the Creative Commons Attribution 4.0 License.
the Creative Commons Attribution 4.0 License.
 | 10 Apr 2026
Energetics of monsoons and deserts: role of surface albedo vs water vapor feedback
Chetankumar Jalihal
Uwe Mikolajewicz
Despite receiving similar solar energy, the top–of–the–atmosphere (TOA) radiation budget is near-zero over deserts and positive over monsoon domains. This contrast has been attributed to differences in the surface albedo between the two regions. Here, we show that this difference in TOA radiation budget is primarily driven by the absorption of longwave radiation by water vapor, while the surface albedo only plays a secondary role. As a greenhouse gas, water vapor absorbs the surface longwave radiation and enhances the local radiative heating of the atmosphere. Due to the aridity of the deserts and prevalent clear sky conditions, long wave energy is efficiently radiated to space. We demonstrate that this is the dominant cause of the net radiative cooling of the atmosphere. Our hypothesis is confirmed by a climate model experiment in which the Earth’s rotation is reversed. This flips the zonal asymmetries producing a monsoon over the Sahara (in spite of high albedo) and a desert over South East Asia (where low albedo persists). We find that radiative feedback of water vapor on the large-scale circulation drives these changes initially, with further amplification by cloud feedbacks. Our results suggest that this radiation–circulation feedback due to water vapor enhances monsoon–desert contrast and is a dominant feedback during the monsoon onset.
- Article
(5433 KB) - Full-text XML
-
Supplement
(2587 KB) - BibTeX
- EndNote


During boreal summer, the top–of–the–atmosphere (TOA) radiation budget (Ftoa) over the Sahara is approximately zero and can even be negative in some places, which is in stark contrast to the positive TOA radiation budget observed over the South Asian monsoon region (Charney, 1975; Wallace and Hobbs, 2006; Dewitte and Clerbaux, 2017). This contrast has been largely attributed to the high surface albedo of the Sahara, where bright sand reflects a significant portion of incoming solar radiation (Charney, 1975). However, the TOA radiation budget is also influenced by factors such as atmospheric water vapor content, cloud cover, and cloud-top height. Clouds emit longwave radiation at cooler temperatures than the Earth's surface. The height of cloud tops and the extent of cloud cover significantly affect the outgoing longwave radiation (OLR). In cloud-free regions, surface temperature and the amount of water vapor play an important role. Water vapor, a potent greenhouse gas, absorbs longwave radiation emitted by the surface and re-emits it from higher, cooler altitudes. Deserts are characterized by clear skies, dry air, and high surface temperatures. Thus, deserts tend to emit higher levels of OLR than monsoon regions (Wallace and Hobbs, 2006) (Fig. 1). While the influence of these factors is recognized (Charney, 1975; Rodwell and Hoskins, 1996; Alamirew et al., 2018; Wallace and Hobbs, 2006), a quantification of their relative importance on the monsoon–desert TOA radiation budget contrast is missing and the major focus in the literature has been on the differences in surface albedo. Besides, the zonal deviation of the TOA radiation budget is primarily influenced by the OLR rather than the reflected shortwave radiation, both in monsoon and desert regions (Fig. 1). A mechanism for this has not yet been addressed. During the non-monsoon months, the TOA radiation budget is negative over both the Sahara and the South Asian monsoon region (Fig. 2a). South Asia generally absorbs slightly more shortwave radiation than the Sahara during non-monsoon periods (Fig. 2b). However, during the monsoon season (June, July, August), cloud reflection causes South Asia's absorbed shortwave radiation to be less than the Sahara's bright sand. While the annual cycle of absorbed shortwave radiation is similar between the two regions, the annual cycle of OLR significantly diverges (Fig. 2c). During the peak monsoon months, OLR becomes the dominant factor in the TOA radiation budget contrast, resulting in a positive radiation budget over the South Asian monsoon region. This, further underlines the role of OLR on the radiation budget contrast between monsoon regions and deserts. However, this has not yet been investigated in literature.
The sequence of events that creates these differences between monsoons and deserts remains largely speculative and lacks substantial evidence. The diabatic heating associated with monsoons triggers adiabatic subsidence to the west of the monsoon regions (Rodwell and Hoskins, 1996) (Fig. 1). It is suggested that this reduces relative humidity initially, inhibits convection, promotes clear skies, and thereby increases OLR. Over time, the resulting arid conditions reduce vegetation cover, which in turn increases surface albedo (Knorr and Schnitzler, 2006; Zeng and Yoon, 2009). The higher albedo enhances radiative cooling, further strengthening subsidence (Zeng and Neelin, 2000; Bonan, 2008). This vegetation–albedo feedback, initiated by monsoon-driven subsidence, is thought to be the key process leading to the differences in the TOA radiation budget between monsoon and desert regions (Rodwell and Hoskins, 1996, 2001; Chou and Neelin, 2003). However, recent studies have demonstrated that deserts can also impact monsoons (Vinoj et al., 2014; Chakraborty and Agrawal, 2017; Sooraj et al., 2019, 2021; Pausata et al., 2021; Singh and Sandeep, 2022). For example, vegetation changes and dust emissions from deserts can modulate the South Asian monsoon (Vinoj et al., 2014; Pausata et al., 2021). Additionally, dry air intrusion from deserts impacts monsoon dynamics (Parker et al., 2016; Singh and Sandeep, 2022; Rai and Raveh-Rubin, 2023). Thus, monsoons and deserts engage in a two-way interaction that manifests as differences in the TOA radiation budget in a steady state. A delineation of the pathway through which parameters that influence TOA radiation budget contrast between monsoons and deserts in comprehensive Earth system models has not been realized so far. In this study, we examine the steady state as well as the evolution of TOA radiation budget contrast between monsoons and deserts. We chose a simulation where the rotation of the Earth is reversed (RETRO) (Mikolajewicz et al., 2018). In this simulation the Sahara becomes monsoonal and subsidence (and thus an arid climate) develops over the South East and East Asia. This simultaneous reorganization of monsoons and deserts enables a thorough examination of the pathway through which the TOA radiation budget contrast emerges over monsoons and deserts.
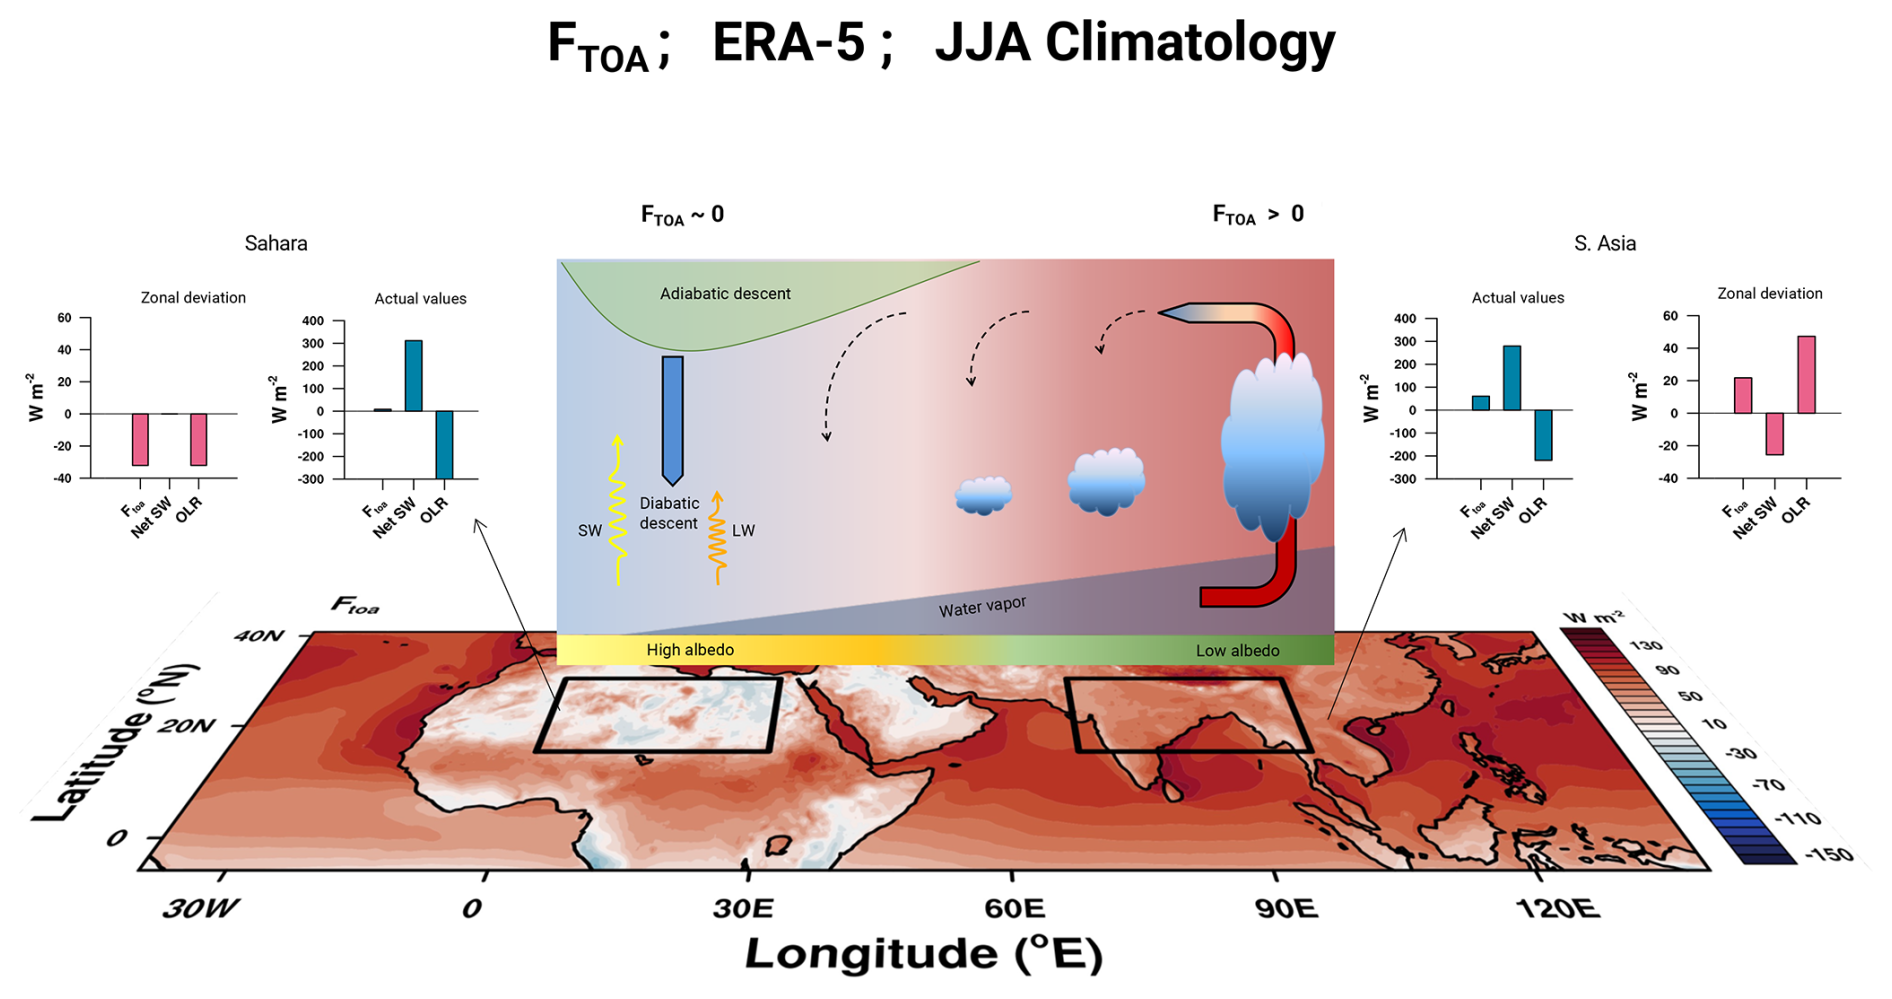
Figure 1Schematic of monsoon–desert mechanism. The spatial plot depicts the June–July–August (JJA) climatology of TOA net radiation budget (Ftoa) from ERA-5 (1991–2020). The bar charts in blue show the Ftoa and its components (the net TOA shortwave – Net_SW and outgoing longwave radiation – OLR; see Data and Methods) area averaged over the regions enclosed by the thick black box. The bar charts in pink represent the same quantities, albeit after removing the zonal mean from land-only grids. The schematic shows a vertical cross-section of the atmosphere. Positive values represent energy gained by the atmosphere.
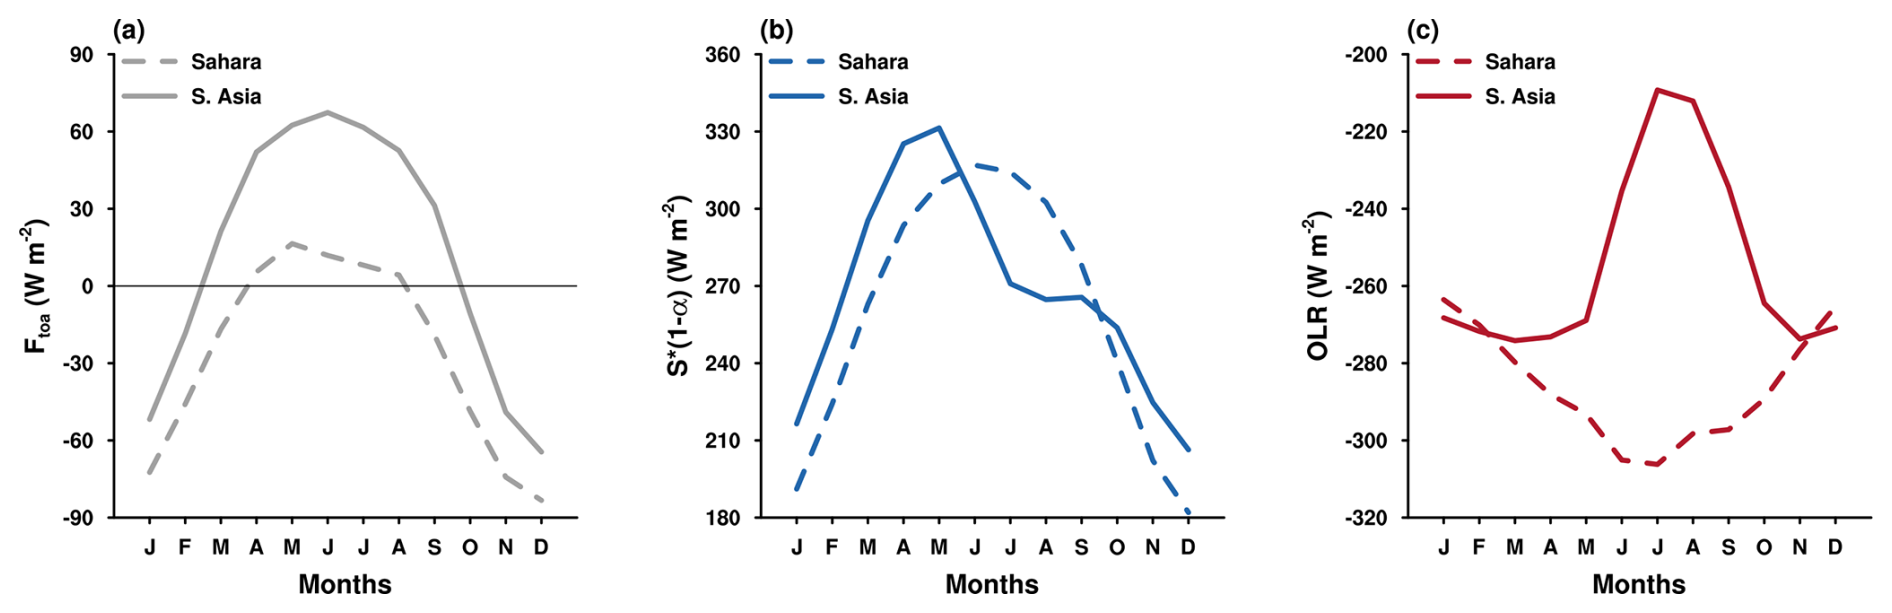
Figure 2Seasonal cycle of Ftoa and its components. The time series of (a) Ftoa, (b) Net shortwave at the top of atmosphere, and (c) outgoing longwave radiation from ERA-5 climatology (based on 1991–2020). The solid line represents the area average over the domain (70–105° E and 15–30° N), while the dashed line shows the area average over the domain (0–30° E and 15–30° N). Positive values represent energy gained by the atmosphere.
A common framework for monsoons and deserts is required for this analysis. However, different theories exist for monsoons and deserts. The TOA radiation budget over land is balanced by the horizontal and vertical advection of moist static energy (MSE) (Trenberth and Smith, 2009). The monsoon circulation balances the positive TOA radiation budget by exporting MSE from the monsoon domain (Neelin and Held, 1987; Biasutti et al., 2018; Hill, 2019). The advection of MSE by monsoons is related to the strength of convection through gross moist stability (GMS) (Neelin and Held, 1987; Srinivasan, 2001; Raymond et al., 2009; Jalihal et al., 2019a). GMS is, therefore, the efficiency of monsoon convection in exporting MSE. This framework is called the energetics of monsoons (Biasutti et al., 2018; Hill, 2019). The energetics framework can be extended to the deserts (Neelin and Held, 1987). Deserts import MSE (for deserts this is nearly equal to dry static energy) which balances the negative TOA radiation budget. However, parts of the Sahara exhibit near-zero or slightly positive TOA radiation budgets. These areas are characterized by a complex vertical structure with thermally driven shallow convection, which can induce an import of MSE into the lower troposphere. The horizontal advection of MSE must be taken into account (Tyrlis et al., 2013; Cherchi et al., 2014; Jalihal et al., 2019a). GMS over the deserts can be interpreted as the efficiency of the subsidence in importing MSE. As energetics accounts for the TOA radiation budget and circulation, it serves as a common framework for understanding monsoons and deserts.
The following section describes the data and simulations used in this study. We use ERA-5 reanalysis to quantify differences in the TOA radiation budget between South Asia and the Sahara and to identify the drivers of the pronounced OLR contrast between the two regions. The implications of these findings and the main conclusions are presented in the Discussion and Conclusion section.
2.1 Modern climatology
We analyze the differences in the energetics of the South Asia and Sahara regions using the ERA-5 global reanalysis (Hersbach et al., 2020). ERA-5 was selected because it provides all the necessary atmospheric and surface variables for calculating both the total radiation budget and the GMS. The Ftoa from ERA-5 exhibits good agreement with independent CERES satellite observations (Fig. S1). However, the ERA-5 net shortwave and OLR components show larger differences, which are primarily attributed to known issues in the representation of clouds within the reanalysis. This does not, however, affect the overall conclusions of this study (Fig. S2). All diagnostics are based on the long-term climatology over the period 1991–2020.
2.2 Model and experimental setup
The CTL (Control) and RETRO (RETROgrade Earth) simulations were carried out using the MPI-ESM v1.2 (Mauritsen et al., 2019). This model consists of the atmospheric general circulation model ECHAM 6.3.02 (Stevens et al., 2013) (with some bug fixes) and the land model JSBACH 3.10 (Reick et al., 2013) with a dynamic vegetation module. The ocean general circulation model is the MPIOM 1.6.2p3 (Jungclaus et al., 2013), with the marine biogeochemistry model HAMOCC (Ilyina et al., 2013; Paulsen et al., 2017) and a dynamic–thermodynamic sea-ice model (Notz et al., 2013). The model was run at coarse resolution: 3.75° × 3.75° for the atmosphere (T31) and a nominal resolution of 3° for the ocean.
The CTL simulation is the pre-industrial setup and follows the CMIP5 protocol. In RETRO, the sign of the Coriolis parameter and the direction of the Sun’s diurnal march were reversed. The boundary conditions in RETRO are the same as that in CTL. Both simulations were initialized from CTL and run for 6990 years till steady state is reached. The climatology of the last 100 years is used for all the analysis. The precipitation and Ftoa in CTL display the monsoon–desert asymmetry (Fig. 5b and d) consistent with modern observations. The daily data are taken from the climatology of the last 30 years of the simulation. Monthly data from the transient model spin-ups (year 0 to year 300 of the RETRO) are used to understand the transition of the Sahara. Further details about the model and the simulations can be found in Mikolajewicz et al. (2018).
2.3 Diagnosis using energetics
The energetics framework relates the moisture converged into a region to the net energy input into the atmosphere (Fnet) and gross moist stability (GMS). Fnet is the total of the Ftoa and Fsfc. Fsfc is the summation of all surface energy fluxes entering the atmosphere. Since, Fsfc is insignificant in the regions of interest, Fnet is predominantly equal to Ftoa. This definition of GMS includes all advection terms (Jalihal et al., 2019a, b, 2020). This is particularly relevant because previous literature has shown that horizontal advection terms are important for deserts as well as monsoon domains (Tyrlis et al., 2013; Cherchi et al., 2014; Jalihal et al., 2019a). Several models for tropical circulation based on energetics exist in literature. However, they assume a simple baroclinic structure of the vertical velocity. This does not represent accurately the omega profile over deserts (Fig. S3a). Hence, we do not use these models for tropical circulation and use precipitation minus evaporation (P−E) instead. P−E is nearly zero over deserts, and is positive over monsoon regions. This can be used as a criterium to diagnose the two climates (Neelin and Held, 1987). Hence, we use the following version:
where, P and E are the precipitation rate and evaporation rate, respectively. P−E is in the units of mm d−1, Ftoa and Fsfc are in the units of W m−2. Hence, a constant (k) is required for conversion of units from W m−2 to mm d−1 (taking the latent heat of vaporization of water as 2.501×10⁶ J kg−1 we get k=0.0345 mm m2 d−1 W−1).
The difference in P−E between RETRO and CTL can be written as:
where, Δ is the difference between RETRO and CTL. The absolute variables (without Δ) are from the reference climate (CTL).
2.4 Net atmospheric radiation budget
The net radiative energy flux at the top of the atmosphere (in W m−2) is given by:
where, S is the incoming solar radiation, α is the shortwave reflectivity at the top of the atmosphere, OLR is the outgoing longwave radiation. Positive sign represent addition of energy into the atmosphere. Fsfc is the total of all surface energy fluxes:
where, SHF, and LHF are the surface sensible and latent heat fluxes. NSWsfc is the net surface shortwave radiation, and NLWsfc is the net surface longwave radiation. The difference in Ftoa between RETRO and CTL, assuming insolation does not change, is:
Here, Δ is the difference between RETRO and CTL. Since the regions of interest are land grid points (Sahara, South East and East Asia), Fsfc is negligible due to low thermal storage of land. Moreover, Fsfc is also nearly zero over the Bay of Bengal (Ramesh and Boos, 2022) (particularly, the north Bay of Bengal which forms a part of the South Asian monsoon domain considered in this study). Hence, we use Ftoa over the regions of interest instead of Fnet.
2.5 Decomposition of outgoing longwave radiation (OLR)
The area averaged OLR over a domain can be expressed as:
OLRclr and OLRcld are the clear sky and cloudy sky longwave emission at the top of the atmosphere. Acld is the cloud area fraction over the whole domain. This equation can be rearranged as follows:
Taking the difference of the above equation between RETRO and CTL gives us:
Here, Δ is the difference between RETRO and CTL. In the above equation (Eq. 8), the variables with absolute values are taken from the reference climate – CTL.
2.6 Determining onset date
We use the OLR criteria to determine the onset date of the monsoon. First, a 3 d running mean is applied to the daily climatological OLR from ERA-5 for each grid point over the South Asian region. This smoothing process helps eliminate spurious events. Onset for a given grid is defined as the first day when the OLR consistently drops below 220 W m−2 for three consecutive days.
2.7 Partial Radiative Perturbation
To determine the dominant factors contributing to the OLR difference between the South Asian monsoon region and the Sahara, we employ the Rapid Radiative Transfer Model for GCMs (RRTMG), implemented via the climlab package (Rose, 2018). RRTMG is run in a standalone configuration, utilizing prescribed pentad-mean climatological profiles of temperature, humidity, ozone, aerosols, and clouds derived from ERA-5 reanalysis and our own model simulations. We use the Partial Radiative Perturbation (PRP) method (Box, 2002) to isolate the relative impact of each parameter. This is achieved through two main perturbation strategies:
-
Spatial Perturbation (Region Contrast): We prescribe all radiative parameters from the Sahara, except for the single parameter of interest (e.g., humidity), which is instead taken from South Asia. The resulting change in OLR quantifies the parameter's relative contribution to the instantaneous OLR contrast between the two regions.
-
Temporal Perturbation (Annual Cycle): To understand the evolution of the annual cycle, we prescribe all parameters in a given region (South Asia or Sahara) with their pre-monsoon (March-April-May) climatological values, except for the parameter of interest (e.g., clouds), which is allowed to evolve over its full annual cycle. This highlights the relative role of that single parameter in driving the regional annual cycle of OLR.
The profiles of vertical velocity, specific humidity, and MSE are crucial in determining the value of GMS (Srinivasan, 2001; Inoue et al., 2021). The profiles of vertical velocity and MSE differ significantly between the Sahara and the South Asian monsoon domain (Fig. S3a, b, and c). However, our diagnostics suggest that the differences in GMS between the South Asian monsoon and the Sahara do not explain the contrast in energetics between the two regions and nearly all of the contrast in the energetics is due to Ftoa (Fig. 3a). This is mainly due to OLR (Fig. 3b). The contrast in reflectivity has a secondary impact on Ftoa. Further decomposing OLR (see Data and Methods) suggests that the clear sky OLR and cloud cover are the prominent terms. Shown in Fig. 3c and d is a delineation of the contribution of temperature (surface and atmosphere) and water vapor to the clear sky OLR. Over the Sahara, clear sky OLR is essentially related to temperature. Higher temperatures lead to larger clear sky longwave emissions. Column integrated water vapor (CWV) over the Sahara does not exceed 25 kg m−2 (Fig. S4a), and does not influence the clear sky OLR. CWV has a larger range in the South Asian monsoon domain. During the non-monsoon months, CWV is low over South Asia and has values similar to the Sahara. The clear sky OLR is driven by temperature during these times (Fig. S4b). As CWV increases during the monsoon onset, clear sky OLR transitions from being dependent on surface temperature to a state where it depends on CWV (Fig. S4a and b). Thus, radiative effect of moisture is the leading cause of difference in clear sky OLR, and Ftoa, between South Asia and the Sahara.
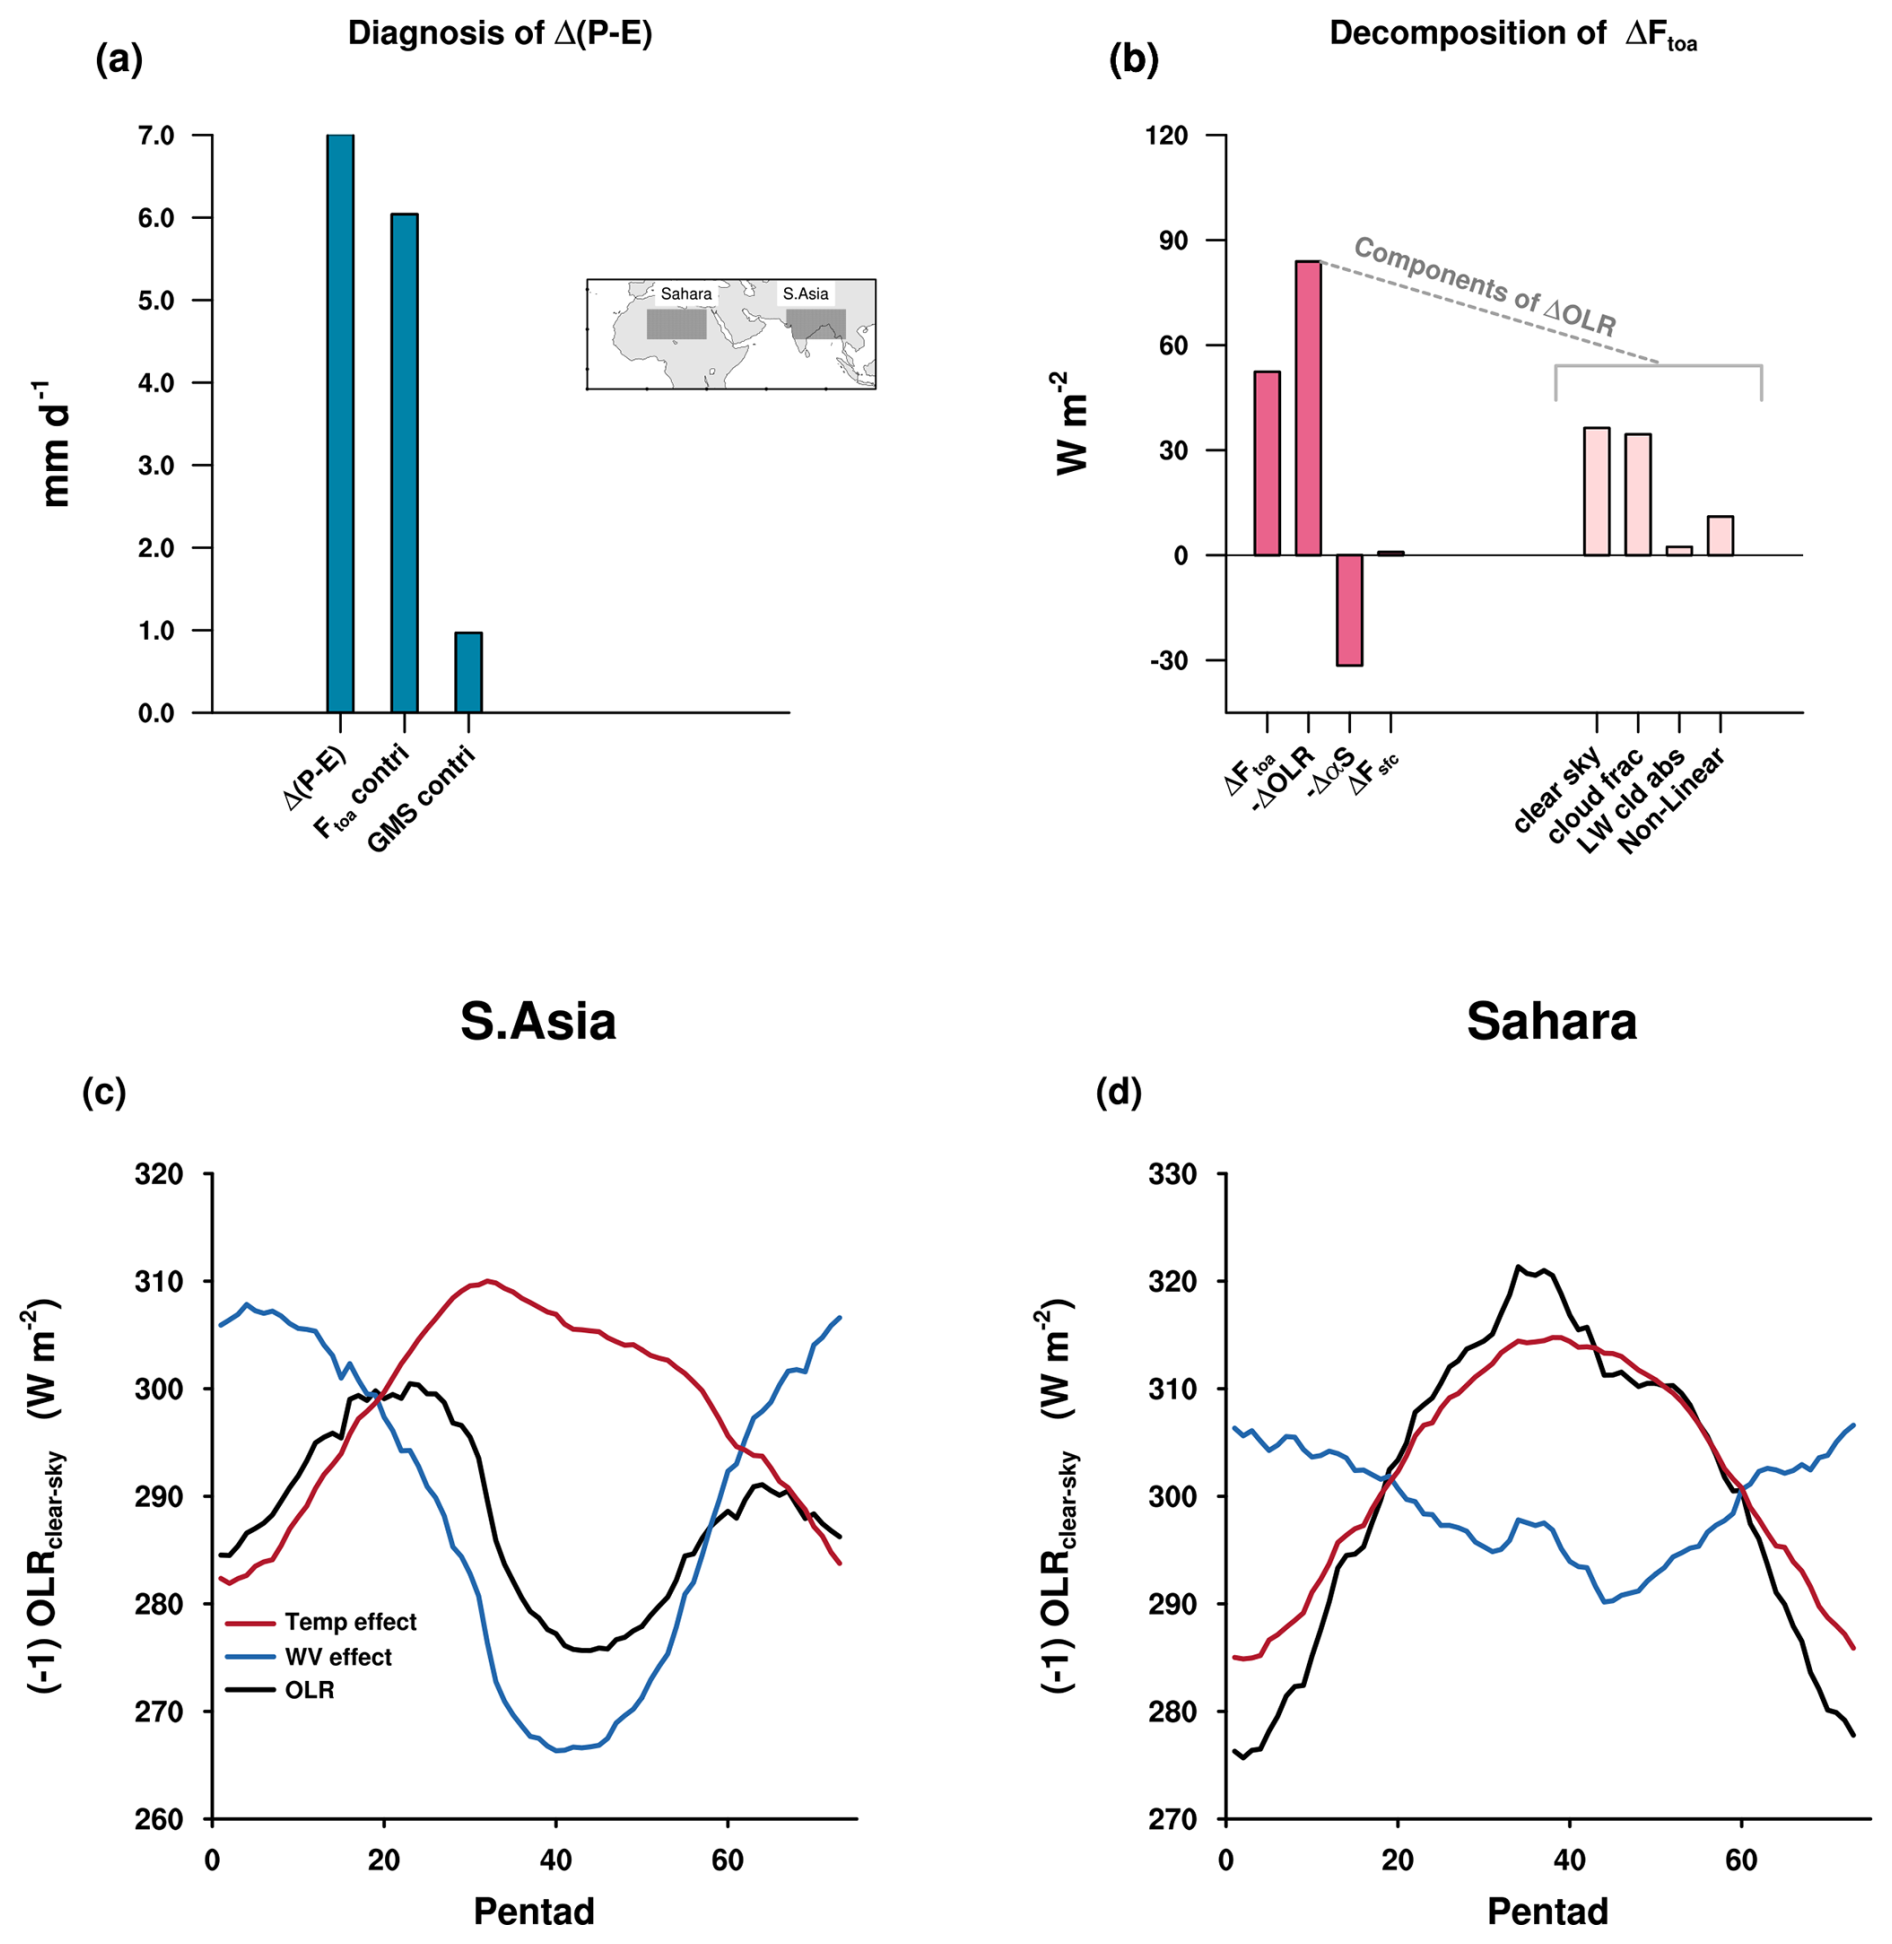
Figure 3Diagnosis of difference in moisture convergence between Sahara and South Asia. Bar graph of (a) the difference in Precipitation minus Evaporation (P−E) between the Sahara and South Asia, contribution of Ftoa, and GMS, and (b) the difference in Ftoa and its components. The change in OLR is further decomposed into changes due to clear sky OLR, changes in cloud area fraction, the longwave cloud absorption, and non-linear term (see Data and Methods). (c) and (d) illustrates the effect of column-integrated water vapor and temperature (surface plus atmosphere) on the seasonal cycle of clear sky OLR. Asia and the Sahara, respectively. June–July–August climatology (1991–2020) from ERA-5 are considered for this analysis. The regions selected for the analysis are shown in the inset map with grey shading: 0–30° E and 15–30° N; land-only grid points (Sahara) and 70–100° E and 15–30° N; all grid points (South Asia). Following the convention that energy gained by the atmosphere is positive, clear-sky OLR values have been multiplied by −1 to represent energy lost to space.
We use the CTL and RETRO simulations to understand the energetics of monsoon over the Sahara. Reversing the sense of rotation flips the zonal asymmetries (Mikolajewicz et al., 2018). The western and eastern boundary currents are flipped in the RETRO creating cooler sea surface temperatures (SST) on the western boundaries, while the eastern boundaries have a warmer sea surface temperature (Fig. 4). The most significant changes occur in the eastern equatorial Pacific. In the CTL, the equatorial upwelling creates a cold tongue in the equatorial east Pacific. However, in the RETRO, the trade winds are reversed and will therefore lead to a disappearance of the cold tongue. Conversely, the cold tongue shifts into the equatorial Indian ocean. The collapse of the Atlantic Meridional Overturning Circulation (AMOC) in the RETRO creates anomalous cooling in the North Atlantic. Simultaneously, the Pacific meridional overturning circulation strengthens which leads to warmer SSTs in the north Pacific. These changes in SSTs produce large-scale shifts in the atmospheric circulation.
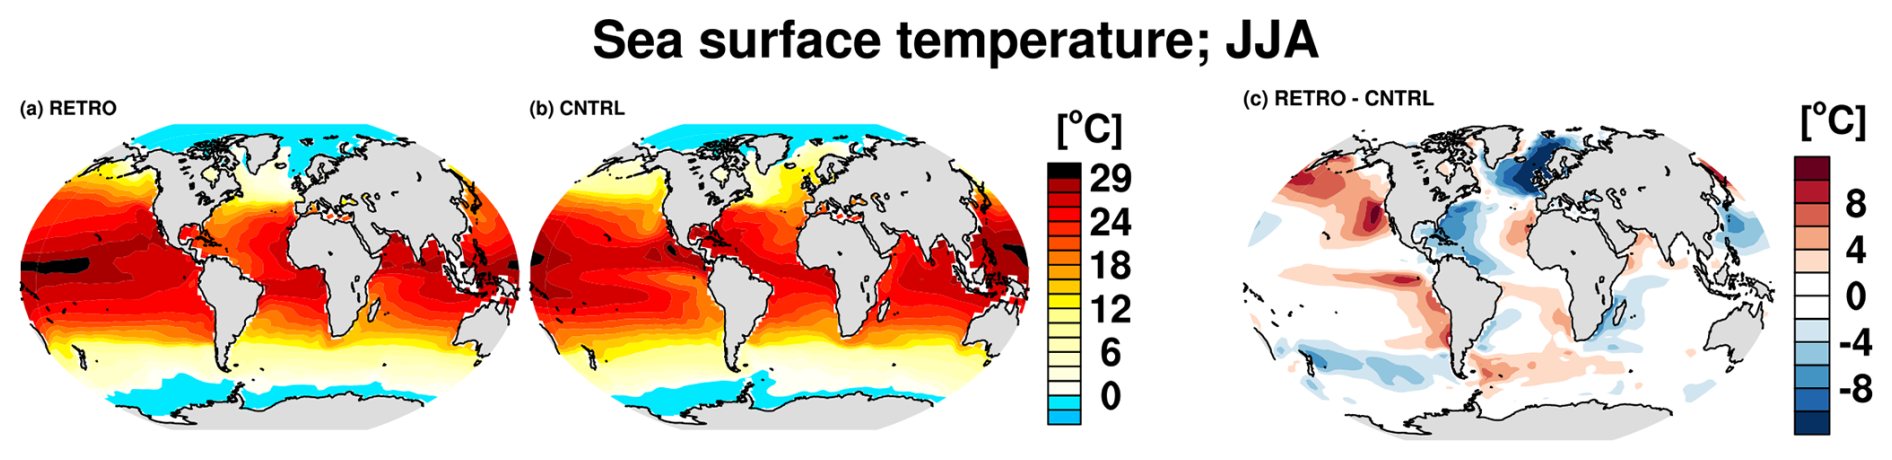
Figure 4Summer mean sea surface temperature. The spatial plot depicts the June–July–August (JJA) climatology of sea surface temperature (SST) for the RETRO in (a) & CTL in (b). (c) shows the difference in SST between the two simulations. Climatology over the last 100 years of the simulation is considered.
The reversal in the sign of the coriolis parameter is enough to trigger changes in atmospheric dynamics. The SST induced circulation changes superimpose on these atmospheric dynamics. In RETRO, Rossby waves propagate to the east. Thus, in RETRO a large desert exists over the South East and East Asia, to the east of monsoon which is now prevalent over the Sahara (Fig. 5a). This redistribution of monsoons and deserts aligns with the predictions of the Rodwell–Hoskins mechanism (Rodwell and Hoskins, 1996, 2001). Ftoa in RETRO is positive over the monsoonal Sahara and also over South East and East Asia which is a desert in RETRO (Fig. 5c). This carries two implications, one for monsoons and one for deserts. Positive Ftoa is a necessary but not a sufficient condition for monsoons to exist. Deserts on the other hand persist under both positive and negative Ftoa conditions. This suggests that dynamics and not radiation is the driving factor for desertification.
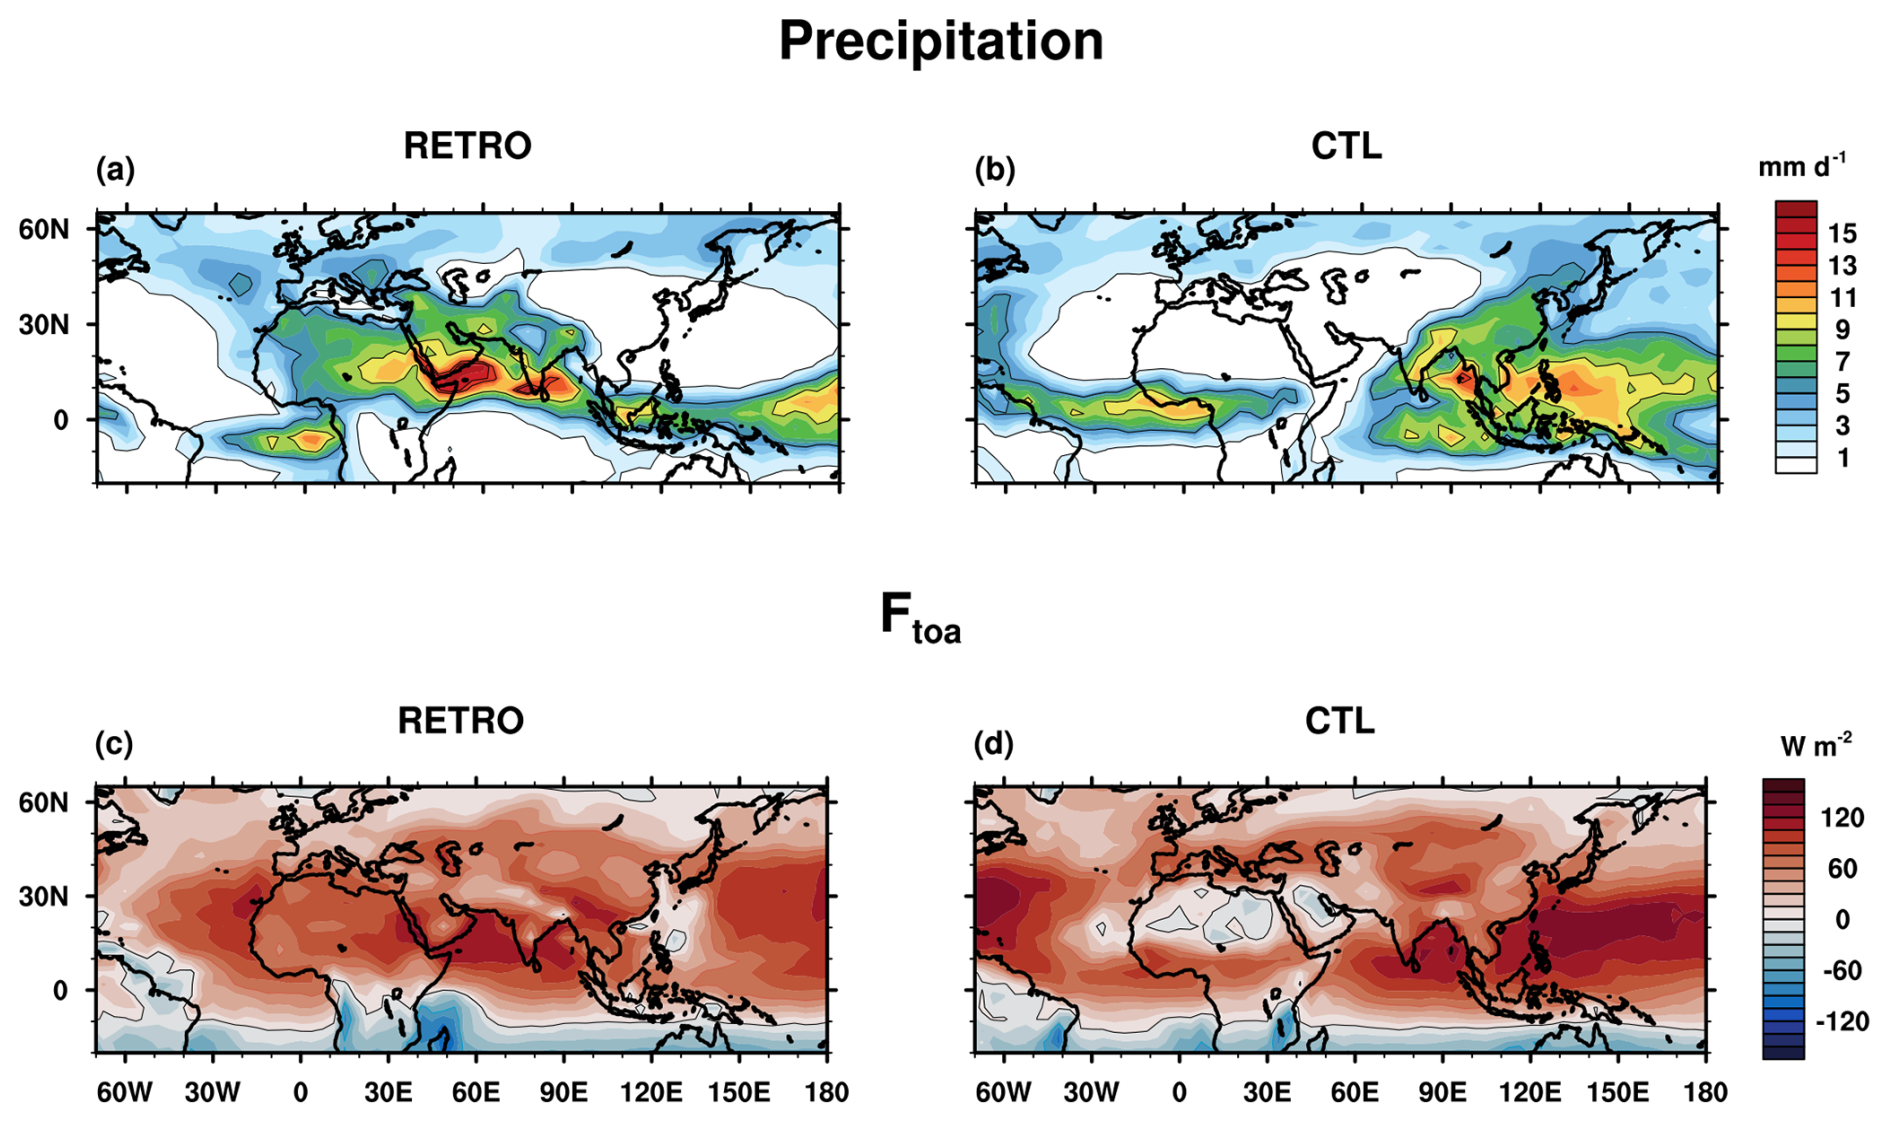
Figure 5Summer mean precipitation, and Ftoa. The spatial plot depicts the June–July–August (JJA) climatology of precipitation rate (a and b), and net radiation at the top of the atmosphere (Ftoa) (c and d). (a and c) are for RETRO simulation, and (b and d) are for the control (CTL) simulation. Climatology over the last 100 years of the simulation is considered. Positive values represent energy gained by the atmosphere.
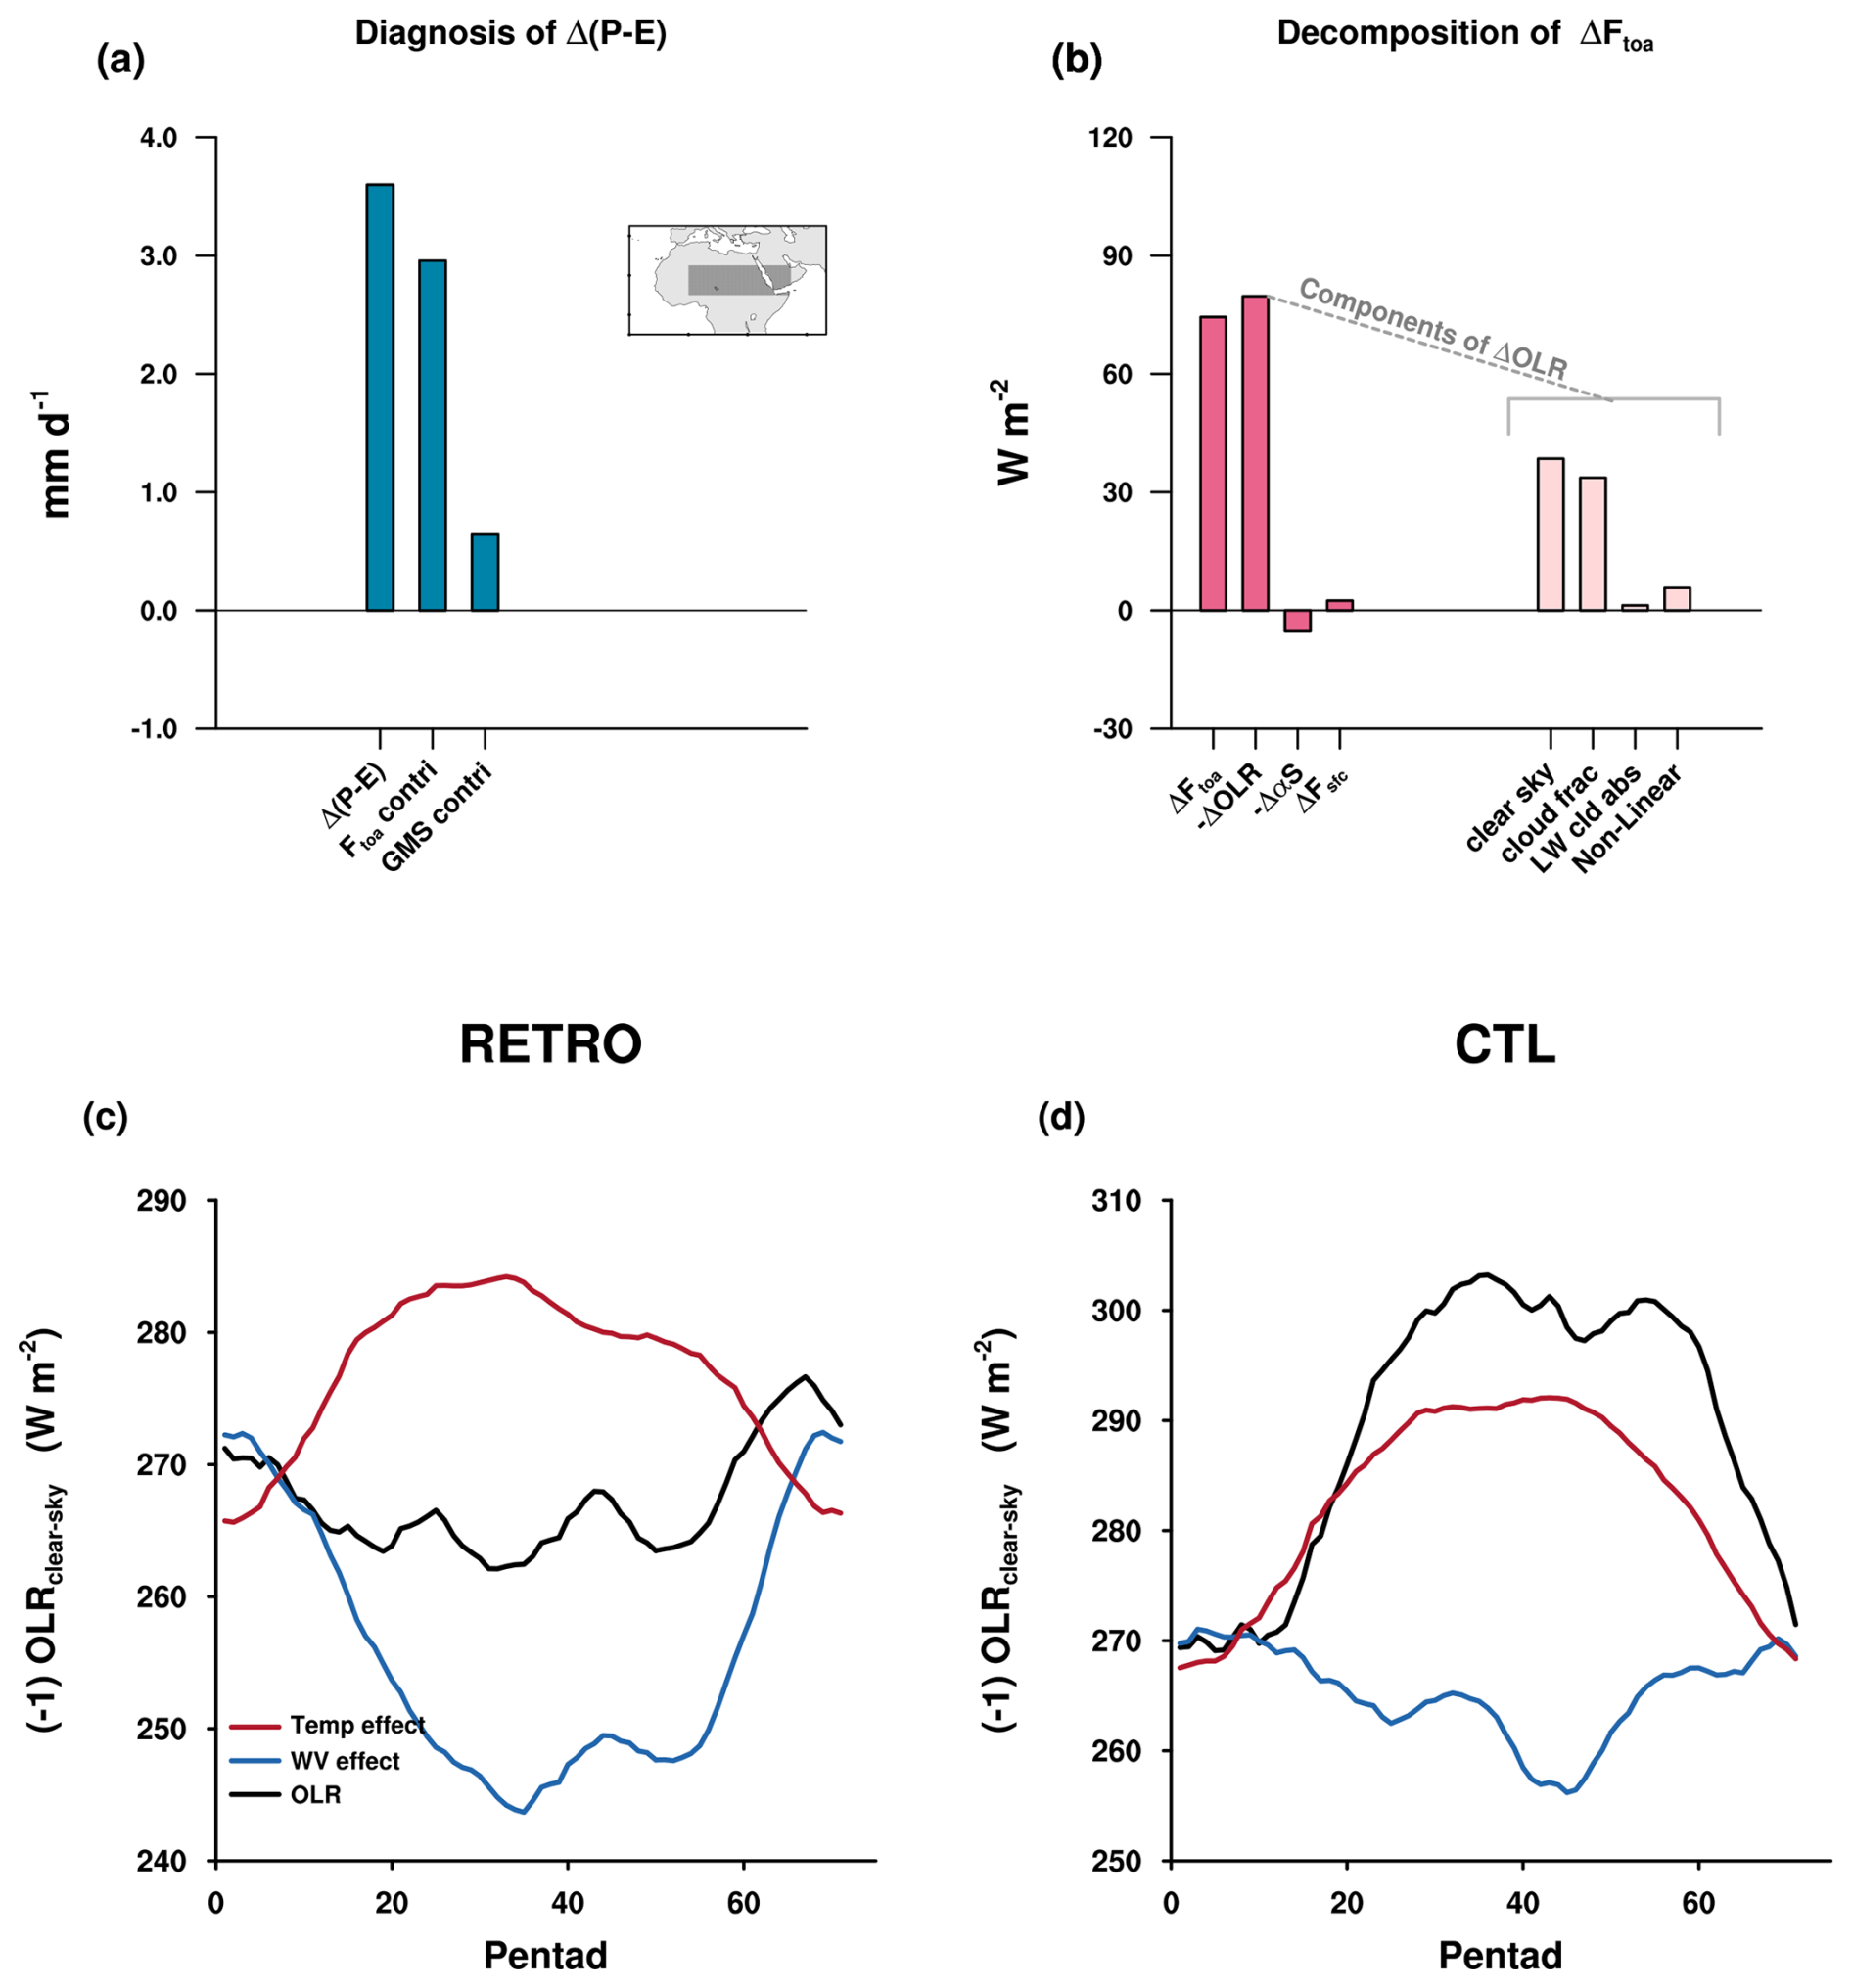
Figure 6Diagnosis of change in moisture convergence between RETRO and CTL. Bar graph of (a) the difference in Precipitation minus Evaporation (P−E) between the RETRO and CTL Sahara, contribution of Ftoa, and GMS, and (b) the difference in Ftoa and its components. The change in OLR is further decomposed into changes due to clear sky OLR, changes in cloud area fraction, the longwave cloud absorption, and non-linear term (see Data and Methods). (c) and (d) shows the effect of column-integrated water vapor and temperature (surface plus atmosphere) on the seasonal cycle of clear sky OLR over the Sahara for RETRO and CTL, respectively. June–July–August climatology of the last 100 years of the simulation is considered for this analysis. The region selected for this analysis is shown in the inset map: 0–50° E and 10–25° N; land-only grid points. Energy gained by the atmosphere is considered positive; therefore, clear-sky OLR, which represents energy lost to space, is multiplied by −1 to account for this energy loss.
The change in moisture convergence over the RETRO Sahara is almost entirely driven by changes in Ftoa (Fig. 6a). The OLR is the primary cause of the increase in Ftoa over the RETRO Sahara (Fig. 6b). The reflected shortwave has remained nearly constant. This is because the albedo of the desert Sahara is nearly as high as that of the cloud-covered Sahara in the simulations. The changes in OLR are related to clear sky radiative effects of water vapor (Fig. 6b, c, and d). Substantial moisture advection into the Sahara from the east (South Asian monsoon winds) and the west (anticyclone associated with the Atlantic subtropical high) leads to higher CWV in RETRO (Fig. 7a and b). Thus, the clear sky OLR over the Sahara is driven by different factors in CTL and RETRO (Figs. 6c and d, and S5a and b). The demise of monsoon in South East and East Asia in RETRO is largely due to the changes in GMS (Fig. S6), emphasizing the role of atmospheric dynamics. The strengthening of the monsoon over the RETRO Sahara during the boreal summer induces a subsidence over the South East and East Asia (Fig. 7c). This adiabatic subsidence is related to the Rossby wave triggered by the diabatic heating over the RETRO Sahara (Fig. S7). With the withdrawal of the monsoon, the adiabatic subsidence over South East and East Asia weakens. The mid-latitude storms penetrate into this region producing precipitation during the boreal winter and vegetation proliferates reducing albedo. In CTL, the subsidence over the Sahara increases with the onset of the South Asian monsoon (Fig. 7d). However, the subsidence continues to persist during non-monsoonal months. This subsidence during the non-monsoonal months is due to the diabatic descent driven by radiative cooling. Our result suggests that the albedo of desert perhaps is important in maintaining subsidence during the non-monsoonal months when the adiabatic descent is absent.
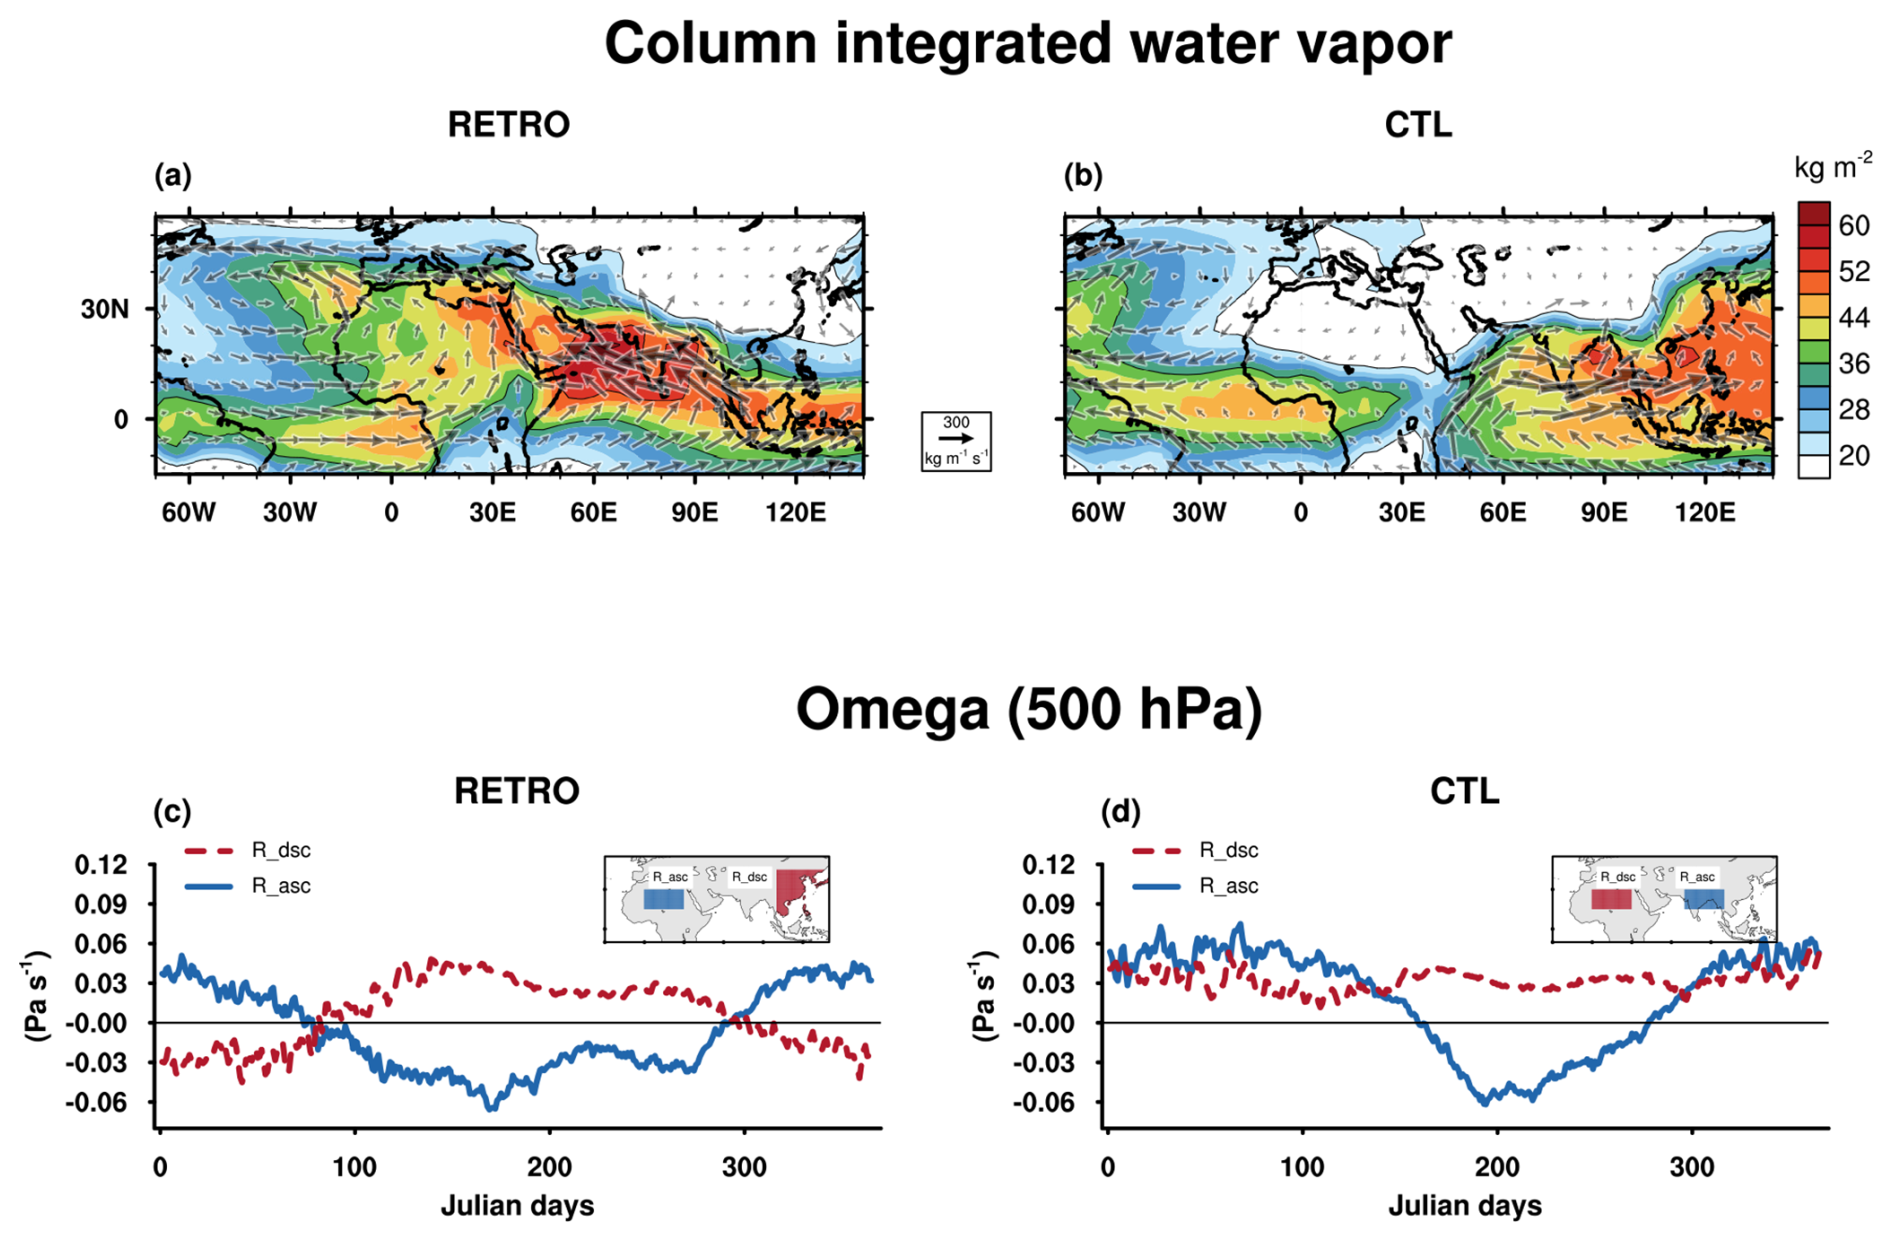
Figure 7Comparison of water vapor fluxes between CTL and RETRO. The spatial map of column-integrated water vapor (in colors) and the vertically integrated moisture flux (vectors) for the RETRO and CTL is depicted in (a) and (b) . The June–July–August climatology over the last 100 years of each simulation is considered. The time evolution of vertical pressure velocity at 500 hPa (ω500) for the RETRO and CTL is shown in (c) and (d), respectively. The solid blue line and the dashed red line are area weighted averages of ω500 over the regions of corresponding colors shown in the inset map.
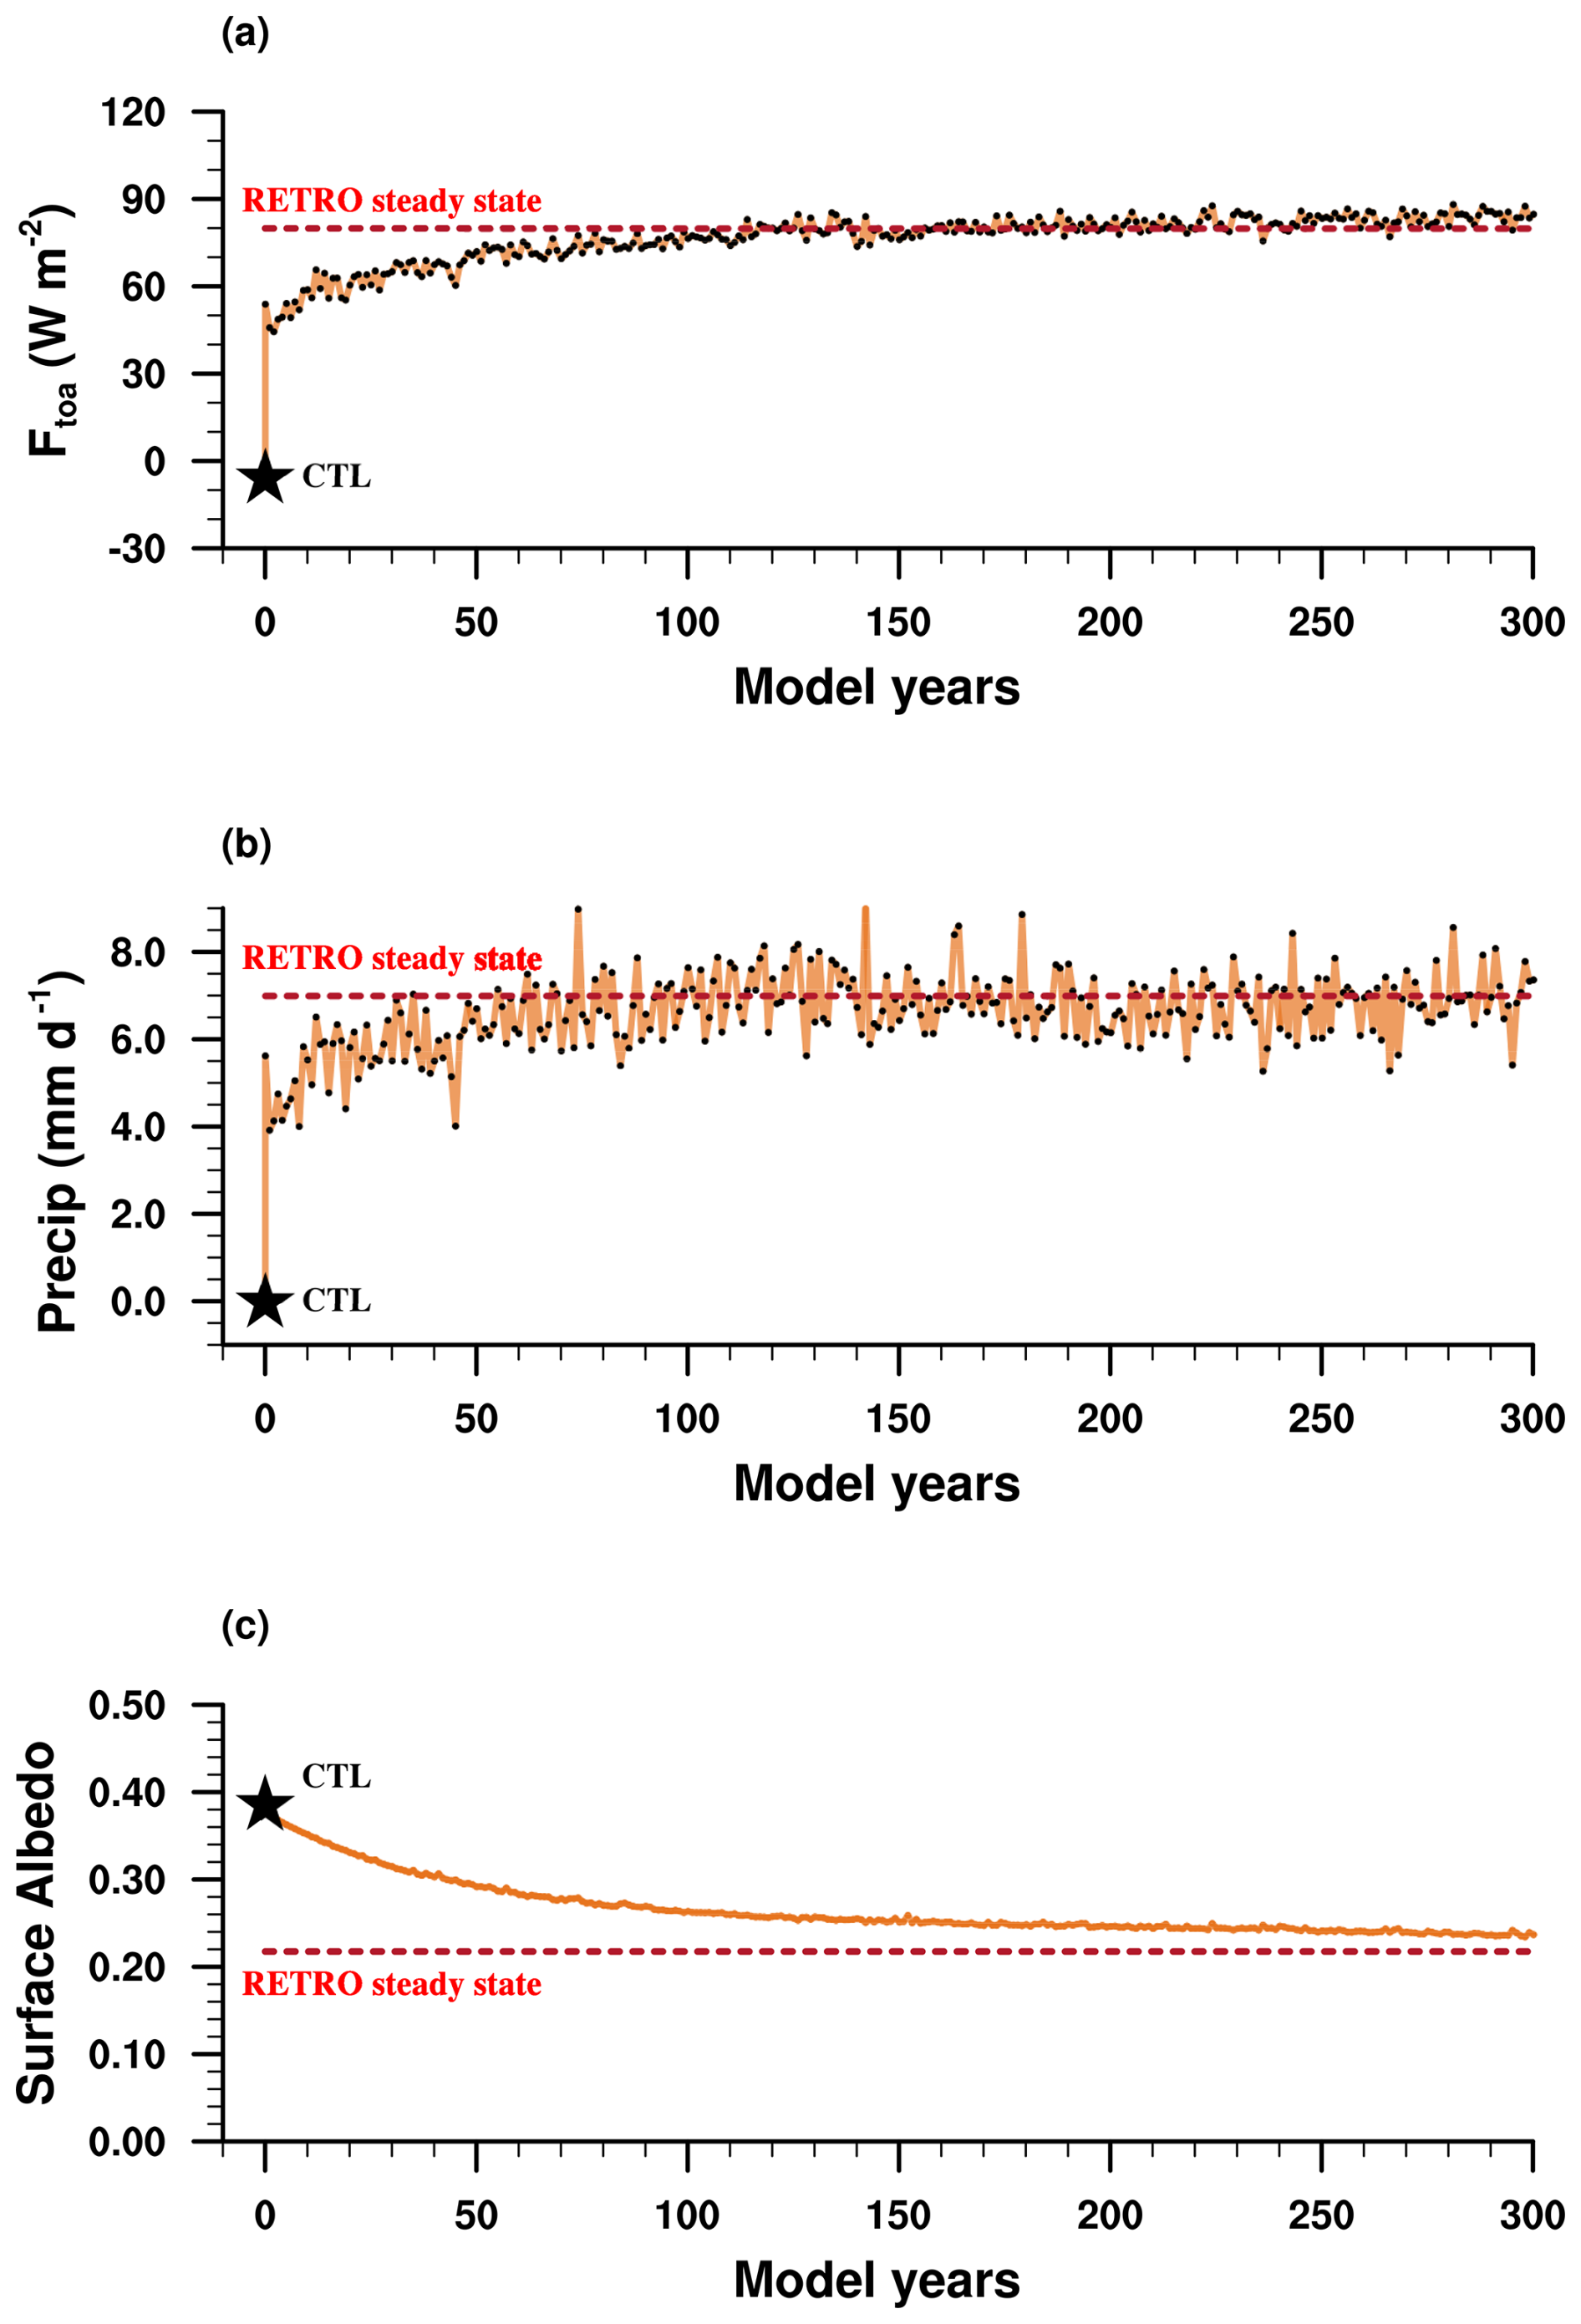
Figure 8Temporal evolution of Ftoa, precipitation, and surface albedo during spin-up. The time series of June–July–August averaged (a) Ftoa, (b) precipitation, and (c) surface albedo, area averaged over the domain (0–50° E and 10–25° N). The orange line depicts the transients in the RETRO, and the red dashed line is the steady-state value. The filled star shows the steady-state value in the CTL.
The precipitation rate and Ftoa over the RETRO Sahara change substantially in the first summer after the rotation is reversed (Fig. 8a and b). The surface albedo is nearly the same as that in CTL (Fig. 8c). The increase in Ftoa and precipitation is due to the clear sky radiative effects of water vapor (Fig. S8a and b). A closer look at the daily evolution of Ftoa during the first year of simulations highlight the important role played by OLR in the transition of Ftoa from negative to positive values (Fig. S9). With the reversal in Earth's rotation, the large-scale dynamics change. This leads to the advection of moisture into the Sahara. The radiative effect of water vapor leads to an increase in Ftoa. The atmospheric circulation responds to these changes in Ftoa by advecting additional MSE out of the domain. This leads to an increased moisture flux into the domain. Thus, a feedback of water vapor radiative effect on circulation is established. Clouds also form in this process and modulate the local Ftoa through their radiative effects. In CTL, adiabatic subsidence prevailed over the Sahara, which is now absent. This also aids in the formation of clouds. These feedbacks and processes lead to the development of a strong monsoon over the RETRO Sahara despite its high albedo. Vegetation grows over the course of a few decades, reducing albedo (Fig. 8c). This is, however, a slow feedback and contributes approximately 35 % to the final change in precipitation.
Monsoons and deserts are contrasting climates, that are believed to be shaped by distinct dynamics (Sooraj et al., 2021). These differences also manifest in the top–of–atmosphere radiation budget (Charney, 1975). The large-scale atmospheric dynamics balances the TOA radiation budget through the advection of energy. Thus, both climates can be described through a common radiation–circulation framework. Traditionally, the differences in the TOA radiation budget between monsoons and deserts have been attributed to the differences in surface albedo (Charney, 1975). Feedbacks from surface albedo on local radiative cooling have been considered to be important for the differences in TOA radiation budget between monsoons and deserts. Moreover, a delineation of the sequence of events that produce TOA radiation budget contrast has been missing. Our results suggest that the radiative effect of water vapor and clouds contribute substantially to the differences in outgoing longwave radiation and hence, the TOA radiation budget. Before the onset of the monsoon, the radiative effect of water vapor exerts the greatest influence on the OLR (Figs. 9, S10a and b). As the monsoon circulation strengthens and clouds begin to form, cloud radiative effects also contribute to the TOA radiation budget. The cloud radiative effects in the longwave further amplify the contrast in the TOA radiation budget between monsoon and desert regions.
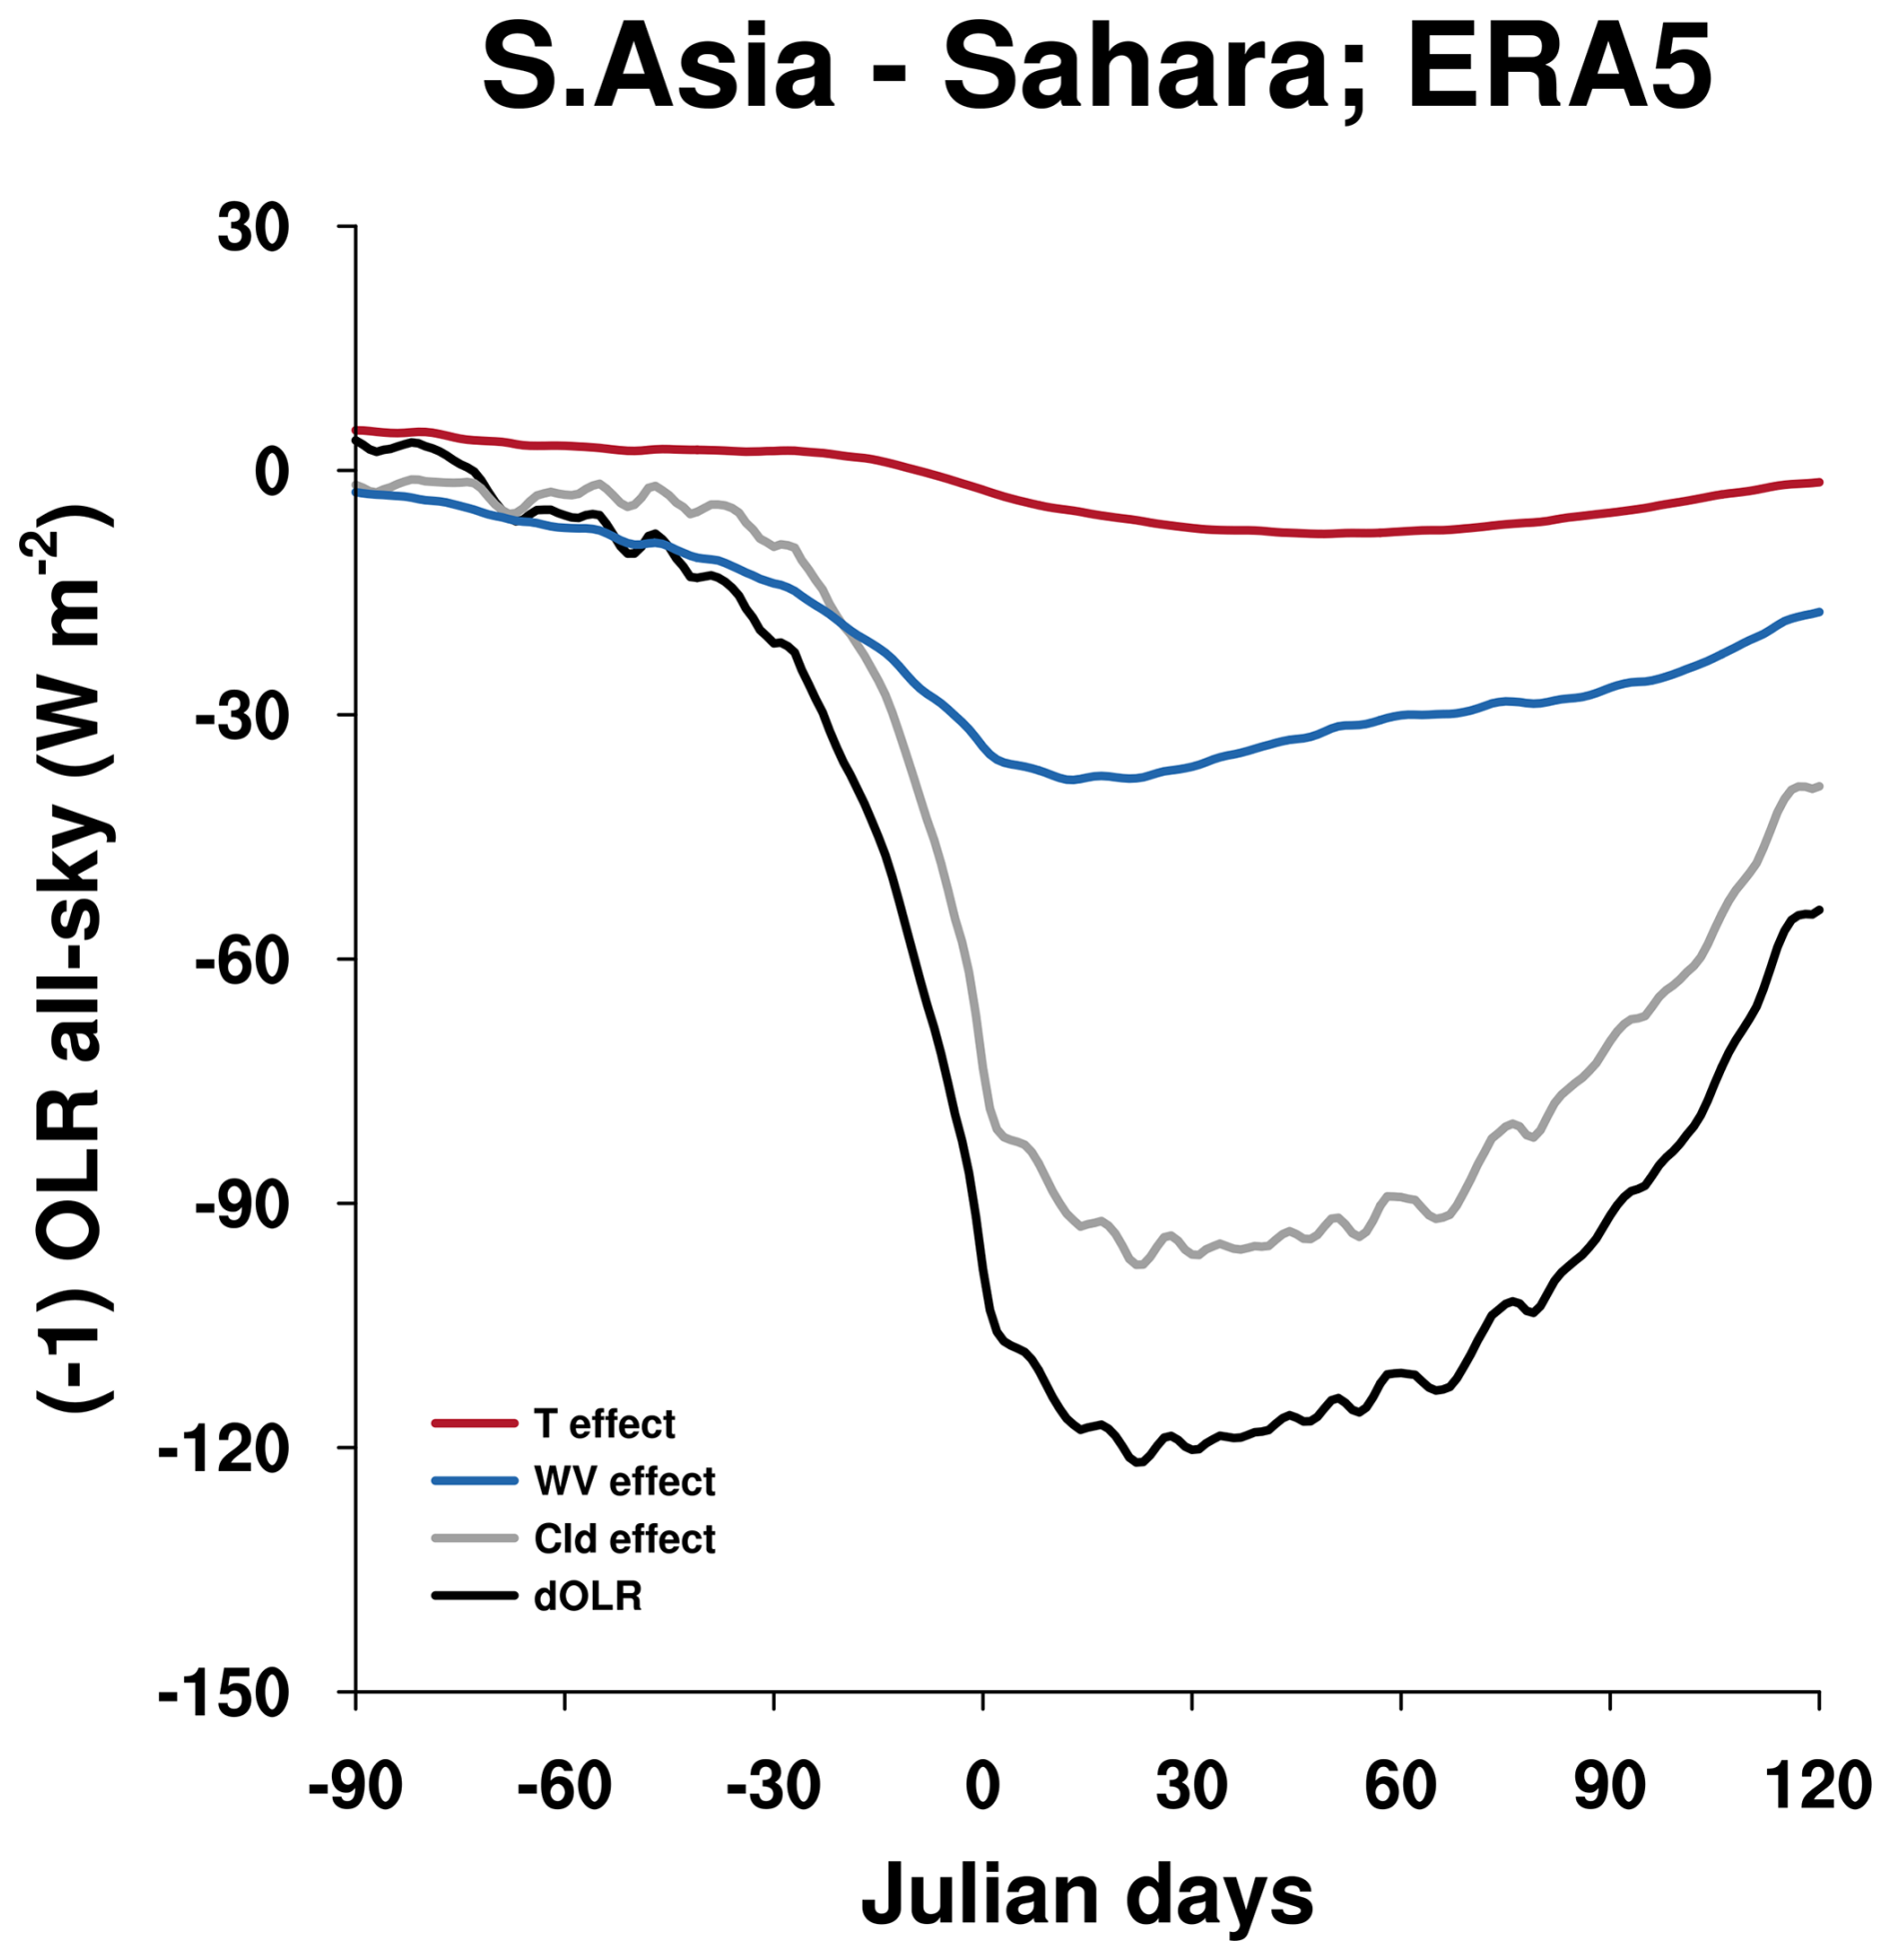
Figure 9Impact of various factors on OLR. The time series shows the difference in outgoing longwave radiation (OLR) between South Asia and the Sahara. The data is represented as follows: black for the total OLR difference, grey for the cloud-related effects on OLR, blue for the radiative effects of water vapor, and red for the influence of temperature (both surface and atmospheric). These OLR values are obtained by running the Climlab version of RRTMG in standalone mode, using thermodynamic profiles from the daily climatology of ERA-5. The x-axis represents the day of the year, with day zero marking the onset date. The regions of South Asia and the Sahara are shown in the inset map in Fig. 3. Following the convention that energy gained by the atmosphere is positive, clear-sky OLR values have been multiplied by −1 to represent energy lost to space.
Using a RETRO simulation and the energetics framework we present a scenario where monsoon exists over a region of high surface albedo. With this simulation and our diagnostics, we unravel for the first time, the processes and sequence of events that produce monsoon–desert TOA radiation budget contrast. During the first summer after a reversal in the rotation of Earth has taken effect in RETRO, the large-scale circulation transports moisture into the Sahara. This has an instantaneous effect on the outgoing longwave radiation (Fig. S9a, b, and c) and, therefore, on the TOA radiation budget. Atmospheric circulation adjusts in response to these changes in the TOA radiation budget, further amplifying the moisture transport into the region. Thus, the water vapor radiative effect feeds back onto the large-scale circulation. We suggest that this radiative feedback of water vapor on circulation plays a crucial role in the formation of monsoons. As convection is initiated, cloud radiative effects further modulate the local TOA radiation budget, eventually leading to the development of a monsoon over the Sahara despite its high albedo. The subsequent growth of vegetation strengthens the monsoon over time. Vegetation–albedo feedback is a slow process that operates over a few decades contributing to 35 % of the precipitation changes. The water vapor/clouds – OLR – circulation feedback is a fast process that accounts for about 65 % of the increase in precipitation. As monsoon strengthens over the Sahara in RETRO, subsidence is induced over East Asia inhibiting convection and promoting arid conditions. Since East Asia continues to receive precipitation during the boreal winter, vegetation exists. The changes in circulation ensure an arid climate only during the boreal summer. This does not, however, lead to a reduction in the TOA radiation budget over East Asia in RETRO. This highlights that desertification is primarily driven by dynamics, with the surface albedo feedbacks playing a secondary role.
Our results have implications for the seasonal development of monsoons in the modern climate. The historical perspective of monsoons has been synonymous with land–sea thermal contrast (Halley, 1753; Hadley, 1735; Lau and Li, 1984; Meehl, 1992). The modern view of monsoons is that of an energetically driven meridional movement of the interhemispheric convergence zone (ITCZ) (Gadgil, 2018; Hill, 2019). Both the historical and modern perspectives of monsoons do not consider feedbacks internal to the monsoon system. The onset and progression of monsoons is akin to the development of a monsoon over the Sahara in RETRO. During onset, changes in large-scale circulation occur that advect large amounts of moisture into the monsoon domain. This triggers the radiation–circulation feedback through clear sky radiative effects of water vapor (Fig. 9). Conceptual models, that are extensively used for monsoon research, need to consider this feedback to comprehensively investigate monsoon onset. Once the monsoon is established, the associated diabatic heating strengthens the atmospheric subsidence to the west of the monsoon region (as described by the Rodwell–Hoskins mechanism (Rodwell and Hoskins, 1996)), creating an arid climate. Previous studies have proposed that the vegetation–albedo feedback at the surface further amplifies this subsidence, contributing to the net difference in the TOA radiation budget between monsoon regions and deserts. However, our findings highlight the critical role of water vapor radiative effect on circulation. In summary, our results underscore the importance of water vapor in establishing and reinforcing a radiation–circulation feedback, thereby accentuating the contrast in the TOA radiation budget between monsoon regions and deserts.
The codes are available from the corresponding author on request.
The RETRO and CTL simulations used in this article can be downloaded from the World Data Center for Climate (DKRZ) archives (https://hdl.handle.net/21.14106/04bf956d056fbfa57592cfe0ad9a1b8a81ab2ccc, Mikolajewicz, 2018). The ERA-5 data are available at https://doi.org/10.24381/cds.adbb2d47 (Hersbach et al., 2023). The CERES EBAF data were obtained from https://ceres-tool.larc.nasa.gov (last access: 20 December 2025).
The supplement related to this article is available online at https://doi.org/10.5194/esd-17-319-2026-supplement.
CJ and UM analysed and interpreted the GCM output. CJ wrote the manuscript with input from UM All authors reviewed the manuscript.
The contact author has declared that none of the authors has any competing interests.
Publisher's note: Copernicus Publications remains neutral with regard to jurisdictional claims made in the text, published maps, institutional affiliations, or any other geographical representation in this paper. The authors bear the ultimate responsibility for providing appropriate place names. Views expressed in the text are those of the authors and do not necessarily reflect the views of the publisher.
We thank B. Stevens and J. Srinivasan for their helpful comments and discussions. We are grateful to J. Marotzke, M.-L. Kapsch, and C. Schannwell for their constructive feedback on the manuscript. We gratefully acknowledge the Deutsches Klimarechenzentrum (DKRZ) for providing the computational resources.
This research has been supported by the Alexander von Humboldt-Stiftung (grant no. IND 1222628 HFST-P).
The article processing charges for this open-access publication were covered by the Max Planck Society.
This paper was edited by Somnath Baidya Roy and reviewed by two anonymous referees.
Alamirew, N. K., Todd, M. C., Ryder, C. L., Marsham, J. H., and Wang, Y.: The early summertime Saharan heat low: sensitivity of the radiation budget and atmospheric heating to water vapour and dust aerosol, Atmos. Chem. Phys., 18, 1241–1262, https://doi.org/10.5194/acp-18-1241-2018, 2018. a
Biasutti, M., Voigt, A., Boos, W. R., Braconnot, P., Hargreaves, J. C., Harrison, S. P., Kang, S. M., Mapes, B. E., Scheff, J., Schumacher, C., Sobel, A. H., and Xie, S.-P.: Global energetics and local physics as drivers of past, present and future monsoons, Nat. Geosci., 11, 392–400, https://doi.org/10.1038/s41561-018-0137-1, 2018. a, b
Bonan, G. B.: Forests and climate change: forcings, feedbacks, and the climate benefits of forests, Science, 320, 1444–1449, https://doi.org/10.1126/science.1155121, 2008. a
Box, M. A.: Radiative perturbation theory: a review, Environ. Modell. & Softw., 17, 95–106, https://doi.org/10.1016/S1364-8152(01)00056-1, 2002. a
Chakraborty, A. and Agrawal, S.: Role of west Asian surface pressure in summer monsoon onset over central India, Environ. Res. Lett., 12, 074002, https://doi.org/10.1088/1748-9326/aa76ca, 2017. a
Charney, J. G.: Dynamics of deserts and drought in the Sahel, Q. J. Roy. Meteor. Soc., 101, 193–202, https://doi.org/10.1002/qj.49710142802, 1975. a, b, c, d, e
Cherchi, A., Annamalai, H., Masina, S., and Navarra, A.: South Asian summer monsoon and the eastern Mediterranean climate: The monsoon–desert mechanism in CMIP5 simulations, J. Climate, 27, 6877–6903, https://doi.org/10.1175/JCLI-D-13-00530.1, 2014. a, b
Chou, C. and Neelin, J. D.: Mechanisms limiting the northward extent of the northern summer monsoons over North America, Asia, and Africa, J. Climate, 16, 406–425, https://doi.org/10.1175/1520-0442(2003)016<0406:MLTNEO>2.0.CO;2, 2003. a
Dewitte, S. and Clerbaux, N.: Measurement of the Earth radiation budget at the top of the atmosphere – A review, Remote Sensing, 9, 1143, https://doi.org/10.3390/rs9111143, 2017. a
Gadgil, S.: The monsoon system: Land–sea breeze or the ITCZ?, J. Earth Syst. Sci., 127, 5, https://doi.org/10.1007/s12040-017-0916-x, 2018. a
Hadley, G.: VI. Concerning the cause of the general trade-winds, Philos. T. R. Soc. Lond., 39, 58–62, https://doi.org/10.1098/rstl.1735.0014, 1735. a
Halley, E.: An historical account of the trade winds, and monsoons, observable in the seas between and near the Tropicks, with an attempt to assign the physical cause of the said winds, Philos. T. R. Soc. Lond., 16, 153–168, https://doi.org/10.1098/rstl.1686.0026, 1753. a
Hersbach, H., Bell, B., Berrisford, P., Hirahara, S., Horányi, A., Muñoz-Sabater, J., Nicolas, J., Peubey, C., Radu, R., Schepers, D., Simmons, A., Soci, C., Abdalla, S., Abellan, X., Balsamo, G., Bechtold, P., Biavati, G., Bidlot, J., Bonavita, M., De Chiara, G., Dahlgren, P., Dee, D., Diamantakis, M., Dragani, R., Flemming, J., Forbes, R., Fuentes, M., Geer, A., Haimberger, L., Healy, S., Hogan, R. J., Hólm, E., Janisková, M., Keeley, S., Laloyaux, P., Lopez, P., Lupu, C., Radnoti, G., de Rosnay, P., Rozum, I., Vamborg, F., Villaume, S., and Thépaut, J.-N.: The ERA5 global reanalysis, Q. J. Roy. Meteor. Soc., 146, 1999–2049, https://doi.org/10.1002/qj.3803, 2020. a
Hersbach, H., Bell, B., Berrisford, P., Biavati, G., Horányi, A., Muñoz Sabater, J., Nicolas, J., Peubey, C., Radu, R., Rozum, I., Schepers, D., Simmons, A., Soci, C., Dee, D., and Thépaut, J.-N.: ERA5 hourly data on single levels from 1940 to present, Copernicus Climate Change Service (C3S) Climate Data Store (CDS) [data set], https://doi.org/10.24381/cds.adbb2d47, 2023. a
Hill, S. A.: Theories for Past and Future Monsoon Rainfall Changes, Current Climate Change Reports, 5, 160–171, https://doi.org/10.1007/s40641-019-00137-8, 2019. a, b, c
Ilyina, T., Six, K. D., Segschneider, J., Maier-Reimer, E., Li, H., and Núñez-Riboni, I.: Global ocean biogeochemistry model HAMOCC: Model architecture and performance as component of the MPI-Earth system model in different CMIP5 experimental realizations, J. Adv. Model. Earth Sy., 5, 287–315, https://doi.org/10.1029/2012MS000178, 2013. a
Inoue, K., Biasutti, M., and Fridlind, A. M.: Evidence that horizontal moisture advection regulates the ubiquitous amplification of rainfall variability over tropical oceans, J. Atmos. Sci., 78, 529–547, https://doi.org/10.1175/JAS-D-20-0201.1, 2021. a
Jalihal, C., Bosmans, J. H. C., Srinivasan, J., and Chakraborty, A.: The response of tropical precipitation to Earth's precession: the role of energy fluxes and vertical stability, Clim. Past, 15, 449–462, https://doi.org/10.5194/cp-15-449-2019, 2019a. a, b, c, d
Jalihal, C., Srinivasan, J., and Chakraborty, A.: Modulation of the Indian monsoon by water vapor and cloud feedback over the past 22,000 years, Nat. Commun., https://doi.org/10.1038/s41467-019-13754-6, 2019b. a
Jalihal, C., Srinivasan, J., and Chakraborty, A.: Different precipitation response over land and ocean to orbital and greenhouse gas forcing, Scientific Reports, 10, 11891, https://doi.org/10.1038/s41598-020-68346-y, 2020. a
Jungclaus, J. H., Fischer, N., Haak, H., Lohmann, K., Marotzke, J., Matei, D., Mikolajewicz, U., Notz, D., and von Storch, J.-S.: Characteristics of the ocean simulations in the Max Planck Institute Ocean Model (MPIOM) the ocean component of the MPI-Earth system model, J. Adv. Model. Earth Sy., 5, 422–446, https://doi.org/10.1002/jame.20023, 2013. a
Knorr, W. and Schnitzler, K.-G.: Enhanced albedo feedback in North Africa from possible combined vegetation and soil-formation processes, Clim. Dynam., 26, 55–63, https://doi.org/10.1007/s00382-005-0073-9, 2006. a
Lau, K.-M. and Li, M.-T.: The monsoon of East Asia and its global associations – A survey, B. Am. Meteorol. Soc., 65, 114–125, https://doi.org/10.1175/1520-0477(1984)065<0114:TMOEAA>2.0.CO;2, 1984. a
Mauritsen, T., Bader, J., Becker, T., Behrens, J., Bittner, M., Brokopf, R., Brovkin, V., Claussen, M., Crueger, T., Esch, M., Fast, I., Fiedler, S., Fläschner, D., Gayler, V., Giorgetta, M., Goll, D. S., Haak, H., Hagemann, S., Hedemann, C., Hohenegger, C., Ilyina, T., Jahns, T., Jimenéz-de-la Cuesta, D., Jungclaus, J., Kleinen, T., Kloster, S., Kracher, D., Kinne, S., Kleberg, D., Lasslop, G., Kornblueh, L., Marotzke, J., Matei, D., Meraner, K., Mikolajewicz, U., Modali, K., Möbis, B., Müller, W. A., Nabel, J. E. M. S., Nam, C. C. W., Notz, D., Nyawira, S.-S., Paulsen, H., Peters, K., Pincus, R., Pohlmann, H., Pongratz, J., Popp, M., Raddatz, T. J., Rast, S., Redler, R., Reick, C. H., Rohrschneider, T., Schemann, V., Schmidt, H., Schnur, R., Schulzweida, U., Six, K. D., Stein, L., Stemmler, I., Stevens, B., von Storch, J.-S., Tian, F., Voigt, A., Vrese, P., Wieners, K.-H., Wilkenskjeld, S., Winkler, A., and Roeckner, E.: Developments in the MPI-M Earth System Model version 1.2 (MPI-ESM1.2) and its response to increasing CO2, J. Adv. Model. Earth Sy., 11, 998–1038, https://doi.org/10.1029/2018MS001400, 2019. a
Meehl, G. A.: Effect of tropical topography on global climate, Annu. Rev. of Earth Pl. Sc., 20, 85–112, https://doi.org/10.1146/annurev.ea.20.050192.000505, 1992. a
Mikolajewicz, U.: The climate of a retrograde rotating earth (data), DOKU at DKRZ [data set], https://hdl.handle.net/21.14106/04bf956d056fbfa57592cfe0ad9a1b8a81ab2ccc (last access: 4 April 2026), 2018. a
Mikolajewicz, U., Ziemen, F., Cioni, G., Claussen, M., Fraedrich, K., Heidkamp, M., Hohenegger, C., Jimenez de la Cuesta, D., Kapsch, M.-L., Lemburg, A., Mauritsen, T., Meraner, K., Röber, N., Schmidt, H., Six, K. D., Stemmler, I., Tamarin-Brodsky, T., Winkler, A., Zhu, X., and Stevens, B.: The climate of a retrograde rotating Earth, Earth Syst. Dynam., 9, 1191–1215, https://doi.org/10.5194/esd-9-1191-2018, 2018. a, b, c
Neelin, J. D. and Held, I. M.: Modeling tropical convergence based on the moist static energy budget, Mon. Weather Rev., 115, 3–12, https://doi.org/10.1175/1520-0493(1987)115<0003:MTCBOT>2.0.CO;2, 1987. a, b, c, d
Notz, D., Haumann, F. A., Haak, H., Jungclaus, J. H., and Marotzke, J.: Arctic sea-ice evolution as modeled by Max Planck Institute for Meteorology's Earth system model, J. Adv. Model. Earth Sy., 5, 173–194, https://doi.org/10.1002/jame.20016, 2013. a
Parker, D. J., Willetts, P., Birch, C., Turner, A. G., Marsham, J. H., Taylor, C. M., Kolusu, S., and Martin, G. M.: The interaction of moist convection and mid-level dry air in the advance of the onset of the Indian monsoon, Q. J. Roy. Meteor. Soc., 142, 2256–2272, https://doi.org/10.1002/qj.2815, 2016. a
Paulsen, H., Ilyina, T., Six, K. D., and Stemmler, I.: Incorporating a prognostic representation of marine nitrogen fixers into the global ocean biogeochemical model HAMOCC, J. Adv. Model. Earth Sy., 9, 438–464, https://doi.org/10.1002/2016MS000737, 2017. a
Pausata, F. S. R., Messori, G., Yun, J., Jalihal, C. A., Bollasina, M. A., and Marchitto, T. M.: The remote response of the South Asian Monsoon to reduced dust emissions and Sahara greening during the middle Holocene, Clim. Past, 17, 1243–1271, https://doi.org/10.5194/cp-17-1243-2021, 2021. a, b
Rai, D. and Raveh-Rubin, S.: Enhancement of Indian summer monsoon rainfall by cross-equatorial dry intrusions, npj Climate and Atmospheric Science, 6, 43, https://doi.org/10.1038/s41612-023-00374-7, 2023. a
Ramesh, N. and Boos, W. R.: The unexpected oceanic peak in energy input to the atmosphere and its consequences for monsoon rainfall, Geophys. Res. Lett., 49, e2022GL099283, https://doi.org/10.1029/2022GL099283, 2022. a
Raymond, D. J., Sessions, S. L., Sobel, A. H., and Fuchs, Ž.: The mechanics of gross moist stability, J. Adv. Model. Earth Sy., 1, https://doi.org/10.3894/JAMES.2009.1.9, 2009. a
Reick, C. H., Raddatz, T., Brovkin, V., and Gayler, V.: Representation of natural and anthropogenic land cover change in MPI-ESM, J. Adv. Model. Earth Sy., 5, 459–482, https://doi.org/10.1002/jame.20022, 2013. a
Rodwell, M. J. and Hoskins, B. J.: Monsoons and the dynamics of deserts, Q. J. Roy. Meteor. Soc., 122, 1385–1404, https://doi.org/10.1002/qj.49712253408, 1996. a, b, c, d, e
Rodwell, M. J. and Hoskins, B. J.: Subtropical anticyclones and summer monsoons, J. Climate, 14, 3192–3211, https://doi.org/10.1175/1520-0442(2001)014<3192:SAASM>2.0.CO;2, 2001. a, b
Rose, B. E. J.: CLIMLAB: a Python toolkit for interactive, process-oriented climate modeling, J. Open Source Softw., 3, 659, https://doi.org/10.21105/joss.00659, 2018. a
Singh, R. and Sandeep, S.: Dynamics of dry air intrusion over India during summer monsoon breaks, Clim. Dynam., 59, 1649–1664, https://doi.org/10.1007/s00382-021-06060-9, 2022. a, b
Sooraj, K. P., Terray, P., Masson, S., and Crétat, J.: Modulations of the Indian summer monsoon by the hot subtropical deserts: insights from coupled sensitivity experiments, Clim. Dynam., 52, 4527–4555, https://doi.org/10.1007/s00382-018-4396-8, 2019. a
Sooraj, K. P., Terray, P., and Cherchi, A.: South Asian summer monsoon and subtropical deserts, in: Indian summer monsoon variability, Elsevier, 299–318, https://doi.org/10.1016/B978-0-12-822402-1.00015-6, 2021. a, b
Srinivasan, J.: A simple thermodynamic model for seasonal variation of monsoon rainfall, Current Science, 73–77, https://www.jstor.org/stable/24105558 (last access: 4 April 2026), 2001. a, b
Stevens, B., Giorgetta, M., Esch, M., Mauritsen, T., Crueger, T., Rast, S., Salzmann, M., Schmidt, H., Bader, J., Block, K., Brokopf, R., Fast, I., Kinne, S., Kornblueh, L., Lohmann, U., Pincus, R., Reichler, T., and Roeckner, E.: Atmospheric component of the MPI-M earth system model: ECHAM6, J. Adv. Model. Earth Sy., 5, 146–172, https://doi.org/10.1002/jame.20015, 2013. a
Trenberth, K. E. and Smith, L.: The three dimensional structure of the atmospheric energy budget: Methodology and evaluation, Clim. Dynam., 32, 1065–1079, https://doi.org/10.1007/s00382-008-0389-3, 2009. a
Tyrlis, E., Lelieveld, J., and Steil, B.: The summer circulation over the eastern Mediterranean and the Middle East: influence of the South Asian monsoon, Clim. Dynam., 40, 1103–1123, https://doi.org/10.1007/s00382-012-1528-4, 2013. a, b
Vinoj, V., Rasch, P. J., Wang, H., Yoon, J.-H., Ma, P.-L., Landu, K., and Singh, B.: Short-term modulation of Indian summer monsoon rainfall by West Asian dust, Nat. Geosci., 7, 308–313, https://doi.org/10.1038/ngeo2107, 2014. a, b
Wallace, J. M. and Hobbs, P. V.: Atmospheric science: an introductory survey, vol. 92, Elsevier, ISBN 978-0127329512, 2006. a, b, c
Zeng, N. and Neelin, J. D.: The role of vegetation–climate interaction and interannual variability in shaping the African savanna, J. Climate, 13, 2665–2670, https://doi.org/10.1175/1520-0442(2000)013<2665:TROVCI>2.0.CO;2, 2000. a
Zeng, N. and Yoon, J.: Expansion of the world's deserts due to vegetation-albedo feedback under global warming, Geophys. Res. Lett., 36, https://doi.org/10.1029/2009GL039699, 2009. a