
the Creative Commons Attribution 4.0 License.
the Creative Commons Attribution 4.0 License.
 | 26 Aug 2026
Toward robust fine-scale decadal precipitation forecasts through dynamically consistent subsampling
Joanne Couallier
Didier Swingedouw
Charlotte Sakarovitch
Théodore Raymond
Ramdane Alkama
Reliable decadal predictions of regional precipitation are critical for managing water-resources and developing climate services, yet they remain a major challenge. To address this gap, we present a 5-step framework that integrates recent advances in decadal predictions of large-scale sea-level pressure (SLP) modes to enhance prediction skill of precipitation at a fine scale resolution. We first identify key atmospheric indices controlling precipitation variability over France, including the winter and summer North Atlantic Oscillation (NAO), the winter West Atlantic Pressure Anomaly, and the summer Mediterranean-Scandinavia index. These indices are predicted through an improved post-processing method applied on the multi-model Decadal Climate Prediction ensemble. The resulting decadal forecasts of the indices are used to select dynamically consistent members from a large uninitialized climate model ensemble, thereby avoiding initial drift from decadal climate predictions. The selected forecasts are then statistically bias-corrected and downscaled to an 8-km grid, providing relevant predictions for local scale and impact studies. The last step of the framework is the skill evaluation: over France, winter precipitation forecast based on the NAO achieves significant Anomaly Correlation Coefficient across 78 % of grid cells. Summer skill, though weaker, improves notably when combining NAO with the Atlantic Multidecadal Variability (significant over 48 % of grid cells). This approach offers a transferable pathway toward actionable, fine scale hydroclimate information at the decadal scale, potentially useful for climate services. The methodology is adaptable to other regions and variables, offering promising opportunities for improving decadal-scale hydroclimate predictions.
- Article
(12774 KB) - Full-text XML
-
Supplement
(3827 KB) - BibTeX
- EndNote


Projections of future precipitation remain one of the most challenging aspects of climate science, as they are highly sensitive to the model used (IPCC, 2023a), the emission scenario considered, and the representation of the internal variability. This internal variability, linked to the intrinsic dynamics of the climate system, introduces substantial uncertainty, particularly at regional scales and on multiyear to decadal timescales (Hawkins and Sutton, 2011). Such uncertainty complicates decision-making for water management and climate adaptation, most notably at the decadal scale, a time frame particularly relevant for policymakers. This is especially true over France where precipitation strongly influence hydrological regimes, water management, agriculture, and energy production (IPCC, 2023b).
Large-scale modes of atmospheric variability exert a strong and spatially structured influence on European precipitation. For example, the North Atlantic Oscillation (NAO) is associated with fluctuations in the jet stream and storm tracks, strongly impacting European climate by producing large anomalies in precipitation and temperature (e.g., Hurrell and Deser, 2010). Its influence on precipitation has been demonstrated in specific French regions, such as the Seine basin during winter months (Friter et al., 2012). Other SLP patterns – including the East Atlantic/Western Russia, East Atlantic (EA), Scandinavian (SCAND) indices and the West Europe Pressure Anomaly (WEPA) – also modulate seasonal precipitation and extremes across Europe (Casanueva et al., 2014). Variations in the WEPA index (Castelle et al., 2017) are exerting particularly strong influence over France (Jalón-Rojas and Castelle, 2021). Additionally, multi-decadal variability in the Atlantic sea surface temperatures – known as the Atlantic Multidecadal Variability (AMV) – affects summer precipitation patterns in Europe via atmosphere-ocean interactions (Börgel et al., 2022; Casanueva et al., 2014; Knight et al., 2006; Simpson et al., 2019; Sutton and Hodson, 2005). These teleconnections link large-scale pressure anomalies to regional hydroclimate variability. Thus, our ability to predict these large-scale modes offers a promising pathway toward more skillful regional precipitation forecasts on decadal timescales (Borchert et al., 2021; Smith et al., 2020).
Decadal climate predictions (DCP) are designed to fill the gap between seasonal forecasts and long-term climate projections (Meehl et al., 2009; Solaraju-Murali et al., 2022). Seasonal forecasts are initialized from the observed climate state and provide predictions up to approximately 12 months ahead, with skill mainly arising from those initial conditions. Long-term climate projections, in contrast, simulate future climate under external forcing scenarios and do not attempt to predict internal variability at specific dates. DCPs focus on intermediate timescale: by initializing climate models from the observed state and running them forward for ten years, they combine predictability from both initialization and external forcing, capturing part of the internal climate variability that long-term projections miss (e.g., Swingedouw et al., 2013a), but also the role of external forcing from increasing greenhouse gas concentration. Decadal predictions were included in phases 5 and 6 of the Coupled Model Intercomparison Project (CMIP5 and CMIP6) (Boer et al., 2016), as retrospective predictions – called hindcasts – and new forecasts are produced and assessed regularly (Hermanson et al., 2022; World Meteorological Organization, 2025). Decadal hindcasts demonstrate skill for selected variables in certain regions, enabling applications in climate services (Dunstone et al., 2022). Indeed, they can provide actionable information concerning – e.g. North Atlantic hurricane activity for the insurance sector (Lockwood et al., 2023); global wheat yields (Solaraju-Murali et al., 2021); hydropower production (Tsartsali et al., 2023); and drought indices in Germany (Paxian et al., 2022).
Decadal precipitation hindcasts have demonstrated limited skill over Europe and particularly over France (Hermanson et al., 2022). To address this challenge, recent research (Smith et al., 2020) has focused on improving the prediction of large-scale atmospheric modes that strongly modulate precipitation variability at the continental scale, most notably the NAO. Building on the well-established relationship between the NAO and European precipitation, Smith et al. (2020) proposed an innovative approach: rather than directly predicting regional rainfall, the first step is to skillfully predict the NAO itself. This enables the identification or subsampling of model ensemble members whose atmospheric states are dynamically consistent with the predicted NAO phase, thereby producing more skillful decadal precipitation predictions over Europe. Building on these advances, a more recent study (Alkama et al., 2026) achieved a further step forward in NAO predictability, by optimizing the averaging step to eliminate temporal misalignment. This new method is providing enhanced skill of the NAO (Alkama et al., 2026) and opens new opportunities to apply comparable methods to other large-scale SLP indices shaping Europe's hydroclimate (Hutchins et al., 2025).
Building upon the improved NAO prediction skill, novel approaches have emerged that leverage skillful SLP decadal prediction to enhance precipitation and temperature predictions via methods such as regression models or NAO-matching techniques (Hutchins et al., 2025; Nicolì et al., 2025; Tsartsali et al., 2023). However, these studies primarily focus on winter months and often show limited skill for precipitation over France. Since observed correlations between NAO and precipitation vary spatially and tend to be weaker over parts of France, incorporating additional relevant SLP indices informed by observed precipitation-SLP relationships may improve forecast skill.
This study aims to overcome these limitations by developing a subsampling-based approach that leverages recent advances in NAO prediction skill while integrating additional climate indices chosen to specifically enhance decadal precipitation forecasts over France. Understanding how these large-scale atmospheric modes shape observed precipitation variability is essential for constructing physically consistent and predictable frameworks. In this respect, this framework can also be applied to other regions where one wants to improve decadal prediction skills. Furthermore, by explicitly predicting these indices within initialized decadal forecasts, our approach bridges the gap between large-scale predictability and regional hydrological relevance.
Beyond its scientific value, this work responds to the growing demand from decision-makers and water resource managers for actionable climate information at fine spatial and temporal scales (Gogien et al., 2023; Sauquet et al., 2026). We therefore focus on providing decadal precipitation predictions at approximately 8 km spatial resolution, matching the resolution of the reference dataset (SAFRAN), targeting both winter and summer seasons across regional domains in France. This high-resolution perspective allows us to assess spatial precipitation variability and its linkage to dominant SLP patterns, offering a pathway toward more robust and usable climate information for adaptation planning.
This study is organized as follows: Sect. 2 describes the data and methods employed; Sect. 3 presents the evaluation of prediction skill for winter and summer precipitation; Sect. 4 discusses the results and concludes the study.
2.1 Data
2.1.1 Observational Data
The precipitation observational data used in this study come from the SAFRAN (Système d'Analyse Fournissant des Renseignements Atmosphériques à la Neige) analysis, based on the system developed by Météo-France (Durand et al., 1993; Le Moigne et al., 2020). SAFRAN is an operational meteorological analysis scheme that combines ground-based observations, large-scale atmospheric analyses, and orographic information to produce spatially and temporally consistent estimates of near-surface meteorological variables. The dataset provides high-quality precipitation fields at hourly resolution over France, available from 1958 to the present, and is widely used for hydrological and climate studies due to its consistency in time, thorough homogenization technique, and fine scale detail (∼ 8 km × 8 km resolution).
As described earlier, our predictive framework relies on large-scale atmospheric and oceanic indices, specifically the SLP-based modes and Atlantic Multidecadal Variability (AMV) derived from Sea Surface Temperature (SST) anomalies. For this purpose, we used ERA5 reanalysis dataset (Hersbach et al., 2020), which provides global, high-resolution atmospheric and oceanic fields at 0.25° spatial resolution and hourly temporal frequency. The ERA5 data, covering the period 1948 to the present, offers a physically consistent representation of large-scale climate variability and serves as the observational reference for computing both SLP and SST indices used in this study. The exact definition of those indices will be provided later on in the paper.
2.1.2 Modeled Data
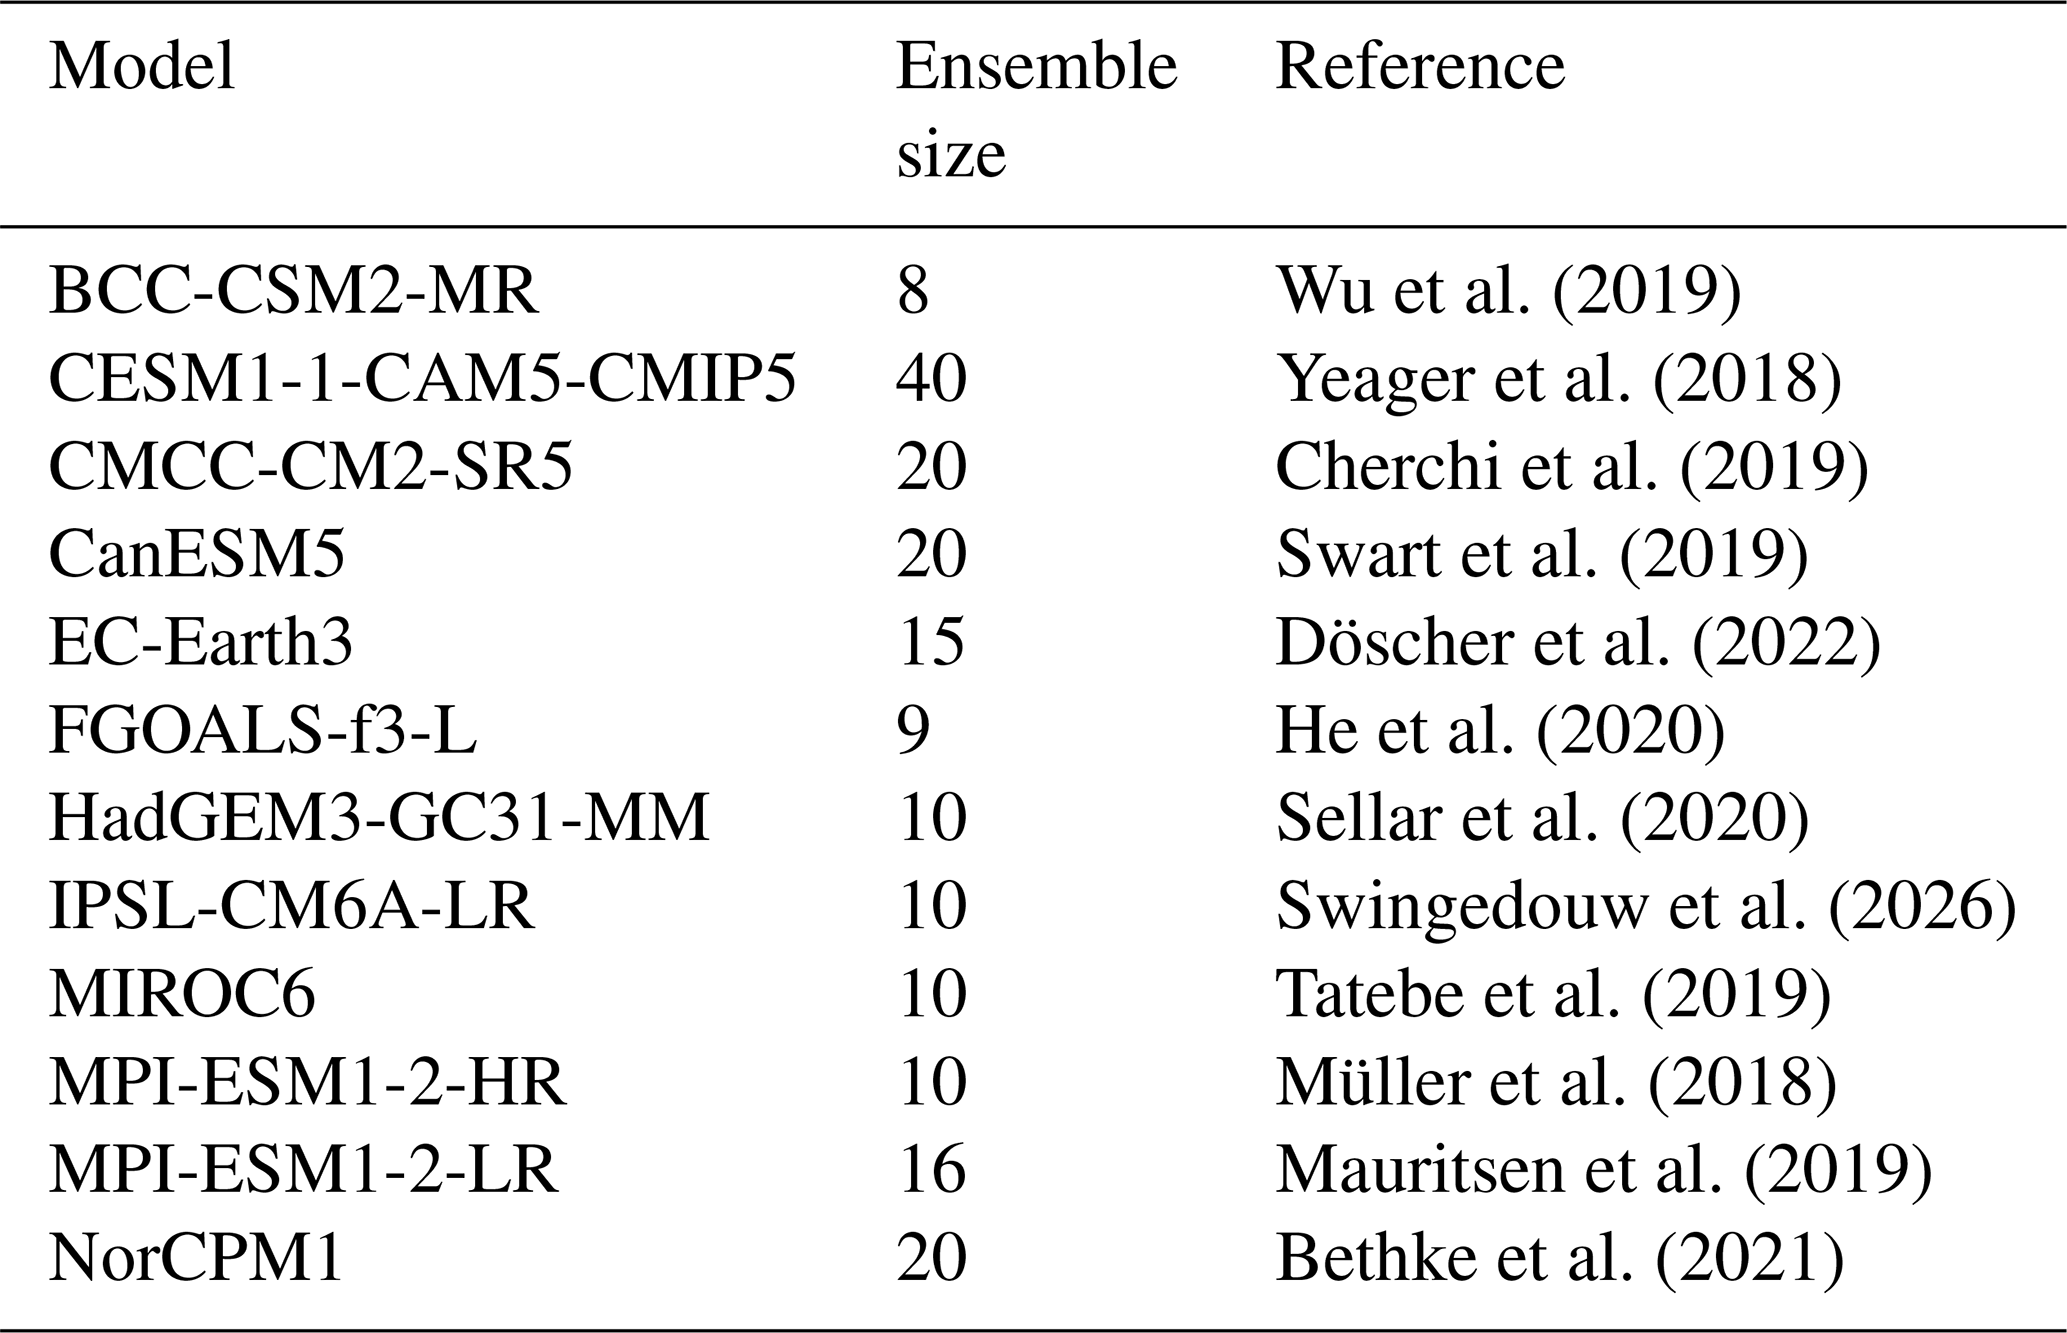
To predict SLP-based mode and AMV indices, we use the multi-model ensemble of initialized decadal predictions from the Decadal Climate Prediction Project Component A (DCPP-A) within CMIP6 (Boer et al., 2016). The ensemble includes decadal hindcasts from 12 models (see Table A1), with a total of 188 members initialized annually from 1960 to 2014 and run for a decade.
Once the target indices are predicted, we apply a subsampling method (described below) to the outputs from the large ensemble of extended historical simulations from the IPSL-CM6A-LR model, consisting of 32 members covering the period 1850–2059 (Bonnet et al., 2021). IPSL-CM6A-LR model contributed to CMIP6 database. It has a nominal horizontal resolution of approximately 2.5° × 1.25° for the atmosphere and 1° for the ocean. A full description of its main components and climatology can be found in Bonnet et al. (2021).
2.2 Methods
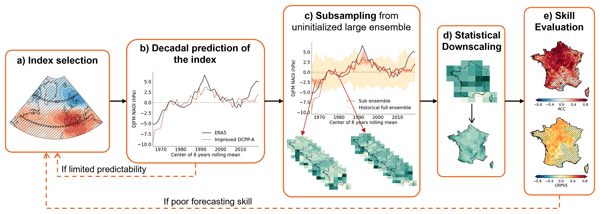
The method we propose to obtain fine-scale decadal precipitation forecasting can be summarized in a 5-step workflow (Fig. 1). This method can be applied to any variable to be predicted over any region of the world. It is designed to boost the skill capacity for the prediction of this variable. Here, we describe its application over France for the precipitation variable.
The workflow begins with the selection of a relevant climate index identified through observed teleconnections between precipitation and atmospheric or oceanic variability. The index is then predicted using an approach that is improving raw decadal predictions (Alkama et al., 2026), followed by a subsampling procedure that selects the ensemble members from a non-initialized climate model that are best matching the index forecasted. The resulting subset of simulations then undergoes temporal aggregation and statistical downscaling to generate regional-scale precipitation forecasts. Finally, these forecasts are evaluated against observations using deterministic and probabilistic skill scores. This workflow is applied in this paper to build and evaluate improved precipitation predictions separately for extended-winter (October to March) and extended-summer (April to September). Trial-and-error tests were conducted to identify the most relevant SLP indices, as indicated by the dashed lines (Fig. 1). The five key steps are detailed below:
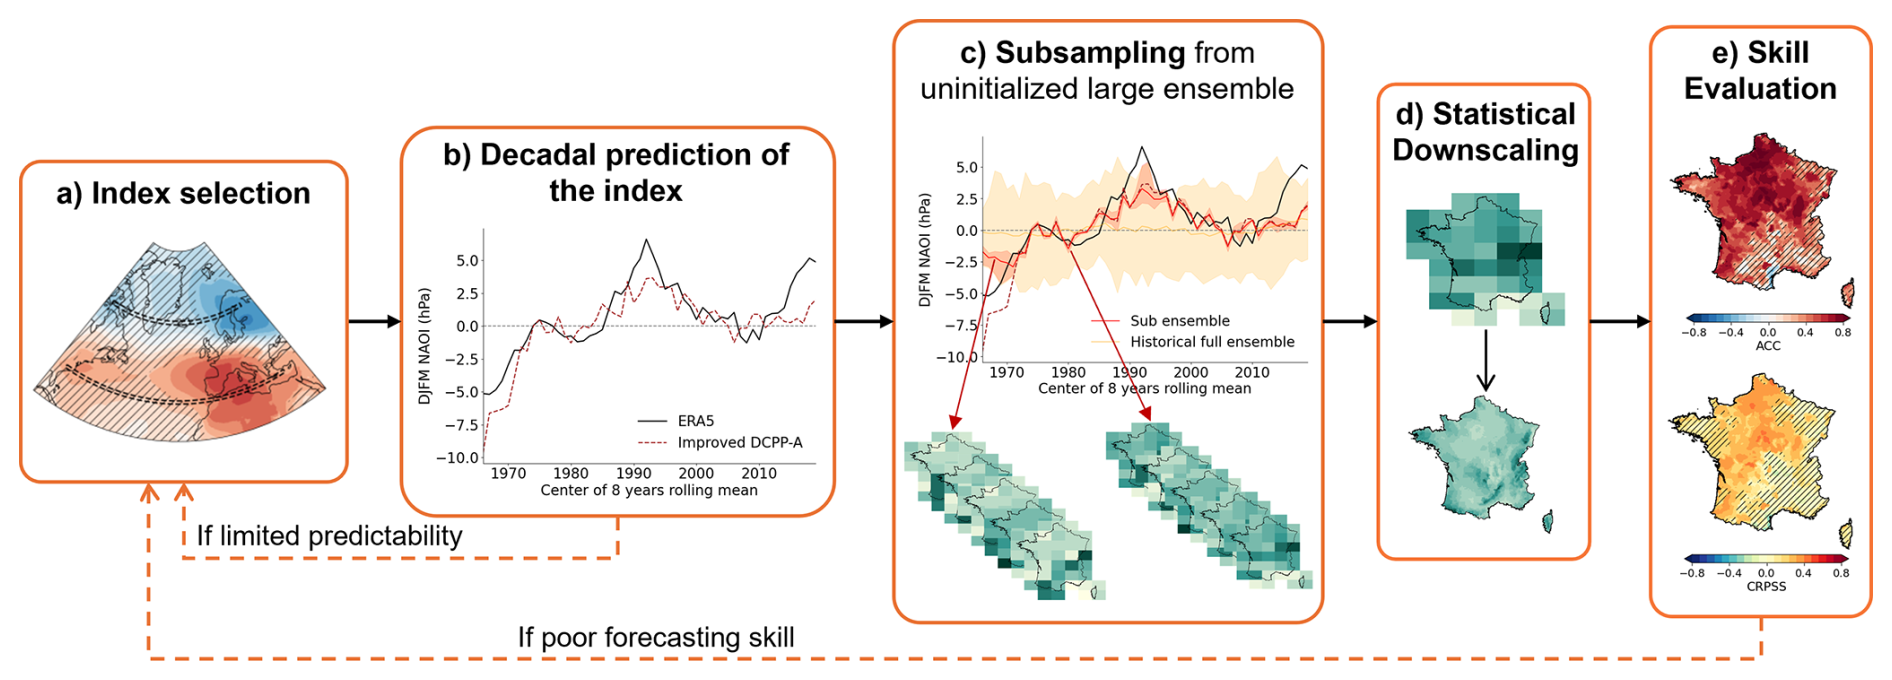
Figure 1Schematic workflow of the proposed framework for decadal prediction of hydroclimate variables: (a) identifying the most relevant large-scale index (here, wNAO), showing the strongest correlation with the target hydroclimate variable (here, winter precipitation); (b) predicting the selected index using improved decadal forecasts from the DCPP database; (c) selecting ensemble members from an uninitialized climate model that best reproduce the predicted index; (d) aggregating, bias-correcting and downscaling the resulting sub-ensemble predictions to the 8 km spatial resolution; (e) Evaluating forecast skill using temporal metrics (e.g., ACC and CRPSS).
2.2.1 Step a: Index selection
To identify large-scale drivers of precipitation variability over France, we derive the main SLP pattern that affect precipitation. Then, we combine the results with knowledge from literature-based climate indices. More precisely, the whole process follows the three analytical stages described below.
(a1) Identifying dominant precipitation patterns
We apply Empirical Orthogonal Function (EOF) analysis to observed seasonal precipitation anomalies using the eofs Python package (Dawson, 2016). EOF analysis decomposes the covariance matrix of the input data into orthogonal spatial patterns (EOFs) and their corresponding time series called principal components (PCs) (Wilks, 2020).
To emphasize low-frequency variability and reduce the influence of interannual noise, precipitation anomalies are smoothed using a 3-year centered rolling mean, and linear trends are removed. The choice of the averaging window is a compromise between enhanced low-frequency variability and retaining sufficient temporal resolution. Results were qualitatively similar for averaging windows between 2 and 4 years (not shown). We define two 6-month extended seasons: October to March (ONDJFM) and April to September (AMJJAS). We limit our analysis to the first two leading modes of variability from the EOF analysis.
(a2) Exploring main temporal periodicities
To gain physical understanding of the main mode of variability obtained through EOF, it is interesting to evaluate the frequency of the main variability modes of precipitation over France. Indeed, strong low frequency variability is indicative of some potential for decadal predictability. Although this step is not required in our workflow, it was included in this study to better characterize the variability of precipitation over France, and to explore how this might relate to decadal predictability. The frequency characteristics are further investigated by applying a continuous wavelet transform (CWT) to the first two principal components using the pycwt Python package (Krieger and Freij, 2023; Torrence and Compo, 1998) with a Morlet wavelet. Wavelet analysis allows the examination of multiscale and non-stationary signals by convolving the input time series with scaled and shifted versions of the wavelet. Time-averaged frequency spectra highlight dominant frequencies, while the full CWT spectra show their temporal evolution.
(a3) Linking precipitation to large-scale climate patterns
We compute correlation maps between the first two principal components of precipitation anomalies (PCs) and SLP anomalies over the North Atlantic sector (20–85° N, 85° W–40° E), for both extended warm and cold seasons. The significance of the correlation coefficients is assessed using a block bootstrap procedure (1000 samples) with a block size of 3 years, where correlations are considered significant if zero is outside the 95 % confidence interval of the bootstrap distribution. Based on the significant correlation patterns and previous literature, candidate SLP indices for decadal precipitation prediction are identified (see Sect. 3.1 for further discussion). From these patterns and previous literature, we identified four atmospheric indices most relevant for France:
For the winter season, those are:
-
The North Atlantic Oscillation Index (wNAO), calculated for DJFM (December to March) as the difference in mean SLP between two zonal boxes spanning the North Atlantic-European sector – subtropical (35–40° N, 80° W–30° E) and subpolar (63–67° N, 80° W–30° E) – following Jianping and Wang (2003). This formulation reduces sensitivity to east-west shifts in the centers of action that can happen within climate models. It should be noted that unlike Jianping and Wang (2003), here the indices are not normalized.
-
The West Europe Pressure Anomaly (wWEPA), defined for ONDJFM (October to March) as the SLP difference between two large spatial boxes: one centered on the Canary Islands (22–36° N, 27–0° W) and another over England (47–61° N, 21° W–21° E). This index based on regional boxes is inspired by the WEPA station-based index of (Castelle et al., 2017) but is less sensitive to slight shifts in space, making it more robust for observations and models. Note that the sign is reversed relative to Castelle et al. (2017), defined here as the southern minus the northern box, for consistency with the wNAO sign convention.
For the summer season, they are:
-
The Summer North Atlantic Oscillation index (hereafter sNAO), defined for AMJJAS (April to September) as the sea level pressure (SLP) difference between two regions: one located west of England and France (45–55° N, 20° W–12° E) and another south of Greenland (55–69° N, 60–45° W). This definition is adapted from previous studies (Dunstone et al., 2023; Folland et al., 2009; Wang and Ting, 2022) to better capture the observed correlations between precipitation principal components and SLP.
-
The Mediterranean-Scandinavia index (sMedScand), computed for AMJJAS (April to September) as the difference between a region over the Mediterranean (30–46° N, 6° W–35° E) and a region over Scandinavia (55–70° N, 3–22° E), based on the correlations obtained between the second PC of summer precipitation and SLP.
The relevance of these indices is evaluated by computing Pearson correlation coefficients with the corresponding principal components at two temporal scales. Correlations are first computed between the PCs based on 3-year mean precipitation and the climate indices smoothed using a 3-year rolling mean. Then, lower-frequency variability of around 8 years is assessed by applying another 6-year rolling mean to the previous PCs and 3-year means climate indices.
To extract atmospheric indices, observations and model outputs are remapped to a common 2° × 2° regular grid using bilinear interpolation prior to spatial averaging over the index definition regions. For observations and the uninitialized IPSL ensemble, 8-year rolling means are first computed from the raw seasonal values, and anomalies are then obtained by subtracting the climatological mean of these smoothed times series, estimated over the full 1966–2019 period. For DCPP boosted predictions (see Sect. 2.2.2), the 8-year aggregation follows the lead-time-aware method of (Alkama et al., 2026); anomalies are subsequently computed relative to the same 1966–2019 climatological baseline.
In addition to the atmospheric indices, we include an AMV index to capture potential low-frequency oceanic influences on European climate (Sutton and Hodson, 2005). The AMV describes the evolution of the dominant mode of North Atlantic SST variability over multidecadal timescales (Schlesinger and Ramankutty, 1994). We define the index used here as the area-weighted mean of annual-mean SST over the North Atlantic domain (0–60° N, 76° W–0° E). For models with curvilinear or irregular ocean grids, weighting is performed using the model-native grid-cell area field; for models on regular latitude-longitude grids, cosine-of-latitude weighting is used. To avoid making any hypothesis to remove the global warming trend, we just use this raw and unadjusted times series that we call uAMV (e.g., Michel et al., 2022) since this does not correspond to classical definitions from the literature, where the trend is removed using various approaches (e.g., Terray, 2012; Trenberth and Shea, 2006). We retain here the externally forced signal in the uAMV index as well as the internal signal, because both signals are used in the subsampling procedure described below (Sect. 2.2.3) to select model members that best reproduce both internal variability and forced trends, which may be misrepresented in models (Kharin et al., 2012). Removing the forced component consistently across observations, initialized, and uninitialized simulations is challenging; thus, keeping the raw signal improves consistency and preserves important multidecadal trends.
2.2.2 Step b: Predicting climate indices using boosted decadal forecasts
We apply the post-processing method developed by Alkama et al. (2026) that improves the earlier work by Marcheggiani et al. (2023) and Smith et al. (2020). This approach includes two key steps:
-
The DCPP-A ensemble mean is aggregated across lead times using an optimized averaging scheme. For each target 8-year calendar window, rather than combining members from four consecutive start dates as in Smith et al. (2020) – which introduces a systematic two-year lag between the predicted and observed periods – Alkama et al. (2026) restrict averaging to hindcast years that fall within the target calendar window. Specifically, for each calendar year in the window, the predicted values from all contributing hindcast start dates (lead years 2–9) are first averaged, before computing the 8-year mean. This ensures temporal synchronization between predictions and observations and increases the ACC of the boosted winter NAO from 0.58 to 0.83 (Alkama et al., 2026). Here, the method is applied using lead times 2–10, rather than 2–9 in Alkama et al. This does not extend the 8-year averaging window, but increases the number of hindcast members contributing to each calendar year within that window, thereby marginally increasing the effective ensemble size and potentially improving skill.
-
The ensemble mean forecast is variance-rescaled so that its standard deviation matches that of the observed signal, correcting for the systematic underestimation of signal amplitude associated with the signal-to-noise paradox (Scaife and Smith, 2018).
The resulting predictions are referred to as 'boosted' decadal predictions. For some indices (wWEPA, sNAO, and sMedScand), the predicted linear trend is opposite in sign to the observed trend (Fig. S1). In these cases, the predicted trend is adjusted to match the observed trend over the historical period, following (Kharin et al., 2012); for future forecasts, this correction is applied by extending the historical observed trend.
2.2.3 Step c: Subsampling procedure (index-matching)
To transfer predictability from large-scale indices to precipitation, we adopt an index-based subsampling strategy inspired by the NAO-matching method (Alkama et al., 2026; Smith et al., 2020). The idea of selecting climate simulations based on predicted or observed criteria has been employed in various contexts: in seasonal forecasting (Ding et al., 2018) and on decadal-to-multi-decadal timescales (Befort et al., 2020; Mahmood et al., 2021, 2022, 2025). Smith et al. (2020) introduced the NAO-matching method by selecting a subset of 20 members from multi-model decadal simulations at each 8-year window whose NAO values best match the NAO prediction from the whole DCP predictions ensemble mean. Climate variables (e.g., precipitation) are then extracted from this subset, yielding “NAO-matched precipitation” predictions expected to improve skill.
Alkama et al. (2026) applied NAO-matching to an uninitialized large ensemble from CESM2, showing skill improvements compared to initialized multi-model, also subsampled on NAO predictions, especially in extended-winter precipitation, though with limited skill over France. This might be related to the fact that initialized predictions can show strong drift in the first few years, contrary to uninitialized large ensemble (e.g., Polkova et al., 2023).
Motivated by these findings, we apply the subsampling method to the large ensemble of extended historical IPSL-CM6A-LR model (32 members), spanning 1850–2059 (Bonnet et al., 2021), hereafter called “uninit IPSL”. The subsampling method selects relevant uninitialized ensemble members separately for each 8-year mean window. The 8-year mean climate index centered in t is predicted by each 32 uninitialized ensemble members (), and by the boosted DCP ensemble mean (f(t)). We select the five uninitialized ensemble members minimizing D defined as:
We name “Sub(X)” the selected ensemble where X denotes the climate index used (e.g., Sub(wNAO)). The procedure can be applied using any SLP or SST index individually or combined. In the case of combined selection, the five selected uninitialized ensemble members minimize:
where and for each index. Standard deviations are computed over the entire historical period rather than at each individual date to provide a stable normalization that is not influenced by the small sample size at any given window.
For extended summer precipitation prediction, we combine the sNAO, sMedScand SLP indices and the uAMV. The corresponding selected ensembles are called “Sub(sNAO+uAMV)” and “Sub(sMedScand+uAMV)”. The subsampling procedure is applied on the entire historical period from 1961 to 2024, allowing to extract precipitation – or other variables – predictions from the selected ensembles. The skill of this system is assessed on 8-year means computed from ensemble members that can be different at successive 8-year periods. The resulting prediction shows reduced temporal coherence that is not directly comparable to the smoothed rolling means applied to observations. To ensure consistent autocorrelation properties, we apply to the selected members the aggregation of the post-processing method described in Sect. 2.2.2 – specifically, the 8-year running mean aggregation with the lead-time weighting scheme.
2.2.4 Step d: Statistical downscaling
The SAFRAN reanalysis provides high-quality precipitation observations at an 8 km resolution across France and has become a reference dataset for hydrological applications, water resource management, and impact studies (Labrousse et al., 2020; Seyedhashemi et al., 2023; Vidal et al., 2010). Developing decadal precipitation forecasts at the same spatial scale would directly support these operational needs by bridging the gap between coarse-scale climate predictions and local-scale decision-making. Correcting the bias of the prediction is also necessary in order to use them in impact studies.
To achieve this, we use the Cumulative Distribution Function-transform (CDF-t) method (Michelangeli et al., 2009), a widely used quantile-mapping technique. CDF-t adjusts the statistical distribution of modeled precipitation to match that of observations while preserving the model's representation of large-scale variability.
This method allows to statistically downscale the subsampled precipitation outputs (∼ 150 km resolution) onto the SAFRAN 8-km grid using available observation. Such an approach is necessary and widely used for impact studies.
This method also accounts for changes in the distribution between historical and forecast periods through a transfer function that aligns modeled and observed daily cumulative distributions and therefore remove the bias in prediction at the daily timescale. The CDF-t technique has been extensively validated for precipitation bias correction and regional climate projection studies (Gogien et al., 2023; Sauquet et al., 2026; Vrac et al., 2012).
2.2.5 Step e: Skill evaluation
We assessed the skill of 8-year precipitation predictions against SAFRAN observations using deterministic and probabilistic metrics (see details in Appendix B). Those skill scores are:
-
Anomaly Correlation Coefficient (ACC). It measures the ability of the ensemble mean to predict temporal variations of observed precipitation anomalies (Wilks, 2020).
-
Residual Correlation Coefficient (RCC). It quantifies added value of initialization compared to the uninitialized ensemble mean. Correlations are computed between residuals from two regressions allowing to withdraw the uninitialized ensemble mean from observations and predictions (Smith et al., 2019).
-
Continuous Ranked Probability Score (CRPS). It assesses overall probabilistic forecast quality by integrating squared differences between the forecasted and observed cumulative distribution functions (Gneiting and Raftery, 2007; Hersbach, 2000). CRPS quantifies both calibration and sharpness as a forecast will be penalized if the observed value falls outside the predicted interval, or if the interval is too wide. The CRPS is computed using the scores Python package (Leeuwenburg et al., 2024), with the “fair” method to correct for finite-ensemble bias (Ferro, 2014).
-
CRPS Skill Score (CRPSS). Compare CRPS of the subsampled predictions against the full uninitialized ensemble. CRPSS and its categorical version RPSS (Ranked Probability Skill Score) are commonly used to evaluate probabilistic climate forecasts (Bonnet et al., 2025; Goddard et al., 2013; Moulds et al., 2023). In our case the continuous version is used.
Statistical significance of ACC, RCC and CRPSS is assessed using a block bootstrap with 1000 samples and block size of eight years to account for temporal autocorrelation (Rousselet et al., 2021; Smith et al., 2020). The p-values are estimated as the proportion of bootstrap scores falling below zero (Goddard et al., 2013). To account for the multiplicity problem arising from simultaneous testing across all grid points (Wilks, 2020), significance is assessed using the False Discovery Rate (FDR) correction with and αglobal=0.05 following (Wilks, 2016) (see Supplement Sect. S9).
Before evaluating forecast skill, the variance of both the subsampled predictions and the uninitialized full ensemble are rescaled to match that of the observations. Because observations represent a single realization of the climate system, while ensemble means (five-member subsampled and 32-member uninitialized) inherently smooth variability through averaging, their standard deviations are artificially reduced. To ensure statistical consistency and comparability with the observed variance, we apply a variance-scaling correction. Each ensemble member is multiplied by , where σo and σm are the standard deviations of the observations and the ensemble member, respectively, computed on the entire historical period. This adjustment does not affect ACC but improves CRPSS by preventing the prediction ensemble from being too narrow, which would lead to underconfident forecast. CRPSS maps computed from the raw, uncorrected predictions are provided in the Supplement (Fig. S10).
2.2.6 Comparison with raw DCPP ensemble mean
The forecast skill is also evaluated against the raw DCPP-A ensemble mean. The DCPP ensemble includes 11 models (and not 12 because precipitation data for CESM1-1-CAM5-CMIP5 are unavailable on ESGF). Drift is removed from DCPP-A predictions by computing precipitation anomalies relative to a lead-time-dependent climatology for each model. Eight-year means are computed by averaging lead times 2–9. The multi-model ensemble mean is then formed by averaging the individual model ensemble means.
The comparison between the two prediction systems is not straightforward due to their different spatial resolutions. DCPP-A predictions are available at a coarse native resolution of approximately 2°, while our subsampling-based predictions have been statistically downscaled at 8 km resolution. To ensure inter-model comparability, we first remapped all DCPP-A outputs to a common 2° resolution grid. Remapping these predictions to a finer scale would not be physically meaningful given the models' native resolution. Concerning the subsampling-based predictions, they have been downscaled and bias-corrected against the SAFRAN observational dataset (∼ 8 km, ∼ 0.08° resolution). Remapping the downscaled subsampling predictions to a 2° is not straightforward. Indeed, since these predictions are only available over metropolitan France, regridding to a 2° would result in incomplete coverage of several coarse grid cells at the domain boundaries, introducing artefacts in the skill computation.
For consistency, ACC from both prediction systems (raw DCPP and subsampled predictions) are compared using ERA5 dataset. DCPP-A predictions are compared against ERA5 remapped to 2°, while subsampling predictions are compared against ERA5 at 0.25° resolution. Note that the subsampling predictions are spatially interpolated onto the 0.25° ERA5 grid for this comparison, no additional bias correction is applied at this stage.
3.1 Observed large-scale variability and teleconnections
The EOF analysis of observed precipitation anomalies (Figs. 2 and 4) reveals distinct spatial and temporal modes of variability over France for both winter and summer seasons. For winter (October to March), the first EOF explains 50.2 % of the total variance and exhibits a spatially coherent pattern with uniform sign across most of France, except along the Mediterranean coast (Fig. 2a). This indicates a dominant large-scale mode of variability for precipitation that affects almost the whole France. The second mode accounts for an additional 17.8 % of the variance and displays a pronounced North-South dipole, reflecting opposite sign of variability between northern and southern France (Fig. 2b).
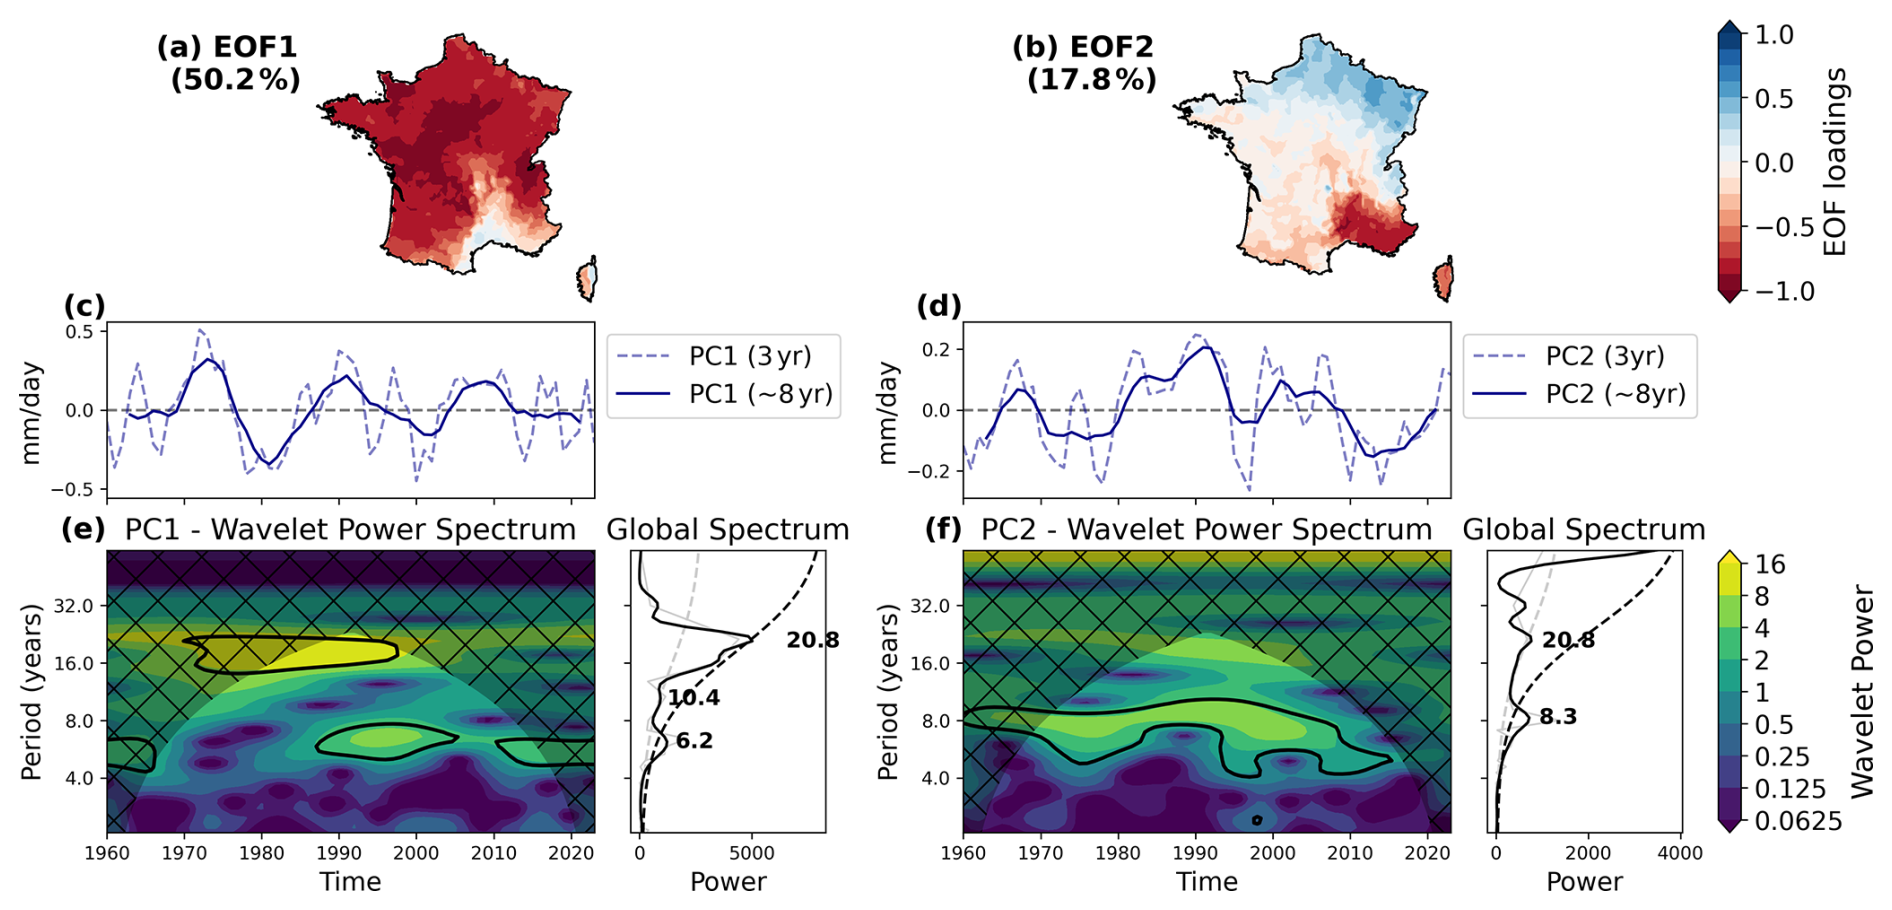
Figure 2Spatial and temporal variability of winter (ONDJFM) precipitation over France (1960–2023). Panels (a) and (b) show the spatial patterns of the first two Empirical Orthogonal Function (EOF) modes of 3-year running mean winter precipitation anomalies from SAFRAN observations, with the percentage of total variance explained shown in parentheses. Colors represent the spatial loadings of each mode expressed as correlations with the principal components. Panels (c) and (d) depict the corresponding principal components (PCs) time series in mm d−1, with dashed and solid blue lines denoting the raw PCs from 3-year means and the low-frequency filtered PCs of around 8 years, respectively. Panels (e) and (f) present the wavelet power spectra (left) and global wavelet power spectra (right) for EOF1 and EOF2 PCs, respectively. In the wavelet spectra, the x-axis is time, and the y-axis is period in years; warmer colors denote higher power. Black contours in the wavelet spectra indicate the 95 % confidence level against a red noise background, while shaded regions depict the cone of influence (COI) where edge effects may influence the results. The global spectra panels show the time-averaged wavelet power spectrum (solid black line) and the Fourier power spectrum (solid gray line), with dashed lines corresponding to the 95 % significance levels.
Wavelet analysis of the first Principal Component (PC1) identifies two statistically significant periodicities close to 6 and 21 years (Fig. 2e). The longer ∼ 21-year cycle remains persistent throughout the historical period, whereas the ∼ 6-year periodicity varies in strength over time. The second PC (PC2) shows a more stable oscillation with a period close to 8 years (Fig. 2f). Together, these statistically significant multi-annual to multi-decadal oscillations reveal physically consistent, non-stationary modes of variability. It suggests that a portion of winter precipitation might be linked to slowly evolving oceanic variability mode – since the ocean has far more temporal inertia than the atmosphere – such as over the North Atlantic region (Persechino et al., 2013). Since the timeseries provided by SAFRAN covers less than 70 years, peaks of variability beyond 30 years are not captured by this analysis. A bi-decadal variability mode in the North Atlantic has been highlighted in the northern part of the North Atlantic Ocean (Swingedouw et al., 2013b, 2015) and might explain the 21-year peak highlighted here, through imprints of the ocean on the atmosphere.
Correlation maps between winter precipitation PCs and North Atlantic SLP anomalies reveal robust teleconnection patterns in the atmosphere (Fig. 3). Correlation map of SLP with PC1 of precipitation displays a dipole pattern over the North Atlantic-European sector that closely mirrors the WEPA index defined by Castelle et al. (2017). Since the first EOF shows negative precipitation anomalies (Fig. 2), and is correlated with a positive wWEPA pattern (Fig. 3), it results in an anti-correlation between PC1 and wWEPA. A negative WEPA corresponds to an intensification and southward shift of the Icelandic Low-Azores High dipole, which drives enhanced precipitation across western and central Europe (Jalón-Rojas and Castelle, 2021). Correlation map of SLP with PC2 of precipitation shows a broader pattern consistent with the wNAO pattern. Time series comparisons confirm strong negative correlations between PC1 and wWEPA (, p<0.01 for 3-year smoothing), and more moderate positive correlations between PC2 and wNAO (r=0.43, p<0.01). These relationships justify using wWEPA and wNAO as key predictors for winter precipitation variability.
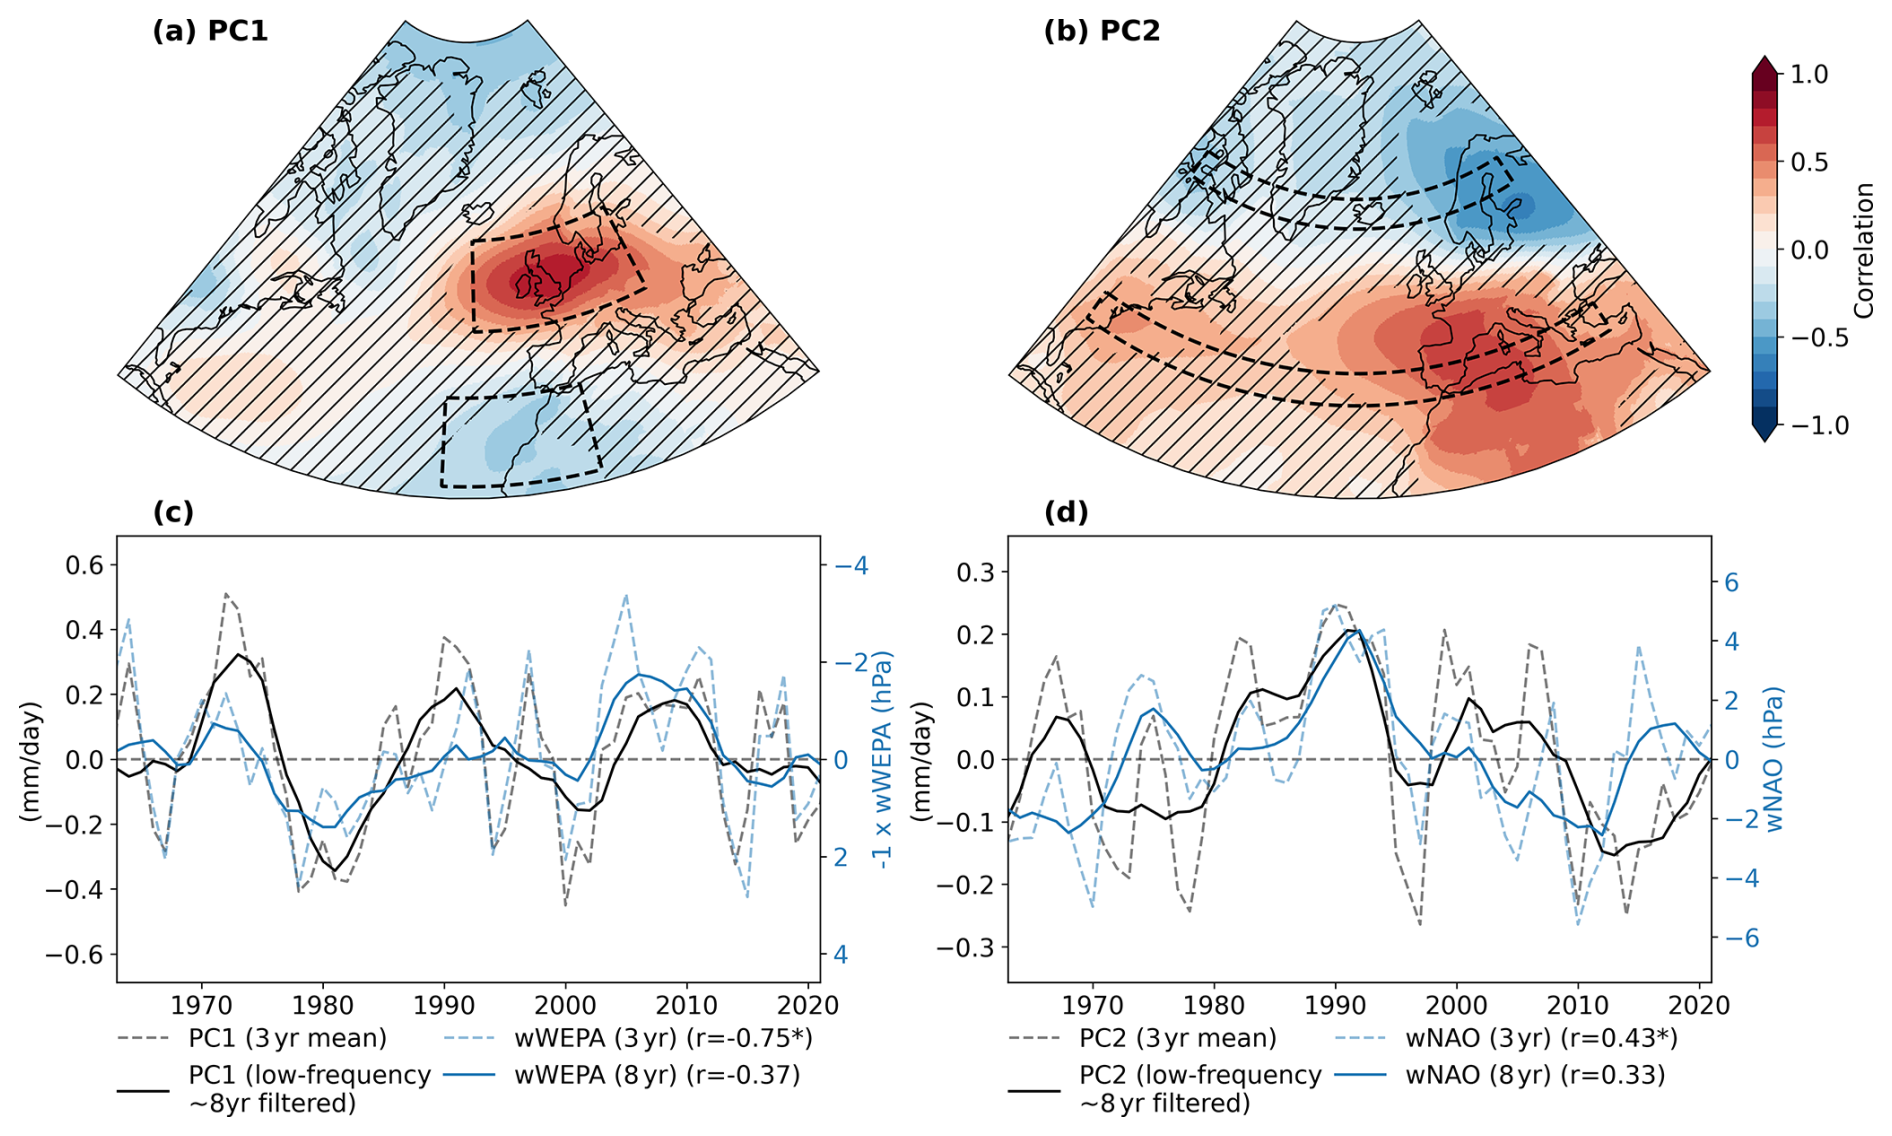
Figure 3Relationship between winter (ONDJFM) precipitation variability and large-scale North Atlantic atmospheric circulation. Panels (a) and (b) display spatial maps of correlations between the first two precipitation PCs (PC1 and PC2) and SLP anomalies over the North Atlantic. Hatched areas denote statistically non-significant correlations at the 95 % confidence level based on a block-bootstrap test. Black dashed boxes outline the spatial domains used to compute the wWEPA (panel a) and wNAO indices (panel b). Panels (c) and (d) compare the time series of precipitation PCs (black lines) with their corresponding SLP indices (blue lines), including 3-year running mean (dashed) and low-frequency (∼ 8-year) filtered (solid). Reported correlation coefficients (r) correspond to both smoothing scales. Units for the precipitation PCs are mm d−1, for the SLP indices are hPa.
For summer (April–September), the first EOF of precipitation over France explains 50 % of the variance and shows a uniform pattern across France, except over the Mediterranean coast (Fig. 4a). The second mode (17 %) again exhibits a North-South dipole (Fig. 4b). Wavelet analysis of the PC1 highlights a notable ∼ 7-year periodicity since the mid-1980s, while the PC2 exhibits a strong 21-year oscillation alongside an intermittent 5-year cycle.
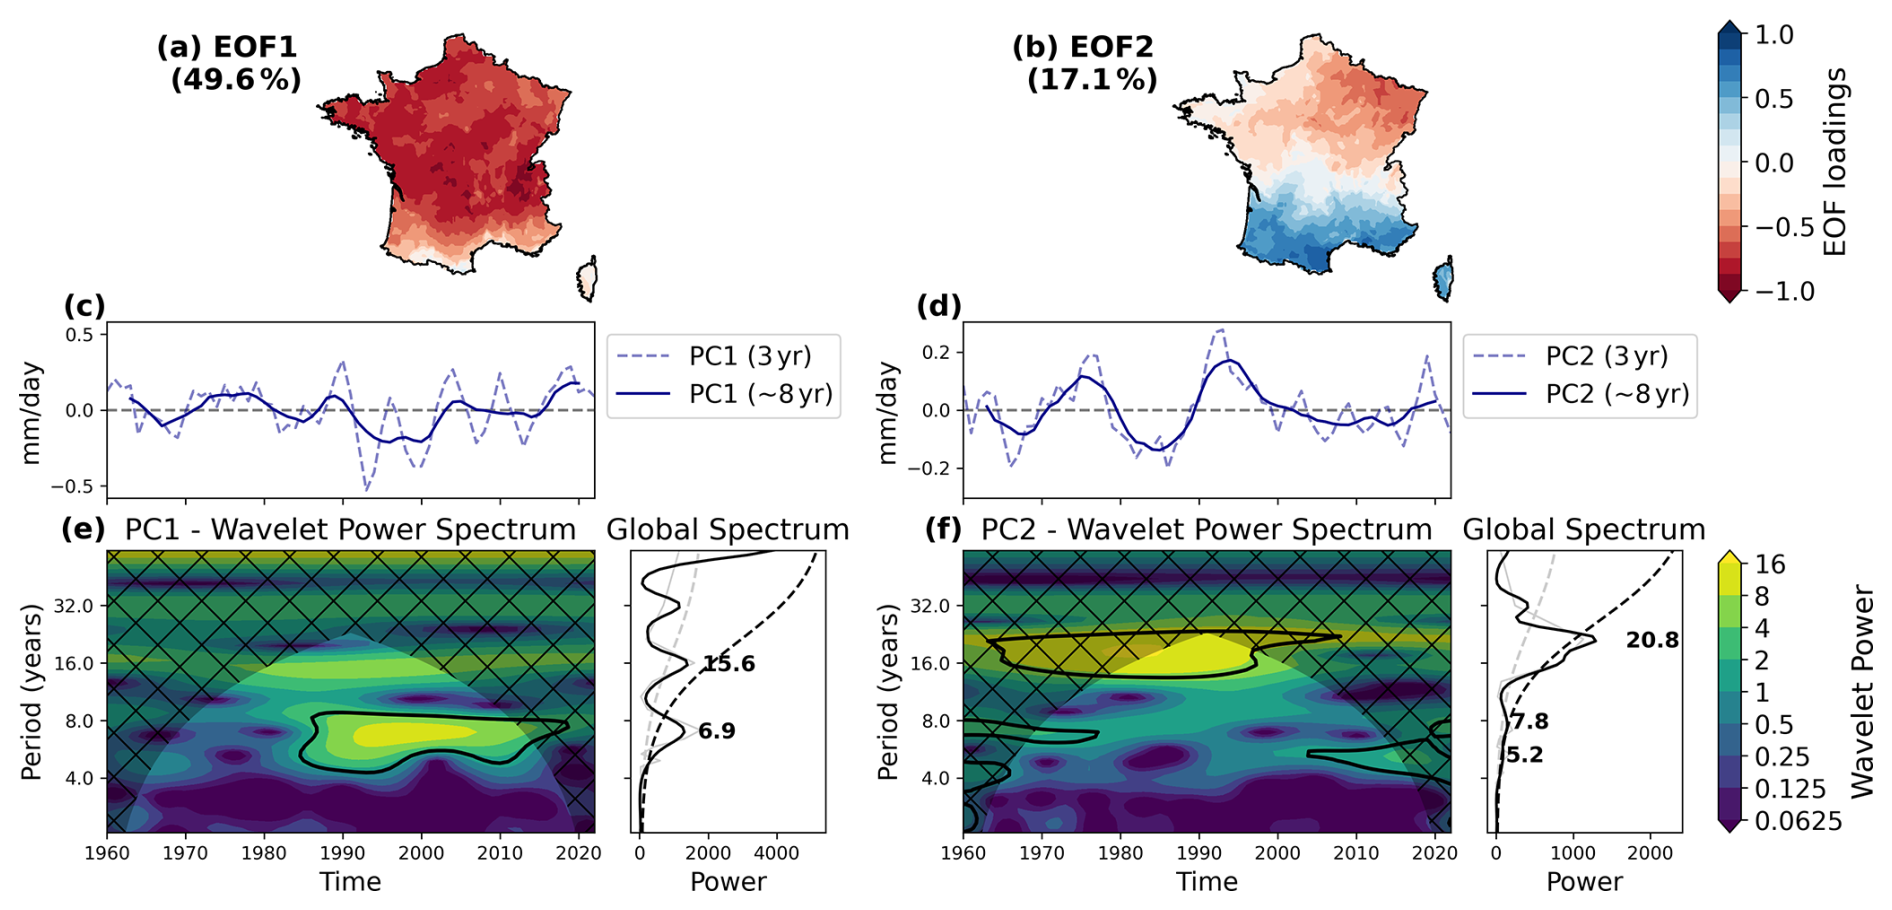
Figure 4Spatial and temporal variability of summer (AMJJAS) precipitation over France (1960–2023). Panels (a) and (b) show the spatial patterns of the first two Empirical Orthogonal Function (EOF) modes of 3-year running mean summer precipitation anomalies from SAFRAN observations, with the percentage of total variance explained shown in parentheses. Colors represent the spatial loadings of each mode expressed as correlations with the principal components. Panels (c) and (d) depict the corresponding principal components (PCs) time series in mm d−1, with dashed and solid blue lines denoting the raw PCs from 3-year means and the low-frequency filtered PCs of around 8 years, respectively. Panels (e) and (f) present the wavelet power spectra (left) and global wavelet power spectra (right) for EOF1 and EOF2 PCs, respectively. In the wavelet spectra, the x-axis is time, and the y-axis is period in years; warmer colors denote higher power. Black contours in the wavelet spectra indicate the 95 % confidence level against a red noise background, while shaded regions depict the cone of influence (COI) where edge effects may influence the results. The global spectra display the time-averaged wavelet power (solid black line) and the Fourier power (solid gray line), with dashed lines corresponding to the 95 % significance levels.
Correlations between summer PCs and SLP anomalies show that PC1 is linked to the Summer NAO (sNAO) pattern, whose index definition is here slightly refined compared to standard one, in order to better align with main driver of precipitation variability (Fig. 5a, c). Generally speaking, the sNAO pattern is smaller in scale and shifted northward as compared to the winter NAO. Although the amplitude is weaker, it significantly influences northern European climate through modulation of the North Atlantic jet streams and storm tracks (Dong et al., 2013; Dunstone et al., 2023; Folland et al., 2009). The resulting sNAO index is strongly correlated with PC1 (r=0.74, p<0.01 for 3-year smoothing). PC2 exhibits weaker correlations with SLP but highlights two significant regions over the Mediterranean and Scandinavian regions, motivating the definition of a Mediterranean-Scandinavia (sMedScand) index (Fig. 5b, d). The sMedScand index is negatively correlated with PC2 (, p<0.01 for 3-year smoothing).
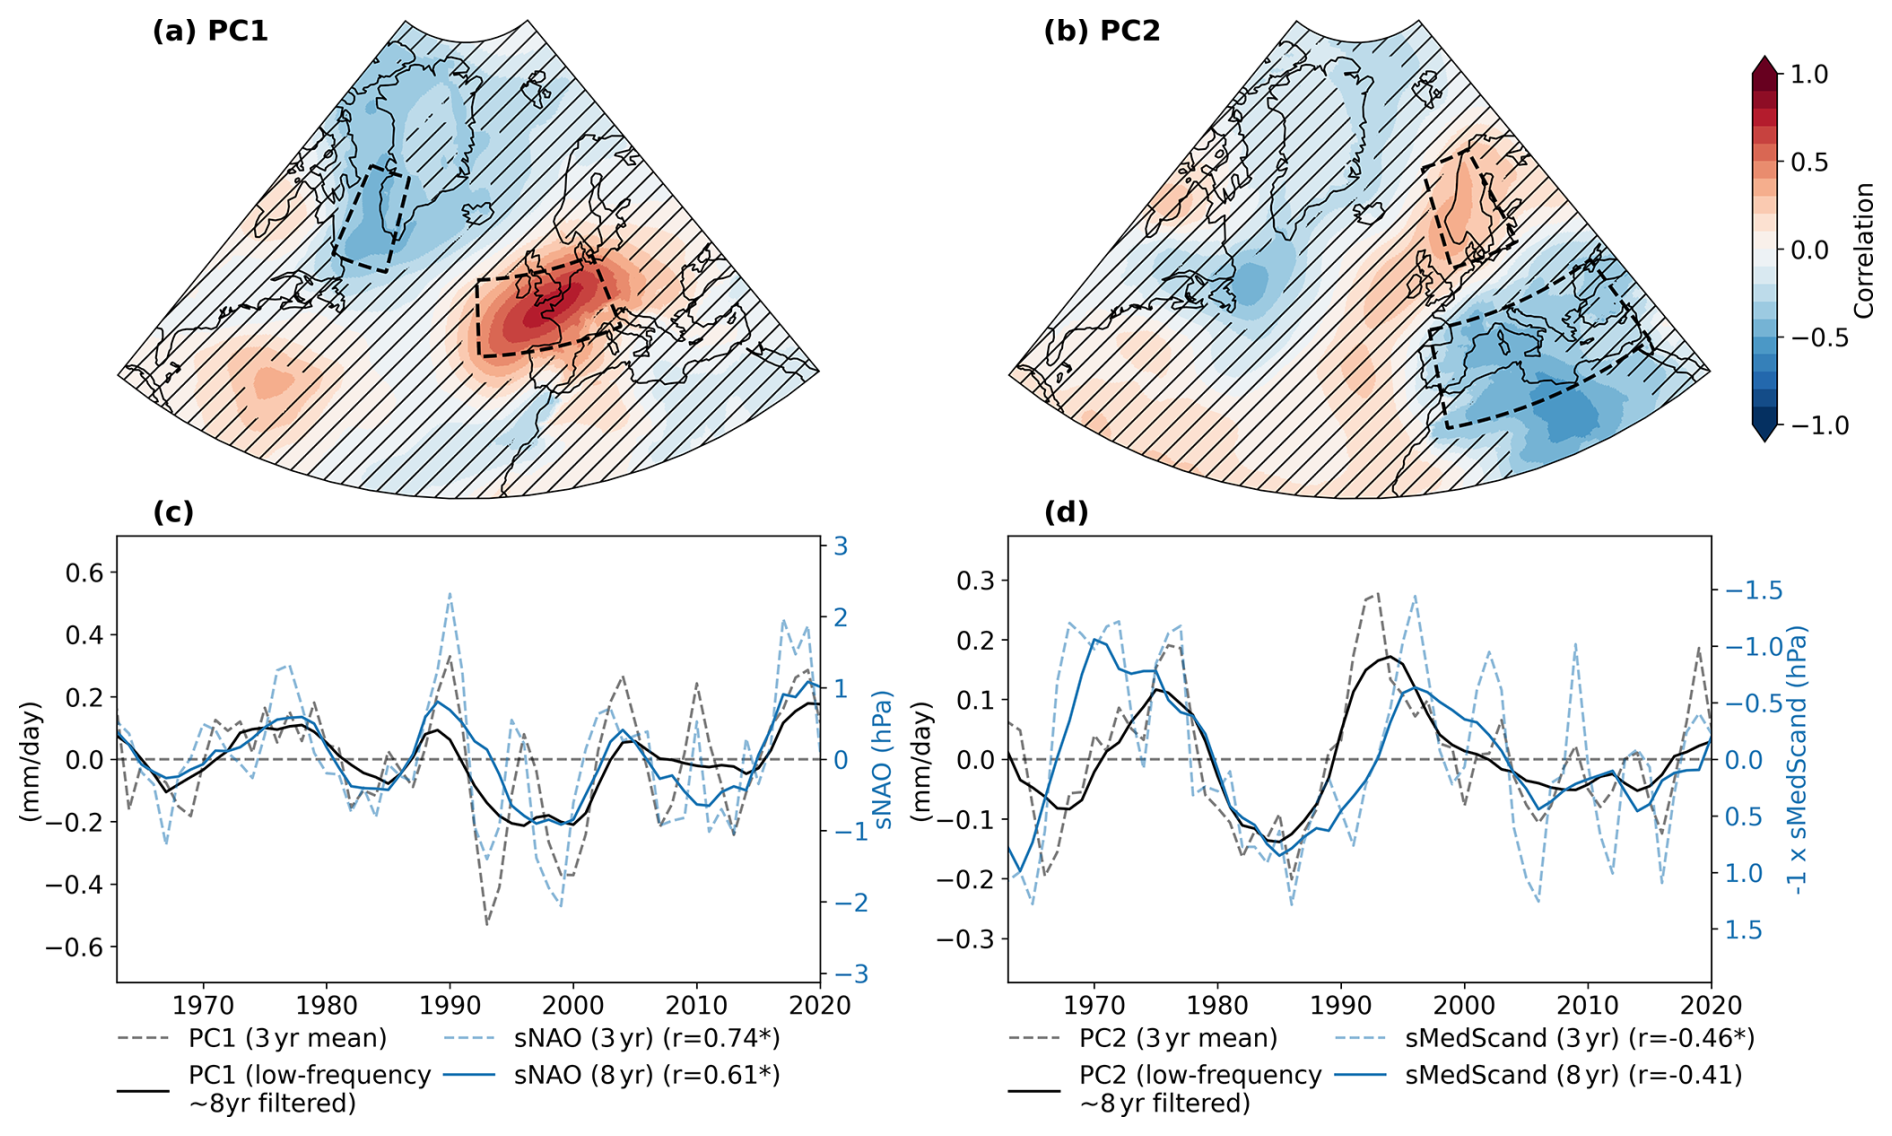
Figure 5Relationship between summer (AMJJAS) precipitation variability and large scale North Atlantic circulation. Panels (a) and (b) show the correlation patterns between summer precipitation PCs (PC1 and PC2) and SLP anomalies over the North Atlantic. Hatched areas indicate regions where correlations are statistically significant at the 95 % confidence level based on a block-bootstrap test. Black dashed boxes outline the spatial domains used to compute the sNAO (panel a) and sMedScand indices (b). Panels (c) and (d) compare the time series of precipitation PCs (black lines) and their corresponding SLP indices (blue lines), including 3-year running mean (dashed) and low-frequency (∼ 8-year) filtered (solid). Reported correlation coefficients (r) correspond to both smoothing scales. Units for the precipitation PCs are mm d−1, and for the SLP indices are hPa.
3.2 Decadal prediction skill of atmospheric and oceanic indices
Hindcasts from the boosted Decadal Climate Prediction Project (DCPP) ensemble successfully reproduce the observed low-frequency variability (8 years) of the key atmospheric indices selected above (Figs. 6 and 7).
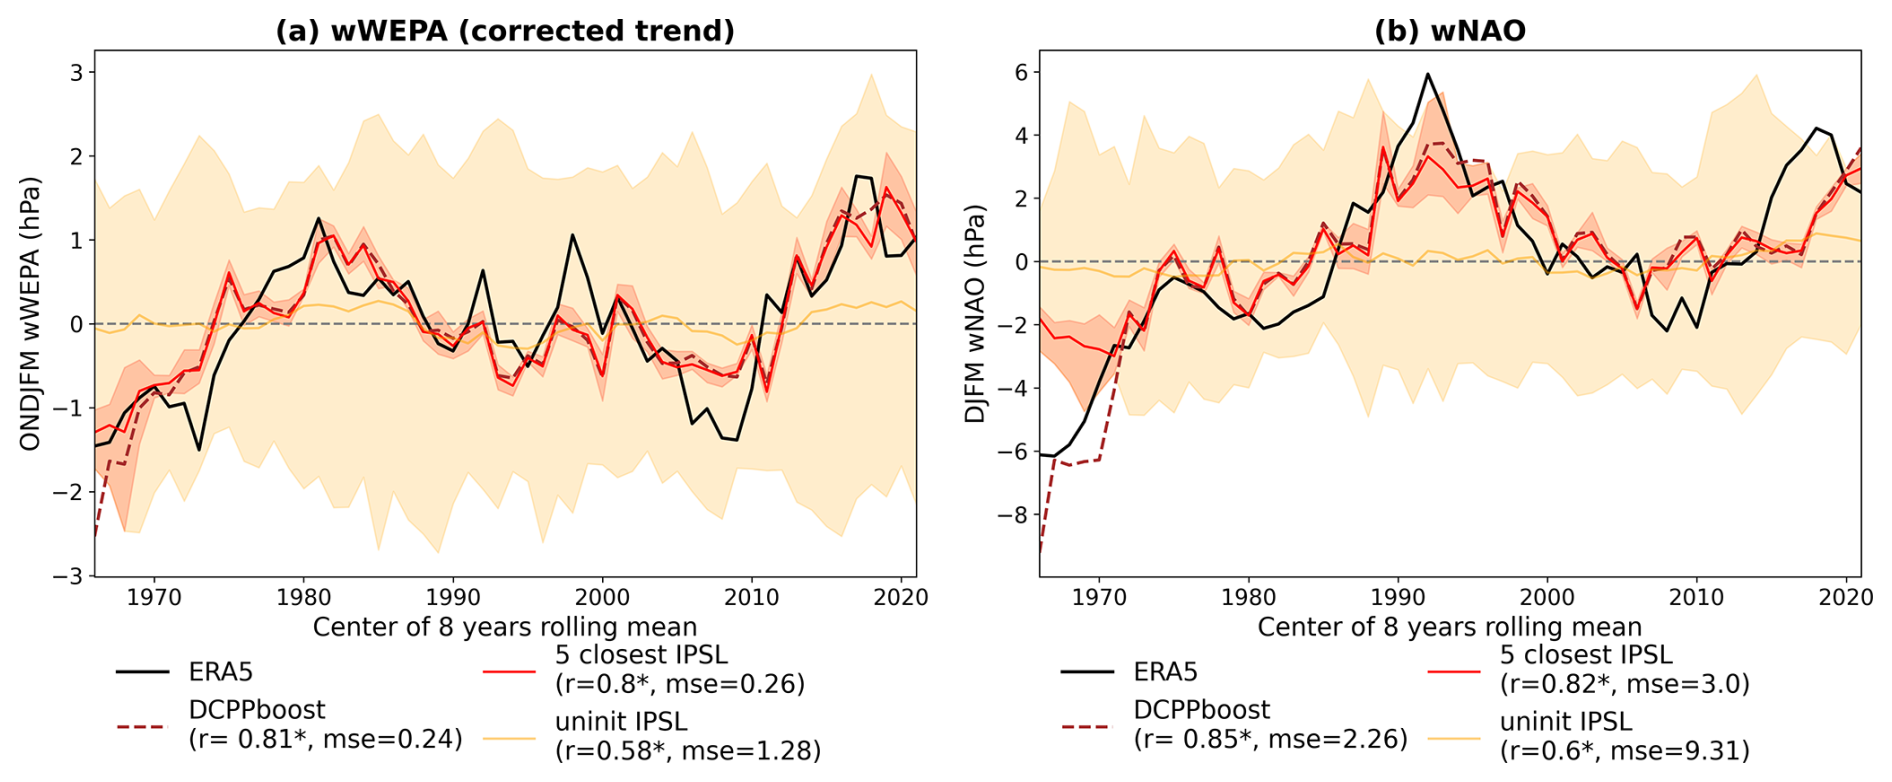
Figure 6Observed and predicted decadal variability of winter atmospheric indices. Panels (a) and (b) show 8-year running mean of the wWEPA and wNAO indices for extended winter seasons (ONDJFM and DJFM respectively). The black line represents ERA5 reanalysis, while the burgundy dashed line shows predictions from the boosted DCPP method. The red shading indicates the spread of the five subsampled members, best matching DCPP indices and selected from the uninitialized IPSL-CM6A-LR ensemble in each 8-year time window, with the bold red line marking their ensemble mean. The yellow line and shading represent the mean and full spread (minimum to maximum) of the entire uninitialized IPSL ensemble, respectively. Correlation coefficients and p-values between predictions and observations are reported in parentheses of each panel's legend.
For winter, boosted DCPP hindcasts effectively capture the observed low-frequency variability of both the wWEPA and wNAO indices, with correlation coefficients of 0.81 and 0.85, respectively (Fig. 6). Selecting the five uninitialized IPSL-CM6A-LR members whose SLP indices most closely match the boosted hindcasts results, by construction, in a sub-ensemble with a substantially narrower spread than the full ensemble. As a consequence, observations frequently fall outside this spread, which should not be interpreted as a failure of reliability. The sub-ensemble was not designed to optimally predict the index itself, but to identify members whose large-scale circulation state is dynamically consistent with the predicted index phase. The skill target of this selection procedure is regional precipitation, whose prediction reliability is assessed later on in the manuscript. The full uninitialized IPSL ensemble shows moderate skill with wider uncertainty and less agreement with observations (Fig. 6). The relatively high ACC of the uninitialized wNAO ensemble mean (r=0.6) is consistent with results from comparable large historical ensembles (Christiansen et al., 2022; Klavans et al., 2021), and likely reflects a substantial contribution from the externally forced response–particularly from anthropogenic aerosol forcing and greenhouse gas-driven trends–rather than from ocean initialization alone. Boosted decadal predictions improve upon this baseline with enhanced signal amplitude, confirming that ocean initialization provides added skill beyond the forced component. Correcting the trend of the wWEPA index notably improves forecast correlation by mitigating model drift effects. Importantly, wNAO predictability is higher when focusing on the 4-month extended winter (December to March) period, as forecast skill diminishes when extending the season to the 6-month ONDJFM period, underscoring the importance of seasonal selection for skill assessment. We therefore use the following the prediction of wNAO over this DJFM season.
For summer, the boosted forecasts indicate skill for both sNAO (ACC =0.72) and sMedScand (ACC =0.57) (Fig. 7a, c). The skill is even higher for the uAMV (ACC =0.94; Fig. 7b) index, reflecting the longer persistence of oceanic modes and their high predictability (e.g., Msadek et al., 2010; Persechino et al., 2013). In the case of atmospheric indices, all boosted decadal predictions ACCs outperform the corresponding uninitialized IPSL ensemble substantially. For the uAMV, the high ACC scores for both the boosted predictions and the uninitialized ensemble seem to be driven by the externally forced trend to a large extent, consistent with a few former studies (e.g. Ting et al., 2009), although covariability between internal variability in observations and forced signal might also obscure the added value of initialized runs. As discussed in Sect. 2.2.1, the externally forced signal was intentionally retained in the uAMV definition, since it contributes to long-term precipitation variability over France. The uAMV is therefore not used as a standalone predictor but exclusively as an additional dynamical constraint alongside the sNAO, in order to better choose members from the large ensemble that include this predictable observed signal, which might be overwhelmed by uninitialized internal variability in some members of the large ensemble. It is worth noting that the similar ACC values of the uAMV index for the sub-ensemble and the full uninitialized ensemble (Fig. 7b) do not imply that including the uAMV in the joint subsampling criterion is redundant. Members selected on the basis of the sNAO alone span a wide range of uAMV states (Fig. 7). Incorporating the uAMV into the MSE-based loss function filters out members whose oceanic state is dynamically inconsistent with the predicted uAMV phase, thereby improving the coherence of the sub-ensemble and the resulting precipitation skill (Fig. 9e), independently of the uAMV's direct initialization contribution.
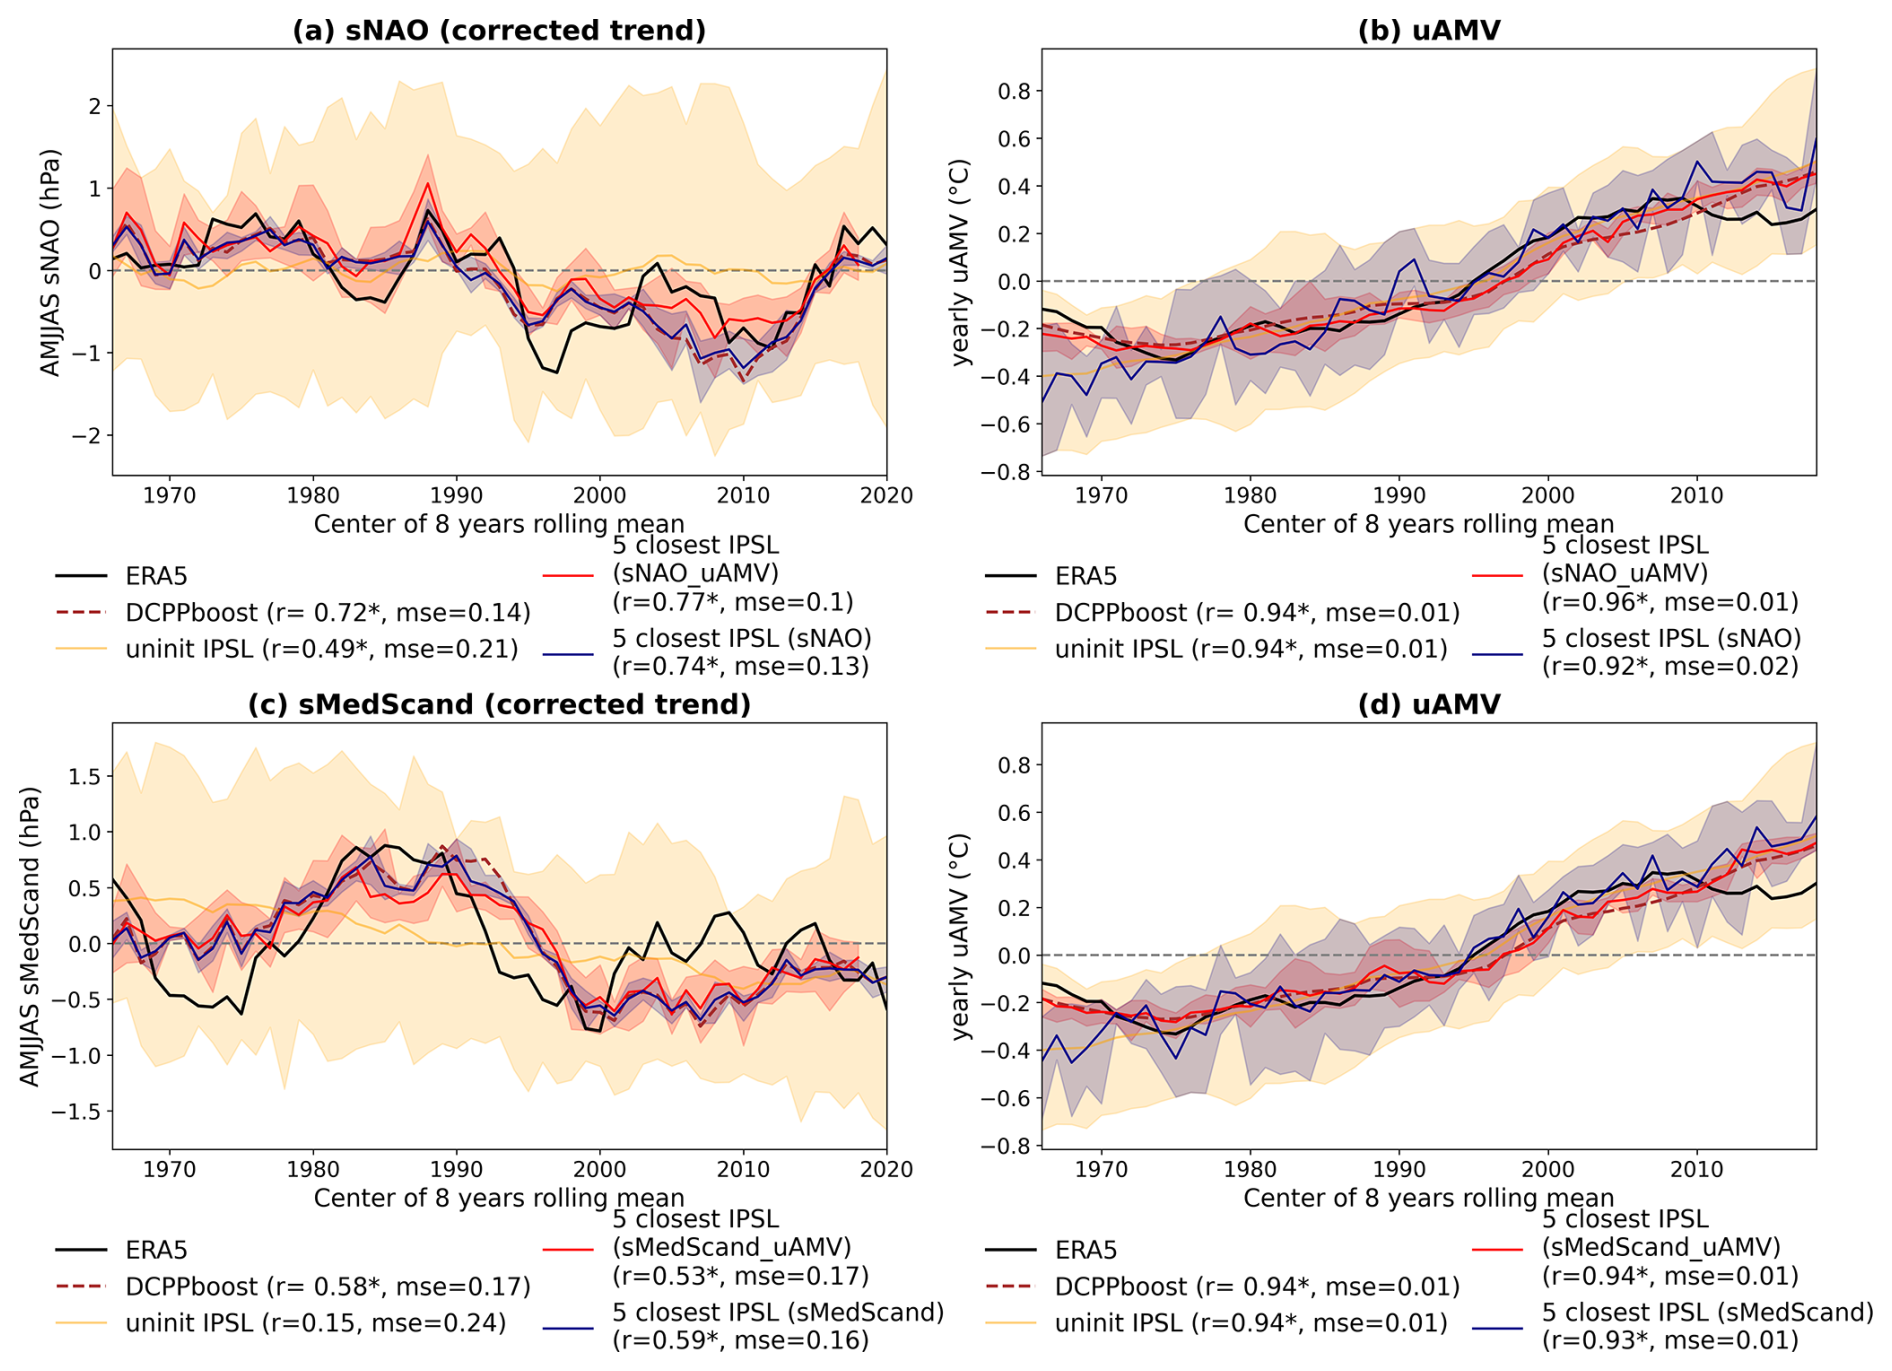
Figure 7Observed and predicted decadal variability of summer large-scale indices. Panels (a) and (c) show 8-year running means of the sNAO and sMedScand indices for the extended summer season (AMJJAS); panels (b) and (d) show the uAMV index (note that the uAMV is shown twice, as it serves as the joint constraint in both the sNAO+uAMV and sMedScand+uAMV subsampling configurations). The black line represents ERA5, and the burgundy dashed line shows boosted DCPP predictions. In each 8-year sliding window, five members are selected from the uninitialized IPSL-CM6A-LR ensemble by minimizing the combined MSE loss function (Eq. 2). The red shading and bold red line show the spread and ensemble mean of the five members selected using both indices jointly (sNAO+uAMV in panels a–b; sMedScand+uAMV in panels c–d). The blue shading and bold blue line show the spread and ensemble mean of the five members selected using the atmospheric index alone (sNAO in panels a–b; sMedScand in panels c–d). The yellow shading and line show the full spread (minimum to maximum) and mean of the entire uninitialized IPSL ensemble. Pearson correlation coefficients (ACC) and mean squared errors (MSE) with ERA5 are reported in each panel legend; stars indicate statistically significant ACC values at the 95 % confidence level.
3.3 Seasonal precipitation forecast skill
Precipitation hindcasts, derived from the subsampling approach, are analyzed in Figs. 8 and 9 and do show skillful prediction over the past periods in a number of regions of France both in summer and winter.
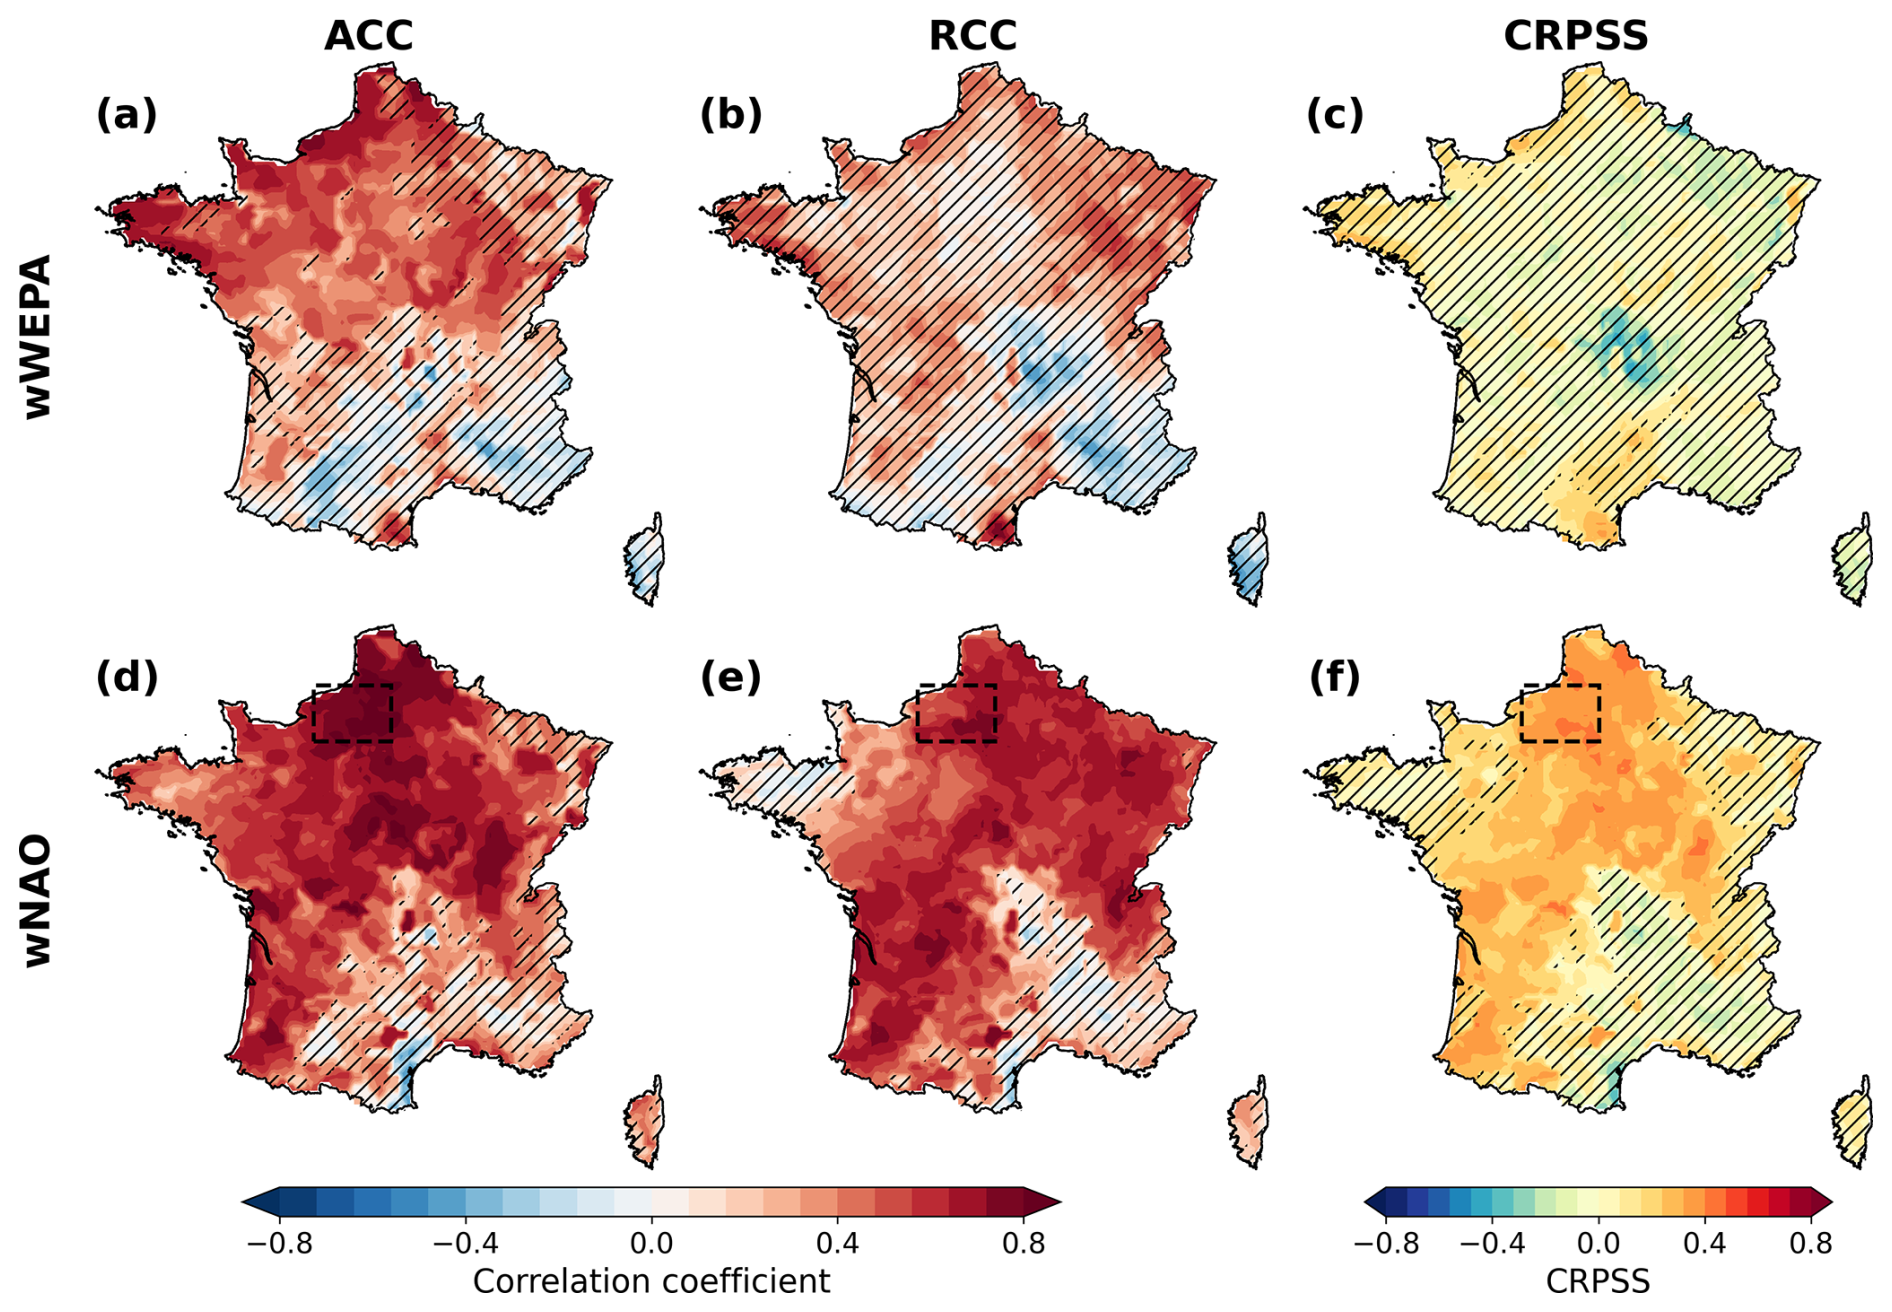
Figure 8Forecast skill for 8-year mean winter (ONDJFM) precipitation anomalies over France. Results are derived from subsampled hindcasts based on the wWEPA (a–c) and wNAO (d–f) indices. Panels show (a, d) Anomaly Correlation Coefficient (ACC), (b, e) Residual Correlation Coefficient (RCC) – quantifying skill beyond the forced response – and (c, f) Continuous Ranked Probability Skill Score (CRPSS), all computed against SAFRAN precipitation observations over 1966–2019. Hatched areas indicate regions where skill scores are not statistically significant at the 95 % confidence level, as assessed using a 1000 sample block bootstrap. Dashed black boxes indicate a specific region illustrated in Fig. 10.
For winter, hindcasts subsampled on wWEPA yield significant ACC over 45 % of all pixels, mainly over the northwestern France (ACC over all the pixels covering France; median =0.33). RCC is not significant, indicating that part of this skill is already present in the uninitialized ensemble (RCC ; median =0.21). The probabilistic performance shows few localized gains, with significant CRPSS on 5 % of the pixels (CRPSS ; median =0.0). In contrast, hindcasts subsampled on wNAO exhibit substantial better skill, with significant ACC over 78 % of the pixels, covering most of mainland France except the Mediterranean coast (ACC ; median =0.54). RCC analysis (RCC ; median =0.54) goes in the same direction, with 81 % significant pixels, and confirms that hindcasts subsampled on the wNAO provide significant skill improvements beyond the forced signal. Finally, CRPSS metric highlights the reduced ensemble spread of the prediction with 61 % significant pixels (CRPSS ; median =0.20). While both indices produce skillful predictions, those based on wNAO consistently outperform wWEPA. These results confirm wNAO as a more effective large-scale predictor for decadal winter precipitation.
For summer, overall forecast skill is lower compared to winter (Fig. 9). Hindcasts subsampled based on the sNAO alone yield significant ACC over 12 % of French territory (ACC ; median =0.05). Skill is geographically concentrated in the north of France, and the probabilistic skill is not significant. Combining sNAO with uAMV index notably enhances performance by broadening skillful areas (ACC ; median =0.32, significant over 48 % of France) and reducing ensemble uncertainty, consistent with RCC significant over 44 % of France (RCC ; median =0.33) and confirmed by probabilistic improvements in CRPSS, with 39 % significant pixels (CRPSS , median =0.11) . It is worth noting that while the sNAO+uAMV subsampling improves summer precipitation skill across most of France relative to sNAO-only subsampling, a degradation is observed over northern France. The origins of these regional differences are not fully understood and may reflect competing influences of the sNAO and uAMV teleconnections in this region. This is left as an open question for future investigation. In contrast, hindcasts subsampled on sMedScand alone yield limited skill, with no significant ACC and only 1 % of France after incorporating the uAMV. The lower skill of sMedScand-based subsampled hindcasts is consistent with weaker observed correlations and lower predictability for this index (Fig. 7, r=0.57). In contrast, when the observed sMedScand index is used directly as a perfect prediction, subsampled hindcasts show significant ACC and RCC scores across southern France (Fig. S3), suggesting that improvements in sMedScand prediction skill would translate directly into improved precipitation forecasts over this region. Overall, summer precipitation forecasts remain less skillful than winter counterparts, likely due to lower prediction skill of summer SLP indices and their reduced variability. For example, observed sNAO fluctuations remain within ±1 hPa, contrasting notably with broader amplitude ranges for winter wNAO (±4 hPa) and wWEPA (±2 hPa) (Fig. 7). Thus, we argue that the reduced summer skill likely arises from smaller SLP variability amplitudes and the predominance of localized convective rainfall not explicitly resolved in present-day models' frameworks.
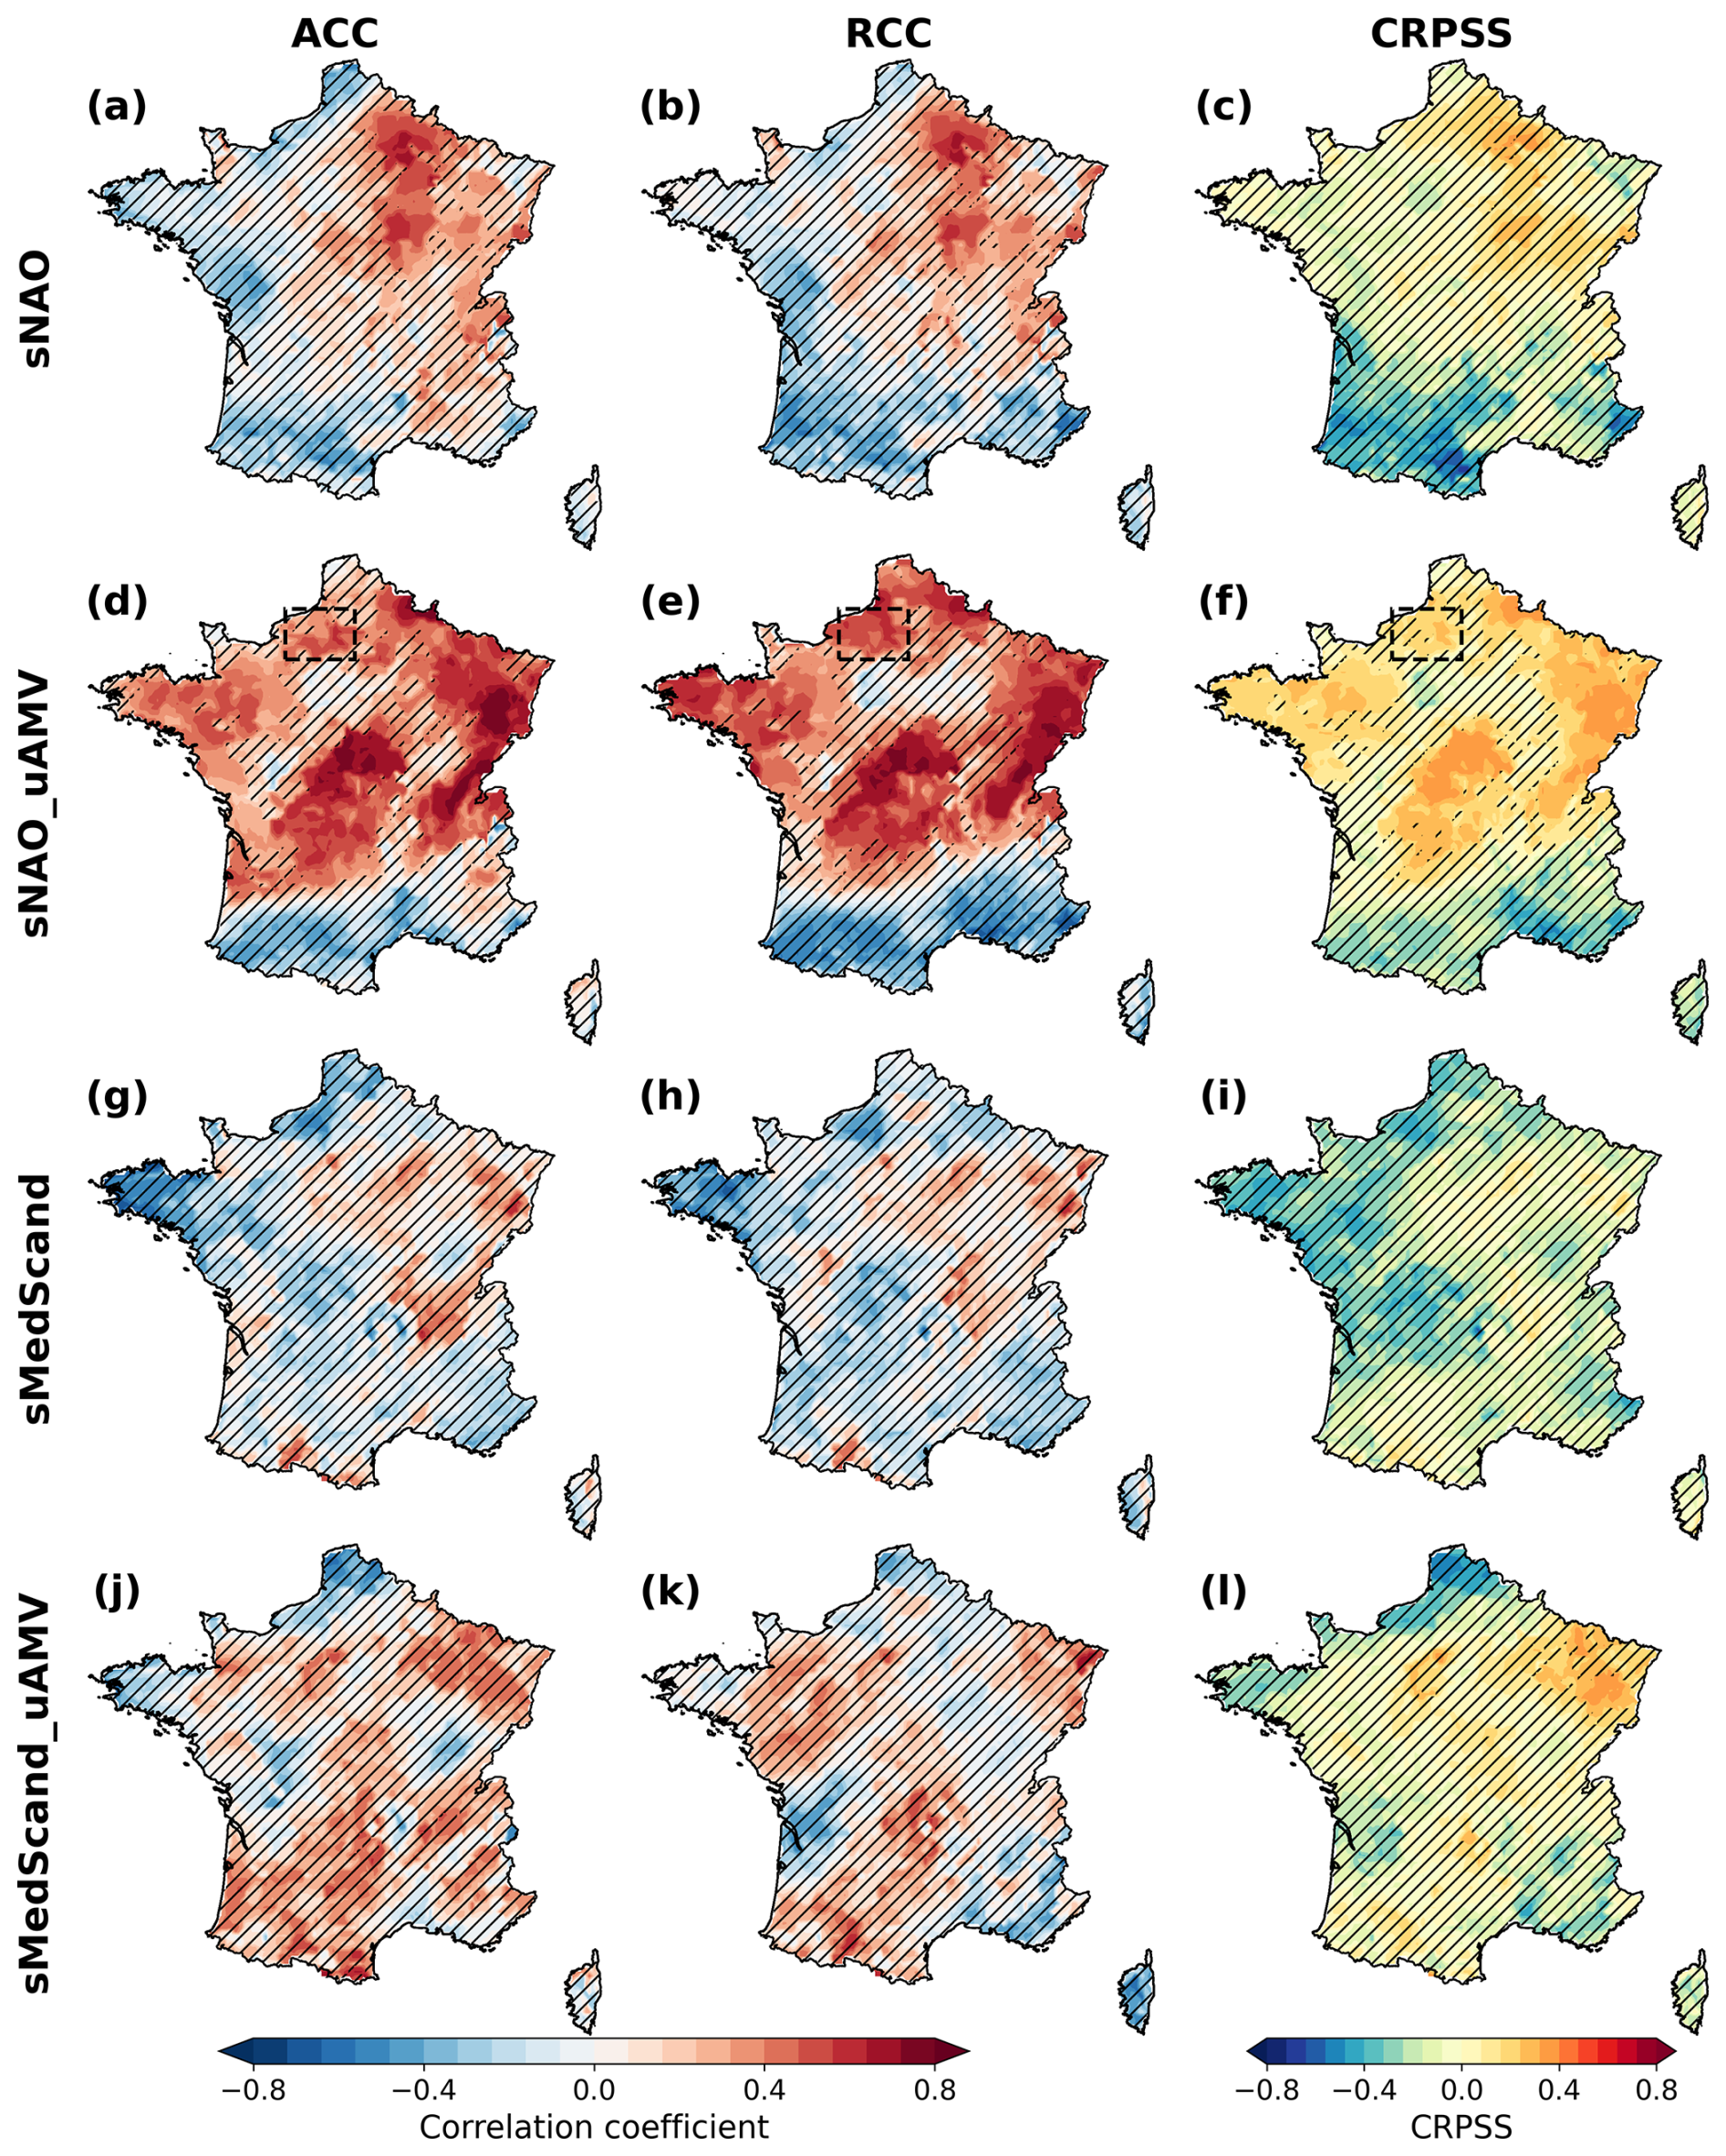
Figure 9Forecast skill for 8-year mean summer (AMJJAS) precipitation anomalies over France. Results are derived from subsampled hindcasts based on the sNAO (a–c), sNAO+uAMV (d–f), sMedScand (g–i) and sMedScand+uAMV (j–l) indices. Panels show (a, d) Anomaly Correlation Coefficient (ACC), (b,e) Residual Correlation Coefficient (RCC) – quantifying skill beyond the forced response – and (c, f) Continuous Ranked Probability Skill Score (CRPSS), all computed against SAFRAN precipitation observations over 1966–2019. Hatched regions indicate areas where skill scores are not statistically significant at the 95 % confidence level, as assessed using a 1000 sample block bootstrap. Dashed black boxes indicate a specific region illustrated in Fig. 10.
In summary, wNAO-based subsampling for winter and combined sNAO+uAMV subsampling for summer yield most skillful decadal precipitation forecasts over France. For northern France (e.g. regions around Rouen, Figs. 8–9), correlation between predicted and observed 8-year precipitation anomalies improve compared to the uninitialized hindcasts from 0.68 to 0.83 in winter, and from −0.08 to 0.41 in summer (Fig. 10). Furthermore, the ensemble spread is notably reduced in the subsampled hindcasts, indicating lower prediction uncertainty and greater confidence compared to the broader uninitialized ensemble. These results demonstrate the tangible benefits of index-based subsampling for operational decadal climate forecasting.
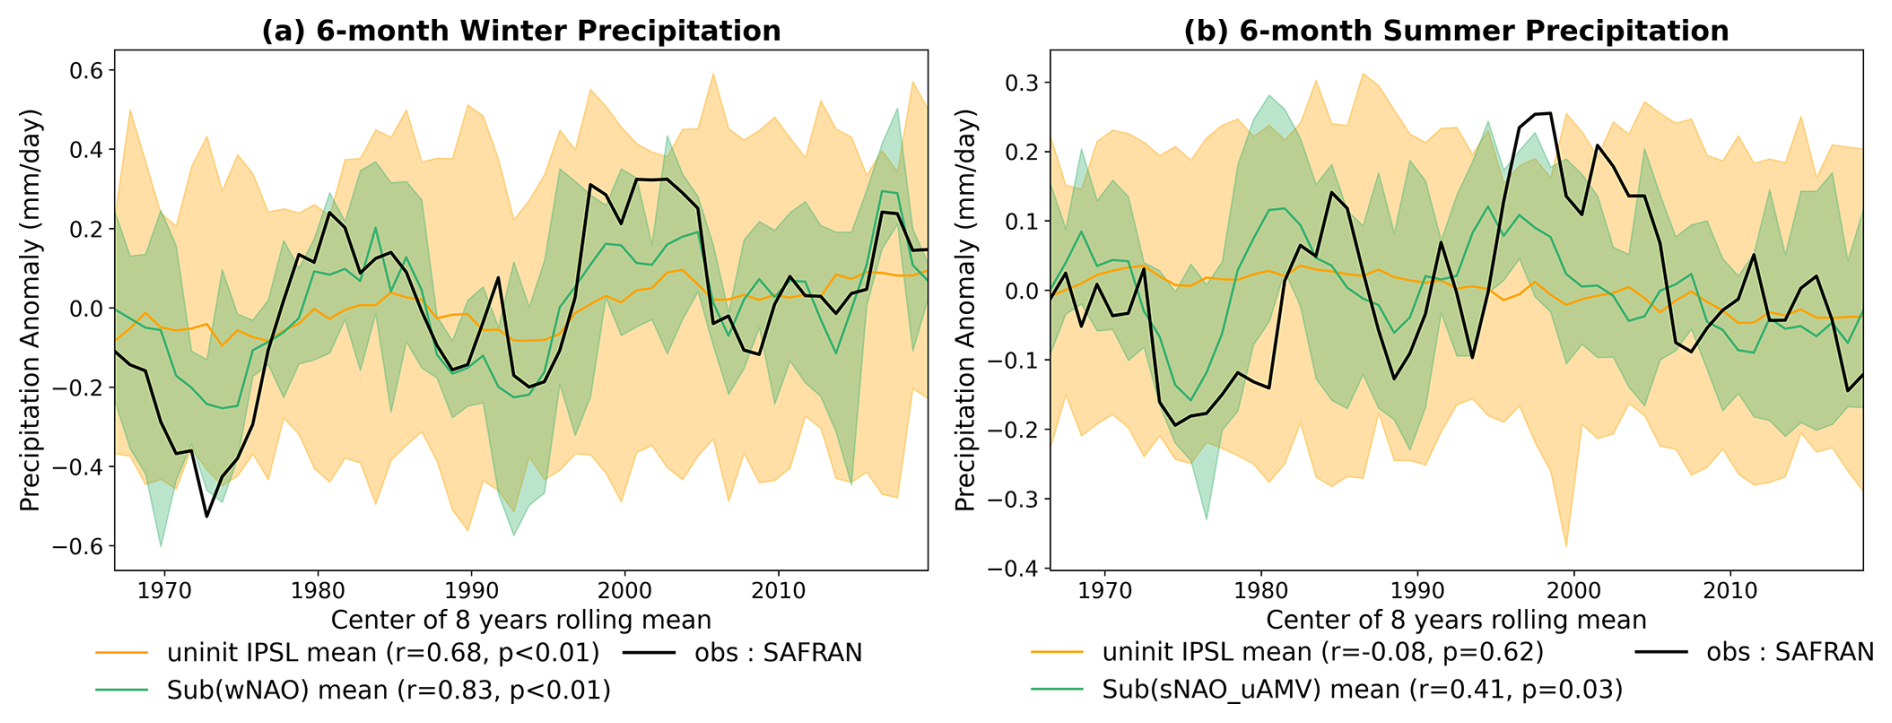
Figure 10Panels (a) and (b) show 8-year running mean precipitation anomalies for winter (ONDJFM) and summer (AMJJAS), respectively, averaged over the region outlined by dashed boxes in Figs. 8 and 9. The black line shows SAFRAN observations. The green line represents the mean of the five-member sub-ensemble selected based on the wNAO index (a) and combined sNAO+uAMV indices (b). The yellow line shows the mean of the full uninitialized IPSL ensemble. Shaded areas indicate the ensemble spread, defined as the 5th to 95th percentile range.
Finally, in winter, wNAO-based subsampling predictions substantially outperform the raw DCPP-A ensemble mean (Fig. 11a–d), with significant ACCs over the majority of metropolitan France, whereas DCPP-A skill is largely confined to the French Atlantic coast. In summer, skill improvements from sNAO+uAMV subsampling are more localized, with gains over Brittany and northern and north-eastern France. In southern France, however, the subsampling skill is lower than that of DCPP-A (Fig. 11e–f). This is because the summer DCPP-A skill in this region is largely attributable to a linear trend, likely of external origin (Fig. 11g). We also note that the skill of the subsampling predictions evaluated against ERA5 at 0.25° differs slightly from the evaluated against SAFRAN (Figs. 8, 9, 11), with higher correlations in winter and lower correlations in summer when ERA5 is used as the reference.
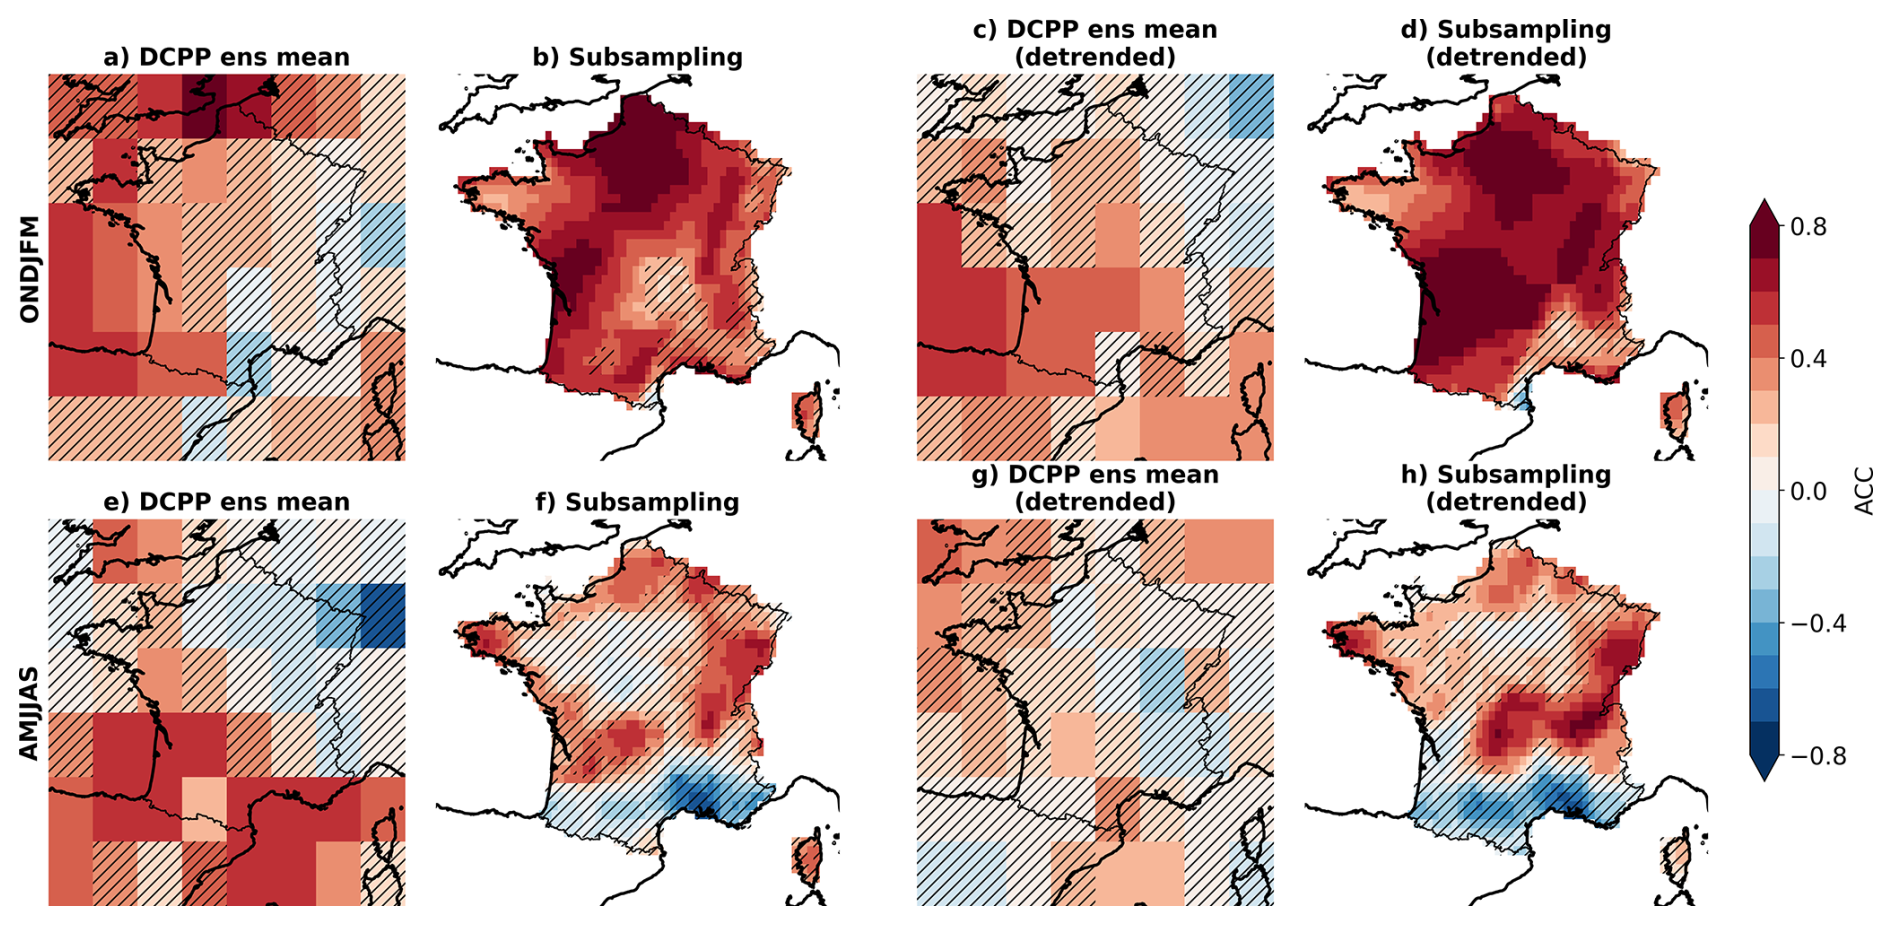
Figure 11Precipitation prediction skill for the DCPP-A ensemble mean and the subsampling method, for extended winter (ONDJFM, a–d) and extended summer (AMJJAS, e–h), evaluated against ERA5 over 1966–2019. Panels (a) and (e): ACC between the DCPP-A multi-model ensemble mean and ERA5 remapped to 2°. Panels (b) and (f): ACC between subsampling predictions (wNAO-based for winter; sNAO+uAMV-based for summer) and ERA5 at 0.25°. Panels (c), (g), (d) and (h): same as (a), (e), (b) and (f), respectively, but computed after removal of the linear trend from both predictions and observations, isolating skill arising from internal climate variability rather than the externally forced signal. Note that panels (a), (c), (e), and (g) are evaluated on a 2° grid while panels (b), (d), (f), (h) are evaluated on a 0.25° grid, reflecting the respective native or target resolutions of the two systems; a direct gridpoint-by-gridpoint skill comparison is therefore not computed. Hatched areas indicate regions where skill scores are not statistically significant at the 95 % confidence level, assessed using a 1000-sample block bootstrap.
3.4 Sensitivity and robustness
The skill of the prediction system proposed here in Fig. 1 relies on the choice of several key parameters, including the averaging window length. A recent study shows that winter NAO boosted decadal predictions can achieve skillful forecasts starting from 4- or 5-year averages (Alkama et al., 2026). Using 5-year means instead of 8-year averages yields slightly reduced but still meaningful skill for wNAO in winter and sNAO+uAMV in summer (see Sect. S7).
Combining the uAMV index with summer SLP indices improved precipitation predictions. This aligns with recent studies reporting benefits from including SST-based indices in winter forecasts (Bonnet et al., 2025; Nicolì et al., 2025). We also evaluated combinations of wNAO and wWEPA with uAMV (see Supplement Fig. S4), as well as SST averages over the subpolar Gyre, but found no significant improvement. Multi-criteria subsampling based on wNAO and wWEPA was also conducted with no significant improvement over subsampling based on wNAO alone (see Fig. S5).
Similarly, varying the sub-ensemble size between two and eight members reveals an optimal compromise around five members for the sNAO+uAMV-based subsampling, balancing ensemble mean correlation with predictive uncertainty estimation (see Sect. S8). This optimum is specific to this multi-criteria subsampling. In this study, a fixed sub-ensemble size of five members is used across all subsampling experiments to ensure consistency and comparability.
Concerning the selection of potential SLP indices, we attempted to study both SLP and precipitation variability simultaneously using the Maximum Covariance Analysis (MCA) method. Results were similar in summer, but more ambiguous in winter, with a switch between the first two modes between the MCA and precipitation EOFs. The interpretation of the modes resulting from the MCA is, however, challenging since they maximize the covariance and are not orthogonal. This is why we preferred to use EOF approach.
Additional indices (see Sect. S5), including the classic NAO index defined as the Iceland-Azores dipole and a Europe North-South (EUNS) index related to winter precipitation PC2, were also tested but yield no improvements for precipitation, compared to the results shown here, despite the higher decadal prediction skill of the NAO.
This study demonstrates the potential for skillful decadal precipitation predictions over France both in summer and winter, through a prediction system based on decadal predictions from DCPP as well as subsampling techniques. This system leverages large-scale atmospheric and oceanic teleconnections relevant to precipitation variability over metropolitan France. Since the methodology is not specific to this region, it can in principle be applied to other regions of the globe, if appropriate large-scale predictors and suitable uninitialized ensembles are available.
More precisely, the principle is to perform a combination of EOF and wavelet analyses, to evaluate if both winter and summer precipitation (here over France) exhibit significant multi-annual to multi-decadal variability linked to dominant modes of North Atlantic variability. These analyses guide the identification of physically meaningful predictors – such as the North Atlantic Oscillation (wNAO) and West Europe Pressure Anomaly (wWEPA) for winter, and the Summer NAO (sNAO) and Mediterranean-Scandinavia (sMedScand) indices for summer – which form the foundation of our prediction system. We then use the decadal forecasts of those predictors based on the DCPP database and with a boosted skill score based on Alkama et al. (2026) methodology. Results from this approach are then combined with a subsampling method that selects members from a large uninitialized climate model ensemble consistent with the large-scale variability mode predicted by the Alkama et al. (2026) approach.
The resulting precipitation predictions over France demonstrate skill improvements relative to both the uninitialized simulations and the raw DCPP-A ensemble mean. Comparison with DCPP-A reveals large improvements in winter, where significant skill extends across the majority of metropolitan France, and more localized improvements in summer. The forecast skill of the indices themselves, as well as their representation and relationship with regional precipitation in climate models, critically influence the quality of precipitation forecasts after subsampling. For example, although WEPA-like indices are closely associated with the principal mode of precipitation variability, wNAO-based subsampling consistently produces higher skills in precipitation predictions. However, the difference between predicted NAO and WEPA remains modest, questioning whether this effect might explain all the differences found in terms of prediction of the precipitation over France. Another possible explanation for this paradox may lie in the model's representation of SLP variability modes (here IPSL-CM6A-LR model). In particular, discrepancies between the observed and simulated centers of action associated with the WEPA pattern could substantially affect its influence over France. To investigate this hypothesis, we performed an EOF analysis of SLP in both the ERA5 reanalysis and a long pre-industrial control (piControl) simulation from IPSL-CM6A-LR model, which provides a sufficiently long record to robustly isolate internally generated modes of variability.
We find substantial differences in the locations of the centers of action between observations and the IPSL-CM6A-LR model (see Sect. S10). In the model, the positive pressure center is shifted northward relative to observations, likely causing the associated wind anomalies to affect the UK and Ireland more strongly than France. This contrasts with the observed WEPA pattern, whose influence is more directly felt over France.
These results highlight the potential importance of both large-ensemble selection and model biases in the representation of the underlying circulation patterns. Developing a systematic approach to account for such structural biases when selecting large ensembles could further improve the proposed framework. However, addressing this issue would considerably broaden the scope of the present study and is therefore left for future work.
Comparing seasonal performances shows that winter forecasts clearly outperform summer forecasts, reflecting the strong low-frequency predictability of winter circulation over the North Atlantic. Summer precipitation is shaped by more localized and convective processes, which are less well captured in coarse-resolution models, while in winter, convective events are scarcer. Nevertheless, incorporating multiple predictors especially by combining sNAO and the Atlantic Multidecadal Variability (AMV) substantially enhanced summer forecast skill. An important methodological note is that our AMV (called here uAMV) retains the externally forced component rather than isolating internal variability, which is why we term it uAMV. Keeping the forced signal allows the prediction to be constrained by both internal variability and the forced trend, which means that the observed improvement in forecast skill may result from constraining either one or both. Disentangling these contributions requires further investigation left for future studies.
Previous work has demonstrated the potential of ensemble selection approaches for predicting climate variability (Befort et al., 2020; Mahmood et al., 2021, 2022, 2025). These studies focused primarily on predicting temperature variations using SST-based selection criteria. Mahmood et al. (2025) extended this approach by incorporating the NAO to select members that reproduce the observed NAO–temperature teleconnection during the 20 years prior to the prediction period. Our study applies a conceptually similar framework, but targets precipitation predictions and introduces an explicit step to identify the most skillful combination of large-scale predictors. Our results confirm and extend previous findings demonstrating that improved predictions of large-scale climate indices, such as the boosted NAO forecasts developed by Alkama et al. (2026), can be effectively leveraged to enhance regional hydroclimate predictions (Nicolì et al., 2025; Tsartsali et al., 2023). While earlier studies focused primarily on winter NAO and its influence, our work broadens this scope to include both winter and summer seasons, incorporating combined index approaches such as the sNAO, together with the uAMV index for summer precipitation forecasting. This highlights the added value of integrating multiple atmospheric and oceanic drivers to capture complex seasonal precipitation variability. Importantly, the novel workflow developed here integrates subsampling of ensemble members from the uninitialized IPSL-CM6A-LR model based on these boosted index forecasts, followed by bias correction using the CDF-t downscaling to the high-resolution (8 km) SAFRAN observational grid. Therefore, the prediction system presented here not only improves forecast skill but also provides operationally relevant, high-resolution decadal precipitation predictions over France, offering a significant advance towards actionable climate services.
While these findings offer promising advances for regional climate services and water management applications, several challenges remain. Precipitation prediction skill is primarily constrained by the limited forecasting performance of some SLP indices (see Fig. S3). In addition, the uninitialized large ensemble used for subsampling is characterized by a relatively coarse spatial resolution of approximately 250 × 150 km. Although statistical downscaling to 8 km improves spatial detail, it likely does not fully capture fine-scale temporal variability at that resolution. Despite the generally satisfactory results obtained here, employing higher-resolution climate models could further enhance the representation of small-scale spatial structures. In the present study, subsampling is performed by selecting 5 members out of 32 from a single-model ensemble (IPSL-CM6A-LR), which limits both the statistical diversity of the selected sub-ensemble and the generalizability of the results across models. Exploring larger single-model ensembles or multi-model CMIP6 ensembles in future work could help assess the robustness of the subsampling approach and potentially improve prediction skill. Moreover, an SLP index that does not yield skillful predictions with the IPSL-CM6A-LR may still serve as a valuable predictor for other models. While this evaluation covers the entire historical period, skill may vary over time. This highlights the possibility to identify potential windows of opportunity with better predictability, for instance due to large SLP indices or AMV variations (e.g., Sgubin et al., 2021). The focus on 8-year averages suits decadal-scale planning but may mask shorter-term dynamics relevant for some stakeholders. Preliminary results for 5-year averages suggest modest, yet significant skill, warranting further investigation. Future work should explore adaptive seasonal definitions, integration of additional indices, optimal weighting strategies and exploration of alternative or larger uninitialized model ensembles to further enhance predictive skill.
Operationalizing this framework poses practical challenges, including coordination across multiple modeling centers and managing ensemble sizes and parameter choices within the subsampling procedure. Although the current ensemble size of five members balances skill and uncertainty, further optimization and sensitivity analyses are desirable.
In conclusion, our study presents a coherent and robust methodology that improves decadal-scale precipitation prediction over France at high spatial resolution. By combining advanced atmospheric and oceanic index predictions with targeted subsampling and bias correction, we achieve enhanced skill and reduced uncertainty, valuable for climate adaptation strategies. The presented methodology, summarized in Fig.1, can potentially be developed for other countries or regions and may also substantially improve prediction skill there. Furthermore, extending this framework to other climate variables and precipitation indicators, such as extreme events and droughts, represents a natural next step, given their large impacts for various stakeholders. These developments will be instrumental for reliable climate services that support informed decision-making based on improved prediction of climate variability and change at the decadal time scale.
-
ACC. Pearson correlation coefficient is computed on predicted ensemble mean and observed anomalies:
where N indicates the time series length, fi and (respectively oi and ) are ensemble mean forecast anomalies (respectively observation anomalies) at time step i and average over the whole time series, respectively.
-
RCC. Correlation coefficients are computed on residuals o′ and f′ representing the variability that cannot be captured by the uninitialized simulations. Residuals are estimated as follow:
where u is the uninitialized ensemble mean, σu, σf and σo are the standard deviations of u, f and o and rou and rfu are the correlations between o and u and between f and u respectively (Smith et al., 2019).
-
CRPS. The instantaneous CRPS is computed as each time step, then averaged over the all period. It is defined as the quadratic measure of discrepancy between the forecast Cumulative Distribution Function (CDF) (F) and the empirical CDF of the observation (o):
Here, lowercase crps denotes the theoretical continuous form (Eq. B3), while uppercase CRPS denotes its discrete ensemble estimator, computed as:
With M the ensemble size, x the predicted values ensemble and o the observed value at time step t. Here we use the fair estimation, so . CRPS ranges from 0 to +∞, where values close to 0 indicate perfect forecasts.
-
CRPSS. This score compares CRPS results between the selected sub-ensemble, and the full uninitialized large ensemble from IPSL-CM6A-LR.
CRPSS ranges from −∞ to 1, with positive values indicating that the sub-ensemble outperforms the reference ensemble.
The code used to produce the results reported in this paper is available from the corresponding author upon reasonable request.
All CMIP6 (historical and DCPP simulations) data are available through the Earth System Grid Federation (ESGF; https://aims2.llnl.gov/search (last access: 1 January 2025). ERA5 reanalysis data are available from the Copernicus Climate Data Store (https://doi.org/10.24381/cds.adbb2d47, Copernicus Climate Change Service, Climate Data Store, 2023). SAFRAN dataset is available from the French public data repository data.gouv at https://www.data.gouv.fr/datasets/donnees-changement-climatique-sim-quotidienne (last access: 1 January 2025).
The supplement related to this article is available online at https://doi.org/10.5194/esd-17-1177-2026-supplement.
All authors designed the study and developed the method. RA and JC developed the source code. JC generated all figures and conducted the analysis. All the authors contributed to interpreting the results, discussing the findings. JC wrote the manuscript with contributions from all co-authors.
The contact author has declared that none of the authors has any competing interests.
Publisher's note: Copernicus Publications remains neutral with regard to jurisdictional claims made in the text, published maps, institutional affiliations, or any other geographical representation in this paper. The authors bear the ultimate responsibility for providing appropriate place names. Views expressed in the text are those of the authors and do not necessarily reflect the views of the publisher.
To process the CMIP6 data, this study benefited from the IPSL mesocenter ESPRI facility which is supported by CNRS, UPMC, Labex L-IPSL, CNES and Ecole Polytechnique. We acknowledge the use of the AI language model ChatGPT to assist with English language editing and formulation improvements. Finally, we thank all colleagues and collaborators who contributed valuable discussions and insights that improved this study.
This project was funded by the French State as part of France 2030 operated by ADEME. This study received financial support from the French government in the framework of the University of Bordeaux's IdEx “Investments for the Future” program/RRI Tackling Global Change.
This paper was edited by Gabriele Messori and reviewed by two anonymous referees.
Alkama, R., Swingedouw, D., Mignot, J., Gastineau, G., and Ogée, J.: Clearing the noise to predict the rhythm of the North Atlantic climate, Science Advances, 12, eaed8616, https://doi.org/10.1126/sciadv.aed8616, 2026.
Befort, D. J., O'Reilly, C. H., and Weisheimer, A.: Constraining Projections Using Decadal Predictions, Geophys. Res. Lett., 47, e2020GL087900, https://doi.org/10.1029/2020GL087900, 2020.
Bethke, I., Wang, Y., Counillon, F., Keenlyside, N., Kimmritz, M., Fransner, F., Samuelsen, A., Langehaug, H., Svendsen, L., Chiu, P.-G., Passos, L., Bentsen, M., Guo, C., Gupta, A., Tjiputra, J., Kirkevåg, A., Olivié, D., Seland, Ø., Solsvik Vågane, J., Fan, Y., and Eldevik, T.: NorCPM1 and its contribution to CMIP6 DCPP, Geosci. Model Dev., 14, 7073–7116, https://doi.org/10.5194/gmd-14-7073-2021, 2021.
Boer, G. J., Smith, D. M., Cassou, C., Doblas-Reyes, F., Danabasoglu, G., Kirtman, B., Kushnir, Y., Kimoto, M., Meehl, G. A., Msadek, R., Mueller, W. A., Taylor, K. E., Zwiers, F., Rixen, M., Ruprich-Robert, Y., and Eade, R.: The Decadal Climate Prediction Project (DCPP) contribution to CMIP6, Geosci. Model Dev., 9, 3751–3777, https://doi.org/10.5194/gmd-9-3751-2016, 2016.
Bonnet, R., Boucher, O., Deshayes, J., Gastineau, G., Hourdin, F., Mignot, J., Servonnat, J., and Swingedouw, D.: Presentation and Evaluation of the IPSL-CM6A-LR Ensemble of Extended Historical Simulations, J. Adv. Model. Earth Sy., 13, e2021MS002565, https://doi.org/10.1029/2021MS002565, 2021.
Bonnet, R., Boé, J., Sanchez-Gomez, E., and Cassou, C.: Reduction of uncertainty in near-term climate forecast by combining observations and decadal predictions, EGUsphere [preprint], https://doi.org/10.5194/egusphere-2025-4463, 2025.
Borchert, L. F., Menary, M. B., Swingedouw, D., Sgubin, G., Hermanson, L., and Mignot, J.: Improved Decadal Predictions of North Atlantic Subpolar Gyre SST in CMIP6, Geophys. Res. Lett., 48, e2020GL091307, https://doi.org/10.1029/2020GL091307, 2021.
Börgel, F., Meier, H. E. M., Gröger, M., Rhein, M., Dutheil, C., and Kaiser, J. M.: Atlantic multidecadal variability and the implications for North European precipitation, Environ. Res. Lett., 17, 044040, https://doi.org/10.1088/1748-9326/ac5ca1, 2022.
Casanueva, A., Rodríguez-Puebla, C., Frías, M. D., and González-Reviriego, N.: Variability of extreme precipitation over Europe and its relationships with teleconnection patterns, Hydrol. Earth Syst. Sci., 18, 709–725, https://doi.org/10.5194/hess-18-709-2014, 2014.
Castelle, B., Dodet, G., Masselink, G., and Scott, T.: A new climate index controlling winter wave activity along the Atlantic coast of Europe: The West Europe Pressure Anomaly, Geophys. Res. Lett., 44, 1384–1392, https://doi.org/10.1002/2016GL072379, 2017.
Cherchi, A., Fogli, P. G., Lovato, T., Peano, D., Iovino, D., Gualdi, S., Masina, S., Scoccimarro, E., Materia, S., Bellucci, A., and Navarra, A.: Global Mean Climate and Main Patterns of Variability in the CMCC-CM2 Coupled Model, J. Adv. Model. Earth Sy., 11, 185–209, https://doi.org/10.1029/2018MS001369, 2019.
Christiansen, B., Yang, S., and Matte, D.: The Forced Response and Decadal Predictability of the North Atlantic Oscillation: Nonstationary and Fragile Skills, J. Climate, 35, 5869–5882, https://doi.org/10.1175/JCLI-D-21-0807.1, 2022.
Copernicus Climate Change Service, Climate Data Store: ERA5 hourly data on single levels from 1940 to present, Copernicus Climate Change Service (C3S) Climate Data Store (CDS) [data set], https://doi.org/10.24381/cds.adbb2d47, 2023.
Dawson, A.: eofs: A Library for EOF Analysis of Meteorological, Oceanographic, and Climate Data, Journal of Open Research Software, https://doi.org/10.5334/jors.122, 2016.
Ding, H., Newman, M., Alexander, M. A., and Wittenberg, A. T.: Skillful Climate Forecasts of the Tropical Indo-Pacific Ocean Using Model-Analogs, J. Climate, 31, 5437–5459, https://doi.org/10.1175/JCLI-D-17-0661.1, 2018.
Dong, C., Schoups, G., and Van De Giesen, N.: Scenario development for water resource planning and management: A review, Technol. Forecast. Soc., 80, 749–761, https://doi.org/10.1016/j.techfore.2012.09.015, 2013.
Döscher, R., Acosta, M., Alessandri, A., Anthoni, P., Arsouze, T., Bergman, T., Bernardello, R., Boussetta, S., Caron, L.-P., Carver, G., Castrillo, M., Catalano, F., Cvijanovic, I., Davini, P., Dekker, E., Doblas-Reyes, F. J., Docquier, D., Echevarria, P., Fladrich, U., Fuentes-Franco, R., Gröger, M., v. Hardenberg, J., Hieronymus, J., Karami, M. P., Keskinen, J.-P., Koenigk, T., Makkonen, R., Massonnet, F., Ménégoz, M., Miller, P. A., Moreno-Chamarro, E., Nieradzik, L., van Noije, T., Nolan, P., O'Donnell, D., Ollinaho, P., van den Oord, G., Ortega, P., Prims, O. T., Ramos, A., Reerink, T., Rousset, C., Ruprich-Robert, Y., Le Sager, P., Schmith, T., Schrödner, R., Serva, F., Sicardi, V., Sloth Madsen, M., Smith, B., Tian, T., Tourigny, E., Uotila, P., Vancoppenolle, M., Wang, S., Wårlind, D., Willén, U., Wyser, K., Yang, S., Yepes-Arbós, X., and Zhang, Q.: The EC-Earth3 Earth system model for the Coupled Model Intercomparison Project 6, Geosci. Model Dev., 15, 2973–3020, https://doi.org/10.5194/gmd-15-2973-2022, 2022.
Dunstone, N., Lockwood, J., Solaraju-Murali, B., Reinhardt, K., Tsartsali, E. E., Athanasiadis, P. J., Bellucci, A., Brookshaw, A., Caron, L.-P., Doblas-Reyes, F. J., Früh, B., González-Reviriego, N., Gualdi, S., Hermanson, L., Materia, S., Nicodemou, A., Nicolì, D., Pankatz, K., Paxian, A., Scaife, A., Smith, D., and Thornton, H. E.: Towards Useful Decadal Climate Services, B. Am. Meteorol. Soc., https://doi.org/10.1175/BAMS-D-21-0190.1, 2022.
Dunstone, N., Smith, D. M., Hardiman, S. C., Hermanson, L., Ineson, S., Kay, G., Li, C., Lockwood, J. F., Scaife, A. A., Thornton, H., Ting, M., and Wang, L.: Skilful predictions of the Summer North Atlantic Oscillation, Commun. Earth Environ., 4, 1–11, https://doi.org/10.1038/s43247-023-01063-2, 2023.
Durand, Y., Brun, E., Merindol, L., Guyomarc'h, G., Lesaffre, B., and Martin, E.: A meteorological estimation of relevant parameters for snow models, Ann. Glaciol., 18, 65–71, https://doi.org/10.3189/S0260305500011277, 1993.
Ferro, C. a. T.: Fair scores for ensemble forecasts, Q. J. Roy. Meteor. Soc., 140, 1917–1923, https://doi.org/10.1002/qj.2270, 2014.
Folland, C. K., Knight, J., Linderholm, H. W., Fereday, D., Ineson, S., and Hurrell, J. W.: The Summer North Atlantic Oscillation: Past, Present, and Future, J. Climate, 22, 1082–1103, https://doi.org/10.1175/2008JCLI2459.1, 2009.
Friter, N., Massei, N., Laignel, B., Durand, A., Dieppois, B., and Deloffre, J.: Links between NAO fluctuations and inter-annual variability of winter-months precipitation in the Seine River watershed (north-western France), CR Géosci., 344, 396–405, https://doi.org/10.1016/j.crte.2012.07.004, 2012.
Gneiting, T. and Raftery, A. E.: Strictly Proper Scoring Rules, Prediction, and Estimation, J. Am. Stat. Assoc., 102, 359–378, https://doi.org/10.1198/016214506000001437, 2007.
Goddard, L., Kumar, A., Solomon, A., Smith, D., Boer, G., Gonzalez, P., Kharin, V., Merryfield, W., Deser, C., Mason, S. J., Kirtman, B. P., Msadek, R., Sutton, R., Hawkins, E., Fricker, T., Hegerl, G., Ferro, C. A. T., Stephenson, D. B., Meehl, G. A., Stockdale, T., Burgman, R., Greene, A. M., Kushnir, Y., Newman, M., Carton, J., Fukumori, I., and Delworth, T.: A verification framework for interannual-to-decadal predictions experiments, Clim. Dynam., 40, 245–272, https://doi.org/10.1007/s00382-012-1481-2, 2013.
Gogien, F., Dechesne, M., Martinerie, R., and Lipeme Kouyi, G.: Assessing the impact of climate change on Combined Sewer Overflows based on small time step future rainfall timeseries and long-term continuous sewer network modelling, Water Res., 230, 119504, https://doi.org/10.1016/j.watres.2022.119504, 2023.
Hawkins, E. and Sutton, R.: The potential to narrow uncertainty in projections of regional precipitation change, Clim. Dynam., 37, 407–418, https://doi.org/10.1007/s00382-010-0810-6, 2011.
He, B., Yu, Y.-Q., Bao, Q., Lin, P., Liu, H., Li, J., Lei, W., Liu, Y., Wu, G., Chen, K., Guo, Y., Zhao, S., Zhang, X., Song, M., and Xie, J.: CAS FGOALS-f3-L model dataset descriptions for CMIP6 DECK experiments, Atmospheric and Oceanic Science Letters, 13, 1–7, https://doi.org/10.1080/16742834.2020.1778419, 2020.
Hermanson, L., Smith, D., Seabrook, M., Bilbao, R., Doblas-Reyes, F., Tourigny, E., Lapin, V., Kharin, V. V., Merryfield, W. J., Sospedra-Alfonso, R., Athanasiadis, P., Nicoli, D., Gualdi, S., Dunstone, N., Eade, R., Scaife, A., Collier, M., O'Kane, T., Kitsios, V., Sandery, P., Pankatz, K., Früh, B., Pohlmann, H., Müller, W., Kataoka, T., Tatebe, H., Ishii, M., Imada, Y., Kruschke, T., Koenigk, T., Karami, M. P., Yang, S., Tian, T., Zhang, L., Delworth, T., Yang, X., Zeng, F., Wang, Y., Counillon, F., Keenlyside, N., Bethke, I., Lean, J., Luterbacher, J., Kolli, R. K., and Kumar, A.: WMO Global Annual to Decadal Climate Update: A Prediction for 2021–25, B. Am. Meteorol. Soc., 103, E1117–E1129, https://doi.org/10.1175/BAMS-D-20-0311.1, 2022.
Hersbach, H.: Decomposition of the Continuous Ranked Probability Score for Ensemble Prediction Systems, Weather Forecast., https://doi.org/10.1175/1520-0434(2000)015<0559:DOTCRP>2.0.CO;2, 2000.
Hersbach, H., Bell, B., Berrisford, P., Hirahara, S., Horányi, A., Muñoz-Sabater, J., Nicolas, J., Peubey, C., Radu, R., Schepers, D., Simmons, A., Soci, C., Abdalla, S., Abellan, X., Balsamo, G., Bechtold, P., Biavati, G., Bidlot, J., Bonavita, M., De Chiara, G., Dahlgren, P., Dee, D., Diamantakis, M., Dragani, R., Flemming, J., Forbes, R., Fuentes, M., Geer, A., Haimberger, L., Healy, S., Hogan, R. J., Hólm, E., Janisková, M., Keeley, S., Laloyaux, P., Lopez, P., Lupu, C., Radnoti, G., de Rosnay, P., Rozum, I., Vamborg, F., Villaume, S., and Thépaut, J.-N.: The ERA5 global reanalysis, Q. J. Roy. Meteor. Soc., 146, 1999–2049, https://doi.org/10.1002/qj.3803, 2020.
Hurrell, J. W. and Deser, C.: North Atlantic climate variability: The role of the North Atlantic Oscillation, J. Marine Syst., 79, 231–244, https://doi.org/10.1016/j.jmarsys.2009.11.002, 2010.
Hutchins, B. W., Brayshaw, D. J., Shaffrey, L. C., Thornton, H. E., and Smith, D. M.: Decadal Prediction for the European Energy Sector, Meteorol. Appl., 32, e70054, https://doi.org/10.1002/met.70054, 2025.
Intergovernmental Panel on Climate Change (IPCC): Climate Change 2021 – The Physical Science Basis: Working Group I Contribution to the Sixth Assessment Report of the Intergovernmental Panel on Climate Change, Cambridge University Press, Cambridge, https://doi.org/10.1017/9781009157896, 2023a.
Intergovernmental Panel on Climate Change (IPCC): Climate Change 2022 – Impacts, Adaptation and Vulnerability: Working Group II Contribution to the Sixth Assessment Report of the Intergovernmental Panel on Climate Change, Cambridge University Press, Cambridge, https://doi.org/10.1017/9781009325844, 2023b.
Jalón-Rojas, I. and Castelle, B.: Climate Control of Multidecadal Variability in River Discharge and Precipitation in Western Europe, Water, 13, 257, https://doi.org/10.3390/w13030257, 2021.
Jianping, L. and Wang, J. X. L.: A new North Atlantic Oscillation index and its variability, Adv. Atmos. Sci., 20, 661–676, https://doi.org/10.1007/BF02915394, 2003.
Kharin, V. V., Boer, G. J., Merryfield, W. J., Scinocca, J. F., and Lee, W.-S.: Statistical adjustment of decadal predictions in a changing climate, Geophys. Res. Lett., 39, https://doi.org/10.1029/2012GL052647, 2012.
Klavans, J. M., Cane, M. A., Clement, A. C., and Murphy, L. N.: NAO predictability from external forcing in the late 20th century, npj Clim. Atmos. Sci., 4, 1–8, https://doi.org/10.1038/s41612-021-00177-8, 2021.
Knight, J. R., Folland, C. K., and Scaife, A. A.: Climate impacts of the Atlantic Multidecadal Oscillation, Geophys. Res. Lett., 33, https://doi.org/10.1029/2006GL026242, 2006.
Krieger, S. and Freij, N.: PyCWT: spectral analysis using wavelets in Python, GitHub, https://github.com/regeirk/pycwt (last access: 1 January 2025), 2023.
Labrousse, C., Ludwig, W., Pinel, S., Sadaoui, M., and Lacquement, G.: Unravelling Climate and Anthropogenic Forcings on the Evolution of Surface Water Resources in Southern France, Water, 12, 3581, https://doi.org/10.3390/w12123581, 2020.
Leeuwenburg, T., Loveday, N., Ebert, E. E., Cook, H., Khanarmuei, M., Taggart, R. J., Ramanathan, N., Carroll, M., Chong, S., Griffiths, A., and Sharples, J.: scores: A Python package for verifying and evaluating models and predictions with xarray, Journal of Open Source Software, 9, 6889, https://doi.org/10.21105/joss.06889, 2024.
Le Moigne, P., Besson, F., Martin, E., Boé, J., Boone, A., Decharme, B., Etchevers, P., Faroux, S., Habets, F., Lafaysse, M., Leroux, D., and Rousset-Regimbeau, F.: The latest improvements with SURFEX v8.0 of the Safran–Isba–Modcou hydrometeorological model for France, Geosci. Model Dev., 13, 3925–3946, https://doi.org/10.5194/gmd-13-3925-2020, 2020.
Lockwood, J. F., Dunstone, N., Hermanson, L., Saville, G. R., Scaife, A. A., Smith, D., and Thornton, H. E.: A Decadal Climate Service for Insurance: Skillful Multiyear Predictions of North Atlantic Hurricane Activity and U.S. Hurricane Damage, J. Appl. Meteorol. Clim., https://doi.org/10.1175/JAMC-D-22-0147.1, 2023.
Mahmood, R., Donat, M. G., Ortega, P., Doblas-Reyes, F. J., and Ruprich-Robert, Y.: Constraining Decadal Variability Yields Skillful Projections of Near-Term Climate Change, Geophys. Res. Lett., 48, e2021GL094915, https://doi.org/10.1029/2021GL094915, 2021.
Mahmood, R., Donat, M. G., Ortega, P., Doblas-Reyes, F. J., Delgado-Torres, C., Samsó, M., and Bretonnière, P.-A.: Constraining low-frequency variability in climate projections to predict climate on decadal to multi-decadal timescales – a poor man's initialized prediction system, Earth Syst. Dynam., 13, 1437–1450, https://doi.org/10.5194/esd-13-1437-2022, 2022.
Mahmood, R., Yang, S., and Donat, M. G.: Constraining the NAO-temperature teleconnection in CMIP6 simulations enables skillful multi-annual predictions of Eurasian winter climate, Environ. Res. Lett., 20, 074016, https://doi.org/10.1088/1748-9326/adde75, 2025.
Marcheggiani, A., Robson, J., Monerie, P.-A., Bracegirdle, T. J., and Smith, D.: Decadal Predictability of the North Atlantic Eddy-Driven Jet in Winter, Geophys. Res. Lett., 50, e2022GL102071, https://doi.org/10.1029/2022GL102071, 2023.
Mauritsen, T., Bader, J., Becker, T., Behrens, J., Bittner, M., Brokopf, R., Brovkin, V., Claussen, M., Crueger, T., Esch, M., Fast, I., Fiedler, S., Fläschner, D., Gayler, V., Giorgetta, M., Goll, D. S., Haak, H., Hagemann, S., Hedemann, C., Hohenegger, C., Ilyina, T., Jahns, T., Jimenéz-de-la-Cuesta, D., Jungclaus, J., Kleinen, T., Kloster, S., Kracher, D., Kinne, S., Kleberg, D., Lasslop, G., Kornblueh, L., Marotzke, J., Matei, D., Meraner, K., Mikolajewicz, U., Modali, K., Möbis, B., Müller, W. A., Nabel, J. E. M. S., Nam, C. C. W., Notz, D., Nyawira, S.-S., Paulsen, H., Peters, K., Pincus, R., Pohlmann, H., Pongratz, J., Popp, M., Raddatz, T. J., Rast, S., Redler, R., Reick, C. H., Rohrschneider, T., Schemann, V., Schmidt, H., Schnur, R., Schulzweida, U., Six, K. D., Stein, L., Stemmler, I., Stevens, B., von Storch, J.-S., Tian, F., Voigt, A., Vrese, P., Wieners, K.-H., Wilkenskjeld, S., Winkler, A., and Roeckner, E.: Developments in the MPI-M Earth System Model version 1.2 (MPI-ESM1.2) and Its Response to Increasing CO2, J. Adv. Model. Earth Sy., 11, 998–1038, https://doi.org/10.1029/2018MS001400, 2019.
Meehl, G. A., Goddard, L., Murphy, J., Stouffer, R. J., Boer, G., Danabasoglu, G., Dixon, K., Giorgetta, M. A., Greene, A. M., Hawkins, E., Hegerl, G., Karoly, D., Keenlyside, N., Kimoto, M., Kirtman, B., Navarra, A., Pulwarty, R., Smith, D., Stammer, D., and Stockdale, T.: Decadal Prediction: Can It Be Skillful?, B. Am. Meteorol. Soc., 90, 1467–1486, https://doi.org/10.1175/2009BAMS2778.1, 2009.
Michel, S. L. L., Swingedouw, D., Ortega, P., Gastineau, G., Mignot, J., McCarthy, G., and Khodri, M.: Early warning signal for a tipping point suggested by a millennial Atlantic Multidecadal Variability reconstruction, Nat. Commun., 13, 5176, https://doi.org/10.1038/s41467-022-32704-3, 2022.
Michelangeli, P.-A., Vrac, M., and Loukos, H.: Probabilistic downscaling approaches: Application to wind cumulative distribution functions, Geophys. Res. Lett., 36, https://doi.org/10.1029/2009GL038401, 2009.
Moulds, S., Slater, L. J., Dunstone, N. J., and Smith, D. M.: Skillful Decadal Flood Prediction, Geophys. Res. Lett., 50, e2022GL100650, https://doi.org/10.1029/2022GL100650, 2023.
Msadek, R., Dixon, K. W., Delworth, T. L., and Hurlin, W.: Assessing the predictability of the Atlantic meridional overturning circulation and associated fingerprints, Geophys. Res. Lett., 37, https://doi.org/10.1029/2010GL044517, 2010.
Müller, W. A., Jungclaus, J. H., Mauritsen, T., Baehr, J., Bittner, M., Budich, R., Bunzel, F., Esch, M., Ghosh, R., Haak, H., Ilyina, T., Kleine, T., Kornblueh, L., Li, H., Modali, K., Notz, D., Pohlmann, H., Roeckner, E., Stemmler, I., Tian, F., and Marotzke, J.: A Higher-resolution Version of the Max Planck Institute Earth System Model (MPI-ESM1.2-HR), J. Adv. Model. Earth Sy., 10, 1383–1413, https://doi.org/10.1029/2017MS001217, 2018.
Nicolì, D., Gualdi, S., and Athanasiadis, P. J.: Decadal predictions outperform climate projections in forecasting Mediterranean wintertime precipitation, Environ. Res. Lett., 20, 034034, https://doi.org/10.1088/1748-9326/adb59e, 2025.
Paxian, A., Reinhardt, K., Pankatz, K., Pasternack, A., Lorza-Villegas, M. P., Scheibel, M., Hoff, A., Mannig, B., Lorenz, P., and Früh, B.: High-Resolution Decadal Drought Predictions for German Water Boards: A Case Study for the Wupper Catchment, Front. Clim., 4, https://doi.org/10.3389/fclim.2022.867814, 2022.
Persechino, A., Mignot, J., Swingedouw, D., Labetoulle, S., and Guilyardi, E.: Decadal predictability of the Atlantic meridional overturning circulation and climate in the IPSL-CM5A-LR model, Clim. Dynam., 40, 2359–2380, https://doi.org/10.1007/s00382-012-1466-1, 2013.
Polkova, I., Swingedouw, D., Hermanson, L., Köhl, A., Stammer, D., Smith, D., Kröger, J., Bethke, I., Yang, X., Zhang, L., Nicolì, D., Athanasiadis, P. J., Karami, M. P., Pankatz, K., Pohlmann, H., Wu, B., Bilbao, R., Ortega, P., Yang, S., Sospedra-Alfonso, R., Merryfield, W., Kataoka, T., Tatebe, H., Imada, Y., Ishii, M., and Matear, R. J.: Initialization shock in the ocean circulation reduces skill in decadal predictions of the North Atlantic subpolar gyre, Front. Clim., 5, https://doi.org/10.3389/fclim.2023.1273770, 2023.
Rousselet, G. A., Pernet, C. R., and Wilcox, R. R.: The Percentile Bootstrap: A Primer With Step-by-Step Instructions in R, Advances in Methods and Practices in Psychological Science, 4, 1–10, https://doi.org/10.1177/2515245920911881, 2021.
Sauquet, E., Evin, G., Siauve, S., Aissat, R., Arnaud, P., Bérel, M., Bonneau, J., Branger, F., Caballero, Y., Colléoni, F., Ducharne, A., Gailhard, J., Habets, F., Hendrickx, F., Héraut, L., Hingray, B., Huang, P., Jaouen, T., Jeantet, A., Lanini, S., Le Lay, M., Magand, C., Mimeau, L., Monteil, C., Munier, S., Perrin, C., Robelin, O., Rousset, F., Soubeyroux, J.-M., Strohmenger, L., Thirel, G., Tocquer, F., Tramblay, Y., Vergnes, J.-P., and Vidal, J.-P.: A large transient multi-scenario multi-model ensemble of future streamflow and groundwater projections in France, Hydrol. Earth Syst. Sci., 30, 2277–2300, https://doi.org/10.5194/hess-30-2277-2026, 2026.
Scaife, A. A. and Smith, D.: A signal-to-noise paradox in climate science, npj Clim. Atmos. Sci., 1, 1–8, https://doi.org/10.1038/s41612-018-0038-4, 2018.
Schlesinger, M. E. and Ramankutty, N.: An oscillation in the global climate system of period 65–70 years, Nature, 367, 723–726, https://doi.org/10.1038/367723a0, 1994.
Sellar, A. A., Walton, J., Jones, C. G., Wood, R., Abraham, N. L., Andrejczuk, M., Andrews, M. B., Andrews, T., Archibald, A. T., de Mora, L., Dyson, H., Elkington, M., Ellis, R., Florek, P., Good, P., Gohar, L., Haddad, S., Hardiman, S. C., Hogan, E., Iwi, A., Jones, C. D., Johnson, B., Kelley, D. I., Kettleborough, J., Knight, J. R., Köhler, M. O., Kuhlbrodt, T., Liddicoat, S., Linova-Pavlova, I., Mizielinski, M. S., Morgenstern, O., Mulcahy, J., Neininger, E., O'Connor, F. M., Petrie, R., Ridley, J., Rioual, J.-C., Roberts, M., Robertson, E., Rumbold, S., Seddon, J., Shepherd, H., Shim, S., Stephens, A., Teixiera, J. C., Tang, Y., Williams, J., Wiltshire, A., and Griffiths, P. T.: Implementation of U.K. Earth System Models for CMIP6, J. Adv. Model. Earth Sy., 12, e2019MS001946, https://doi.org/10.1029/2019MS001946, 2020.
Seyedhashemi, H., Moatar, F., Vidal, J.-P., and Thiéry, D.: Past and future discharge and stream temperature at high spatial resolution in a large European basin (Loire basin, France), Earth Syst. Sci. Data, 15, 2827–2839, https://doi.org/10.5194/essd-15-2827-2023, 2023.
Sgubin, G., Swingedouw, D., Borchert, L. F., Menary, M. B., Noël, T., Loukos, H., and Mignot, J.: Systematic investigation of skill opportunities in decadal prediction of air temperature over Europe, Clim. Dynam., 57, 3245–3263, https://doi.org/10.1007/s00382-021-05863-0, 2021.
Simpson, I. R., Yeager, S. G., McKinnon, K. A., and Deser, C.: Decadal predictability of late winter precipitation in western Europe through an ocean–jet stream connection, Nat. Geosci., 12, 613–619, https://doi.org/10.1038/s41561-019-0391-x, 2019.
Smith, D. M., Eade, R., Scaife, A. A., Caron, L.-P., Danabasoglu, G., DelSole, T. M., Delworth, T., Doblas-Reyes, F. J., Dunstone, N. J., Hermanson, L., Kharin, V., Kimoto, M., Merryfield, W. J., Mochizuki, T., Müller, W. A., Pohlmann, H., Yeager, S., and Yang, X.: Robust skill of decadal climate predictions, npj Clim. Atmos. Sci., 2, 1–10, https://doi.org/10.1038/s41612-019-0071-y, 2019.
Smith, D. M., Scaife, A. A., Eade, R., Athanasiadis, P., Bellucci, A., Bethke, I., Bilbao, R., Borchert, L. F., Caron, L.-P., Counillon, F., Danabasoglu, G., Delworth, T., Doblas-Reyes, F. J., Dunstone, N. J., Estella-Perez, V., Flavoni, S., Hermanson, L., Keenlyside, N., Kharin, V., Kimoto, M., Merryfield, W. J., Mignot, J., Mochizuki, T., Modali, K., Monerie, P.-A., Müller, W. A., Nicolí, D., Ortega, P., Pankatz, K., Pohlmann, H., Robson, J., Ruggieri, P., Sospedra-Alfonso, R., Swingedouw, D., Wang, Y., Wild, S., Yeager, S., Yang, X., and Zhang, L.: North Atlantic climate far more predictable than models imply, Nature, 583, 796–800, https://doi.org/10.1038/s41586-020-2525-0, 2020.
Solaraju-Murali, B., Gonzalez-Reviriego, N., Caron, L.-P., Ceglar, A., Toreti, A., Zampieri, M., Bretonnière, P.-A., Samsó Cabré, M., and Doblas-Reyes, F. J.: Multi-annual prediction of drought and heat stress to support decision making in the wheat sector, npj Clim. Atmos. Sci., 4, 1–9, https://doi.org/10.1038/s41612-021-00189-4, 2021.
Solaraju-Murali, B., Bojovic, D., Gonzalez-Reviriego, N., Nicodemou, A., Terrado, M., Caron, L.-P., and Doblas-Reyes, F. J.: How decadal predictions entered the climate services arena: an example from the agriculture sector, Climate Services, 27, 100303, https://doi.org/10.1016/j.cliser.2022.100303, 2022.
Sutton, R. T. and Hodson, D. L. R.: Atlantic Ocean Forcing of North American and European Summer Climate, Science, 309, 115–118, https://doi.org/10.1126/science.1109496, 2005.
Swart, N. C., Cole, J. N. S., Kharin, V. V., Lazare, M., Scinocca, J. F., Gillett, N. P., Anstey, J., Arora, V., Christian, J. R., Hanna, S., Jiao, Y., Lee, W. G., Majaess, F., Saenko, O. A., Seiler, C., Seinen, C., Shao, A., Sigmond, M., Solheim, L., von Salzen, K., Yang, D., and Winter, B.: The Canadian Earth System Model version 5 (CanESM5.0.3), Geosci. Model Dev., 12, 4823–4873, https://doi.org/10.5194/gmd-12-4823-2019, 2019.
Swingedouw, D., Mignot, J., Labetoulle, S., Guilyardi, E., and Madec, G.: Initialisation and predictability of the AMOC over the last 50 years in a climate model, Clim. Dynam., 40, 2381–2399, https://doi.org/10.1007/s00382-012-1516-8, 2013a.
Swingedouw, D., Rodehacke, C. B., Behrens, E., Menary, M., Olsen, S. M., Gao, Y., Mikolajewicz, U., Mignot, J., and Biastoch, A.: Decadal fingerprints of freshwater discharge around Greenland in a multi-model ensemble, Clim. Dynam., 41, 695–720, https://doi.org/10.1007/s00382-012-1479-9, 2013b.
Swingedouw, D., Ortega, P., Mignot, J., Guilyardi, E., Masson-Delmotte, V., Butler, P. G., Khodri, M., and Séférian, R.: Bidecadal North Atlantic ocean circulation variability controlled by timing of volcanic eruptions, Nat. Commun., 6, 6545, https://doi.org/10.1038/ncomms7545, 2015.
Swingedouw, D., Reiter, R., Mignot, J., Gastineau, G., Torres, O., and Alkama, R.: Evaluation of two versions of the IPSL-EPOC decadal prediction systems, Front. Clim., 8, https://doi.org/10.3389/fclim.2026.1803256, 2026.
Tatebe, H., Ogura, T., Nitta, T., Komuro, Y., Ogochi, K., Takemura, T., Sudo, K., Sekiguchi, M., Abe, M., Saito, F., Chikira, M., Watanabe, S., Mori, M., Hirota, N., Kawatani, Y., Mochizuki, T., Yoshimura, K., Takata, K., O'ishi, R., Yamazaki, D., Suzuki, T., Kurogi, M., Kataoka, T., Watanabe, M., and Kimoto, M.: Description and basic evaluation of simulated mean state, internal variability, and climate sensitivity in MIROC6, Geosci. Model Dev., 12, 2727–2765, https://doi.org/10.5194/gmd-12-2727-2019, 2019.
Terray, L.: Evidence for multiple drivers of North Atlantic multi-decadal climate variability, Geophys. Res. Lett., 39, https://doi.org/10.1029/2012GL053046, 2012.
Ting, M., Kushnir, Y., Seager, R., and Li, C.: Forced and Internal Twentieth-Century SST Trends in the North Atlantic, J. Climate, 22, 1469–1481, https://doi.org/10.1175/2008JCLI2561.1, 2009.
Torrence, C. and Compo, G. P.: A Practical Guide to Wavelet Analysis, B. Am. Meteorol. Soc., 79, 61–78, https://doi.org/10.1175/1520-0477(1998)079<0061:APGTWA>2.0.CO;2, 1998.
Trenberth, K. E. and Shea, D. J.: Atlantic hurricanes and natural variability in 2005, Geophys. Res. Lett., 33, https://doi.org/10.1029/2006GL026894, 2006.
Tsartsali, E. E., Athanasiadis, P. J., Materia, S., Bellucci, A., Nicolì, D., and Gualdi, S.: Predicting precipitation on the decadal timescale: A prototype climate service for the hydropower sector, Climate Services, 32, 100422, https://doi.org/10.1016/j.cliser.2023.100422, 2023.
Vidal, J.-P., Martin, E., Franchistéguy, L., Habets, F., Soubeyroux, J.-M., Blanchard, M., and Baillon, M.: Multilevel and multiscale drought reanalysis over France with the Safran-Isba-Modcou hydrometeorological suite, Hydrol. Earth Syst. Sci., 14, 459–478, https://doi.org/10.5194/hess-14-459-2010, 2010.
Vrac, M., Drobinski, P., Merlo, A., Herrmann, M., Lavaysse, C., Li, L., and Somot, S.: Dynamical and statistical downscaling of the French Mediterranean climate: uncertainty assessment, Nat. Hazards Earth Syst. Sci., 12, 2769–2784, https://doi.org/10.5194/nhess-12-2769-2012, 2012.
Wang, L. and Ting, M.: Stratosphere-Troposphere Coupling Leading to Extended Seasonal Predictability of Summer North Atlantic Oscillation and Boreal Climate, Geophys. Res. Lett., 49, e2021GL096362, https://doi.org/10.1029/2021GL096362, 2022.
Wilks, D. S.: “The Stippling Shows Statistically Significant Grid Points”: How Research Results are Routinely Overstated and Overinterpreted, and What to Do about It, B. Am. Meteor. Soc., 97, 2263–2273, https://doi.org/10.1175/BAMS-D-15-00267.1, 2016.
Wilks, D. S.: Statistical methods in the atmospheric sciences, 4th edn., Elsevier, ISBN 978-0-12-815823-4, 2020.
World Meteorological Organization: WMO Global Annual to Decadal Climate Update 2025–2029, WMO, https://wmo.int/resources/publication-series/wmo-global-annual-decadal-climate-update/wmo-global-annual-decadal-climate-update-2025-2029 (last access: 31 July 2026), 2025.
Wu, T., Lu, Y., Fang, Y., Xin, X., Li, L., Li, W., Jie, W., Zhang, J., Liu, Y., Zhang, L., Zhang, F., Zhang, Y., Wu, F., Li, J., Chu, M., Wang, Z., Shi, X., Liu, X., Wei, M., Huang, A., Zhang, Y., and Liu, X.: The Beijing Climate Center Climate System Model (BCC-CSM): the main progress from CMIP5 to CMIP6, Geosci. Model Dev., 12, 1573–1600, https://doi.org/10.5194/gmd-12-1573-2019, 2019.
Yeager, S. G., Danabasoglu, G., Rosenbloom, N. A., Strand, W., Bates, S. C., Meehl, G. A., Karspeck, A. R., Lindsay, K., Long, M. C., Teng, H., and Lovenduski, N. S.: Predicting Near-Term Changes in the Earth System: A Large Ensemble of Initialized Decadal Prediction Simulations Using the Community Earth System Model, B. Am. Meteorol. Soc., https://doi.org/10.1175/BAMS-D-17-0098.1, 2018.