the Creative Commons Attribution 4.0 License.
the Creative Commons Attribution 4.0 License.
 | 11 Jun 2025
Estimating lateral nitrogen transfers over the last century through the global river network using a land surface model
Haicheng Zhang
Ronny Lauerwald
Philippe Ciais
Pierre Regnier
Lateral nitrogen (N) transport from land to oceans through rivers is an important component of the global N cycle. We developed a new model of this aquatic system, called LSM_Nlateral_Off (Land Surface Model Nitrogen lateral Offline), which simulates the routing of water in rivers, and the pertaining transport of dissolved inorganic N (DIN), dissolved organic N (DON), and particulate organic N (PON) as well as the accompanying biogeochemical processes of DON and PON decomposition and denitrification during transit from land to oceans through the global river network. Evaluation against global observation-based datasets shows that the model effectively captures both the magnitude and seasonal variations in riverine water discharges and total nitrogen (TN) flows. Our model was then applied to reconstruct the historical evolution of global N flows and transformations from land to rivers and, ultimately, the oceans. Model simulation results indicate that, driven by anthropogenic activities (e.g. application of mineral fertilisers and manure, sewage water injection in rivers, and land use change) and indirect effects of climate change and rising atmosphere CO2, TN exports increased from 27.5 Tg N yr−1 during the 1901–1920 period to 40.0 Tg N yr−1 during the 1995–2014 period, with DIN contributing most (80 %) of this increase. Simulation results reveal substantial spatial heterogeneities in annual mean TN flows and denitrification rates, while their seasonal amplitude is of similar magnitude to the large-scale spatial variability. Compared to previously published regional or global aquatic N transfer models (IMAGE-GNM, FrAMES-N, MBM, DLEM, and GlobalNEWS2), our model produces similar global- and continental-scale TN exports to the ocean but shows distinct patterns at the finer scale of river basins. LSM_Nlateral_Off is here coupled to the land surface model (LSM) ORCHIDEE, but the offline approach implemented in this work facilitates its coupling with other land surface models in the future such as those synthesised by the Global N2O Model Intercomparison Project (NMIP). Our modelling approach provides a comprehensive simulation of N transport and transformations from terrestrial ecosystems to oceans at 0.5° spatial resolution and daily temporal resolution, globally.
- Article
(8636 KB) - Full-text XML
-
Supplement
(2184 KB) - BibTeX
- EndNote


Reactive nitrogen (N) is a vital element for all life on Earth, playing a fundamental role in biological processes. The nitrogen cycle interacts with the Earth's climate system and environment in multiple ways. One notable interaction is through nitrous oxide (N2O), a potent greenhouse gas that influences the Earth's energy balance in a similar way to carbon dioxide (CO2) but with a global warming potential nearly 300 times greater on a per-molecule basis (Sainju et al., 2014). N also plays a critical role in the carbon (C) cycle, influencing CO2 and CH4 fluxes by limiting primary production rates in many terrestrial, freshwater, and marine ecosystems (Thornton et al., 2007; Morée et al., 2013; Zaehle et al., 2014; Seiler et al., 2024). As a result, the N cycle is a key regulator of the C cycle and climate change. This role underscores the need for a comprehensive analysis of N dynamics in the context of a changing C cycle, shifting climate conditions, and intensifying anthropogenic activities.
From an Earth system perspective, the critical connection between terrestrial and marine nitrogen (N) cycles via the Land-to-Ocean Aquatic Continuum (LOAC) has been insufficiently addressed (Galloway, 2003; Billen et al., 2013; Maranger et al., 2018; Battin et al., 2023). Existing studies have largely treated the land and open ocean cycles separately, ignoring the N processes occurring along the LOAC (Fowler et al., 2013; Zhang et al., 2021). The representation of N processes within the LOAC is however required to achieve a dynamic coupling between land surface and ocean biogeochemical models, as this route plays a pivotal role in controlling the coupled terrestrial C–N cycles and their perturbations from anthropogenic activities (Gruber and Galloway, 2008; Regnier et al., 2013, 2022). Over the past several decades, the cumulative effects of climate change, population growth, industrialisation, and increased use of agricultural fertilisers have accelerated the global N cycle and hence increased N leaching into the aquatic environment (Bouwman et al., 2005; Gruber and Galloway, 2008; Kim et al., 2011; Swaney et al., 2012; Beusen et al., 2016a). This has resulted in negative human health and environmental impacts, such as the degradation of drinking water quality and an increase in the frequency and severity of eutrophication events (Dodds and Smith, 2016; Huang et al., 2017; Costa et al., 2018; Lee et al., 2019; Dai et al., 2023). Most land surface models (LSMs) include N leaching into aquatic systems; however, this process is rarely evaluated in quantitative terms using observations collected within the fluvial network. It has been shown that N leaching is inaccurate in most LSMs (Feng et al., 2023), which in turn affects the simulation of the response of terrestrial C and N cycles to anthropogenic activities and climate change (Thomas et al., 2013). Furthermore, an explicit representation of the fate of the land-derived N inputs into the LOAC is required to better constrain the response of the ocean C cycle to increased nutrient inputs (Lacroix et al., 2021; Resplandy et al., 2024) as well as to assess the extent to which N pollution reduction scenarios can mitigate (Satter et al., 2014) eutrophication in riverine and coastal aquatic ecosystems (Hashemi et al., 2016; Desmit et al., 2018; Battin et al., 2023).
The representation of N lateral transfers through aquatic systems is challenging as it requires multiple N sources, transformation, transport, and retention processes to be represented along the global fluvial network. A variety of models with different structures and representations of the water and N cycles have been developed to address this complexity (Luscz et al., 2015, 2017). Models such as the Soil and Water Assessment Tool (SWAT) (Arnold et al., 1998; Liu et al., 2017), the Hydrologic Simulation Program – FORTRAN (HSPF) (Bicknell et al., 2005; Wang and Zhang, 2015), and the HYdrological Predictions for the Environment (HYPE) (Lindström et al., 2010; Donnelly et al., 2014) were designed to represent hydrological processes as well as N transport and transformation in rivers but mainly for catchment-scale applications. Therefore, their complexity and high requirements for hard-to-get forcing datasets constrain their applicability, in particular for the long-term evolution of global N fluxes and transformation processes. Simplified empirical approaches provide an alternative for large-scale simulations. For instance, the Global Nutrient Export from Watersheds 2 (GlobalNEWS2) model allows us to estimate riverine N exports to the ocean as a function of N deliveries from the surrounding catchment with a highly simplified representation of N transport and in-stream N processes (Seitzinger et al., 2005; Mayorga et al., 2010; Lee et al., 2016a). The Integrated Model to Assess the Global Environment – Global Nutrient Model (IMAGE-GNM) provides a more process-based representation of the river networks as it relies on a globally distributed, spatially explicit hydrological model, PCR-GLOBWB (PCRaster Global Water Balance), to estimate N delivery to surface waters and its subsequent transport (Beusen et al., 2015, 2016a, 2022; Vilmin et al., 2018). This model however still simulates N retention using empirical formulas and is not dynamically coupled with vegetation–soil N processes. Furthermore, it only provides annually averaged fluxes, hence ignoring the seasonal fluctuations induced by the hydrology and N cycling on land and in the river network. The Dynamic Land Ecosystem Model (DLEM 2.0) provides a significant advancement as it simulates riverine N flow from terrestrial ecosystems to rivers and coastal oceans using a unified process-based representation. So far, however, the model's simulation of N lateral transfer has only been evaluated at the regional scale, specifically in eastern North America (Yang et al., 2015), or for N2O emissions on the global scale (Tian et al., 2018; Yao et al., 2020). To complement these studies, we develop here a new N lateral transfer model that can be linked to the outputs of different LSMs. This model captures the hydrological dynamics and N transformation processes in the global river network at a temporal resolution from days to months, i.e. at a temporal resolution relevant to biogeochemical processes in coastal and marine ecosystems. At the same time, this model has the capacity to reconstruct and forecast the long-term (decadal- to century-scale) evolution of the aquatic N cycle as a result of a wide variety of anthropogenic factors, including climate change. To achieve this aim, we apply an offline approach in which lateral N transfers are constrained by outputs from an LSM. The resulting model, called LSM_Nlateral_Off (Land Surface Model Nitrogen lateral Offline), is in the present study coupled to ORCHIDEE, an LSM developed by the Institute Pierre-Simon Laplace (IPSL, France).
ORCHIDEE is a widely used land surface model (Krinner et al., 2005), with many versions (or branches) focusing on different aspects of the terrestrial C cycle and associated bio-elements. Here, we leverage ORCHIDEE-CNP, the branch simulating the coupled cycles of C, N, and phosphorus (P) in the terrestrial biosphere (Sun et al., 2021), and ORCHIDEE-Clateral, the branch simulating the leaching and erosion of C along the soil–inland-water continuum (Lauerwald et al., 2017, 2020; Zhang et al., 2022). Our study is structured as follows: (1) we present the development of the offline N lateral transfer model (LSM_Nlateral_Off) driven by outputs from ORCHIDEE-Clateral and ORCHIDEE-CNP, (2) we evaluate our model using a collection of water discharge and N concentration observations, (3) we investigate the spatio-temporal dynamics of N lateral transfers over the historical period of 1901–2014, and (4) we compare model results with those obtained from previously published models.
2.1 Model development
2.1.1 The LSM_Nlateral_Off model
The LSM, here ORCHIDEE, comprehensively simulates the cycling of energy, water, and C in terrestrial ecosystems (Krinner et al., 2005). As the model evolved, many versions (or branches) emerged with various foci on additional land surface processes impacting the climate system. In particular, the ORCHIDEE-CNP branch features a detailed representation of the coupled cycling of C, N, and P within vegetation and soil (e.g. root uptake of N, the allocation of N in the tissue of different parts of vegetation biomass, N turnover in litter and soil organic matter) and the leaching of NH and NO from soils to inland waters (Goll et al., 2017, 2018; Sun et al., 2021). The ORCHIDEE-Clateral branch simulates the large-scale lateral transfer and fate of water, sediment, particulate organic carbon (POC), dissolved organic C (DOC), and CO2 along the land–river–ocean continuum (Lauerwald et al., 2017; Hastie et al., 2019; Bowring et al., 2020; Zhang et al., 2022).
Based on the land-to-river inputs of water, POC, DOC, and inorganic N simulated by ORCHIDEE-CNP and ORCHIDEE-Clateral, we developed LSM_Nlateral_Off (Land Surface Model Nitrogen lateral Offline), simulating the transfers and transformations of reactive N through the global river network. The offline strategy provides a computationally efficient numerical model in which the mathematical representation of aquatic biogeochemical processes can easily be implemented, calibrated, and evaluated. Furthermore, by construction, it can also be used to route the N leaching fluxes produced by any other LSM in the future, allowing for applications at various scales and across different regions. In this offline scheme, ORCHIDEE-CNP provides as input the leaching rates of terrestrial dissolved inorganic N (DIN) with surface runoff and subsoil drainage and dissolved organic N (DON) leaching from manure. Inputs of terrestrial DON and particulate organic N (PON) are derived from the leaching and erosional fluxes of DOC and POC simulated by ORCHIDEE-Clateral and stoichiometric C : N ratios of dissolved organic matter (DOM) and particulate organic matter (POM); please refer to Sect. 2.1.2 for further details (Fig. 1).
N discharge from sewage is also included as an additional input to LSM_Nlateral_Off, using the N sewage dataset (1900–2010, gridded maps every 5 years) reported by Beusen et al. (2016b). Indeed, during the 20th century, global N (DIN and DON) discharge from sewage to surface waters has increased about 3.5-fold to 7.7 Tg N yr−1 and thus has a large impact on trends in global N lateral transfers. Sewage-derived N comes from three main sources: human waste from urban environments, animal waste, and industrial waste, each of which follows distinct pathways. For further details, please refer to Van Drecht (2009) and Morée et al. (2013).
Following delivery, PON, DON, and DIN are then transported by water flow advection from soils to rivers and through the river network all the way to the coast. Within the river network, parts of the transported DON and PON are decomposed into DIN, while part of the DIN is released back to the atmosphere through denitrification. Following previous global modelling approaches (Aitkenhead-Peterson et al., 2005; Bernot and Dodds, 2005; Wollheim et al., 2008), LSM_Nlateral_Off simulates the denitrification process without explicit representation of the different DIN species (i.e. NO and NH) or their interconversion via nitrification (Fig. 1).
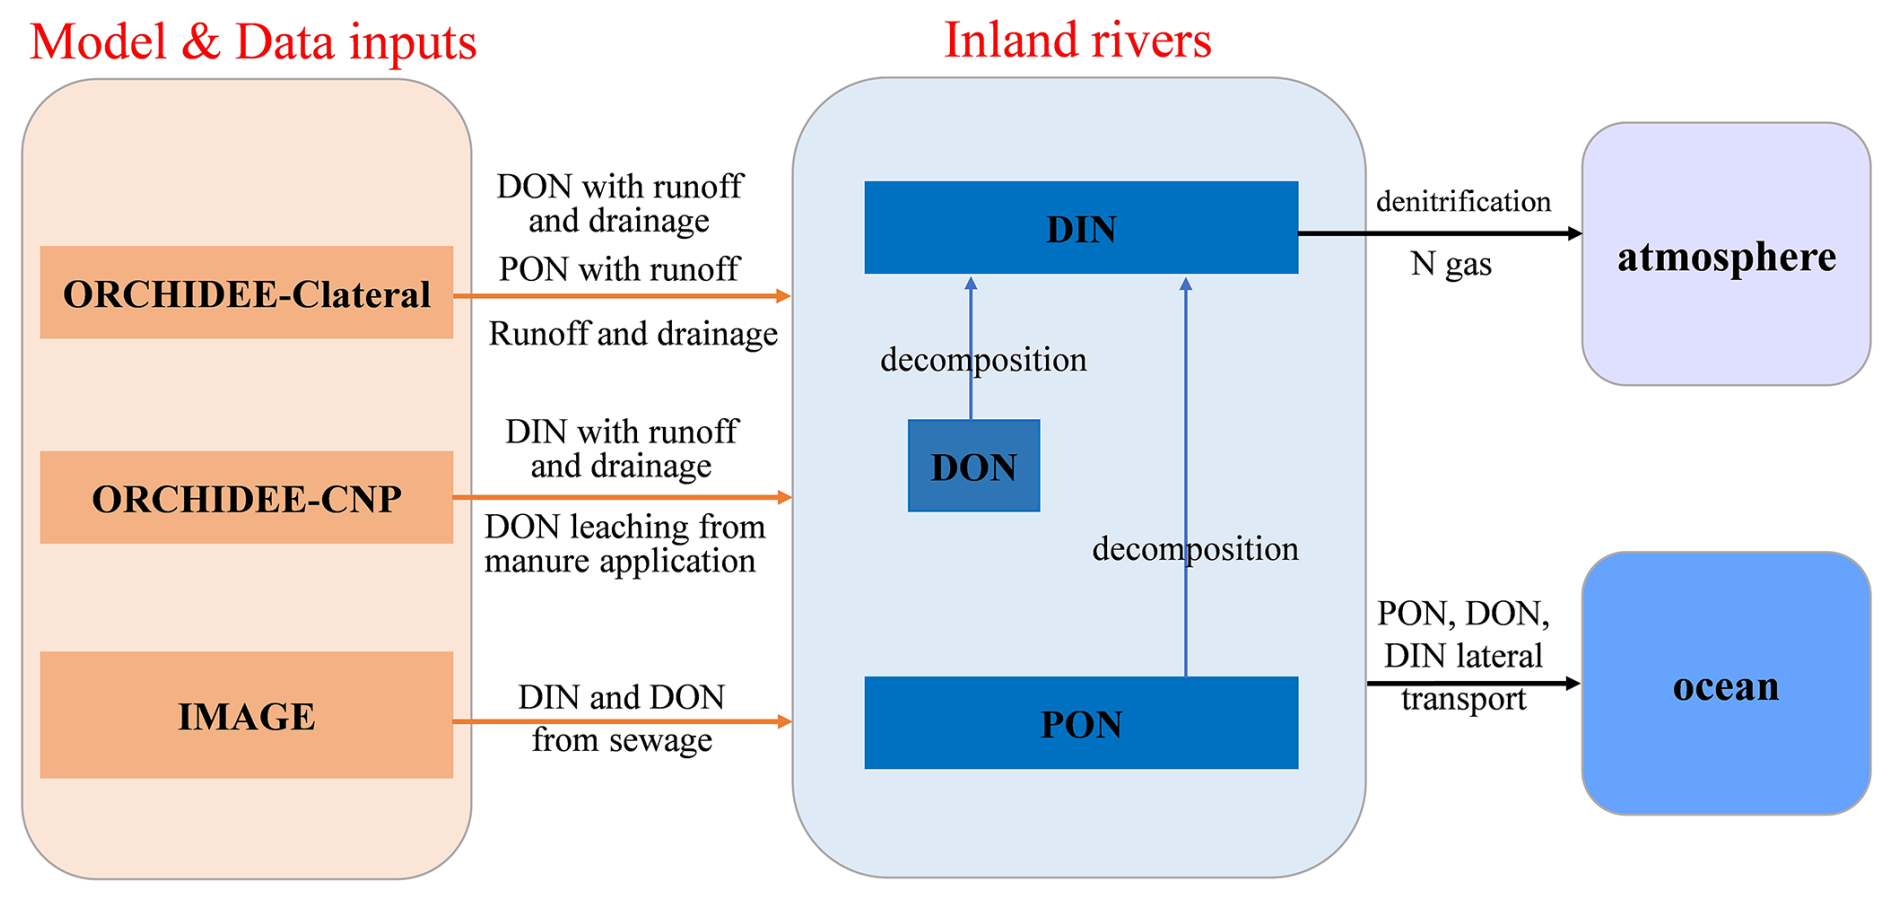
Figure 1Sources of driving data extracted from other models (left) and main aquatic N transformation processes represented in LSM_Nlateral_Off (right).
2.1.2 Water and N delivery from soils to the river network
LSM_Nlateral_Off was developed to simulate N lateral transfer and transformation during 1901–2014 in this study. The runoff and drainage simulated by ORCHIDEE-Clateral were used to constrain water inputs from land to rivers. This input dataset had a spatial resolution of 1° and a temporal resolution of daily time steps (Table 1). The data were downscaled to the LSM_Nlateral_Off spatial resolution of 0.5° using nearest-neighbour resampling (Patil, 2018). Runoff and drainage are critical components that determine DIN, DON, and PON fluxes. ORCHIDEE-CNP and ORCHIDEE-Clateral used the same scheme to simulate soil hydrology (Sun et al., 2021; Zhang et al., 2022), and they have been run with the same climate forcing data, land cover map, and soil parameters maps (Table 1). The climate forcing data during 1901–2014 were obtained from Global Soil Wetness Project Phase 3 (GSWP 3). Both ORCHIDEE-CNP and ORCHIDEE-Clateral used the ESA-CCI LUH2v2 plant functional type (PFT) distribution, which combines the ESA-CCI land cover map for 2015 with the historical land cover reconstruction from LUH2 (Lurton et al., 2020). Soil parameters in these two models follow Reynolds et al. (1999) and the Harmonized World Soil Database (FAO/IIASA/ISRIC/ISS-CAS/JRC, 2012). Therefore, the differences in runoff (0.9 %) and drainage (1.7 %) simulated by the two ORCHIDEE branches are relatively small (Fig. S1).
The lateral transfer of DOC and POC from land to rivers was used to constrain inputs of DON and PON. PON erosion with runoff originates from three soil organic matter (SOM) pools, each characterised by distinct C : N ratios set at 12, 25, and 8 for active, slow, and passive SOM pools, respectively (Zhang et al., 2022). The PON erosion from each pool is calculated by dividing the POC erosion flux from the same SOM pool by its corresponding C : N ratio. For DON leaching with runoff and drainage, the calculation relies upon measurements of the stoichiometry of dissolved organic matter, which report C : N ratios in soil and rivers between 8 and 25, with an average value of around 12 (Kirkby et al., 2011; Lutz et al., 2011; Tipping et al., 2016; Maranger et al., 2018; Rodríguez-Cardona et al., 2021). Therefore, the leaching of DON with runoff and drainage was quantified using the DOC fluxes simulated by ORCHIDEE-Clateral and an average C : N ratio of 12. It is important to note that this resulting flow excludes DON leaching sourced from manure application, as this source is not included in the ORCHIDEE-Clateral simulations. The spatial and temporal resolution of the resulting DON and PON fluxes used to force LSM_Nlateral_Off was 1° with a daily time step (Table 1), and these inputs were resampled to the nominal resolution of LSM_Nlateral_Off (0.5°) using the nearest-neighbour resampling (Patil, 2018).
DIN (i.e. NH and NO) inputs from soils to rivers were prescribed from a simulation of ORCHIDEE-CNP (Goll et al., 2017, 2018; Sun et al., 2021), which include DIN leaching from both natural and cultivated (e.g. cropland and pasture) ecosystems and account for changes induced by atmospheric N deposition, fertiliser use, and manure application. DON inputs to rivers from manure application were also prescribed using ORCHIDEE-CNP. The approach relies on a DON pool and a leaching factor, with a dedicated manure-derived DON pool incorporated into ORCHIDEE-CNP to participate in subsequent N cycling and leaching processes. The spatial and temporal resolution of this input dataset was 2° with a daily time step, and the data were downscaled to the LSM_Nlateral_Off spatial resolution of 0.5° using nearest-neighbour resampling (Patil, 2018) (Table 1).
Finally, total nitrogen (TN) inputs from sewage (https://doi.org/10.17026/dans-zgs-9k9m), provided at 0.5° globally with a 5-year time step (Beusen et al., 2016b), were evenly redistributed across each day of the year (Table 1). TN from sewage was then partitioned into different N species following the approach of Naden et al. (2016), which assumes that 10 % of sewage TN is DON and the remaining 90 % is DIN.
Table 1List of (1) forcing data used to run ORCHIDEE-Clateral, ORCHIDEE-CNP, and LSM_Nlateral_Off and (2) observational data used to evaluate the simulation results. Sres and Tres are the original spatial and temporal resolutions of the forcing data, respectively.
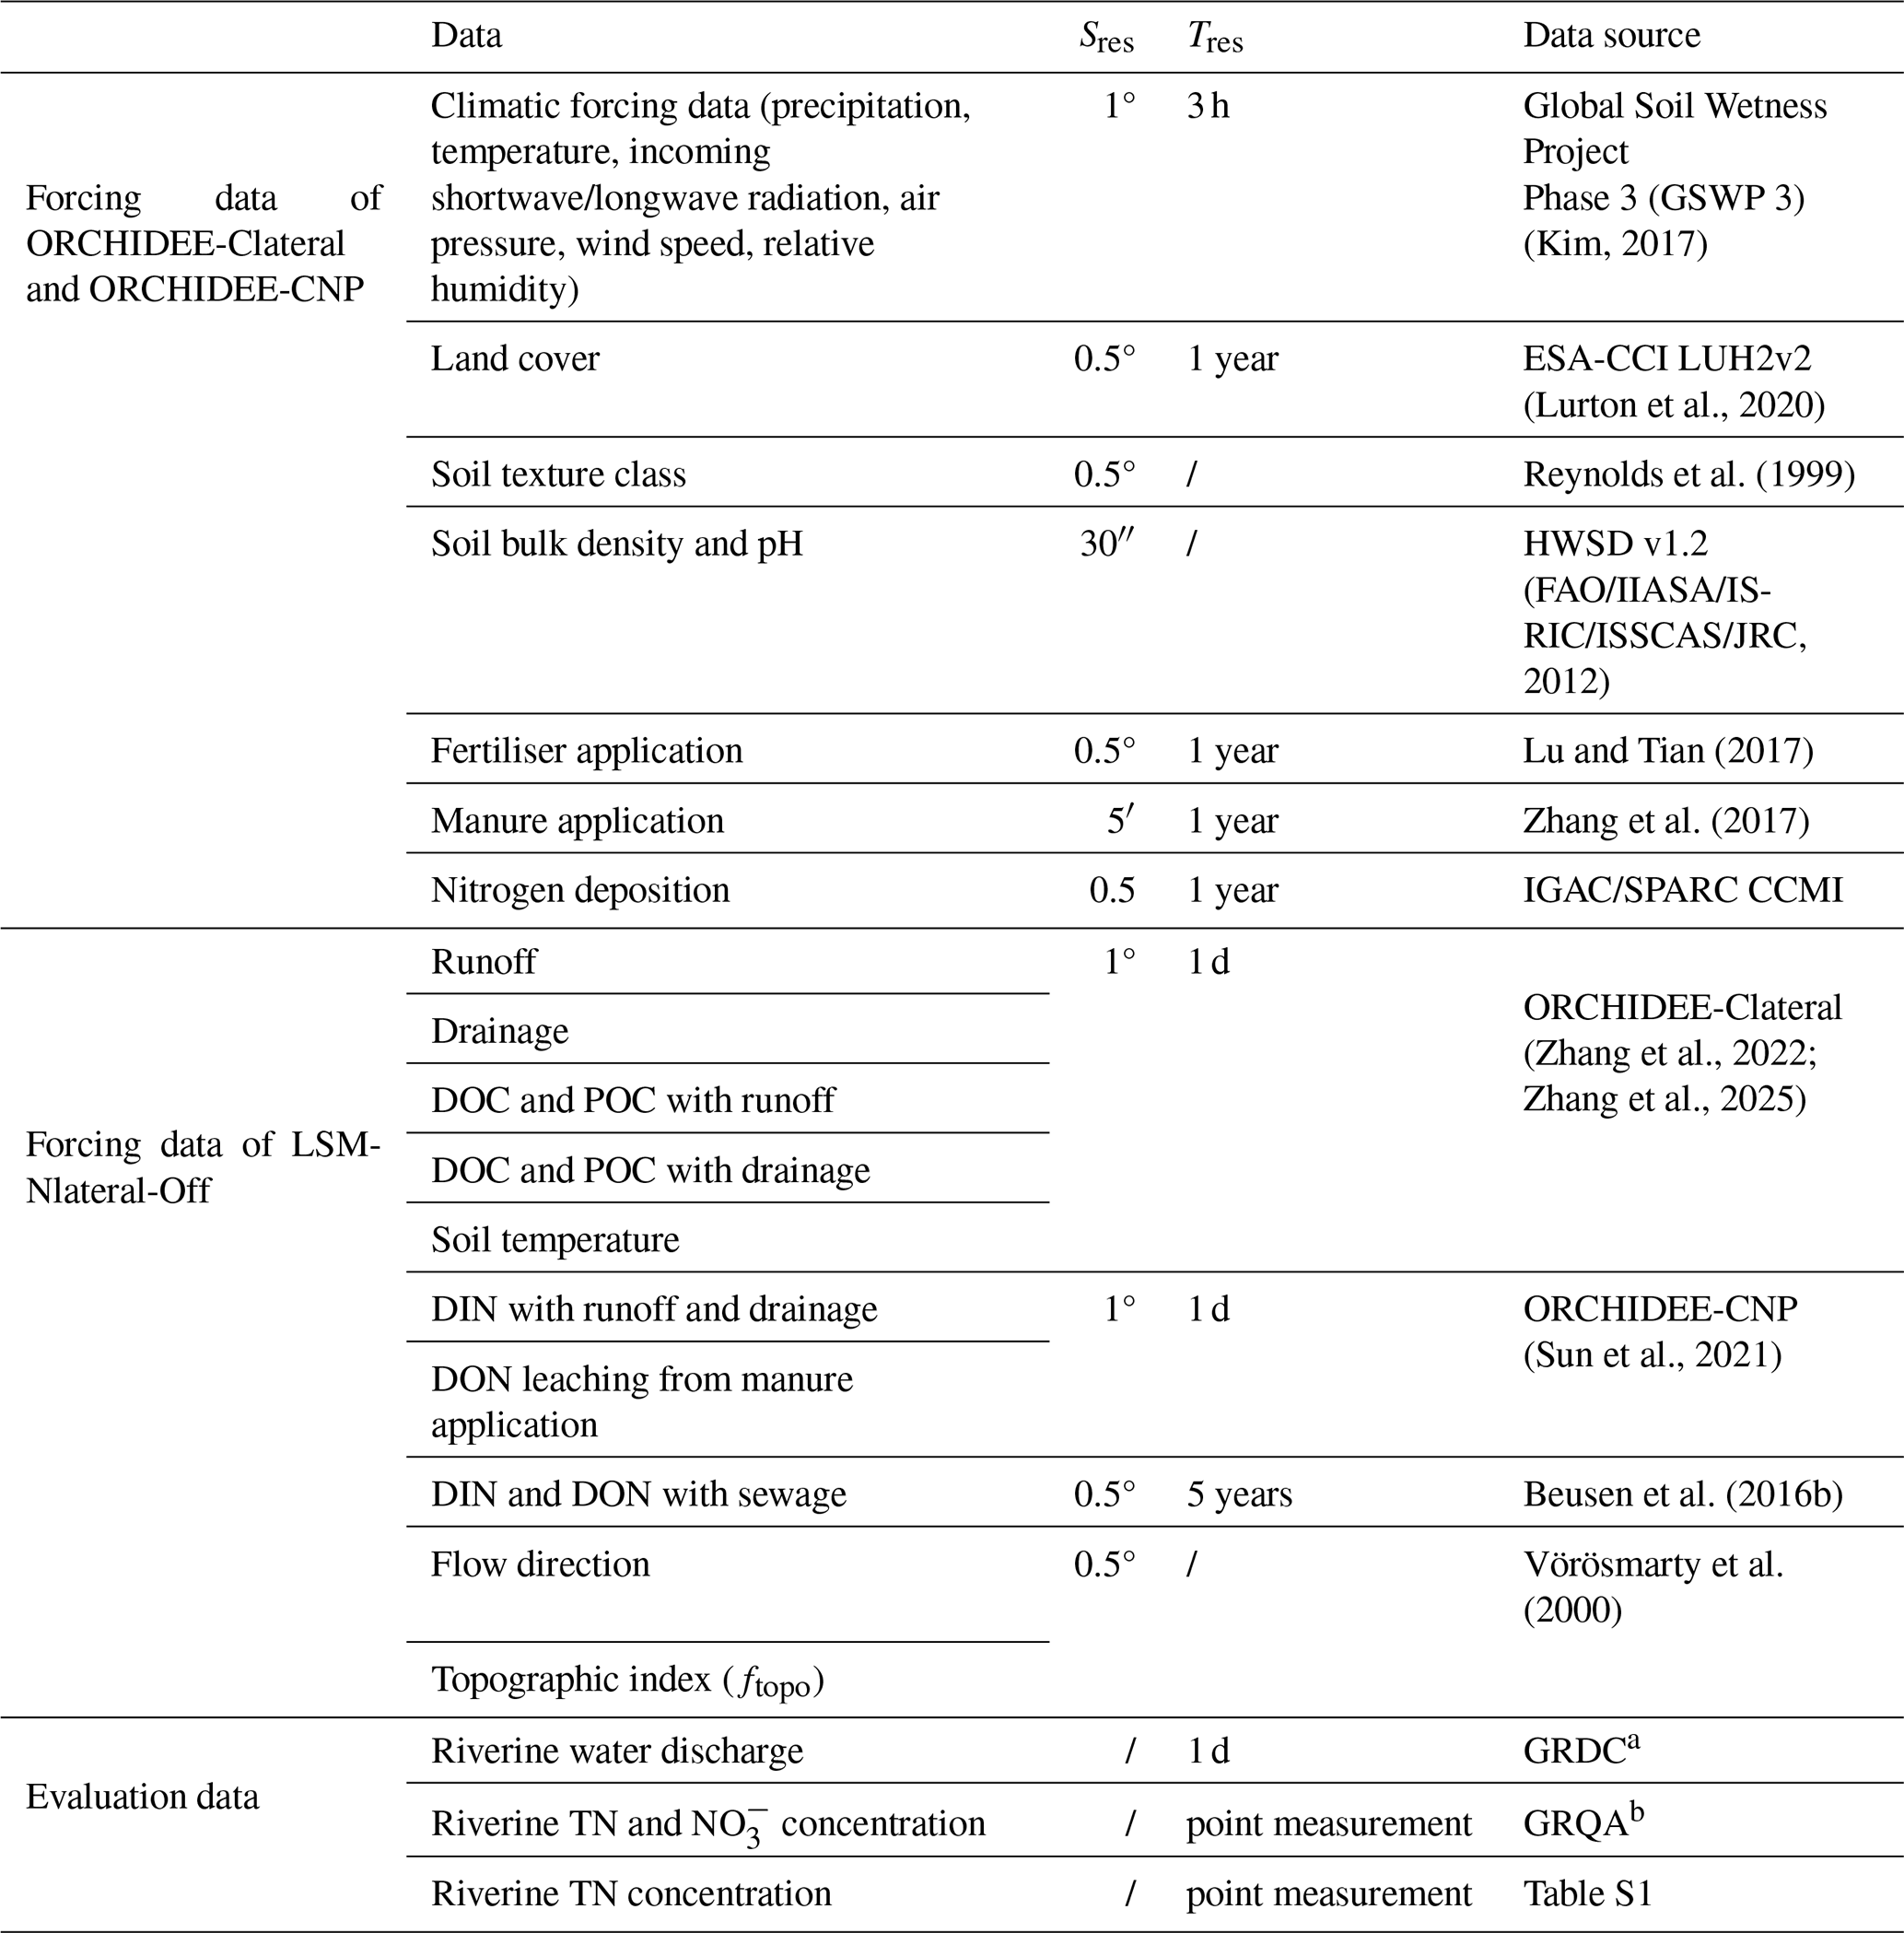
a Global Runoff Data Centre (GRDC) (Federal Institute of Hydrology, https://grdc.bafg.de/data/data_portal/, last access: 15 April 2022). b Global River Water Quality Archive (GRQA) (Virro et al., 2021).
2.1.3 N transport and transformation in the river network
LSM_Nlateral_Off simulates water discharge using a distributed routing scheme (Vörösmarty et al., 2000). As shown in Fig. 2, surface runoff (FRO) and belowground drainage (FDR), both derived from ORCHIDEE-Clateral, serve as inputs to LSM_Nlateral_Off. FRO first feeds into the “fast” water reservoir (), while FDR feeds into the “slow” water reservoir (). The delayed outflows from these reservoirs then feed into the “stream” water reservoir (). Water in the stream reservoir () in grid cell i then flows downstream into the stream reservoir of grid cell i+1 (, m3 d−1). The outflow rates from the fast (), slow (), and stream () reservoirs are calculated at a daily time step based on a grid-cell-specific topographic index ftopo (unitless; Vörösmarty et al., 2000) (Table 1) and a reservoir-specific water turnover factor τ, which translates ftopo into a water residence time for each reservoir attached to each river segment (Eq. 1).
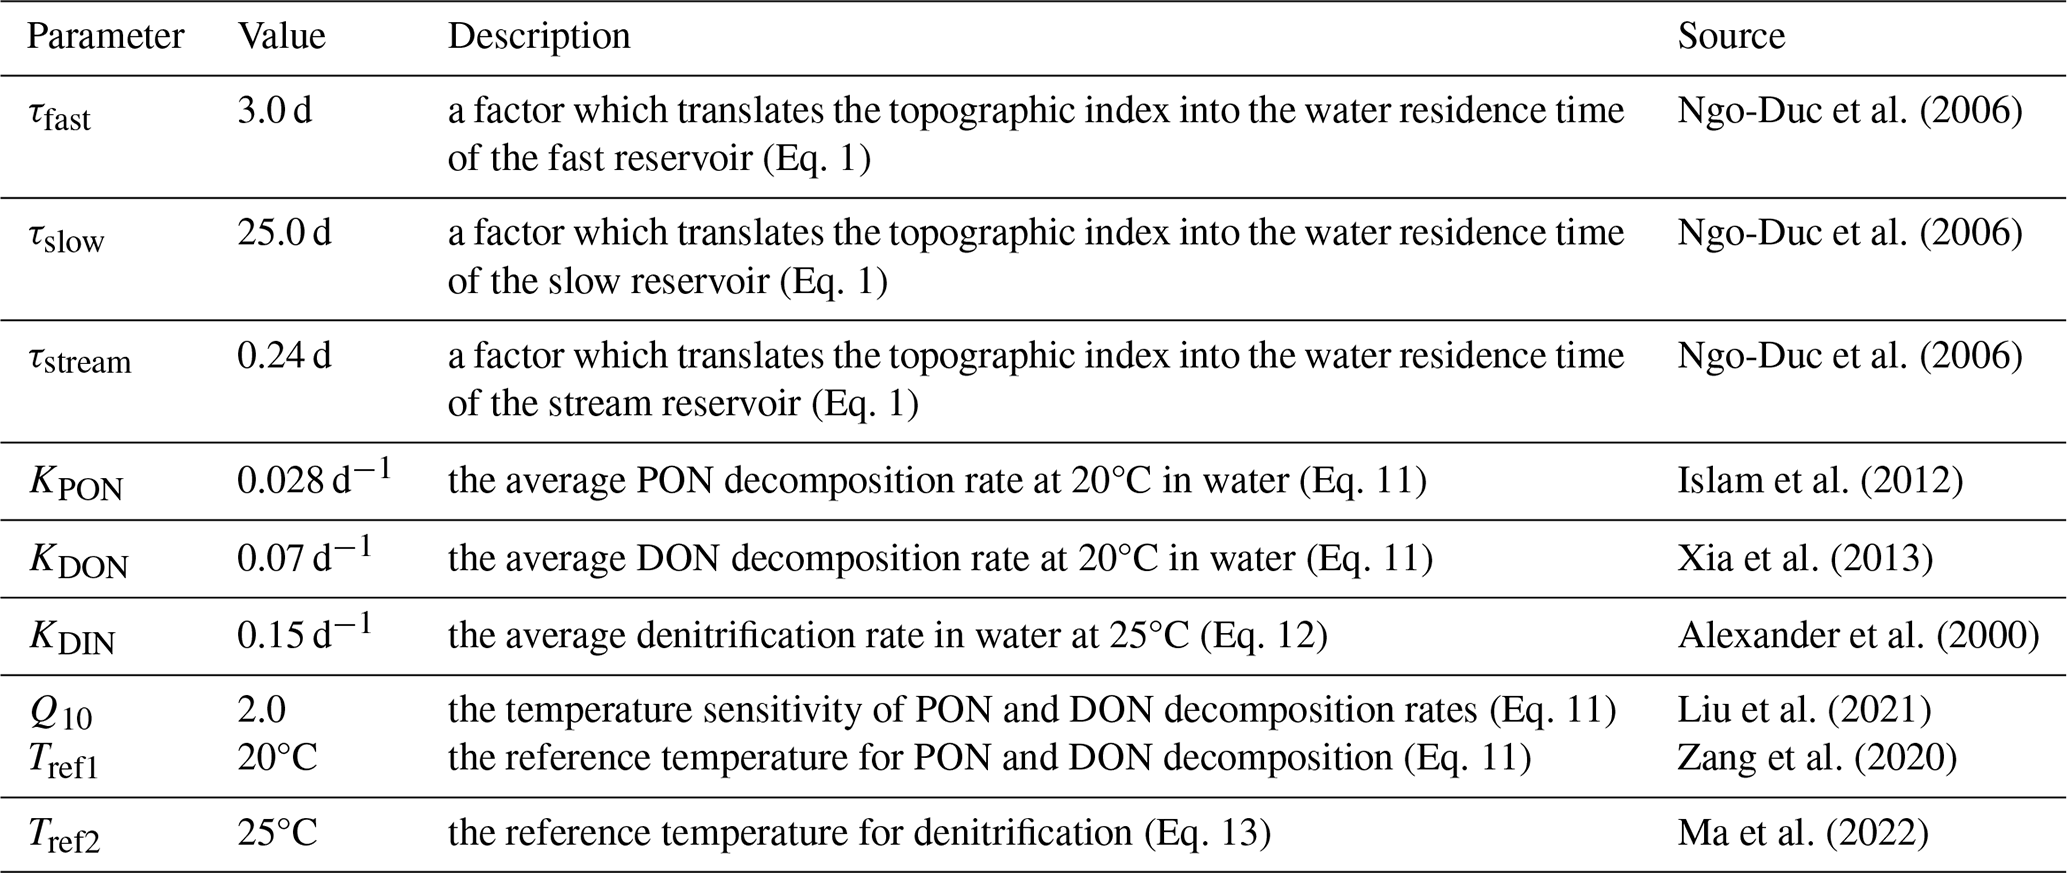
where (m3 d−1) represents water outflow rates from the fast (), slow (), or stream () reservoir; (m3) represents water stock in the fast (), slow (), or stream reservoir (); τ represents water residence time for each reservoir, equal to 3.0, 25.0, and 0.24 d for the fast, slow, and stream reservoirs, respectively (Ngo-Duc et al., 2006); and ftopo represents the grid-cell-specific topographic index (unitless; Vörösmarty et al., 2000).
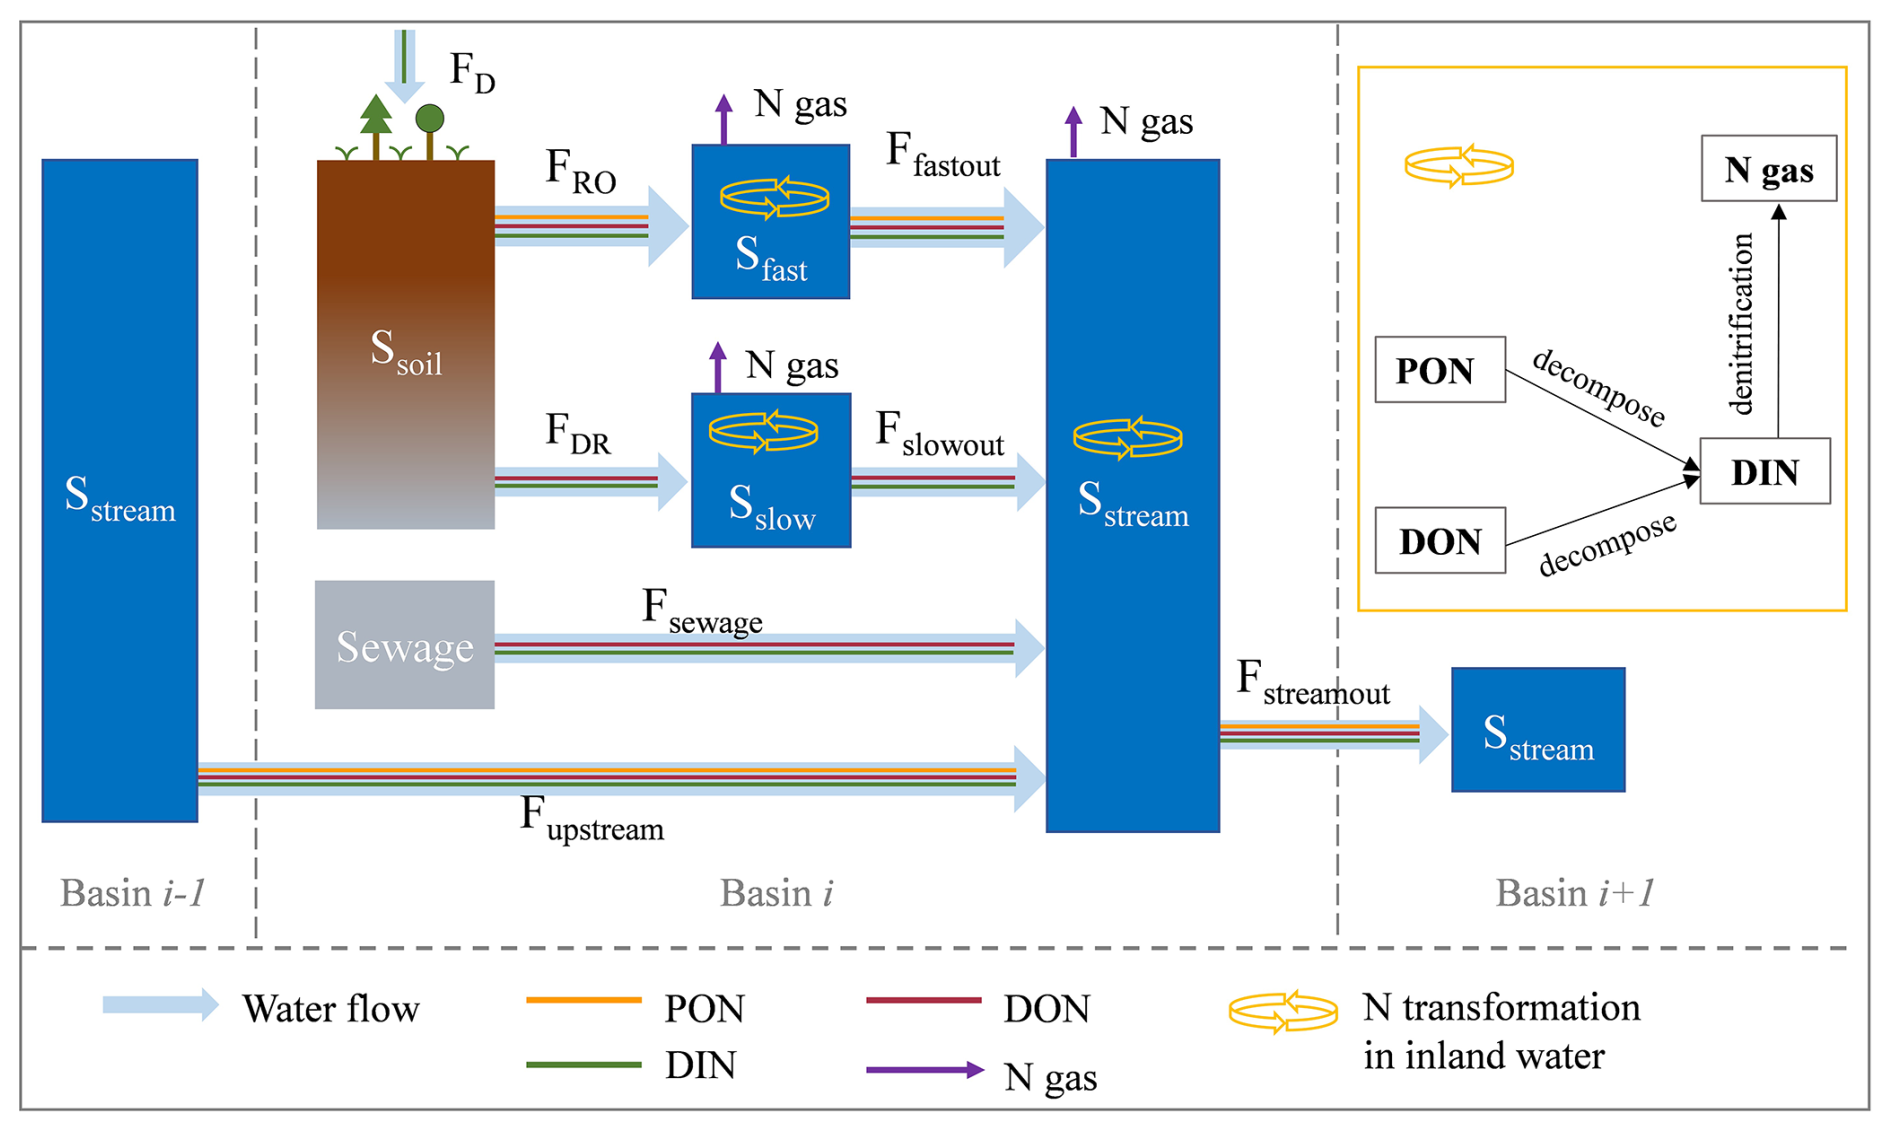
Figure 2Schematic plot for the reservoirs and flows of water and N in LSM_Nlateral_Off. Ssoil is the soil pool. Sfast, Sslow, and Sstream are the “fast”, “slow”, and “stream” water reservoirs, respectively. FRO and FDR are surface runoff and below-ground drainage (also called sub-surface runoff in other studies), respectively. Ffastout is the flow from fast reservoir to stream reservoir. Fslowout is the flow from slow reservoir to stream reservoir. Fupstream and Fstreamout are the upstream inputs from basin i−1 and downstream outputs to basin i+1, respectively. FD is the wet and dry deposition of DIN from the atmosphere.
Following the routing scheme of water in LSM_Nlateral_Off, N contained in surface runoff (FRO) and belowground drainage (FDR) flows into the fast and slow reservoir, respectively. Subsequently, the N stocks in these reservoirs are subject to decomposition and losses via denitrification, which are governed by the water residence time. The remaining fractions further flow into the stream reservoirs, which also receive direct N inputs from sewage (Fig. 2). Within stream reservoirs, N is transformed by biogeochemical reactions and flows from one grid cell to the next along the river routing scheme. The timescale of these biogeochemical transformation processes scales to the water residence time (and hence topography) within the river network, and the fraction of N that is not lost to the atmosphere via denitrification is ultimately exported to the coast. Biogeochemical reactions within each reservoir include the decomposition of PON and DON to DIN, as well as the denitrification of DIN to N gas which is assumed to all be released into the atmosphere (Fig. 2). The mass balance equations for the N stocks in different reservoirs are calculated as follows:
where Fupstream_PON (g N d−1), Fupstream_DON (g N d−1), and Fupstream_DIN (g N d−1) represent the inflow rates of PON, DON, and DIN from upstream grids, respectively, and Fstreamout_PON (g N d−1), Fstreamout_DON (g N d−1), and Fstreamout_DIN (g N d−1) represent outflow rates of PON, DON, and DIN from the given grid to downstream grid, respectively. For each N species, the N inputs to a stream reservoir in a given grid cell (Fupstream_PON, Fupstream_DON, and Fupstream_DIN) are equal to the sum of N outflow from the upstream stream reservoir in the adjacent grid cells (Fstreamout_PON, Fstreamout_PON, and Fstreamout_PON), as calculated in Eq. (10). Rfast_PON and Rstream_PON (g N d−1) represent PON decomposition rates in the fast and stream reservoirs, respectively. Rfast_DON, Rslow_DON, and Rstream_DON (g N d−1) represent DON decomposition rates in the fast, slow, and stream reservoirs, respectively. Rfast_DIN, Rslow_DIN, and Rstream_DIN (g N d−1) represent DIN denitrification rates in the fast, slow, and stream reservoirs, respectively.
We assume that N concentrations are homogeneously distributed within each reservoir of each grid and that N transfers between reservoirs simply follow that of water. N transfers are calculated as follows:
where represents water stocks (m3), and represents flow rates of water (m3 d−1). Fout_N represents PON flow rates from fast (Ffastout_PON) or stream (Fstreamout_PON) reservoirs; DON flow rates from fast (Ffastout_DON), slow (Fslowout_DON), or stream (Fstreamout_DON) reservoirs; and DIN flow rates from fast (Ffastout_DIN), slow (Fslowout_DIN), or stream (Fstreamout_DIN) reservoirs. The same principle applies to the SN (N stocks) terms.
Temperature controls the decomposition rates of organic N in rivers (Ferreira et al., 2020). Following the algorithm of Xia et al. (2013), the decomposition rates of PON and DON in each reservoir are calculated using first-order kinetics of the corresponding N stock and a Q10 temperature dependence based on water temperature.
RON (g N d−1) represents the decomposition rate of organic N (ON, i.e. PON and DON). SON (g N) represents ON stocks in each reservoir. KON represents the average PON decomposition rate (KPON=0.028 d−1) (Islam et al., 2012) and the average DON decomposition rate (KDON=0.07 d−1) at the reference temperature of 20°C in water (Xia et al., 2013). Q10 is the temperature sensitivity of PON and DON decomposition rates set to 2.0 (Yang et al., 2015; Liu et al., 2021). TW is the water temperature (°C) and Tref1 is the reference temperature for PON and DON decomposition, set to 20°C. RON (g N d−1) represents PON decomposition rates in fast (Rfast_PON) or stream (Rstream_PON) reservoirs and DON decomposition rates in fast (Rfast_DON), slow (Rslow_DON), or stream (Rstream_DON) reservoirs.
The denitrification rates decrease with stream depth because most denitrification happens in benthic sediments rather than in the water column, so high benthic area-to-water-volume ratios result in high denitrification rates (Aitkenhead-Peterson et al., 2005; Bernot and Dodds, 2005). In addition, denitrification rates are also controlled by temperature (Jung et al., 2014; Ma et al., 2022). The denitrification process is simulated by adapting equations from Pauer and Auer (2008):
where RDIN (g N d−1) represents denitrification rates in fast (Rfast_DIN), slow (Rslow_DIN), or stream (Rstream_DIN) reservoirs; KDIN (0.15 d−1) represents the denitrification rate in water at 25°C (Alexander et al., 2009); FT_DIN (unitless) represents the dependency of denitrification on temperature (Ma et al., 2022); Tref2 is the reference temperature for denitrification (= 25°C); (unitless) represents the factor that simulates the role of the benthic surface-area-to-water-volume ratio, which serves as a key control factor of denitrification rates. The stream depth is simulated according to the method in Raymond et al. (2012). Therefore, aside from the availability of DIN stocks, denitrification rates are spatially and temporally dependent through the effects of water residence time (controlled by topography), temperature, and water depths (controlled by discharge). Tables A1 and A2 provide a summary of all variables, fluxes, and processes incorporated in LSM_Nlateral_Off.
2.2 Observational data
Riverine water discharge from the Global Runoff Data Centre (GRDC) (Federal Institute of Hydrology, https://grdc.bafg.de/data/data_portal/, last access: 15 April 2022) and riverine TN and NO concentrations from the Global River Water Quality Archive (GRQA) (Virro et al., 2021) were used to evaluate LSM_Nlateral_Off (Fig. 3). We obtained observed water discharge data from the GRDC website for 346 gauging stations with a catchment area exceeding 50 000 km2. Each station has over 12 months of observational records and more than 25 observations per month (Fig. S4). For GRQA data, only time series with more than two observations per month in 1 year were retained for model evaluation. For N concentrations, after removing duplicates in the GRQA database, we obtained TN data for 3507 sites and NO data for 1841 sites. Moreover, since observations of NO at a given site are generally more frequent and cover a longer time span than those for TN, we used the strong correlation between these two species to estimate TN concentrations from NO when only NO data were available (represented by yellow dots in Fig. 3). The prediction equation applied in this study (Eq. 15, Fig. S2) was obtained based on GRQA data at 148 sites with simultaneous concentrations of both TN and NO (R2=0.78):
where CTN_obs (mg L−1) and (mg L−1) represent the observed concentrations of TN and NO, respectively.
The TN flow rates are equal to the water discharge rates multiplied by N concentrations. Therefore, for each GRDC site, the nearest GRQA site with reported N concentration (McDowell et al., 2021) was systematically selected to calculate the flux. We first calculated the monthly average N concentrations and monthly total water discharge and then determined the monthly N fluxes using Eq. (16). The total annual N flow is then obtained by summing the monthly N fluxes over the entire year.
where FTN_obs (g N d−1) and FW_obs (m3 d−1) represent observed rates of TN flow and water discharge, respectively.
Since TN concentrations for several large rivers (e.g. Amazon and Chinese rivers) were missing in GRQA, we complemented this dataset by collecting additional observational TN data from the peer-reviewed literature (represented by green dots in Fig. 3), resulting in the addition of 20 sites to our database (see details of observed sites in Table S1).
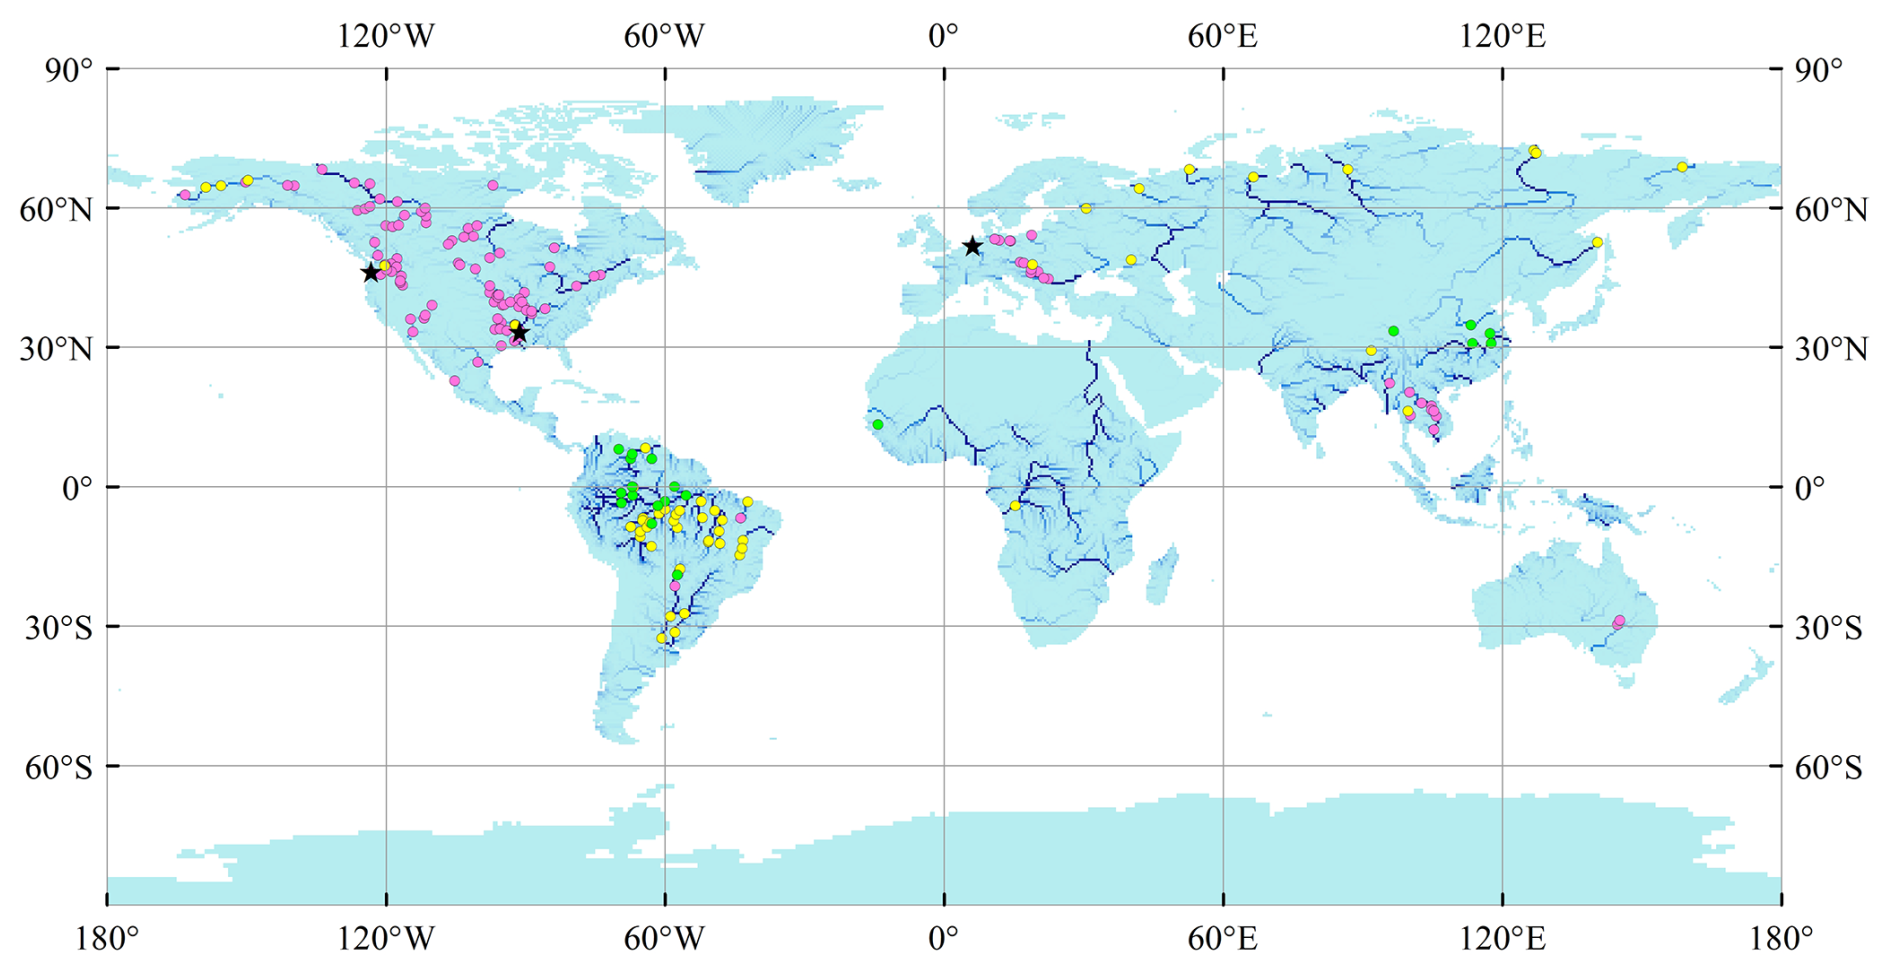
Figure 3Location of observational sites for N concentrations. Pink dots represent sites with observations of total nitrogen (TN) concentrations, 116 sites; yellow dots represent sites with observations of NO concentrations, 53 sites; and green dots represent sites with observations of TN concentrations from the published literature, 20 sites (Table S1). Black stars represent sites with daily time series of water discharge and TN flow.
2.3 Simulation protocol and analysis of model results
2.3.1 Simulation protocol
LSM_Nlateral_Off was applied to simulate the lateral transfer of PON, DON, and DIN; the decomposition of PON and DON; and the loss of DIN by denitrification within the river network from 1901–2014. The model was run at 0.5° spatial resolution and daily temporal resolution using the downscaled terrestrial forcings as inputs (see Sect. 2.1.2). Running LSM_Nlateral_Off on a daily step allows for the evaluation of the model's performance in capturing not only long-term trends but also seasonality in lateral N transfers and transformations within the global river network. The model was evaluated on a daily time step by comparing the simulated and observed TN lateral transfer at three sites with long time series of observed TN flows. We also evaluated the performance of LSM_Nlateral_Off in simulating annual lateral TN transfer using observational data from 189 sites worldwide, each with records of both water discharge rates and N concentrations. The simulated total amounts of PON, DON, and DIN from land to river and from river to ocean were further compared with previously published global N models, namely IMAGE-GNM (Vilmin et al., 2018), the Framework for Aquatic Modeling in the Earth System (FrAMES-N) (Wollheim et al., 2008), the mass balance model (MBM) (Green et al., 2004), and GlobalNEWS2 (Mayorga et al., 2010).
Table 1 summarises the forcing and evaluation data along with their spatio-temporal resolution and references to the gridded products and point datasets.
2.3.2 Model evaluation metrics
To evaluate the performance of LSM_Nlateral_Off in reproducing the spatial variations in water and N flow, the mean bias error (MBE) and the coefficient of determination (R2) were determined. R2 represents how much variation in the observations can be explained by the model. For the definition of R2, please refer to Renaud and Victoria-Feser (2010). MBE quantifies the degree to which LSM_Nlateral_Off overestimates or underestimates observations of water discharge and TN flow at the grid level.
where M is the mean of simulated values, and O is the mean of observed values.
To assess the performance of LSM_Nlateral_Off in reproducing time series of TN and water flows, the relative root mean square root (RRMSE) and Nash–Sutcliffe efficiency (NSE) coefficient were calculated.
where n represents the total number of days/months with available observations at a given site, and Oj and Mj represent the observed and modelled values of water TN flow on day/month j. The NSE can take values between 1 and −∞. An NSE of 1 indicates a perfect fit between observed and simulated values, and an NSE of 0 means that using the mean observed value as a constant simulated value would lead to as much deviation between observed and predicted values as using the actual simulated values. If the NSE is negative, there is more deviation between simulated and observed values than between the observed values and their mean.
2.3.3 Seasonality analysis
To explore the seasonal variability in water discharge, TN flow, TN concentration, and denitrification rates during 1995–2014 at the global scale, we constructed spatial maps of monthly anomalies following the method by Roobaert et al. (2019). If FV denotes the rate of water flow (km3 yr−1), denitrification (Gg N yr−1), TN flow (Gg N yr−1), or TN concentration (mg L−1) in rivers, then for each grid cell, the monthly anomaly of FV can be calculated as the difference between the FV value in a given month and the corresponding annual mean value:
where FVAt represents the anomaly of FV in month t, while FVt and represent the values of FV in month t and the annual mean, respectively.
The seasonality, defined as the amplitude of seasonal variations in water discharge, N flow rates, N concentrations, and denitrification rates, is expressed as the root mean square (RMS) of the monthly FVA.
3.1 Model evaluation
The evaluation of the simulated water discharge using GRDC data indicates that for major rivers with drainage areas larger than 50 000 km2 spread over the globe, LSM_Nlateral_Off reproduces the magnitude and seasonal variations in water discharge well. Overall, the model simulation explains 90 % of the spatial variations in the observed long-term average water discharges (Fig. 4a). The absolute values of MBE for the simulated average water discharges are mostly smaller than 50 % (Fig. S3a). At 25 sites (13 % of all sites), the absolute values of MBE are larger than 100 %, but the annual mean water discharge at each of these sites is less than 100 km3 yr−1 (about 3200 m3 s−1), indicating that large errors tend to occur at sites where water discharge is low (Fig. S3a). The discrepancy between model simulations and observations at these sites may be caused by three factors: (1) a potential discrepancy between the stream routing scheme (delineation of catchment boundaries) defined by the 0.5° resolution forcing data and the real river network; (2) the presence of stream channel bifurcations that are poorly resolved by the model (Zhang et al., 2022); and (3) biases in runoff and drainage simulated by ORCHIDEE-Clateral, which may stem from deviations in meteorological data and the parameterisation of soil hydraulic properties. At some sites, such as the Columbia, Rhine, and Mississippi rivers, for which continuous time series in TN flows are available, LSM_Nlateral_Off also captures the seasonal variation in water discharges well, with RRMSEs ranging from 30 % to 37 % (Fig. 5a1–3).
Area-averaged TN flows simulated by LSM_Nlateral_Off are generally consistent with observed TN flows at the 189 sites extracted from the GRQA database and additional published literature. LSM_Nlateral_Off explains 77 % of the observed spatial variations in long-term TN flows across sites (Fig. 4b). The absolute values of MBE for the simulated average TN flows are mostly below 50 % (Fig. S3b). LSM_Nlateral_Off significantly underestimated (MBE < −100 %) or overestimated (MBE >100 %) the observed TN flows at 32 sites (17 % of all sites), all located in regions with relatively low water discharge (Fig. S3b). At 9 of these 32 sites (28 %), the MBE of TN flow is very close to that of water discharge, showing that discrepancies between observed and modelled TN flows at these locations stem primarily from water discharge rather than nitrogen concentrations. The results reveal that the MBE of TN flow is relatively small in large rivers, such as at sites located in the lower reaches of the Columbia, Rhine, and Mississippi rivers, where MBE values are −25 %, −16 %, and 1 %, respectively. LSM_Nlateral_Off also basically reproduces the seasonal patterns of TN flow in these rivers, with RRMSEs ranging from 30 % to 62 % (Fig. 5b1–3). At the Rhine River site, the NSE of TN flow is negative, revealing that although the seasonal pattern of TN flow simulated by LSM_Nlateral_Off is similar to that observed, the model does not capture accurate trends on the daily scale (Fig. 5b2).
The seasonality in water discharge is an important control factor for the seasonality in TN fluxes. Therefore, the observational data derived from GRDC were used to further assess the performance of LSM_Nlateral_Off in reproducing the monthly seasonality of water discharge. At the 346 GRDC sites with continuous measurements (Fig. S4), we computed the monthly average value, taken as the observed water discharge of that month. For the world's 20 largest rivers (Dai and Trenberth, 2002), which account for approximately 31 % of the total global river discharge (Table S2, Fig. S4), LSM_Nlateral_Off effectively simulates both the magnitude and seasonality of water discharge (Fig. S5). The Nash–Sutcliffe efficiency (NSE) values range from 0.07 to 0.92, with 17 out of the 20 rivers achieving an NSE greater than 0.5 (Fig. S5). However, the model demonstrates a significantly weaker accuracy in capturing the seasonality of water discharge in some low-flow rivers, with NSE values below zero at 84 (24 % of the sites contributing to 17 % of the global river discharge) of the 346 GRDC sites (Fig. S6). The model's limitations in capturing seasonality are attributed to three main reasons, as discussed above.
As an additional evaluation, we compared our model results against observed N concentrations and water discharges across the United States provided by the U.S. Geological Survey (USGS). Based on these data, a previous study (Scott et al., 2007) calculated the long-term (1975–2004) mean annual loads of total organic N (TON) and TON fractions (TON yield / TN yield) at 854 stations nationwide. LSM_Nlateral_Off simulates a spatial pattern for the TON fraction which closely matches that reported by Scott et al. (2007), with high values in western regions and low values in the east (Fig. S7). This suggests that LSM_Nlateral_Off not only effectively simulates TN fluxes but also captures the organic and inorganic fractions across the United States relatively well. Moreover, the simulated DIN concentrations display similar spatial patterns as those obtained from a recent observation-based machine learning (ML) assessment (Marzadri et al., 2021) in regions such as North America, western Europe, eastern China, and India (Fig. S8). However, in regions such as the Amazon, Africa, and Australia, LSM_Nlateral_Off simulates lower DIN concentrations compared to the ML assessment (Fig. S8). These lower DIN concentrations are attributed to different factors. In Australia, low N inflow into rivers results in low DIN concentrations, whereas in the Amazon and tropical rainforests of Africa, high denitrification rates are primarily responsible for the low DIN concentrations in the model (Fig. 7). The ML involves a significant degree of empirical modelling and therefore does not fully reflect real-world conditions. Therefore, this comparison cannot be regarded as a direct evaluation of the model based on observational data. However, the consistency between the two models across most regions globally (e.g. North America, western Europe, eastern China, and India) suggests that LSM_Nlateral_Off overall performs reasonably well in simulating DIN lateral transfer processes.
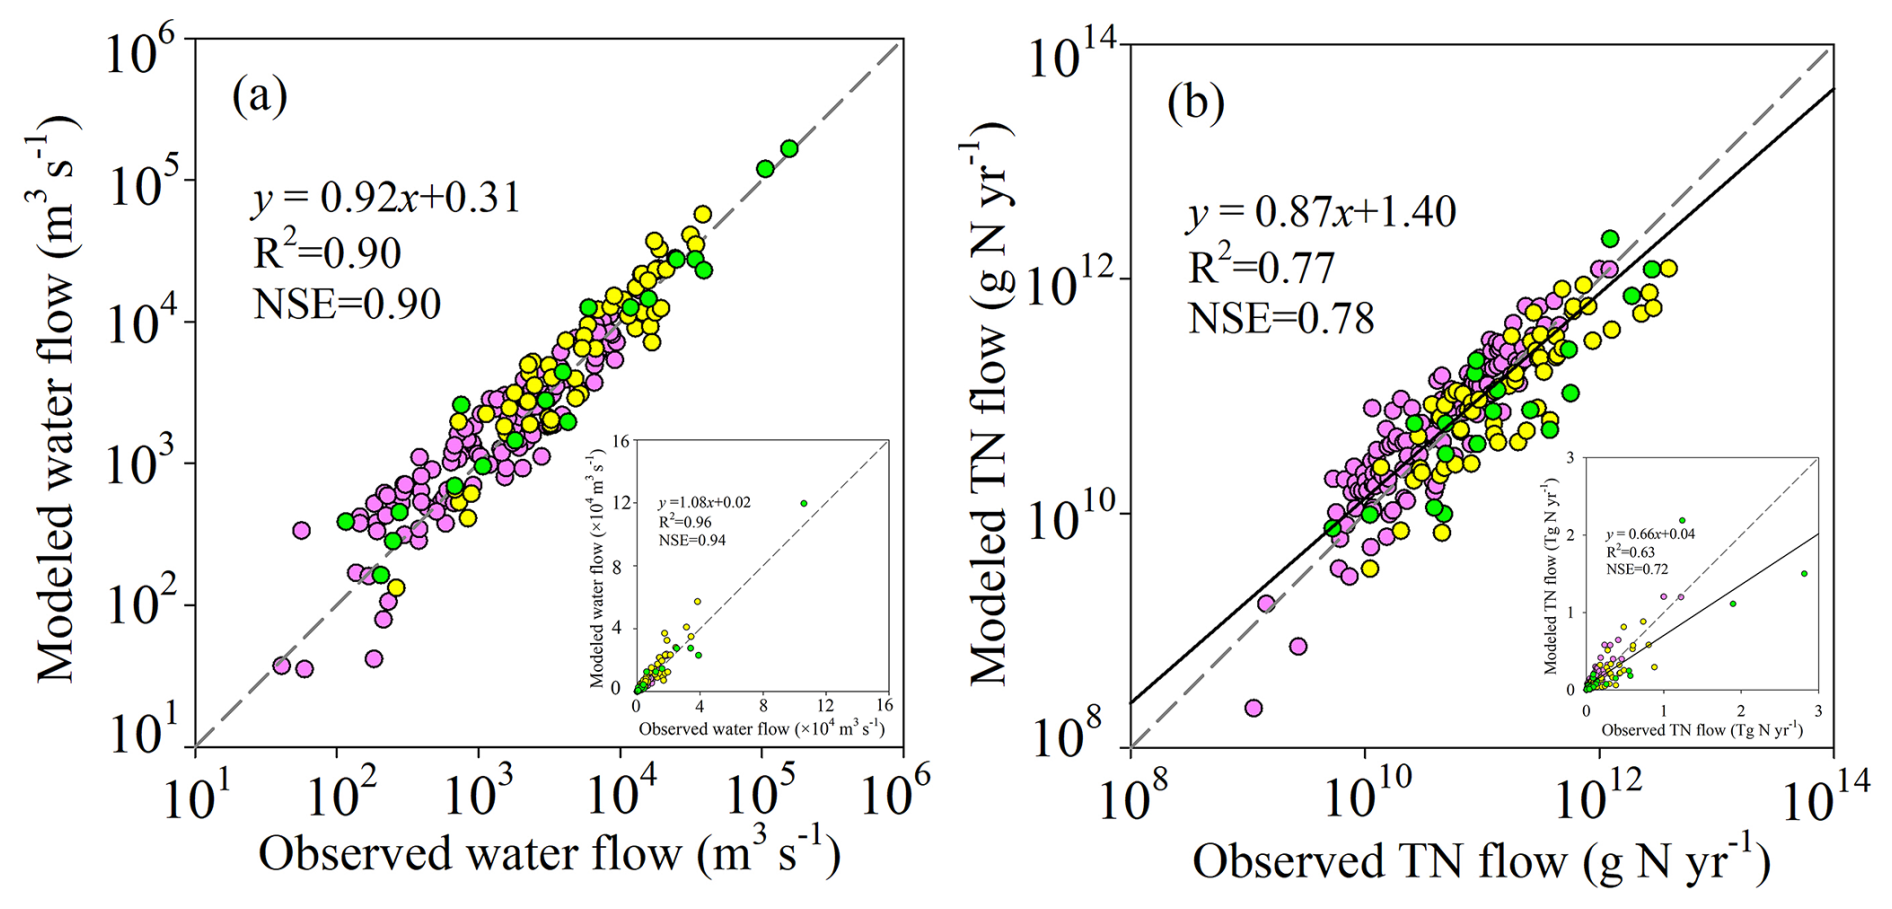
Figure 4Evaluation of LSM_Nlateral_Off. Global-scale comparison between observed and modelled annual mean water discharge (a) and TN flow (b). Pink symbols represent sites with observations of TN concentrations from GRQA, yellow symbols represent GRQA sites for which TN concentrations were estimated from observations of NO concentrations, and green symbols represent sites with observations of TN from the published literature.
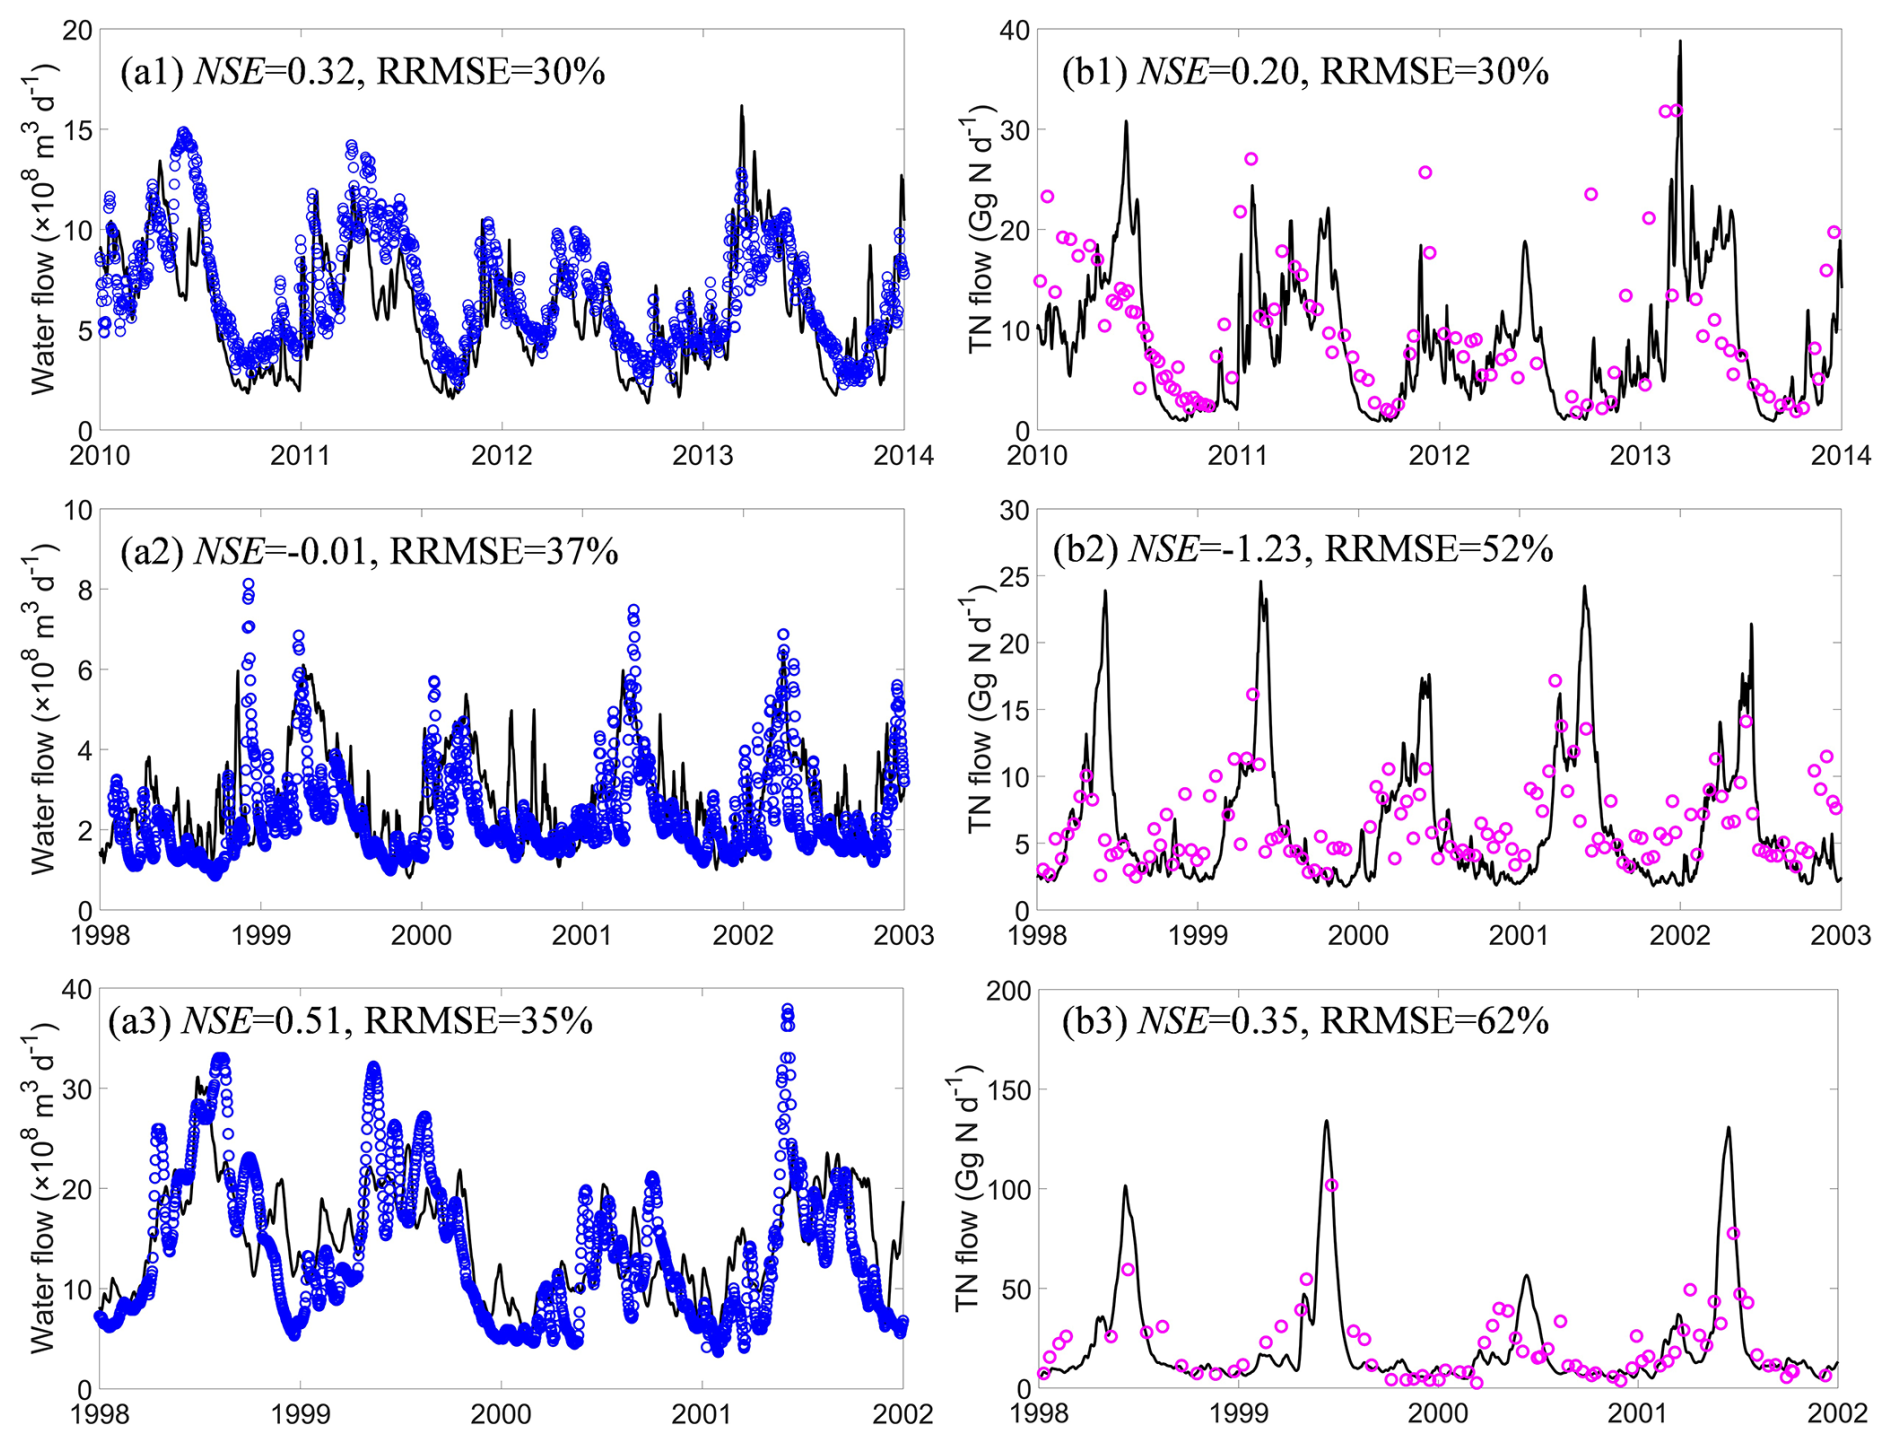
Figure 5Time series of water discharge (a) and TN flow (b). Panels (a1) and (b1) represent the Columbia River (46.18° N, 123.18° W), (a2) and (b2) the Rhine River (51.84° N, 6.11° E), and (a3) and (b3) the Mississippi River (32.25° N, −91.25° W).
3.2 Temporal and spatial patterns of N flows
Input data for LSM_Nlateral_Off are provided by ORCHIDEE-CNP and ORCHIDEE-Clateral. Therefore, the magnitude and spatio-temporal patterns of N inflows from land to rivers are exclusively derived from these two model branches. In contrast, the quantification of denitrification and N exports to oceans results from the combined influence of the input data from ORCHIDEE and from the process representation implemented in LSM_Nlateral_Off. In the following, we investigate spatial, seasonal, and decadal trends resulting from the offline coupling of these three models.
3.2.1 Trends in global N flows
Averaged over the 1995–2014 period, the annual TN input from soils to rivers, TN exports to oceans, and denitrification in transit amount to 64.4, 40.0, and 24.4 Tg N yr−1, respectively. These three N fluxes show increasing trends from 1901 to 2014. The global annual TN input to rivers increased by 72.4 %, from 37.4 Tg N yr−1 during 1901–1920 to 64.4 Tg N yr−1 during 1995–2014 (Fig. 6a). The global annual TN export to oceans increased by 45.6 % from 27.4 to 40.0 Tg N yr−1. Most of this increase is attributed to DIN, which doubled over the simulation period, rising from 10.0 to 19.9 Tg N yr−1, while, in absolute terms, DON exports show a much smaller but still substantial relative increase of 50.6 % (Fig. 6b). In contrast, PON exports to oceans show a slightly decreasing trend. This decrease is mainly attributed to global greening, which enhances vegetation cover (Cortés et al., 2021; Wang et al., 2022) and reduces soil erosion, resulting in lower PON inputs from the land and, thus, PON exports to oceans. The increase in global denitrification mostly follows the rise in DIN inputs, with a relative increase of 146.6 %, from 9.9 Tg N yr−1 during 1901–1920 to 24.4 Tg N yr−1 during 1995–2014 (Fig. 6a).
The global TN input into rivers, TN export to oceans, and denitrification in rivers all show a slight peak between 1926 and 1931 due to the relatively higher surface runoff during this period (Fig. S9). This higher runoff results mostly from meteorological forcings, as the global total amount of heavy rainfall (> 25 mm d−1) was higher during this period (Fig. S9). Note that Probst and Tardy (1989) provide empirical evidence for elevated global runoff during this period, and we thus consider this peak to be realistic.
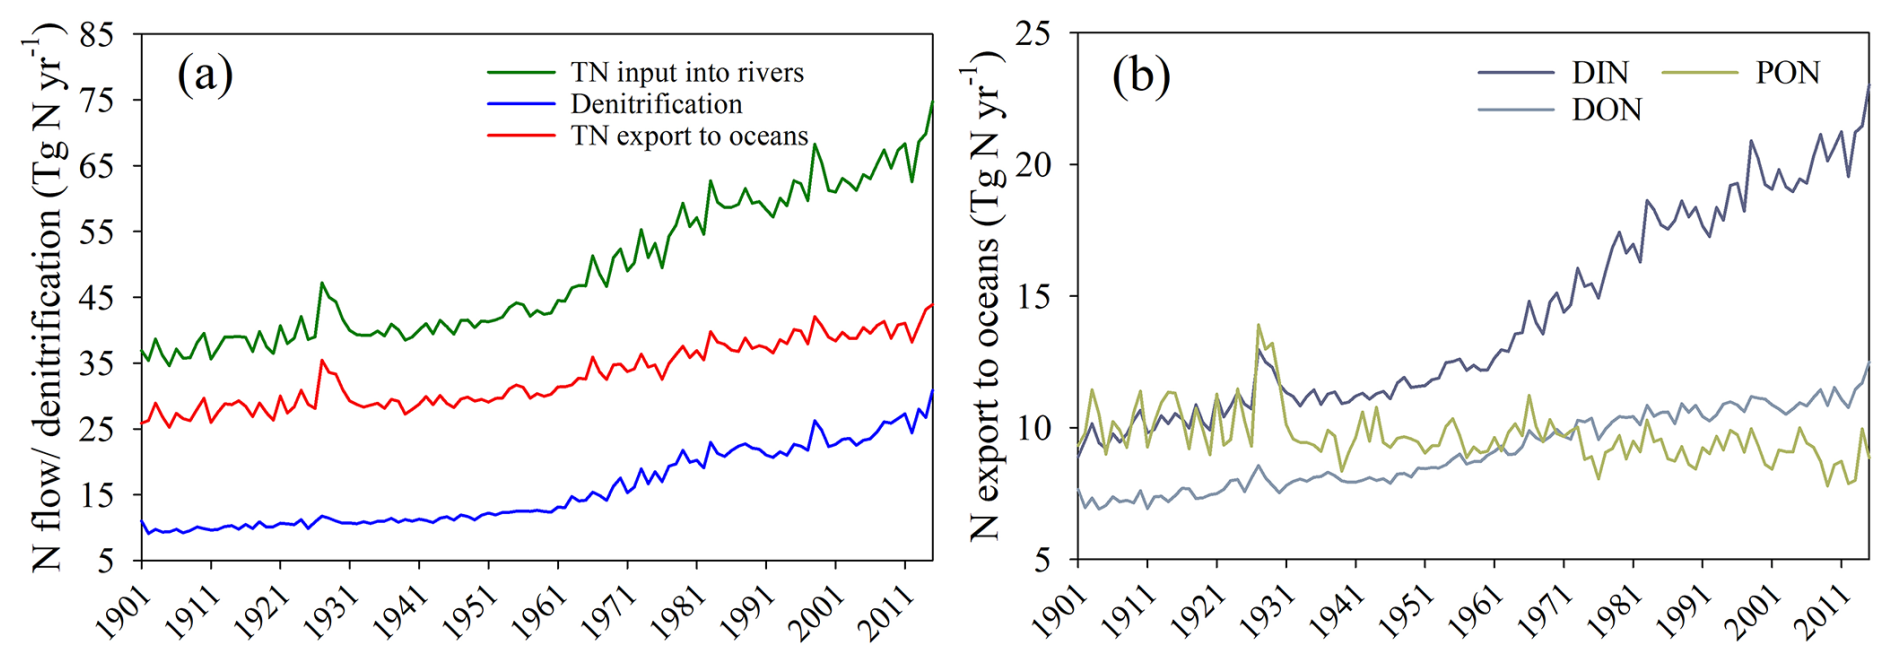
Figure 6Trends in global N flows during 1901–2014: (a) yearly mean TN inputs into rivers, TN exports to oceans, and denitrification rates and (b) yearly mean DIN, DON, and PON exports to oceans. TN: total nitrogen; DIN: dissolved inorganic nitrogen; DON: dissolved organic nitrogen; PON: particulate organic nitrogen.
3.2.2 Spatial patterns in N flows and concentrations
In this section, we examine the spatial distribution of contemporary N flows and their changes compared to the early 20th century. Given the rapid increase in N flows since 1960 and the interannual variability induced by climate, we use the 1995–2014 average to represent contemporary N flows and the 1901–1920 average to represent early 20th-century conditions.
Annual mean TN input into rivers during 1995–2014 shows large spatial heterogeneity, with higher values mainly located in eastern North America, South America, western Europe, tropical Africa, South Asia, Southeast Asia, and southeast China (Fig. 7a). When compared with 1901–1920, TN inflow into rivers increased in most areas (about 62 %), with the highest increase (exceeding 300 %) appearing in China, the United States, Canada, Germany, France, and Spain (Fig. 8a). The annual mean contemporary denitrification rates (1995–2014) also exhibit large spatial heterogeneity (Fig. 7b) with high denitrification rates in large tropical and subtropical rivers, such as the Amazon, Nile, and Congo rivers. Over the entire simulation period, the grid cells with the highest relative denitrification increases are mostly located in the subtropical and north temperate zone (Fig. 8b).
The TN export to oceans during 1995–2014 also varies substantially across regions (Fig. 7c). The riverine TN exports are relatively low for the Arctic Ocean; the western and southern coasts of Australia; and the coastal zone adjacent to desert areas in South America (e.g. the Atacama Desert and the Patagonian Desert), Africa (the Sahara Desert and the Namib Desert), and Asia (e.g. the Arabian Desert, the Thar Desert in India, the deserts of eastern Iran, and the Syrian Desert) (Fig. 7c). In contrast, the Amazon region in South America, the African rainforest region, western Europe, South Asia, and southeast China are prominent hotspots of riverine TN exports (Fig. 7c). Unsurprisingly, TN exports to oceans have increased in approximately half of the coastal areas since the early 20th century (Fig. 8c). In several regions, such as the southeastern coastal areas of China and the eastern coast of the United States, TN exports to oceans have even increased by more than 100 % from 1901–1920 to 1995–2014 (Fig. 8c).
The annual mean contemporary concentration of TN at river mouths also exhibits significant spatial heterogeneity (Fig. 7d), which differs from that of TN export to oceans (Fig. 7c). For instance, the Amazon region is one of the hotspots for TN exports, but its TN concentrations are low (< 1 mg L−1) because the water discharge and denitrification rates are both high (Figs. 7b, S10a). The highest TN concentrations (> 5 mg L−1) are found in areas with intense human activity, for example the San Francisco area, Chile, Spain, Egypt (Nile River estuary), and the southeastern coastal areas of China (Bu et al., 2019; Hou et al., 2022; Yang et al., 2023).
The spatial distribution of changes in TN concentrations from 1901–1920 to 1995–2014 differs from that of TN exports (Fig. 8c, d). For example, along the western coast of Chile and the western coast of Guinea, Sierra Leone, and Liberia, TN exports to oceans decreased by more than 10 %, while TN concentrations increased by more than 10 % (Fig. 8c, d). This phenomenon is due to negative trends in water discharge from the corresponding watersheds (Fig. S10b). In most regions, the ratio of changes in TN fluxes to changes in TN concentrations ranges between 0 and 10, indicating that TN flux changes are driven by the combined effects of changes in water discharge and TN concentrations (TN inputs into rivers) (Fig. 9).
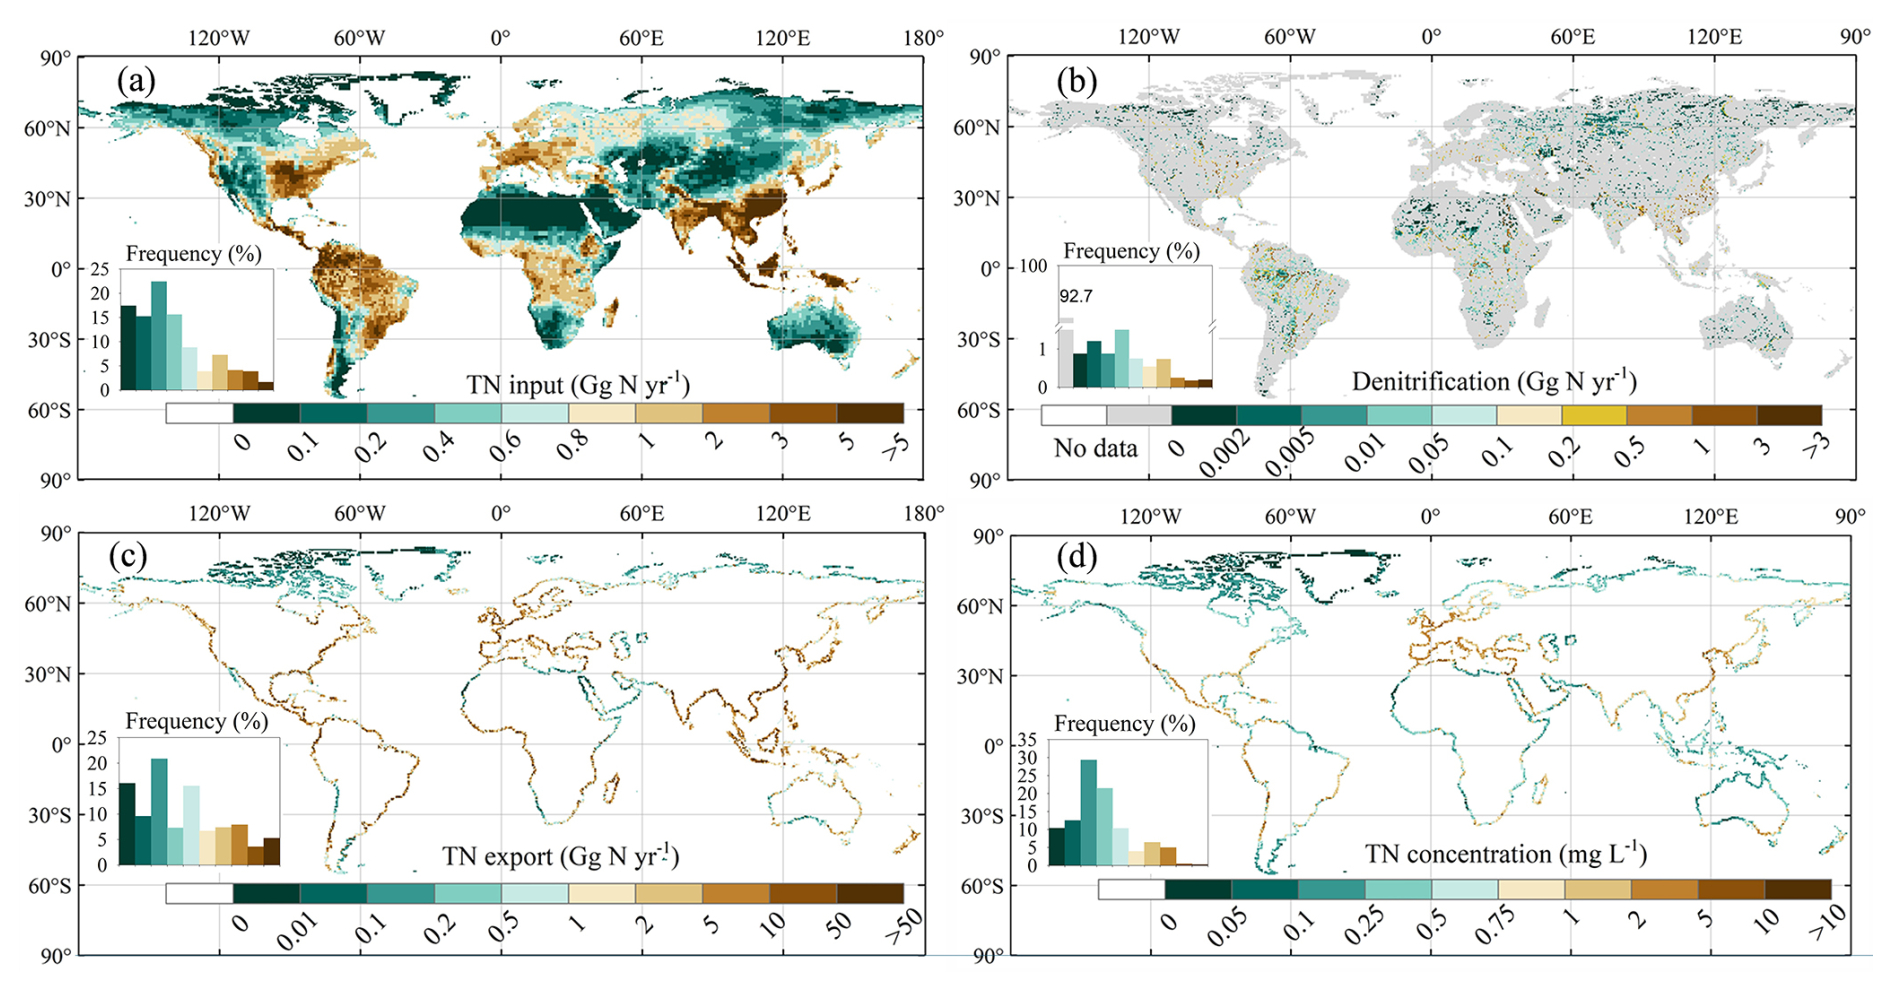
Figure 7Spatial patterns of annual mean N fluxes and concentrations during 1995–2014: (a) TN inputs into rivers, (b) denitrification rates in rivers, (c) TN exports to oceans, and (d) TN concentrations at river mouths. To display the spatial patterns of denitrification in rivers better, we excluded data with denitrification rates less than 0.001 Gg N yr−1 per grid.
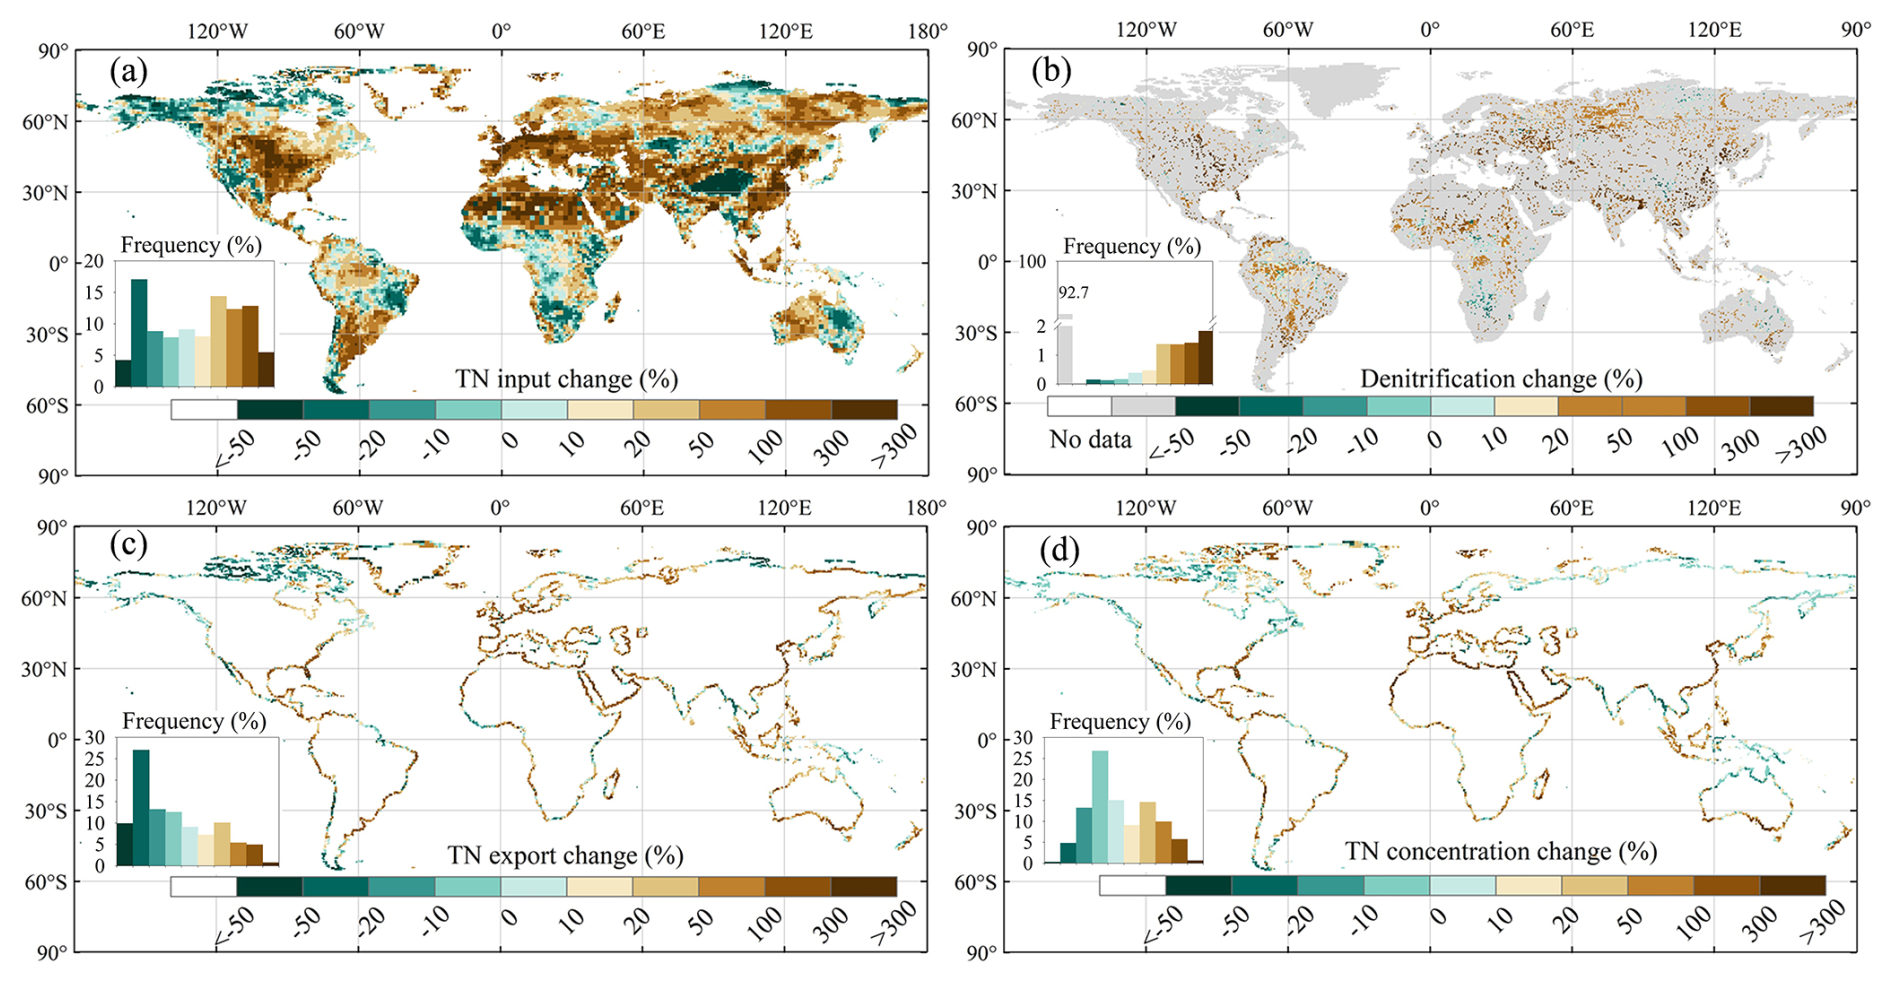
Figure 8Spatial patterns of changes from 1901–1920 to 1995–2014 of (a) TN inputs into rivers, (b) denitrification, (c) TN exports to oceans, and (d) TN concentrations.
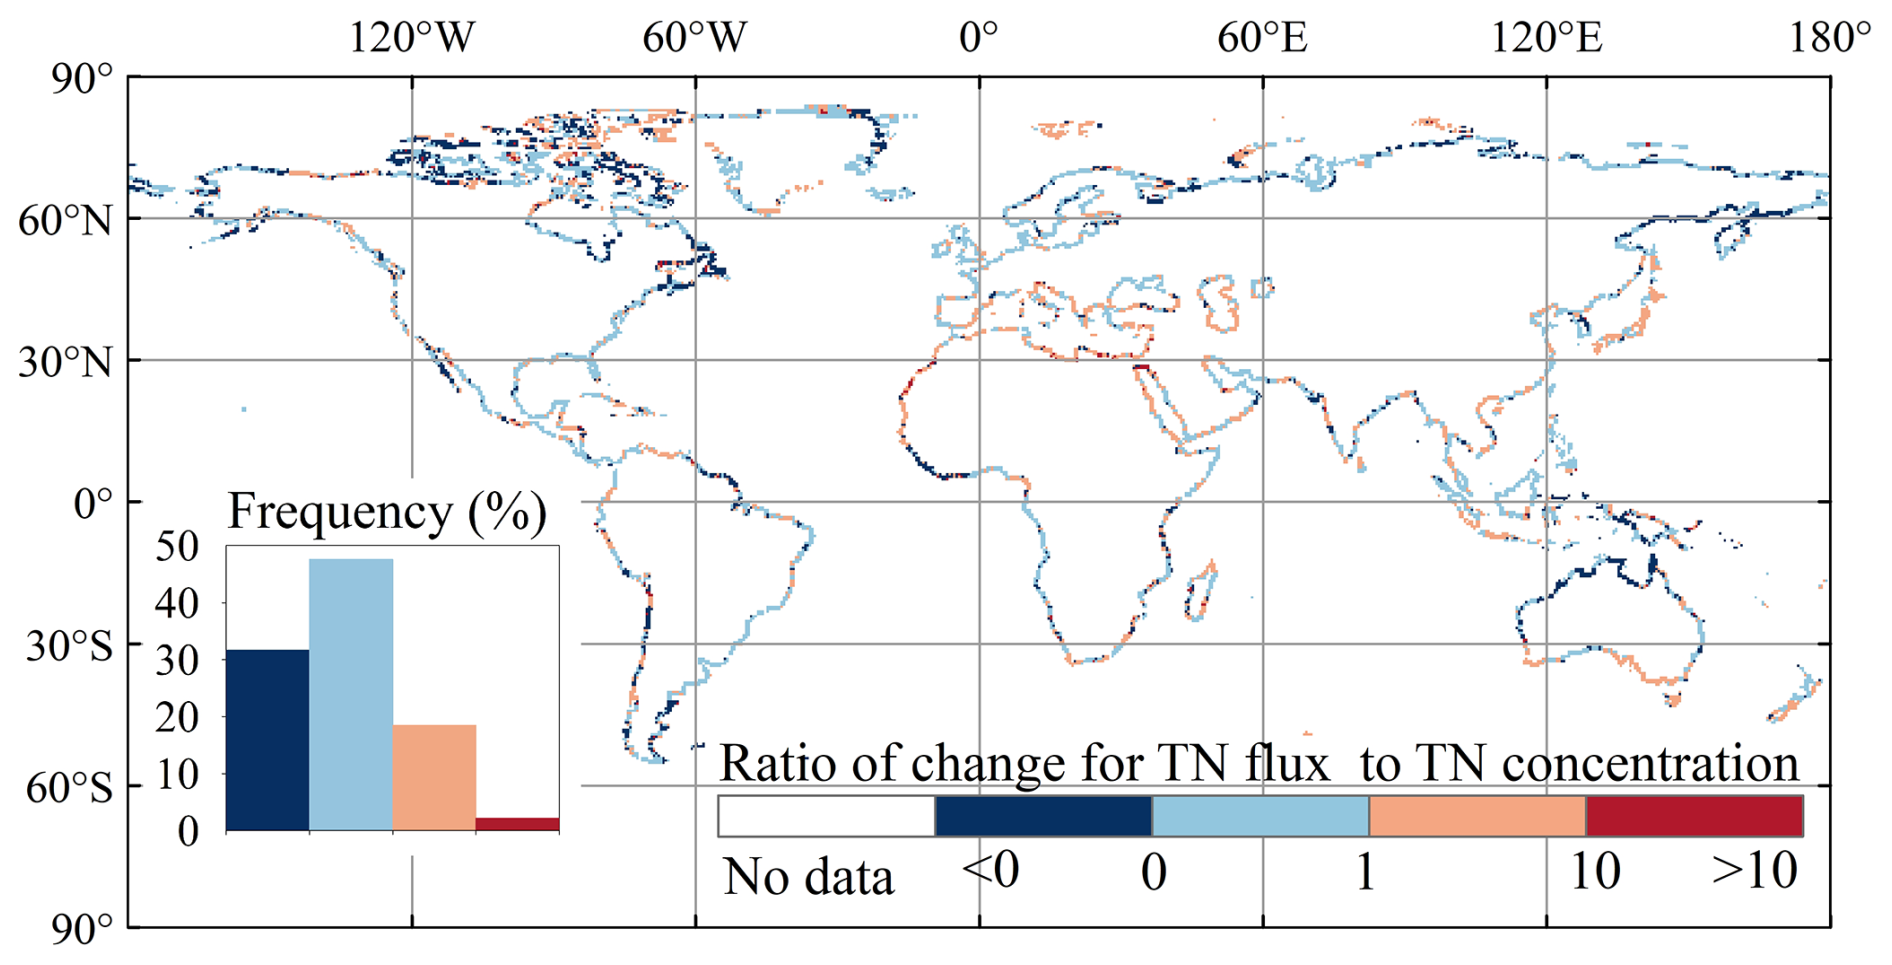
Figure 9Ratio of changes in TN exports to changes in TN concentrations from 1901–1920 to 1995–2014.
3.2.3 Seasonal variability in N flows and concentrations
The seasonality of TN inputs into rivers during the period 1995–2014 is most pronounced in the central United States, Europe, South Asia, Southeast Asia, and southeast China (Fig. 10a). The frequency distribution of the seasonal amplitude in inputs (Fig. 10a) is broadly similar to that of the mean annual inputs (Fig. 7a), suggesting a seasonal variability of similar magnitude to the broad, global-scale spatial variability. A similar pattern is observed for denitrification rates, with seasonal and spatial variations of comparable magnitudes (Figs. 7b, 10b).
The seasonal amplitudes of TN exports to oceans during the period 1995–2014 show the highest values (> 10 Gg N yr−1) along the coasts of South Asia, southeast China, and Mexico and to a lesser extent (1–10 Gg N yr−1) along the coastline of the Amazon region, the rainforest regions of Africa, and western Europe (Fig. 10c). As expected, a significant portion of this seasonal variability is due to river discharge (Fig. S11a). Our results indicate that the spatial pattern of seasonal amplitudes in TN concentrations at river mouths differs from that of TN exports (Figs. 10, S12, S13). This result is important because the ocean biogeochemical modelling community typically uses annual mean TN fluxes derived from Global News to force their simulations (e.g. Lee et al., 2016b; Stock et al., 2020; Tjiputra et al., 2020; Lacroix et al., 2021) and downscales these inputs to monthly values under the assumption that the seasonal variability in the flux is entirely driven by river discharge. Our simulations thus stress the need for models that explicitly resolve the seasonal variability in fluxes and concentrations.
We also normalised the seasonality by the mean value of N flux or concentrations. For TN inputs into rivers, denitrification, and TN exports, the normalised seasonal maps all show higher values in the middle and high latitudes of the Northern Hemisphere and lower values in the low latitudes and the Southern Hemisphere (Fig. S12). Moreover, the regional-scale heterogeneity in the normalised seasonality of TN concentration is a little weaker than that of the TN flux (Figs. S12c and d).
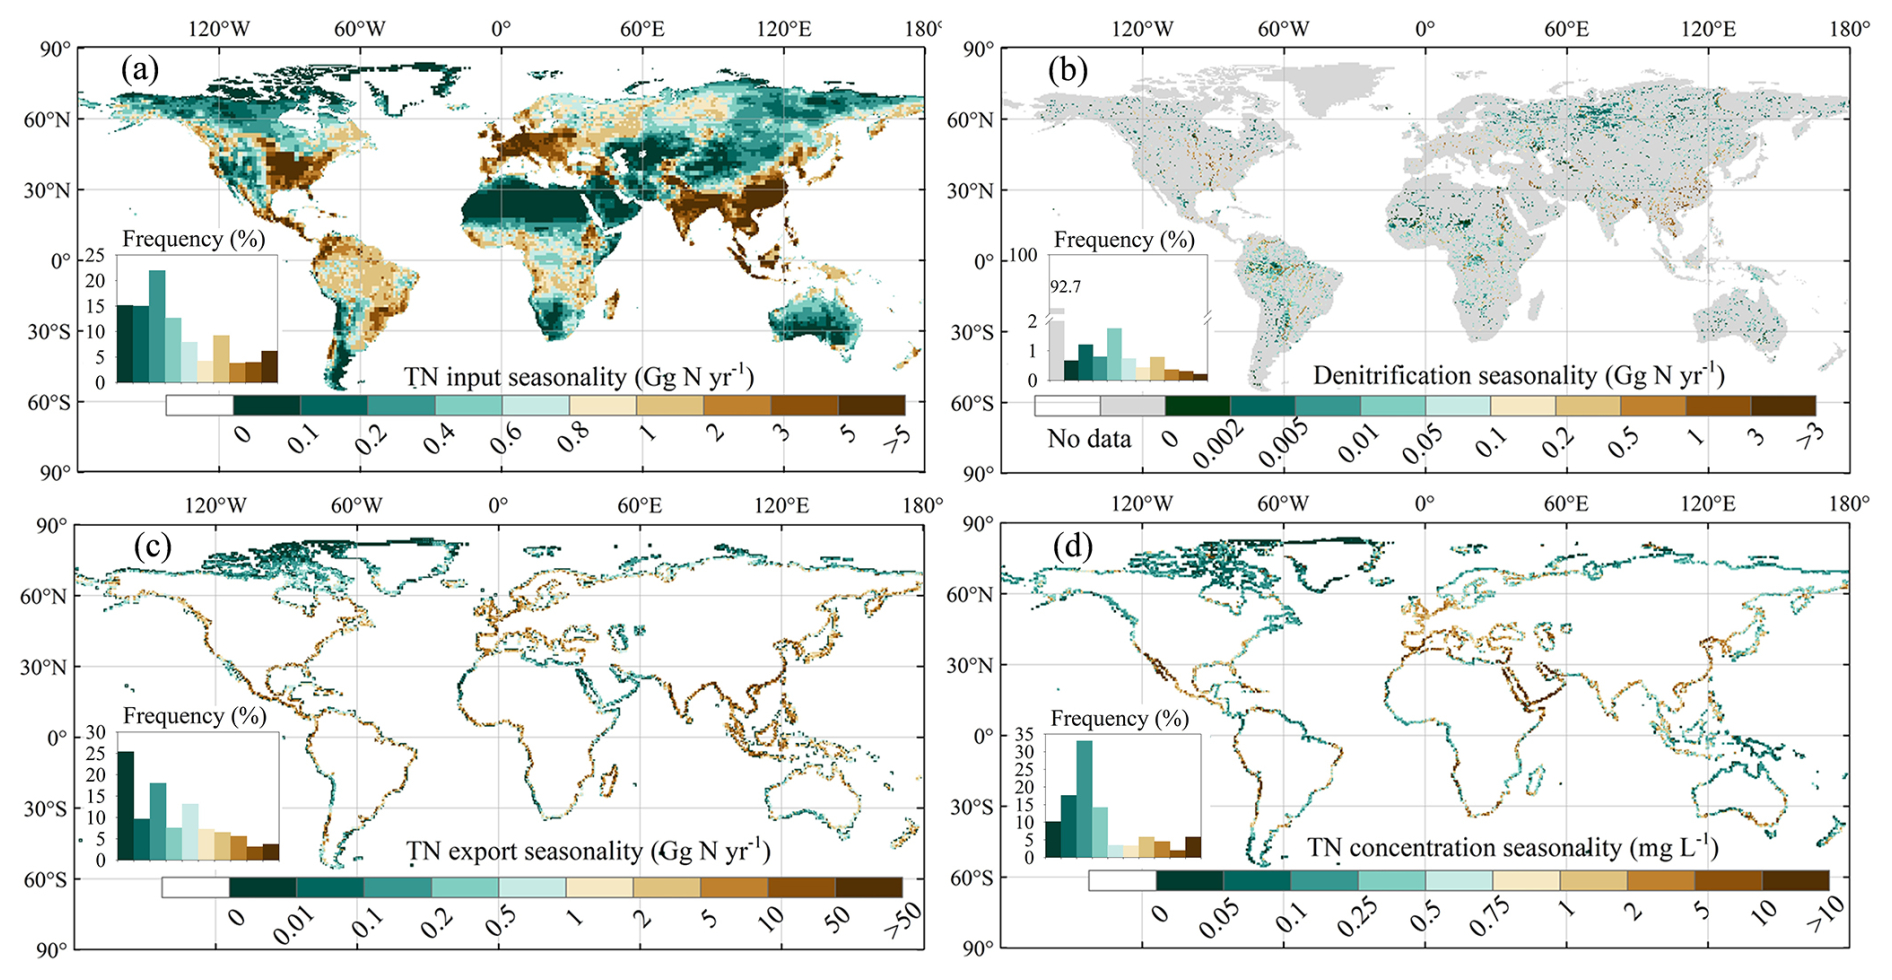
Figure 10Spatial distribution of the seasonal amplitude (period 1995–2014) in (a) TN inputs into rivers, (b) rates of denitrification, (c) TN exports to oceans, and (d) TN concentrations at river mouths.
3.3 Comparison with other models
We compared the trends of global DIN input into rivers simulated by ORCHIDEE-CNP with those generated by the recently published IMAGE-GNM model (Vilmin et al., 2018). Overall, both models capture a similar increasing trend in global DIN delivery from land to rivers during 1901–2001 (Fig. 11a). During 1961–2000, the global-scale interannual variability in DIN simulated by ORCHIDEE-CNP is comparatively stronger than that simulated by IMAGE-GNM (Fig. 11a). This discrepancy may be partially explained by differences in the temporal resolution of the two models (daily for ORCHIDEE-CNP, yearly for IMAGE-GNM) and the associated climate forcings. In other words, ORCHIDEE-CNP calculates the annual means from daily fluxes, whereas IMAGE-GNM does not resolve the intra-annual variability. In contrast, the organic nitrogen (ON = PON + DON) fluxes simulated by ORCHIDEE-Clateral and derived from IMAGE-GNM differ significantly. The ON inflow simulated by IMAGE-GNM shows a substantial increase from 24.9 Tg N yr−1 during 1901–1910 to 37.9 Tg N yr−1 during 1991–2000, while ON simulated by ORCHIDEE-Clateral exhibits a weaker increasing trend over the same period, from 26.5 to 32.4 Tg N yr−1. The weaker trend in ORCHIDEE-Clateral can primarily be explained by the increasing DON inflow being offset by a decreasing PON inflow (Fig. 11c). The fundamental reason for the discrepancy among the two models stems from their distinct structures and algorithms. In ORCHIDEE-Clateral, the ON flows into rivers are calculated separately for the dissolved and particulate compounds using a process-based representation of the soil C stock dynamics and C : N ratios, as well as the rates of runoff and drainage. The approach is different in IMAGE-GNM, which calculates the bulk ON flows (DON + PON) based on empirical formulas (Vilmin et al., 2018). Specifically, IMAGE-GNM calculates ON delivery from land to rivers with drainage based on the TN delivery rate with drainage, assuming that 50 % of TN flux is in the form of ON. For ON flows into rivers with runoff, IMAGE-GNM distinguishes two runoff mobilisation pathways, i.e. losses from recent nutrient applications in the form of fertiliser and manure, and a memory effect related to long-term historical changes in soil nutrient inventories. These two pathways both are simulated based on empirical formulas (Vilmin et al., 2018). In ORCHIDEE-Clateral, the default C : N ratio in different SOM pools was used to calculate the PON erosional fluxes from soils using a process-based approach, and a constant C : N ratio (averaged values from references) was applied to simulate DON flows out of soils. The assumption of a constant C : N ratio for dissolved matter in soil may contribute to the weaker trend in ON delivery to rivers simulated by LSM_Nlateral_Off, since some studies have revealed that DOC : DON ratios vary with time and land cover (Li et al., 2019; Yates et al., 2019).
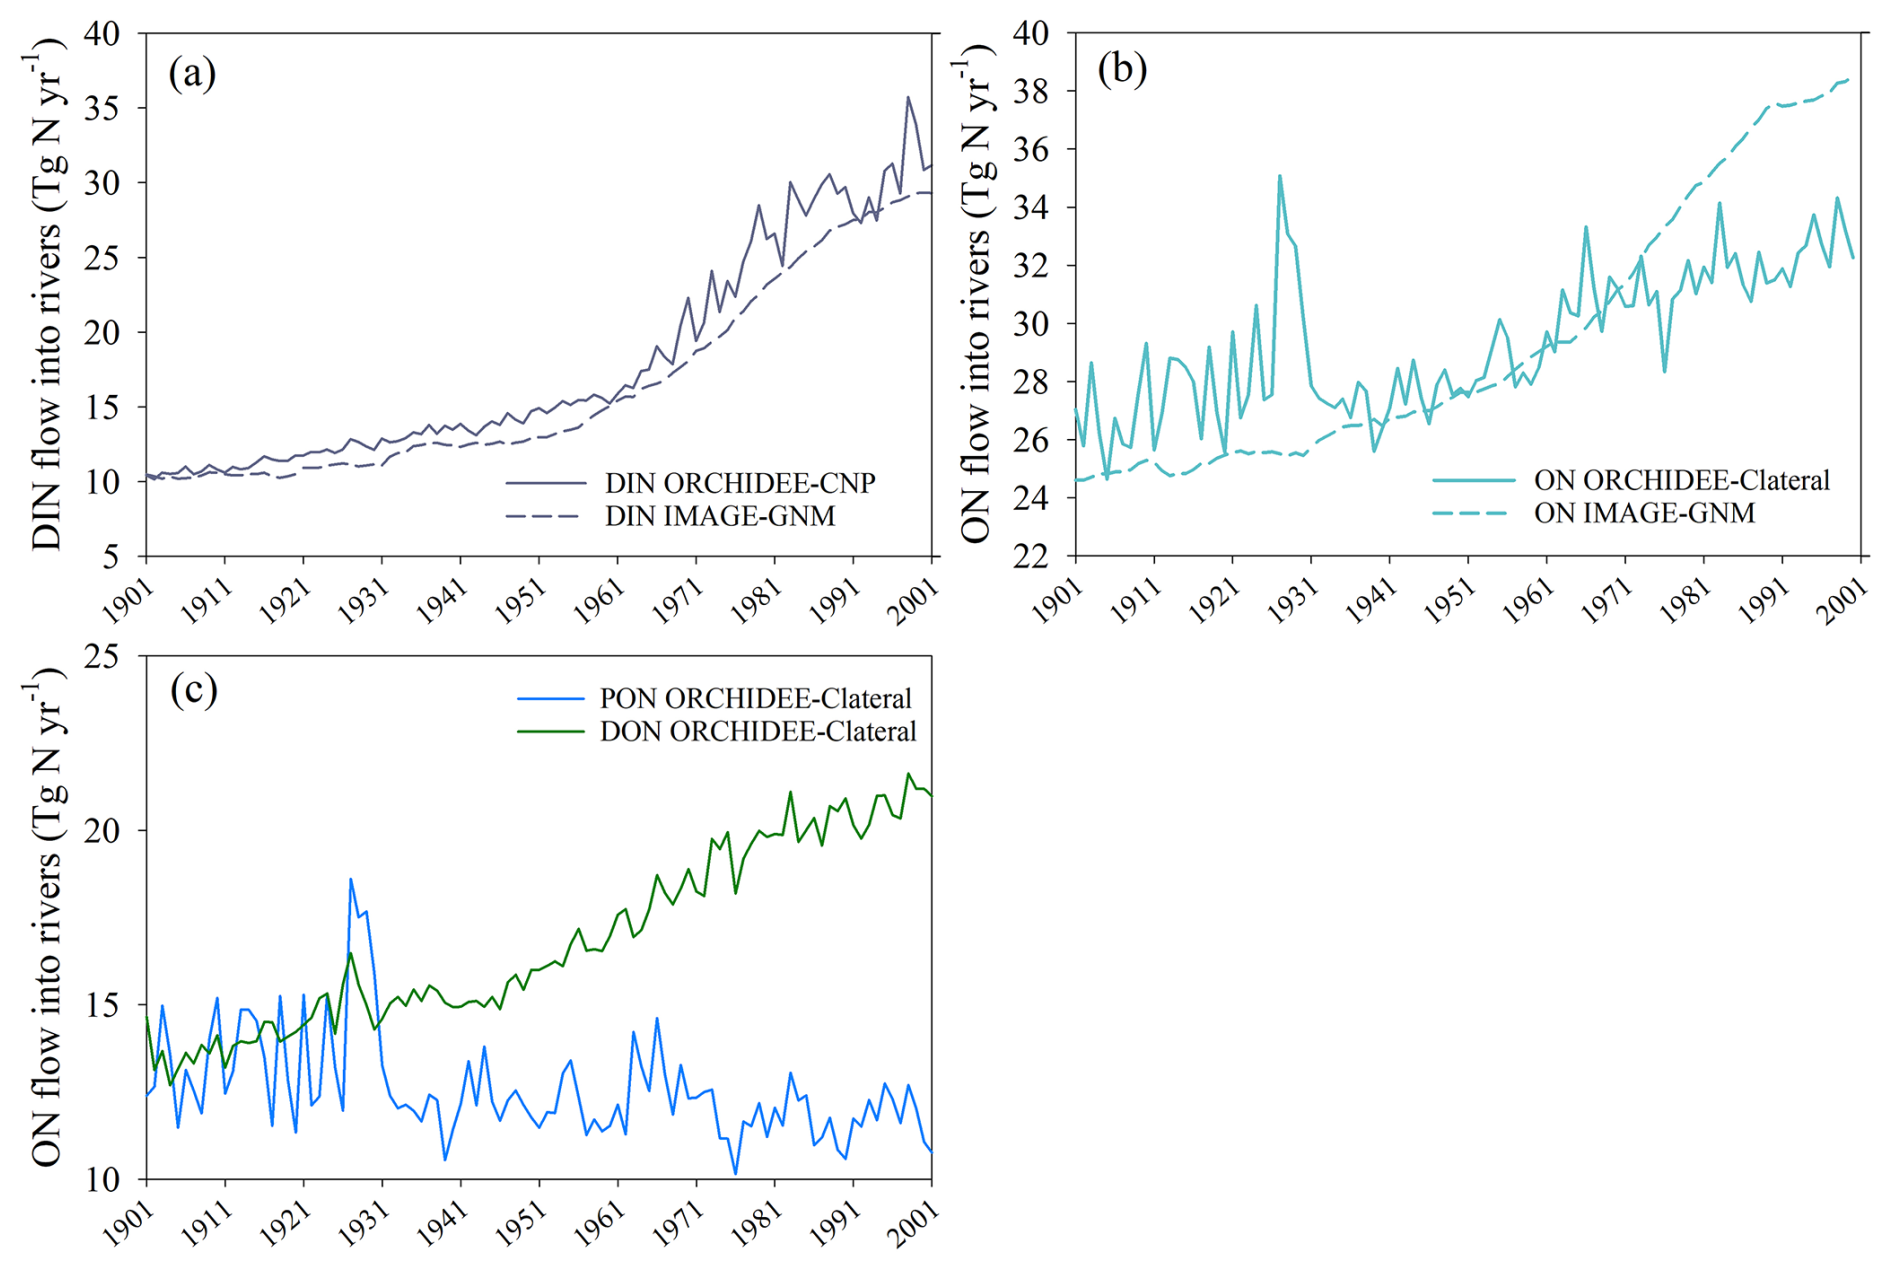
Figure 11Global terrestrial N flows into rivers during 1901–2001 simulated by ORCHIDEE model versions and IMAGE-GNM (Vilmin et al., 2018): (a) DIN, (b) ON (DON + PON), and (c) DON and PON derived from ORCHIDEE-Clateral.
The simulated lateral N flows from land to rivers and N exports to oceans in this study are now compared with those simulated by other models across different time horizons, noting that each model covers different time periods (Fig. 12). Focusing first on the global N flows from land to rivers, we find that for different time horizons, the N inputs used as forcings for LSM_Nlateral_Off (i.e. simulated by ORCHIDEE-Clateral and ORCHIDEE-CNP) are very close to those estimated by IMAGE-GNM (Vilmin et al., 2018) and FrAMES-N (Wollheim et al., 2008), with differences between our simulations and other models never exceeding 7 % across different time horizons. Although the fraction of DIN in TN over 1901–1910 simulated by LSM_Nlateral_Off (27 %) is slightly lower than that of IMAGE-GNM (29 %), the DIN fractions simulated by these two models both show obvious increasing trends with time, LSM_Nlateral_Off and IMAGE-GNM reporting DIN fractions for the 1991–2000 period reaching 48 % and 43 %, respectively (Fig. 12a). These results are consistent with a comprehensive cross-biome assessment of N composition in rivers that also revealed a shift in the dissolved N from highly heterogeneous to primarily inorganic N in response to human disturbances (Wymore et al., 2021). This change in the composition of TN inputs from land to rivers is primarily caused by the excess inorganic N released from agricultural (due to the utilisation of fertilisers) and urban (due to the release of sewage) areas.
The global N export from rivers to oceans simulated by LSM_Nlateral_Off is also comparable to estimates from other models. During 1901–1910, the global riverine N export to oceans is 29.0 Tg N yr−1, a value that falls within the range simulated by IMAGE-GNM (19.0 Tg N yr−1; Vilmin et al., 2018) and DLEM (29.4 Tg N yr−1; Tian and Li, 2024) (Fig. 12b). For the most recent period (2000s), the simulated riverine N export to oceans is converging, with differences of less than 10 % compared to other models such as GlobaNEWS2 (Mayorga et al., 2010), IMAGE-GNM, and DLEM (Fig. 12b). Although the global riverine TN export to oceans simulated by LSM_Nlateral_Off is close to that simulated by GlobalNEWS2 (1970–2010), the TN export reported here contains a slightly larger fraction of DIN and a slightly lower fraction of PON compared to GlobalNEWS2 (Fig. 12b).
The TN export to oceans simulated by LSM_Nlateral_Off and GlobalNEWS2 is also comparable at continental scale (Fig. 13a), with the largest TN exports from Asia and the lowest exports from Australia. However, the simulated proportions of N species in the overall TN export show distinct behaviours between these two models. For example, compared to GlobalNEWS2, the DIN proportion in TN exports simulated by LSM_Nlateral_Off is larger in Asia, Africa, and South America but smaller in Europe (Fig. 13a).
The magnitude of TN exports simulated by LSM_Nlateral_Off and GlobalNEWS2 continues to diverge at basin scale (Fig. 13b). In 8 of the top 20 basins by area, the difference between the two models is less than 50 %, such as in the Congo, Mississippi, Ob, Paraná, Yenisei, Changjiang, Mackenzie, and Nelson basins. Larger discrepancies can however be observed in several large river systems. For instance, in the Amazon basin, the TN export simulated by GlobaNEWS2 is about 2.5 times larger than that simulated by LSM_Nlateral_Off. The evaluation of LSM_Nlateral_Off simulation results against measurements of TN flow rates in the Amazon River indicates that LSM_Nlateral_Off underestimates the TN flow in this basin (Fig. 4). At Manacapuru and Óbidos, two observation sites on the main channel of the Amazon River, the observed TN flow is 1.90 and 2.82 Tg N yr−1, but the simulated values are 0.92 and 1.57 Tg N yr−1, respectively. To evaluate whether this underestimation is caused by less TN inflow into rivers, we set the N transformation processes (decomposition of DON and PON and denitrification) in rivers to zero and found that the TN flows are 1.56 Tg N yr−1 at Manacapuru and 2.35 Tg N yr−1 at Óbidos. Therefore, even with no N removal, LSM_Nlateral_Off still underestimates the observed TN flows at these two sites, suggesting that N delivery from terrestrial ecosystems to rivers (as simulated by ORCHIDEE) is too low in the Amazon basin. In the Nile basin, the TN export simulated by LSM_Nlateral_Off is 30 times larger than that simulated by GlobalNEWS2. Observed annual exports of DIN and DON amount to 0.079 and 0.038 Tg N yr−1, respectively (Badr, 2016). These observed values are of the same magnitude as those simulated by LSM_Nlateral_Off, 0.113 Tg N yr−1 for DIN and 0.048 Tg N yr−1 for DON. This finding suggests that LSM_Nlateral_Off better captures the observed N export for this specific basin than GlobalNEWS2.
It should be noted that GlobalNEWS2 and IMAGE-GNM both have an IMAGE part to simulate N inputs into inland rivers but were developed using different hydrological models and different methods to calculate N transport and retention along the global river network. The hydrological model embedded in GlobalNEWS2 is the water balance model (WBMplus) (Fekete et al., 2010), and the NEWS models were then developed to calculate nutrient retention in streams and reservoirs (Seitzinger et al., 2005, 2010; Mayorga et al., 2010). The hydrological model used in IMAGE-GNM is the PCRaster Global Water Balance (PCR-GLOBWB) (Van Beek et al., 2011), and IMAGE-GNM then applied the nutrient spiralling approach (Newbold et al., 1981) to describe in-stream retention of both N and P with a yearly time step (following Wollheim et al., 2008).
In summary, the global total N input to rivers and N export to oceans simulated by the different models are comparable, but the spatial distribution of N export to oceans at finer spatial scales shows increasing discrepancies, as does the chemical speciation. This is mainly due to differences in model structures, spatial and temporal resolutions, and forcing data. Although our model has been evaluated against the largest dataset of river discharge and N concentrations from the recently assembled global GRDC and GRQA database, significant cross-model discrepancies emerge as the analysis is refined to regional patterns and individual river basins. This highlights the necessity for improvements in model structure and quality of both forcing data and evaluation data, as well as the implementation of ensemble-mean assessments, akin to the recent approach applied to constrain carbon exports to the oceans (Liu et al., 2024).
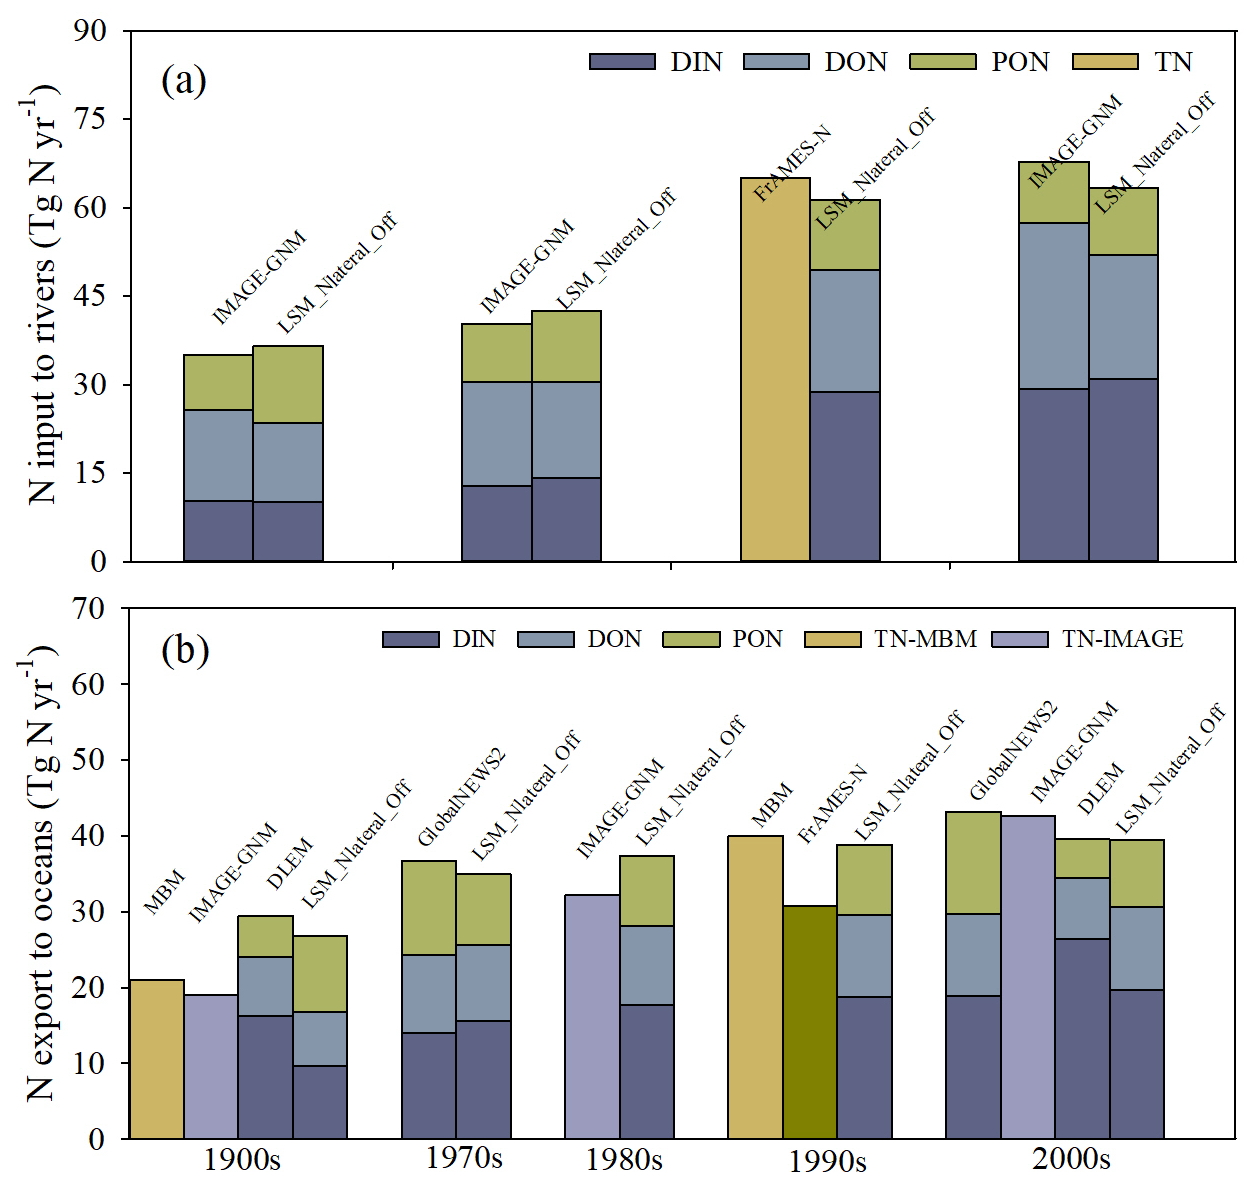
Figure 12Comparison of global TN fluxes estimated by different models: (a) global TN inputs to rivers and (b) global TN exports to oceans. IMAGE-GNM: Integrated Model to Assess the Global Environment – Global Nutrient Model (Vilmin et al., 2018); FrAMES-N: Framework for Aquatic Modeling in the Earth System (Wollheim et al., 2008); MBM: mass balance model (Green et al., 2004); GlobalNEWS2: Global Nutrient Export from Watersheds 2 (Mayorga et al., 2010); and DLEM: Dynamic Land Ecosystem Model (unpublished, Tian and Li, 2024).
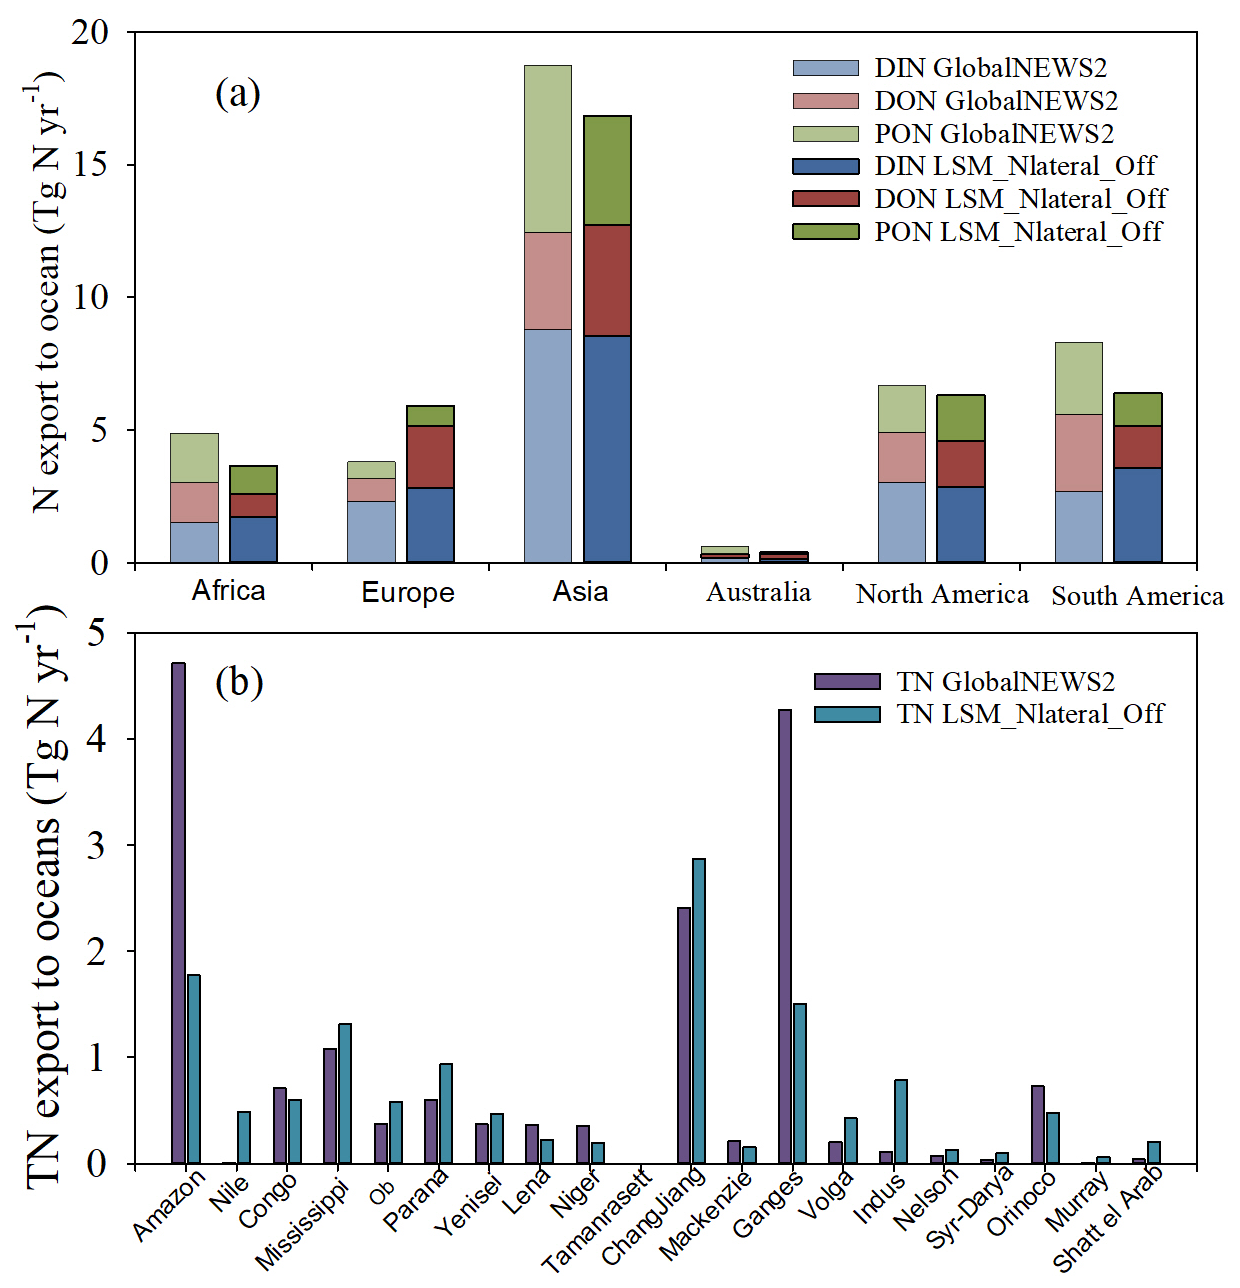
Figure 13Comparison of present-day (2001–2010) TN export to oceans simulated by LSM_Nlateral_Off and GlobalNEWS2 (Mayorga et al., 2010) at (a) continental scale and (b) basin scale.
3.4 Model limitations and priorities for future research
LSM_Nlateral_Off currently relies on a simplified representation of the N processes in benthic sediments and water without explicit simulation of the hyporheic exchange between sediments and water. The importance of these processes is estimated using a scaling factor based on water depth, which itself relies on a coarse approximation of the stream channel geometry based on empirical formulas (Raymond et al., 2012). Global-scale databases on the geomorphic properties of river channels, including river depth and width, are available (Andreadis et al., 2013) and could be used in the future to further refine the representation of N processes in river channels, including the hyporheic exchange between sediments and water. The residence time method was used to estimate water and N transport within river networks. This method is simple and has been widely used in large-scale simulations of fluvial water, carbon, and N transports (Beusen et al., 2015; Jepsen et al., 2019; Zhang et al., 2022). However, it may not fully capture the seasonality of water and N flows accurately in some regions (Fig. 5a2 and b2). To improve the accuracy of simulating fluvial water and N transport, the residence time method currently used in LSM_Nlateral_Off could be replaced with hydrological kinetic equations in future versions of the model.
The current version of LSM_Nlateral_Off also has several limitations in terms of biogeochemistry. One limitation is the use of a constant C : N ratio to simulate DON fluxes from soils to rivers. Research has shown that the C : N ratio varies over time and across different land cover types (Li et al., 2019; Yates et al., 2019). The use of a constant C : N ratio may thus reduce the accuracy and informativeness of the estimated DON flux. Addressing this limitation is an urgent priority for future research.
At present, few studies have accounted for the effects of PON deposition and resuspension on lateral N transfer in rivers because of the challenge of representing these processes at the global scale. Moreover, PON deposition is mainly controlled by the rate of sediment deposition, a process which is not represented in the current model version. Therefore, PON deposition has not been simulated either. Recent results from ORCHIDEE-Clateral suggest that about 22 % of POC entering the global river network is deposited with sediments before reaching the coast (Zhang et al., 2025). Assuming a similar fraction of deposited PON, global PON export to oceans simulated by LSM_Nlateral_Off could be approximately 20 % lower (about 2 Tg N yr −1) than estimated here.
The role of autotrophic production is another process currently omitted. Autotrophs (aquatic macrophytes, algae, cyanobacteria, bryophytes, some protists, and bacteria) in freshwater systems take up DIN from the water column (King et al., 2014) and may play a significant role in N cycling within rivers (Wachholz et al., 2024). In future model developments, the role of autotrophic production in N retention should thus be considered, although the large dominance of the heterotrophic metabolism on a global scale suggests that in situ aquatic production is a second-order control on N cycling (Battin et al., 2023). The transformation of PON to DON is also not included in the current version of LSM_Nlateral_Off. A previous study suggests that the in-stream transformation of POC to DOC is limited (about 0.3 %) (Zhang et al., 2022). It can thus be assumed that the fraction of PON transformed to DON is also rather negligible. Nevertheless, we plan to incorporate this transformation process into our model in the next phase of our research.
In the present version of LSM_Nlateral_Off, river–floodplain dynamics and channel erosion are currently not represented because of the incomplete understanding of how these processes affect lateral N transfer and the lack of reliable parameters from field studies to quantify their impacts at global scale. Floodplain inundation not only facilitates N inputs into rivers but also significantly influences N retention efficiency in rivers (Martí et al., 1997; Hanrahan et al., 2018) and N cycling (e.g. nitrification and denitrification) in flooded soils (Sánchez-Rodríguez et al., 2019; Hu et al., 2020). For instance, in the Jiulong River watershed in southeast China, flood events exported 47 % and 42 % of the annual land-derived ammonium (NH) and NO, respectively, although they only occurred 24 % of the time (Gao et al., 2018). This highlights the critical role of flood events in N transport and cycling, emphasising the need to incorporate floodplain processes in future model development.
LSM_Nlateral_Off includes the major sources of riverine N with runoff and drainage from natural, agricultural, and urban ecosystems (Fig. 1). Yet, several sources are still missing, for example atmospheric N deposition directly onto rivers and N release from aquaculture (Filoso et al., 2003; Bouwman et al., 2013; Beusen et al., 2016a; Gao et al., 2020), suggesting that the N exports to oceans simulated by LSM_Nlateral_Off might be conservative. On the other hand, N retention and recycling in lakes and artificial reservoirs are currently missing, which have the potential to decrease lateral N flows because they offer ideal conditions for N burial in sediment or permanent loss via denitrification (Saunders and Kalff, 2001; Harrison et al., 2009; Akbarzadeh et al., 2019). The absence of these processes in the current model may lead to an overestimation of N exports to oceans.
The forcing data used by LSM_Nlateral_Off (Table 1) introduce additional uncertainties into the simulation results. The routing scheme of water and N is driven by a map of streamflow direction at 0.5° spatial resolution (Vörösmarty et al., 2000). There are obvious discrepancies between this routing scheme and the real river network (Zhang et al., 2022). This deviation of flow direction induces uncertainties in the simulated riverine water discharge and N flow because the flow direction directly determines the area of each catchment and the routing of the river.
Finally, although LSM_Nlateral_Off effectively reproduces the magnitude and seasonal variations in water and N transfer from land to rivers and oceans (Figs. 4 and 5), spatial and temporal biases in observational data also affect the evaluation of model performance. Most observations of riverine N are distributed in North America, South America, and Europe, highlighting the crucial need to collect more measurements in other regions of the world, especially in Africa. In addition, despite the strong correlation between TN and NO concentrations, the application of an empirical equation (Eq. 15) to estimate TN from NO introduces additional uncertainties in the observational dataset (Pisani et al., 2017; Niu et al., 2022).
We developed a global N lateral transfer model from land to oceans through the river network, incorporating the decomposition of DON and PON and denitrification of DIN during fluvial transport. Evaluations using observational data from GRDC and GRQA indicate that LSM_Nlateral_Off reproduces observed rates and seasonal variations in water discharge and N flow well. The global simulation of LSM_Nlateral_Off shows that global TN inputs into rivers, TN exports to oceans, and riverine denitrification rates increased significantly over the last century. In particular, the TN exports to oceans increased from 27.5 Tg N yr−1 during 1901–1920 to 40.0 Tg N yr−1 during 1995–2014, with DIN contributing 80 % to the TN increase. Our results reveal significant spatial heterogeneity in the global distribution of N inputs, transformation, and exports to oceans, with East Asia and Southeast Asia identified as hotspots of N lateral transfers and their increase. The seasonal amplitude of TN export is of similar magnitude to the large-scale spatial heterogeneity in TN fluxes. Although the global- and continental-scale TN exports to oceans simulated by LSM_Nlateral_Off are similar to those of another widely used model (GlobalNEWS2), their spatial distributions at the basin scale reveal significant discrepancies. One key strength of LSM_Nlateral_Off is its ability to resolve N processes at the daily timescale, using a framework fully compatible with land surface model (LSM) outputs. This compatibility enables the model to account for the effects of climate change, atmospheric composition changes, land use change, and agricultural practices (e.g. manure and fertiliser use) in a fully consistent way.
LSM_Nlateral_Off has however its own limitations, and we plan to further enhance its capabilities with additional processes (e.g. autotrophy, variable C : N ratios, erosion and deposition on riverbed), additional sources (e.g. aquaculture, direct N deposition), and interconnections with other (semi-)aquatic and benthic systems (hyporheic zone, lakes, reservoirs, floodplains). Furthermore, additional observational data will be collected to further calibrate and evaluate LSM_Nlateral_Off. Last but not least, LSM_Nlateral_Off is currently being dynamically embedded into ORCHIDEE (Vuichard et al., 2019), the land surface scheme of the IPSL Earth System Model. This coupling opens new avenues towards fully coupled simulations of the land–ocean–atmosphere N cycle. Additionally, the current offline version of our model could also be easily coupled to other LSMs representing N cycling in terrestrial ecosystems, enabling broader applications and cross-model comparisons.
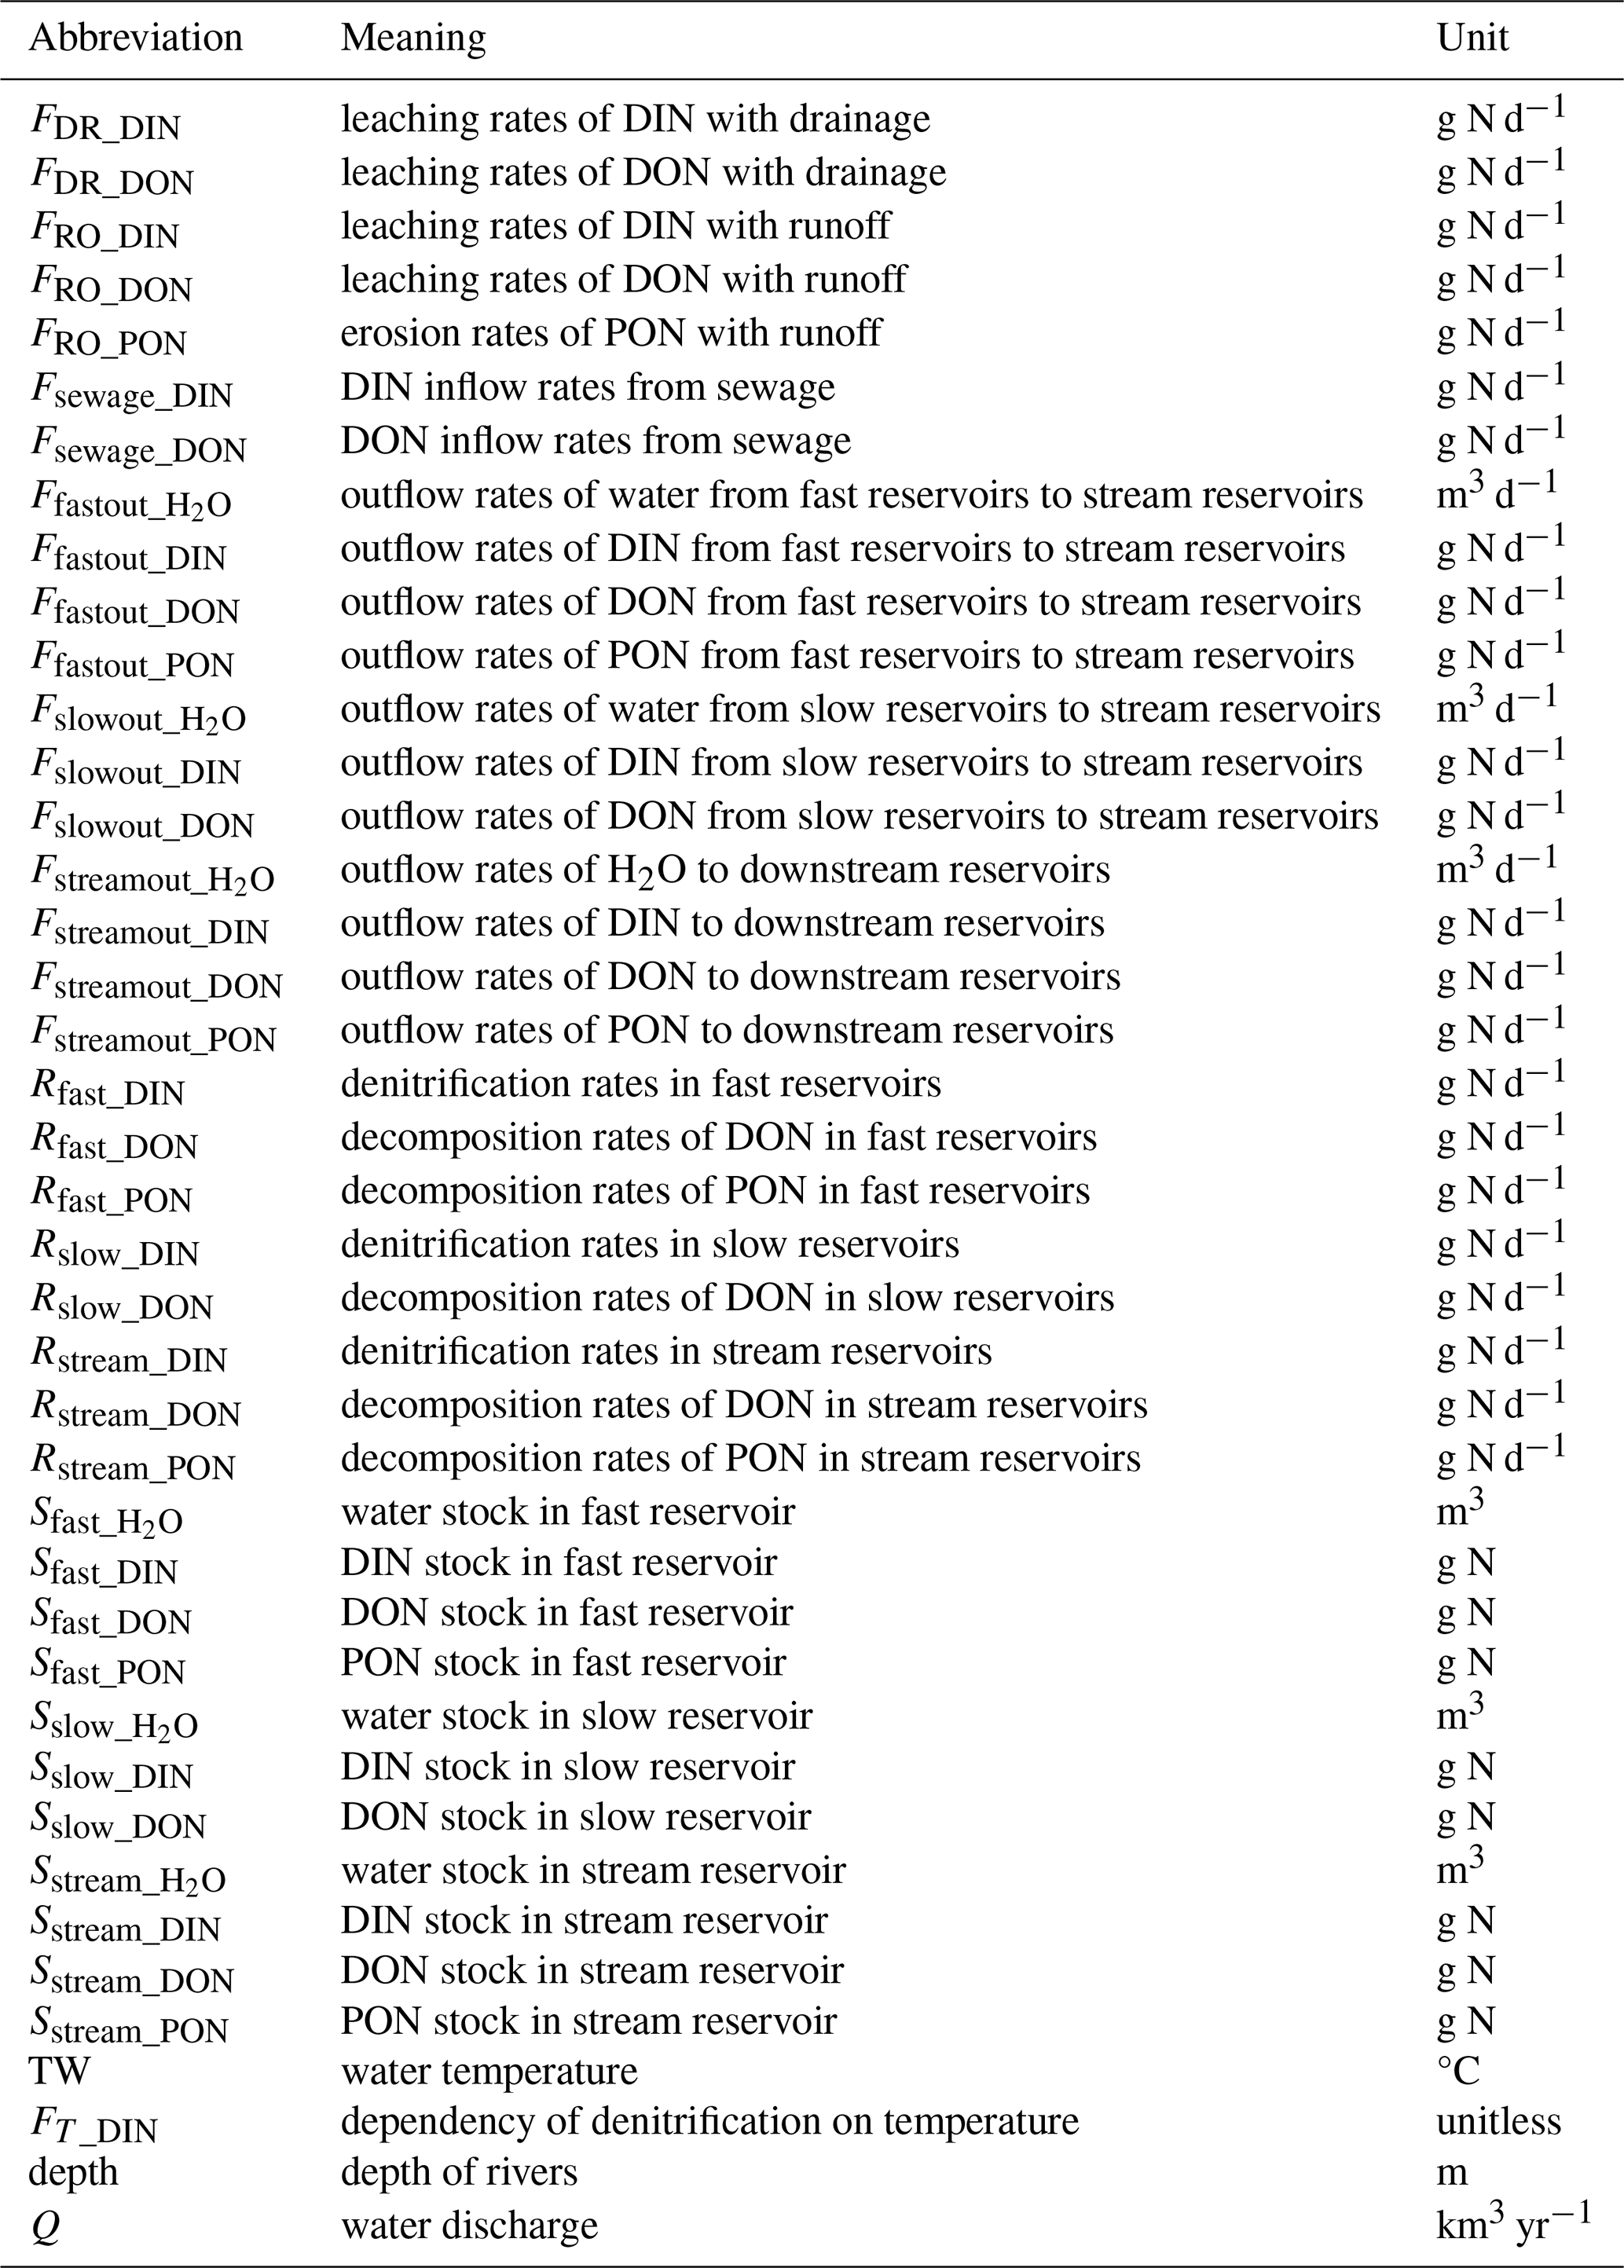
Table A2Values of the key parameters used in LSM_Nlateral_Off to simulate the lateral transfer of N.
The source code of the LSM_Nlateral_Off model is available online (https://zenodo.org/records/13309551, Ma, 2024). All forcing and validation data used in this study are publicly available online. The specific sources for these data can be found in Table 1.
The supplement related to this article is available online at https://doi.org/10.5194/esd-16-841-2025-supplement.
MM, HZ, RL, PR, and PC designed the study. MM and HZ conducted the model development and simulation experiments. PR, RL, and PC provided critical contributions to the model development and the design of simulation experiments. MM conducted the model calibration, validation, and data analysis. HZ, PR, RL, and PC provided support on collecting forcing and validation data. MM wrote the paper. All authors contributed to the interpretation and discussion of results and improved the paper.
The contact author has declared that none of the authors has any competing interests.
Publisher’s note: Copernicus Publications remains neutral with regard to jurisdictional claims made in the text, published maps, institutional affiliations, or any other geographical representation in this paper. While Copernicus Publications makes every effort to include appropriate place names, the final responsibility lies with the authors.
Minna Ma and Pierre Regnier acknowledge funding from the European Union's Horizon 2020 research and innovation program under grant agreement no. 101003536 (ESM2025 – Earth System Models for the Future). Pierre Regnier received financial support from BELSPO through the project ReCAP (which is part of the Belgian research programme FedTwin). Haicheng Zhang acknowledges the Fundamental and Applied Basic Research Fund of Guangdong Province, China (no. 2024A1515010929), and the Fundamental Research Funds for the Central Universities, Sun Yat-sen University (no. 31610004). Philippe Ciais and Ronny Lauerwald acknowledge support from the CLAND convergence institute funded by the National Research Agency of France “ANR” 16-CONV-0003. Philippe Ciais also acknowledges support of the CALIPSO project funded through the generosity of Eric and Wendy Schmidt by recommendation of the Schmidt Futures program. Ronny Lauerwald and Pierre Regnier further acknowledge funding under the “France 2030” programme with the reference ANR-22-PEXF-0009 (PEPR “FairCarboN” – project “DEEP-C”). We thank Hanqin Tian's team for providing the simulated data from DLEM.
This research was partially supported by the European Union's Horizon 2020 research and innovation program under grant agreement no. 101003536.
This paper was edited by Sibyll Schaphoff and reviewed by Zihao Bian and one anonymous referee.
Aitkenhead-Peterson, J. A., Alexander, J. E., and Clair, T. A.: Dissolved Organic Carbon and Dissolved Organic Nitrogen Export from Forested Watersheds in Nova Scotia: Identifying Controlling Factors, Global Biogeochem. Cy., 19, GB4016, https://doi.org/10.1029/2004GB002438, 2005.
Akbarzadeh, Z., Maavara, T., Slowinski, S., and Cappellen, P. V.: Effects of Damming on River Nitrogen Fluxes: A Global Analysis, Global Biogeochem. Cy., 33, 1339–1357, https://doi.org/10.1029/2019GB006222, 2019.
Alexander, R. B., Böhlke, J. K., Boyer, E. W., David, M. B., Harvey, J. W., Mulholland, P. J., Seitzinger, S. P., Tobias, C. R., Tonitto, C., and Wollheim, W. F.: Dynamic Modeling of Nitrogen Losses in River Networks Unravels the Coupled Effects of Hydrological and Biogeochemical Processes, Biogeochemistry, 93, 91–116, https://doi.org/10.1007/s10533-008-9274-8, 2009.
Andreadis, K. M., Schumann, G. J. P., and Pavelsky, T.: A Simple Global River Bankfull Width and Depth Database, Water Resour. Res., 49, 7164–68, https://doi.org/10.1002/wrcr.20440, 2013.
Arnold, J. G., Srinivasan, R., Muttiah, R. S., and Williams, J. R.: Large area hydrologic modeling and assessment Part I: model development, JAWRA J. Am. Water Resour. Assoc., 34, 73–89, https://doi.org/10.1111/j.1752-1688.1998.tb05961.x, 1998.
Badr, E. S. A.: Spatio-Temporal Variability of Dissolved Organic Nitrogen (DON), Carbon (DOC), and Nutrients in the Nile River, Egypt, Enviro. Monit. Assess., 188, 580, https://doi.org/10.1007/s10661-016-5588-5, 2016.
Battin, T. J., Lauerwald, R., Bernhardt, E. S., Bertuzzo, E., Gener, L. G., Hall, R.O., Hotchkiss, E. R., Maavara, T., Pavelsky, T. M., Ran, L., Raymond, P., Rosentreter, J. A., and Regnier, P.: River Ecosystem Metabolism and Carbon Biogeochemistry in a Changing World, Nature, 613, 449–459, https://doi.org/10.1038/s41586-022-05500-8, 2023.
Bernot, M. J. and Dodds, M. K.: Nitrogen Retention, Removal, and Saturation in Lotic Ecosystems, Ecosystems, 8, 442–453, https://doi.org/10.1007/s10021-003-0143-y, 2005.
Beusen, A. H. W., Van Beek, L. P. H., Bouwman, A. F., Mogollón, J. M., and Middelburg, J. J.: Coupling global models for hydrology and nutrient loading to simulate nitrogen and phosphorus retention in surface water – description of IMAGE–GNM and analysis of performance, Geosci. Model Dev., 8, 4045–4067, https://doi.org/10.5194/gmd-8-4045-2015, 2015.
Beusen, A. H. W., Bouwman, A. F., Van Beek, L. P. H., Mogollón, J. M., and Middelburg, J. J.: Global Riverine N and P Transport to Ocean Increased during the 20th Century despite Increased Retention the along Aquatic Continuum, Biogeosciences, 13, 2441–51, https://doi.org/10.5194/bg-13-2441-2016, 2016a.
Beusen, A. H. W.: Planbureau voor de Leefomgeving – PBL: Global riverine nitrogen (N) and phosphorus (P) input, retention and export during the 20th century, PBL Netherlands Environmental Assessment Agency/Utrecht University, DANS, https://doi.org/10.17026/dans-zgs-9k9m, 2016b.
Beusen, A. H. W., Doelman, J. C., Van Beek, L. P. H., Van Puijenbroek, P., Mogollón, J. M., Van Grinsven, H. J. M., Stehfest, E., Van Vuuren, D. P., and Bouwman, A. F.: Exploring River Nitrogen and Phosphorus Loading and Export to Global Coastal Waters in the Shared Socio-Economic Pathways, Glob. Environ. Change, 72, 102426, https://doi.org/10.1016/j.gloenvcha.2021.102426, 2022.
Bicknell, B. R., Burkey, J. J., and Dusenbury, R. A.: Modeling Water Quality in Urban Northwest Watersheds, in: Managing Watersheds for Human and Natural Impacts, 1–12, https://doi.org/10.1061/40763(178)93, 2005.
Billen, G., Garnier, J., and Lassaletta, L.: The Nitrogen Cascade from Agricultural Soils to the Sea: Modelling Nitrogen Transfers at Regional Watershed and Global Scales, Philos. T. R. Soc. B, 368, 20130123, https://doi.org/10.1098/rstb.2013.0123, 2013.
Bouwman, A. F., Van Drecht, G., Knoop, J. M., Beusen, A. H. W., and Meinardi, C. R.: Exploring Changes in River Nitrogen Export to the Worlds Oceans, Global Biogeochem. Cy., 19, GB1002, https://doi.org/10.1029/2004GB002314, 2005.
Bouwman, A. F., Beusen, A. H. W., Overbeek, C. C., Bureau, D. P., Pawlowski, M., and Glibert, P. M.: Hindcasts and Future Projections of Global Inland and Coastal Nitrogen and Phosphorus Loads Due to Finfish Aquaculture, Rev. Fish. Sci., 21, 112–156, https://doi.org/10.1080/10641262.2013.790340, 2013.
Bowring, S. P. K., Lauerwald, R., Guenet, B., Zhu, D., Guimberteau, M., Regnier, P., Tootchi, A., Ducharne, A., and Ciais, P.: ORCHIDEE MICT-LEAK (r5459), a global model for the production, transport, and transformation of dissolved organic carbon from Arctic permafrost regions – Part 2: Model evaluation over the Lena River basin, Geosci. Model Dev., 13, 507–520, https://doi.org/10.5194/gmd-13-507-2020, 2020.
Bu, H. M., Song, X. F., and Zhang, Y.: Using Multivariate Statistical Analyses to Identify and Evaluate the Main Sources of Contamination in a Polluted River near to the Liaodong Bay in Northeast China, Environ. Pollut., 245, 1058–1070, https://doi.org/10.1016/j.envpol.2018.11.099, 2019.
Cortés, J., Mahecha, M. D., Reichstein, M., Myneni, R. B., Chen, C., and Brenning, A.: Where Are Global Vegetation Greening and Browning Trends Significant?, Geophys. Res. Lett., 48, e2020GL091496, https://doi.org/10.1029/2020GL091496, 2021.
Costa, J. A., Souza, J. P., Teixeira, A. P., Nabout, J. C., and Carneiro, F. M.: Eutrophication in Aquatic Ecosystems. A Scientometric Study, Acta Limnol. Brasil., 30, 1–11, https://doi.org/10.1590/S2179-975X3016, 2018.
Dai, A. and Trenberth, K. E.: Estimates of Freshwater Discharge from Continents: Latitudinal and Seasonal Variations, J. Hydrometeorol., 3, 660–687, https://doi.org/10.1175/1525-7541(2002)003<0660:EOFDFC>2.0.CO;2, 2002.
Dai, M., Zhao, Y., Chai, F., Chen, M., Chen, N., Chen, Y., Cheng, D., Gan, J., Guan, D., Hong, Y., Huang, J., Lee, Y., Leung, K. M. Y., Lim, P. E., Lin, S., Lin, X., Liu, X., Liu, Z., Luo, Y., Meng, F., Sangmanee, C., Shen, Y., Uthaipan, K., Wan Talaat, W. I. A., Wan, X. S., Wang, C., Wang, D., Wang, G., Wang, S., Wang, Y., Wang, Y., Wang, Z., Wang, Z., Xu, Y., Yang, J. T., Yang, Y., Yasuhara, M., Yu, D., Yu, J., Yu, L., Zhang, Z., and Zhang, Z.: Persistent Eutrophication and Hypoxia in the Coastal Ocean, Cambridge Prisms, Coastal Futures, 1, e19, https://doi.org/10.1017/cft.2023.7, 2023.
Desmit, X., Thieu, V., Billen, G., Campuzano, F., Dulière, V., Garnier, J., Lassaletta, L., Ménesguen, A., Nevers, R, Pinto, L., Silvestre, M., Sobrinho, J. L., and Lacroix, G.: Reducing Marine Eutrophication May Require a Paradigmatic Change, Sci. Total Environ., 635, 1444–1466, https://doi.org/10.1016/j.scitotenv.2018.04.181, 2018.
Dodds, W. K. and Smith, V. H.: Nitrogen, Phosphorus, and Eutrophication in Streams, Inland Waters, 6, 155–1564, https://doi.org/10.5268/IW-6.2.909, 2016.
Donnelly, C., Yang, W., and Dahné, J.: River Discharge to the Baltic Sea in a Future Climate, Climatic Change, 122, 157–170, https://doi.org/10.1007/s10584-013-0941-y, 2014.
FAO/IIASA/ISRIC/ISSCAS/JRC: Harmonized World Soil Database (version 1.2), FAO, Rome, Italy and IIASA, Laxenburg, Austria, https://webarchive.iiasa.ac.at/Research/LUC/External-World-soil-database/HTML/ (last access: 8 May 2022), 2012.
Federal Institute of Hydrology: Global river data centre, Federal Institute of Hydrology, Global Runoff data centre, https://grdc.bafg.de/data/data_portal/, (last access: 15 April 2022), 2018.
Fekete, B. M., Wisser, D., Kroeze,C., Mayorga, E., Bouwman, L., Wollheim, W. M., and Vörösmarty, C.: Millennium Ecosystem Assessment Scenario Drivers (1970–2050): Climate and Hydrological Alterations, Global Biogeochem. Cy., 24, 1024, https://doi.org/10.1029/2009GB003593, 2010.
Feng, M., Peng, S., Wang, Y., Ciais, P., Goll, D. S., Chang, J., Fang,Y., Houlton, B. Z., Liu, G., Sun, Y., and Xi, Y.: Overestimated Nitrogen Loss from Denitrification for Natural Terrestrial Ecosystems in CMIP6 Earth System Models, Nat. Commun., 14, 3065, https://doi.org/10.1038/s41467-023-38803-z, 2023.
Ferreira, V., Elosegi, A., Tiegs, S. D., Schiller, D. V., and Young, R.: Organic Matter Decomposition and Ecosystem Metabolism as Tools to Assess the Functional Integrity of Streams and Rivers – A Systematic Review, Water, 12, 3523, https://doi.org/10.3390/w12123523, 2020.
Filoso, S., Martinelli, L. A., Williams, M. R., Luciene, B. L., Krusche, A. K., Ballester, M. V., Victoria, R., and Camargo, P. B.: Land use and nitrogen export in the Piracicaba River basin, Southeast Brazil, Biogeochemistry, 65, 275–294, https://doi.org/10.1023/A:1026259929269, 2003.
Fowler, D., Coyle, M., Skiba, U., Sutton, M. A., Cape, J. N., Reis, S., Sheppard, L. J., Jenkins, A., Grizzetti, B., Galloway, J. N., Vitousek, P., Leach, A., Bouwman, A. F., Butterbach-Bahl, K., Dentener, F., Stevenson, D., Amann, M., and Voss, M.: The Global Nitrogen Cycle in the Twenty-First Century, Philos. T. R. Soc. B, 368, 20130164, https://doi.org/10.1098/rstb.2013.0164, 2013.
Galloway, J. N.: 8.12 – The Global Nitrogen Cycle. In Treatise on Geochemistry, edited by Heinrich D. Holland and Karl K. Turekian, 557–83, Oxford, Pergamon, https://doi.org/10.1016/B0-08-043751-6/08160-3, 2003.
Gao, X., Chen, N., Yu, D., Wu, Y., and Huang, B.: Hydrological Controls on Nitrogen (Ammonium versus Nitrate) Fluxes from River to Coast in a Subtropical Region: Observation and Modeling, J. Environ. Manag., 213, 382–391, https://doi.org/10.1016/j.jenvman.2018.02.051, 2018.
Gao, Y., Zhou, F., Ciais, P., Miao, C.,Yang, T., Jia, Y, Zhou, X., Klaus, B. B., Yang, T., and Yu, Y.: Human Activities Aggravate Nitrogen-Deposition Pollution to Inland Water over China, Natl. Sci. Rev., 7, 430–440, https://doi.org/10.1093/nsr/nwz073, 2020.
Green, P. A.,Vörösmarty, C. J., Meybeck, M., Galloway, J. N., Peterson, B. J., and Boyer, E. W.: Pre-Industrial and Contemporary Fluxes of Nitrogen through Rivers: A Global Assessment Based on Typology, Biogeochemistry, 68, 71–105, https://doi.org/10.1023/B:BIOG.0000025742.82155.92, 2004.
Gruber, N. and Galloway, J.: An Earth-system perspective of the global nitrogen cycle, Nature, 451, 293–296, https://doi.org/10.1038/nature06592, 2008.
Goll, D. S., Vuichard, N., Maignan, F., Jornet-Puig, A., Sardans, J., Violette, A., Peng, S., Sun, Y., Kvakic, M., Guimberteau, M., Guenet, B., Zaehle, S., Penuelas, J., Janssens, I., and Ciais, P.: A representation of the phosphorus cycle for ORCHIDEE (revision 4520), Geosci. Model Dev., 10, 3745–3770, https://doi.org/10.5194/gmd-10-3745-2017, 2017.
Goll, D. S., Joetzjer, E., Huang, M., and Ciais, P.: Low Phosphorus Availability Decreases Susceptibility of Tropical Primary Productivity to Droughts, Geophys. Res. Lett., 45, 8231–8240, https://doi.org/10.1029/2018GL077736, 2018.
Hanrahan, B. R., Tank, J. L., Dee, M. M., Trentman, M. T., Berg, E. M., and McMillan, S. K.: Restored Floodplains Enhance Denitrification Compared to Naturalized Floodplains in Agricultural Streams, Biogeochemistry, 141, 419–437, https://doi.org/10.1007/s10533-018-0431-4, 2018.
Harrison, J. A., Maranger, R. J., Alexander, R. B., Giblin, A. E., Jacinthe, P., Mayorga, E., Seitzinger, S. P., Sobota, D. J., and Wollheim, W. M.: The Regional and Global Significance of Nitrogen Removal in Lakes and Reservoirs, Biogeochemistry, 93, 143–157, https://doi.org/10.1007/s10533-008-9272-x, 2009.
Hashemi, F., Olesen, J. E., Dalgaard, T., and Børgesen, C. D.: Review of Scenario Analyses to Reduce Agricultural Nitrogen and Phosphorus Loading to the Aquatic Environment, Sci. Total Environ., 573, 608–626, https://doi.org/10.1016/j.scitotenv.2016.08.141, 2016.
Hastie, A., Lauerwald, R., Ciais, P., and Regnier, P.: Aquatic carbon fluxes dampen the overall variation of net ecosystem productivity in the Amazon basin: An analysis of the interannual variability in the boundless carbon cycle, Glob. Change Biol., 25, 2094–2111, https://doi.org/10.1111/gcb.14620, 2019.
Hou, W., Chen, X., Wu, J., Zhang, C., Yu, J., Bai, J., and Chen, T.: Sources and Spatiotemporal Variations of Nitrogen and Phosphorus in Liaodong Bay, China, Mar. Pollut. Bull., 185, 114191, https://doi.org/10.1016/j.marpolbul.2022.114191, 2022.
Hu, J., Liao, X.,Vardanyan, L. G., Huang, Y., Inglett, K. S., Wright, A. L., and Reddy, K. R.: Duration and Frequency of Drainage and Flooding Events Interactively Affect Soil Biogeochemistry and N Flux in Subtropical Peat Soils, Sci. Total Environ., 727, 138740, https://doi.org/10.1016/j.scitotenv.2020.138740, 2020
Huang, J., Xu, C., Ridoutt, B. G., Wang, X., and Ren, P.: Nitrogen and Phosphorus Losses and Eutrophication Potential Associated with Fertilizer Application to Cropland in China, J. Clean. Prod., 159, 171–79, https://doi.org/10.1016/j.jclepro.2017.05.008, 2017.
Islam, M. J., Jang, C., Eum, J., Jung, S., Shin, M. S., Lee, Y., and Kim, B.: The decomposition rates of organic phosphorus and organic nitrogen in river waters, J. Freshwater Ecol., 28, 239–250, https://doi.org/10.1080/02705060.2012.733969, 2012.
Jepsen, S. M., Harmon, T. C., Sadro, S., Reid, B., and Chandra, S.: Water Residence Time (Age) and Flow Path Exert Synchronous Effects on Annual Characteristics of Dissolved Organic Carbon in Terrestrial Runoff', Sci. Total Environ., 656, 1223–1237, https://doi.org/10.1016/j.scitotenv.2018.11.392, 2019.
Jung, S. P., Kim Y. J., and Kang, H.: Denitrification Rates and Their Controlling Factors in Streams of the Han River Basin with Different Land-Use Patterns, Pedosphere, 24, 516–528, https://doi.org/10.1016/S1002-0160(14)60038-2, 2014.
Kim, T., Lee, K., Najjar, R. G., Jeong, H., and Jeong, H. J.: Increasing N Abundance in the Northwestern Pacific Ocean Due to Atmospheric Nitrogen Deposition, Science, 334, 505–519, https://doi.org/10.1126/science.1206583, 2011.
King, S. A., Heffernan, J. B., and Cohen, M. J.: Nutrient Flux, Uptake, and Autotrophic Limitation in Streams and Rivers, Freshwater Sci., 33, 85–98, https://doi.org/10.1086/674383, 2014.
Kirkby, C. A., Kirkegaard, J. A., Richardson, A. E., Wade, L. J., Blanchard, C., and Batten, G.: Stable Soil Organic Matter: A Comparison of C : N : P : S Ratios in Australian and Other World Soils, Geoderma, 163, 197–208, https://doi.org/10.1016/j.geoderma.2011.04.010, 2011.
Krinner, G., Viovy, N., Noblet-Ducoudré, N. D., Ogée, J., Polcher, J., Friedlingstein, P., Ciais, P., Sitch, S., and Prentice, I. C.: A Dynamic Global Vegetation Model for Studies of the Coupled Atmosphere-Biosphere System, Global Biogeochem. Cy., 19, GB1015, https://doi.org/10.1029/2003GB002199, 2005.
Lacroix, F., Ilyina, T., Mathis, M., Laruelle, G. G., and Regnier, R.: Historical Increases in Land-Derived Nutrient Inputs May Alleviate Effects of a Changing Physical Climate on the Oceanic Carbon Cycle, Glob. Change Biol., 27, 5491–5513, https://doi.org/10.1111/gcb.15822, 2021.
Lauerwald, R., Regnier, P., Camino-Serrano, M., Guenet, B., Guimberteau, M., Ducharne, A., Polcher, J., and Ciais, P.: ORCHILEAK (revision 3875): a new model branch to simulate carbon transfers along the terrestrial–aquatic continuum of the Amazon basin, Geosci. Model Dev., 10, 3821–3859, https://doi.org/10.5194/gmd-10-3821-2017, 2017.
Lauerwald, R., Regnier, P., Guenet, B., Friedlingstein, P., and Ciais, P.: How Simulations of the Land Carbon Sink Are Biased by Ignoring Fluvial Carbon Transfers: A Case Study for the Amazon Basin, One Earth, 3, 226–236, https://doi.org/10.1016/j.oneear.2020.07.009, 2020.
Lee, R. Y., Seitzinger, S., and Mayorga, E.: Land-Based Nutrient Loading to LMEs: A Global Watershed Perspective on Magnitudes and Sources, Environ. Dev., 17, 220–229, https://doi.org/10.1016/j.envdev.2015.09.006, 2016a.
Lee, Y. J., Matrai, P.A., Friedrichs, M. A. M., Saba, V. S., Aumont, O., Babin, M., Buitenhuis, E. T., Chevallier, M., Mora, L., Dessert, M., Dunne, J. P., Ellingsen, I. H., Feldman, D., Frouin, R., Gehlen, M., Gorgues, M., Ilyina, Y., Jin, M., John, J. G., Lawrence, J., Manizza, M., Menkes, C. E., Perruche, C., Fouest, V. L., Popova, E. E., Romanou, A., Samuelsen, A., Schwinger, J., Séférian, R., Stock, C. A., Tjiputra, J., Tremblay, L. B., Ueyoshi, K., Vichi, M., Yool, A., and Zhang, J.: Net Primary Productivity Estimates and Environmental Variables in the Arctic Ocean: An Assessment of Coupled Physical-Biogeochemical Models, J. Geophys. Res.-Ocean., 121, 8635–8669, https://doi.org/10.1002/2016JC011993, 2016b.
Lee, M., Shevliakova, E., Stock, C. A., Malyshev, S., and Milly, P. C. D.: Prominence of the Tropics in the Recent Rise of Global Nitrogen Pollution, Nat. Commun., 10, 1437, https://doi.org/10.1038/s41467-019-09468-4, 2019.
Li, M., Wang, J., Guo, M., Yang, R., and Fu, H.: Effect of Land Management Practices on the Concentration of Dissolved Organic Matter in Soil: A Meta-Analysis, Geoderma, 344, 74–81, https://doi.org/10.1016/j.geoderma.2019.03.004, 2019.
Lindström, G, Pers, C., Rosberg, J., Strömqvist, J., and Arheimer, B.: Development and Testing of the HYPE (Hydrological Predictions for the Environment) Water Quality Model for Different Spatial Scales, Hydrol. Res., 41, 295–319, https://doi.org/10.2166/nh.2010.007, 2010.
Liu, R., Wang, Q., Xu, F., Men, C., and Guo, L.: Impacts of Manure Application on SWAT Model Outputs in the Xiangxi River Watershed, J. Hydrol., 555, 479–488, https://doi.org/10.1016/j.jhydrol.2017.10.044, 2017.
Liu, H., Xu, H., Wu, Y., Ai, Z., Zhang, J., Liu, G., and Xue, S.: Effects of Natural Vegetation Restoration on Dissolved Organic Matter (DOM) Biodegradability and Its Temperature Sensitivity, Water Res., 191, 116792, https://doi.org/10.1016/j.watres.2020.116792, 2021.
Liu, Z., Deng, Z., Davis, S. J., and Ciais, P.: Global Carbon Emissions in 2023, Nat. Rev. Earth Environ., 5, 253–254, https://doi.org/10.1038/s43017-024-00532-2, 2024.
Lu, C. and Tian, H.: Global nitrogen and phosphorus fertilizer use for agriculture production in the past half century: shifted hot spots and nutrient imbalance, Earth Syst. Sci. Data, 9, 181–192, https://doi.org/10.5194/essd-9-181-2017, 2017.
Lurton, T., Balkanski, Y., Bastrikov, V., Bekki, S., Bopp, L., Braconnot, P., Brockmann, P., Cadule, P., Contoux, C., Cozix, A., Cugnet, D., Dufresne, J., Ethé, C., Foujols, M., Ghattas, J., Didier, H., Hu, R., Kageyama, M., Khodri, M., Nicolas, L., Levavasseur, G., Marchand, M., Ottlé, C., Peylin, P., Sima, A., Szopa, S., Thiéblemount, R., Vuichard, N., and Boucher, O.: Implementation of the CMIP6 Forcing Data in the IPSL-CM6A-LR Model, J. Adv. Model. Earth Sy., 12, e2019MS001940, https://doi.org/10.1029/2019ms001940, 2020.
Luscz, E. C., Kendall, A. D., and Hyndman, D. W.: High Resolution Spatially Explicit Nutrient Source Models for the Lower Peninsula of Michigan, J. Great Lakes Res., 41, 618–629, https://doi.org/10.1016/j.jglr.2015.02.004, 2015.
Luscz, E. C., Kendall, A. D., and Hyndman, D. W.: A spatially explicit statistical model to quantify nutrient sources, pathways, and delivery at the regional scale, Biogeochemistry, 133, 37–57, https://doi.org/10.1007/s10533-017-0305-1, 2017.
Lutz, B. D., Bernhardt, E. S., Roberts, B. J., and Mulholland, P. J.: Examining the Coupling of Carbon and Nitrogen Cycles in Appalachian Streams: The Role of Dissolved Organic Nitrogen, Ecology, 92, 720–732, https://doi.org/10.1890/10-0899.1, 2011.
Ma, M.: ORCHIDEE-NLAT model code and evaluation data, Zenodo [data set], https://doi.org/10.5281/zenodo.13309551, 2024.
Ma, M., Song, C., Fang, H., Zhang, J., Wei, J., Liu, S., Chen, X, Zhang, K., Yuan, W, and Lu, H.: Development of a Process-Based N2O Emission Model for Natural Forest and Grassland Ecosystems, J. Adv. Model. Earth Sy., 14, e2021MS002460, https://doi.org/10.1029/2021MS002460, 2022.
Maranger, R., Jones, S. E., and Cotner, J. B.: Stoichiometry of Carbon, Nitrogen, and Phosphorus through the Freshwater Pipe, Limnol. Oceanogr. Lett., 3, 89–101, https://doi.org/10.1002/lol2.10080, 2018.
Martí, E., Grimm, N. B., and Fisher, S. G.: Pre- and Post-Flood Retention Efficiency of Nitrogen in a Sonoran Desert Stream, J. North Am. Benthol. Soc., 16, 805–819, https://doi.org/10.2307/1468173, 1997.
Marzadri, A., Amatulli, G., Tonina, D., Bellin, A., Shen, L. Q., Allen, G. H., and Raymond, P. A.: Global Riverine Nitrous Oxide Emissions: The Role of Small Streams and Large Rivers, Sci. Total Environ., 776, 145148, https://doi.org/10.1016/j.scitotenv.2021.145148, 2021.
Mayorga, E., Seitzinger, S. P., Harrison, J. A., Dumont, E., Beusen, A. H. W., Bouwman, A. F., Fekete, B. M., Kroeze, C., and Van Drecht, G.: Global Nutrient Export from WaterSheds 2 (NEWS 2): Model Development and Implementation, Environ. Model. Softw., 25, 837–853, https://doi.org/10.1016/j.envsoft.2010.01.007, 2010.
McDowell, R. W., Noble, A., Pletnyakov, P., and Mosley, L. M.: Global Database of Diffuse Riverine Nitrogen and Phosphorus Loads and Yields, Geosc. Data J., 8, 132–143, https://doi.org/10.1002/gdj3.111, 2021.
Morée, A. L., Beusen, A. H. W., Bouwman, A. F., and Willems, W. J.: Exploring Global Nitrogen and Phosphorus Flows in Urban Wastes during the Twentieth Century, Global Biogeochem. Cy., 27, 836–846, https://doi.org/10.1002/gbc.20072, 2013.
Naden, P., Bell, V., Carnell, E., Tomlinson, S., Dragosits, U., Chaplow, J., May, L., and Tipping, E.: Nutrient Fluxes from Domestic Wastewater: A National-Scale Historical Perspective for the UK 1800–2010, Sci. Total Environ., 572, 1471–1484, https://doi.org/10.1016/j.scitotenv.2016.02.037, 2016.
Newbold, J. D., Elwood, J. W., O'Neill, R. V., and Winkle, W. V.: Measuring nutrient spiraling in streams, Can. J. Fish. Aquat. Sci., 38, 860–863, 1981.
Niu, H., Lu, X., Zhang, G., and Sarangi, C.: Investigation of water-soluble organic constituents and their spatio-temporal heterogeneity over the Tibetan Plateau, Environ. Pollut., 302, 119093, https://doi.org/10.1016/j.envpol.2022.119093, 2022.
Ngo-Duc, T., Polcher, J., and Laval, K.: A 53-Year Forcing Data Set for Land Surface Models, J. Geophys. Res.-Atmos., 110, D06116, https://doi.org/10.1029/2004JD005434, 2006.
Patil, M. M.: Interpolation Techniques in Image Resampling, Int. J. Eng. Technol., 7, 567–570, https://doi.org/10.14419/ijet.v7i3.34.19383, 2018.
Pauer, J. J. and Auer, M. T.: Formulation and Testing of a Novel River Nitrification Model, Ecol. Model., 220, 857–866, https://doi.org/10.1016/j.ecolmodel.2008.12.014, 2008.
Pisani, O., Boyer, J. N., Podgorski, D. C., Thomas, C. P., Coley, T., and Jaffé, R.: Molecular composition and bioavailability of dissolved organic nitrogen in a lake f Beusen low-influenced river in south Florida, USA, Aquat. Sci., 79, 891–908, https://doi.org/10.1007/s00027-017-0540-5, 2017.
Probst, J. and Tardy, Y.: Global runoff fluctuations during the last 80 years in relation to world temperature change, Amer. J. Sci., 289, 267–285, https://doi.org/10.2475/ajs.289.3.267, 1989.
Raymond, P. A., Zappa, C. J., Butman, D., Bott, T. L., Potter, J., Mulholland, P., Laursen, A. E., McDowell, W. H., and Newbold, D.: Scaling the Gas Transfer Velocity and Hydraulic Geometry in Streams and Small Rivers, Limnol. Oceanogr.-Fluid. Environ., 2, 41–53, https://doi.org/10.1215/21573689-1597669, 2012.
Regnier, P., Friedlingstein, P., Ciais, P., Mackenzie, F. T., Gruber, N., Janssens, I. A., Laruelle, G. G., Lauerwald, R., Luyssaert, S., Andersson, A. J., Arndt, A., Arnosti, C., Borges, A. V., Dale, A. W., Gallego-Sala, A., Goddéris, Y., Goossens, N., Hartmann, J., Heinze, C., Ilyina, T., Joos, F., LaRowe, D. E., Leifeld, J., Meysman, F. J. R., Munhoven, G., Raymond, P. A., Spahni, R., Suntharalingam, P., and Thulllner, M.: Anthropogenic perturbation of the carbon fluxes from land to ocean, Nat. Geosci., 6, 597–607, https://doi.org/10.1038/ngeo1830, 2013.
Regnier, P., Resplandy, L., Najjar, R. G., and Ciais, P.: The land-to-ocean loops of the global carbon cycle, Nature, 603, 401–410, https://doi.org/10.1038/s41586-021-04339-9, 2022.
Renaud, O. and Victoria-Feser, M.: A Robust Coefficient of Determination for Regression, J. Stat. Plan. Infer., 140, 1852–1862, https://doi.org/10.1016/j.jspi.2010.01.008, 2010.
Resplandy, L., Hogikyan, A., Müller, J. D., Najjar, R. G., Bange, H. W., Bianchi, D., Weber, T., Cai, W., Doney, S. C., Fennel, K., Gehlen, M., Hauck, J., Lacroix, F., Landschützer, P., Quéré, C. L., Roobaertm A., Schinger, J., Berthet, S., Bopp, L., Chau, T. T. T., Dai, M., Gruber, N., Ilyina, T., Kock, A., Manizza, M., Lachkaer, Z., Laruelle, G. G., Liao, E., Lima, I. D., Nissen, C., Rödenbeck, C., Séférian, R., Toyama, K., Tsujino, H., and Regnier, P.: A Synthesis of Global Coastal Ocean Greenhouse Gas Fluxes, Global Biogeochem. Cy., 38, e2023GB007803, https://doi.org/10.1029/2023GB007803, 2024.
Reynolds, C., Jackson, T., and Rawls, W.: Estimating available water content by linking the FAO soil map of the world with global soil profile databases and pedo-transfer functions, EOS, Transactions, AGU, Spring Meet. Suppl., 80, S132, https://doi.org/10.1029/2000WR900130, 1999.
Rodríguez-Cardona, B. M., Wymore, A. S., Argerich, A., Barnes, R. T., Bernal, S., Brookshire, E. N. J., Coble, A. A., Dodds, W. K., Fazekas, H. M., Helton, A. M., Johnes, P. J., Johnson, S. L., Jones, J. B., Kaushal, S. S., Kortelainen, P., López-Lloreda, C., Spencer, R. G. M., and McDowell, W. H.: Shifting Stoichiometry: Long-Term Trends in Stream-Dissolved Organic Matter Reveal Altered C: N Ratios Due to History of Atmospheric Acid Deposition, Glob. Change Biol., 28, 98–114, https://doi.org/10.1111/gcb.15965, 2021.
Roobaert, A., Goulven, G. L., Landschützer, P., Gruber, N., Chou, L., and Regnier, P.: The Spatiotemporal Dynamics of the Sources and Sinks of CO2 in the Global Coastal Ocean, Global Biogeochem. Cy., 33, 1693–1714, https://doi.org/10.1029/2019GB006239, 2019.
Sainju, U. M., Stevens, W. B., Caesar-TonThat, T., Liebig, M. A., and Wang, J.: Net Global Warming Potential and Greenhouse Gas Intensity Influenced by Irrigation, Tillage, Crop Rotation, and Nitrogen Fertilization, J. Environ. Qual., 43, 777–788, https://doi.org/10.2134/jeq2013.10.0405, 2014.
Saunders, D. L. and Kalff, J.: Nitrogen Retention in Wetlands, Lakes and Rivers, Hydrobiologia, 443, 205–212, https://doi.org/10.1023/A:1017506914063, 2001.
Sánchez-Rodríguez, A. R., Hill, P. W., Chadwick, D. R., and Jones, D. L.: Typology of Extreme Flood Event Leads to Differential Impacts on Soil Functioning, Soil Biol. Biochem., 129, 153–168, https://doi.org/10.1016/j.soilbio.2018.11.019, 2019.
Sattar, M. A., Kroeze, C., and Strokal, M.: The Increasing Impact of Food Production on Nutrient Export by Rivers to the Bay of Bengal 1970–2050, Mar. Pollut. Bull., 80, 168–78, https://doi.org/10.1016/j.marpolbul.2014.01.017, 2014.
Scott, D., Harvey, J., Alexander, R., and Schwarz, G.: Dominance of Organic Nitrogen from Headwater Streams to Large Rivers across the Conterminous United States, Global Biogeochem. Cy., 21, GB1003, https://doi.org/10.1029/2006GB002730, 2007.
Seiler, C., Kou-Giesbrecht, S., Arora, V. K., and Melton, J. R.: The Impact of Climate Forcing Biases and the Nitrogen Cycle on Land Carbon Balance Projections, J. Adv. Model. Earth Sy., 16, e2023MS003749, https://doi.org/10.1029/2023MS003749, 2024.
Seitzinger, S. P., Harrison, J. A., Dumont, E, Beusen, A. H. W., and Bouwman, A. F.: Sources and Delivery of Carbon, Nitrogen, and Phosphorus to the Coastal Zone: An Overview of Global Nutrient Export from Watersheds (NEWS) Models and Their Application, Global Biogeochem. Cy., 19, GB4S01, https://doi.org/10.1029/2005GB002606, 2005.
Seitzinger, S. P., Mayorga, E., Bouwman, A. F., Kroeze, C., Beusen, A. H. W., Billen, G., Drecht, G. V., Dumont, E., Fekete, B. M., Garnier, J., and Harrison, J. A.: Global River Nutrient Export: A Scenario Analysis of Past and Future Trends, Global Biogeochem. Cy., 24, GB0A08, https://doi.org/10.1029/2009GB003587, 2010.
Stock, C. A., Dunne, J. P., Fan, S., Ginoux, P., John, J., Krasting, J. P., Laufkötter, C., Paulot, F., and Zadeh, N.: Ocean Biogeochemistry in GFDL's Earth System Model 4.1 and Its Response to Increasing Atmospheric CO2, J. Adv. Model. Earth Sy., 12, e2019MS002043, https://doi.org/10.1029/2019MS002043, 2020.
Sun, Y., Goll, D. S., Chang, J., Ciais, P., Guenet, B., Helfenstein, J., Huang, Y., Lauerwald, R., Maignan, F., Naipal, V., Wang, Y., Yang, H., and Zhang, H.: Global evaluation of the nutrient-enabled version of the land surface model ORCHIDEE-CNP v1.2 (r5986), Geosci. Model Dev., 14, 1987–2010, https://doi.org/10.5194/gmd-14-1987-2021, 2021.
Swaney, D. P., Hong, B., Ti, C., Howarth, R. W., and Humborg, C.: Net Anthropogenic Nitrogen Inputs to Watersheds and Riverine N Export to Coastal Waters: A Brief Overview, Carbon Nitrog. Cy., 4, 203–211, https://doi.org/10.1016/j.cosust.2012.03.004, 2012.
Thomas, R. Q., Bonan, G. B., and Goodale, C. L.: Insights into mechanisms governing forest carbon response to nitrogen deposition: a model–data comparison using observed responses to nitrogen addition, Biogeosciences, 10, 3869–3887, https://doi.org/10.5194/bg-10-3869-2013, 2013.
Thornton, P. E., Lamarque, J., Rosenbloom, N. A., and Mahowald, N. M.: Influence of Carbon-Nitrogen Cycle Coupling on Land Model Response to CO2 Fertilization and Climate Variability, Global Biogeochem. Cy., 21, GB4018, https://doi.org/10.1029/2006GB002868, 2007.
Tian, H., Yang, J., Lu, C., Xu, R., Canadell, J. G., Jackson, R. B., Arneth, A., Chang, J., Chen, G., Ciais, P., Gerber, S., Ito, A., Huang, Y., Joos, F., Lienert, S., Messina, P., Olin, S., Pan, S., Peng, Chang, Saikawa, E., Thompson, R, Vuichard, N., Winiwarter, W., Zaehle, S., Zhang, B., Zhang, K., and Zhu, Q.: The Global N2O Model Intercomparison Project, Bull. Am. Meteorol. Soc., 99, 1231–1251, https://doi.org/10.1175/BAMS-D-17-0212.1, 2018.
Tipping, E., Somerville, C. J., and Luster, J.: The C : N : P : S Stoichiometry of Soil Organic Matter, Biogeochemistry, 130, 117–131, https://doi.org/10.1007/s10533-016-0247-z, 2016.
Tjiputra, J. F., Schwinger, J., Bentsen, M., Morée, A. L., Gao, S., Bethke, I., Heinze, C., Goris, N., He, Y., Olivié, D., Seland, Ø., and Schulz, M.: Ocean Biogeochemistry in the Norwegian Earth System Model Version 2 (NorESM2), Geosci. Model Dev., 13, 2393–2431, https://doi.org/10.5194/gmd-13-2393-2020, 2020.
Van Beek, L. P. H., Wada, Y., and Bierkens, M. F. P.: Global monthly water stress: 1. Water balance and water availability, Water Resour. Res., 47, W07517, https://doi.org/10.1029/2010wr009791, 2011.
Van Drecht, G., Bouwman, A. F., Harrison, J., and Knoop, J. M.: Global Nitrogen and Phosphate in Urban Wastewater for the Period 1970 to 2050, Global Biogeochem. Cy., 23, GB0A03, https://doi.org/10.1029/2009GB003458, 2009.
Vilmin, L., Mogollón, J. M., Beusen, A. H. W., and Bouwman, A. F.: Forms and Subannual Variability of Nitrogen and Phosphorus Loading to Global River Networks over the 20th Century, Glob. Planetary Chang., 163, 67–85, https://doi.org/10.1016/j.gloplacha.2018.02.007, 2018.
Virro, H., Amatulli, G., Kmoch, A., Shen, L., and Uuemaa, E.: GRQA: Global River Water Quality Archive, Earth Syst. Sci. Data, 13, 5483–5507, https://doi.org/10.5194/essd-13-5483-2021, 2021.
Vörösmarty, C. J., Fekete, B. M., Meybeck, M., and Lammers, R. B.: Geomorphometric Attributes of the Global System of Rivers at 30-Minute Spatial Resolution, J. Hydrol., 237, 17–39, https://doi.org/10.1016/S0022-1694(00)00282-1, 2000.
Vuichard, N., Messina, P., Luyssaert, S., Guenet, B., Zaehle, S., Ghattas, J., Bastrikov, V., and Peylin, P.: Accounting for Carbon and Nitrogen Interactions in the Global Terrestrial Ecosystem Model ORCHIDEE (Trunk Version, Rev 4999): Multi-Scale Evaluation of Gross Primary Production, Geosci. Model Dev., 12, 4751–4779, https://doi.org/10.5194/gmd-12-4751-2019, 2019.
Wachholz, A., Jawitz, J. W., and Borchardt, D.: From Iron Curtain to green belt: shift from heterotrophic to autotrophic nitrogen retention in the Elbe River over 35 years of passive restoration, Biogeosciences, 21, 3537–3550, https://doi.org/10.5194/bg-21-3537-2024, 2024.
Wang, X. and Zhang, J.: Watershed Hydrological Model HSPF Based on BASINS and the Uncertainty Analysis, Adv. Mat. Res., 1073, 1720–1723, https://doi.org/10.4028/www.scientific.net/AMR.1073-1076.1720, 2015.
Wang, Z. Q., Wang, H., Wang, T. F., Wang, L. N., Liu, X., Zheng, K., and Huang, X. T.: Large discrepancies of global greening: Indication of multi-source remote sensing data, Glob. Ecol. Conserv., 34, e02016, https://doi.org/10.1016/j.gecco.2022.e02016, 2022.
Wollheim, W. M., Vörösmarty, C. J., Bouwman, A. F., Green, P., Harrison, J., Linder, E., Peterson, B. J., Seitzinger, S. P., and Syvitski, J. P. M.: Global N Removal by Freshwater Aquatic Systems Using a Spatially Distributed, within-Basin Approach, Global Biogeochem. Cy., 22, GB2026, https://doi.org/10.1029/2007GB002963, 2008.
Wymore, A. S., Johnes, P. J., Bernal, S., Jack Brookshire, E. N., Fazekas, H. M., Helton, A. M., Argerich, A., Barnes, R. T., Coble, A. A., Dodds, W. K., Haq, S., Johnson, S. L., Jones, J. B., Kaushal, S. S., Kortelainen, P., López-Lloreda, C., Rodríguez-Cardona, B. M., Spencer, R. G. M., Sullivan, P. L., Yates, C. A., and McDowell, W. H.: Gradients of Anthropogenic Nutrient Enrichment Alter N Composition and DOM Stoichiometry in Freshwater Ecosystems, Global Biogeochem. Cy., 35, e2021GB006953, https://doi.org/10.1029/2021GB006953, 2021.
Xia, X., Liu, T., Yang, Z., Zhang, X., and Yu, Z.: Dissolved Organic Nitrogen Transformation in River Water: Effects of Suspended Sediment and Organic Nitrogen Concentration, J. Hydrol., 484, 96–104, https://doi.org/10.1016/j.jhydrol.2013.01.012, 2013.
Yang, F., Wang, H., Bouwman, A. F., Beusen, A. H. W., Liu, X., Wang, J., Yu, Z., and Yao, Q.: Nitrogen from Agriculture and Temperature as the Major Drivers of Deoxygenation in the Central Bohai Sea, Sci. Total Environ., 893, 164614, https://doi.org/10.1016/j.scitotenv.2023.164614, 2023.
Yang, Q., Tian, H., Friedrichs, M. A. M., Hopkinson, C. S., Lu, C., and Najjar, R. G.: Increased Nitrogen Export from Eastern North America to the Atlantic Ocean Due to Climatic and Anthropogenic Changes during 1901–2008, J. Geophys. Res.-Biogeo., 120, 1046–1068, https://doi.org/10.1002/2014JG002763, 2015.
Yao, Y., Tian, H., Shi, H., Pan, S., Xu, R., Pan, N., and Canadell, J. G.: Increased Global Nitrous Oxide Emissions from Streams and Rivers in the Anthropocene, Nat. Clim. Change, 10, 138–142, https://doi.org/10.1038/s41558-019-0665-8, 2020.
Yates, C. A., Johnes, P. J., Owen, A.T., Brailsford, F. L., Glanville, H. C., Evans, C. D., Marshall, M. R., Jones, D. L., Lloyd, C. E. M., Jickells, T., and Evershed, R. P.: Variation in Dissolved Organic Matter (DOM) Stoichiometry in U.K. Freshwaters: Assessing the Influence of Land Cover and Soil C : N Ratio on DOM Composition, Limnol. Oceanogr., 64, 2328–2340, https://doi.org/10.1002/lno.11186, 2019.
Zaehle, S., Medlyn, B. E., De Kauwe, M. G., Walker, A. P., Dietze, M. C., Hickler, T., Luo, Y., Wang Y., El-Masri, B., Thornton, P., Jain, A., Wang, S., Warlind, D., Weng, E., Parton, W., Iversen, C. M., Gallet-Budynek, A., McCarthy, H., Finzi, A., Hanson, P. J., Prentice, C., Oren, R., and Norby, R. J.: Evaluation of 11 Terrestrial Carbon–Nitrogen Cycle Models against Observations from Two Temperate Free-Air CO2 Enrichment Studies, New Phytol., 202, 803–822, https://doi.org/10.1111/nph.12697, 2014.
Zang, H., Blagodatskaya, E., Wen, Y., Shi, L., Cheng, F., Chen, H., Zhao, B., Zhang, F., Fan, M., and Kuzyakov, Y.: Temperature Sensitivity of Soil Organic Matter Mineralization Decreases with Long-Term N Fertilization: Evidence from Four Q10 Estimation Approaches, Land Degrad. Dev., 31, 683–693, https://doi.org/10.1002/ldr.3496, 2020.
Zhang, B., Tian, H., Lu, C., Dangal, S. R. S., Yang, J., and Pan, S.: Global manure nitrogen production and application in cropland during 1860–2014: a 5 arcmin gridded global dataset for Earth system modeling, Earth Syst. Sci. Data, 9, 667–678, https://doi.org/10.5194/essd-9-667-2017, 2017.
Zhang, H., Lauerwald, R., Regnier, P., Ciais, P., Van Oost, K., Naipal, V., Guenet, B., and Yuan, W.: Estimating the lateral transfer of organic carbon through the European river network using a land surface model, Earth Syst. Dynam., 13, 1119–1144, https://doi.org/10.5194/esd-13-1119-2022, 2022.
Zhang, H., Lauerwald, R., Ciais, P., Yuan, W., Tang, G., and Regnier, P.: Weakening of the terrestrial carbon sink through enhanced fluvial carbon export, Nature, in review, 2025.
Zhang X, Zou, T., Lassaletta, L., Mueller, N. D., Tubiello, F. N., Lisk, M. D., Lu, C., Conant, R. T., Dorich, C. D., Gerber, J., Tian, H., Bruulsema, T., Maaz, T. M., Nishina, K., Bodirsky, B. L., Popp, A., Bouwman, L., Beusen, A., Chang, J., Havlík, P., Leclère,D., Canadell, J. G., Jackson, R. B., Heffer, P., Wanner, N., Zhang, W., and Davidson, E. A.: Quantification of Global and National Nitrogen Budgets for Crop Production, Nature Food, 2, 529–540, https://doi.org/10.1038/s43016-021-00318-5, 2021.