the Creative Commons Attribution 4.0 License.
the Creative Commons Attribution 4.0 License.
Assessing coupling between soil temperature and potential air temperature using PALM-4U: implications for idealized scenarios
Christopher C. Holst
Basit Khan
Susanne A. Benz
Underground heat extremes, amplified by factors such as underground infrastructure or poorly adjusted geothermal systems, have long been discussed in the geosciences. However, there is little emphasis on the exchange between these subsurface heat extremes and the atmosphere. To address the issue, this study investigates the impact of varying soil temperatures on potential air temperatures in an idealized domain using the turbulence- and building-resolving large-eddy-simulation urban microclimate model PALM-4U (Parallelized Large-Eddy Simulation Model for Urban Applications). This involves two steps. First, we test if and how idealized domains can be simulated, and second, the coupling between surface and subsurface energy fluxes, or rather temperatures in air and soil, is in focus. We develop several scenarios, distinguishing between cyclic and Dirichlet/radiation boundary conditions along the x axis, between summer and winter, and between various land cover types. Our results demonstrate that cyclic boundary conditions induce modifications in potential air temperatures due to changes in soil temperature. The magnitude of the impact varies with respect to the tested land covers, which primarily affect absolute temperatures. The time of day and season have a larger influence on the magnitude of the modifications. A 5 K increase in subsurface temperatures at 2 m depth results in a maximum increase of 0.38 K in near-surface potential air temperatures during winter between 09:00 and 10:00 local time after 3 d of simulation. When soil temperatures are decreased, we find predominantly inverse patterns. The least influence is found during summer at 09:00, when elevated soil temperatures increase potential air temperatures by only 0.02 K over short and tall grass and by 0.18 K over bare soil. When using Dirichlet/radiation boundary conditions, the atmosphere cannot develop freely, and changing soil temperatures do not impact potential air temperatures.
These results help enhance our understanding of the coupling between soil and atmospheric temperatures and also provide recommendations for the “simulatability” of idealized but reality-oriented scenarios in PALM-4U. This is one of the first studies to demonstrate that heat and cold sources in the soil can affect atmospheric parameters.
- Article
(4735 KB) - Full-text XML
- BibTeX
- EndNote
Anthropogenic encroachments on the environment lead to elevated temperatures (Intergovernmental Panel On Climate Change, 2023). More than 50 % of the global population lives in cities and is exposed to a climate that is characterized by the built environment (Oke et al., 2017; Chakraborty and Lee, 2019; Benz et al., 2021). This percentage is projected to increase (UN2, 2019). Urban heat islands affect the health, general well-being, and productivity of city dwellers (Tong et al., 2021; Shahmohamadi et al., 2011; Heaviside et al., 2017). Furthermore, with increasing temperatures in the course of climate change and ongoing urbanization, this issue is exacerbated (Oke et al., 2017; Rizwan et al., 2008; Manoli et al., 2019; Huang et al., 2019). Accordingly, understanding the mechanisms that drive temperatures in an altered environment, including their connection to the underground, is of utmost importance.
Anthropogenic activities alter subsurface temperatures from their natural state via numerous heat sources and modified heat fluxes, e.g., through urbanization processes (Tissen et al., 2019; Menberg et al., 2013). These activities induce rising temperatures in the soil and aquifer (as observed from groundwater temperatures). Here, we use the term soil temperatures to describe temperatures at the shallow depth of 2 m, predominantly in the unsaturated zone. Numerous studies, primarily conducted within the groundwater research community, have investigated temperatures in the subsoil and depicted multiple heat sources, especially in urban areas and the built environment, which impact soil and groundwater temperatures (Epting et al., 2017; Noethen et al., 2023; Tissen et al., 2019). These can be measured worldwide in boreholes and groundwater wells. Anthropogenic heat is accumulated and stored in the subsurface beneath cities, contributing to altered heat fluxes and higher temperatures compared to rural surroundings (Tissen et al., 2019; Benz et al., 2018). In particular, heated buildings and underground infrastructure, including tunnels, underground parking lots, subways, water pipes, sewers, and basements, lead to modifications in the thermal regime of the subsurface. Mostly, these constructions add energy to the system, resulting in elevated subsurface temperatures (Oke et al., 2017; Benz et al., 2022). Even a single construction in the subsurface can lead to thermal pollution of several degrees Celsius in the surrounding area (Attard et al., 2016). For example, ground temperatures near underground parking garages can be up to 10 K warmer. This occurs both within and outside the urban environment and contributes to the accumulation of urban waste heat. Also, ground temperatures next to wastewater pipes, mining sites, or landfills differ by 3 to 10 K compared to the surrounding area. Hence, highly developed buried infrastructure is chiefly responsible for subsurface warming (Benz et al., 2022; Böttcher and Zosseder, 2022). Not only anthropogenic sources but also natural sources, such as hot springs, can significantly alter ground temperatures (Tissen et al., 2019).
Thermal coupling between the underground and the atmosphere is complex. Meteorological forcing, soil moisture, soil temperature, heat transfer within the subsurface, and vegetation influence land–atmosphere flux exchanges (Gao et al., 2008). The release of heat from the subsurface to the atmosphere can modify boundary layer dynamics and local wind patterns and affect atmospheric stability (Rahman et al., 2015; Wouters et al., 2019; Brunsell et al., 2011). These atmospheric changes, in turn, can impact local meteorology and air quality (Hermoso de Mendoza et al., 2020; Asaeda and Ca, 1993; Santamouris et al., 2017).
Most land–atmosphere studies still focus on the impact of the atmosphere on the ground by using a top-down scheme with a very simple treatment of the soil. For example, Staniec and Nowak (2016) employ a mathematical model to project annual soil temperature distributions based on the transient heat conduction equation. They find that soil temperatures are significantly sensitive to alterations in air temperature. Several studies model soil temperature derived from air temperatures with physical models or with machine learning (Bayatvarkeshi et al., 2021; Hu et al., 2017; Liang et al., 2014). In addition, Taylor and Stefan (2009) analyze the potential impacts of climate and land use on surface and shallow-groundwater temperatures with the aid of a 1-D heat diffusion equation. Similarly, Nitoiu and Beltrami (2005) depict subsurface thermal disturbances due to land use changes. Kurylyk and MacQuarrie (2014) examine the response of subsurface temperature to changes in atmospheric conditions using an analytical solution for a 1-D transient conduction–advection equation and validate it with numerical methods.
In our study, we ask the reverse: do alterations in soil temperatures impact potential air temperatures? Due to a lack of usable real-world data, this study approaches this question numerically using an idealized domain. As such, it is intended as a proof of concept, laying the groundwork for future research. Idealized domains are not yet defined in the Parallelized Large-Eddy Simulation Model for Urban Applications (PALM-4U). Before conducting experiments, it is essential to thoroughly understand and characterize the processes in our area of investigation. To study the impact of subsurface heat on the near-surface atmosphere (considering heights up to 4000 m, with a special focus on the lowest 35 m) across various seasons and land cover settings, we utilize version 23.10 of PALM-4U (Maronga et al., 2015). The PALM-4U system uses large-eddy simulations (LESs) to calculate turbulent flows and incorporate both subsurface and atmospheric processes. It can provide valuable insights into the complex dependencies of these processes. In order to gain a general understanding of how underground temperature extremes impact the atmosphere, we model an idealized domain without any infrastructure or topography.
Accordingly, we set out to conduct a sensitivity analysis and address the following three distinct questions:
- a.
How can we depict a realistic but idealized domain in PALM-4U?
- b.
Do heat or cold extremes in the soil modify potential air temperatures?
- c.
What parameters affect these modifications?
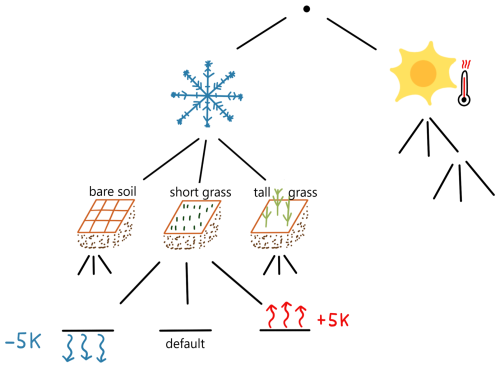
To answer these questions, we run our model for a total of 36 scenarios, based on different lateral boundary conditions, seasons, land cover types, and subsurface temperatures (Fig. 1). To our knowledge, we are the first to investigate this bottom-up procedure, which involves modifying soil temperatures and evaluating their effects on surface parameters, particularly atmospheric temperature. As of present, no quantitative assessment has been conducted. We aim to enhance our incomplete understanding of the interplay between evolving thermal conditions in the subsoil and the atmosphere. Additionally, the research seeks to investigate the feasibility of simulations in an idealized scenario and elucidate the associated constraints. These idealized scenarios provide a paramount understanding of the potential influence of varying soil temperatures in an unaltered environment.
2.1 PALM-4U
In this study, we use the turbulence- and building-resolving LES urban climate model PALM-4U (version 23.10). PALM-4U is capable of simulating meteorological processes at building-resolving scales down to sub-meter scales. The model has been developed at the Institute of Meteorology and Climatology at Leibniz University Hannover. The specifications and capabilities of the model are described in detail by Maronga et al. (2020). Here, we employ the model to investigate the coupling of temperatures between the soil and the atmosphere, with a focus on deep-soil–atmosphere interactions. The model considers only conductive heat transport, i.e., no groundwater flow in the subsurface. Particularly in urban environments, advective heat transport can be neglected due to the widespread occurrence of sealed surfaces. With its deepest layer at 2 m depth, we can assume it does not reach the aquifer in most places. Effective thermal conductivity within the simulated 2 m soil layer is estimated individually for each grid cell based on the soil type, as specified by the geostationary input, and soil moisture.
In order to produce realistic results, realistic initial and lateral boundary conditions for both the atmosphere and the soil are required. The mesoscale numerical Weather and Research Forecasting (WRF) model (WRF Community, 2000; Skamarock et al., 2019) can be used to provide large-scale meteorological forcing, e.g., wind and temperature, in the form of profiles or 3-D data (Maronga et al., 2020). Furthermore, precise information on the geospatial components, surface, and local environment is essential. Thus, PALM-4U also incorporates static surface information. The so-called static driver contains, for example, the topography, properties of the surface, geometries (height and type) of buildings and street canyons, soil type (coarse, medium, fine, etc.), vegetation type, and land cover type (short or tall grass, crops, shrubs, forests, bare soil, etc.), as well as the current state and type of the plant canopy. Variables like roughness length, emissivity, and leaf area index are automatically prompted by the model and are summarized in the following lookup tables: https://palm.muk.uni-hannover.de/trac/wiki/doc/app/iofiles/pids/static/tables (last access: 19 December 2024) and https://palm.muk.uni-hannover.de/trac/wiki/doc/app/land_surface_parameters (last access: 19 December 2024). In addition, it is worth noting that up to 20 different soil layers with corresponding temperatures, moisture levels, and root fractions can be implemented.
2.2 Idealized domain
We aim to disentangle the effects of changes in soil temperature on the atmosphere from the influence of surface heterogeneities. For this purpose, an idealized test domain is set up: our domain contains neither plants, such as bushes or trees, nor infrastructure, e.g., roads or houses. It is a homogeneous, flat terrain. We apply the land surface model (LSM) (Gehrke et al., 2021) and the radiative transfer model (Krč et al., 2021) integrated in PALM-4U. The LSM is used for modeling surface fluxes, i.e., the exchange of heat and moisture between the soil and the atmosphere, depending on the type of land cover (e.g., soil, water, and pavement), the radiation budget of the surface, and the atmospheric conditions. The radiative transfer model calculates the radiation budget of the Earth's surface and derives 3-D radiative interactions between surfaces and vegetation. The integrated models are based on the theory of a stable system, i.e., no climate change and no artificial or natural (e.g., geothermal) heat sources (Gehrke et al., 2021; Krč et al., 2021).
2.3 Scenarios
For each season (summer and winter) and land cover type (bare soil, short grass, and tall grass), we simulate multiple scenarios, adjusting the temperature of the deepest soil layer (−2 m) based on the following:
- i.
Status quo. In this scenario, default temperatures are derived from a 2-year soil spin-up.
- ii.
Heat source. Here, the temperature of the deepest layer is increased by +5 K.
- iii.
Cold source. In this scenario, we examine the potential effects of cooling the soil on the parameters of study by decreasing the temperature of the deepest soil layer by −5 K.
Figure 1 shows the scheme of all the scenarios, resulting in 18 runs for each of the two applied lateral boundary conditions. We set up the model to simulate 3 d with hourly data output. For the sake of examining not only the short-term behavior but also the long-term developments, we additionally run selected scenarios under Dirichlet/radiation and cyclic boundary conditions for 1 year.
2.4 Initial and lateral boundary conditions
Significant emphasis is placed on setting up the initial and lateral boundary conditions (LBCs hereafter). The Fortran namelist input parameter (P3D) file is provided in the “Code availability” section. The P3D file contains all the control parameters required for the model, such as the initial and boundary conditions, resolution, and variables to be output after the simulation. Specifically, an idealized, blank domain is located at lat 52.5103°, long 13.1418°, which corresponds geographically to an undeveloped area near Berlin. We chose a 10 m isotropic grid spacing with 50×50 grid points in the x and y directions (corresponding to a 500 m×500 m domain), as well as 50 grid points in the height (z) direction. We applied vertical stretching with a factor of 1.05 at a level of 300, resulting in a maximum value of dzmax=50.0. Thus, in total, z corresponds to 670.052 m. We also tested our simulations over a greater domain () but found that the domain size had no impact on our results. To save computational costs, we focus here on simulations conducted over a smaller domain.
We use cyclic boundary conditions along the y axis. In our different simulations, we test different LBCs along the x axis: Dirichlet/radiation LBCs (case A) and cyclic LBCs (case B).
Within PALM-4U, there are several options for LBCs, such as Dirichlet, cyclic, Neumann, and turbulence recycling LBCs, as well as those mentioned in conjunction with one radiation boundary, all of which can be looked up here: https://palm.muk.uni-hannover.de/trac/wiki/doc/app/initialization_parameters#bc (last access: 19 December 2024). Further, a detailed explanation of the LBCs and how they calculate the flow is given here: (https://palm.muk.uni-hannover.de/trac/wiki/doc/tec/bc (last access: 19 December 2024). We decided to use Dirichlet/radiation LBCs and entire cyclic LBCs because these options are plausible for our use case. In this way, the system can unfold without allowing too many degrees of freedom. The advantages and disadvantages we faced with these options are outlined in the discussion.
In case A, the Dirichlet condition is used on the inflow side for each variable. This means that a constant vertical profile is determined at the beginning and that the inflow properties do not change with time. On the outflow side, the radiation condition is employed across all velocity variables. The boundaries are not connected to each other. A turbulent flow develops due to the inherent friction of the flow itself, e.g., through irradiation and fluxes (Zhiyin, 2015). In case B, under cyclic boundary conditions, turbulence can be generated by itself along the x axis. The turbulence does not encounter any horizontal boundaries; hence, it can develop freely, flow out, and enter the domain again with its outflow values (https://palm.muk.uni-hannover.de/trac/wiki/doc, last access: 19 December 2024).
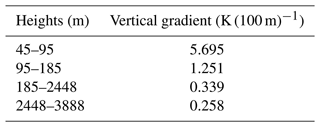
Half of the simulations start in summer (22 July 2022), whereas the remaining half start in winter (13 January 2022), with all simulations beginning at midnight. These dates were chosen because they represent the closest median winter and summer temperatures in Berlin for 2022 (calculated with data from the German Weather Service (DWD) Climate Data Center) (https://opendata.dwd.de/climate_environment/CDC/observations_germany/climate/hourly/air_temperature/recent, last access: 19 December 2024). Berlin has a temperate oceanic climate with moderate summers and mild winters. Its Köppen climate type thus corresponds to Cfb – a temperate oceanic climate characterized by moderate temperatures, a lack of extreme heat or cold, and precipitation evenly distributed throughout the year (Kottek et al., 2006). The clear-sky scheme is used for the radiative forcing in the simulation, which disregards clouds and modifications in aerosols. The temperature gradients of the initial temperature profile (K (100 m)−1) and the height levels above which the temperature gradient is effective can be seen in Table 1. These are derived from the “init_atmosphere_pt” variable of a previous WRF simulation for Berlin. For the actual run of the idealized case, no dynamic driver is used – only static variables (i.e., the static driver) and a P3D file.
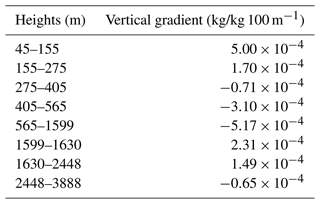
Analogously, the WRF data also serve for the calculation of the humidity gradient, “q_vertical_gradient”. Here, the data for the variable “init_atmosphere_qv” from the middle of the domain, at x=5000 and y=5000, are used. The levels (“q_vertical_gradient_level”) are selected according to the vertical profile. The calculated gradients (kg/kg 100 m−1) between each height (z) are shown in Table 2.
Initial potential temperatures at the surface are obtained from ERA5 hourly data, spanning the period from 1950 to the present, provided by the ECMWF Integrated Forecasting System (Copernicus Climate Change Service, 2019). Accordingly, in summer, the initial potential temperature at the surface is 20.7 °C, which corresponds to the 2 m air temperature for 22 July 2023 at 00:00 for the selected coordinates. All times in this paper are given in local time, which in Berlin is Central European Time (UTC+1 in winter and UTC+2 in summer). In the winter scenario, the initial potential temperature at the surface (“pt_surface”) is 275.75 K, which is 2.6 °C. The u component (west–east) of the wind speed has a value of 3 m s−1, and the v component (north–south) has a value of 0 m s−1. The LBCs we have specified assume that there is an outflow boundary. Therefore, a positive u component is required to ensure that the wind does not flow out via the (left) inflow side. With a negative u component, the radiation boundary conditions on the outflow boundary would fail because, in this case, there would be no proper outflow in the domain. Further, we include humidity in the domain, and the surface water vapor / total water mixing ratio, “q_surface”, in summer is 0.007 kg kg−1, which is derived from the WRF data for Berlin at z=5 m. In winter, it is 0.004 kg kg−1.
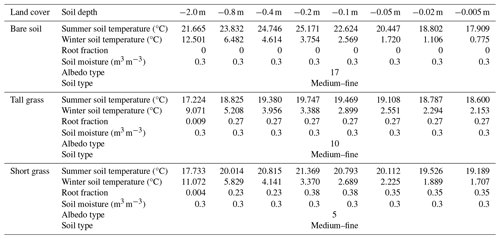
To estimate initial soil temperatures, a 2-year parameterized soil spin-up is performed without the influence of an interactive atmosphere for both winter and summer. We purposely chose a long spin-up period to allow deeper soil layers to adapt. Hence, at the beginning of the actual 3-D simulation, the soil heat flux and temperature are very close to equilibrium with the atmosphere. Specifically, all eight soil layers are initially horizontally homogeneous – i.e., the soil is horizontally isothermal. By default, the soil layers have depths (from top to bottom) of 0.005, 0.02, 0.05, 0.1, 0.2, 0.4, 0.8, and 2.0 m. During this process, the soil and wall layer temperatures are tailored to the prevailing atmospheric conditions. Due to the fact that we simulate each scenario with a different land cover type, this procedure is repeated for all land cover types: bare soil, tall grass, and short grass. The land cover types are set in the corresponding P3D file (called “vegetation_type”). In addition, the land cover is prescribed in the static driver. The last wall/soil spin-up temperature output serves as the initial soil temperature profile for all eight layers in the actual run, which can be seen in Table 3. In the actual simulations, the soil spin-up runs for only 3 d. In general, the soil spin-up is performed before the 3-D atmosphere is activated in order to save computational costs and time and to avoid misleading heat fluxes at the beginning of the model simulation (Maronga et al., 2020). Table 3 also includes the initial soil moisture (water volume per unit soil volume), soil type, root fraction, and albedo type assigned by PALM-4U. Most of the parameters vary with the land cover and the respective depths. These data are derived from the PALM-4U documentation page (https://palm.muk.uni-hannover.de/trac/wiki/doc/app/land_surface_parameters#dz_soil, last access: 19 December 2024).
We cannot set a fixed temperature in the soil to depict a fixed heat source; hence, we accept that in the model, the heat or cold source changes its temperature over time. Thus, running the model for 3 d after the soil spin-up is a compromise that provides enough time for the temperature signal to travel to the surface but not enough time to significantly alter the underground heat or cold source.
The amplitude of the diurnal near-surface temperature variation during the spin-up phase is 5.4 K in summer and 2.4 K in winter for all land cover types. These values are calculated using the 2 m air temperature data from ERA5 for the position near Berlin (see above) (Copernicus Climate Change Service, 2019). Regarding the processor topology, we use 10 processors along the x direction of the virtual processor grid and 5 along its y direction. The simulation is run with 50 cores and 50 tasks per node.
3.1 Impact of lateral boundary conditions in an idealized domain
As a first step, we compare the resulting differences between cyclic and Dirichlet/radiation LBCs arising when the domain is subjected to identical forcing for 3 d (the status quo bare-soil scenario for summer). Atmospheric potential air temperatures below 35 m height are 10–20 K warmer under cyclic LBCs, with soil temperatures warming marginally due to the coupling (Fig. 2). Cyclic LBCs produce larger differences between soil and atmospheric temperatures at the interface compared to Dirichlet/radiation LBCs (not shown).
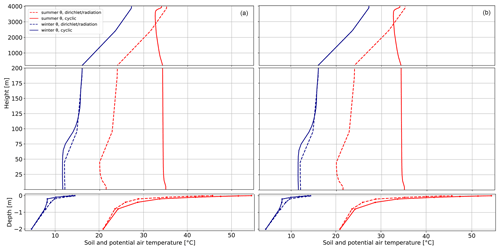
Figure 2Horizontally averaged profiles of vertical soil temperature and potential air temperature for the summer and winter default scenarios under Dirichlet/radiation and cyclic lateral boundary conditions, measured up to a height of 4000 m over bare soil after 3 d of simulation at (a) 04:00 and (b) 14:00. Note that the y axis is not scaled uniformly.
In winter, the behavior of the cyclic domain is notably different. After 3 d of simulation time, cyclic LBCs produce potential air temperatures that are several degrees colder during the night (Fig. 2). During the daytime, warmer potential air temperatures are found. While winter soil temperatures under cyclic LBCs show slight cooling compared to those in the Dirichlet/radiation domain, this difference decreases with depth. In addition, the differences between air and soil temperatures at the interface are less pronounced in the cyclic domain, as shown in Fig. 5. For Dirichlet/radiation LBCs, this difference is largely unaffected by the season (not shown).
When running the model for an entire year (not shown), only the Dirichlet/radiation LBCs lead to a plausible annual cycle. Under cyclic boundary conditions, air and soil temperatures show seasonal variations, but the domain heats up to beyond 100 K. This indicates that the system accumulates energy over time and is not stable. Such accumulation is caused by the domain's imitation of an infinitely large bare-soil plane, with no thermal sinks other than the deep soil. Convective cooling, in this case, only redistributes energy and does not dissipate it sufficiently to balance the radiative forcing. Hence, we focus our analysis on the results under cyclic LBCs after 3 d of simulation, when this effect has not yet dominated the system.
The temperature profiles under different LBCs differ not only near the surface but also throughout the entire modeled atmosphere up to 4000 m height (Fig. 2). Under Dirichlet/radiation LBCs, the profile at the inflow boundary remains the same as the initial profile throughout the entire simulation. This constant forcing prevents the atmosphere from developing freely. Near the surface, potential air temperatures decrease up to a height of 100 m, leading to an unstable atmosphere, meaning warmer (thinner) air is located below colder (denser) air. This so-called inversion is located at a height of about 200 m; from thereon, the potential temperature increases with height, resulting in a stable atmosphere. Due to this stable stratification, vertical motion and mixing are suppressed. The stable temperature gradient does not change substantially at greater heights. Despite the formation of diurnal cycles in the temperature profile, the prescribed profile is prominent throughout the simulation. Hence, the summer and winter potential-air-temperature profiles that develop in the simulations under Dirichlet/radiation LBCs are not useful for our analysis as they mostly reflect the values defined in the LBCs.
This is in contrast to the cyclic LBCs, under which the profile develops more freely and produces a more neutral, or even slightly unstable, temperature profile compared to the stable Dirichlet/radiation profile. In summer, the vertical temperature gradient is reduced (Fig. 2). Furthermore, a diurnal cycle develops such that the potential air temperature decreases slightly with height, producing slightly unstable conditions up to 3.7 km. Above this height, the conditions are more stable, with temperatures increasing with height. In winter, the cyclic LBCs produce substantially different temperature profiles, similar to the Dirichlet/radiation profiles. These differences between summer and winter are the result of different energy flows. In summer, a surplus of energy due to solar radiation leads to the soil heating up, with sensible heat transferring energy to the air near the surface. Thus, the heat flux moves from the ground into the atmosphere (except at night). In winter, larger longwave infrared emissions from the ground cause greater cooling of the soil. In addition, less solar radiation transfers heat into the system during the day. As potential air temperatures are warmer than soil temperatures, the energy flux becomes negative, meaning that the air transfers sensible heat to the ground. The resulting stable stratification and suppression of convective mixing cause the temperature profile to behave rather similarly to the Dirichlet/radiation profile.
Next, we investigate the 2-D spatial patterns of potential air temperature (exemplified for bare soil) and the wind in the domain, which maintains its westerly direction throughout the entire simulation (not shown). Under Dirichlet/radiation LBCs, the u and v components correspond to the initial profile (3 and 0 m s−1, respectively). Under cyclic LBCs, the effects of boundary layer development are evident.
In Fig. 3, we show horizontal x–y cross sections of instantaneous and 1 h averaged potential air temperature at 5 m height for different LBCs. In panel (a), instantaneous values for the Dirichlet/radiation LBCs are shown. Due to the aforementioned constant forcing at the inflow boundary and the homogeneous westerly flow, a gradient forms along the flow throughout the domain as the air receives energy from the soil along this trajectory. The intensity of the gradient differs with height, but there are no significant differences between the cross sections of average and instantaneous potential air temperature.

Figure 3(a) Instantaneous potential air temperature at 5 m above the surface over the entire domain, measured 11 h after starting the simulation under Dirichlet/radiation boundary conditions over bare soil. (b) Time-averaged potential air temperature at 5 m above the surface over the entire domain, measured between 26 and 27 h after starting the simulation under cyclic boundary conditions. (c) Instantaneous potential air temperature at 5 m above the surface over the entire domain, measured 11 h after starting the simulation under cyclic boundary conditions.
In contrast, under cyclic LBCs, different patterns develop, although with very marginal differences in potential air temperature, as shown in Fig. 3b. The hour-to-hour variations in these patterns are large. For instance, a wave pattern forms after 27 h, showing diagonal alignment. Just an hour later, fine structures are visible (not shown). In panel (c), cell structures are evident based on instantaneous data.
An examination of the x–z cross section reveals that even under Dirichlet/radiation LBCs, the lowest layers, up to 35 m height along the x axis, are not entirely laminar. However, in the higher atmosphere, the stable temperature stratification is constant in the x direction (not shown).
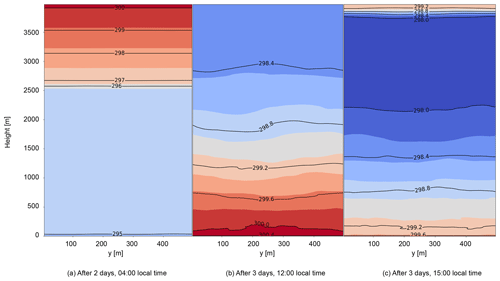
Under cyclic LBCs, the profile becomes more turbulent the longer the simulations run, especially after the third day at lower heights along the x axis. In terms of stratification, a thick, neutral residual layer develops at nighttime and remains until 09:00, as shown in Fig. 4a (after 2 d at 04:00). In addition, the surface cools down, while hotter potential air temperatures are present at greater heights. At midday (after 3 d at 12:00; Fig. 4b), when the soil heats up, a reversed temperature profile develops, and cooler temperatures reach the higher atmosphere. In the afternoon (after 3 d at 15:00; Fig. 4c), a thin layer of hot air forms above the colder layers at about 3800 m height. Figure 4 also reveals the expected course of the daily boundary layer height. This can be further substantiated by studying the humidity (not shown) (Hennemuth and Lammert, 2006; Kraus, 2008). In our simulation, the afternoon boundary layer height is about 1700 m. In the late afternoon (at 17:00), there is hardly any gradient, and the maximum degree of mixing has been reached, meaning that the moisture is lifted upward as far as possible from the ground. We observe this in consecutive x–z cross sections of instantaneous humidity (not shown). The formed structures disappear at heights around 1800 m, indicating detrainment, allowing us to identify this as the boundary layer height. However, as the temperature gradient counteracts, effective mixing cannot take place.
3.2 Coupling of soil and atmosphere under cyclic lateral boundary conditions
We ran all the simulations shown in Fig. 1 under both Dirichlet/radiation and cyclic LBCs. However, soil anomalies had no effect on potential air temperatures under Dirichlet/radiation LBCs. Therefore, we concentrate on the changes under cyclic LBCs.
3.2.1 Impact of the season and time of day
In Fig. 5a, we show the difference in potential air temperature (ΔΘ) between the default bare-soil scenario and the scenarios with either a heat or cold source for the entire third day, considering both summer and winter. In addition, absolute soil temperatures and potential air temperatures at 04:00 and 14:00, measured up to 35 m in height, are shown for summer and winter in panels (b)–(e). In response to the modification of the temperature of the deepest soil layer, the thermal signal travels upward, impacting both soil and potential air temperatures. When deep-soil temperatures increase by +5 K, the potential air temperatures in the first 35 m of height after 3 d over bare soil are, on average, 0.2 K warmer than those in the default scenario in summer, and they are 0.3 K warmer in winter (Fig. 5a). In general, the changes in potential air temperature are less pronounced in summer than in winter. The cold-source scenario produces similar but inverse patterns.
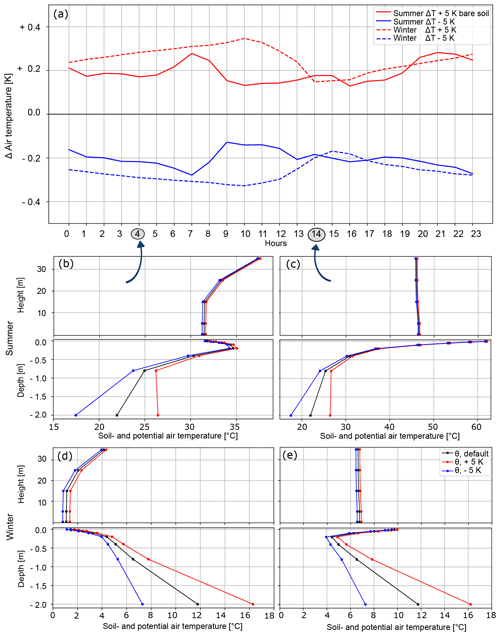
Figure 5Potential-air-temperature modifications at a height of 5 m over bare soil under cyclic boundary conditions for the entire third simulated day with respect to winter and summer. The change in air temperature corresponds to the difference between the default scenario and the modified one. Additionally, shown are the profiles of potential soil temperature and potential air temperature (at 04:00 and 14:00), measured up to a height of 35 m, for deep-soil (−2 m) temperatures corresponding to the default scenario, the +5 K scenario, and the −5 K scenario.
The differences between the default scenario and the modified scenarios (exhibiting either an increase or a decrease in the deep-soil temperature) are greatest at 10:00 and lowest at 14:00 for the winter scenario. In summer, the most pronounced differences are reached shortly after sunrise (at 07:00).
Considering Fig. 5b–e, it is evident that the soil temperatures for the various scenarios, i.e., the cold-source, heat-source, and default scenarios, converge toward the surface.
In addition, we find a typical day–night pattern of potential air temperatures. At night (Fig. 5b and d), potential air temperatures rise above 15 m height, while during the day (Fig. 5c and e), the air cools slightly with increasing height. Another point is that the differences between the soil temperatures closest to the surface (−0.005 m depth) and the potential air temperatures closest to the surface (5 m height) are greatest during the day. These differences are prominent in summer due to high radiation intensities (Fig. 5c), while the soil and potential air temperatures close to the surface do not differ strongly during the night (Fig. 5b and d). In addition, at 14:00 (during the day), potential air temperatures show a rather low sensitivity to changes in deep-soil temperature compared to at night and during morning hours.
3.2.2 Impact of land cover
Regarding the impact of land cover, the results behave as expected: temperatures are more sensitive as insulation decreases (Brunsell et al., 2011). Tall grass is the most inert land cover class, whereas bare soil is the most sensitive. Different types of land cover have a significant influence on absolute air and soil temperatures (Figs. 6b–e and 7b–e). Potential air temperatures over bare soil are somewhat more than 10 K warmer than those over tall or short grass. In comparison, the modifications in potential air temperature based on changes in deep-soil temperature are only slight across different land covers (Figs. 6a and 7a). Additionally, in winter, the potential-air-temperature modifications over different land covers are more similar than those in summer. A change of 5 K has an effect on the potential air temperature of up to a maximum of 0.3 K for all land covers. In summer, the anomalies are most pronounced for bare soil, where they are larger than 0.1 K throughout the day (Fig. 5a). In contrast, short grass and tall grass show anomalies in potential air temperature of less than 0.05 K during the daytime (Figs. 6a and 7a). It is also striking that, unlike over bare soil and short grass, increasing the deep-soil temperature over tall grass does not result in a symmetric potential-air-temperature profile between 17:00 and 07:00 compared to when the deep-soil temperature is decreased. Furthermore, bare soil has a more constant modification profile over the course of the day. With tall grass, however, strong variations in the diurnal cycle are visible (Fig. 7a).
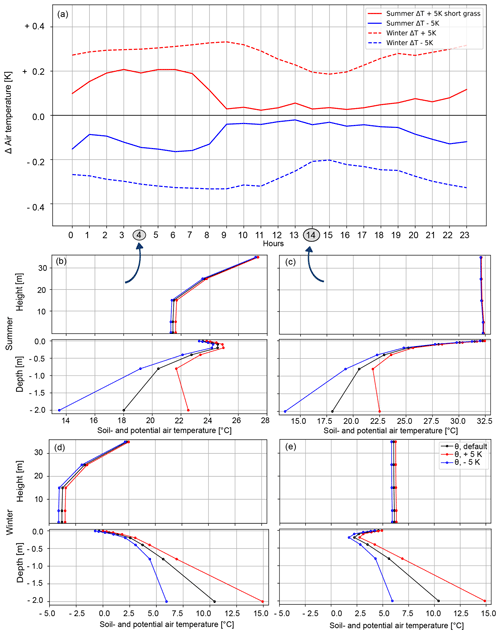
Figure 6Potential-air-temperature modifications over short grass under cyclic boundary conditions for the entire third simulated day with respect to winter and summer. Additionally, shown are the profiles of potential soil temperature and potential air temperature (at 04:00 and 14:00), measured up to a height of 35 m, for deep-soil (−2 m) temperatures corresponding to the default scenario, the +5 K scenario, and the −5 K scenario.
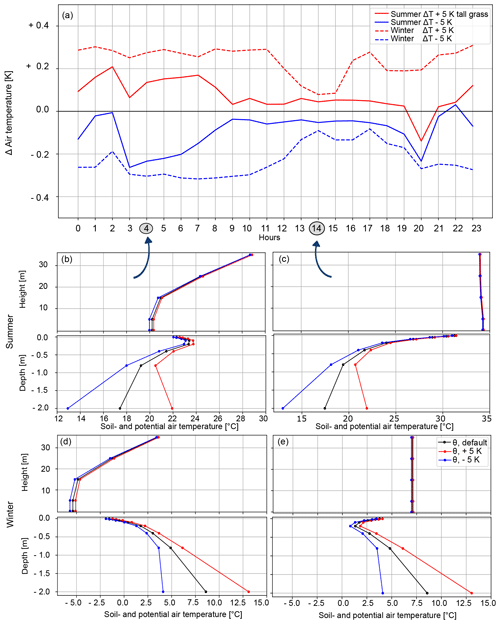
Figure 7Potential-air-temperature modifications over tall grass under cyclic boundary conditions for the entire third simulated day with respect to winter and summer. Additionally, shown are the profiles of potential soil temperature and potential air temperature (at 04:00 and 14:00), measured up to a height of 35 m, for deep-soil (−2 m) temperatures corresponding to the default scenario, the +5 K scenario, and the −5 K scenario.
Regarding the fluxes, as shown in Appendix A, a 5 K difference causes, on average, a 2.5 % change in ground (soil) heat flux for bare soil over the course of the third simulated day in summer and a 5.1 % change in winter. For short grass, the change corresponds to 5.4 % in summer and 2.8 % in winter. Similarly, for tall grass, it amounts to 7.7 % in summer and 3.1 % in winter.
4.1 Differences between Dirichlet/radiation and cyclic lateral boundary conditions
A general evaluation of the model performance to check the quality of the digital representation of reality cannot be conducted as there are no reliable observational data addressing the question of how heat sources in the soil affect ground-level atmospheric temperatures. Thus, our aim was to test our hypothesis for the first time using quasi-idealized experiments.
Under cyclic conditions, the atmosphere can develop freely; in contrast, under Dirichlet/radiation LBCs, a constant potential-air-temperature profile is prescribed at the inflow boundary. Although the air receives energy from the surface as it moves through the domain, this energy leaves the system through the radiation boundary on the outflow side and no longer remains in the domain (Maronga et al., 2020, https://palm.muk.uni-hannover.de/trac/wiki/doc, last access: 19 December 2024). Consequently, deep-soil temperature anomalies have no detectable effect on potential air temperatures under Dirichlet/radiation LBCs.
Furthermore, potential air temperatures under cyclic and Dirichlet/radiation conditions differ greatly due to a radiation imbalance (Maronga et al., 2020, https://palm.muk.uni-hannover.de/trac/wiki/doc, last access: 19 December 2024). Longer hours of sunshine in summer lead to an excess of energy in the system, particularly under clear-sky conditions. Accordingly, under cyclic LBCs, energy accumulates continuously in the system, and the domain warms steadily over the course of the simulation. In addition, the outflowing air returns through the inflow; thus, small imbalances accumulate over time (Maronga et al., 2020; Schumann and Sweet, 1988; Lund et al., 1998, https://palm.muk.uni-hannover.de/trac/wiki/doc, last access: 19 December 2024). Additionally, there is no sink of energy in the system. Thus, after just 3 d, temperatures under cyclic LBCs are significantly higher compared to those under Dirichlet/radiation LBCs.
In winter, temperatures are colder under cyclic LBCs than under Dirichlet/radiation LBCs. The radiation deficit causes net cooling under cyclic conditions. The temperature becomes colder throughout the run until a stationary point is reached. Under the clear-sky radiation balance, there is no equilibrium between emitted and incoming radiation. More longwave radiation is emitted, which leads to a decrease in soil temperature. Thus, after 3 d, the temperatures are already more than 10 K lower than those under Dirichlet/radiation LBCs. In addition, the air continues to emit energy to the ground after 3 d. With lower deep-soil temperatures, the energy flow from the soil into the atmosphere is even lower (Wanner et al., 2022). Additionally, it must be mentioned that the inherent reactions of the soil and atmosphere lead to different timescales for adaption to soil temperature anomalies. The atmosphere reacts quickly, whereas the soil is an inert system (Asaeda and Ca, 1993; Benz et al., 2022; Tissen et al., 2019; Staniec and Nowak, 2016). There is hysteresis, the inertial effects caused by the different reaction timescales, which means the system cannot be in full balance after a short time period.
Another reasonable aspect is that under cyclic LBCs, the air and soil temperature values are closer together. Generally, an equilibrium between air and soil can be established as the air adapts to the soil and vice versa (Gehrke et al., 2021; Maronga et al., 2020). The longer the simulation runs, the closer the two temperatures approach each other. Under Dirichlet/radiation LBCs, the difference between these two temperatures depends on the amount of imbalance in the forcing data.
Regarding the spatial evolution of the variables (x–y cross section; see Fig. 3), a constant gradient prevails in the domain under Dirichlet/radiation LBCs. Since the LBCs are prescribed, no free development is possible in the atmosphere. The cyclic LBCs allow more freedom for the variables to develop (Schumann and Sweet, 1988). In a broader sense, the solar radiation begins to heat the ground after sunrise, and different structures form. Depending on the gradient of temperature difference, turbulent movements arise. These are smaller in the beginning, when solar radiation is still relatively low, but grow larger during the day. In the x–z cross section, disturbances can be seen even when Dirichlet/radiation LBCs are applied. The disturbance that enters the atmosphere in the model originates from the deep soil. Although the stable profile strongly suppresses vertical movements, it has little effect on the near-surface potential air temperature.
4.2 Impact of land cover and seasonality under cyclic boundary conditions
The highest absolute temperatures and the largest offset between soil temperatures and potential air temperatures develop over bare soil (Fig. 5b–e). This can be explained by the lack of vegetation, resulting in less evapotranspiration and decreased latent heat flux. This, in turn, leads to increased ground heat flux, as well as decreased soil moisture and low heat capacity in bare soils (Brunsell et al., 2011). Our large modeled difference between soil and air temperatures is in line with the existing literature. For example, Cermak et al. (2017) conducted measurements of air, near-surface, and shallow-ground temperatures under bare soil, sand, short-cut grass, and asphalt and found that soil temperatures were generally warmer than near-surface air temperatures, particularly under high solar radiation. They also found different behaviors for different land cover types, with the highest offsets occurring on summer days under asphalt. Furthermore, when comparing all three land cover types, deep-soil temperature modifications impact potential air temperature differently, albeit to a small magnitude (Figs. 5a, 6a, and 7a), due to different surface properties, such as thermal conductivity, heat capacity, soil moisture, various surface energy balances, and the dependent influence of ground heat flux. However, seasonality and the time of the day have a more pronounced influence on the modifications of potential air temperature induced by our different scenarios. The effect of changing deep-soil temperatures on potential air temperatures is greater in winter than in summer and is more pronounced at night than during the daytime, when the atmosphere effectively transports heat upward through convection. In winter, when overall temperatures are cooler, the potential air temperature increases with height, i.e., the atmosphere is stable. The soil cools down, and the air transfers heat to the ground and becomes cooler. Due to this stable stratification, vertical air mixing is suppressed. In contrast, in summer, the air near the surface is additionally heated by the soil. With more heat in the soil, there is more outgoing longwave radiation and more convection. The colder, heavier air above falls below the warmer air due to buoyancy effects (Kraus, 2008). Furthermore, in summer, when the energy in the system increases, i.e., when the deep-soil temperature increases, a higher boundary layer develops (not shown). The energy is distributed over a larger volume. On the other hand, if the soil is cooled, the opposite effect occurs, and it stabilizes. By removing heat from the soil, convection is suppressed. With less heat transport in the atmosphere, the net transport is reduced. This effect is not linear but exponential (Hennemuth and Lammert, 2006; Wanner et al., 2022; Kraus, 2008). Therefore, the decrease with cooling is more pronounced than the increase with heating. The atmosphere responds more strongly to colder temperatures. At night, the air temperature modifications are more pronounced. This can be expected as the system is dominated by the sun during the day. At night, on the other hand, there is no heat source, and it is only dominated by radiative cooling. In addition, the response to colder temperatures is greater because the energy difference is distributed over a smaller volume in the cold scenario due to the mixing depth in the boundary layer. Due to increases in mixing layer height with seasonal changes in stability and solar irradiance, the same energy differences are distributed over a comparably larger volume during summer, resulting in local air temperature differences being less pronounced.
The aim of this study is to examine the sensitivity of potential air temperatures to soil temperature alterations in unaltered, homogeneous environments and, moreover, to test the simulatability of idealized domains by utilizing the coupled urban microclimate model PALM-4U. The response of the idealized domain is especially dependent on the LBCs. Both Dirichlet/radiation and cyclic LBCs along the x axis have certain limitations. Only under cyclic LBCs are potential air temperatures sensitive to soil temperatures. The magnitude of change depends mostly on seasonality and the time of day. This amounts to between 0.1 and 0.4 K, with a change of 5 K at a depth of 2 m in the soil. Land cover has an influence on both the absolute temperature and the magnitude of the potential-air-temperature modification. However, since energy accumulates in the domain under cyclic LBCs, it should only be used for short-term simulations. With the developed scenarios, it was not possible to reproduce entirely realistic conditions for an ideal domain at our chosen latitude and longitude. Impacts of deep-soil temperature anomalies on potential air temperatures only occur when using cyclic LBCs. However, an important finding is that time is a limiting factor. Our recommendation is to run the model for a maximum of 3 d; otherwise, too much energy is accumulated, and temperatures become unrealistically high. With Dirichlet/radiation LBCs, the atmosphere cannot develop freely. Nevertheless, if Dirichlet LBCs are used anyway, it would be required to add dynamic forcing from a large-scale model. One advantage is that certain physical properties, such as reasonable wind profiles, and their internal consistency can be guaranteed. Thus, instead of prescribing initial constant profiles for the inlet, a dynamic driver can be provided in the form of already modeled, time-resolved profiles. Such a setup even allows for long-term simulations because the energy in the system does not accumulate, as is the case with cyclic LBCs.
In summary, we show that temperature anomalies in the soil impact atmospheric potential air temperatures in some PALM-4U setups. The results underline the importance of an application-specific, well-elaborated, and precise setting of initialization and runtime parameters. In future studies, we aim to transfer our findings to real-world scenarios and investigate how the accumulation of subsurface waste heat influences atmospheric conditions. The latter is becoming an increasingly important factor as more interest arises in microclimatic influences on air temperatures, especially in urban contexts.
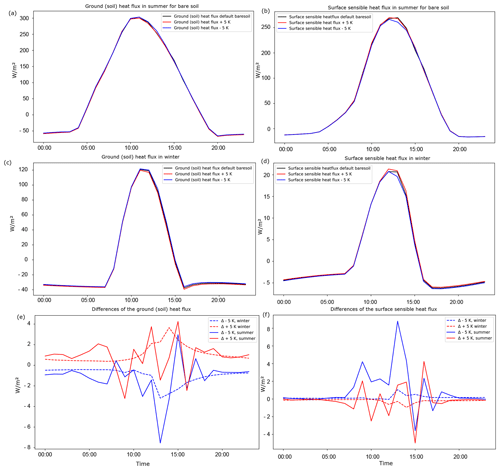
Figure A1Bare soil is the land cover type depicted here. Shown are the ground (soil) heat flux in summer (a), sensible heat flux in summer (b), ground (soil) heat flux in winter (c), sensible heat flux in winter (d), differences in ground heat fluxes across the various scenarios (e), and differences in sensible heat fluxes across the various scenarios (f). Negative values represent the upward transport of heat from the deep soil to the surface (i.e., heat loss), and positive values correspond to the downward flow of heat from the surface through the deeper soil layers (i.e., absorption). Note the different axis labels.
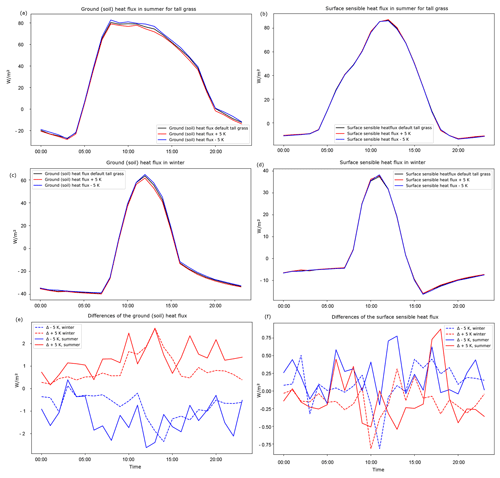
Figure A2Tall grass is the land cover type depicted here. Shown are ground (soil) heat flux in summer (a), sensible heat flux in summer (b), ground (soil) heat flux in winter (c), sensible heat flux in winter (d), differences in ground heat fluxes across the various scenarios (e), and differences in sensible heat fluxes across the various scenarios (f). Negative values represent the upward transport of heat from the deep soil to the surface (i.e., heat loss), and positive values correspond to the downward flow of heat from the surface through the deeper soil layers (i.e., absorption). Note the different axis labels.
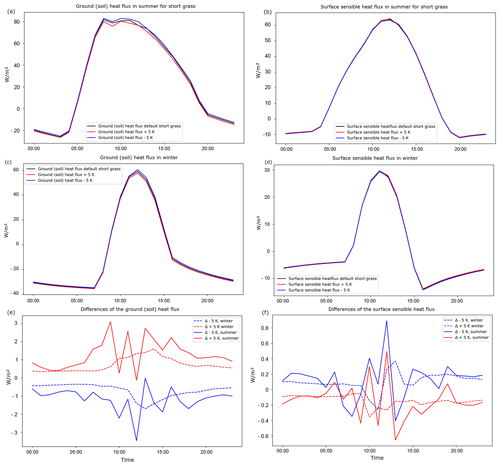
Figure A3Short grass is the land cover type depicted here. Shown are ground (soil) heat flux in summer (a), sensible heat flux in summer (b), ground (soil) heat flux in winter (c), sensible heat flux in winter (d), differences in ground heat fluxes across the various scenarios (e), and differences in sensible heat fluxes across the various scenarios (f). Negative values represent the upward transport of heat from the deep soil to the surface (i.e., heat loss), and positive values correspond to the downward flow of heat from the surface through the deeper soil layers (i.e., absorption). Note the different axis labels.
Our P3D file and static driver for running the simulation in PALM-4U (version 23.10) are available at https://github.com/patikit/Glocke_PALM4U_idealized_scenarios (last access: 19 December 2024) and https://doi.org/10.5281/zenodo.14529808 (Glocke, 2024).
No data sets were used in this article.
Conceptualization: PG, SAB, BK, and CCH. Methodology: PG and CCH. Validation: PG. Formal analysis: PG. Investigation: PG. Writing and original draft preparation: PG. Editing: SAB, CCH, and BK. Visualization: PG. Supervision: SAB and CCH. Project administration: SAB. All authors have read and agreed to the published version of the paper.
The contact author has declared that none of the authors has any competing interests.
Publisher's note: Copernicus Publications remains neutral with regard to jurisdictional claims made in the text, published maps, institutional affiliations, or any other geographical representation in this paper. While Copernicus Publications makes every effort to include appropriate place names, the final responsibility lies with the authors.
We acknowledge support from the KIT Publication Fund of the Karlsruhe Institute of Technology. Patricia Glocke, Susanne A. Benz, and Basit Khan are supported by a Freigeist Fellowship, funded by the Volkswagen Foundation. The authors gratefully acknowledge the computing time made available to them on the high-performance computer HoreKa at NHR@KIT. This center is jointly supported by the Federal Ministry of Education and Research and the state governments participating in the NHR Alliance.
This research has been supported by the Volkswagen Foundation (grant no. 9b 125, Freigeist Fellowship).
The article processing charges for this open-access publication were covered by the Karlsruhe Institute of Technology (KIT).
This paper was edited by Somnath Baidya Roy and reviewed by two anonymous referees.
Asaeda, T. and Ca, V. T.: The subsurface transport of heat and moisture and its effect on the environment: A numerical model, Bound.-Lay. Meteorol., 65, 159–179, https://doi.org/10.1007/BF00708822, 1993. a, b
Attard, G., Rossier, Y., Winiarski, T., and Eisenlohr, L.: Deterministic modeling of the impact of underground structures on urban groundwater temperature, Sci. Total Environ., 572, 986–994, https://doi.org/10.1016/j.scitotenv.2016.07.229, 2016. a
Bayatvarkeshi, M., Bhagat, S. K., Mohammadi, K., Kisi, O., Farahani, M., Hasani, A., Deo, R., and Yaseen, Z. M.: Modeling soil temperature using air temperature features in diverse climatic conditions with complementary machine learning models, Comput. Electron. Agr., 185, 106158, https://doi.org/10.1016/j.compag.2021.106158, 2021. a
Benz, S. A., Bayer, P., Blum, P., Hamamoto, H., Arimoto, H., and Taniguchi, M.: Comparing anthropogenic heat input and heat accumulation in the subsurface of Osaka, Japan, Sci. Total Environ., 643, 1127–1136, https://doi.org/10.1016/j.scitotenv.2018.06.253, 2018. a
Benz, S. A., Davis, S. J., and Burney, J. A.: Drivers and projections of global surface temperature anomalies at the local scale, Environ. Res. Lett., 16, 064093, https://doi.org/10.1088/1748-9326/ac0661, 2021. a
Benz, S. A., Menberg, K., Bayer, P., and Kurylyk, B. L.: Shallow subsurface heat recycling is a sustainable global space heating alternative, Nat. Commun., 13, 3962, https://doi.org/10.1038/s41467-022-31624-6, 2022. a, b, c
Böttcher, F. and Zosseder, K.: Thermal influences on groundwater in urban environments – A multivariate statistical analysis of the subsurface heat island effect in Munich, Sci. Total Environ., 810, 152193, https://doi.org/10.1016/j.scitotenv.2021.152193, 2022. a
Brunsell, N. A., Mechem, D. B., and Anderson, M. C.: Surface heterogeneity impacts on boundary layer dynamics via energy balance partitioning, Atmos. Chem. Phys., 11, 3403–3416, https://doi.org/10.5194/acp-11-3403-2011, 2011. a, b, c
Cermak, V., Bodri, L., Kresl, M., Dedecek, P., and Safanda, J.: Eleven years of ground–air temperature tracking over different land cover types, Int. J. Climatol., 37, 1084–1099, https://doi.org/10.1002/joc.4764, 2017. a
Chakraborty, T. and Lee, X.: A simplified urban-extent algorithm to characterize surface urban heat islands on a global scale and examine vegetation control on their spatiotemporal variability, Int. J. Appl. Earth Obs., 74, 269–280, https://doi.org/10.1016/j.jag.2018.09.015, 2019. a
Copernicus Climate Change Service: ERA5-Land hourly data from 2001 to present, https://doi.org/10.24381/CDS.E2161BAC, 2019. a, b
Epting, J., García-Gil, A., Huggenberger, P., Vázquez-Suñe, E., and Mueller, M. H.: Development of concepts for the management of thermal resources in urban areas – Assessment of transferability from the Basel (Switzerland) and Zaragoza (Spain) case studies, J. Hydrol., 548, 697–715, https://doi.org/10.1016/j.jhydrol.2017.03.057, 2017. a
Gao, Z., Horton, R., Wang, L., Liu, H., and Wen, J.: An improved force-restore method for soil temperature prediction, Eur. J. Soil Sci., 59, 972–981, https://doi.org/10.1111/j.1365-2389.2008.01060.x, 2008. a
Gehrke, K. F., Sühring, M., and Maronga, B.: Modeling of land–surface interactions in the PALM model system 6.0: land surface model description, first evaluation, and sensitivity to model parameters, Geosci. Model Dev., 14, 5307–5329, https://doi.org/10.5194/gmd-14-5307-2021, 2021. a, b, c
Glocke, P.: Glocke_PALM4U_idealized_scenarios, Zenodo [data set], https://doi.org/10.5281/zenodo.14529807, 2024. a
Heaviside, C., Macintyre, H., and Vardoulakis, S.: The Urban Heat Island: Implications for Health in a Changing Environment, Current Environmental Health Reports, 4, 296–305, https://doi.org/10.1007/s40572-017-0150-3, 2017. a
Hennemuth, B. and Lammert, A.: Determination of the Atmospheric Boundary Layer Height from Radiosonde and Lidar Backscatter, Bound.-Lay. Meteorol., 120, 181–200, https://doi.org/10.1007/s10546-005-9035-3, 2006. a, b
Hermoso de Mendoza, I., Beltrami, H., MacDougall, A. H., and Mareschal, J.-C.: Lower boundary conditions in land surface models – effects on the permafrost and the carbon pools: a case study with CLM4.5, Geosci. Model Dev., 13, 1663–1683, https://doi.org/10.5194/gmd-13-1663-2020, 2020. a
Hu, G., Wu, X., Zhao, L., Li, R., Wu, T., Xie, C., Pang, Q., and Cheng, G.: An improved model for soil surface temperature from air temperature in permafrost regions of Qinghai-Xizang (Tibet) Plateau of China, Meteorol. Atmos. Phys., 129, 441–451, https://doi.org/10.1007/s00703-016-0468-7, 2017. a
Huang, K., Li, X., Liu, X., and Seto, K. C.: Projecting global urban land expansion and heat island intensification through 2050, Environ. Res. Lett., 14, 114037, https://doi.org/10.1088/1748-9326/ab4b71, 2019. a
Intergovernmental Panel On Climate Change: Climate Change 2021 – The Physical Science Basis: Working Group I Contribution to the Sixth Assessment Report of the Intergovernmental Panel on Climate Change, 1st edn., Cambridge University Press, https://doi.org/10.1017/9781009157896, 2023. a
Kottek, M., Grieser, J., Beck, C., Rudolf, B., and Rubel, F.: World Map of the Köppen-Geiger climate classification updated, Meteorol. Z., 15, 259–263, https://doi.org/10.1127/0941-2948/2006/0130, 2006. a
Kraus, H.: Grundlagen der Grenzschicht-Meteorologie, Springer, https://doi.org/10.1007/978-3-540-75981-2, 2008. a, b, c
Krč, P., Resler, J., Sühring, M., Schubert, S., Salim, M. H., and Fuka, V.: Radiative Transfer Model 3.0 integrated into the PALM model system 6.0, Geosci. Model Dev., 14, 3095–3120, https://doi.org/10.5194/gmd-14-3095-2021, 2021. a, b
Kurylyk, B. L. and MacQuarrie, K. T. B.: A new analytical solution for assessing climate change impacts on subsurface temperature, Hydrol. Process., 28, 3161–3172, https://doi.org/10.1002/hyp.9861, 2014. a
Liang, L. L., Riveros-Iregui, D. A., Emanuel, R. E., and McGlynn, B. L.: A simple framework to estimate distributed soil temperature from discrete air temperature measurements in data-scarce regions, J. Geophys. Res.-Atmos., 119, 407–417, https://doi.org/10.1002/2013JD020597, 2014. a
Lund, T. S., Wu, X., and Squires, K. D.: Generation of Turbulent Inflow Data for Spatially-Developing Boundary Layer Simulations, J. Comput. Phys., 140, 233–258, https://doi.org/10.1006/jcph.1998.5882, 1998. a
Manoli, G., Fatichi, S., Schläpfer, M., Yu, K., Crowther, T. W., Meili, N., Burlando, P., Katul, G. G., and Bou-Zeid, E.: Magnitude of urban heat islands largely explained by climate and population, Nature, 573, 55–60, https://doi.org/10.1038/s41586-019-1512-9, 2019. a
Maronga, B., Gryschka, M., Heinze, R., Hoffmann, F., Kanani-Sühring, F., Keck, M., Ketelsen, K., Letzel, M. O., Sühring, M., and Raasch, S.: The Parallelized Large-Eddy Simulation Model (PALM) version 4.0 for atmospheric and oceanic flows: model formulation, recent developments, and future perspectives, Geosci. Model Dev., 8, 2515–2551, https://doi.org/10.5194/gmd-8-2515-2015, 2015. a
Maronga, B., Banzhaf, S., Burmeister, C., Esch, T., Forkel, R., Fröhlich, D., Fuka, V., Gehrke, K. F., Geletič, J., Giersch, S., Gronemeier, T., Groß, G., Heldens, W., Hellsten, A., Hoffmann, F., Inagaki, A., Kadasch, E., Kanani-Sühring, F., Ketelsen, K., Khan, B. A., Knigge, C., Knoop, H., Krč, P., Kurppa, M., Maamari, H., Matzarakis, A., Mauder, M., Pallasch, M., Pavlik, D., Pfafferott, J., Resler, J., Rissmann, S., Russo, E., Salim, M., Schrempf, M., Schwenkel, J., Seckmeyer, G., Schubert, S., Sühring, M., von Tils, R., Vollmer, L., Ward, S., Witha, B., Wurps, H., Zeidler, J., and Raasch, S.: Overview of the PALM model system 6.0, Geosci. Model Dev., 13, 1335–1372, https://doi.org/10.5194/gmd-13-1335-2020, 2020. a, b, c, d, e, f, g
Menberg, K., Bayer, P., Zosseder, K., Rumohr, S., and Blum, P.: Subsurface urban heat islands in German cities, Sci. Total Environ., 442, 123–133, https://doi.org/10.1016/j.scitotenv.2012.10.043, 2013. a
Nitoiu, D. and Beltrami, H.: Subsurface thermal effects of land use changes, J. Geophys. Res.-Earth, 110, F01005, https://doi.org/10.1029/2004JF000151, 2005. a
Noethen, M., Hemmerle, H., Menberg, K., Epting, J., Benz, S. A., Blum, P., and Bayer, P.: Thermal impact of underground car parks on urban groundwater, Sci. Total Environ., 903, 166572, https://doi.org/10.1016/j.scitotenv.2023.166572, 2023. a
Oke, T. R., Mills, G., Christen, A., and Voogt, J. A.: Urban Heat Island, in: Urban Climates, Cambridge University Press, 197–237, https://doi.org/10.1017/9781139016476.008, 2017. a, b, c
Rahman, M., Sulis, M., and Kollet, S. J.: The subsurface–land surface–atmosphere connection under convective conditions, Adv. Water Resour., 83, 240–249, https://doi.org/10.1016/j.advwatres.2015.06.003, 2015. a
Rizwan, A. M., Dennis, L. Y. C., and Liu, C.: A review on the generation, determination and mitigation of Urban Heat Island, J. Environ. Sci., 20, 120–128, https://doi.org/10.1016/S1001-0742(08)60019-4, 2008. a
Santamouris, M., Ding, L., Fiorito, F., Oldfield, P., Osmond, P., Paolini, R., Prasad, D., and Synnefa, A.: Passive and active cooling for the outdoor built environment – Analysis and assessment of the cooling potential of mitigation technologies using performance data from 220 large scale projects, Sol. Energy, 154, 14–33, https://doi.org/10.1016/j.solener.2016.12.006, 2017. a
Schumann, U. and Sweet, R. A.: Fast Fourier transforms for direct solution of poisson's equation with staggered boundary conditions, J. Comput. Phys., 75, 123–137, https://doi.org/10.1016/0021-9991(88)90102-7, 1988. a, b
Shahmohamadi, P., Che-Ani, A. I., Etessam, I., Maulud, K. N. A., and Tawil, N. M.: Healthy Environment: The Need to Mitigate Urban Heat Island Effects on Human Health, Procedia Engineer., 20, 61–70, https://doi.org/10.1016/j.proeng.2011.11.139, 2011. a
Skamarock, W. C., Klemp, J. B., Dudhia, J., Gill, D. O., Liu, Z., Berner, J., Wang, W., Powers, J. G., Duda, M. G., Barker, D. M., and Huang, X.-Y.: A Description of the Advanced Research WRF Model Version 4, https://doi.org/10.5065/1DFH-6P97, 2019. a
Staniec, M. and Nowak, H.: The application of energy balance at the bare soil surface to predict annual soil temperature distribution, Energ. Buildings, 127, 56–65, https://doi.org/10.1016/j.enbuild.2016.05.047, 2016. a, b
Taylor, C. A. and Stefan, H. G.: Shallow groundwater temperature response to climate change and urbanization, J. Hydrol., 375, 601–612, https://doi.org/10.1016/j.jhydrol.2009.07.009, 2009. a
Tissen, C., Benz, S. A., Menberg, K., Bayer, P., and Blum, P.: Groundwater temperature anomalies in central Europe, Environ. Res. Lett., 14, 104012, https://doi.org/10.1088/1748-9326/ab4240, 2019. a, b, c, d, e
Tong, S., Prior, J., McGregor, G., Shi, X., and Kinney, P.: Urban heat: an increasing threat to global health, The BMJ, 375, n2467, https://doi.org/10.1136/bmj.n2467, 2021. a
Wanner, L., De Roo, F., Sühring, M., and Mauder, M.: How Does the Choice of the Lower Boundary Conditions in Large-Eddy Simulations Affect the Development of Dispersive Fluxes Near the Surface?, Bound.-Lay. Meteorol., 182, 1–27, https://doi.org/10.1007/s10546-021-00649-7, 2022. a, b
World Urbanization Prospects: The 2018 Revision, UN, https://doi.org/10.18356/b9e995fe-en, 2019. a
Wouters, H., Petrova, I. Y., van Heerwaarden, C. C., Vilà-Guerau de Arellano, J., Teuling, A. J., Meulenberg, V., Santanello, J. A., and Miralles, D. G.: Atmospheric boundary layer dynamics from balloon soundings worldwide: CLASS4GL v1.0, Geosci. Model Dev., 12, 2139–2153, https://doi.org/10.5194/gmd-12-2139-2019, 2019. a
WRF Community: Weather Research and Forecasting (WRF) Model, UCAR/NCAR, https://doi.org/10.5065/D6MK6B4K 2000. a
Zhiyin, Y.: Large-eddy simulation: Past, present and the future, Chinese J. Aeronaut., 28, 11–24, https://doi.org/10.1016/j.cja.2014.12.007, 2015. a


