the Creative Commons Attribution 4.0 License.
the Creative Commons Attribution 4.0 License.
 | 15 Oct 2025
Normalizing the permafrost carbon feedback contribution to the Transient Climate Response to Cumulative Carbon Emissions and the Zero Emissions Commitment
Norman J. Steinert
Benjamin M. Sanderson
As permafrost thaws, the permafrost carbon feedback (PCF) can amplify the Transient Climate Response to Cumulative Carbon Emissions (TCRE) and the Zero Emissions Commitment (ZEC) by introducing additional greenhouse gases into the atmosphere. Using a basic permafrost carbon response model coupled to the simple climate model FaIR, we estimate this feedback's contribution to TCRE and ZEC100 (ZEC at 100 years after emission cessation) and find that it can substantially increase estimates of these climate metrics. TCRE is increased by 0.12 % per PgCeq °C−1 of PCF and is robust in scenarios with various emission rates. ZEC100's increase is emission-rate-dependent but is increased by 0.006 °C per PgCeq °C−1 of PCF for emission rates of 10 PgC yr−1 and is robust for varying emission rates when time-integrated warming is considered. Relating these climate metrics to permafrost carbon emissions allows the normalization of the PCF contribution to TCRE and ZEC by discounting its uncertainties.
- Article
(5418 KB) - Full-text XML
- BibTeX
- EndNote


The Transient Climate Response to Cumulative Carbon Emissions (TCRE) measures the global surface temperature increase per 1000 PgC of carbon emitted, given a near-linear relationship seen in the majority of Earth system models (Liddicoat et al., 2021; Gillett et al., 2013), making it a key metric for estimating remaining carbon budgets and guiding climate policy (MacDougall, 2016). Equally relevant for the Earth system response to warming is the Zero Emissions Commitment (ZEC), which refers to the expected temperature change that occurs after anthropogenic emissions are completely stopped (Palazzo Corner et al., 2023).
Both TCRE and ZEC are influenced by biogeochemical and thermal climate feedbacks, which can either amplify (positive feedbacks) or dampen (negative feedbacks) warming during transient warming periods and after carbon emission stabilization. However, consistent modeling of TCRE and ZEC in future climate scenarios is hindered by inter-model discrepancies in representing processes governing the thermal climate response that stems from inter-model differences in the effect of physical climate feedbacks and planetary heat uptake (Williams et al., 2020). These processes lead to significant uncertainty and disagreement between different climate models regarding their TCRE (Williams et al., 2020) and the sign and magnitude of temperature change following the cessation of carbon emissions (MacDougall et al., 2020).
One such climate feedback is the permafrost carbon feedback (PCF; Schuur et al., 2022). Permafrost is permanently frozen ground that remains at or below 0 °C for at least 2 consecutive years, typically found in polar regions. As temperatures rise, microbial decomposition from thawing permafrost emits additional carbon into the atmosphere in the form of CO2 and methane (Schuur et al., 2022). Earlier assessments did not fully account for the PCF, potentially underestimating its effect on TCRE and ZEC (Canadell et al., 2021; Natali et al., 2021). However, this feedback can amplify warming and potentially increase TCRE and ZEC estimates. For ZEC, a perturbed parameter experiment conducted with an Earth system model of intermediate complexity that represents the PCF to climate change projects an additional 0.27 °C warming 500 years post-emissions due to prolonged carbon release, with permafrost carbon loss partly offsetting mitigation efforts (MacDougall, 2021). There is still significant uncertainty in the quantification of the PCF due to structural differences between the models used to quantify the PCF, particularly in representing soil carbon decomposition response to climatic change (Burke et al., 2017; Canadell et al., 2021). This underscores the need to integrate the PCF (and propagate its uncertainties) into climate projections to refine TCRE and ZEC estimates.
Here, we quantify the contribution of the PCF to estimate TCRE and ZEC using a basic permafrost carbon response model coupled to the simple climate model FaIR. This allows us to obtain a relationship between permafrost carbon emissions and TCRE and ZEC, so the contribution of permafrost carbon emissions to these climate metrics can be independently inferred from knowledge of the PCF alone. This quantification considers the response of currently frozen carbon in the soil to warming, not including further positive and negative (localized) climate feedbacks, such as from vegetation interactions or its changing distribution (Pugh et al., 2018), nitrogen fertilization (Burke et al., 2022), or nonlinear dynamics of biogeochemical and biogeophysical processes (Nitzbon et al., 2024). However, a comprehensive sampling for climate and carbon response uncertainties constrained to the responses of the more complex models, although ambiguous, implicitly emulates some of these processes in our modeling approach.
To estimate the permafrost carbon feedback contribution to TCRE and ZEC, we compare two versions of the FaIR simple climate model: the standard version (v1.6.4; Smith et al., 2018) and a modified version that incorporates an idealized representation of the PCF (FaIR-PCF hereafter). To FaIR-PCF, we introduce a permafrost carbon response model (PerCX, Steinert, 2025) described in Eqs. (1)–(3). The carbon response to climate in PerCX is determined by the sum of the CO2 and CH4 responses:
Both and , derived as carbon emissions, are determined by an exponential decay function, taking into account the temperature history:
and
with Cp(0) denoting the initial carbon pool at time t=0 and Cp(t) denoting the time-evolving combined leftover CO2 and CH4 carbon pool after some emissions have been caused, i.e., . Additionally, there are currently 3 degrees of freedom in PerCX: the response amplitudes for CO2 and for CH4 and a combined response timescale τ. Here, we assume the response timescales for CO2 and CH4 to be the same, effectively releasing carbon at an identical rate. Note that this only refers to the rate of emissions, not the individual climate effects of CO2 and CH4, which is considered by FaIR internally. We also note that under certain circumstances, CH4 might be more volatile, for example, when abrupt thaw processes cause nonlinear CH4 responses to warming (Turetsky et al., 2020) – a scenario that is currently not captured in PerCX.
, and τ are calibrated by randomly sampling 1000 combinations of these parameters using a uniform independent distribution. The sampling range per parameter is chosen so that it exceeds the range (upper and lower end) of CMIP-model-based permafrost carbon loss under historical + SSP2-4.5 scenario warming (Fig. 1a) of 4–48 PgC °C−1 at 2100 (Fig. 1b) given in the Intergovernmental Panel on Climate Change's (IPCC) 6th assessment report (AR6, Canadell et al., 2021, Box 5.1). Then, only those parameter combinations are kept that give carbon loss estimates that fall into the AR6 range (here 775 of 1000 combinations). Note that this accounts for varying shapes of exponential decay, as long its response conforms to the constraining range at 2100. Additionally, the initial carbon pool size is set to Cp(0)=1400 PgC (Meredith et al., 2022; Schuur et al., 2022), and a CO2-to-CH4 ratio of is enforced so that and . Note that this constrained ensemble (Fig. 1b) still constitutes a big uncertainty reflected in idealized temperature “Transient” ramp up of 1.5 °C per century and “Stabilization” at 3 °C scenario simulations (Fig. 1c and d), where PerCX's carbon loss ranges between 118–728 and 146–828 PgCeq after 400 simulation years, with medians of 396 and 480 PgCeq, respectively.
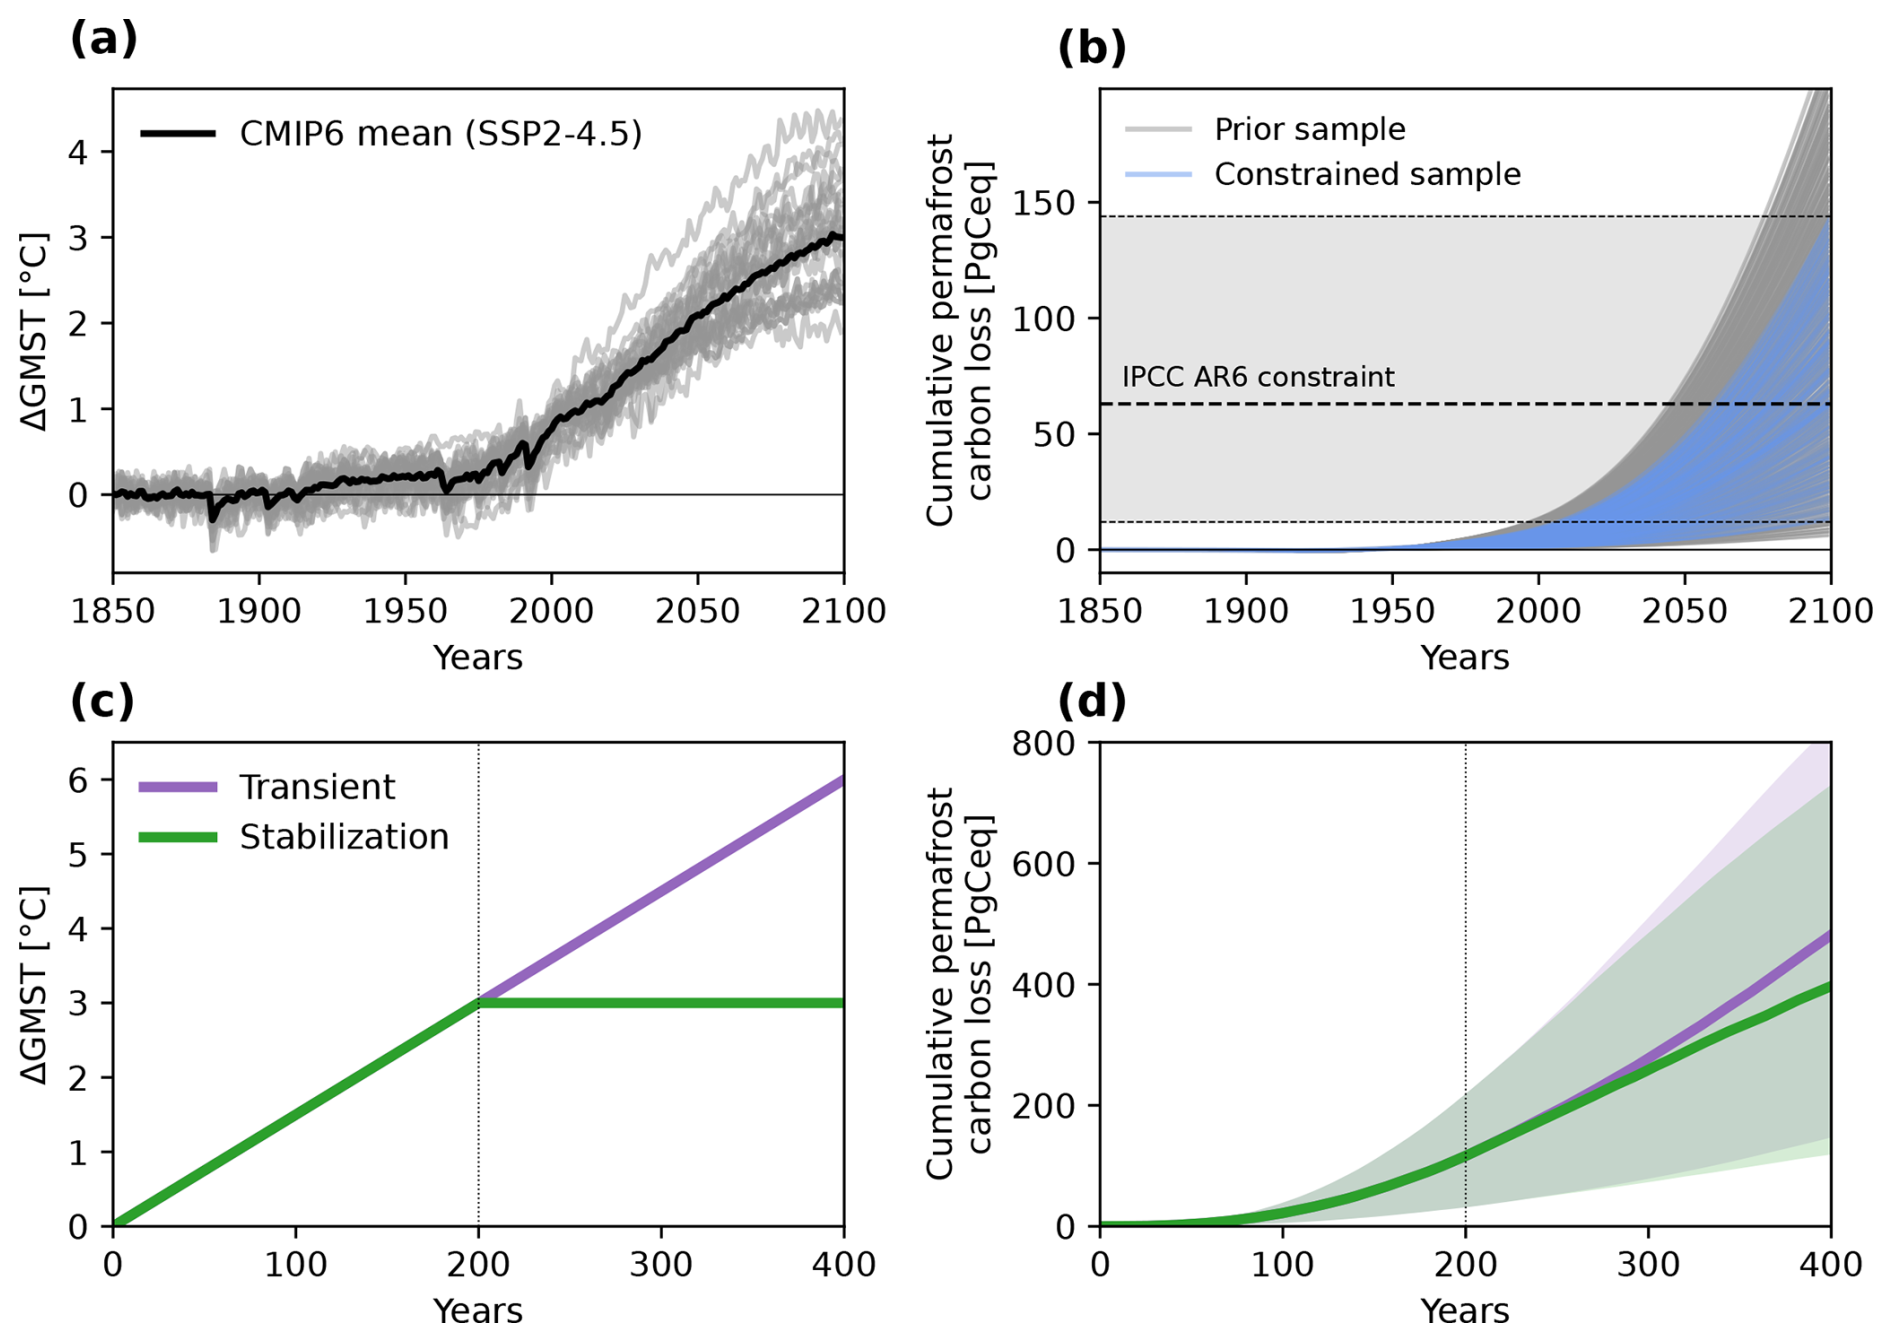
Figure 1(a) Global mean temperature anomaly (ΔGMST) of 29 CMIP6 Earth system models for the historical + SSP2-4.5 scenario relative to pre-industrial conditions. (b) Carbon loss response in PerCX to the CMIP6 ensemble mean in (a) to derive a prior sample (gray). CMIP-model-based permafrost carbon loss estimates from IPCC AR6 are then used to constrain PerCX parameter combinations (teal). (c) Idealized temperature “Transient” ramp up and “Stabilization” scenarios that are used to illustrate the out-of-sample response of PerCX to these idealized scenarios in (d).
Taking the combined CO2 (in units PgC) and CH4 (converted to units Mt) emissions as input, FaIR simulates their individual effects on the climate, including a consideration of their respective lifetimes. From a pool of 2237 parameter combinations – representing climate sensitivity uncertainty in FaIR (Forster et al., 2021; Smith et al., 2021) and the pool of 775 coefficient combinations from PerCX – representing carbon loss sensitivity, we perform uniform independent sampling for 1000 parameter combinations from these two pools to explore modeling uncertainties. The results of FaIR-PCF are tested against the UVic intermediate-complexity Earth system model (MacDougall, 2021) in Appendix A (Fig. A1).
Figure 2a shows results for simulations following the flat10MIP protocol for the flat10 experiment (Sanderson et al., 2025), assuming 10 PgC yr−1 emitted constantly over 200 years, which allows a quantification of TCRE. Here, TCRE and PCF are quantified over 1000 PgC of cumulative emissions (gray shading). For the standard FaIR, the mean temperature response exhibits a TCRE of 1.39 (1.25–1.52) °C EgC−1 (blue; median with minimum-to-maximum estimates in brackets) – on the lower end of the range of CMIP models (Arora et al., 2020). Considering the permafrost carbon response in FaIR-PCF yields a TCRE of 1.45 (1.32–1.59) °C EgC−1 (orange) – a median increase by 0.06 °C EgC−1, or 4.3 %. The effect of PCF is slightly increased when calculating TCRE over 2000 PgC of cumulative emissions, with a standard TCRE of 1.35 (1.15–1.51) °C EgC−1, increased by roughly 6.6 % due to PCF to 1.43 (1.21–1.61) °C EgC−1.
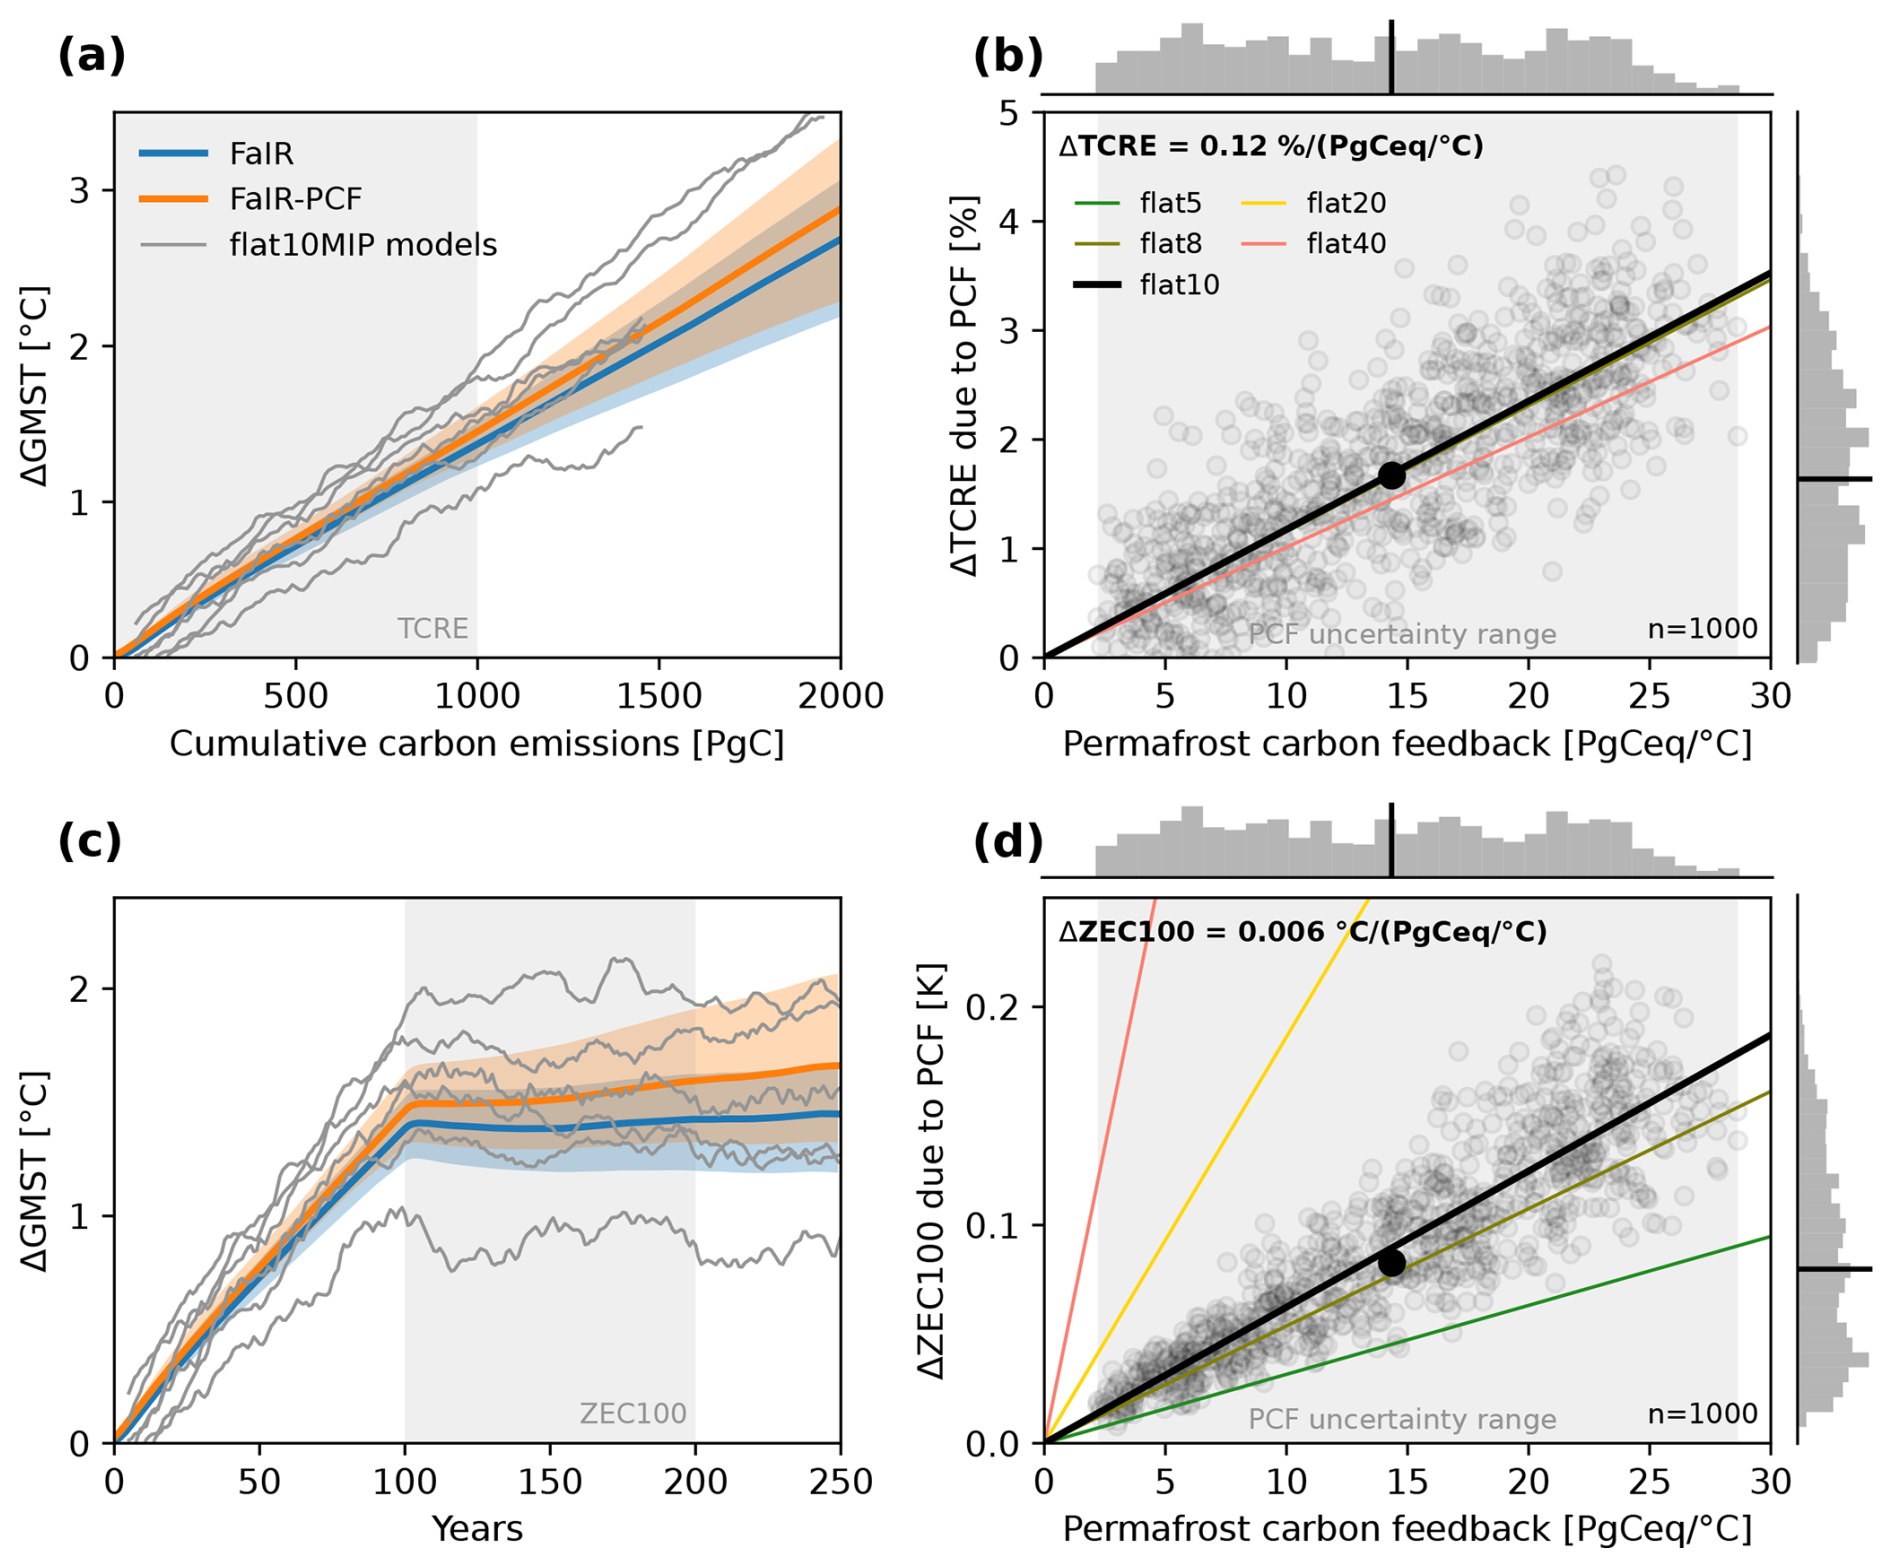
Figure 2(a) Global mean surface temperature (ΔGMST) relative to pre-industrial conditions vs cumulative carbon emissions of the flat10 scenario of 10 PgC annual emissions for 200 years, without (blue) and with (orange) permafrost carbon feedback (median of parameter ensemble distribution; shading shows the min-to-max range). The gray lines denote CMIP6 models (top to bottom: ACCESS-ESM1-5, CESM2, MPI-ESM1-2-LR, GISS, GFDL-ESM4, NorESM2-LM) that have performed the same experimental design within flat10MIP (Sanderson et al., 2025). For reference, the dashed and dotted black lines show previous estimates from MacDougall and Friedlingstein (2015). (b) TCRE increase [%] due to permafrost carbon feedback vs. permafrost carbon emissions (in PgCeq as the sum of CO2 and CH4 emissions) per degree of warming [°C]. Note that the uncertainty sampling is only shown for flat10, whereas flat10-like variations of that experiment constituting different warming rates (i.e., 5, 8, 20 and 40 PgC yr−1) are shown as colored lines. (c) ΔGMST temporal evolution of the flat10-zec scenario, 10 PgC annual emissions for the first 100 years before emissions cease. ZEC100 is estimated as the difference between simulation years 200 and 100. (d) Same as (b) but for ZEC100 changes due to PCF [K]. The sample size for the parameter ensemble in (b), and (d) is n=1000. Again, (d) also show estimates for flat10-like scenarios with different emission rates.
Given the uncertainties in existing permafrost carbon loss simulations, we quantify the percentage change of TCRE due to PCF to permafrost carbon emissions for all combinations of our uncertainty sampling (n=1000). The PCF is 14 (2–29) PgCeq °C−1, and its impact on TCRE ranges between 0 %–4.5 % (Fig. 2b). The emerging relationship yields a 0.12 % increase in TCRE per PgCeq °C−1 of PCF. Because the temperature response to cumulative emissions holds under various flat10-like scenarios with different emission rates, this relationship is also robust across variations of emission rates ranging from 5 to 40 PgC yr−1 (Figs. A2, A3a–e and A4a). Therefore, the quantification of this relationship allows for a more generalized translation between TCRE and PCF under a range of PCF feedback strengths. Using this framework then also allows us to infer a theoretical TCRE increase due to PCF if only the PCF is known, or, vice versa, quantifying TCRE differences allows us to infer a quantification of the PCF in a given climate model.
A previous estimate by MacDougall and Friedlingstein (2015) using the UVic Earth System Climate Model shows a much higher base TCRE of 1.9 K EgC−1 – at the upper end of CMIP6 models – and a strong increase of roughly 16 % in TCRE due to PCF to 2.3 K EgC−1. MacDougall and Friedlingstein (2015) acknowledge that UVic has one of the largest carbon releases from permafrost soils of any land surface model at the time of publication. They also report values for effective TCRE (i.e., including non-CO2 forcers), which tend to be higher than CO2-only TCRE values. Still, UVic's increased TCRE values compared to FaIR indicate a larger climate sensitivity of UVic, which could explain some of the differences to the results presented here. Using our generalized approach allows us to infer a substantially larger PCF in UVic (∼134 PgC °C−1), which is likely overestimated slightly due to the difference between CO2-only TCRE and effective TCRE.
Equally, for the quantification of the PCF effect on ZEC, Fig. 2c shows results for the flat10-zec experiment (Sanderson et al., 2025), following 10 PgC annual emissions for the first 100 years before emissions cease. The standard FaIR's ZEC100 (temperature 100 years after emissions cease relative to the year at which emissions cease) is 0.06 (−0.03 to 0.12) °C, whereas it is 0.14 (−0.01 to 0.33) °C for FaIR-PCF – a median increase of 0.08 °C. This indicates that the PCF contribution to ZEC100 is more than half as large as the ZEC100 uncertainty range in the standard FaIR. These numbers are comparable with previous studies employing a similar simulation setup quantifying the PCF to add 0.09 °C (0.04–0.21) °C to ZEC1000 after emitting 1000 PgC of CO2 with an additional 0.04 °C (0–0.06 °C) arising from thaw-lagged permafrost thaw, caused by rapid emission rates in standardized ZEC experiments (MacDougall, 2021).
Similar to TCRE, we further quantify ZEC100 relative to permafrost carbon emissions, which gives an increased by 0.006 °C per PgCeq °C−1 of PCF for emission rates of 10 PgC yr−1 (Fig. 2d). However, ZEC100's increase is emission-rate-dependent (also see Figs. A2 and A3), so that for smaller and larger emission rates ranging 5–40 PgC yr−1, ZEC100's increase due to PCF varies between 0.003–0.05 °C per PgCeq °C−1 (Figs. A3 and A4). This is due to the shortened ramp-up period allowing permafrost carbon emissions when emission rates are high, and vice versa. However, ZEC100's increase due to PCF is consistent across emission rates when the time-integrated temperature exposure is considered (Fig. A4d). This is also consistent with MacDougall (2021), who finds the PCF's relative impact to remain consistent across emission scenarios (1000 vs. 2000 PgC), though absolute carbon releases scale with total emissions. While the range of these feedbacks slightly increases ZEC, it does not fundamentally alter the conclusion that ZEC remains near zero on inter-decadal scales after emissions cease. However, it becomes increasingly significant over centuries due to persistent carbon release from thawed soils under the elevated stabilization temperature (McGuire et al., 2018).
The relationships found here generalize the contribution of permafrost carbon emissions to TCRE and ZEC100, so that uncertainties in the strength of the PCF are accounted for. Hence, TCRE and ZEC100 differences due to PCF can be quantified as long as the PCF and the scenario temperature trajectory (i.e., time-integrated warming) are known. Still, uncertainty in TCRE and ZEC estimates remains, as the amount and rate of permafrost carbon release generally depend on several factors, including regional warming patterns, soil moisture and microbial activity. However, regardless of whether current-generation climate models show a particularly weak or strong PCF, the relationship framework presented here allows us to simply infer the PCF's contribution to TCRE and ZEC100 using estimates provided here as a scaling factor (for TCRE) and an addition (for ZEC).
As a caveat, permafrost emissions could continue contributing to atmospheric CO2 and CH4 long after anthropogenic emissions peak and could therefore increase the current ceiling of PCF estimates, specifically when long timescales (e.g., centuries to millennia) or nonlinear responses to climate change are considered. Further, model-specific results indicating that increased feedback strength could lead to nonlinearity in TCRE (MacDougall and Friedlingstein, 2015) are not quantified with the current coupling of PercX and FaIR as used here. We therefore call for additional efforts and more complex models, e.g., permafrost-process-based models, including Earth system models, to further explore the possibility for deviations from a linear TCRE relationship and modifications of ZEC. These results highlight the necessity of incorporating the permafrost carbon feedback into climate projections to avoid underestimating future warming and refining carbon budget assessments.
The Appendix includes Figs. A1–A4.
Figure A1 shows the comparison of PerCX to the UVic intermediate-complexity model (MacDougall, 2021) for the esm-1pct-brch-1000PgC scenario, with additional PerCX results for the flat10-zec scenario for reference. The esm-1pct-brch-1000PgC scenario follows a 1 % increase of emissions per year, until emissions are reduced to zero when 1000 PgC of cumulative emissions is reached. Since this scenario is driven by CO2 concentration, these emissions are inferred from the default FaIR version 1.6.4 using the fair.inverse functionality. As noted by MacDougall (2021), equal in the application with UVic, this means that not all different model setups (i.e., parameter combinations or model variants) follow the 1 % pathway exactly, but this treatment ensures a simplification of the data handling and analysis of the results and likely presents a negligible deviation of the results from the true 1 % pathway of each model setups. UVic's median response to this scenario is a rapid loss of permafrost carbon over the first 100–200 years, where it starts to slow down for several centuries before it slowly starts to accelerate emission again towards the end of the simulation. In contrast, PerCX is slower in its initial median response to the forcing and starts to accelerate permafrost carbon loss when UVic starts to slow down before PerCX begins to stabilize towards the end of the simulation. At least in PerCX, the response differences between the esm-1pct-brch-1000PgC and flat10 scenarios are negligible. Together with the somewhat different temporal dynamic of the response between the two models, PerCX results in about 50 % larger median cumulative permafrost carbon loss at the end of the simulation. However, the lower range (5th percentile) of both models is quite similar, while the PerCX upper range (95th percentile) produces significantly larger carbon loss. This indicates that, in this model comparison, the median response of PerCX is biased by the upper end of the response range it is calibrated to. Since we opted for calibration to a response range of CMIP models here, and not a single model (which was in fact also tested during the calibration process), there are obvious differences between PerCX and UVic. Hence, the model differences are partly also an artifact of where UVic's permafrost carbon response lies in that AR6 range and how its median response differs from that of the average CMIP6 models. We note that, despite their differences, the functional form of the responses of PerCX and UVic is quite similar, and it would be possible to calibrate PerCX to output from UVic, which would result in a much closer match between the two model responses.
Figure A2 shows the flat10-like and flat10-zec-like scenario response of temperature and permafrost carbon loss from FaIR-PCF vs. time and cumulative emissions for various emission rates.
Figures A3 and A4 show the fits of TCRE and ZEC100 changes due to the permafrost carbon feedback for various emission rates, where Fig. A4 summarizes the results, also showing permafrost carbon feedback by time-integrated temperature exposure.
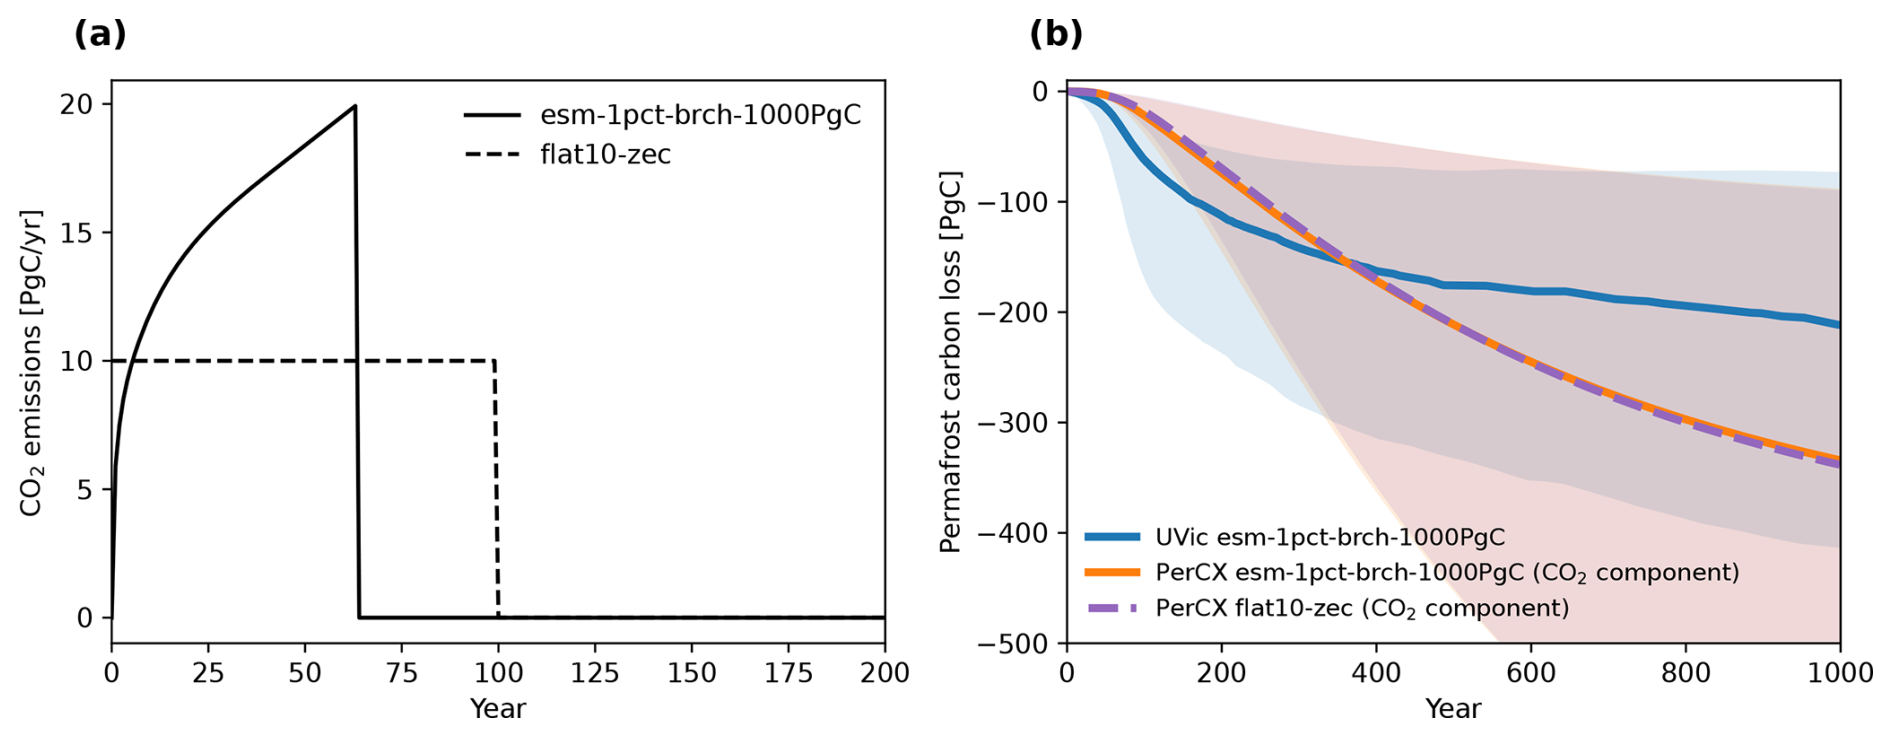
Figure A1(a) CO2 emissions over time for the 1 % increase scenario where emissions are abruptly decreased to zero (esm-1pct-brch-1000PgC) and the flat10-zec scenario. The emissions for esm-1pct-brch-1000PgC are inferred from the default FaIR version 1.6.4, given that this scenario is driven by CO2 concentration. (b) Cumulative permafrost carbon loss for the UVic model (MacDougall, 2021) and PerCX for the esm-1pct-brch-1000PgC scenario. Additionally, PerCX results for the flat10-zec scenario are shown. Note that PerCX results are only showing the permafrost carbon emissions of the CO2 component to allow for a direct comparison to UVic. The shaded areas denote the 5th–95th percentile ranges.
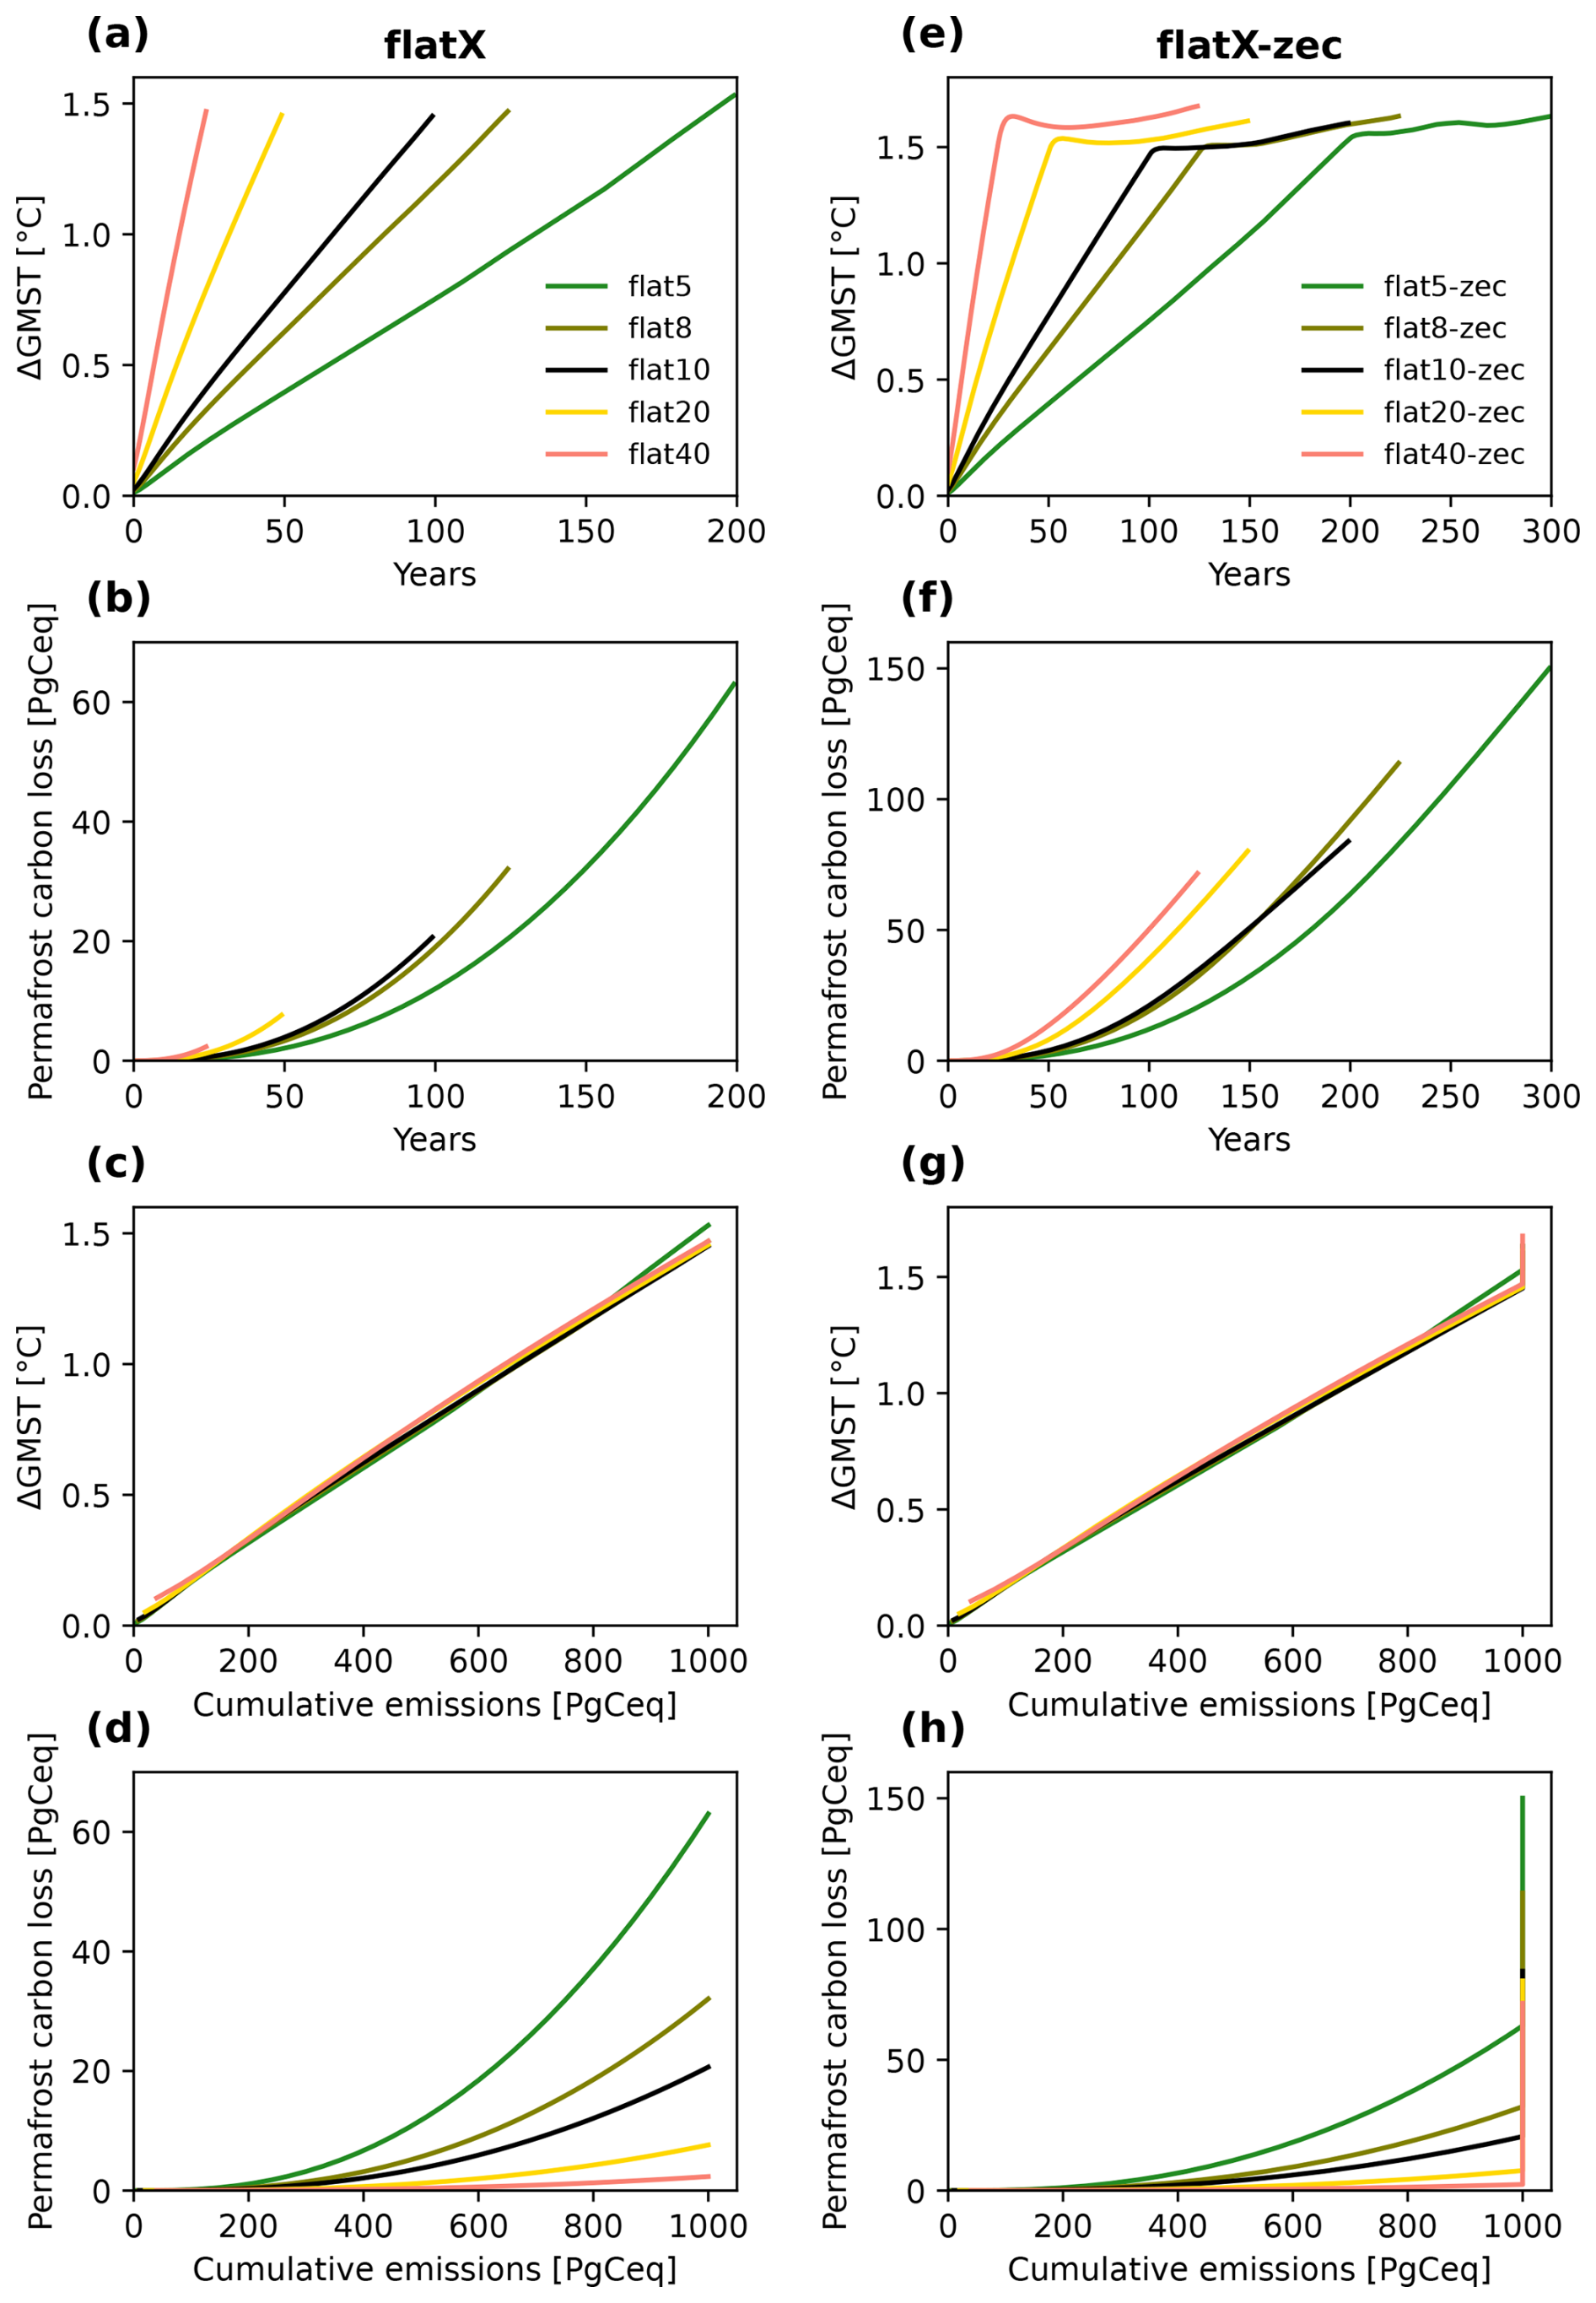
Figure A2(a) Global mean surface temperature (ΔGMST) relative to pre-industrial conditions over time from FaIR-PCF for flat10-like scenarios with emission rates ranging 5–40 PgC yr−1. (b) Cumulative permafrost carbon loss over time for the same scenarios. (c, d) Same as (a) and (b) but vs. cumulative carbon emissions. (e, f) Same as (a)–(d) but for flat10-like scenario with the same variations in emission rates.
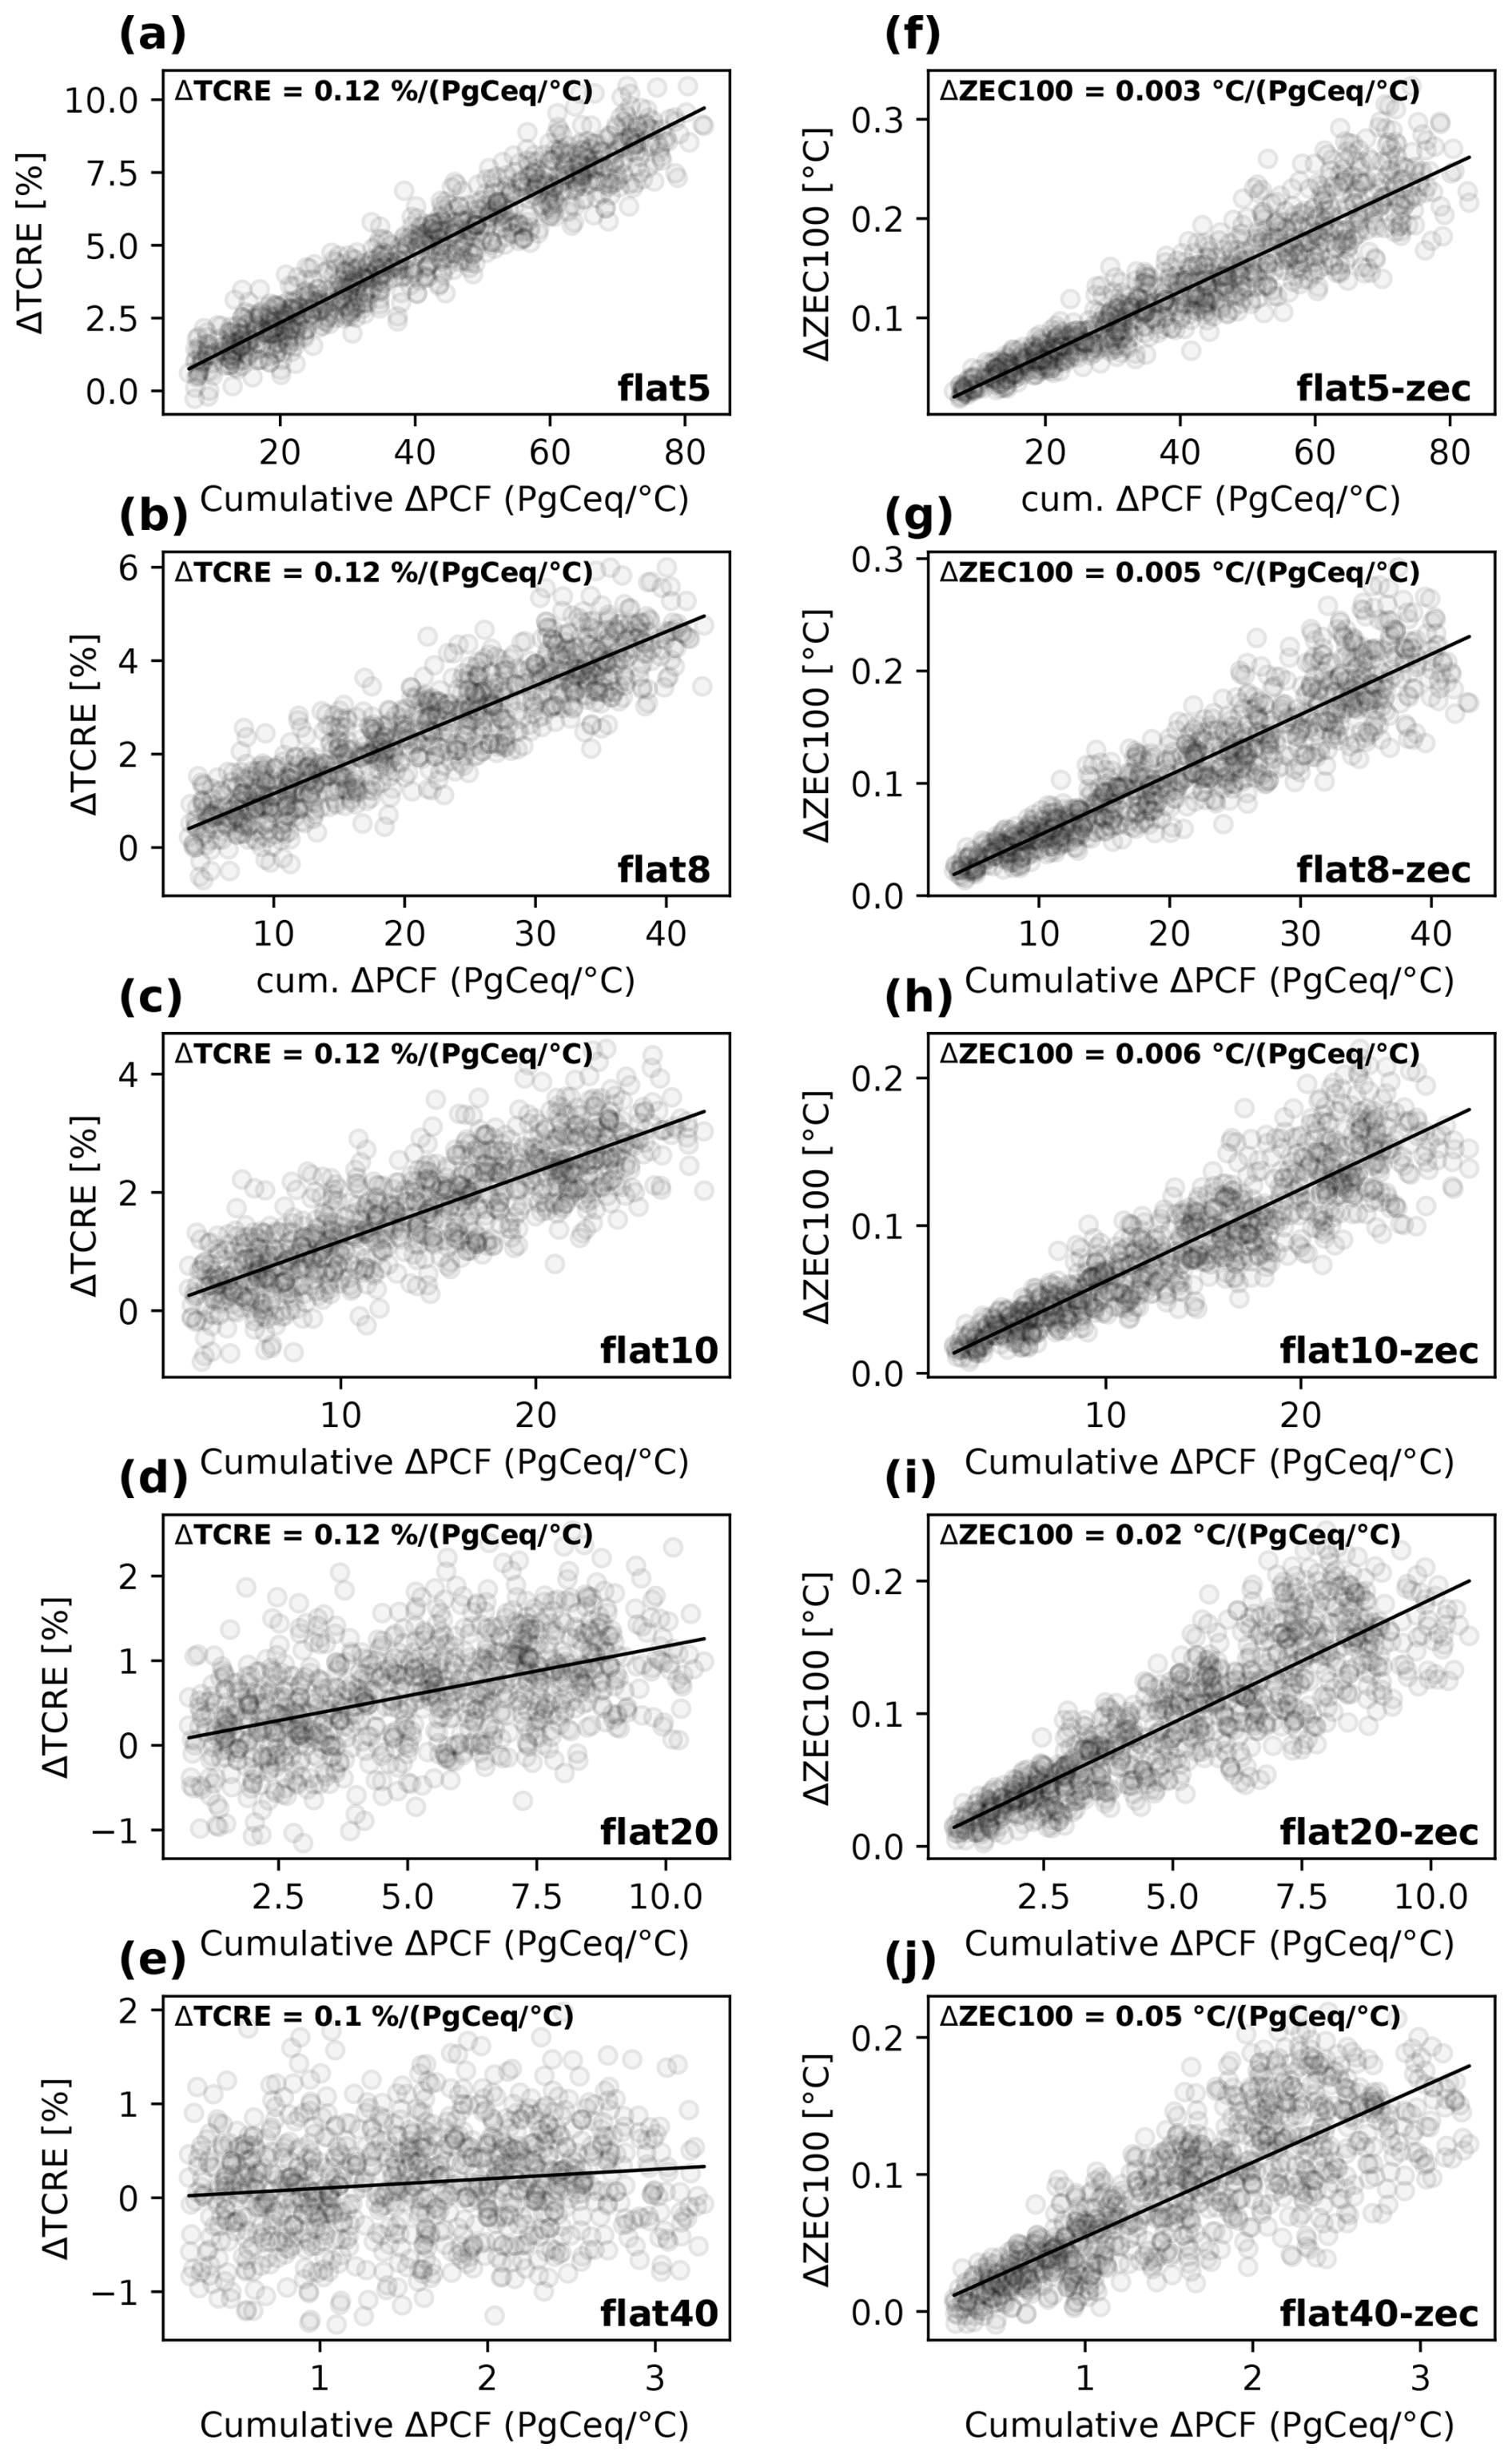
Figure A3(a–e) Changes in TCRE (ΔTCRE) by cumulative changes of the permafrost carbon feedback for flat10-like scenarios with emission rates ranging 5–40 PgC yr−1. Note that despite the PCF being smaller, the higher the emission rates, the more the changes of TCRE due to PCF are consistent across emission rates. (f–j) Changes in ZEC100 by cumulative changes of the permafrost carbon feedback for the same scenarios. Here, the absolute change of ZEC100 is emission-rate-dependent, increasing with increasing emission rates. Note that the results of flat10-zec in (c) and (h) are what is shown in Fig. 2.
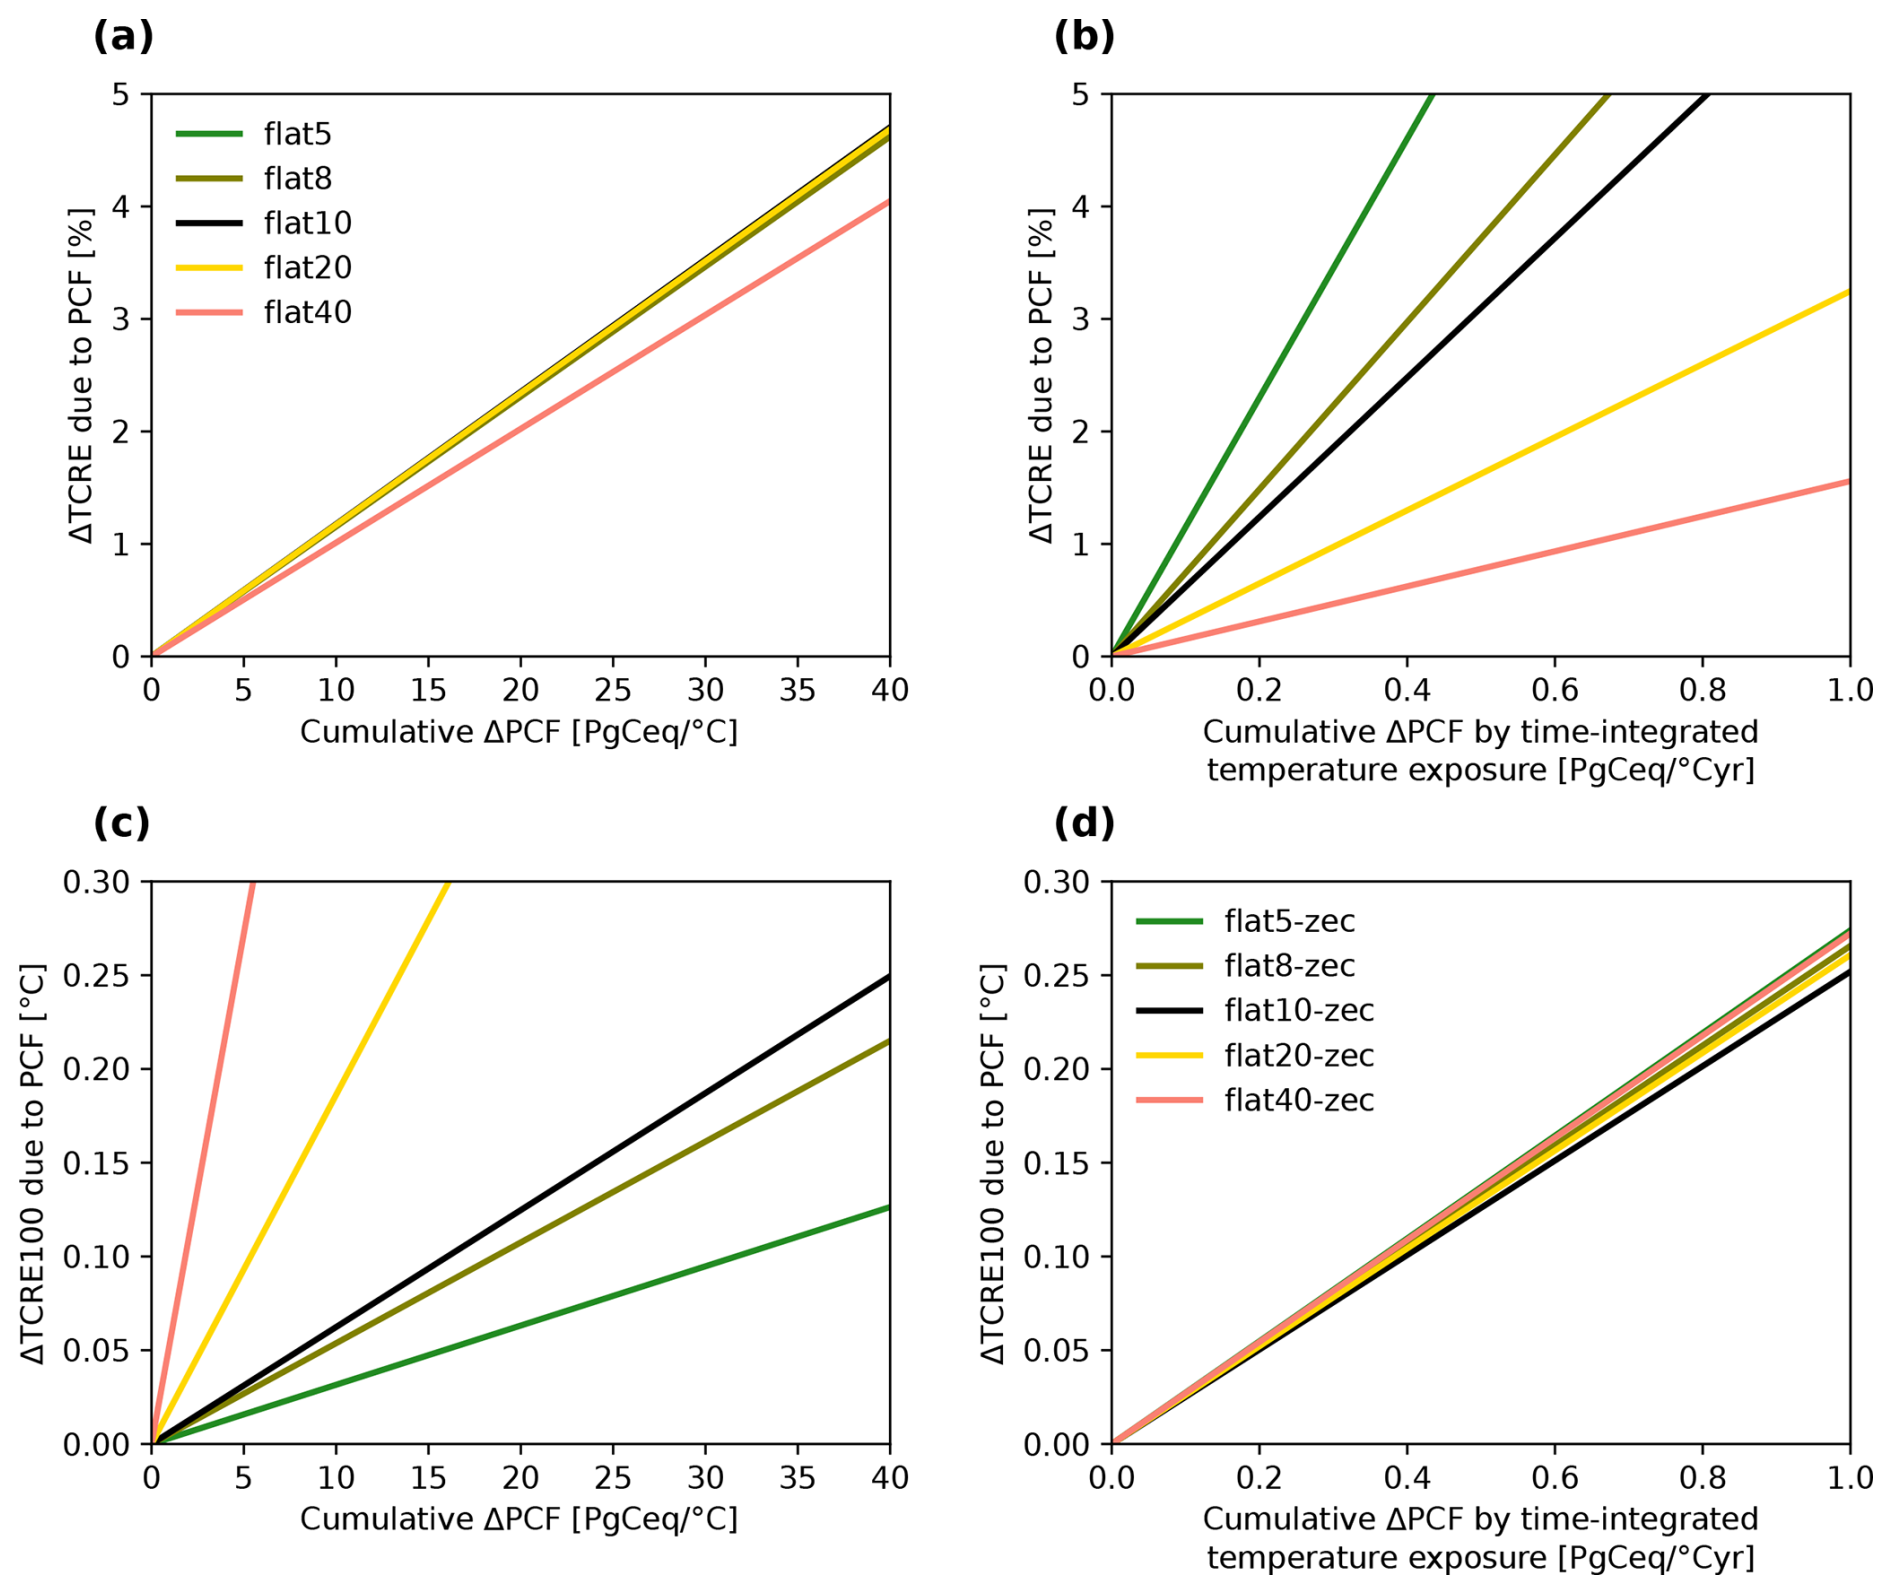
Figure A4(a) Changes in TCRE (ΔTCRE) by cumulative changes of the permafrost carbon feedback for flat10-like scenarios with emission rates ranging 5–40 PgC yr−1. (b) Same as (a) but for permafrost carbon feedback by time-integrated temperature exposure. Due to the shorter period until 1000 PgC of cumulative emissions for scenarios with higher emission rates, the time-integrated temperature exposure is less, permafrost carbon emissions are fewer, and vice versa. (c, d) Same as (a) and (b) but for ZEC100. Note that ZEC100 is emission-rate-dependent for changes due to PCF but is consistent across emission rates when the time-integrated temperature exposure is considered when assessing the contribution of permafrost carbon emissions in (d). Panels (a) and (c) replicate the results of Fig. 2b and d.
The code for the permafrost carbon response model PerCX can be found on Zenodo under the following DOI: https://doi.org/10.5281/zenodo.17279654 (Steinert, 2025). All data can be reproduced following the modeling examples provided in the repository. flat10MIP Earth system model data were taken from Sanderson et al. (2025). The model code and more information on the FaIR simple climate model are from Smith et al. (2021).
NJS and BMS designed and directed the concept of this paper. NJS conducted the model development, ran the model experiments, performed the calculations and wrote the manuscript, all with revisions from BMS.
The contact author has declared that neither of the authors has any competing interests.
Publisher's note: Copernicus Publications remains neutral with regard to jurisdictional claims made in the text, published maps, institutional affiliations, or any other geographical representation in this paper. While Copernicus Publications makes every effort to include appropriate place names, the final responsibility lies with the authors.
This research has been supported by the Norges Forskningsråd (grant no. 334811).
This paper was edited by Martin Heimann and reviewed by Chris Jones and Andrew MacDougall.
Arora, V. K., Katavouta, A., Williams, R. G., Jones, C. D., Brovkin, V., Friedlingstein, P., Schwinger, J., Bopp, L., Boucher, O., Cadule, P., Chamberlain, M. A., Christian, J. R., Delire, C., Fisher, R. A., Hajima, T., Ilyina, T., Joetzjer, E., Kawamiya, M., Koven, C. D., Krasting, J. P., Law, R. M., Lawrence, D. M., Lenton, A., Lindsay, K., Pongratz, J., Raddatz, T., Séférian, R., Tachiiri, K., Tjiputra, J. F., Wiltshire, A., Wu, T., and Ziehn, T.: Carbon–concentration and carbon–climate feedbacks in CMIP6 models and their comparison to CMIP5 models, Biogeosciences, 17, 4173–4222, https://doi.org/10.5194/bg-17-4173-2020, 2020. a
Burke, E. J., Ekici, A., Huang, Y., Chadburn, S. E., Huntingford, C., Ciais, P., Friedlingstein, P., Peng, S., and Krinner, G.: Quantifying uncertainties of permafrost carbon–climate feedbacks, Biogeosciences, 14, 3051–3066, https://doi.org/10.5194/bg-14-3051-2017, 2017. a
Burke, E., Chadburn, S., and Huntingford, C.: Thawing permafrost as a nitrogen fertiliser: implications for climate feedbacks, Nitrogen, 3, 353–375, 2022. a
Canadell, J., Monteiro, P., Costa, M., da Cunha, L. C., Cox, P., Eliseev, A., Henson, S., Ishii, M., Jaccard, S., Koven, C., Lohila, A., Patra, P., Piao, S., Rogelj, J., Syampungani, S., Zaehle, S., and Zickfeld, K.: Global carbon and other biogeochemical cycles and feedbacks, in: Climate Change 2021: The Physical Science Basis. Contribution of Working Group I to the Sixth Assessment Report of the Intergovernmental Panel on Climate Change, Cambridge University Press, Cambridge, UK and New York, NY, USA, https://doi.org/10.1017/9781009157896.007, 673–816, 2021. a, b, c
Forster, P., Storelvmo, T., Armour, K., Collins, W., Dufresne, J.-L., Frame, D., Lunt, D., Mauritsen, T., Palmer, M., Watanabe, M., Wild, M., and Zhang, H.: The Earth's energy budget, climate feedbacks, and climate sensitivity, in: Climate Change 2021: The Physical Science Basis. Contribution of Working Group I to the Sixth Assessment Report of the Intergovernmental Panel on Climate Change, Cambridge University Press, Cambridge, UK and New York, NY, USA, https://doi.org/10.1017/9781009157896.009, 923–1054, 2021. a
Gillett, N. P., Arora, V. K., Matthews, D., and Allen, M. R.: Constraining the ratio of global warming to cumulative CO2 emissions using CMIP5 simulations, J. Climate, 26, 130314153438000, https://doi.org/10.1175/jcli-d-12-00476.1, 2013. a
Liddicoat, S. K., Wiltshire, A. J., Jones, C. D., Arora, V. K., Brovkin, V., Cadule, P., Hajima, T., Lawrence, D. M., Pongratz, J., Schwinger, J., Séférian, R., Tjiputra, J. F., and Ziehn, T.: compatible fossil fuel CO2 emissions in the CMIP6 Earth system models' historical and shared socioeconomic pathway experiments of the twenty-first century, J. Climate, 34, 2853–2875, https://doi.org/10.1175/jcli-d-19-0991.1, 2021. a
MacDougall, A. H.: The transient response to cumulative CO2 emissions: a review, Curr. Clim. Change Rep., 2, 39–47, https://doi.org/10.1007/s40641-015-0030-6, 2016. a
MacDougall, A. H.: Estimated effect of the permafrost carbon feedback on the zero emissions commitment to climate change, Biogeosciences, 18, 4937–4952, https://doi.org/10.5194/bg-18-4937-2021, 2021. a, b, c, d, e, f, g
MacDougall, A. H. and Friedlingstein, P.: the origin and limits of the near proportionality between climate warming and cumulative CO2 emissions, J. Climate, 28, 4217–4230, https://doi.org/10.1175/jcli-d-14-00036.1, 2015. a, b, c, d
MacDougall, A. H., Frölicher, T. L., Jones, C. D., Rogelj, J., Matthews, H. D., Zickfeld, K., Arora, V. K., Barrett, N. J., Brovkin, V., Burger, F. A., Eby, M., Eliseev, A. V., Hajima, T., Holden, P. B., Jeltsch-Thömmes, A., Koven, C., Mengis, N., Menviel, L., Michou, M., Mokhov, I. I., Oka, A., Schwinger, J., Séférian, R., Shaffer, G., Sokolov, A., Tachiiri, K., Tjiputra , J., Wiltshire, A., and Ziehn, T.: Is there warming in the pipeline? A multi-model analysis of the Zero Emissions Commitment from CO2, Biogeosciences, 17, 2987–3016, https://doi.org/10.5194/bg-17-2987-2020, 2020. a
McGuire, A. D., Lawrence, D. M., Koven, C., Clein, J. S., Burke, E., Chen, G., Jafarov, E., MacDougall, A. H., Marchenko, S., Nicolsky, D., Peng, S., Rinke, A., Ciais, P., Gouttevin, I., Hayes, D. J., Ji, D., Krinner, G., Moore, J. C., Romanovsky, V., Schädel, C., Schaefer, K., Schuur, E. A. G., and Zhuang, Q.: Dependence of the evolution of carbon dynamics in the northern permafrost region on the trajectory of climate change, P. Natl. Acad. Sci. USA, 115, 3882–3887, https://doi.org/10.1073/pnas.1719903115, 2018. a
Meredith, M., Sommerkorn, M., Cassotta, S., Derksen, C., Ekaykin, A., Hollowed, A., Kofinas, G., Mackintosh, A., Melbourne-Thomas, J., Muelbert, M., Ottersen, G., Pritchard, H., and Schuur, E.: Polar regions, in: IPCC Special Report on the Ocean and Cryosphere in a Changing Climate, Cambridge University Press, Cambridge, UK and New York, NY, USA, https://doi.org/10.1017/9781009157964.005, 203–320, 2022. a
Natali, S. M., Holdren, J. P., Rogers, B. M., Treharne, R., Duffy, P. B., Pomerance, R., and MacDonald, E.: Permafrost carbon feedbacks threaten global climate goals, P. Natl. Acad. Sci. USA, 118, e2100163118, https://doi.org/10.1073/pnas.2100163118, 2021. a
Nitzbon, J., Schneider von Deimling, T., Aliyeva, M., Chadburn, S. E., Grosse, G., Laboor, S., Lee, H., Lohmann, G., Steinert, N. J., Stuenzi, S. M., Werner, M., Westermann, S., and Langer, M.: No respite from permafrost-thaw impacts in the absence of a global tipping point, Nat. Clim. Chang., 14, 573–585, https://doi.org/10.1038/s41558-024-02011-4, 2024. a
Palazzo Corner, S., Siegert, M., Ceppi, P., Fox-Kemper, B., Frölicher, T. L., Gallego-Sala, A., Haigh, J., Hegerl, G. C., Jones, C. D., Knutti, R., Koven, C. D., MacDougall, A. H., Meinshausen, M., Nicholls, Z., Sallée, J. B., Sanderson, B. M., Séférian, R., Turetsky, M., Williams, R. G., Zaehle, S., and Rogelj, J.: The Zero Emissions Commitment and climate stabilization, Front. Sci., 1, 1170744, https://doi.org/10.3389/fsci.2023.1170744, 2023. a
Pugh, T. A. M., Jones, C. D., Huntingford, C., Burton, C., Arneth, A., Brovkin, V., Ciais, P., Lomas, M., Robertson, E., Piao, S. L., and Sitch, S.: A large committed long-term sink of carbon due to vegetation dynamics, Earths Future, 6, 1413–1432, 2018. a
Sanderson, B. M., Brovkin, V., Fisher, R. A., Hohn, D., Ilyina, T., Jones, C. D., Koenigk, T., Koven, C., Li, H., Lawrence, D. M., Lawrence, P., Liddicoat, S., MacDougall, A. H., Mengis, N., Nicholls, Z., O'Rourke, E., Romanou, A., Sandstad, M., Schwinger, J., Séférian, R., Sentman, L. T., Simpson, I. R., Smith, C., Steinert, N. J., Swann, A. L. S., Tjiputra, J., and Ziehn, T.: flat10MIP: an emissions-driven experiment to diagnose the climate response to positive, zero and negative CO2 emissions, Geosci. Model Dev., 18, 5699–5724, https://doi.org/10.5194/gmd-18-5699-2025, 2025. a, b, c, d
Schuur, E. A. G., Abbott, B. W., Commane, R., Ernakovich, J., Euskirchen, E., Hugelius, G., Grosse, G., Jones, M., Koven, C., Leshyk, V., Lawrence, D., Loranty, M. M., Mauritz, M., Olefeldt, D., Natali, S., Rodenhizer, H., Salmon, V., Schädel, C., Strauss, J., Treat, C., and Turetsky, M.: Permafrost and climate change: carbon cycle feedbacks from the warming Arctic, Annu. Rev. Environ. Resour., 47, 343–371, https://doi.org/10.1146/annurev-environ-012220-011847, 2022. a, b, c
Smith, C. J., Forster, P. M., Allen, M., Leach, N., Millar, R. J., Passerello, G. A., and Regayre, L. A.: FAIR v1.3: a simple emissions-based impulse response and carbon cycle model, Geosci. Model Dev., 11, 2273–2297, https://doi.org/10.5194/gmd-11-2273-2018, 2018. a
Smith, C. J., Nicholls, Z. R. J., Armour, K., Collins, W., Forster, P., Meinshausen, M., Palmer, M. D., and Watanabe, M.: The Earth's energy budget, climate feedbacks, and climate sensitivity Supplementary Material, in: Climate Change 2021: The Physical Science Basis. Contribution of Working Group I to the Sixth Assessment Report of the Intergovernmental Panel on Climate Change, Cambridge University Press, Cambridge, UK and New York, NY, USA, 923–1054, https://www.ipcc.ch/ (last access: 9 October 2025), 2021. a, b
Steinert, N.: normansteinert/PerCX: v1.0.1 (v1.0.1), Zenodo [code], https://doi.org/10.5281/zenodo.17279654, 2025. a, b
Turetsky, M. R., Abbott, B. W., Jones, M. C., Anthony, K. W., Olefeldt, D., Schuur, E. A. G., Grosse, G., Kuhry, P., Hugelius, G., Koven, C., Lawrence, D. M., Gibson, C., Sannel, A. B. K., and McGuire, A. D.: Carbon release through abrupt permafrost thaw, Nat. Geosci., 13, 138–143, https://doi.org/10.1038/s41561-019-0526-0, 2020. a
Williams, R. G., Ceppi, P., and Katavouta, A.: Controls of the transient climate response to emissions by physical feedbacks, heat uptake and carbon cycling, Environ. Res. Lett., 15, 0940c1, https://doi.org/10.1088/1748-9326/ab97c9, 2020. a, b