the Creative Commons Attribution 4.0 License.
the Creative Commons Attribution 4.0 License.
Future changes in compound explosive cyclones and atmospheric rivers in the North Atlantic
Ferran Lopez-Marti
Mireia Ginesta
Davide Faranda
Anna Rutgersson
Pascal Yiou
Lichuan Wu
Gabriele Messori
The explosive development of extratropical cyclones and atmospheric rivers plays a crucial role in driving extreme weather in the mid-latitudes, such as compound windstorm–flood events. Although both explosive cyclones and atmospheric rivers are well understood and their relationship has been studied previously, there is still a gap in our understanding of how a warmer climate may affect their concurrence. Here, we focus on evaluating the current climatology and assessing changes in the future concurrence between atmospheric rivers and explosive cyclones in the North Atlantic. To accomplish this, we independently detect and track atmospheric rivers and extratropical cyclones and study their concurrence in both ERA5 reanalysis and CMIP6 historical and future climate simulations. In agreement with the literature, atmospheric rivers are more often detected in the vicinity of explosive cyclones than non-explosive cyclones in all datasets, and the atmospheric river intensity increases in all the future scenarios analysed. Furthermore, we find that explosive cyclones associated with atmospheric rivers tend to be longer lasting and deeper than those without. Notably, we identify a significant and systematic future increase in the cyclones and atmospheric river concurrences. Finally, under the high-emission scenario, the explosive cyclone and atmospheric river concurrences show an increase and model agreement over western Europe. As such, our work provides a novel statistical relation between explosive cyclones and atmospheric rivers in CMIP6 climate projections and a characterization of their joint changes in intensity and location.
- Article
(6186 KB) - Full-text XML
-
Supplement
(951 KB) - BibTeX
- EndNote
Atmospheric rivers (ARs) are narrow and elongated corridors of horizontal moisture transport usually associated with the cold front of an extratropical cyclone (Bao et al., 2006; Ralph et al., 2004, 2017). They play an essential role in the atmospheric water vapour cycle in the mid-latitudes, accounting for 90 % of the poleward moisture transport (Zhu and Newell, 1998; Guan and Waliser, 2015). Moreover, ARs drive wet and windy extreme weather events, particularly in western continental coasts, such as western Europe (Zhu and Newell, 1998; Guan and Waliser, 2015; Lavers and Villarini, 2015, 2013; Gimeno et al., 2016). In some coastal areas, intense ARs are associated up to 95 % of the time with extreme precipitation and up to 75 % with wind extremes (Waliser and Guan, 2017). As a result, ARs have widespread socioeconomic impacts; for example, the majority of European storms causing insurance losses of a billion US dollars or more are linked to ARs (de Vries, 2021).
Another meteorological feature that can lead to wet and windy extremes is explosive cyclones (ECs), which are also known as weather bombs (Roebber, 1984; Reale et al., 2019). ECs are rapidly intensifying mid-latitude cyclones. Historically, ECs have been identified as those with a deepening rate of more than 24 hPa in 24 h and scaled by the latitude (Sanders and Gyakum, 1980), although this definition has been repeatedly challenged, especially for the Southern Hemisphere (Allen et al., 2010). Events such as the Presidents' Day Snowstorm of 1979 (Schultz, 2022), characterized by poor forecast accuracy, sparked extensive research into this phenomenon. Upon landfall during their intensification phase, ECs can produce widespread damage and impacts associated with strong winds, heavy precipitation, and storm surges (Fink et al., 2012; Liberato et al., 2013; Ludwig et al., 2015; Seiler and Zwiers, 2016b; Reale et al., 2019; Ginesta et al., 2023).
ECs and the associated ARs thus play a crucial role in driving extreme weather hazards in the mid-latitudes (Liberato et al., 2013; Davolio et al., 2020). An illustrative example is Storm Alex, an EC associated with an AR that at first produced extreme winds in France and the UK and then led to record-breaking precipitation in Italy in October 2020 (Davolio et al., 2023; Ginesta et al., 2023). The climatological relationship between ECs and ARs has been previously studied and the literature shows that ARs are more often found in the surroundings of EC than non-ECs (Eiras-Barca et al., 2018; Zhang et al., 2019; Guo et al., 2020). ARs are important sources of moisture for cyclonic systems, and it has been suggested that they can enhance cyclone deepening through moist diabatic processes (Zhu and Newell, 1994; Ferreira et al., 2016), such as cloud condensation (Pinto et al., 2009). In addition, ECs with ARs show larger moisture inflow and deepen more rapidly than ECs without an AR but do not show significant differences in low-level baroclinicity nor upper-level potential vorticity, suggesting that diabatic processes are important contributors to their intensification (Zhang and Ralph, 2021). However, the extent to which these moist diabatic processes, compared to other factors such as upper-level forcing, influence cyclone intensification can vary from case to case (Pfahl and Sprenger, 2016; Ginesta et al., 2024).
A range of studies have investigated the impact of anthropogenic climate change on extratropical cyclones and ARs individually (Lavers et al., 2015; Zappa et al., 2013). The thermodynamic response of ARs to climate change is characterized by an increase in integrated water vapour transport (IVT). This increase is driven by the Clausius–Clapeyron relation, which implies a rise in moisture content in a warmer atmosphere. However, integrated water vapour (IWV) is expected to experience a larger increase than surface water vapour under climate change (Payne et al., 2020). This thermodynamic signal would act to increase the number of ARs detected in a warmer climate (Thandlam et al., 2022; Espinoza et al., 2018; Zhang et al., 2024; O’Brien et al., 2022; Wang et al., 2023). Similarly, the thermodynamic response acts to increase the precipitation within extratropical cyclones (Yettella and Kay, 2017). The dynamical response to climate change, such as changes in atmospheric circulation patterns, is more uncertain (Shepherd, 2014). In the North Atlantic, dynamic changes are mostly driven by changes in the eddy-driven jet, which serves as a guide for extratropical cyclones. The tug of war between the upper tropospheric warming and the Arctic amplification leads to a high uncertainty regarding the changes in the jet over the North Atlantic and western Europe (Shaw et al., 2016). However, climate models indicate a decline in the number of extreme extratropical cyclones in the North Atlantic and a local increase over the North Sea in EC frequency (Priestley and Catto, 2022; Zappa et al., 2013; Seiler and Zwiers, 2016a). Regarding ARs, studies also point to an increase in frequency, intensity, and size in western Europe and a northward shift in the AR location and landfall (Lavers et al., 2013; Ramos et al., 2016; Gao et al., 2016; Zhang et al., 2024).
The hazards associated with the joint occurrence of explosive cyclones and atmospheric rivers, especially along the western coast of Europe, underscores the importance of evaluating the projected changes in their concurrence in future climates. In this study, we assess future projections of the interplay between ECs and ARs using state-of-the-art models from the Coupled Model Intercomparison Project phase 6 (CMIP6; Eyring et al., 2016b). We specifically evaluate the frequency of EC and AR concurrence in the present climate for the ERA5 reanalysis and CMIP6 models, and in three end-of-century scenarios for the CMIP6 models. Moreover, we also assess the future changes in the intensity and location of such compound events.
This paper is structured as follows. Section 2 describes the datasets employed in this study, while Sect. 3 explains the methodologies for tracking ARs and cyclones and the calculation of their concurrences. In Sect. 4 we evaluate and discuss the performance of the CMIP6 models with ERA5 reanalysis. Section 5 shows the results and discussion of the future changes in frequency, intensity, and location of this compound event. Finally, Sect. 6 summarizes the key findings and provides the conclusions of this study.
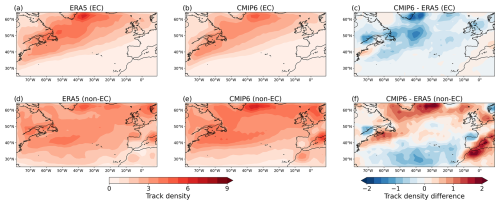
Figure 1EC track density climatology during the extended winter (ONDJFM) (1980–2009) for ERA5 (a), historical simulations of CMIP6 models (b), and the difference between ERA5 and CMIP6 (c). Panels (d, e, f) are the same as (a, b, c) but for non-ECs. The values are given in units representing the number of cyclone time steps per 3° spherical cap per month.
We use the ECMWF reanalysis ERA5 (Hersbach et al., 2020) with a horizontal resolution of 0.25° × 0.25° as an observationally constrained reference for the current climate and validation of the global climate models (GCMs). For the AR detection, the variables used are specific humidity and meridional and zonal wind components at 1000, 925, 850, 700, 600, 500, 400, and 300 hPa (Sect. 3.2). For cyclone detection, the variable used is the sea level pressure (SLP). In both cases, the variables are at 6-hourly resolution during the extended winter period (October to March) between 1980 and 2009 for the North Atlantic region (15–75° N, 90° W–20° E) (hereafter referred to as the “data domain”). To mitigate issues caused by the cyclone tracking algorithm, which tends to generate stationary “artefact” cyclones along the western boundary, we apply a buffer zone of 10° to this data domain. This adjustment ensures that artefacts at the western boundaries are excluded. As a result, the domain used for all analyses presented in the results section is (25–65° N, 80° W–10° E), referred to simply as the “domain” from here on.
Further, we use one member each of six different GCMs from the CMIP6 dataset (Eyring et al., 2016a): MPI-ESM1-2-LR, MPI-ESM1-2-HR, NorESM2-MM, EC-Earth3, CMCC-ESM2, and MIROC6. More detailed information about the GCMs used can be found in the Appendix A1. We evaluate the listed GCMs for two periods: the current climate (1980–2009), using historical simulations, and the future climate at the end of the 21st century (2070–2099), where we used simulations following the SSP1-2.6, SSP2-4.5, and SSP5-8.5 forcing scenarios (Riahi et al., 2017). These 30-year datasets consist of 29 full winters and two partial winters (January to March for 1980 and 2070 and October to December for 2009 and 2099). Variables used for tracking ARs and cyclones in the GCMs are the same as used for ERA5. The current list of GCMs used in this study is limited by the availability of 6-hourly instantaneous variables for the historical and the three scenarios experiments in hybrid-sigma pressure model levels, which are required to interpolate to the necessary pressure levels for the IVT calculation when detecting ARs. This limitation in the analysed data prevents a complete assessment of model performance, as only a single member from each model is used, and a multi-member ensemble for each model would be necessary for a more robust evaluation of the individual model uncertainty. For this reason, we evaluate the results using the multi-model mean of the ensemble.
3.1 Extratropical cyclone tracking
There are several detection and tracking algorithms for extratropical cyclones, most of them using either SLP or lower-tropospheric vorticity (Neu et al., 2013). Here, we detect and track cyclones based on SLP using the TempestExtremes algorithm developed by Ullrich et al. (2021); Ullrich (2020). This command-line software facilitates adaptable and rapid feature detection and tracking for extratropical cyclones and for ARs.
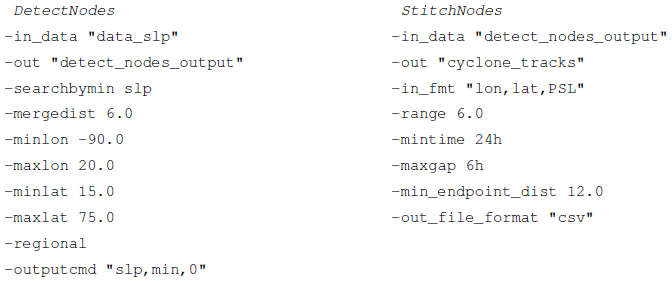
To identify extratropical cyclones, we recognize candidate “nodes” corresponding to local minima in the SLP field with the same set-up as in Ullrich et al. (2021). Nodes within a 6° great circle distance (GCD) of each other are merged. Next, to connect these candidate nodes into tracks, the distance between consecutive detections should not exceed 6° GCD. The tracks must persist for a minimum of 24 h, the maximum duration between two detections is set at 6 h, and the cyclones must have moved at least 12° GCD to filter out stationary lows, such as the Icelandic Low. The relevant code and the detailed set-up are available in the Appendix A2.
In addition, extratropical cyclones are classified as ECs if their normalized deepening rate (NDR), as defined by Sanders and Gyakum (1980), is equal to or higher than 1:
where DR24 h is the pressure difference over 24 h measured at the storm centre and φ is the latitude at its second time step. Cyclones that do not fulfil this condition are classified as non-ECs. Table A2 in Appendix A4 lists the number of cyclone tracks of ECs and non-ECs in each model and scenario and in ERA5 within the North Atlantic domain. The number of cyclone tracks detected fits inside the range number of cyclones detected in Neu et al. (2013) using several cyclone tracking algorithms.
Figure 1 shows the number of cyclone time steps detected within a 3° spherical cap per month, hereafter referred to as cyclone track density, for ECs and non-ECs in both ERA5 and CMIP6 models. These results agree with Priestley and Catto (2022) for CMIP6 and Zappa et al. (2013) for CMIP5 track densities despite using different tracking algorithms. Our tracking method shows some differences between ERA5 and CMIP6 models (Fig. 1c, f). CMIP6 models show smaller values for cyclone track density along the North Atlantic storm track, particularly east of Newfoundland, south of Greenland, and in the North Sea. For non-ECs, CMIP6 show a northward shift in the storm track with lower cyclone track density in the south and higher density in the north of the domain.
3.2 AR detection and tracking
There are two primary approaches to detecting ARs: one involves using the integrated water vapour, commonly applied to satellite data, while the other more broadly used approach consists of computing the IVT (Gimeno et al., 2014; Shields et al., 2018). In this study, we calculate the IVT for both reanalysis and model data. The IVT is defined for each grid point as follows:
where q is the specific humidity, u is the zonal wind component, v is the meridional wind component, and g is the gravitational acceleration. Moreover, we separately compute the eastward (IVTE) and northward (IVTN) components of IVT, which correspond to the two terms inside of the brackets in Eq. (2), respectively.
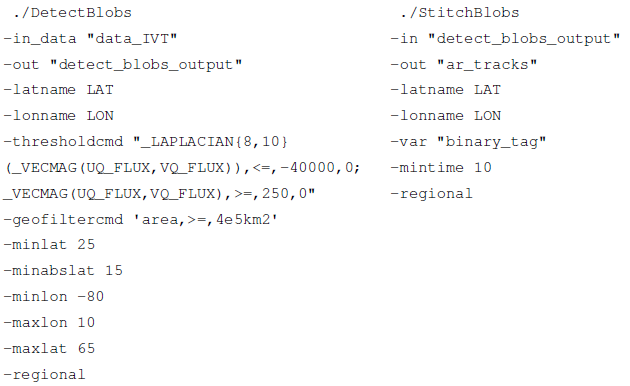
For the detection of ARs, we also use the TempestExtremes algorithm developed by Ullrich et al. (2021); Ullrich (2020). We find candidates for atmospheric rivers by detecting ridges in the IVT field. Ridges are defined as points where the Laplacian of the IVT is below kg m−2 s−1 rad−2, as this operator identifies elongated areas and regions of local minima. In addition, the IVT should be higher than 250 kg m−1 s−1. Each candidate should have an area larger than 4×10⁵ km−2. These thresholds were defined and tested by Ullrich et al. (2021) and show strong agreement with other tracking algorithms (Collow et al., 2022). The detected candidates are concatenated if at least one grid point is identified as an AR in consecutive time steps, meaning that the AR area at a consecutive time step spatially overlaps with the previous AR. In addition, they should last 60 h. The successful ARs that fulfil all these requirements are labelled as AR grid points and will be used later to determine if cyclones are concurrent with an AR (Sect. 3.3). This AR tracking methodology is less sensitive to a generalized increase in IVT in the future climate due to the Clausius–Clapeyron relationship because we detect AR candidates using the Laplacian of the IVT instead of the IVT field. Thus, AR candidates are detected when having a pronounced gradient of IVT (not dependent on the background IVT), as discussed further in Sect. 5. This detection algorithm may influence the observed changes in the number of AR tracks in future climates. The relevant code is available in Appendix A3, and the detailed number of AR tracks detected is reported in Table A3 in Appendix A4. Figure 2a shows the percentage of time steps with a detected AR for ERA5, hereafter referred to as AR frequency. Our tracking methodology accurately reproduces the AR frequency when compared with Guan and Waliser (2015). The AR frequency in the historical simulations of CMIP6 models is higher compared to ERA5 and exhibits a southward shift, with more AR time steps detected primarily in the lower mid-latitudes (Fig. 2b, c).
3.3 Concurrences
For each extratropical cyclone (both ECs and non-ECs) we compute the maximum deepening point (MDP), which is the maximum difference in SLP between two consecutive 6-hourly time steps. This metric allows us to evaluate the influence of ARs on the development of the cyclone before and after its maximum intensification, which is when the potential impact of ARs on cyclone deepening is expected, following the approach used by Eiras-Barca et al. (2018).
Subsequently, we determine whether a specific time step of an extratropical cyclone (EC or non-EC) is linked to an AR if at least one grid point within 1500 km from the centre of the cyclone is part of an AR (detected and tracked independently; see Sect. 3.2). This AR search radius is consistently applied across all time steps of the EC and non-EC tracks. By selecting a 1500 km radius, our methods align with those of (Eiras-Barca et al., 2018), with the primary difference between the two methods being the AR and cyclone tracking algorithms used. Almost 50 % of the identified ARs are located in the southeastern quadrant of the cyclone (Supplement Figs. S1 and S2). The rationale for using a 1500 km radius is based on the consideration that an AR can influence the cyclone by delivering moisture to the warm conveyor belt or feeder airstream (Dacre et al., 2019), which are typically located in the southeastern quadrant and within this distance from the cyclone centre.
Figure 3 shows an example of our detection methodology applied to storm Xynthia. EC Xynthia underwent rapid intensification before making landfall on 27 February 2010. It caused widespread damage across western European countries, especially France and Spain. In Fig. 3, the black dots represent the cyclone's path, while the red crosses indicate the time steps concurrent with the presence of an AR. The shaded areas depict the regions identified as ARs at each concurrence time step during the cyclone trajectory. Xynthia was associated with an AR during its intensification phase until landfall, suggesting that the AR may have contributed to its intensification (Liberato et al., 2013).
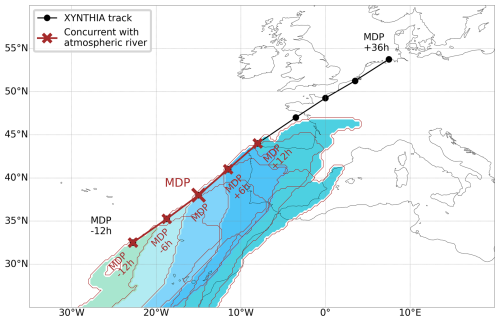
Figure 3Example of the detection and tracking of an EC (Xynthia, 26 February 2010 at 18:00 UTC to 1 March 2010 at 00:00 UTC) concurrent to an AR in ERA5. Red crosses mark the location of the cyclone at times when it concurred with an AR. Black dots indicate no concurrence. Shaded areas depict the regions identified as ARs at each concurrence time step during the cyclone trajectory.
We further evaluate the internal variability of the CMIP6 concurrences by analysing the spread within the multi-model ensemble. Additionally, we assess the inter-annual variability of the concurrences by calculating the standard deviation at each time step of the rate of coincidence between cyclones and ARs over the 29 full extended winter seasons (ONDJFM).
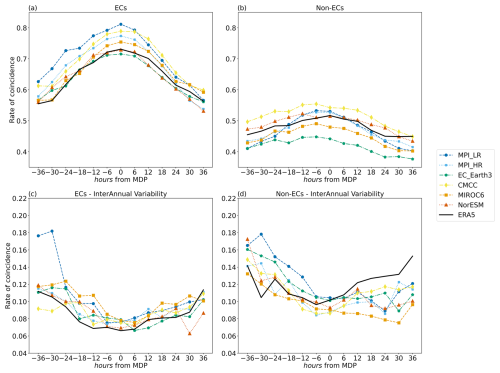
Figure 4Rate of coincidence between ECs and ARs (a) and non-EC and ARs (b) for ERA5 and the historical runs of CMIP6 models (1980–2009) during the extended winter (ONDJFM). Inter-annual variability as the standard deviation of the rate of coincidence over the 30 winter seasons between ECs and ARs (c) and non-ECs and ARs (d).
In this section, we evaluate the concurrence of ECs and ARs in the ERA5 reanalyses and compare it with those obtained in climate models. Figure 4a shows the rate of coincidence between ECs and ARs, indicating the fraction of ECs that are associated with an AR (see Sect. 3.3) as a function of time from the MDP. ERA5 shows a maximum rate of coincidence at around the MDP. This maximum is about 0.72, meaning that 72 % of the ECs are associated with ARs. The rate of coincidence is minimum 36 h before and after the MDP, with 55 % of the ECs associated with an AR. These results agree with the ones obtained by Eiras-Barca et al. (2018), despite changes of up to 0.05 in the rate of coincidence that were probably due to differences in the tracking method and data used. The curves of the CMIP6 models show a similar shape to that of ERA5, with a maximum rate of coincidence centred at the MDP and two minimums 36 h before and after the MDP. Some of the models, specifically CMCC, MPI-HR, MPI-LR, and MIROC6, have higher rates of coincidence for almost the whole lifetime of the ECs. CMCC and MPI-LR show a maximum of around 80 % of ECs associated with an AR, which is 10 % more than ERA5. In contrast, EC-Earth3 and NorESM2-MM show very similar rates of coincidence along the EC lifetimes, with differences up to 0.02 with respect to ERA5. Figure 4c shows the evolution of inter-annual variability as the standard deviation of the rate of coincidence between ECs and ARs over the 29 winter seasons at each time from −36 to +36 h from the MDP. CMIP6 models and ERA5 show an inter-annual variability between 0.06 and 0.18 that is higher at the first and last time steps from the MDP. CMIP6 models reproduce similar concurrence variability to ERA5, and differences in concurrence rate between them and ERA5 are within the internal variability, computed as the spread of the multi-model ensemble. However, MPI-LR has a higher rate of coincidence with respect to ERA5 and the rest of the models 36 h before the MDP.
Figure 4b shows the rate of coincidence of non-ECs and ARs. ERA5 has a much smaller variation in the rate of coincidence for non-ECs than for the ECs. There is a maximum in the coincidence rate for ERA5 at the MDP, around 50 %, with two minimums if around 0.45 % at 36 h before and after the MDP of the cyclones. Thus, there is a relatively small variation in the coincidence rate throughout the lifetime of the non-ECs. These results for non-ECs also agree with the ones obtained by Eiras-Barca et al. (2018). All models resemble ERA5 regarding the shape of the curve. However, CMCC has a higher rate of coincidence throughout the lifetime of the cyclones of up to 0.02 with respect to ERA5. In contrast, EC-Earth3 and MIROC6 have lower rates of coincidence of up to almost 0.1 with respect to ERA5. The models that have the most similar rates with respect to ERA5 are MPI-HR, MPI-LR, and NorESM2-MM. We emphasize that caution is needed when interpreting these model performances, as they may be influenced by internal variability due to the use of only a single member. Additional sensitivity tests of the impact of resolution on ERA5 are available in the Supplement. Figure 4d shows the inter-annual variability for the rate of coincidence between non-ECs and ARs. In this case, CMIP6 models and ERA5 show an inter-annual variability between 0.08 and 0.12, showing larger values at the first and last time steps for some models, reaching 0.18 for MPI-LR. CMIP6 models reproduce similar concurrence variability to ERA5, and the differences in concurrence rate between them and ERA5 are within their inter-annual variability.
In summary, for ECs, the coincidence rate maximum model difference with respect to ERA5 occurs during the MDP, reaching around 0.1. Even though this represents almost 15 % of the ERA5 value, the inter-annual variability of the datasets is comparable. For non-ECs, the different models show a more constant difference with ERA5 with a maximum of 0.05 or around 11 % of the ERA5 value but smaller than the inter-annual variability. Overall, the models reproduce the qualitative features of the life cycle of the rate of coincidence between both ECs and non-ECs and ARs. The quantitative differences with ERA5 are generally smaller than the datasets' internal variability.
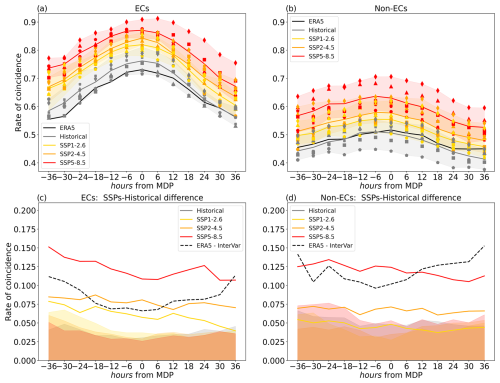
Figure 5Rate of coincidence between ECs and ARs (a) and non-ECs and ARs (b) for the historical runs and ERA5 (1980–2009) and the future scenario runs (2070–2099) during the extended winter (ONDJFM). Solid lines show the multi-model mean, shape points are individual models, and shading shows the inter-model spread. The difference in the multi-model mean rate of coincidence between the forcing scenarios and historical runs for ECs and ARs (c) and non-EC and ARs (d) is also shown. Solid lines show the multi-model mean difference, the shading shows the inter-annual variability of the multi-model ensembles in future scenarios and the historical data, and the dashed line shows the inter-annual variability for ERA5.
In this section, we analyse changes in the concurrence of cyclones and ARs in CMIP6 models between the historical simulations (1980–2009) and the three scenario simulations (2070–2099).
5.1 Changes in concurrence frequency
Figure 5a and b show a clear increase in the rate of coincidence of ARs with ECs and non-EC events across all warming scenarios. In the SSP5-8.5 scenario, the multi-model mean rate of coincidence increases by approximately 0.14 throughout the lifetime of ECs and 0.12 for non-ECs. For the SSP1-2.6 and SSP2-4.5 scenarios, the increases are around 0.07 and 0.08 for ECs, respectively, and 0.05 and 0.07 for non-ECs.
Table A2 in Appendix A4 shows the number of EC and non-EC tracks and Table A3 shows the number of AR tracks detected for ERA5 and the CMIP6 models in each scenario. Hence, these tables also show the changes (in parentheses) in the occurrence of the features individually in future scenarios compared to historical ones. The number of ECs decreases in all future scenarios with respect to the historical data and for all models, with the largest decrease for the high-emission scenario (SSP5-8.5). The decrease in the number of non-ECs is smaller when compared to the EC, although for SSP1-2.6 not all the models show a decrease in non-ECs, but for SSP2-4.5 and SSP5-8.5 all the models project a decrease. Regarding the number of AR tracks, in four models (EC-Earth3, NorESM2-MM, MIROC6, CMCC-ESM2) there is an increase in all emission scenarios. However, the changes are not linear, meaning some of the models (MPI-LR, MPI-HR, NorESM2-MM, MIROC6) depict a larger number of ARs in the SSP1-2.6 scenario than in the SSP5-8.5. The non-proportional increase in the number of AR tracks with warmer scenarios at the end of the century could be explained by the nature of the AR tracking, which detects ARs in the Laplacian of the IVT (Sect. 3.2). However, Table A3 only shows the number of AR tracks and does not account for the AR duration or extension, which might result in an increase in AR activity under a warmer climate (Zhang et al., 2024; O’Brien et al., 2022). Despite not finding a strong increase in ARs' tracks, the total number of times an AR is detected in the surroundings of both types of cyclones nonetheless shows a clear increase in all scenarios (Fig. 5a, b), with the increase becoming larger with higher warming.
The increase in the rate of coincidence between cyclones and ARs is partly the result of a decrease in the total number of cyclone time steps and a direct increase in the number of concurrent cyclone and AR time steps. To clarify this, we calculated the absolute number (including all CMIP6 models) of cyclones concurrent with ARs at the MDP and it increases across all scenarios: 4.6 %, 7.1 %, and 6.3 % for SSP1-2.6, SSP2-4.5, and SSP5-8.5, respectively. In addition, the absolute number of cyclone time steps also at the MDP decreases: −3.6 %, −5.2 %, and −12.3 % for SSP1-2.6, SSP2-4.5, and SSP5-8.5, respectively. Hence, the combined effect of an increase in AR occurrence and a decrease in the number of cyclones (with the latter being especially relevant for SSP5-8.5) explains the rise in the rate of coincidence as the level of warming increases (Fig. 5a, b). These findings suggest that changes in the characteristics of ARs, cyclones, or their interactions may be driving the observed changes, rather than the result being merely a statistical artefact of more cyclones and ARs occurring individually.
The spread across CMIP6 models is the primary source of uncertainty when evaluating changes in the rate of coincidence and exhibits overlap between different scenarios (Fig. 5a, b). The choice of model thus has a significant impact on the results when quantifying the increase in cyclone–AR compound events. Nevertheless, the inter-model spread of the SSP5-8.5 scenario is well separated from that of the historical period for both ECs and non-ECs (Fig. 5a, b). The inter-model spread further exceeds inter-annual variability for the models we analyse (Fig. 5). Indeed, the inter-annual variability of the model ensemble is consistently smaller than the multi-model mean differences between any of the three warming scenarios and historical data for ECs (Fig. 5c) and systematically smaller than the multi-model mean differences for non-ECs in the SSP5-8.5 scenario and at most lead times for the SSP2-4.5 scenario (Fig. 5d). Our results thus point to anthropogenic climate change exerting a strong influence on the increase in coincidence rates of cyclones and ARs, which is most evident for higher warming levels and for the latter cannot be attributed to natural variability or inter-model spread.
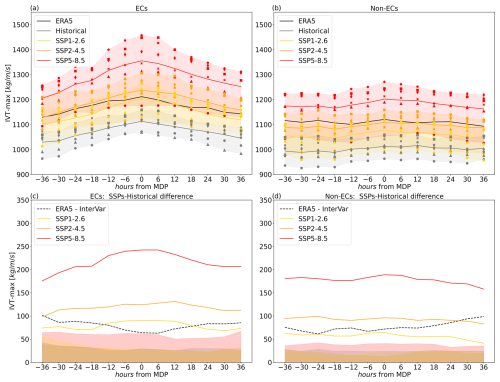
Figure 6Mean IVT-max for the historical runs and ERA5 (1980–2009) and the future scenario runs (2070–2099) of ARs associated with ECs (a) and ARs associated with non-EC (b) during the extended winter (ONDJFM). Solid lines show the multi-model mean, shape points are individual models, and shading shows the inter-model spread. The difference in the multi-model mean IVT-max between the forcing scenarios and historical run for ECs and ARs (c) and non-EC and ARs (d) is also shown. Solid lines show the multi-model mean difference, the shading shows the inter-annual variability of the multi-model ensembles in future scenarios and the historical data, and the dashed line shows the inter-annual variability for ERA5.
5.2 Changes in AR intensity
The intensity of ARs can be quantified in different ways. Here we use the maximum value of IVT (IVT-max) within the detected AR. We use this metric because it represents a good proxy for the total transport of moisture of an AR and is not dependent on the boundaries of the detected AR (Ralph et al., 2017). Moreover, the IVT-max is usually located at the core of the AR, and this makes this variable also a good proxy for AR extension and duration as ARs reaching higher IVT values at their core tend to be larger and last longer (Guan et al., 2023). Our results indicate that the IVT-max of ARs associated with ECs and non-ECs increases proportionally to the warming in future scenarios (Fig. 6). When comparing the IVT-max between scenarios, it is particularly relevant that under the SSP5-8.5 the multi-model mean remains above 1250 kg m s−1 for more than 48 h. This extended duration suggests that on average ARs under these conditions will primarily be hazardous, as classified by the AR scale from Eiras-Barca et al. (2021). For ARs with non-EC events, the IVT-max is constant throughout the entire cyclone lifetime, suggesting a uniform inflow of atmospheric moisture transport. On the other hand, for ARs associated with ECs, the IVT-max reaches its peak around the MDP of the cyclone's life cycle, showing the maximum moisture transport during the cyclone's most active phase (Fig. 6a, b). The AR intensity for ERA5 is larger than any model for the historical period because ERA5's resolution is almost 4 times higher than the CMIP6 models and attains larger values of IVT-max. Additional sensitivity tests of the impact of resolution on the ERA5 results are available in the Supplement. Despite this, the ERA5 and CMIP6 curves show the same qualitative behaviour during the cyclones' lifetime, and the inter-annual variability in both datasets is of the same order of magnitude (Fig. 6).
When evaluating uncertainties for changes in the AR intensity, inter-annual variability is smaller than the inter-model spread. Both are dependent on model resolution, as the IVT-max magnitude is sensitive to resolution, and all datasets are treated on their native grids. For ARs with ECs and non-ECs, the inter-model spread of both the SSP2-4.5 and the SSP5-8.5 scenarios is well separated from that of the historical period (Fig. 6a, b). Moreover, the difference in the multi-model mean between the future scenarios and the historical period is more pronounced than the inter-annual variability for all three scenarios and for both ECs and non-ECs (Fig. 6c,d). Thus, the IVT-max increases in all scenarios, and our results point to this being larger than both inter-model spread and internal model variability in most scenarios, and thus it is ascribable to anthropogenic warming.
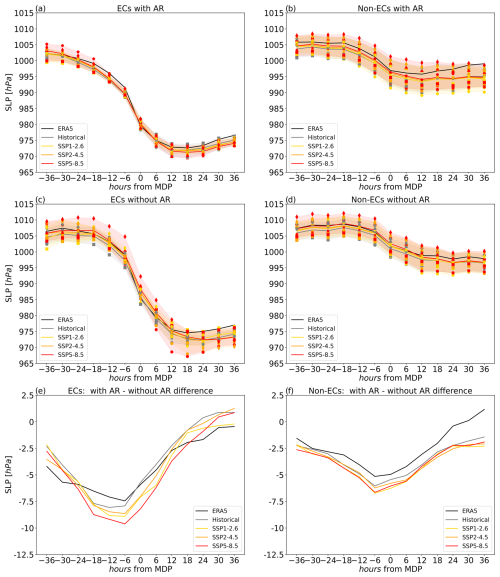
Figure 7Mean SLP for the historical runs and ERA5 (1980–2009) and the future scenario runs (2070–2099) of ECs with ARs (a), non-EC with ARs (b), ECs without ARs (c), and non-ECs without ARs (d) during the extended winter (ONDJFM). Solid lines show the multi-model mean, shape points show individual models, and the shading shows the inter-model spread. The difference in the multi-model mean SLP between the ECs with AR and without AR (e) and non-EC with AR and without AR (f) is also shown.
5.3 Changes in cyclone intensity
In this section, we examine the cyclone core SLP to assess changes in the intensity of ECs and non-ECs with the presence of ARs or lack thereof under climate change. The presence of ARs influences the evolution of SLP through the life cycle of the two types of cyclones differently, but in both cases when an AR is present the cyclone is deeper (Fig. 7e, f). The concurrence of ECs with ARs makes the ECs substantially deeper, especially before the MDP, where ECs are between 2.5 hPa and almost 10 hPa deeper. After the MDP the influence of the AR on the cyclone intensity decreases. Thus, ARs play an important role before the EC MDP, making these storms deeper from an earlier stage and resulting in longer-lasting and more intense cyclones. The particular influence in the first half of the cyclone life span suggests that moisture brought by the AR plays a key role in the EC intensification. On the other hand, the non-ECs also get deeper when occurring together with an AR, with a deepening between 2 and 7 hPa, having its peak also just before the MDP. The results from ERA5 show similar behaviour for both types of cyclones when compared to the models (Fig. 7b, d). Before the MDP, the models tend to simulate lower SLP for ECs with ARs and higher SLP for ECs without ARs. After the MDP, the models generally simulate higher SLP for both ECs with and without ARs. For non-ECs, the models have higher SLP values after the MDP compared to ERA5. However, the ERA5 values fall within the ensemble spread of historical values, indicating that they are within the uncertainty range of the models.
The influence of climate change on cyclone intensity for any of the four types of compound events is very limited, as the historical and scenario lines, along with their respective spreads in Fig. 7, are close to each other or overlap. All three forcing scenarios show the same life cycle behaviour and intensity changes as the historical ensemble. Figure A1 shows that the difference in the multi-model mean between the forcing scenarios and the historical is negligible (less than 1 hPa). It is slightly larger only for the ECs without ARs, probably due to the reduced number of these events (but as a result their inter-annual variability is also larger). The < 1 hPa shift can be compared to the models' inter-annual variability of between 1 and 2 hPa (Fig. A1). Similarly, the multi-model spreads of all scenarios are about ± 4 hPa (Fig. 7). Thus, the models do not show a robust change in cyclone intensity when averaged across the North Atlantic basin under climate change scenarios.
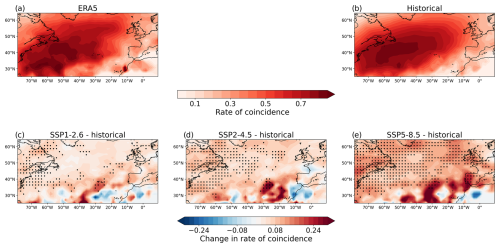
Figure 8Rate of coincidence between ECs and ARs for ERA5 (a) and the multimodel-mean of the CMIP6 historical runs (b). Differences between future projections and historical periods of the three scenarios: SSP1-2.6 (b), SSP2-4.5 (c), and SSP5-8.5 (d). Dots denote where all the CMIP6 models agree on the sign of change.
5.4 Changes in the location of concurrent ECs and ARs
To assess the spatial distribution of changes observed across the North Atlantic, we show the rate of EC-AR coincidence over a 3° spherical cap. In the historical period, the rate is highest along the climatological North Atlantic storm track, extending from the western to the northeastern part of the basin (Fig. 8a, b). CMIP6 models reproduce closely this spatial pattern. Differences between future projections and the historical period show an increase in the rate of coincidence, all the stronger for higher warming levels. The high-emission scenario shows the largest increase and a high model agreement across almost the entire domain. The southern part of the domain shows a noisier pattern and weaker model agreement due to the reduced number of events in the area. Only the high-emission scenario shows a clear increase in the rate of coincidence over Europe, showing model agreement over the British Isles, northern France, and the Iberian Peninsula. In other words, a larger proportion of landfalling ECs and ARs at their maximum deepening point is expected under the SSP5-8.5 scenario. This highlights the possibility of an increase in wet and windy extremes in western Europe in a high-emission future.
We have used six global climate models (GCMs) participating in CMIP6 to evaluate the change in the concurrences of cyclones and atmospheric rivers (ARs) in three different future scenarios under climate change in the North Atlantic. We have compared the performance of the models using the ERA5 reanalysis. Our main findings are summarized as follows.
-
For the present period, in ERA5 nearly 72 % of the explosive cyclones (ECs) are associated with an AR at the maximum deepening point (MDP). This higher rate of coincidence around the MDP indicates that ARs are more likely to occur when the EC is at its peak deepening stage. Despite some biases in the magnitude of the coincidence rate, CMIP6 models exhibit qualitatively similar concurrence rates to ERA5. In contrast, the concurrence rate over the lifespan of non-explosive cyclones (non-ECs) shows much smaller variation compared to ECs.
-
In future scenarios, there is an increase in the rate of coincidence between ECs and ARs, with the magnitude of the increase being proportional to the level of warming. All models agree on the sign of the change. In the high-emission scenario (SSP5-8.5), there is a maximum increase in the rate of coincidence from 0.72 to 0.87. Even in the best-case scenario (SSP1-2.6), there is an increase of around 0.07. For non-ECs, there is an increase in the rate of coincidence, ranging from 0.05 to 0.13 across scenarios. The increase in SSP5-8.5 and SSP2-4.5 scenarios is larger than the inter-annual model variability for both ECs and non-ECs, but the inter-model spread of the historical period is only well separated from that of the SSP5-8.5 scenario.
-
In all warming scenarios there is an increase in AR intensity. This is larger than the inter-annual variability for ARs associated with both ECs and non-ECs. Moreover, the inter-model spread of both the SSP2-4.5 and the SSP5-8.5 scenarios is well separated from that of the historical period. Under the SSP5-8.5 scenario, the maximum integrated vapour transport (IVT) of ARs associated with ECs is projected to exceed 1250 kg m−1 s−1 for more than 48 h on average, indicating exceptional and hazardous AR conditions.
-
ECs are deeper when associated with an AR. The presence of an AR is associated with ECs deepening earlier compared to those without, making them deeper for a longer period and potentially more hazardous. Non-ECs are also deeper when having an AR in their surroundings, but their intensification is lesser compared to the ECs with ARs.
-
The concurrence of ARs with ECs will be more frequent in the North Atlantic basin in future climates. There is an increase in both agreement among models and the magnitude of the change with the degree of warming, with the SSP5-8.5 scenario showing the largest change. Under this most severe scenario, Europe is exposed to this increase, particularly the southern Iberian Peninsula, the British Isles, France, and Scandinavia.
Our results for concurrence rates of cyclones and ARs in the present climate are broadly consistent with Eiras-Barca et al. (2018). One key difference is that they calculated the MDP using a 24 h time window, while we used a 6 h window. These differences in time intervals, as well as detection and tracking configurations for cyclones and ARs, may account for the minor differences in concurrence rates. Furthermore, our study uses the latest ECMWF reanalysis, ERA5 (Hersbach et al., 2020), whereas their study used the earlier ERA-Interim dataset.
Previous studies found an increase in the IVT of ARs under climate change (Payne et al., 2020), as well as an increase in their frequency (Espinoza et al., 2018; Wang et al., 2023; Ramos et al., 2016). These results align with the increase in IVT-max detected for ARs associated with ECs and non-ECs and the increase in concurrences between cyclones and ARs, partly driven by an enhanced AR frequency. Moreover, other studies have found an increase in the frequency and severity of extratropical cyclones under climate change, mainly over the British Isles, and an eastward extension of the storm track activity over Europe (Priestley and Catto, 2022; Zappa et al., 2013; Seiler and Zwiers, 2016a). Our results show a generalized increase in compound events of ECs with ARs in most of the North Atlantic basin. A robust increase in concurrence over the British Isles, Iberia, and northern France is only observed under the most severe climate change scenario. However, we did not detect a clear upward trend in the individual frequency of EC or AR tracks across the entire North Atlantic basin. This apparent contradiction suggests that changes in the characteristics or dynamics of ECs and ARs, rather than their frequency, may be driving the observed increase in concurrence. This is a significant finding that needs further investigation, as the underlying physical mechanisms for this increase remain unclear.
Our analysis has limitations that should be acknowledged. The main constraint is the reduced number of CMIP6 models and members used. The number of models or ensemble members used is limited by the availability of data on multiple vertical levels at the 6-hourly resolution that are necessary to compute IVT. We acknowledge that using only one member per model does not facilitate a comprehensive model intercomparison; more members for each model would be needed to adequately assess model uncertainty, specifically the biases of the models relative to reanalysis data. We chose all models and members from CMIP6 where these variables were available for the historical, SSP1-2.6, SSP2-4.5, and SSP5-8.5 experiments. In particular, we deemed it important to go beyond the high-emission scenario (SSP5-8.5) and also look at the implications of lower warming levels. While most of the results presented indicate a stronger signal for the highest-emission scenario (SSP5-8.5), this scenario has been deemed unrealistic (Hausfather and Peters, 2020). Therefore, we emphasize that our results should be interpreted with consideration of various scenarios. A further caveat is that we used a single tracking algorithm, namely the TempestExtremes software (Ullrich et al., 2021). While we have compared our results for the present period with a previous study that uses different tracking algorithms (Eiras-Barca et al., 2018), this does not detract from the fact that our results depend on the detection and tracking method (Neu et al., 2013). Furthermore, future studies should aim to delve deeper into isolating the dynamic signal from the thermodynamics of the climate change response. Finally, future work should explore future changes in the wet and windy extremes associated with the compound meteorological events investigated here.
A1 Information about the CMIP6 models
Mauritsen et al. (2019)Müller et al. (2018)Seland et al. (2020)Döscher et al. (2022)Cherchi et al. (2019)Tatebe et al. (2019)A2 TempestExtremes code for detecting and tracking extratropical cyclones
To identify extratropical cyclones, we use the executable DetectNodes from the TempestExtremes tracking algorithm (Ullrich et al., 2021; Ullrich, 2020), which recognizes candidate “nodes” corresponding to local minima in the SLP field. Subsequently, we employ StitchNodes also from the TempestExtremes tracking algorithm (Ullrich et al., 2021; Ullrich, 2020) to connect these candidate nodes into tracks. The tracking codes set up with the parameters used are as follows:
A3 TempestExtremes code for detecting and tracking ARs
For the detection and tracking of ARs, we use the executables from the TempestExtremes tracking algorithm (Ullrich et al., 2021; Ullrich, 2020) DetectBlobs to detect ARs and to connect ARs or “blobs” we use the executable StitchBlobs with the following parameters:
A4 Number of cyclone tracks and AR tracks detected in ERA5 and CMIP6
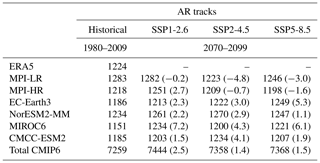
Section 3.1 describes how cyclones are detected, tracked, and classified as ECs or non-ECs. The result of this process is the track of each cyclone. In the following table we summarize the number of individual EC and non-EC tracks for each dataset and the percentage difference from the historical period.
Table A2Number of EC and non-EC tracks detected in each dataset. In parentheses we provide the percentage difference between the future scenario and the historical period for each model.

Section 3.2 describes how ARs are detected and tracked. The result of this process is the track of each AR. In the following table we summarize the number of individual AR tracks for each dataset and the percentage difference from the historical period.
A5 Cyclone intensity differences between future scenarios and historical simulations
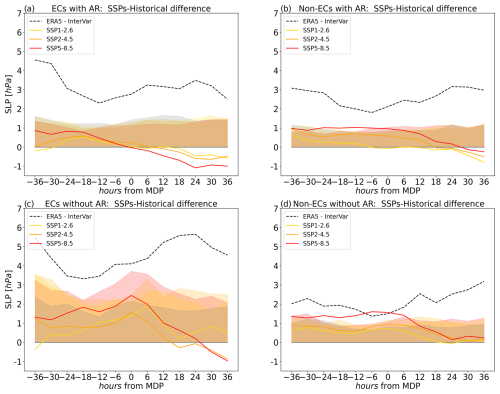
Figure A1The difference in the multi-model mean SLP between the forcing scenarios and historical runs is shown as solid lines, the inter-annual variability of the multi-model ensembles of mean SLP is shown with shading, and the inter-annual variability for ERA5 is shown with the dashed line for ECs with ARs (a), non-ECs with ARs (b), ECs without ARs (c), and non-ECs without ARs (d).
The scripts used within this paper are available upon reasonable request.
ERA5 data are available from the C3S Climate Data Store at https://cds.climate.copernicus.eu/{#}/home (Copernicus Climate Change Service, 2024). CMIP6 data are available from the ESGF Metagrid web application at https://aims2.llnl.gov/search (Lawrence Livermore National Laboratory, 2024).
The supplement related to this article is available online at https://doi.org/10.5194/esd-16-169-2025-supplement.
FLM and MG developed the concept of the paper, performed the data analysis, prepared the figures, and wrote the first manuscript draft. All authors contributed with ideas, interpretation of the results, and manuscript revisions.
At least one of the (co-)authors is a member of the editorial board of Earth System Dynamics. The peer-review process was guided by an independent editor, and the authors also have no other competing interests to declare.
Publisher’s note: Copernicus Publications remains neutral with regard to jurisdictional claims made in the text, published maps, institutional affiliations, or any other geographical representation in this paper. While Copernicus Publications makes every effort to include appropriate place names, the final responsibility lies with the authors.
The authors wish to thank Lionel Guez, Atef Ben Nasser, Leonardo Olivetti, and Anastasiya Shyrokaya for providing useful discussions and technical support that shaped this article.
This project has received funding from the European Union's Horizon 2020 research and innovation programme under Marie Skłodowska-Curie grant no. 956396 (EDIPI project). Gabriele Messori was further supported by the European Union's Horizon 2020 research and innovation programme under ERC grant no. 948309 (CENÆ Project) and the Swedish Research Council Vetenskapsrådet (grant no. 2022-06599). Davide Faranda and Mireia Ginesta were further supported by the COST Action FutureMed CA22162 from the European Cooperation in Science and Technology, an INSU-CNRS-LEFE-MANU grant (project CROIRE), state aid managed by the National Research Agency under France 2030 bearing the reference ANR-22-EXTR-0005 (TRACCS-PC4-EXTENDING project), and the European Union's Horizon 2020 research and innovation programme under grant no. 101003469 (XAIDA).
The publication of this article was funded by the Swedish Research Council, Forte, Formas, and Vinnova.
This paper was edited by Olivia Martius and reviewed by Mika Rantanen and three anonymous referees.
Allen, J. T., Pezza, A. B., and Black, M. T.: Explosive cyclogenesis: A global climatology comparing multiple reanalyses, J. Clim., 23, 6468–6484, 2010. a
Bao, J., Michelson, S., Neiman, P., Ralph, F., and Wilczak, J.: Interpretation of enhanced integrated water vapor bands associated with extratropical cyclones: Their formation and connection to tropical moisture, Mon. Weather Rev., 134, 1063–1080, 2006. a
Cherchi, A., Fogli, P. G., Lovato, T., Peano, D., Iovino, D., Gualdi, S., Masina, S., Scoccimarro, E., Materia, S., Bellucci, A., and Navarra, A.: Global Mean Climate and Main Patterns of Variability in the CMCC-CM2 Coupled Model, J. Adv. Model. Earth Sy., 11, 185–209, https://doi.org/10.1029/2018MS001369, 2019. a
Collow, A. B. M., Shields, C. A., Guan, B., Kim, S., Lora, J. M., McClenny, E. E., Nardi, K., Payne, A., Reid, K., Shearer, E. J., Tomé, R., Wille, J. D., Ramos, A. M., Gorodetskaya, I. V., Leung, L. R., O’Brien, T. A., Ralph, F. M., Rutz, J., Ullrich, P. A., and Wehner, M.: An Overview of ARTMIP's Tier 2 Reanalysis Intercomparison: Uncertainty in the Detection of Atmospheric Rivers and Their Associated Precipitation, J. Geophys. Res.-Atmos., 127, e2021JD036155, https://doi.org/10.1029/2021JD036155, 2022. a
Copernicus Climate Change Service: Climate Data Store, Copernicus Climate Change Service [data set], https://cds.climate.copernicus.eu/, last access: 14 October 2024. a
Dacre, H. F., Martínez-Alvarado, O., and Mbengue, C. O.: Linking Atmospheric Rivers and Warm Conveyor Belt Airflows, J. Hydrometeorol., 20, 1183–1196, https://doi.org/10.1175/JHM-D-18-0175.1, 2019. a
Davolio, S., Della Fera, S., Laviola, S., Miglietta, M., and Levizzani, V.: Heavy precipitation over Italy from the Mediterranean storm “Vaia” in October 2018: Assessing the role of an atmospheric river, Mon. Weather Rev., 148, 3571–3588, 2020. a
Davolio, S., Vercellino, M., Miglietta, M. M., Pitura, L. D., Laviola, S., and Levizzani, V.: The influence of an atmospheric river on a heavy precipitation event over the western Alps, Weather Clim. Extrem., 39, 100542, https://doi.org/10.1016/j.wace.2022.100542, 2023. a
de Vries, A. J.: A global climatological perspective on the importance of Rossby wave breaking and intense moisture transport for extreme precipitation events, Weather Clim. Dynam., 2, 129–161, https://doi.org/10.5194/wcd-2-129-2021, 2021. a
Döscher, R., Acosta, M., Alessandri, A., Anthoni, P., Arsouze, T., Bergman, T., Bernardello, R., Boussetta, S., Caron, L.-P., Carver, G., Castrillo, M., Catalano, F., Cvijanovic, I., Davini, P., Dekker, E., Doblas-Reyes, F. J., Docquier, D., Echevarria, P., Fladrich, U., Fuentes-Franco, R., Gröger, M., v. Hardenberg, J., Hieronymus, J., Karami, M. P., Keskinen, J.-P., Koenigk, T., Makkonen, R., Massonnet, F., Ménégoz, M., Miller, P. A., Moreno-Chamarro, E., Nieradzik, L., van Noije, T., Nolan, P., O'Donnell, D., Ollinaho, P., van den Oord, G., Ortega, P., Prims, O. T., Ramos, A., Reerink, T., Rousset, C., Ruprich-Robert, Y., Le Sager, P., Schmith, T., Schrödner, R., Serva, F., Sicardi, V., Sloth Madsen, M., Smith, B., Tian, T., Tourigny, E., Uotila, P., Vancoppenolle, M., Wang, S., Wårlind, D., Willén, U., Wyser, K., Yang, S., Yepes-Arbós, X., and Zhang, Q.: The EC-Earth3 Earth system model for the Coupled Model Intercomparison Project 6, Geosci. Model Dev., 15, 2973–3020, https://doi.org/10.5194/gmd-15-2973-2022, 2022. a
Eiras-Barca, J., Ramos, A. M., Pinto, J. G., Trigo, R. M., Liberato, M. L. R., and Miguez-Macho, G.: The concurrence of atmospheric rivers and explosive cyclogenesis in the North Atlantic and North Pacific basins, Earth Syst. Dynam., 9, 91–102, https://doi.org/10.5194/esd-9-91-2018, 2018. a, b, c, d, e, f, g
Eiras-Barca, J., Ramos, A. M., Algarra, I., Vázquez, M., Dominguez, F., Miguez-Macho, G., Nieto, R., Gimeno, L., Taboada, J., and Ralph, F. M.: European West Coast atmospheric rivers: A scale to characterize strength and impacts, Weather Clim. Extrem., 31, 100305, https://doi.org/10.1016/j.wace.2021.100305, 2021. a
Espinoza, V., Waliser, D. E., Guan, B., Lavers, D. A., and Ralph, F. M.: Global analysis of climate change projection effects on atmospheric rivers, Geophys. Res. Lett., 45, 4299–4308, 2018. a, b
Eyring, V., Bony, S., Meehl, G. A., Senior, C. A., Stevens, B., Stouffer, R. J., and Taylor, K. E.: Overview of the Coupled Model Intercomparison Project Phase 6 (CMIP6) experimental design and organization, Geosci. Model Dev., 9, 1937–1958, https://doi.org/10.5194/gmd-9-1937-2016, 2016a. a
Eyring, V., Bony, S., Meehl, G. A., Senior, C. A., Stevens, B., Stouffer, R. J., and Taylor, K. E.: Overview of the Coupled Model Intercomparison Project Phase 6 (CMIP6) experimental design and organization, Geosci. Model Dev., 9, 1937–1958, https://doi.org/10.5194/gmd-9-1937-2016, 2016b. a
Ferreira, J. A., Liberato, M. L., and Ramos, A. M.: On the relationship between atmospheric water vapour transport and extra-tropical cyclones development, Phys. Chem. Earth Pt. A/B/C, 94, 56–65, 2016. a
Fink, A. H., Pohle, S., Pinto, J. G., and Knippertz, P.: Diagnosing the influence of diabatic processes on the explosive deepening of extratropical cyclones, Geophys. Res. Lett., 39, L07803, https://doi.org/10.1029/2012GL051025, 2012. a
Gao, Y., Lu, J., and Leung, L. R.: Uncertainties in Projecting Future Changes in Atmospheric Rivers and Their Impacts on Heavy Precipitation over Europe, J. Clim., 29, 6711–6726, https://doi.org/10.1175/JCLI-D-16-0088.1, 2016. a
Gimeno, L., Nieto, R., Vázquez, M., and Lavers, D. A.: Atmospheric rivers: A mini-review, Front. Earth Sci., 2, 2, https://doi.org/10.3389/feart.2014.00002, 2014. a
Gimeno, L., Dominguez, F., Nieto, R., Trigo, R., Drumond, A., Reason, C. J., Taschetto, A. S., Ramos, A. M., Kumar, R., and Marengo, J.: Major mechanisms of atmospheric moisture transport and their role in extreme precipitation events, Annu. Rev. Environ. Res., 41, 117–141, 2016. a
Ginesta, M., Yiou, P., Messori, G., and Faranda, D.: A methodology for attributing severe extratropical cyclones to climate change based on reanalysis data: the case study of storm Alex 2020, Clim. Dynam., 61, 229–253, 2023. a, b
Ginesta, M., Flaounas, E., Yiou, P., and Faranda, D.: Anthropogenic climate change will intensify European explosive storms analogous to Alex, Eunice, and Xynthia, J. Clim., 37, 5427–5452, 2024. a
Guan, B. and Waliser, D. E.: Detection of atmospheric rivers: Evaluation and application of an algorithm for global studies, J. Geophys. Res.-Atmos., 120, 12514–12535, 2015. a, b, c
Guan, B., Waliser, D. E., and Ralph, F. M.: Global application of the atmospheric river scale, J. Geophys. Res.-Atmos., 128, e2022JD037180, https://doi.org/10.1029/2022JD037180, 2023. a
Guo, Y., Shinoda, T., Guan, B., Waliser, D. E., and Chang, E. K.: Statistical relationship between atmospheric rivers and extratropical cyclones and anticyclones, J. Clim., 33, 7817–7834, 2020. a
Hausfather, Z. and Peters, G. P.: Emissions–the ‘business as usual’story is misleading, Nature, 577, 618–620, https://doi.org/10.1038/d41586-020-00177-3, 2020. a
Hersbach, H., Bell, B., Berrisford, P., Hirahara, S., Horányi, A., Muñoz-Sabater, J., Nicolas, J., Peubey, C., Radu, R., Schepers, D., Simmons, A., Soci, C., Abdalla, S., Abellan, X., Balsamo, G., Bechtold, P., Biavati, G., Bidlot, J., Bonavita, M., De Chiara, G., Dahlgren, P., Dee, D., Diamantakis, M., Dragani, R., Flemming, J., Forbes, R., Fuentes, M., Geer, A., Haimberger, L., Healy, S., Hogan, R. J., Hólm, E., Janisková, M., Keeley, S., Laloyaux, P., Lopez, P., Lupu, C., Radnoti, G., de Rosnay, P., Rozum, I., Vamborg, F., Villaume, S., and Thépaut, J.-N.: The ERA5 global reanalysis, Q. J. Roy. Meteorol. Soc., 146, 1999–2049, https://doi.org/10.1002/qj.3803, 2020. a, b
Lavers, D. A. and Villarini, G.: The nexus between atmospheric rivers and extreme precipitation across Europe, Geophys. Res. Lett., 40, 3259–3264, 2013. a
Lavers, D. A. and Villarini, G.: The contribution of atmospheric rivers to precipitation in Europe and the United States, J. Hydrol., 522, 382–390, 2015. a
Lavers, D. A., Allan, R. P., Villarini, G., Lloyd-Hughes, B., Brayshaw, D. J., and Wade, A. J.: Future changes in atmospheric rivers and their implications for winter flooding in Britain, Environ. Res. Lett., 8, 034010, https://doi.org/10.1088/1748-9326/8/3/034010, 2013. a
Lavers, D. A., Ralph, F. M., Waliser, D. E., Gershunov, A., and Dettinger, M. D.: Climate change intensification of horizontal water vapor transport in CMIP5, Geophys. Res. Lett., 42, 5617–5625, 2015. a
Lawrence Livermore National Laboratory: AIMS2 Search Page, https://aims2.llnl.gov/search, last access: 14 October 2024. a
Liberato, M. L. R., Pinto, J. G., Trigo, R. M., Ludwig, P., Ordóñez, P., Yuen, D., and Trigo, I. F.: Explosive development of winter storm Xynthia over the subtropical North Atlantic Ocean, Nat. Hazards Earth Syst. Sci., 13, 2239–2251, https://doi.org/10.5194/nhess-13-2239-2013, 2013. a, b, c
Ludwig, P., Pinto, J. G., Hoepp, S. A., Fink, A. H., and Gray, S. L.: Secondary cyclogenesis along an occluded front leading to damaging wind gusts: Windstorm Kyrill, January 2007, Mon. Weather Rev., 143, 1417–1437, 2015. a
Mauritsen, T., Bader, J., Becker, T., Behrens, J., Bittner, M., Brokopf, R., Brovkin, V., Claussen, M., Crueger, T., Esch, M., Fast, I., Fiedler, S., Fläschner, D., Gayler, V., Giorgetta, M., Goll, D. S., Haak, H., Hagemann, S., Hedemann, C., Hohenegger, C., Ilyina, T., Jahns, T., Jimenéz-de-la Cuesta, D., Jungclaus, J., Kleinen, T., Kloster, S., Kracher, D., Kinne, S., Kleberg, D., Lasslop, G., Kornblueh, L., Marotzke, J., Matei, D., Meraner, K., Mikolajewicz, U., Modali, K., Möbis, B., Müller, W. A., Nabel, J. E. M. S., Nam, C. C. W., Notz, D., Nyawira, S.-S., Paulsen, H., Peters, K., Pincus, R., Pohlmann, H., Pongratz, J., Popp, M., Raddatz, T. J., Rast, S., Redler, R., Reick, C. H., Rohrschneider, T., Schemann, V., Schmidt, H., Schnur, R., Schulzweida, U., Six, K. D., Stein, L., Stemmler, I., Stevens, B., von Storch, J.-S., Tian, F., Voigt, A., Vrese, P., Wieners, K.-H., Wilkenskjeld, S., Winkler, A., and Roeckner, E.: Developments in the MPI-M Earth System Model version 1.2 (MPI-ESM1.2) and Its Response to Increasing CO2, J. Adv. Model. Earth Sy., 11, 998–1038, https://doi.org/10.1029/2018MS001400, 2019. a
Müller, W. A., Jungclaus, J. H., Mauritsen, T., Baehr, J., Bittner, M., Budich, R., Bunzel, F., Esch, M., Ghosh, R., Haak, H., Ilyina, T., Kleine, T., Kornblueh, L., Li, H., Modali, K., Notz, D., Pohlmann, H., Roeckner, E., Stemmler, I., Tian, F., and Marotzke, J.: A Higher-resolution Version of the Max Planck Institute Earth System Model (MPI-ESM1.2-HR), J. Adv. Model. Earth Sy., 10, 1383–1413, https://doi.org/10.1029/2017MS001217, 2018. a
Neu, U., Akperov, M. G., Bellenbaum, N., Benestad, R., Blender, R., Caballero, R., Cocozza, A., Dacre, H. F., Feng, Y., Fraedrich, K., Grieger, J., Gulev, S., Hanley, J., Hewson, T., Inatsu, M., Keay, K., Kew, S. F., Kindem, I., Leckebusch, G. C., Liberato, M. L. R., Lionello, P., Mokhov, I. I., Pinto, J. G., Raible, C. C., Reale, M., Rudeva, I., Schuster, M., Simmonds, I., Sinclair, M., Sprenger, M., Tilinina, N. D., Trigo, I. F., Ulbrich, S., Ulbrich, U., Wang, X. L., and Wernli, H.: IMILAST: A Community Effort to Intercompare Extratropical Cyclone Detection and Tracking Algorithms:, Bull. Am. Meteorol. Soc., 94, 529–547, https://doi.org/10.1175/BAMS-D-11-00154.1, 2013. a, b, c
O’Brien, T. A., Wehner, M. F., Payne, A. E., Shields, C. A., Rutz, J. J., Leung, L.-R., Ralph, F. M., Collow, A., Gorodetskaya, I., Guan, B., Lora, J. M., McClenny, E., Nardi, K. M., Ramos, A. M., Tomé, R., Sarangi, C., Shearer, E. J., Ullrich, P. A., Zarzycki, C., Loring, B., Huang, H., Inda-Díaz, H. A., Rhoades, A. M., and Zhou, Y.: Increases in Future AR Count and Size: Overview of the ARTMIP Tier 2 CMIP5/6 Experiment, J. Geophys. Res.-Atmos., 127, e2021JD036013, https://doi.org/10.1029/2021JD036013, 2022. a, b
Payne, A. E., Demory, M.-E., Leung, L. R., Ramos, A. M., Shields, C. A., Rutz, J. J., Siler, N., Villarini, G., Hall, A., and Ralph, F. M.: Responses and impacts of atmospheric rivers to climate change, Nat. Rev. Earth Environ., 1, 143–157, 2020. a, b
Pfahl, S. and Sprenger, M.: On the relationship between extratropical cyclone precipitation and intensity, Geophys. Res. Lett., 43, 1752–1758, 2016. a
Pinto, J. G., Zacharias, S., Fink, A. H., Leckebusch, G. C., and Ulbrich, U.: Factors contributing to the development of extreme North Atlantic cyclones and their relationship with the NAO, Clim. Dynam., 32, 711–737, 2009. a
Priestley, M. D. K. and Catto, J. L.: Future changes in the extratropical storm tracks and cyclone intensity, wind speed, and structure, Weather Clim. Dynam., 3, 337–360, https://doi.org/10.5194/wcd-3-337-2022, 2022. a, b, c
Ralph, F. M., Neiman, P. J., and Wick, G. A.: Satellite and CALJET aircraft observations of atmospheric rivers over the eastern North Pacific Ocean during the winter of 1997/98, Mon. Weather Rev., 132, 1721–1745, 2004. a
Ralph, F. M., Iacobellis, S., Neiman, P., Cordeira, J., Spackman, J., Waliser, D., Wick, G., White, A., and Fairall, C.: Dropsonde observations of total integrated water vapor transport within North Pacific atmospheric rivers, J. Hydrometeorol., 18, 2577–2596, 2017. a, b
Ramos, A. M., Tomé, R., Trigo, R. M., Liberato, M. L., and Pinto, J. G.: Projected changes in atmospheric rivers affecting Europe in CMIP5 models, Geophys. Res. Lett., 43, 9315–9323, 2016. a, b
Reale, M., Liberato, M. L., Lionello, P., Pinto, J. G., Salon, S., and Ulbrich, S.: A global climatology of explosive cyclones using a multi-tracking approach, Tellus A, 71, 1611340, https://doi.org/10.1080/16000870.2019.1611340, 2019. a, b
Riahi, K., van Vuuren, D. P., Kriegler, E., Edmonds, J., O’Neill, B. C., Fujimori, S., Bauer, N., Calvin, K., Dellink, R., Fricko, O., Lutz, W., Popp, A., Cuaresma, J. C., KC, S., Leimbach, M., Jiang, L., Kram, T., Rao, S., Emmerling, J., Ebi, K., Hasegawa, T., Havlik, P., Humpenöder, F., Da Silva, L. A., Smith, S., Stehfest, E., Bosetti, V., Eom, J., Gernaat, D., Masui, T., Rogelj, J., Strefler, J., Drouet, L., Krey, V., Luderer, G., Harmsen, M., Takahashi, K., Baumstark, L., Doelman, J. C., Kainuma, M., Klimont, Z., Marangoni, G., Lotze-Campen, H., Obersteiner, M., Tabeau, A., and Tavoni, M.: The Shared Socioeconomic Pathways and their energy, land use, and greenhouse gas emissions implications: An overview, Glob. Environ. Change, 42, 153–168, https://doi.org/10.1016/j.gloenvcha.2016.05.009, 2017. a
Roebber, P. J.: Statistical analysis and updated climatology of explosive cyclones, Mon. Weather Rev., 112, 1577–1589, 1984. a
Sanders, F. and Gyakum, J. R.: Synoptic-dynamic climatology of the “bomb”, Mon. Weather Rev., 108, 1589–1606, 1980. a, b
Schultz, D. M.: The Presidents’ Day Snowstorm of 18–19 February 1979: Its History and Significance at Monthly Weather Review, Mon. Weather Rev., 150, 305–307, https://doi.org/10.1175/MWR-D-22-0012.1, 2022. a
Seiler, C. and Zwiers, F.: How will climate change affect explosive cyclones in the extratropics of the Northern Hemisphere?, Clim. Dynam., 46, 3633–3644, https://doi.org/10.1007/s00382-015-2791-y, 2016a. a, b
Seiler, C. and Zwiers, F. W.: How will climate change affect explosive cyclones in the extratropics of the Northern Hemisphere?, Climate Dynamics, 46, 3633–3644, 2016b. a
Seland, Ø., Bentsen, M., Olivié, D., Toniazzo, T., Gjermundsen, A., Graff, L. S., Debernard, J. B., Gupta, A. K., He, Y.-C., Kirkevåg, A., Schwinger, J., Tjiputra, J., Aas, K. S., Bethke, I., Fan, Y., Griesfeller, J., Grini, A., Guo, C., Ilicak, M., Karset, I. H. H., Landgren, O., Liakka, J., Moseid, K. O., Nummelin, A., Spensberger, C., Tang, H., Zhang, Z., Heinze, C., Iversen, T., and Schulz, M.: Overview of the Norwegian Earth System Model (NorESM2) and key climate response of CMIP6 DECK, historical, and scenario simulations, Geosci. Model Dev., 13, 6165–6200, https://doi.org/10.5194/gmd-13-6165-2020, 2020. a
Shaw, T., Baldwin, M., Barnes, E. A., Caballero, R., Garfinkel, C., Hwang, Y.-T., Li, C., O'gorman, P., Rivière, G., Simpson, I., and Voigt, A.: Storm track processes and the opposing influences of climate change, Nat. Geosci., 9, 656–664, 2016. a
Shepherd, T. G.: Atmospheric circulation as a source of uncertainty in climate change projections, Nat. Geosci., 7, 703–708, 2014. a
Shields, C. A., Rutz, J. J., Leung, L.-Y., Ralph, F. M., Wehner, M., Kawzenuk, B., Lora, J. M., McClenny, E., Osborne, T., Payne, A. E., Ullrich, P., Gershunov, A., Goldenson, N., Guan, B., Qian, Y., Ramos, A. M., Sarangi, C., Sellars, S., Gorodetskaya, I., Kashinath, K., Kurlin, V., Mahoney, K., Muszynski, G., Pierce, R., Subramanian, A. C., Tome, R., Waliser, D., Walton, D., Wick, G., Wilson, A., Lavers, D., Prabhat, Collow, A., Krishnan, H., Magnusdottir, G., and Nguyen, P.: Atmospheric River Tracking Method Intercomparison Project (ARTMIP): project goals and experimental design, Geosci. Model Dev., 11, 2455–2474, https://doi.org/10.5194/gmd-11-2455-2018, 2018. a
Tatebe, H., Ogura, T., Nitta, T., Komuro, Y., Ogochi, K., Takemura, T., Sudo, K., Sekiguchi, M., Abe, M., Saito, F., Chikira, M., Watanabe, S., Mori, M., Hirota, N., Kawatani, Y., Mochizuki, T., Yoshimura, K., Takata, K., O'ishi, R., Yamazaki, D., Suzuki, T., Kurogi, M., Kataoka, T., Watanabe, M., and Kimoto, M.: Description and basic evaluation of simulated mean state, internal variability, and climate sensitivity in MIROC6, Geosci. Model Dev., 12, 2727–2765, https://doi.org/10.5194/gmd-12-2727-2019, 2019. a
Thandlam, V., Rutgersson, A., and Sahlee, E.: Spatio-temporal variability of atmospheric rivers and associated atmospheric parameters in the Euro-Atlantic region, Theor. Appl. Climatol., 147, 13–33, https://doi.org/10.1007/s00704-021-03776-w, 2022. a
Ullrich, P., Pinheiro, M. C., Stachowicz, K., and Zarzycki, C. M.: ClimateGlobalChange/tempestextremes: Version 2.1 (2.1), Zenodo [code], https://doi.org/10.5281/zenodo.4385656, 2020. a, b, c, d, e
Ullrich, P. A., Zarzycki, C. M., McClenny, E. E., Pinheiro, M. C., Stansfield, A. M., and Reed, K. A.: TempestExtremes v2.1: a community framework for feature detection, tracking, and analysis in large datasets, Geosci. Model Dev., 14, 5023–5048, https://doi.org/10.5194/gmd-14-5023-2021, 2021. a, b, c, d, e, f, g, h
Waliser, D. and Guan, B.: Extreme winds and precipitation during landfall of atmospheric rivers, Nat. Geosci., 10, 179–183, 2017. a
Wang, S., Ma, X., Zhou, S., Wu, L., Wang, H., Tang, Z., Xu, G., Jing, Z., Chen, Z., and Gan, B.: Extreme atmospheric rivers in a warming climate, Nat. Commun., 14, 3219, https://doi.org/10.1038/s41467-023-38980-x, 2023. a, b
Yettella, V. and Kay, J. E.: How will precipitation change in extratropical cyclones as the planet warms? Insights from a large initial condition climate model ensemble, Clim. Dynam., 49, 1765–1781, 2017. a
Zappa, G., Shaffrey, L. C., Hodges, K. I., Sansom, P. G., and Stephenson, D. B.: A Multimodel Assessment of Future Projections of North Atlantic and European Extratropical Cyclones in the CMIP5 Climate Models, J. Clim., 26, 5846–5862, https://doi.org/10.1175/JCLI-D-12-00573.1, 2013. a, b, c, d
Zhang, L., Zhao, Y., Cheng, T. F., and Lu, M.: Future changes in global atmospheric rivers projected by CMIP6 models, J. Geophys. Res.-Atmos., 129, e2023JD039359, https://doi.org/10.1029/2023JD039359, 2024. a, b, c
Zhang, Z. and Ralph, F. M.: The influence of antecedent atmospheric river conditions on extratropical cyclogenesis, Mon. Weather Rev., 149, 1337–1357, 2021. a
Zhang, Z., Ralph, F. M., and Zheng, M.: The relationship between extratropical cyclone strength and atmospheric river intensity and position, Geophys. Res. Lett., 46, 1814–1823, 2019. a
Zhu, Y. and Newell, R. E.: Atmospheric rivers and bombs, Geophys. Res. Lett., 21, 1999–2002, 1994. a
Zhu, Y. and Newell, R. E.: A proposed algorithm for moisture fluxes from atmospheric rivers, Mon. Weather Rev., 126, 725–735, 1998. a, b


