the Creative Commons Attribution 4.0 License.
the Creative Commons Attribution 4.0 License.
 | 25 Sep 2025
Storylines of future drought in the face of uncertain rainfall projections: a New Zealand case study
Luke J. Harrington
Peter B. Gibson
Neelesh Rampal
Robust increases in temperatures will occur globally across the twenty-first century; however, for some regions, sign changes in rainfall remain uncertain. Navigating this uncertainty is crucial in addressing drought-related challenges faced by climate-exposed sectors. New Zealand represents these challenges, exhibiting significant model uncertainty in warm-season rainfall change. Here, we examine how temperature-driven increases in potential evapotranspiration interact with contrasting storylines of future rainfall to explore soil moisture drought outcomes for New Zealand. In our drying storyline, we find that increasing temperatures accompanied by less rainfall bring forward the onset of drought several months and delay its termination. In the wetting storyline, increases in rainfall partly offset the temperature-induced drying effect, leading to minor reductions in soil moisture. Examining extreme years, the average hydrological year in the future becomes comparable to the driest years of the current climate, while the worst future events exhibit unprecedented drought severity.
- Article
(7377 KB) - Full-text XML
-
Supplement
(10366 KB) - BibTeX
- EndNote


The environmental and economic risk posed by severe drought events is projected to rise in the twenty-first century as global temperatures increase (Lesk et al., 2016; Naumann et al., 2021; Singh et al., 2022). While models from the Coupled Model Intercomparison Project Phase 6 (CMIP6, Eyring et al., 2016) exhibit a large range in the magnitude of the “likely” (66 % probability) global mean surface temperature response (2.3–4.5 °C) to a doubling of CO2 concentrations (Sherwood et al., 2020), the sign of mean rainfall changes remains uncertain for many regions of the world (Lee et al., 2021). Predictions of warming-induced changes in global rainfall patterns over subtropical and mid-latitude land masses vary significantly (Byrne and O’Gorman, 2015; Allan et al., 2020), partly due to different circulation changes and horizontal gradients of change in surface air temperature. Some climate models can overestimate the future response to jet changes (Simpson et al., 2014) due to an equatorward biased climatological jet position (Vallis et al., 2015; Curtis et al., 2020), which enhances the rainfall response to future forcings. Future changes in ENSO have the ability to impose changes in regional rainfall outside of the tropics (McGregor et al., 2022), as well as inducing changes in other large-scale features (Haarsma and Selten, 2012; Teng and Branstator, 2019; Wang et al., 2022). Additionally, internal climate variability can also introduce an irreducible uncertainty in future climate projections, further obscuring future rainfall trends (Deser et al., 2012; Lehner et al., 2020).
The above factors are exemplified when looking at projected rainfall changes over New Zealand. Here, previous research has found model uncertainty and substantive internal variability both contribute to uncertain projections of the sign and magnitude of warm-season rainfall changes over the twenty-first century (Gibson et al., 2024a). Subsequently, there is considerable uncertainty about whether future rainfall changes will alleviate or exacerbate future drought events already strengthened by background warming.
Past efforts to understand future drought risk across New Zealand also reveal mixed results. When examining the risks of meteorological drought only, Harrington et al. (2016) found the synoptic conditions responsible for the particularly extreme rainfall deficits across the North Island in early 2013 were more likely to occur in the recent climate than corresponding model simulations of the late 1800s. This was supported by Gibson et al. (2016), who found circulation types linked to low rainfall across the country were projected to occur more often in the twenty-first century under a high-warming (RCP8.5) scenario. However, previous assessments of changing agricultural drought risk across New Zealand (Mullan et al., 2018; Sood and Mullan, 2020) have instead largely reflected climatological patterns of rainfall: wet regions in the south-west of the country were expected to experience a reduction in drought risk over the twenty-first century, and the drier regions of the country were likely to experience an increase in drought, while many parts of the North Island exhibited no clear trend either way.
A key drawback of previous research examining agricultural drought with downscaled climate projections in New Zealand has been the focus on communicating future projections based on the mean of the multi-model ensemble only (Mullan et al., 2018; Clark et al., 2011; Mullan et al., 2005). However, given the rainfall-related uncertainty across models (Gibson et al., 2016), physically plausible but extremely diverse outcomes often end up being averaged out when looking only at ensemble-mean outcomes. To overcome this, we focus here on two different storyline scenarios (Shepherd et al., 2018) to investigate how warm-season rainfall changes could affect the severity of future droughts across New Zealand, based on the rainfall storylines presented in Gibson et al. (2024a). Storyline approaches typically group climate models based on consistent physical climate drivers (Zappa and Shepherd, 2017; Ghosh and Shepherd, 2023; van der Wiel et al., 2021), with multiple studies using storyline approaches to investigate drought (Gessner et al., 2022; Chan et al., 2022; Harvey et al., 2023). We use a methodology similar to that of van der Wiel et al. (2024), where our two storylines are those where precipitation is projected to increase in the future, a “wetting” scenario, where warming-driven increases in potential evapotranspiration are offset by increases in rainfall, and decrease in the future, a “drying” scenario, where rainfall decreases in a warming climate and exacerbates the soil moisture loss from warming. Both storylines are well represented by at least one dynamically downscaled CMIP6 model in recently completed regional climate projections for New Zealand (Gibson et al., 2024b). Here, we use a single model to represent each storyline due to the limited size of the downscaled ensemble. Past research has found the diversity of future outcomes in this ensemble of regional climate projections likely spans the plausible range of uncertainty in temperature and rainfall changes for a given future scenario (in our case, SSP370). Thus, we are confident that we successfully explore a fuller representation of the model uncertainty space with these two storylines.
This study primarily focuses on defining drought using a single-layer soil water balance model, driven by daily rainfall and potential evapotranspiration (PET) derived from the output of dynamically downscaled regional climate model projections. This water balance model has been extensively used in drought projections for New Zealand in previous studies (Mullan et al., 2005; Clark et al., 2011; Mullan et al., 2018) and for real-time drought monitoring (Mol et al., 2017) and is integrated into New Zealand's most comprehensive gridded station data product (Tait et al., 2006, 2012). We thus adopt this approach primarily to ensure consistency with past approaches but also because this simple model of soil moisture can provide us with a clear understanding of the first-order effects of temperature and rainfall change on future drought.
The remainder of this paper is structured as follows. In Sect. 2, we first discuss the regional climate model (RCM) data used in this analysis and the water balance model used to calculate drought metrics. In Sect. 3, we examine future drought across our two storylines and discuss them in the context of the other CMIP6 models used to produce regional climate projections for New Zealand. We discuss the limitations of this work in Sect. 4 and summarize our main findings in Sect. 5.
2.1 Regional climate model data
We examine historical and future drought in six models from the CMIP6 ensemble, which have been dynamically downscaled from their native resolutions to a resolution of 12 km over New Zealand (Gibson et al., 2024b). These six models were chosen because of their performance over the historical period using processes-based metrics (i.e. jet position), model independence, and spread in equilibrium climate sensitivity (Gibson et al., 2024b). Dynamical downscaling was performed using the Conformal Cubic Atmospheric Model (CCAM, McGregor and Dix, 2008), which implements a variable-resolution conformal-cubic grid to provide an enhanced resolution over the area of interest (New Zealand and its surrounding ocean), accompanied by a relatively high resolution (12–35 km) over the wider South Pacific. Three GCMs (ACCESS-CM2, EC-Earth3, NorESM2-MM) were downscaled with CCAM through spectral nudging to the host GCM's atmospheric fields, sea surface temperatures (SSTs), and sea ice concentrations (SICs). Three other GCMs (AWI-CM-1-1-MR, CNRM-CM6-1, GFDL-ESM4) were downscaled using an “AMIP” configuration, driving CCAM with bias-corrected host model SSTs and SICs. We consider two time periods in this analysis, a historical period (1985–2014) and a future period (2070–2099). We elect to use the SSP370 scenario for this future period, as this relatively high-emissions scenario allows us to more readily be separate climate change responses from internal variability. We do not use SSP585 due to concerns about its realism (Hausfather and Peters, 2020).
2.2 Water balance model and drought metrics
We use daily mean values from the RCM as input into a simple water balance model applied across the RCM grid to estimate the soil moisture state, the actual evapotranspiration (AET), and the potential evapotranspiration deficit (PED). We use daily maximum, daily minimum, and mean surface air temperatures, alongside daily mean surface air relative humidity, surface wind speeds, surface net radiation, and elevation, to define PET using the FAO56 method (Allen et al., 1998). The soil moisture content (SM) is given by the following soil water budget equation (Porteous et al., 1994):
Soil moisture deficit (SMD) is defined as the amount of water the soil is short of field capacity (FC): . The FC is determined by the soil characteristics; an FC of 150 mm is typical for New Zealand's silt-loam soils (Porteous et al., 1994). With enough available soil moisture AET is able to meet atmospheric demand and equal PET, which is calculated using the FAO-56 Penman–Monteith method (Allen et al., 1998; Prudhomme and Williamson, 2013) for an idealized grass reference crop of height 0.12 m and an albedo of 0.23 (Allen et al., 1998; Vremec et al., 2023). As soil moisture decreases, there is no longer enough readily available water to meet the atmospheric demand of PET. Based on Porteous and Salinger's (1994) single-layer water balance model, if half or more of the FC is available, PET and AET are set equal, and if less than half of the FC is available, AET reduces linearly proportional to PET:
In addition to examining drought with SMD, we also examine PED, defined as the difference between PET and AET. We focus on accumulated changes in PED over the June–July water year. Positive values of PED imply that the soil is too dry to meet water demand, and plants do not have sufficient access to moisture for optimal growth.
We examine future changes in PET, AET, PED, and SMD across six low-lying agriculturally important regions around New Zealand, namely the Far North, Waikato, Hawkes Bay, Manawatu, Canterbury, and Southland. These regions are visualized in Fig. 4a. SMD climatologies across these regions in the historical period of the six downscaled GCMs in our ensemble have good agreement with those produced using CCAM downscaled ERA5 (see Supplement). Note that agreement between the six downscaled GCMs and downscaled observations across the historical period does not imply that future projections are necessarily valid.
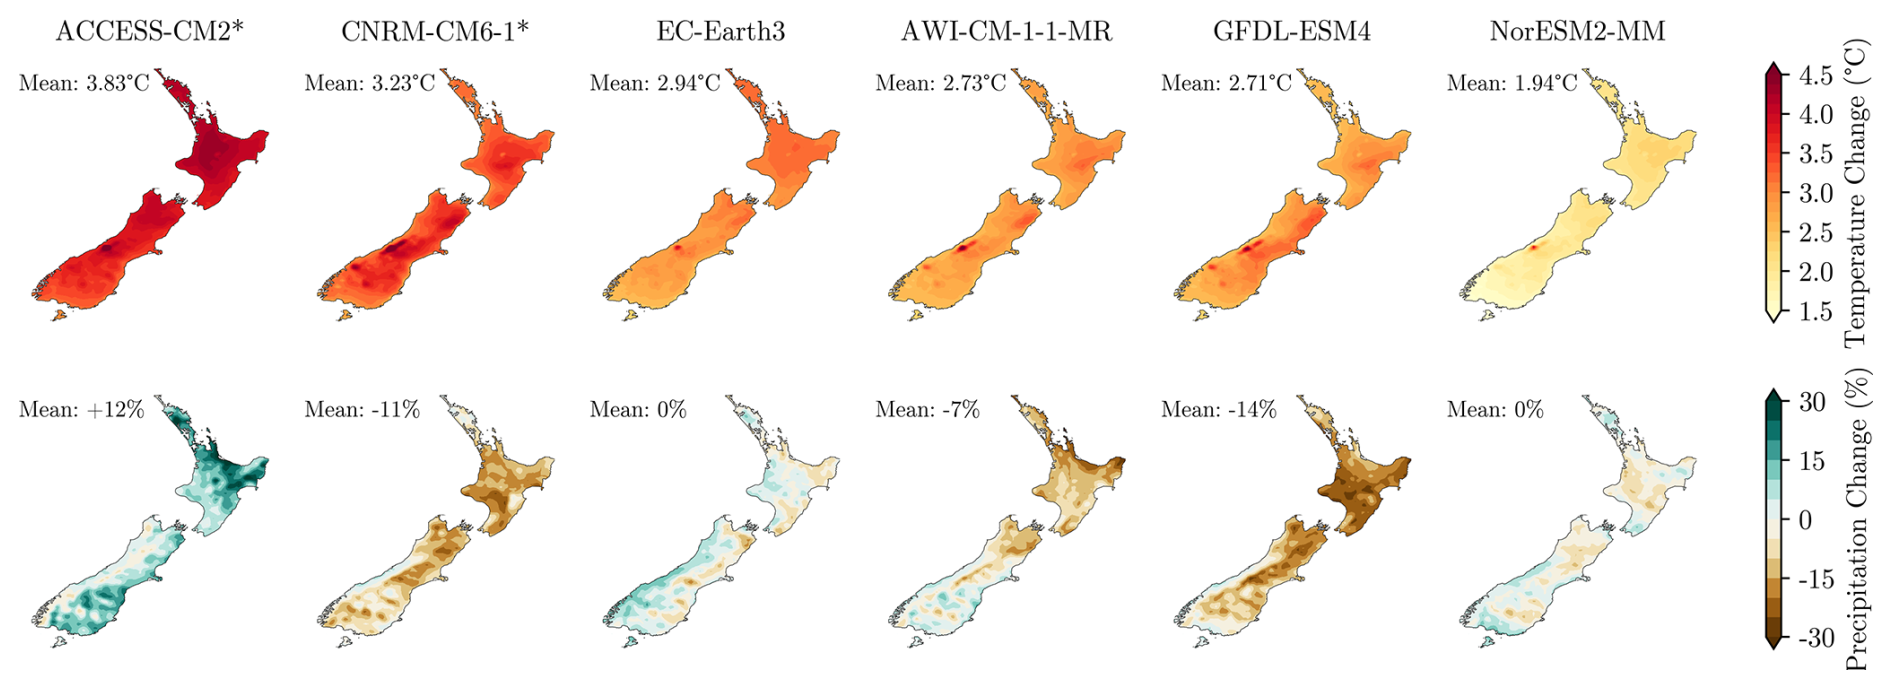
Figure 1ONDJFM temperature and rainfall changes between the historical (1985–2014) and future (2070–2099) periods examined in this study, for the six models in our ensemble ordered from warmest to coolest. The models which encapsulate the wetting (ACCESS-CM2) and drying (CNRM-CM6-1) storylines are highlighted with an asterisk. The mean change over the New Zealand land surface across low-lying areas (elevation <500 m) is presented for each model.
By design, the six dynamically downscaled climate models have considerably different warming rates (see Gibson et al., 2024b, for each model's ECS compared to the greater CMIP6 ensemble). We analyse changes in ONDJFM (October–March) as this is the period over which droughts generally intensify, peak, and begin to recover. Surface air temperatures between the historical and future periods increase between 1.94–3.83 °C on average across New Zealand. These temperature changes are shown in Fig. 1, where we also present the change in ONDJFM rainfall as a percentage. Across the models, only CNRM-CM6-1 and GFDL-ESM4 share a consistent sign of change across the majority of New Zealand, with the other models having more varied spatial patterns of rainfall change. When examining future warm-season mean changes in temperature and rainfall across this ensemble, two models stand out as good candidates to represent contrasting storylines of future drought in New Zealand. ACCESS-CM2 has the highest warming of all the models within the ensemble (3.83 °C) and has mean rainfall increasing across all regions of New Zealand. Conversely, CNRM-CM6-1 has the second-highest future warming (3.23 °C), while rainfall decreases in all regions. These two model storylines of “wetting” and “drying” represent either end of the distribution of possible rainfall changes which could affect drought: thus, we focus on these two models for the remainder of the analysis (equivalent figures for all other models are shown in the Supplement).
Differences in regional projections of precipitation in climate models may arise for many different reasons (Gibson et al., 2024a). Figures 2 and 3 examine changes in mean sea level pressure (MSLP), 500 hPa geopotential heights, and 850 hPa specific humidity, alongside precipitation, in both the early (OND) and late (JFM) dry season to investigate the drivers of precipitation projections in our two storyline models (equivalent figures and explanations for the other models in the ensemble are presented in the Supplement). Shown in Fig. 2 the projection of drying in CNRM-CM6-1 is mostly driven by the drying in OND. This early season drying over New Zealand appears to be driven by the increase in high pressure directly over New Zealand (comparable changes are seen in other models with drying signals, GFDL-ESM4 and AWI-CM-1-1-MR). Synoptically ACCESS-CM2 (shown in Fig. 3) is very similar to other models in the ensemble which show little to no increases in precipitation (EC-Earth3, NorESM2-MM), with a region of increased high pressure occurring further to the east of New Zealand in OND than the drying models. However, increased moisture availability particularly in the late dry season (i.e. JFM) coincidences with increased precipitation over this period. The future position of the jet stream is similar across all ensemble members, and all members showing a tendency towards an El Niño state in the future means that these features are unlikely to contribute to the precipitation change differences across the ensemble. Interpretation of the drivers for the other models in the ensemble is provided in the Supplement.
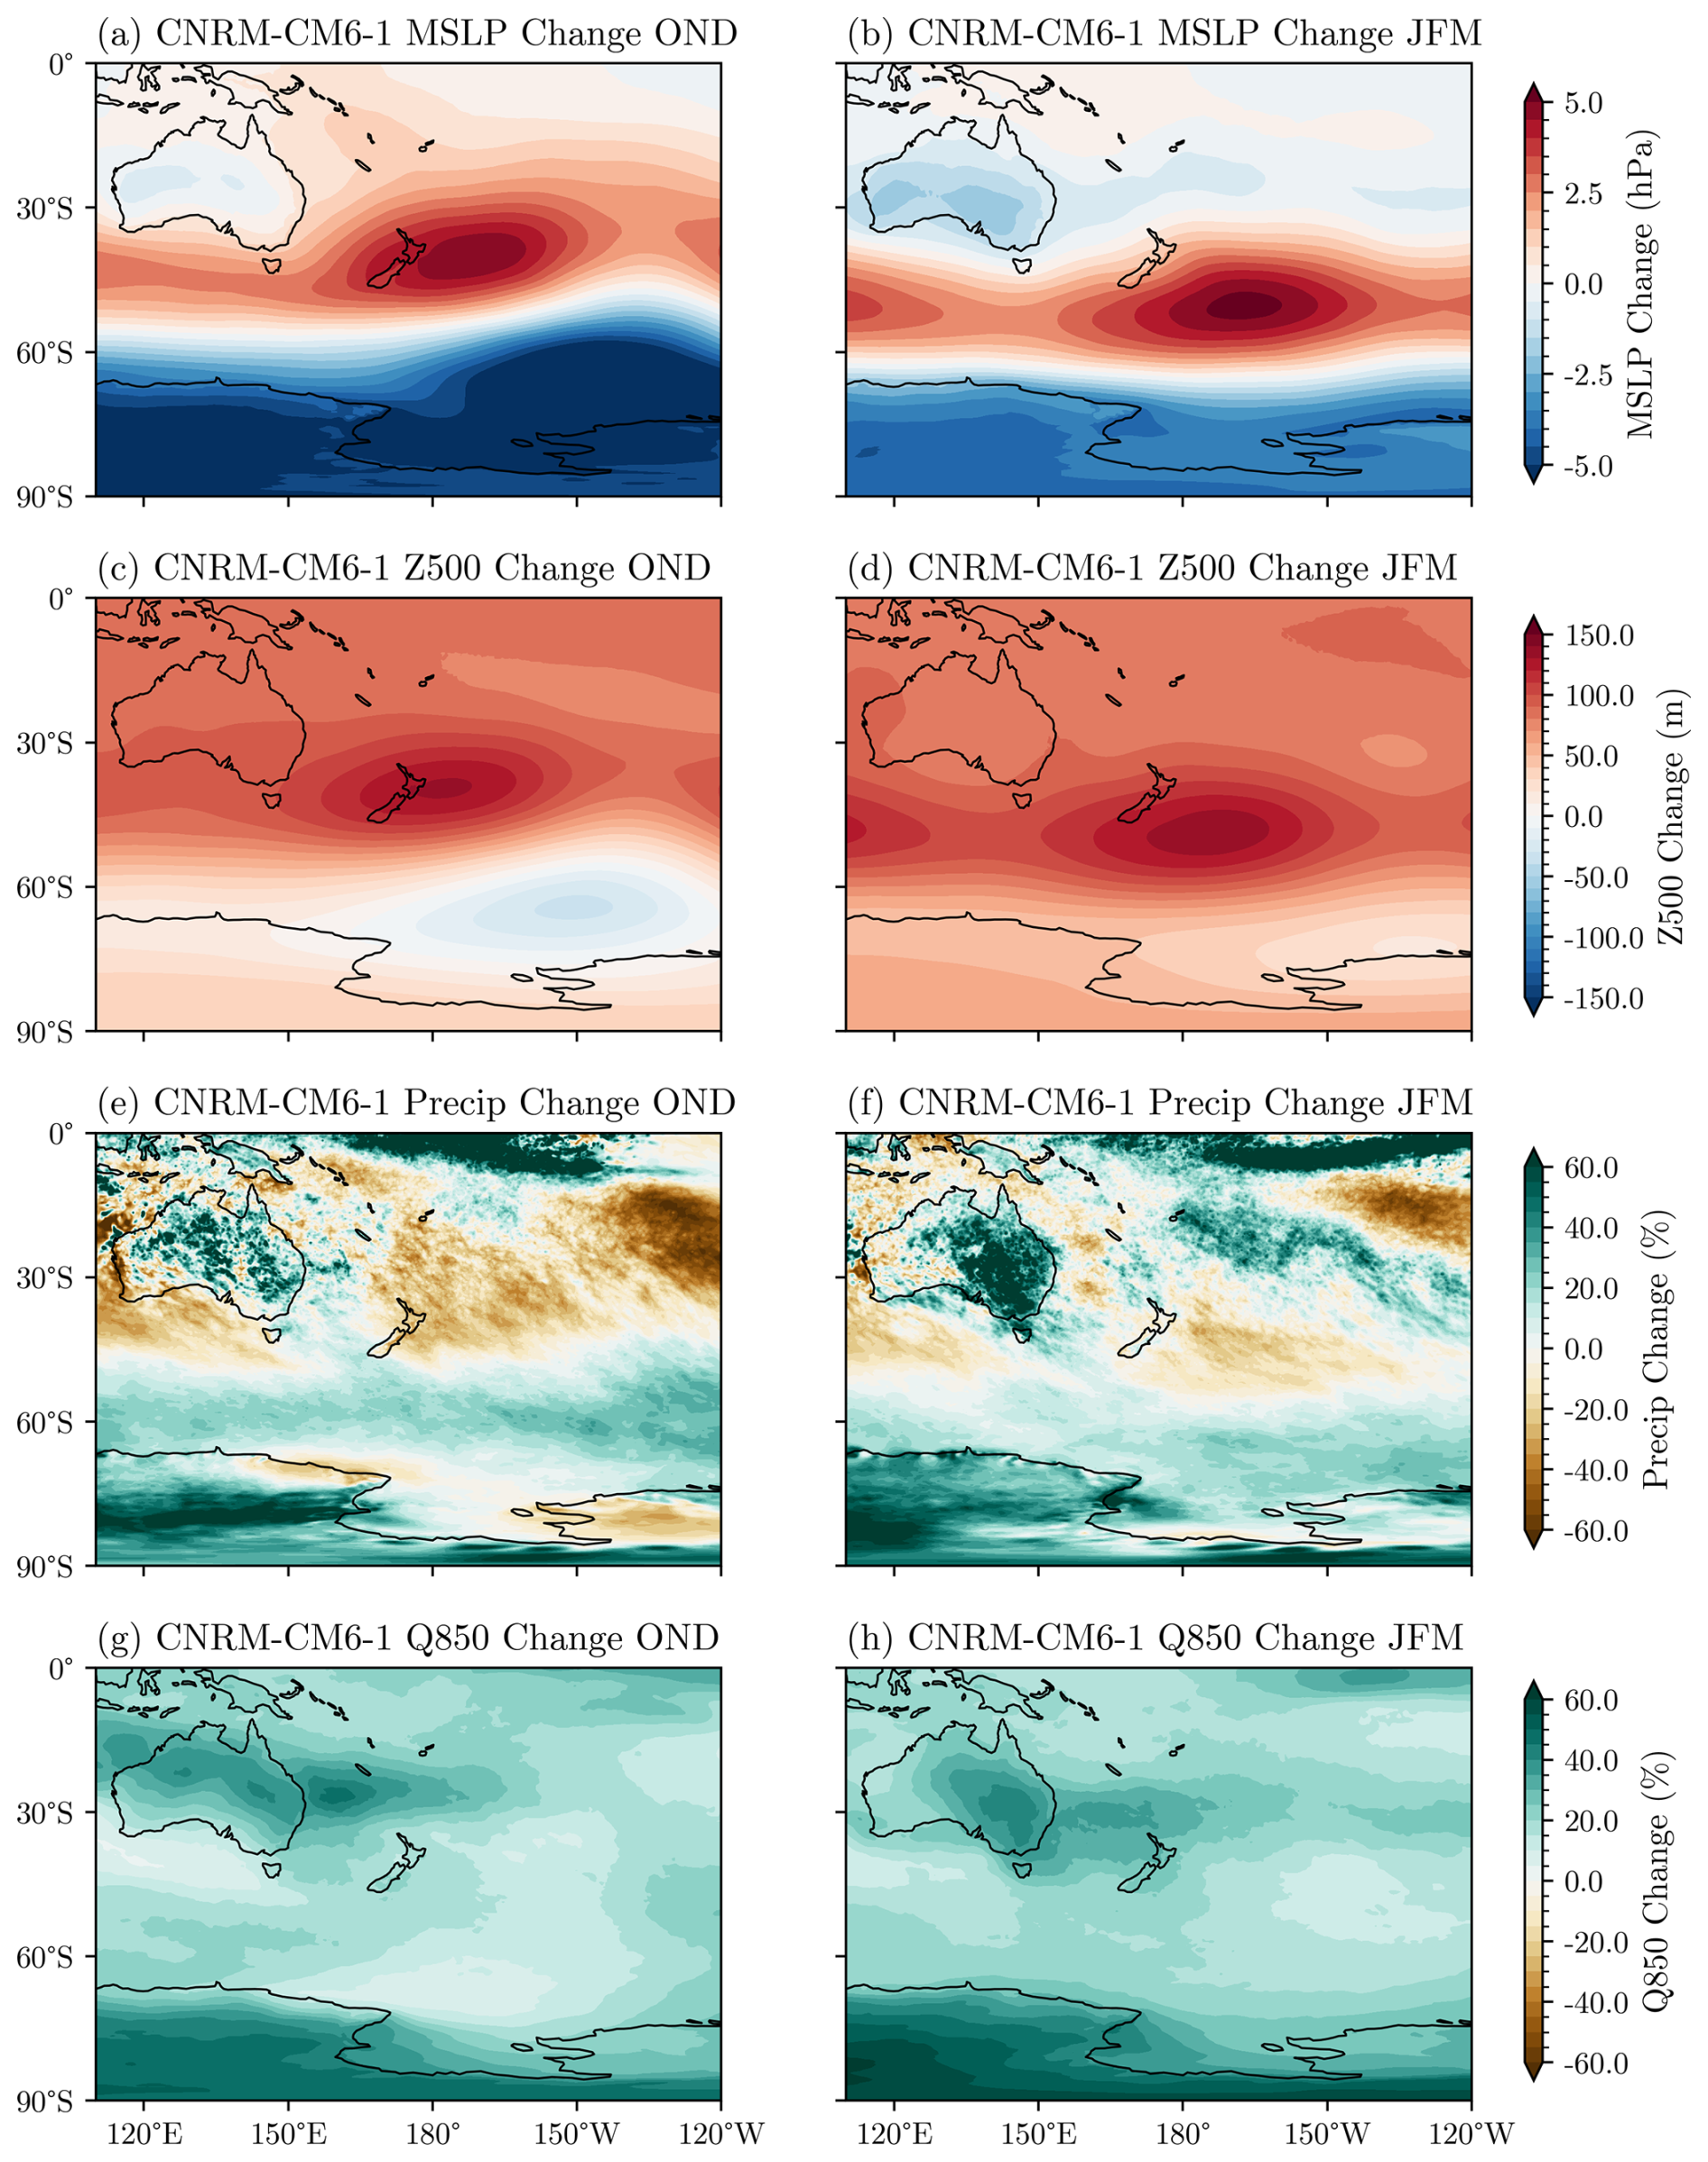
Figure 2Changes in large-scale conditions between 1985–2014 (historical) and 2070–2099 (SSP370) for the CNRM-CM6-1 model. (a–b) Changes in mean sea level pressure (MSLP) in (a) OND and (b) JFM between 1985–2014 in the historical period and 2070–2099 in SSP370. (c–d) Similarly to panels (a)–(b) but for changes in geopotential height (Z) at 500 hPa. (e–f) Similarly to panels (a)–(b) but for precipitation. (g–h) Similarly to panels (a)–(b) but for specific humidity (Q) at 850 hPa.
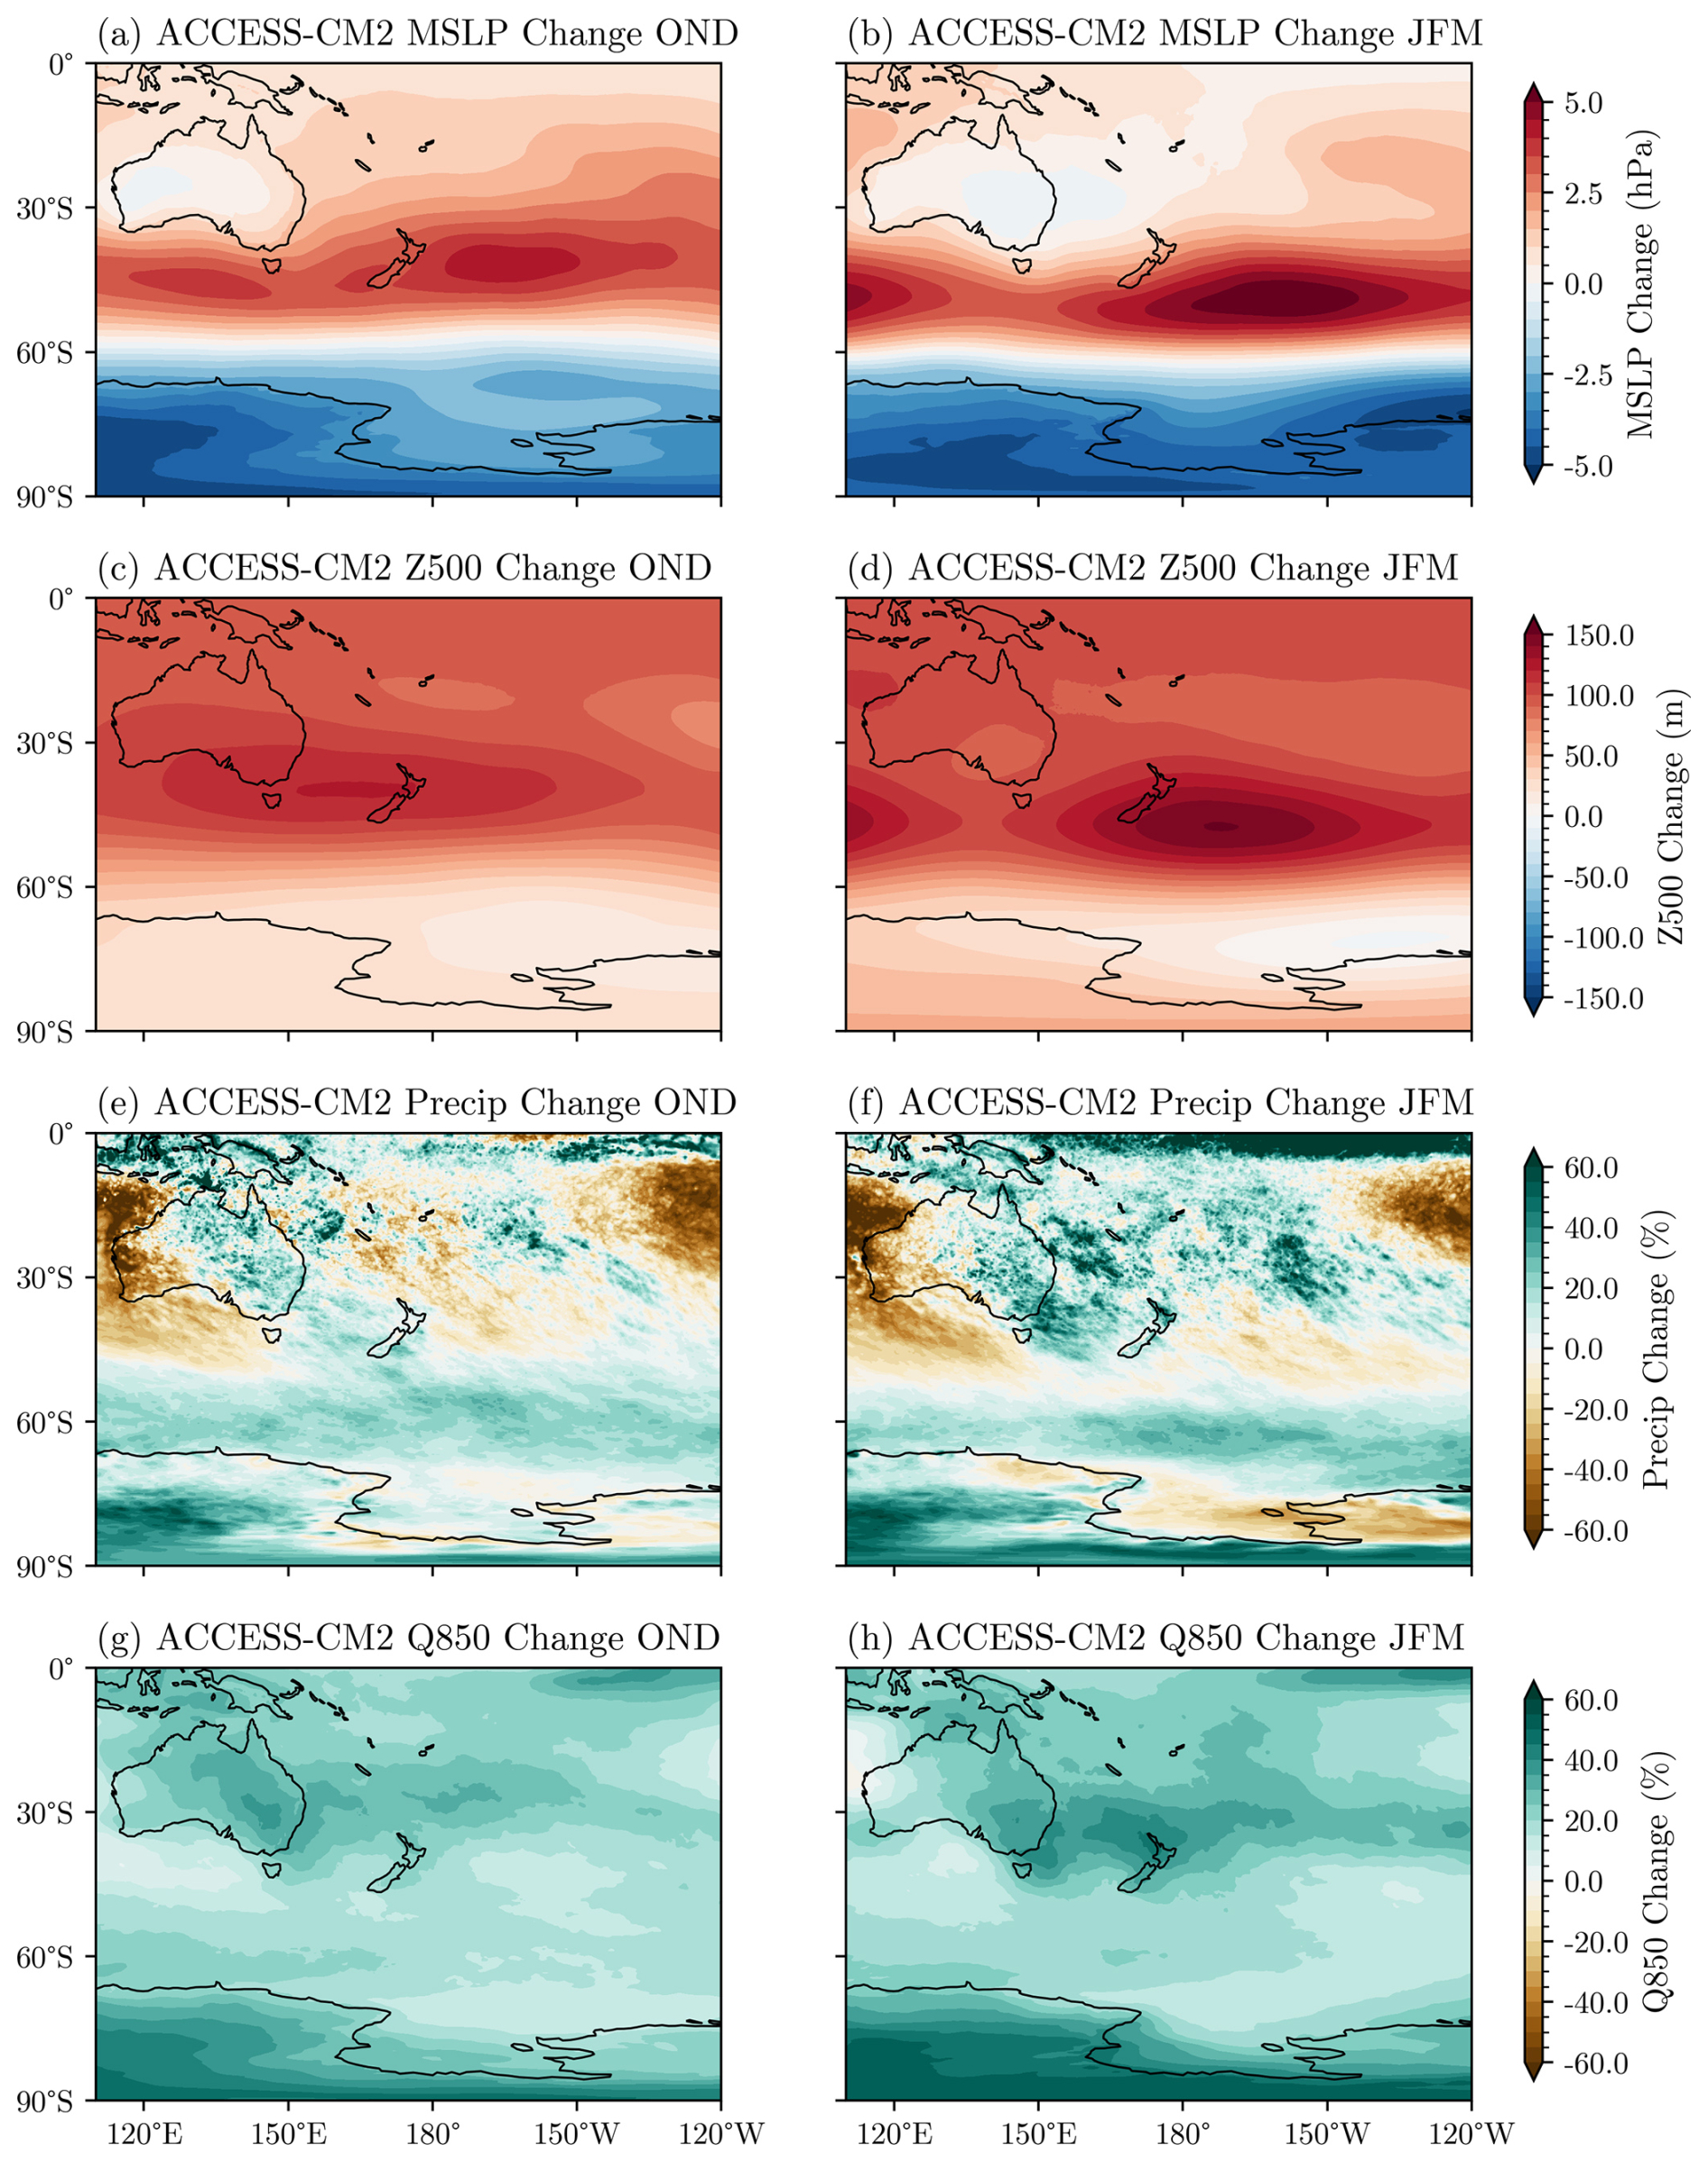
Figure 3Changes in large-scale conditions between 1985–2014 (historical) and 2070–2099 (SSP370) for the ACCESS-CM2 model. (a–b) Changes in mean sea level pressure (MSLP) in (a) OND and (b) JFM between 1985–2014 in the historical period and 2070–2099 in SSP370. (c–d) Similarly to panels (a)–(b) but for changes in geopotential height (Z) at 500 hPa. (e–f) Similarly to panels (a)–(b) but for precipitation. (g–h) Similarly to panels (a)–(b) but for specific humidity (Q) at 850 hPa.
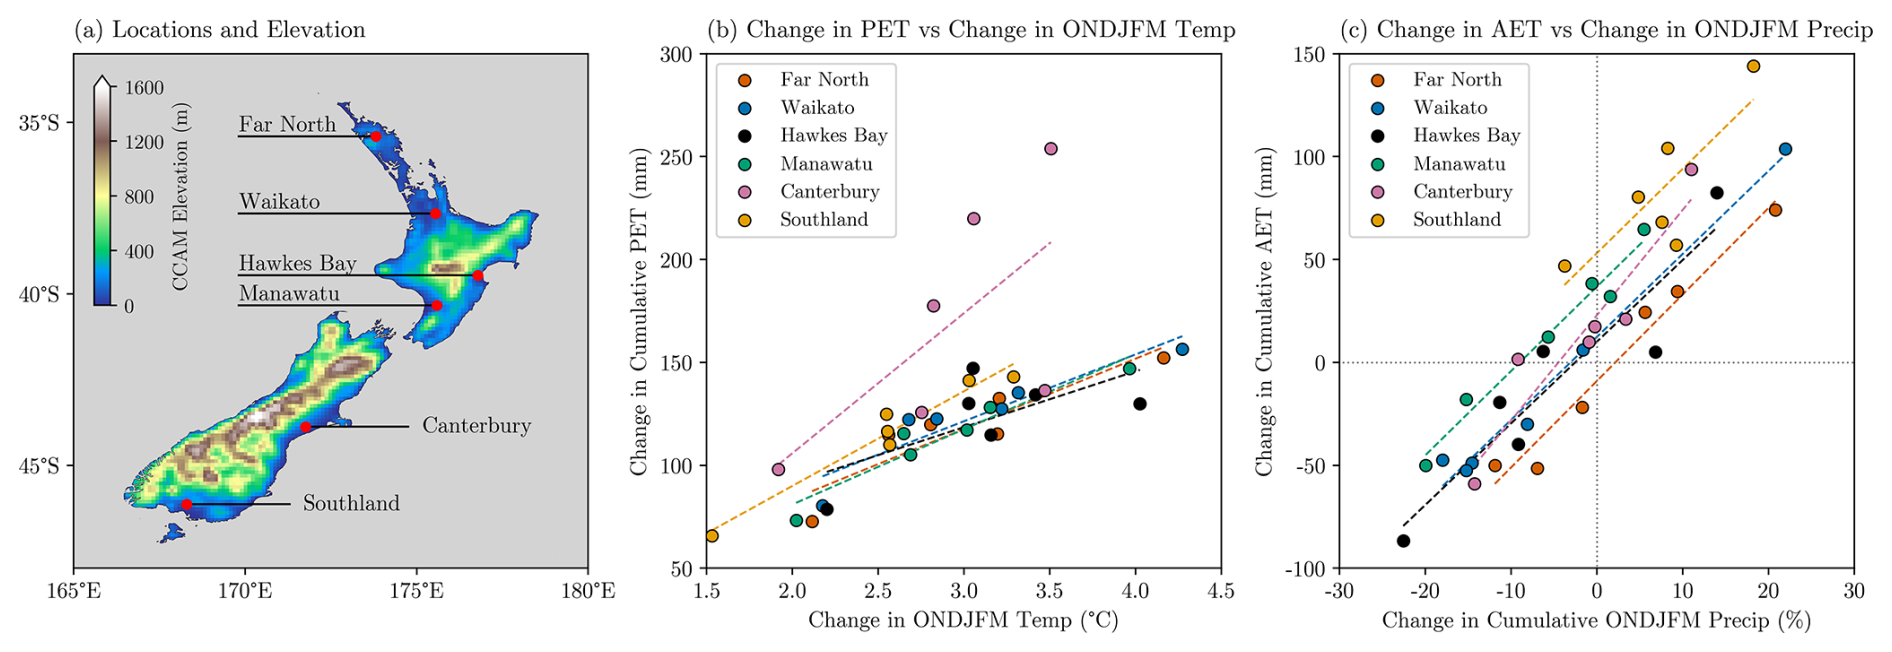
Figure 4(a) Agrarian locations used in this analysis, as well as the elevation of New Zealand grid points in the CCAM RCM. (b) Changes in accumulated annual PET across a mean year versus changes in ONDJFM temperature between historical (1985–2014) and future (2070–2099) periods for various agrarian locations around New Zealand. (c) The same as panel (b) but for changes in annual AET versus ONDJFM rainfall. Each colour represents one location, with each circle representing a downscaled model in our ensemble (n=6) and with the dotted line being the line of best fit across all models for each location.
In our two storyline models, all else being equal, the large degree of warming will increase PET and thus also increase the drying rate of soil moisture. This drying will be somewhat mitigated in ACCESS-CM2 due to future increases in rainfall and exacerbated in CNRM-CM6-1 due to decreases in rainfall. Indeed, this is confirmed when examining future changes to cumulative PET and AET across a full hydrological (July–June) year for six low-lying agriculturally important regions around New Zealand (Fig. 4a), where changes in PET are correlated with mean temperature (b) and where changes in AET are correlated with rainfall (c) across all six GCMs.
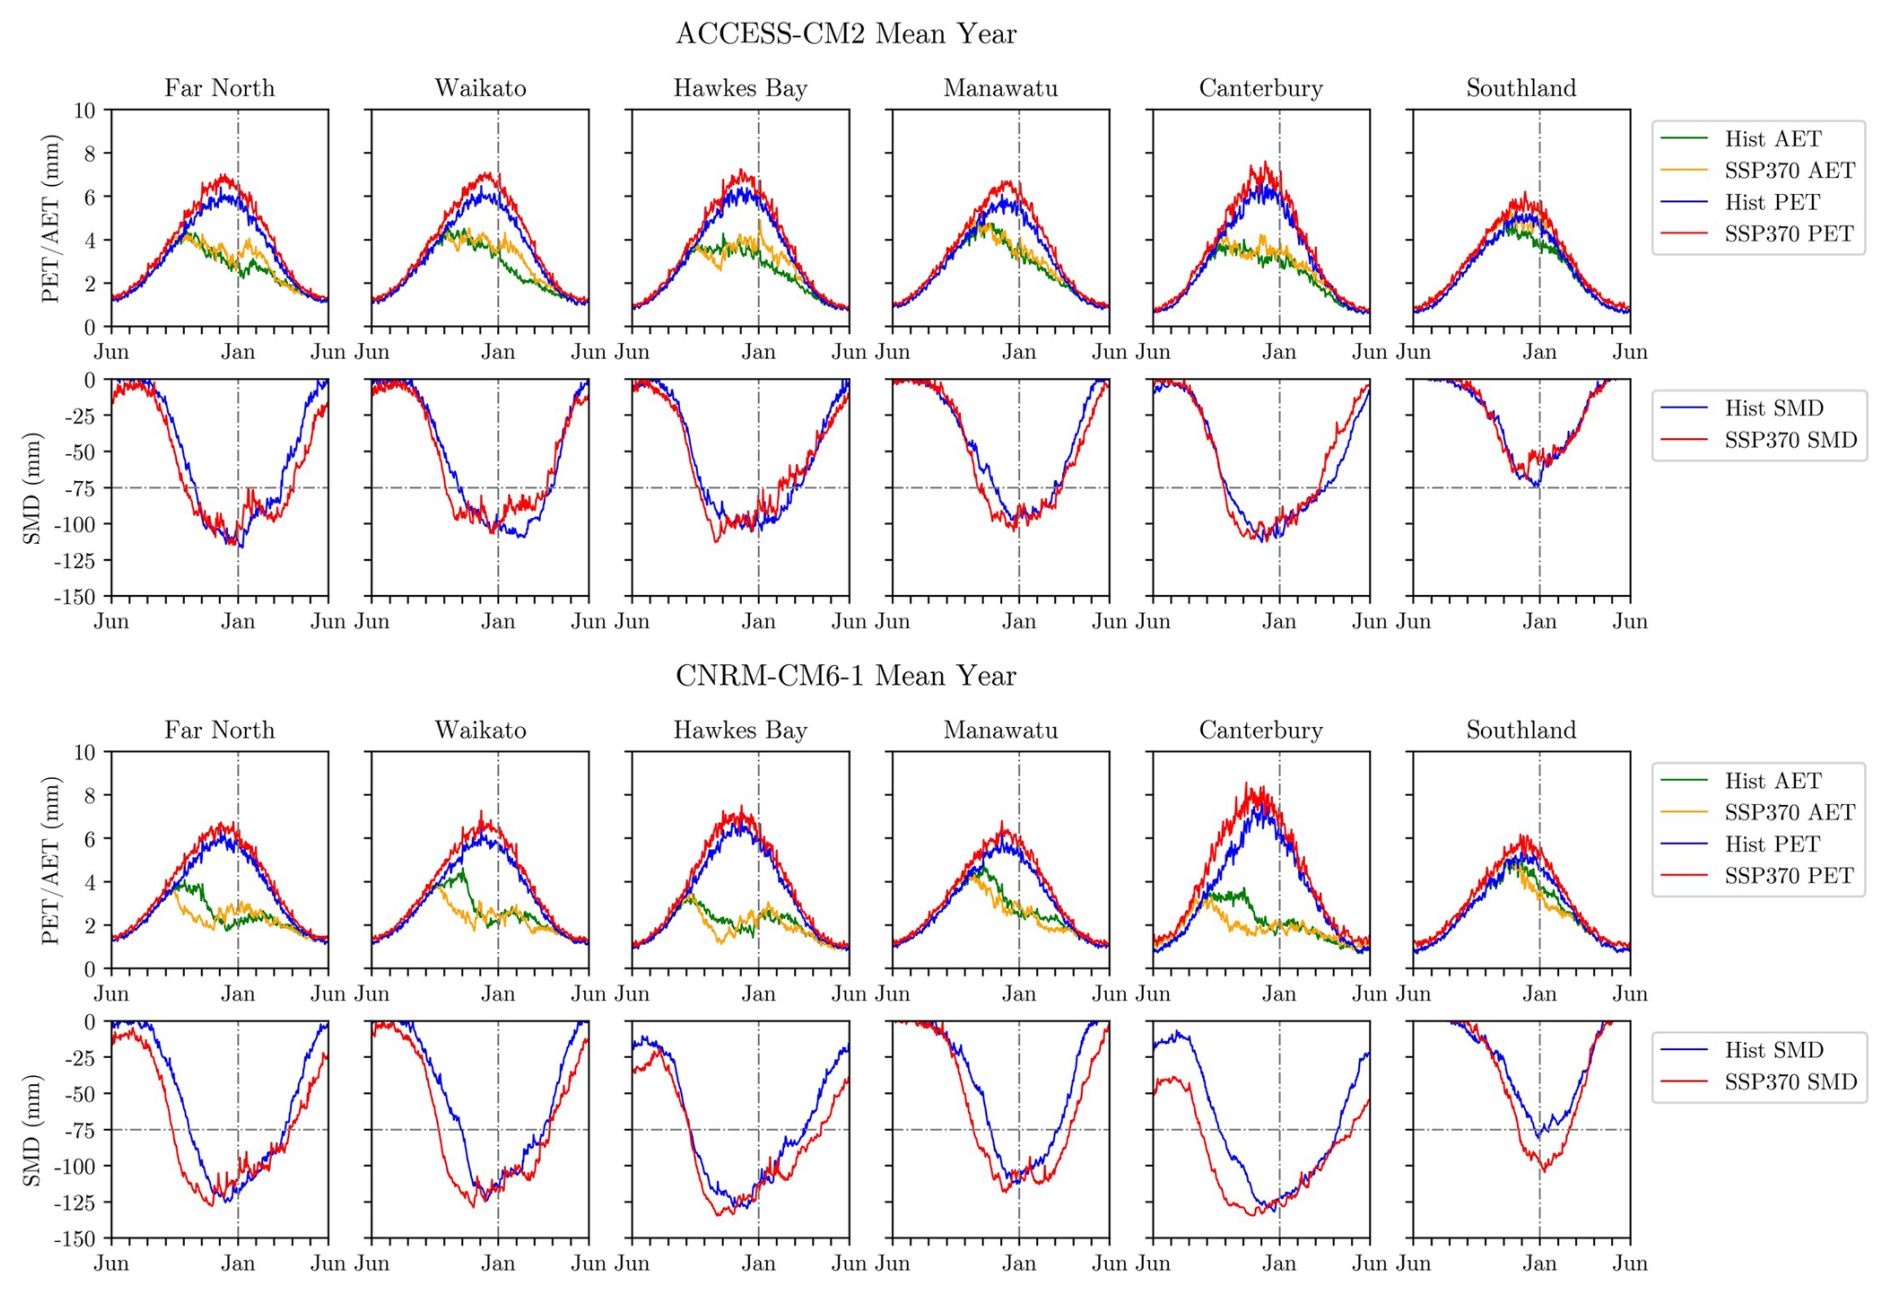
Figure 5First row/third row: day-of-year mean values of historical (blue) and SSP370 (red) PET, alongside historical (green) and SSP370 (orange) values of AET, across the six agrarian locations in this analysis. Second row/fourth row: day-of-year mean values of historical (blue) and SSP370 (red) SMD, across the six agrarian locations in this analysis. The ACCESS-CM2 model is depicted in the top two rows; the CNRM-CM6-1 model is depicted in the bottom two rows.
Figure 5 examines PET, AET, and SMD in both historical and future periods across our six case study locations for the two selected models. In the top and third row of Fig. 5, increases in PET due to the effect of rising future temperatures can be seen in both models (Allen et al., 1998). In ACCESS-CM2, there is a distinct increase in AET from January onwards in the Far North, Waikato, and Hawkes Bay. This increase is likely due to two factors: first, the slightly smaller SMD shown in the second row of Fig. 5, which is due to future increases in mean rainfall; second, the increase in PET while the SMD remains at a similar level, as is the case for the remainder of the regions in ACCESS-CM2 (Manawatu, Canterbury, and Southland). In the CNRM-CM6-1 model the reduction in spring rainfall causes the SMD to reach its summertime values far sooner in the Far North, Waikato, Manawatu, and Canterbury, causing a large reduction in AET over this period. Decreases in summer and autumn rainfall delay the recovery of the soil moisture state most significantly in Manawatu and the Hawkes Bay, with the wintertime SMD value in the Far North, Hawkes Bay, and Canterbury becoming significantly drier in the future.
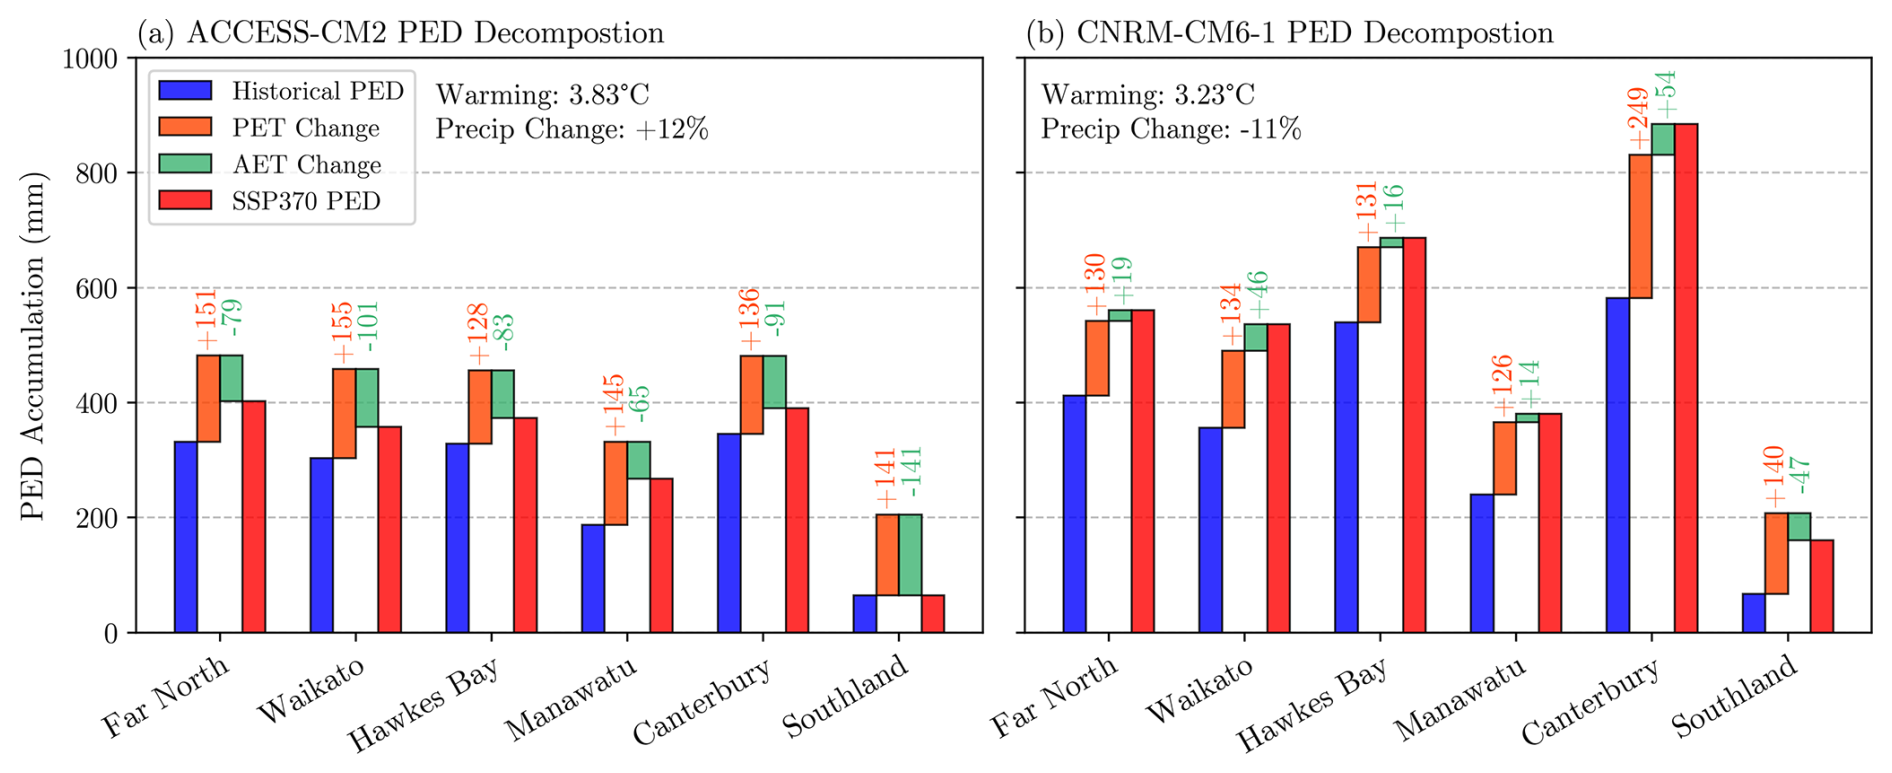
Figure 6Decomposition of changes in PED accumulation at the end of a mean June–July water year from the mean year in the historical period (blue) to the mean year in the future period (red) into contributions from changes in PET (orange) and AET (green). Panel (a) depicts these changes for ACCESS-CM2, and panel (b) depicts these changes for CNRM-CM6-1. Numbers above the PET and AET bars indicate the magnitude of their contribution to the change in PED; this means increases in AET provide a negative contribution to PED, while decreases in AET provide a positive contribution.
The severity of droughts in historical and future periods can be simply quantified using PED, whose climate change signal can be decomposed into contributions of both PET and AET. As seen in Figs. 4c and 5, there is a differing response of AET between the two storylines. We detail these opposing effects on the change in mean drought severity in Fig. 6. In ACCESS-CM2 (Fig. 6a), rainfall-driven increases in AET (increases in AET provide a negative contribution to PED) significantly offset the effects of the temperature-driven increases in PET on PED accumulation. This effect reduces the change in drought severity by over 50 % in the Far North, Waikato, Hawkes Bay, and Canterbury and mostly offsets any changes in PET accumulation in Southland. It is possible that the severity of droughts could be alleviated further through if the combination of the PET response from a smaller future temperature increase (e.g. NorESM2-MM shown in Fig. S8b) alongside an AET response from our wet storyline eventuated (ACCESS-CM2 Fig. 6a). The opposite is true for CNRM-CM6-1, shown in panel (b): as soil moisture is no longer replenished by additional rainfall during the dry seasons, the consequential decreases in AET contribute to greater PED accumulation across all regions except Southland. Additionally, the temperature-driven increases in PET propagate through to produce soil moisture drought earlier in the spring/summer and thus lead to higher PED accumulation (see Fig. 7).
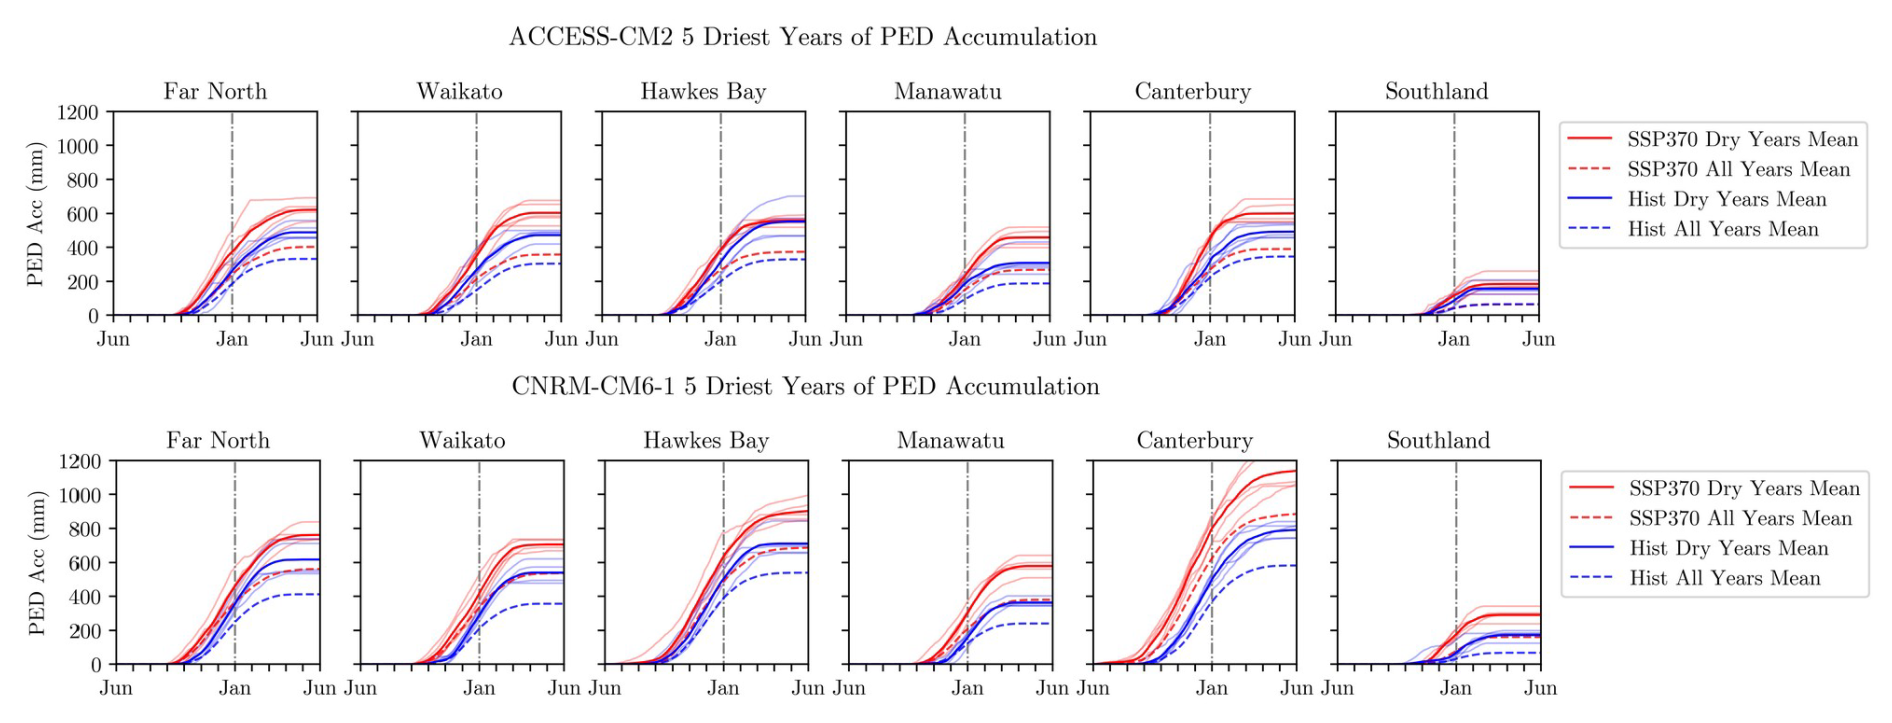
Figure 7The 5 driest years of PED accumulation (light lines) and the mean of those years (solid lines) in both historical (blue) and future (red) periods, for ACCESS-CM2 and CNRM-CM6-1. Dotted lines depict the mean PED accumulation through the mean year in both historical (1985–2014) and future periods (2070–2099) respectively.
Throughout the results presented, we have detailed the mechanisms contributing to future drought in New Zealand for a mean year in both wetting and drying storylines. In Fig. 7, we addressed the drought severity for particularly dry years, examining the 5 driest years in both 30-year historical and future periods, based on the accumulated PED deficit at the end of each June–July water year. With this storyline framework of extreme drought exacerbation being similar to approaches used in Europe (Chan et al., 2022; van der Wiel et al., 2021). For ACCESS-CM2, the 5 driest years become significantly drier in the Far North, Waikato, Manawatu, and Canterbury, with small changes in the severity of the future 5 driest years in Hawkes Bay and Southland. We see a more modest increase in PED accumulation during a mean year across all regions, apart from Southland where the mean PED accumulation does not change. The increases in PED accumulation in the 5 driest years in the CNRM-CM6-1 model are larger than those seen in ACCESS-CM2. These increases occur across all regions, with PED accumulation beginning sooner due to the reduction in spring rainfall. More significantly, the PED accumulation during a mean year in the future approaches and in some cases exceeds the mean of the 5 driest years at each location within the model's historical period. This presents a potentially disastrous scenario for New Zealand's ecology and agriculture, implying that a typical year in a future climate may become a drought year relative to the historical climate. This is especially true in the Canterbury region, where the mean PED accumulation increases by 50 % in the future period. Additionally, under such a scenario, the driest years in the future would be unprecedented relative to any recorded before.
Fundamentally, the selection of any drought metric must confront a trade-off between meaningfully representing the many processes responsible for producing drought-related impacts and ensuring confidence in the ability of our modelling tools to simulate drought projections for the right reasons, which includes being able to identify the physical processes which govern any future change (Erian et al., 2021). Some drought metrics are inherently complex, requiring a multitude of variables to calculate and often including some empirical grounding based on real-world observations from only several locations worldwide. Other more simple metrics emphasize certain aspects of drought for which we have confidence in being meaningfully represented by climate models (Ukkola et al., 2020). Our choice of model and metrics in this analysis was motivated by ensuring consistency with past research on agricultural drought in New Zealand. Uncertainty associated with our choice of model undoubtedly is present, but similar divergence between model projections of river flows has previously been seen in hydrological projections produced for New Zealand based on downscaling of CMIP5 models (Mullan et al., 2018; Collins et al., 2018), providing reassurance that our results are not simply a product of the chosen model. Our framework also allows a transparent pathway to quantify the sometimes-competing influences of projected rainfall and temperature change under future climate scenarios.
There is also some disagreement in the community on the best way to define evaporative droughts in a changing climate. Offline methods using PET tend to overestimate future droughts when compared to direct climate model outputs (Sheffield et al., 2012; Milly and Dunne, 2016; Swann et al., 2016; Yang et al., 2019). These overestimates stem from inappropriate assumptions of the vegetation response to elevated atmospheric CO2 concentrations (Yang et al., 2019) and the double counting of plant feedbacks on surface variables from earth system model outputs (Swann et al., 2016). In the context of our results, the differences between our two storylines are largely due to the rainfall differences between models rather than different levels of temperature-induced drying, which we demonstrate in Fig. 4. In fact, ACCESS-CM2, which represents our wetting storyline, is, on average, 0.6 °C warmer than CNRM-CM6-1 in the future period. Additionally, in the agricultural locations (pasture land) which are the focus of our study, the land surface is not covered by significant vegetation, meaning the vegetation response is likely less important. These factors lead us to believe that although this overestimation of PET may be present, it should only result in a minimal difference when comparing storylines.
Due to the number of available downscaled climate projections over New Zealand in this ensemble, there are some limitations to this analysis. Here, we have been primarily focused on mean change, briefly touching on the increasing severity of particularly dry years within one SSP scenario. Scenario and model uncertainty is often second to internal variability when looking at regional scales (Hawkins and Sutton, 2011; Lehner et al., 2020) and would be the dominant form of uncertainty when examining single model realizations of the future climate. In future, the use of a large initial condition ensemble could be useful to complement the existing analysis by better quantifying extreme drought risk similarly to Falster et al. (2024) or Suarez-Gutierrez et al. (2023). Datasets such as the weather@home ensemble (Black et al., 2016; Harrington et al., 2024) or those produced using artificial intelligence methods to downscale a large ensemble of climate projections (Rampal et al., 2024) could be used to do so.
In this work we have investigated two divergent future drought storylines in New Zealand using dynamically downscaled CMIP6 climate projections and a storyline approach. Our two storylines encapsulate two extreme futures where droughts are either mitigated or exacerbated by future warm-season changes in rainfall, which is highly uncertain during the summertime in New Zealand.
In the wetting storyline, warming-driven increases in potential evapotranspiration are offset by increases in rainfall, leaving soil moisture state only slightly drier than the historical period. In the drying storyline, the decrease in rainfall causes the soil moisture state to dry out earlier in the spring and recover more slowly between autumn and winter. The wetting storyline shows a modest increase in drought severity in the future for a mean year, where increases in rainfall mitigate 50 % of the drying associated with temperature-driven increases in PET. The drying storyline shows a significant increase in drought severity for a mean year, where decreases in rainfall compound the drying associated with the temperature-driven increases in PET. More significantly, in the drying storyline, the drought severity in a mean year in the future becomes comparable to one of the driest years in the model's historical period.
Our choice of storylines aims to capture the two extremes of the future drought distribution in very high warming scenarios. However, the true spread of the possible changes in drought could be more moderate than depicted in these two storylines. We give no weight or recommendation to which particular storyline or intermediate state between two is most likely to play out in the future. Our analysis indicates that this riskier drying storyline remains physically plausible under a high-emissions pathway and should be considered in future planning and adaptation strategies.
The CCAM climate projection ensemble used in this work was produced by NIWA (Gibson et al., 2024b). Access to core variable outputs from this ensemble can be obtained through a free NeSI account: https://www.nesi.org.nz/services/applyforaccess (last access: 20 November 2024). A subset of the model ensemble output is also freely available at https://climatedata.environment.govt.nz/ (last access: 11 September 2025). Computations of PET were made using the PYET Python package (https://github.com/pyet-org/pyet, last access: 11 September 2025) (Vremec et al., 2023).
The supplement related to this article is available online at https://doi.org/10.5194/esd-16-1557-2025-supplement.
HL generated the PET and soil moisture datasets, contributed to the conceptualization of the work, analysed the data, produced visualizations, and led the writing of the manuscript. LJH conceptualized the work and assisted in writing and editing of the manuscript. PBG ran the CCAM regional climate model and contributed to writing and editing of the manuscript. NR produced the code for the water balance model and contributed to the writing and editing of the manuscript.
The contact author has declared that none of the authors has any competing interests.
Publisher's note: Copernicus Publications remains neutral with regard to jurisdictional claims made in the text, published maps, institutional affiliations, or any other geographical representation in this paper. While Copernicus Publications makes every effort to include appropriate place names, the final responsibility lies with the authors.
The authors would like to thank Wilson Chan and one anonymous reviewer for their helpful comments.
The authors acknowledge funding from the Royal Society of New Zealand via the Marsden Fund (grant ID MFP-UOW2307) and the New Zealand Ministry of Business, Innovation and Employment via their Endeavour Smart Ideas Fund (grant ID UOWX2302).
This paper was edited by Roberta D'Agostino and reviewed by Wilson Chan and one anonymous referee.
Allan, R. P., Barlow, M., Byrne, M. P., Cherchi, A., Douville, H., Fowler, H. J., Gan, T. Y., Pendergrass, A. G., Rosenfeld, D., Swann, A. L. S., Wilcox, L. J., and Zolina, O.: Advances in understanding large-scale responses of the water cycle to climate change, Ann. NY Acad. Sci., 1472, 49–75, https://doi.org/10.1111/nyas.14337, 2020. a
Allen, R. G., Pereira, L. S., Raes, D., and Smith, M.: Crop evapotranspiration-Guidelines for computing crop water requirements-FAO Irrigation and drainage paper 56, Fao, Rome, 300, D05109, https://www.fao.org/4/X0490E/x0490e00.htm (last access: 11 September 2025), 1998. a, b, c, d
Black, M. T., Karoly, D. J., Rosier, S. M., Dean, S. M., King, A. D., Massey, N. R., Sparrow, S. N., Bowery, A., Wallom, D., Jones, R. G., Otto, F. E. L., and Allen, M. R.: The weather@home regional climate modelling project for Australia and New Zealand, Geosci. Model Dev., 9, 3161–3176, https://doi.org/10.5194/gmd-9-3161-2016, 2016. a
Byrne, M. P. and O’Gorman, P. A.: The Response of Precipitation Minus Evapotranspiration to Climate Warming: Why the “Wet-Get-Wetter, Dry-Get-Drier” Scaling Does Not Hold over Land, J. Climate, 28, 8078–8092, https://doi.org/10.1175/JCLI-D-15-0369.1, 2015. a
Chan, W. C. H., Shepherd, T. G., Facer-Childs, K., Darch, G., and Arnell, N. W.: Storylines of UK drought based on the 2010–2012 event, Hydrol. Earth Syst. Sci., 26, 1755–1777, https://doi.org/10.5194/hess-26-1755-2022, 2022. a, b
Clark, A., Mullan, B., and Porteous, A.: Scenarios of regional drought under climate change, National Institute of Water & Atmospheric Research, 2011. a, b
Collins, D., Montgomery, K., and Zammit, C.: Hydrological projections for New Zealand rivers under climate change, Ministry for the Environment, NZ, 2018. a
Curtis, P. E., Ceppi, P., and Zappa, G.: Role of the mean state for the Southern Hemispheric jet stream response to CO2 forcing in CMIP6 models, Environ. Res. Lett., 15, 064011, https://doi.org/10.1088/1748-9326/ab8331, 2020. a
Deser, C., Phillips, A., Bourdette, V., and Teng, H.: Uncertainty in climate change projections: the role of internal variability, Clim. Dynam., 38, 527–546, 2012. a
Erian, W., Pulwarty, R., Vogt, J., et al.: GAR special report on drought 2021, United Nations Office for Disaster Risk Reduction (UNDRR), 2021. a
Eyring, V., Bony, S., Meehl, G. A., Senior, C. A., Stevens, B., Stouffer, R. J., and Taylor, K. E.: Overview of the Coupled Model Intercomparison Project Phase 6 (CMIP6) experimental design and organization, Geosci. Model Dev., 9, 1937–1958, https://doi.org/10.5194/gmd-9-1937-2016, 2016. a
Falster, G. M., Wright, N. M., Abram, N. J., Ukkola, A. M., and Henley, B. J.: Potential for historically unprecedented Australian droughts from natural variability and climate change, Hydrol. Earth Syst. Sci., 28, 1383–1401, https://doi.org/10.5194/hess-28-1383-2024, 2024. a
Gessner, C., Fischer, E. M., Beyerle, U., and Knutti, R.: Multi-year drought storylines for Europe and North America from an iteratively perturbed global climate model, Weather Climate Extremes, 38, 100512, https://doi.org/10.1016/j.wace.2022.100512, 2022. a
Ghosh, R. and Shepherd, T. G.: Storylines of Maritime Continent dry period precipitation changes under global warming, Environ. Res. Lett., 18, 034017, https://doi.org/10.1088/1748-9326/acb788, 2023. a
Gibson, P. B., Perkins-Kirkpatrick, S. E., and Renwick, J. A.: Projected changes in synoptic weather patterns over New Zealand examined through self-organizing maps, Int. J. Climatol., 36, 3934–3948, https://doi.org/10.1002/joc.4604, 2016. a, b
Gibson, P. B., Rampal, N., Dean, S. M., and Morgenstern, O.: Storylines for future projections of precipitation over New Zealand in CMIP6 models, J. Geophys. Res.-Atmos., 129, e2023JD039664, https://doi.org/10.1029/2023JD039664, 2024a. a, b, c
Gibson, P. B., Stuart, S., Sood, A., Stone, D., Rampal, N., Lewis, H., Broadbent, A., Thatcher, M., and Morgenstern, O.: Dynamical downscaling CMIP6 models over New Zealand: added value of climatology and extremes, Clim. Dynam., https://doi.org/10.1007/s00382-024-07337-5, 1–27, 2024b. a, b, c, d, e
Haarsma, R. J. and Selten, F.: Anthropogenic changes in the Walker circulation and their impact on the extra-tropical planetary wave structure in the Northern Hemisphere, Clim. Dynam., 39, 1781–1799, 2012. a
Harrington, L. J., Gibson, P. B., Dean, S. M., Mitchell, D., Rosier, S. M., and Frame, D. J.: Investigating event-specific drought attribution using self-organizing maps, J. Geophys. Res.-Atmos., 121, 12766–12780, https://doi.org/10.1002/2016JD025602, 2016. a
Harrington, L. J., Rosier, S. M., Marsh, T. I., and Frame, D. J.: Robust changes to the wettest and driest days of the year are hidden within annual rainfall projections: a New Zealand case study, Environ. Res. Lett., 19, 074057, https://doi.org/10.1088/1748-9326/ad585a, 2024. a
Harvey, B., Hawkins, E., and Sutton, R.: Storylines for future changes of the North Atlantic jet and associated impacts on the UK, Int. J. Climatol., 43, 4424–4441, 2023. a
Hausfather, Z. and Peters, G. P.: RCP8.5 is a problematic scenario for near-term emissions, P. Natl. Acad. Sci. USA, 117, 27791–27792, https://doi.org/10.1073/pnas.2017124117, 2020. a
Hawkins, E. and Sutton, R.: The potential to narrow uncertainty in projections of regional precipitation change, Clim. Dynam., 37, 407–418, 2011. a
Lee, J.-Y., Marotzke, J., Bala, G., et al.: Future global climate: scenario-based projections and near-term information, in: Climate change 2021: The physical science basis. Contribution of working group I to the sixth assessment report of the intergovernmental panel on climate change, 553–672, Cambridge University Press, edited by: Kumar Kanikicharla, K., Kattsov, V., and Kimoto, M., https://doi.org/10.1017/9781009157896.006, 2021. a
Lehner, F., Deser, C., Maher, N., Marotzke, J., Fischer, E. M., Brunner, L., Knutti, R., and Hawkins, E.: Partitioning climate projection uncertainty with multiple large ensembles and CMIP5/6, Earth Syst. Dynam., 11, 491–508, https://doi.org/10.5194/esd-11-491-2020, 2020. a, b
Lesk, C., Rowhani, P., and Ramankutty, N.: Influence of extreme weather disasters on global crop production, Nature, 529, 84–87, 2016. a
McGregor, J. L. and Dix, M. R.: An updated description of the conformal-cubic atmospheric model, in: High resolution numerical modelling of the atmosphere and ocean, 51–75, Springer, https://doi.org/10.1007/978-0-387-49791-4_4, 2008. a
McGregor, S., Cassou, C., Kosaka, Y., and Phillips, A. S.: Projected ENSO Teleconnection Changes in CMIP6, Geophys. Res. Lett., 49, e2021GL097511, https://doi.org/10.1029/2021GL097511, 2022. a
Milly, P. C. and Dunne, K. A.: Potential evapotranspiration and continental drying, Nat. Clim. Change, 6, 946–949, 2016. a
Mol, A., Tait, A., and Macara, G.: An automated drought monitoring system for New Zealand, Weather Climate, 37, 23–36, https://doi.org/10.2307/26735444, 2017. a
Mullan, B., Porteous, A., Wratt, D., and Hollis, M.: Changes in drought risk with climate change, Prepared for Ministry for the Environment (NZ Climate Change Office) and Ministry of Agriculture and Forestry, NIWA Client Report: WLG2005–23, National Institute of Water and Atmospheric Research, Wellington, 2005. a, b
Mullan, B., Abha, S., and Stuart, S.: Climate Change Projections for New Zealand: Atmospheric projections based on simulations undertaken for the IPCC 5th Assessment, National Institute of Water & Atmospheric Research, 2018. a, b, c, d
Naumann, G., Cammalleri, C., Mentaschi, L., and Feyen, L.: Increased economic drought impacts in Europe with anthropogenic warming, Nat. Clim. Change, 11, 485–491, 2021. a
Porteous, A. S., Basher, R. E., and Salinger, M. J.: Calibration and performance of the single‐layer soil water balance model for pasture sites, New Zealand J. Agric. Res., 37, 107–118, https://doi.org/10.1080/00288233.1994.9513047, 1994. a, b
Prudhomme, C. and Williamson, J.: Derivation of RCM-driven potential evapotranspiration for hydrological climate change impact analysis in Great Britain: a comparison of methods and associated uncertainty in future projections, Hydrol. Earth Syst. Sci., 17, 1365–1377, https://doi.org/10.5194/hess-17-1365-2013, 2013. a
Rampal, N., Hobeichi, S., Gibson, P. B., Baño-Medina, J., Abramowitz, G., Beucler, T., González-Abad, J., Chapman, W., Harder, P., and Gutiérrez, J. M.: Enhancing Regional Climate Downscaling through Advances in Machine Learning, Artificial Intelligence for the Earth Systems, 3, 230066, https://doi.org/10.1175/AIES-D-23-0066.1, 2024. a
Sheffield, J., Wood, E. F., and Roderick, M. L.: Little change in global drought over the past 60 years, Nature, 491, 435–438, 2012. a
Shepherd, T. G., Boyd, E., Calel, R. A., Chapman, S. C., Dessai, S., Dima-West, I. M., Fowler, H. J., James, R., Maraun, D., Martius, O., Senior, C. A., Sobel, A. H., Stainforth, D. A., Tett, S. F. B., Trenberth, K. E., van den Hurk, B. J. J. M., Watkins, N. W., Wilby, R. L., and Zenghelis, D. A.: Storylines: an alternative approach to representing uncertainty in physical aspects of climate change, Clim. Change, 151, 555–571, 2018. a
Sherwood, S. C., Webb, M. J., Annan, J. D., Armour, K. C., Forster, P. M., Hargreaves, J. C., Hegerl, G., Klein, S. A., Marvel, K. D., Rohling, E. J., Watanabe, M., Andrews, T., Braconnot, P., Bretherton, C. S., Foster, G. L., Hausfather, Z., von der Heydt, A. S., Knutti, R., Mauritsen, T., Norris, J. R., Proistosescu, C., Rugenstein, M., Schmidt, G. A., Tokarska, K. B., and Zelinka, M. D.: An Assessment of Earth's Climate Sensitivity Using Multiple Lines of Evidence, Rev. Geophys., 58, e2019RG000678, https://doi.org/10.1029/2019RG000678, 2020. a
Simpson, I. R., Shaw, T. A., and Seager, R.: A Diagnosis of the Seasonally and Longitudinally Varying Midlatitude Circulation Response to Global Warming, J. Atmos. Sci., 71, 2489–2515, https://doi.org/10.1175/JAS-D-13-0325.1, 2014. a
Singh, J., Ashfaq, M., Skinner, C. B., Anderson, W. B., Mishra, V., and Singh, D.: Enhanced risk of concurrent regional droughts with increased ENSO variability and warming, Nat. Clim. Change, 12, 163–170, 2022. a
Sood, A. and Mullan, B.: Projected Changes in New Zealand Drought Risk: An updated assessment using multiple drought indicators, NIWA Client Report 202001WN1, 2020. a
Suarez-Gutierrez, L., Müller, W. A., and Marotzke, J.: Extreme heat and drought typical of an end-of-century climate could occur over Europe soon and repeatedly, Commun. Earth Environ., 4, 415, https://doi.org/10.1038/s43247-023-01075-y, 2023. a
Swann, A. L., Hoffman, F. M., Koven, C. D., and Randerson, J. T.: Plant responses to increasing CO2 reduce estimates of climate impacts on drought severity, P. Natl. Acad. Sci. USA, 113, 10019–10024, 2016. a, b
Tait, A., Henderson, R., Turner, R., and Zheng, X.: Thin plate smoothing spline interpolation of daily rainfall for New Zealand using a climatological rainfall surface, Int. J. Climatol., 26, 2097–2115, https://doi.org/10.1002/joc.1350, 2006. a
Tait, A., Sturman, J., and Clark, M.: An assessment of the accuracy of interpolated daily rainfall for New Zealand, J. Hydrol. (New Zealand), http://www.jstor.org/stable/43944886 (last access: 10 September 2025), 25–44, 2012. a
Teng, H. and Branstator, G.: Amplification of waveguide teleconnections in the boreal summer, Current Climate Change Reports, 5, 421–432, 2019. a
Ukkola, A. M., De Kauwe, M. G., Roderick, M. L., Abramowitz, G., and Pitman, A. J.: Robust Future Changes in Meteorological Drought in CMIP6 Projections Despite Uncertainty in Precipitation, Geophys. Res. Lett., 47, e2020GL087820, https://doi.org/10.1029/2020GL087820, 2020. a
Vallis, G. K., Zurita-Gotor, P., Cairns, C., and Kidston, J.: Response of the large-scale structure of the atmosphere to global warming, Q. J. Roy. Meteor. Soc., 141, 1479–1501, https://doi.org/10.1002/qj.2456, 2015. a
van der Wiel, K., Lenderink, G., and de Vries, H.: Physical storylines of future European drought events like 2018 based on ensemble climate modelling, Weather Climate Extremes, 33, 100350, https://doi.org/10.1016/j.wace.2021.100350, 2021. a, b
van der Wiel, K., Beersma, J., van den Brink, H., Krikken, F., Selten, F., Severijns, C., Sterl, A., van Meijgaard, E., Reerink, T., and van Dorland, R.: KNMI'23 climate scenarios for the Netherlands: storyline scenarios of regional climate change, Earth's Future, 12, e2023EF003983, https://doi.org/10.1029/2023EF003983, 2024. a
Vremec, M., Collenteur, R. A., and Birk, S.: Technical note: Improved handling of potential evapotranspiration in hydrological studies with PyEt, Hydrol. Earth Syst. Sci. Discuss. [preprint], https://doi.org/10.5194/hess-2022-417, 2023. a, b
Wang, J., Kim, H., and DeFlorio, M. J.: Future Changes of PNA-like MJO Teleconnections in CMIP6 Models: Underlying Mechanisms and Uncertainty, J. Climate, 35, 3459–3478, https://doi.org/10.1175/JCLI-D-21-0445.1, 2022. a
Yang, Y., Roderick, M. L., Zhang, S., McVicar, T. R., and Donohue, R. J.: Hydrologic implications of vegetation response to elevated CO2 in climate projections, Nat. Clim. Change, 9, 44–48, 2019. a, b
Zappa, G. and Shepherd, T. G.: Storylines of Atmospheric Circulation Change for European Regional Climate Impact Assessment, J. Climate, 30, 6561–6577, https://doi.org/10.1175/JCLI-D-16-0807.1, 2017. a