the Creative Commons Attribution 4.0 License.
the Creative Commons Attribution 4.0 License.
 | 29 Jan 2024
Historical and projected future runoff over the Mekong River basin
Chao Wang
Stephen Leisz
Xiaoying Shi
Jiafu Mao
The Mekong River (MR) crosses the borders and connects six countries, including China, Myanmar, Laos, Thailand, Cambodia, and Vietnam. It provides critical water resources and supports natural and agricultural ecosystems, socioeconomic development, and the livelihoods of the people living in this region. Understanding changes in the runoff of this important international river under projected climate change is critical for water resource management and climate change adaptation planning. However, research on long-term runoff dynamics for the MR and the underlying drivers of runoff variability remains scarce. Here, we analyse historical runoff variations from 1971 to 2020 based on runoff gauge data collected from eight hydrological stations along the MR. With these runoff data, we then evaluate the runoff simulation performance of five global hydrological models (GHMs) forced by four global climate models (GCMs) under the Inter-Sectoral Impact Model Intercomparison Project (ISIMIP). Furthermore, based on the best simulation combination, we quantify the impact of future climate change on river runoff changes in the MR. The result shows that the annual runoff in the MR has not changed significantly in the past 5 decades, while the establishment of dams and reservoirs in the basin visibly affected the annual runoff distribution. The ensemble-averaged result of the Water Global Assessment and Prognosis version 2 (WaterGAP2; i.e. GHM) forced by four GCMs has the best runoff simulation performance. Under Representative Concentration Pathways (RCPs; i.e. RCP2.6, RCP6.0 and RCP8.5), the runoff of the MR is projected to increase significantly (p<0.05); e.g. 3.81 ± 3.47 (9 ± 8 % increase in 100 years) at the upper reach under RCP2.6 and 16.36 ± 12.44 (13 ± 10 % increase in 100 years) at the lower reach under RCP6.0. In particular, under the RCP6.0 scenario, the increase in annual runoff is most pronounced in the middle and lower reaches, due to increased precipitation and snowmelt. Under the RCP8.5 scenario, the runoff distribution in different seasons varies obviously, increasing the risk of flooding in the wet season and drought in the dry season.
- Article
(5493 KB) - Full-text XML
- BibTeX
- EndNote


Earth has been experiencing unprecedented climate change since the 1950s (IPCC, 2021). Changes in the climate system are expected to lead to regionally divergent alterations in the hydrological cycle (Giuntoli et al., 2015; Prudhomme et al., 2014). In particular, with the CO2-induced increase in radiative forcing, global runoff is expected to increase (Milly et al., 2005; Yang et al., 2017; IPCC, 2021). Yet the change is also highly heterogenous across different regions (Arnell et al., 2011; Yang et al., 2017). For example, while large runoff increases are expected in moist tropics and high latitudes, dry tropical regions are likely to experience a decrease in runoff (Hagemann et al., 2013; Field and Barros, 2014; Schewe et al., 2014). Moreover, obvious uncertainties also exist for projected changes in regional and global runoff. Coupled state-of-the-art global climate models (GCMs) and global hydrological models (GHMs) are increasingly used for assessments of changes in the hydrological cycle (Li et al., 2017; Krysanova et al., 2018; Wang et al., 2021). Different GCMs use distinct representations of the climate system, leading to “climate model structural uncertainty” (Gosling and Arnell, 2011). Furthermore, differences in GHM structures could also result in large uncertainties in modelled runoffs. In particular, GHMs are modelled on a global scale, and most GHMs are not calibrated. It is common that the performance of GHMs tends to vary with regional location and catchment size (Krysanova et al., 2018). Because simulated river runoffs can guide policy decisions regarding regional water resource management and climate change adaption (Arnell and Gosling, 2016), assessing model performance and reducing uncertainties in modelling results are especially desired at regional scales (Krysanova et al., 2018).
The Mekong River (MR) is an important international river running from the Tibetan Plateau through China and the countries of mainland Southeast Asia (i.e. Myanmar, Laos, Thailand, Cambodia, and Vietnam) before emptying through southern Vietnam into the South China Sea (Baiyinbaoligao et al., 2020). The upper reach of the MR, located in China, is called the Lancang River (Wang et al., 2021) and the lower reaches, as they pass through each country, are known as follows: in Laos it is Mènam Khong, in Thailand it is Mae Nam Khong, in Cambodia it is Mékôngk, and in Vietnam it is Sông Tiên Giang (https://www.britannica.com/place/Mekong-River, last access: 23 February 2023). The agricultural production and life of the residents along the river are directly affected by the changes in the water volume of the MR. Seasonally, the water from the Mekong flood pulses when the river backs up and floods the Tonlé Sap in Cambodia, which is responsible for local fish raising that provides up to 70 % of Cambodians' animal protein intake, and also allows for the growing of floating rice, which feeds the communities in central Cambodia (Eyler, 2019). Furthermore, the fish that originate in the Tonlé Sap leave the lake as the water level decreases and restock a large part of the Lower Mekong reach (Eyler, 2019), providing an important source of income for the population of this area. The Mekong also provides the freshwater necessary for growing rice in the delta in Vietnam, which is considered the “rice bowl” of Vietnam (Tran et al., 2018).
The main stream of the MR extends over 4800 km, with a drainage area of about 795 000 km2 (Adamson et al., 2009). The average annual runoff at the outlet is 14 500 m3 s−1, making it the 10th largest river in the world in terms of water discharge (Cochrane et al., 2014). However, the performance of GHMs for the Mekong River basin (MRB) has rarely been reported (Chen et al., 2021), which could impede improved predictions of future runoff. Importantly, while a number of models have been used to simulate the runoff of the MR (Johnston and Kummu, 2012; Kingston et al., 2011; Li et al., 2017; Yun et al., 2020; Wang et al., 2021), these studies focus on the simulation and analysis of the MR runoff under different climate models by using a single hydrological model and without comparing the performances of different hydrological models. On the other hand, Chen et al. (2021) assess the applicability of 10 hydrological models in the MR using one set of meteorological forcing data from the Global Soil Wetness Project Phase 3 (GSWP3) under the Inter-Sectoral Impact Model Intercomparison Project (ISIMIP). Their study shows that the calibrated GHMs have the best performances during the historical scenario period. However, these studies do not systematically analyse the runoff simulation results of long-term historical periods (including the historical period of historical scenarios and the real-time period of Representative Concentration Pathway (RCP) scenarios, i.e. from the start simulation year of the RCPs to 2020, for which observed runoff data are available) under different GCM–GHM combinations. In the context of high uncertainty in runoff projections under the RCPs, the use of real-world observations to evaluate future projections during the real-time period can increase the reliability of the simulation for more distant future periods. Such an analysis is meaningful and urgent to potentially assess and reduce the uncertainty or bias of runoff simulations introduced by both GCMs and GHMs to achieve more reliable future projections (Kingston et al., 2011; Hoang et al., 2016). As one of the longest rivers in the world and one that is the major water source for 65 million people in the five countries of the Lower Mekong region, comprehensive model evaluation for the MR runoff is critical in order to understand the limitations and strengths of, and also further improve, the global hydrology models for wide application and for better policy decisions for the region.
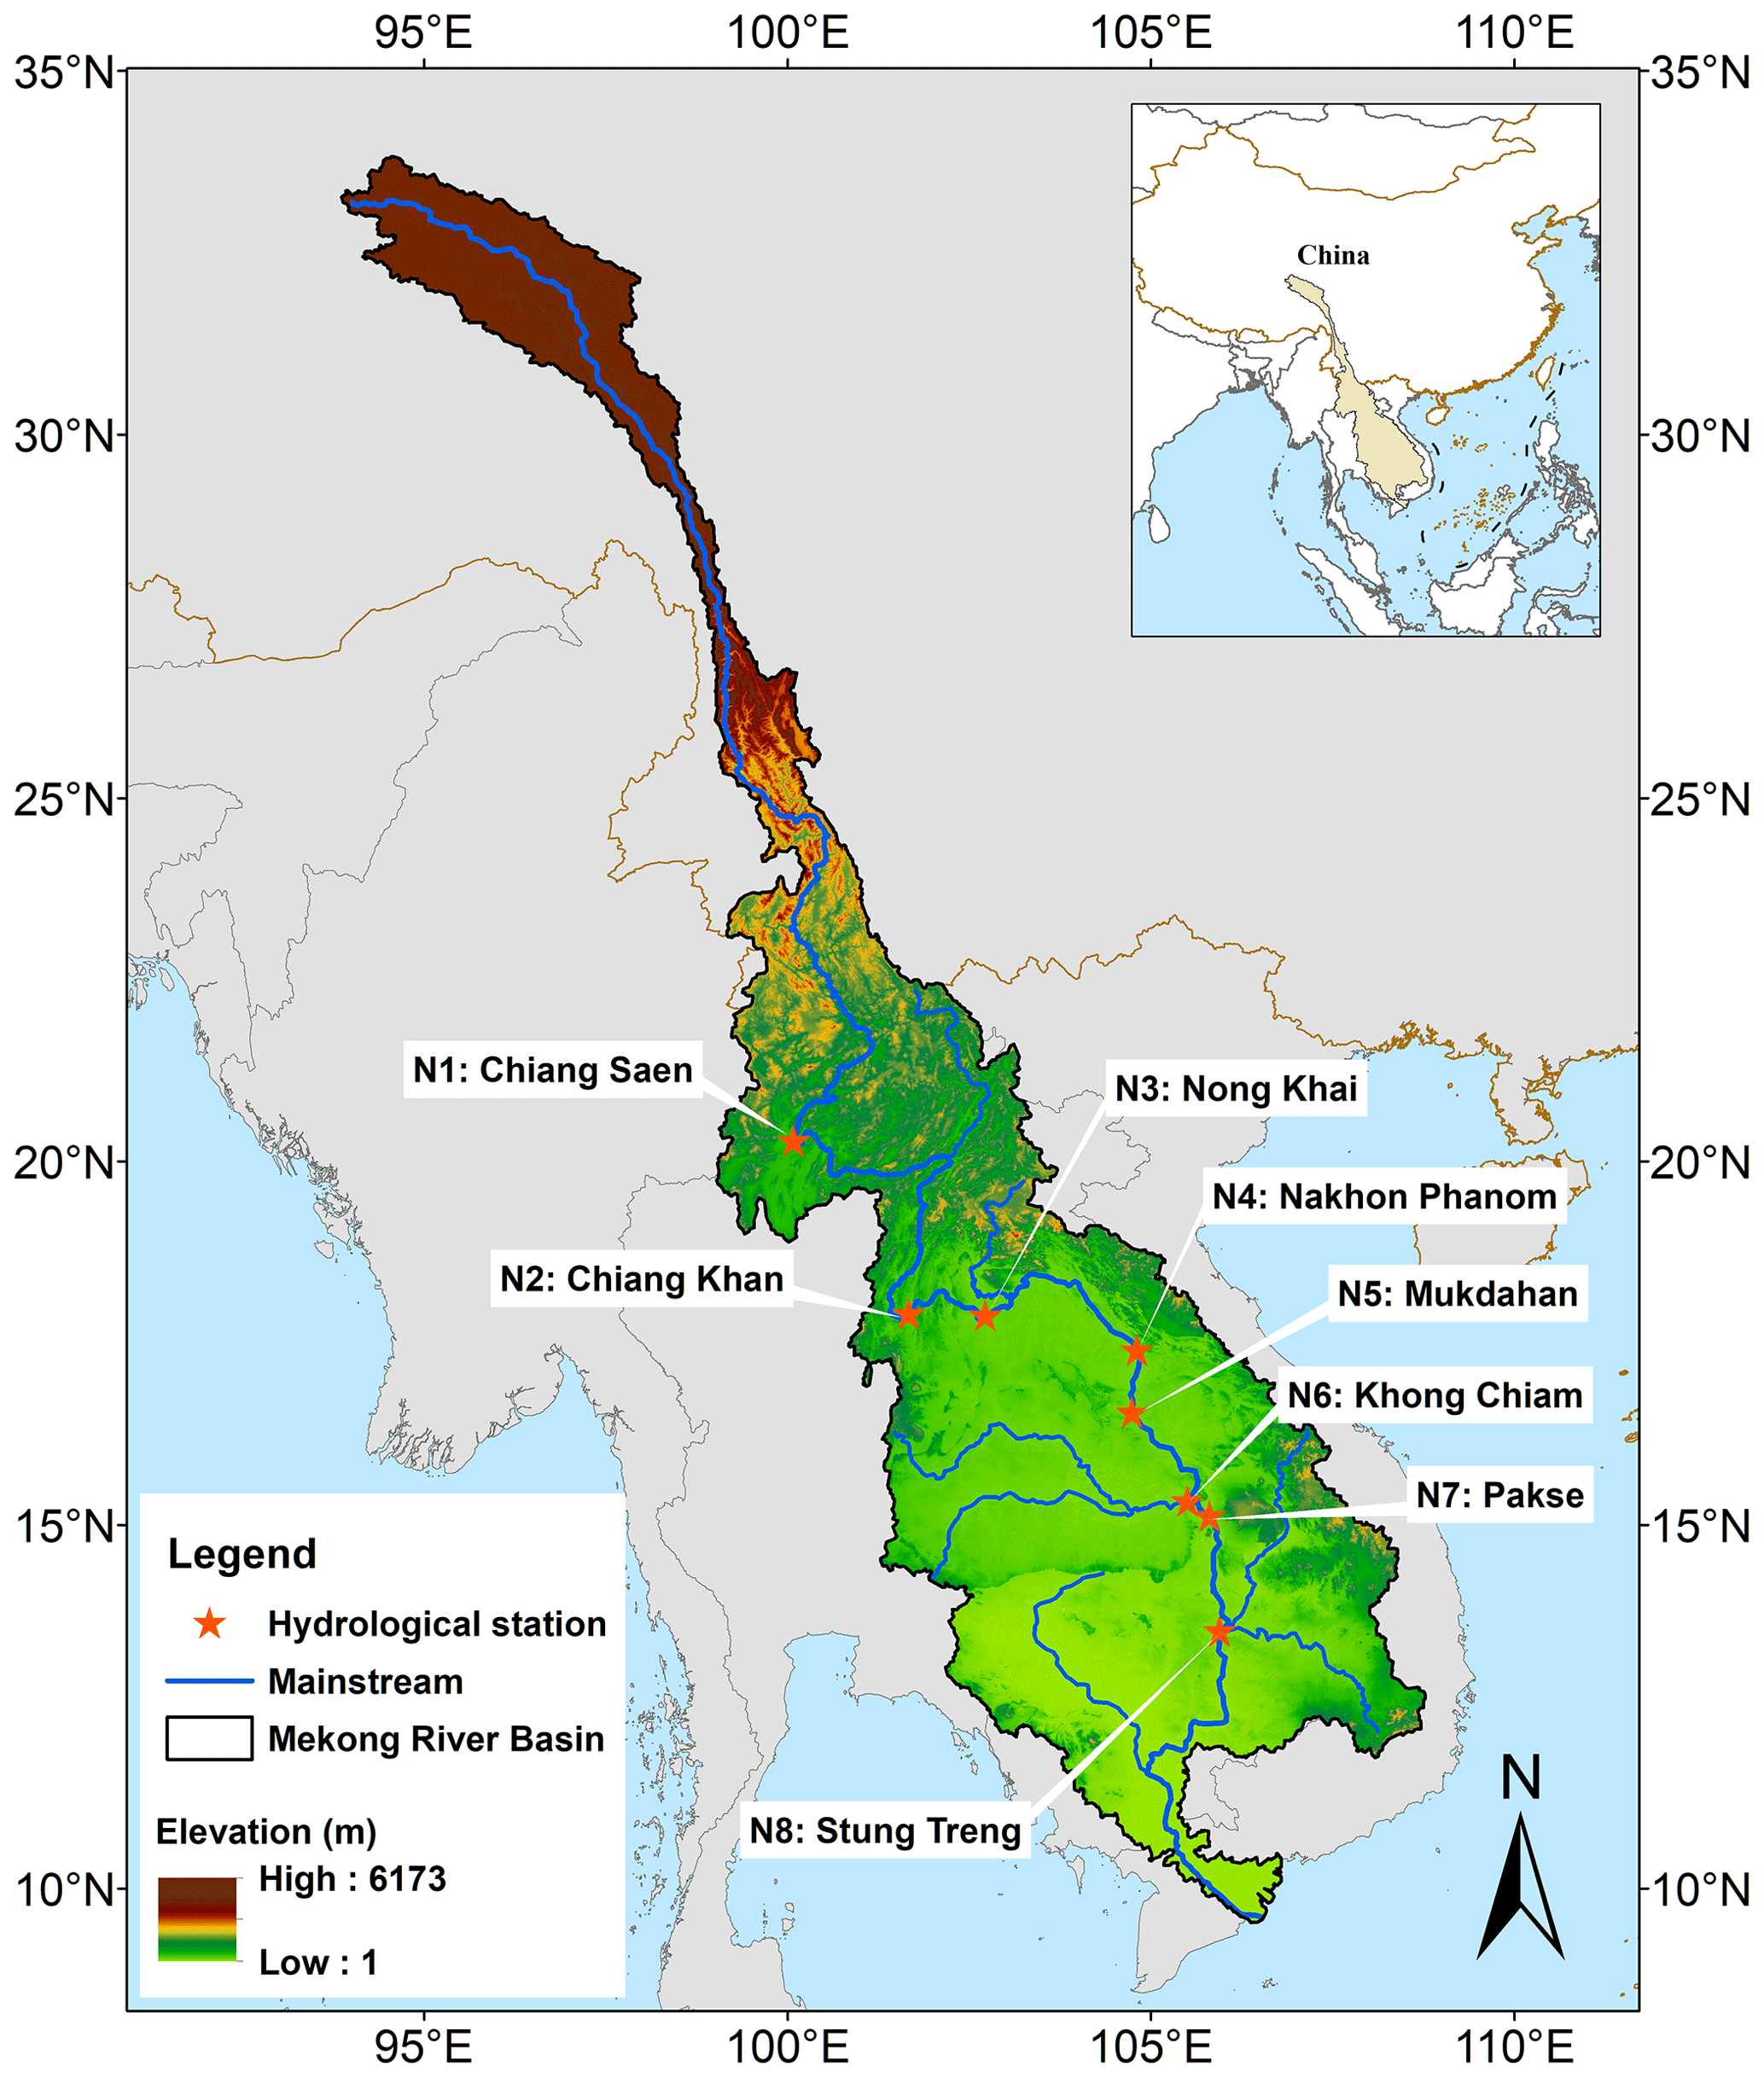
Figure 1The Mekong River basin and the locations of the eight hydrological stations used in modelling comparisons. Note that all the stations are in the Lower Mekong River basin. See Table 1 for detailed station information. Publisher's remark: please note that the above figure contains disputed territories.
The goal of this study is to understand the temporal and spatial variation characteristics of the MR runoff, with a focus on the future runoff changes under different RCP scenarios. To this end, we perform the following analyses: (1) we first perform a trend analysis and significance test on the historical observed runoff during the period 1971–2020 at the eight gauging stations located along the Lower Mekong main stream (Fig. 1). (2) We then evaluate the runoff simulations of different GCM–GHM combinations in ISIMIP over historical scenario periods and real-time periods of RCPs against observed runoff from the above gauging stations and identify the best GCM–GHM combination for predicting future runoff changes. (3) Finally, we comprehensively analyse the future runoff pattern changes (including annual runoff and seasonal runoff) in the upper, middle, and lower reaches of the MRB under future RCP scenarios based on the best GCM–GHM combination.
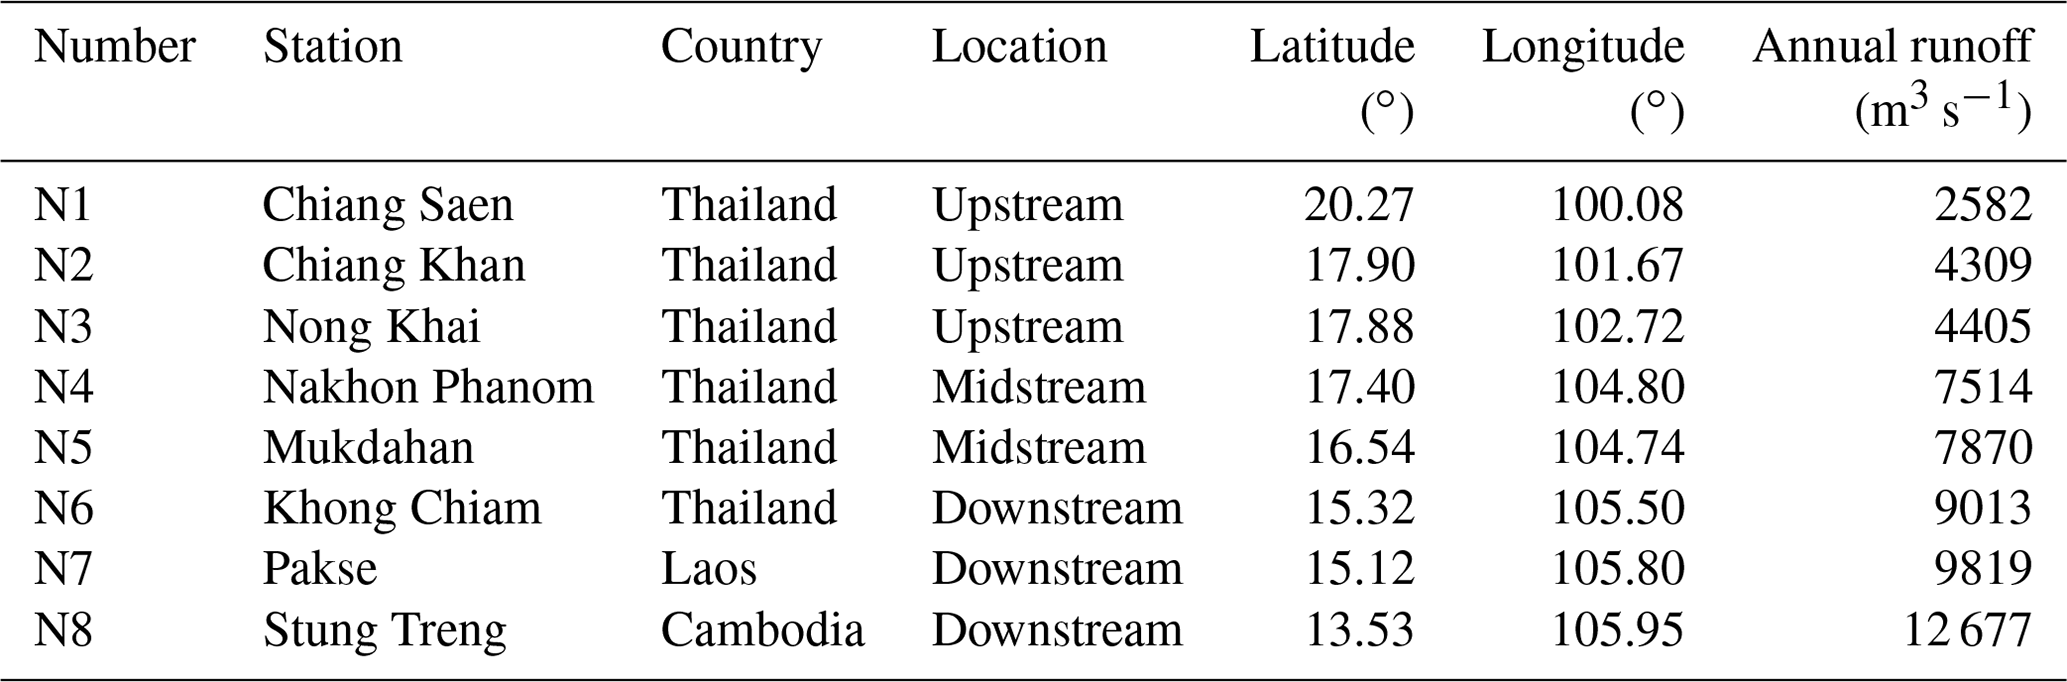
Table 1Basic statistical information of the eight hydrological stations. Note that upstream, midstream, and downstream are referring to the stations' locations along the Lower Mekong River.
2.1 Study area and hydrological stations
Located between 9 and 35∘ N and 94 and 110∘ E (Fig. 1), the MR drains water from a rather narrow basin area. The river is commonly divided into upper and lower parts at the China–Laos boundary. The Lower Mekong River is about 2668 km in length (about 55.6 % of the total length), but the Lower Mekong River basin (LMRB) accounts for nearly 80 % of the total drainage of the MRB. The Mekong River Commission (MRC) manages a database of dozens of gauging stations that monitor the runoff of the main stream and tributaries of the LMRB. For the reasons of availability and for completeness of the data time series, we select eight hydrological stations from the upper, middle, and lower reaches of the Lower Mekong River, including Chiang Saen (N1), Chiang Khan (N2), Nong Khai (N3), Nakhon Phanom (N4), Mukdahan (N5), Khong Chiam (N6), Pakse (N7), and Stung Treng (N8) (Fig. 1). The latitude and longitude locations and annual runoff of the hydrological stations are provided in Table 1. Monthly observed runoff data from MRC (https://portal.mrcmekong.org/, last access: 26 October 2021), ranging from 1971 to 2020, serve as validation data for the GHMs.
2.2 Trend test method
Both linear regression models and the Mann–Kendall test (MK test) are commonly used to test the linear trend of annual climatic variables and the significance of variation in the trends. The MK test is a nonparametric method for detecting trends in time series with minimal assumptions (Lv et al., 2019) and has been widely applied to test trends in hydrological and meteorological series around the world. Compared to parametric tests (e.g. regression coefficient test), non-parametric tests (e.g. the MK test) have no requirements of homoscedasticity or prior assumptions on the distribution of the data sample (Bihrat and Bayazit, 2003) and are less sensitive to outliers (Hamed, 2007). As the MK test statistic is determined by the ranks and sequences of time series rather than the original values, it is robust when dealing with non-normally distributed data, which are commonly encountered in hydrometeorological time series (Wang et al., 2020). The MK test statistic index U (referred to as the MK value) follows the standard normal distribution. A positive or negative U value indicates whether the trend is increasing or decreasing. The null hypothesis in this test is that there is no significant trend in the time series at the significance level of p. If , where is the critical value of the standard normal distribution with a probability greater than , then the null hypothesis is rejected, and the trend is significant (Guan et al., 2021). This study adopts the significance level of 0.05, which means that there is a significant trend of change when the p value is less than 0.05.
2.3 Climate projections and hydrological models
The Inter-Sectoral Impact Model Intercomparison Project (ISIMIP) is a community-driven modelling effort and offers a framework for comparing climate impact projections in different sectors and at different scales (Warszawski et al., 2014). Specifically, the ISIMIP2b scenarios are designed to elicit the contribution of climate change to impacts arising from low-emission climate change scenarios (Frieler et al., 2017). The global climate models (GCMs) selected for this study are derived from the ISIMIP2b protocol, which provides four GCMs from CMIP5 and three emission scenarios (i.e. RCP2.6, RCP6.0, and RCP8.5). In particular, the four GCMs are the Model for Interdisciplinary Research on Climate version 5 (MIROC5); the Hadley Global Environment Model version 2 – Earth System (HadGEM2-ES); the Geophysical Fluid Dynamics Laboratory's Earth System Model 2M (GFDL-ESM2M); and the Institut Pierre-Simon Laplace Climate Model 5A Low Resolution (IPSL-CM5A-LR). These climate models are used because they provide detailed daily climate data, a fine spatial scale, and they have shown good performance in reproducing historical precipitation conditions in the MRB (Ul Hasson et al., 2016; Wang et al., 2021).
This study has selected five global hydrological models (GHMs) to evaluate the runoff simulations in the MRB, and they are the Water Global Assessment and Prognosis version 2 (WaterGAP2) (Alcamo et al., 2003; Müller Schmied et al., 2016), Lund–Potsdam–Jena managed Land (LPJmL) (Sitch et al., 2003), H08 (Hanasaki et al., 2018), Community Land Model version 4.5 (CLM4.5) (Leng et al., 2015), and the Minimal Advanced Treatments of Surface Interaction and RunOff (MATSIRO) (Takata et al., 2003). The ensemble-averaged results of the GHMs model are also added to the validation (Chen et al., 2021). Table 2 shows the daily meteorological forcing variables and the main physical process modules of the above five GHMs. All GHMs operate under the meteorological forcing of the four GCMs, and the ensemble-averaged results of the GCMs are also evaluated due to the variability in the GCMs and the uncertainty of the climate change. The standard deviation of the outputs of the GHM driven by four GCMs is used to quantify the uncertainty from the GCMs. The runoff simulation results of five GHMs forced by four GCMs are all derived from the experimental data of the global water sector in ISIMIP2b.
Table 2Basic information of the GHMs in the ISIMIP2b global water programme. The runoff simulation results of the GHMs forced by different GCMs are all derived from the ISIMIP protocol (https://data.isimip.org/search/product/, last access: 13 December 2021).
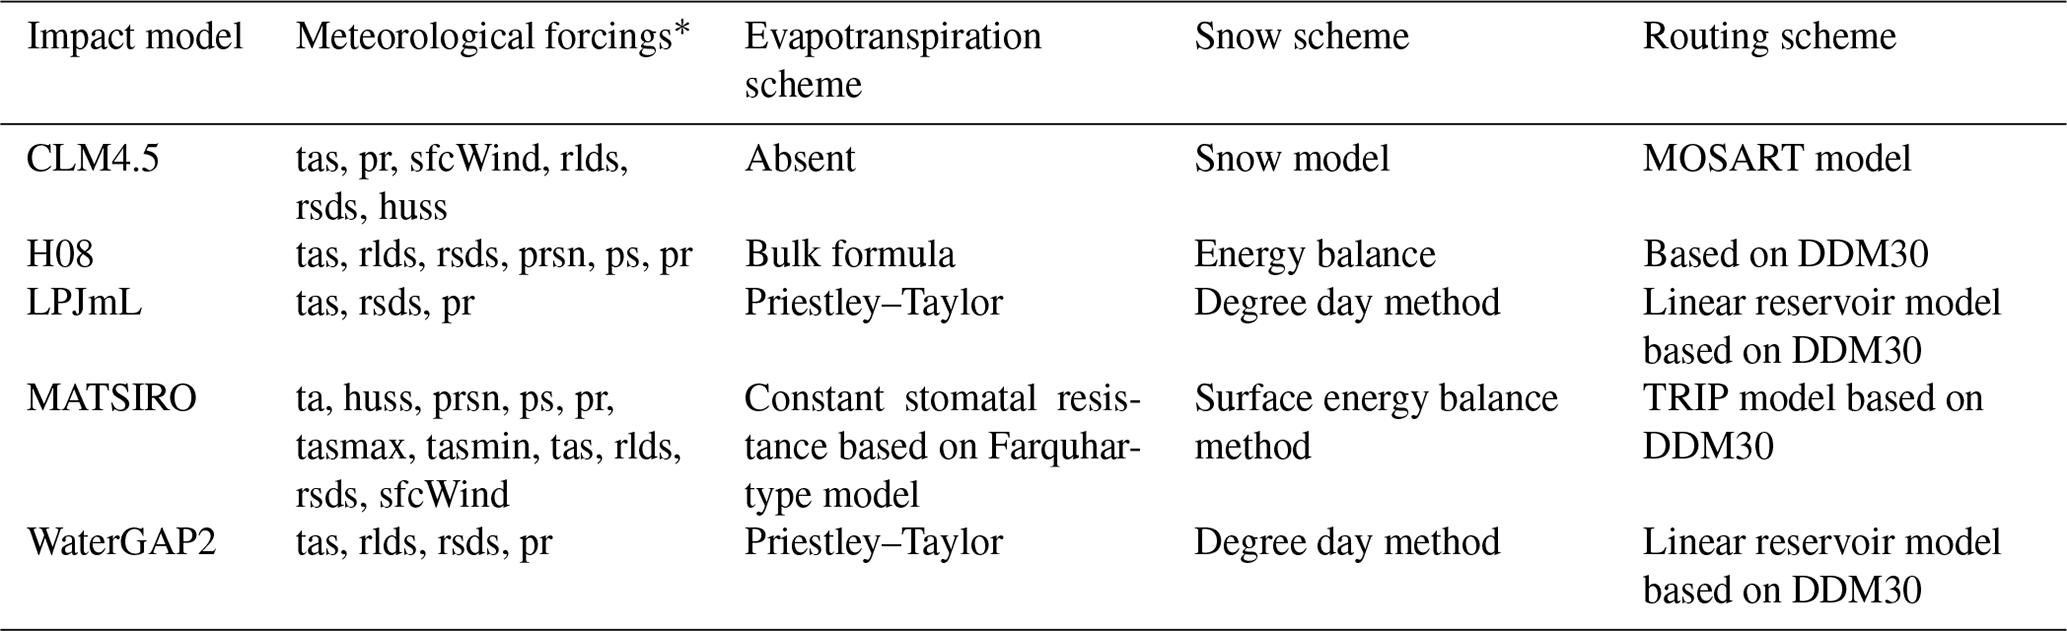
∗ Note: ta is for air temperature; huss is for near-surface specific humidity; sfcWind is for near-surface wind speed; rlds is for longwave downwelling radiation; rsds is for shortwave downwelling radiation; pr is for total precipitation; tas is for daily mean temperature; prsn is for snowfall; ps is for surface air pressure; tasmax is for daily maximum temperature; and tasmin is for daily minimum temperature.
2.4 Model validation and performance indices
Simulated monthly runoffs from different combinations of GCM–GHM models are used to validate a monthly time series for each gauge station (Table 1). For these simulated data, by combining the runoff data of both the historical (1850–2005) and the future RCP (2006–2099) scenarios, we obtain the series corresponding to the same period (1971–2020) as the observed runoff data. We choose to verify the historical phase of the historical simulation (1971–2005) and the historical phase of the RCP simulation (2006–2020) separately. Runoff validation during the RCP period is particularly important, given the uncertainties in climate change under the future projection, and good model performance would greatly increase our confidence in future runoff simulations (Krysanova et al., 2018). For model performance metrics, we select three matrices of quantitative statistics, including Pearson's correlation coefficient squared (R2) in Eq. (1), the Nash–Sutcliffe efficiency (NSE) in Eq. (2), and the percentage bias (Pbias) in Eq. (3):
where is the runoff observation value at time t, and is the runoff simulation value at time t. T is the total number of time steps.
The values of R2 vary between 0 and 1 and reflect the quality of the model for simulating the flow time trend. The closer R2 is to 1, the stronger the simulation ability of the model. NSE is a common evaluation index in the field of hydrology. Its value range is (]. An NSE value close to 1 indicates good model performance, while a value close to 0 means credible model performance but with large errors. Negative NSE values mean that the model is not credible. Pbias shows the average trend of the overestimation or underestimation of the model results compared with the observed data. The closer the value is to 0, the smaller the model deviation and the more credible the results.
3.1 Observation-based historical runoff changes
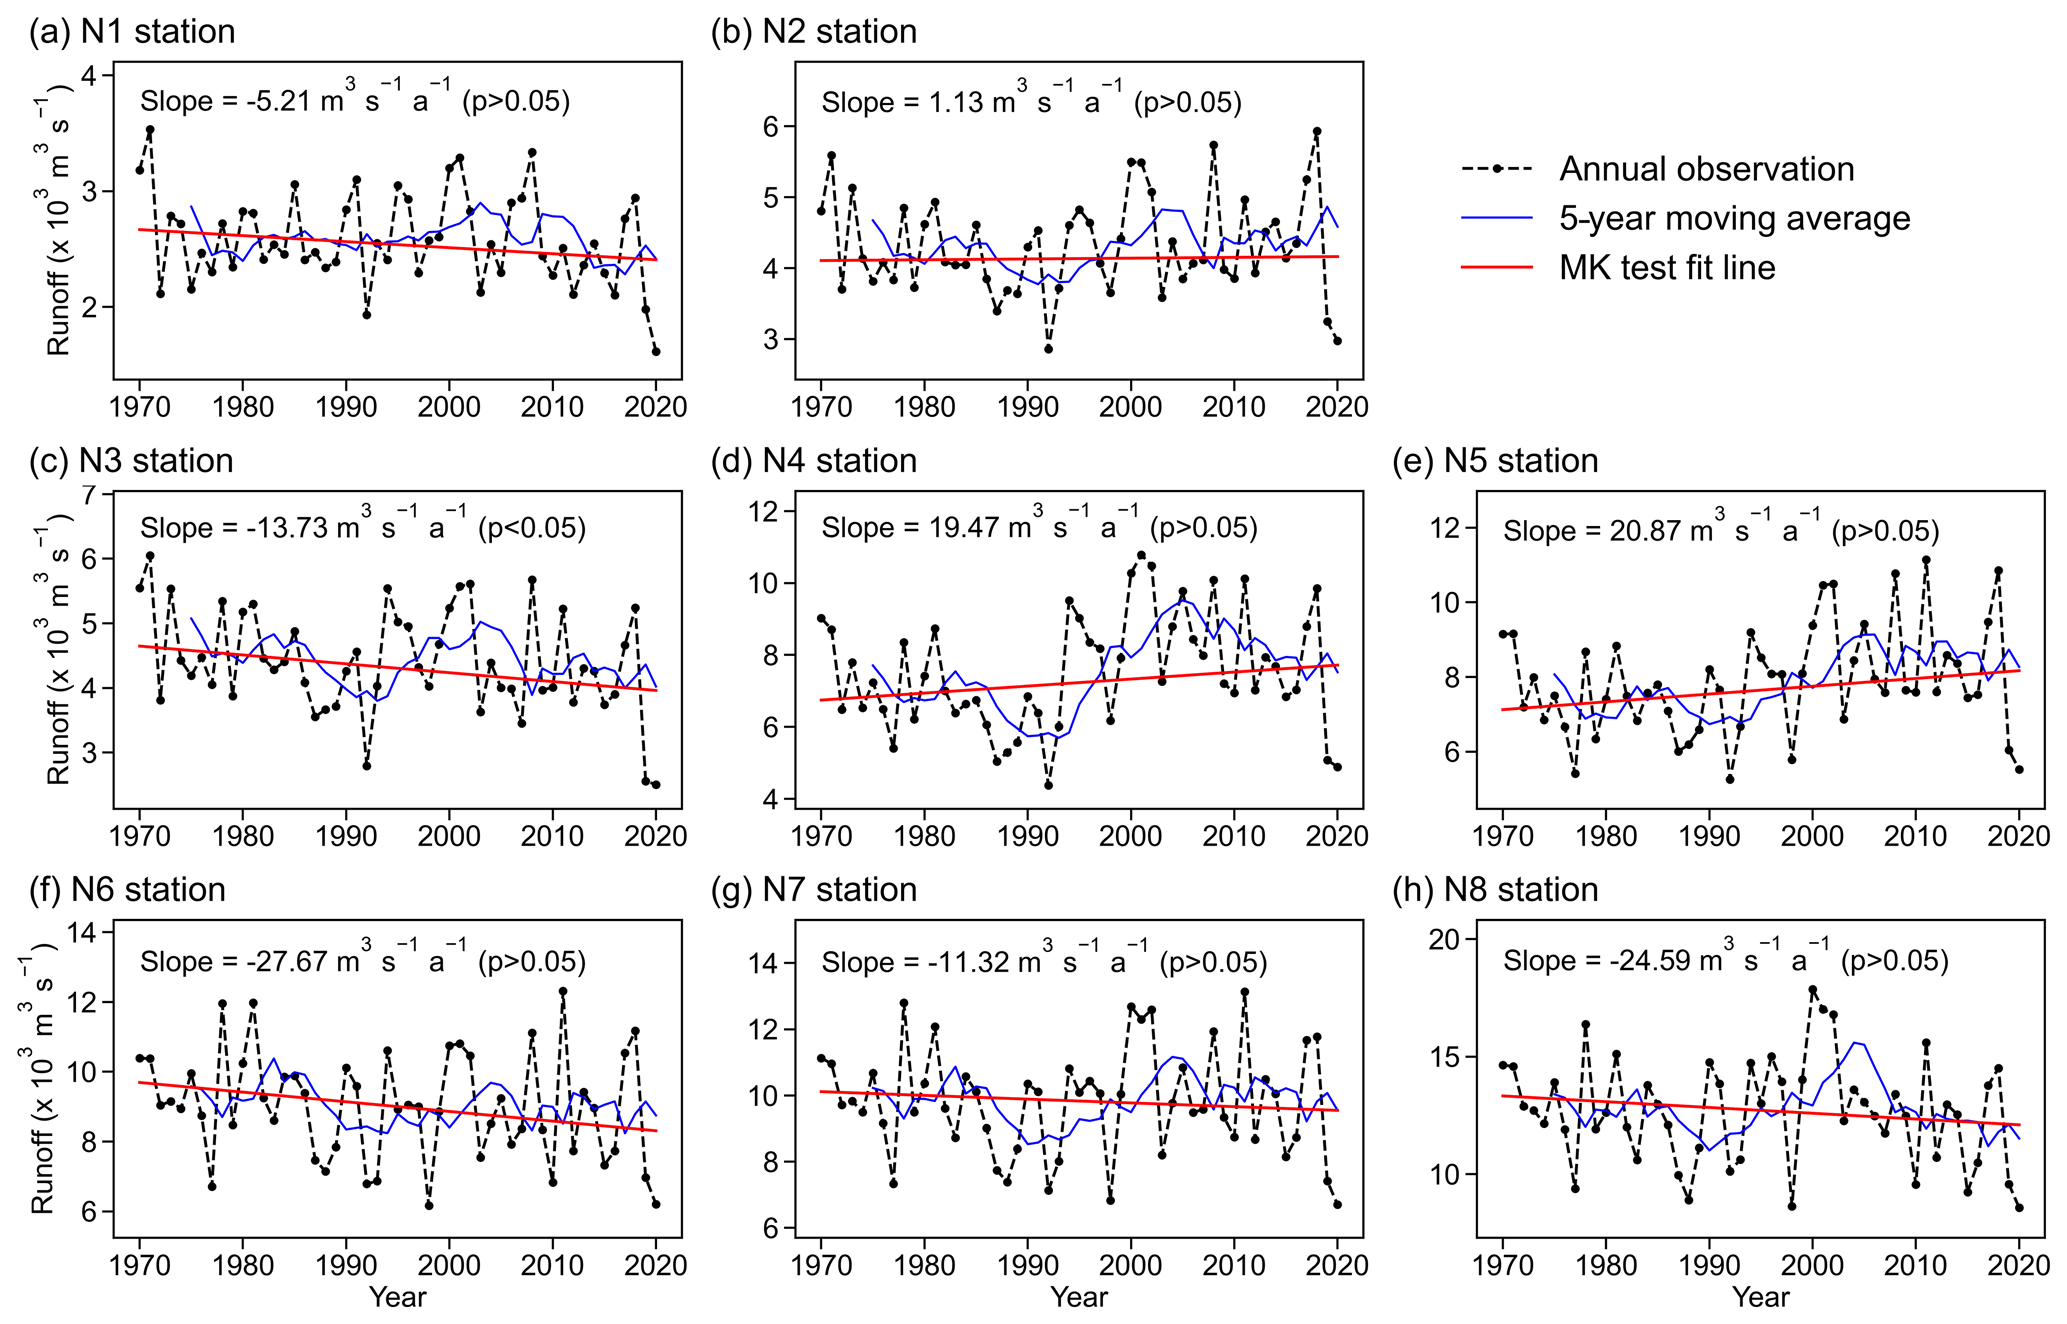
Figure 2 show the annual runoff trend and significance test results of each station from 1971 to 2020. From the interannual variation process and trend line, the upstream stations (N1–N3) and downstream stations (N6–N8) have a decreasing trend, while the midstream stations (N4–N5) have an increasing trend. However, these changes are not significant (p>0.05) in the long-term trend, except for N3, which is a result consistent with the findings by Li et al. (2017). Based on the 5-year moving average, the runoff from the middle and lower reaches has a steep decline and then a slow rise in the 1990s, which is closely related to the construction of dams and reservoirs during this period (Lu and Siew, 2006). Some studies have shown that in the early stage of the construction of a reservoir, the impoundment of the reservoir will have an impact on the annual runoff (Lu et al., 2014). However, during the operation scheduling period after the completion of the reservoir impoundment, its impact on the annual runoff is relatively small, although the impact on the annual distribution of runoff is relatively large (Lu et al., 2014).
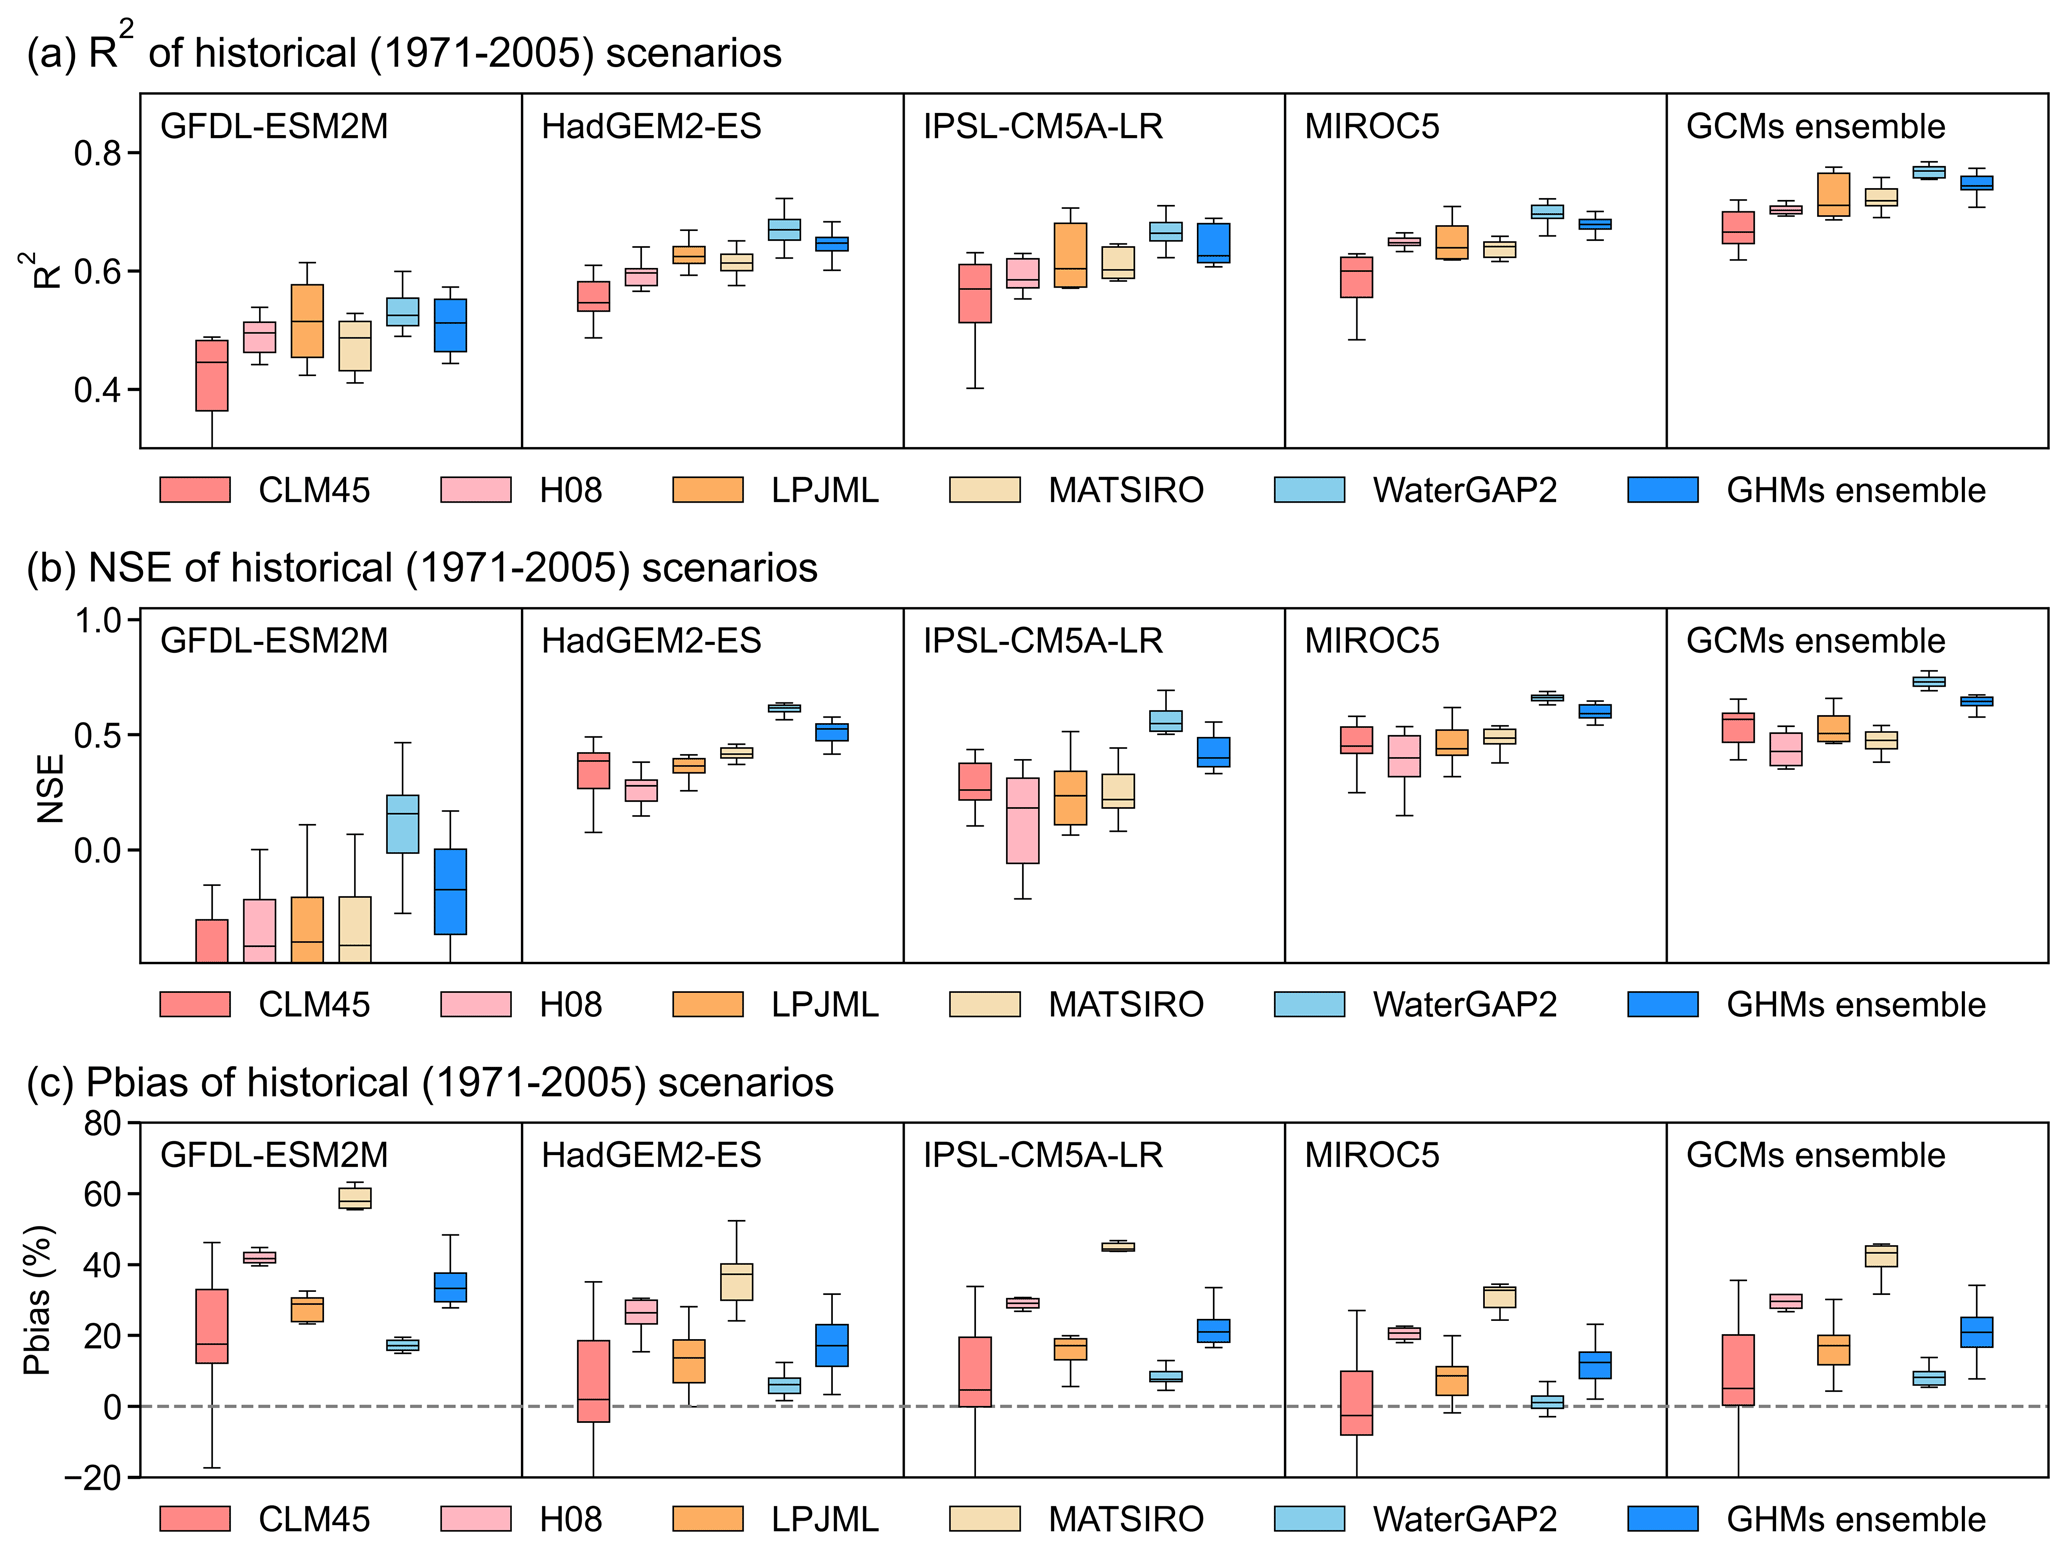
Figure 3Performance of all combinations of GCMs and GHMs during historical (1971–2005) periods. The three rows correspond to three performance matrices (R2, NSE, and Pbias) of all GCM–GHM combinations at the eight hydrological stations. In each row, each panel is for a different GCM, as annotated. Then in each panel, the different colours are for each GHM, as marked under each row.
3.2 Verifying ISIMIP historical and future projections
3.2.1 Historical scenario (1971–2005) simulation performance
During the validation of the historical scenarios of ISIMIP, the simulated runoff under different GCM–GHM combinations with the measured discharges at the hydrological stations are compared, and it is found that most of the combinations performed well (Fig. 3). This indicates that even if GHMs instead of regional hydrological models are chosen, GHMs still have satisfactory performance in runoff simulations. As far as the differences among GCMs are concerned, except for GFDL-ESM2M, the simulation results of GHMs driven by all other climate models are generally good. Krysanova et al. (2018) suggest using ensemble-averaged results from multiple GCMs to reduce climate model uncertainty. The results here show that GCM ensemble-averaged simulations have an overall higher accuracy than that of individual GHMs results, and the model confidence also increases. In addition, all of the GHMs show R2 of at least 0.6 under GCMs that are ensemble-averaged, demonstrating a model performance that is reasonably good. Among these GHMs, WaterGAP2 has the highest R2 and NSE and a lower Pbias than others under the same GCM forcing. This is in line with the findings of Chen et al. (2021), who point out that the WaterGAP2 model is more suitable for the runoff simulation in the MRB than other models. In particular, the combination of GCM ensemble averaging and WaterGAP2 performs the best for runoff simulations. The evaluation indicators are R2 = 0.78 (0.72–0.82), NSE = 0.68 (0.63–0.81), and Pbias = 5.5 % (4.2 %–10 %). Generally speaking, a distributed regional hydrological model specially developed for a region will be more suitable for the simulation and evaluation of water resources in the region. However, the simulated performance under this combination is comparable to the evaluation index reported by Wang et al. (2021), which uses the distributed hydrological model (SWAT). Good temporal dynamic capture (average R2 of 0.78; average NSE of 0.68) and extremely low total runoff volume bias (average Pbias of 5.5 %) indicate that the combination of the GCM ensemble average and WaterGAP2 is likely to produce the most reliable runoff simulations for this region.
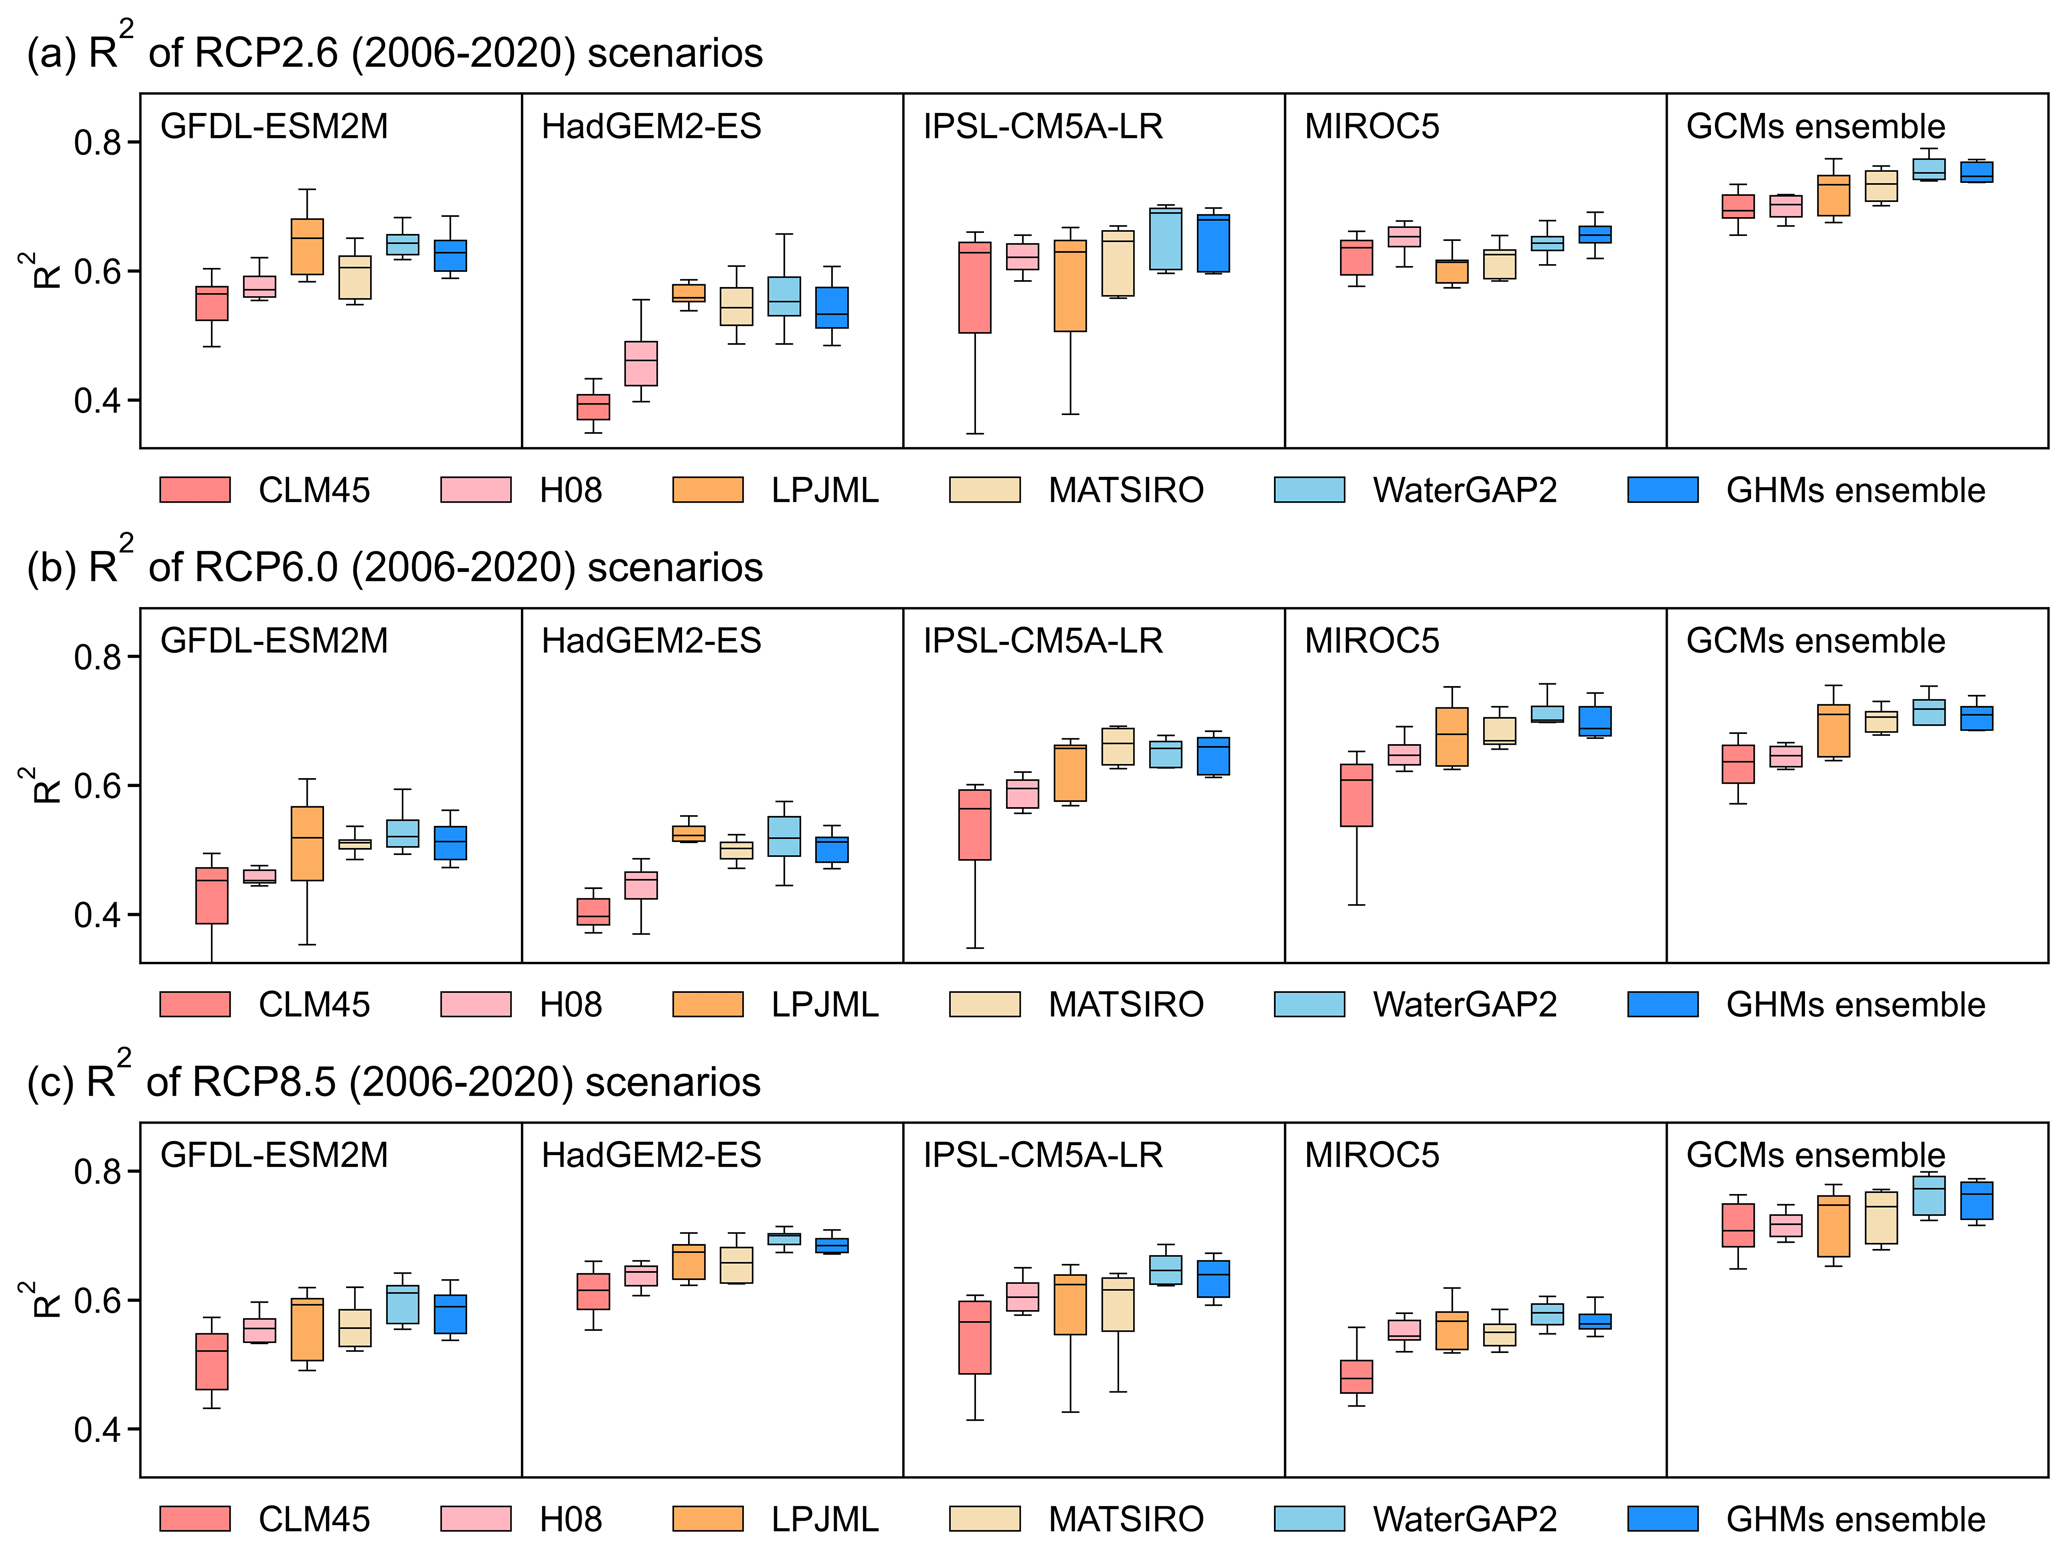
Figure 4The R2 performance matric of ISIMIP historical (2006–2020) modelling under different RCP scenarios. The three rows correspond to three RCP scenarios (RCP2.6, RCP6.0, and RCP8.5) of all GCM–GHM combinations at the eight hydrological stations. In each row, each panel is for a different GCM, as annotated. Then in each panel, the different colours are for each GHM, as marked under each row.
3.2.2 Different RCP (2006–2020) simulation performance
ISIMIP2b projections are published before 2006, so its future projections include the period 2006–2020, a period that now has real-time or world observations to test against the projections. The simulation performance of these GCM–GHM combinations during this time is thus further evaluated. Similar to the historical scenario verification process, the results under RCPs scenarios with different GCM–GHM combinations are verified and compared (Fig. 4). The results of this work show that under three mission pathways (RCP2.6, RCP6.0, and RCP8.5), the runoff simulation performance of each GCM–GHM combination is consistent with the runoff performance under the historical scenario (1971–2005). The combination of the GCM ensemble and WaterGAP2 again performs the best, with R2 of at least 0.70 under three mission pathways. This model combination can accurately simulate the runoff process in the real-time period under the future scenario, which increases the reliability of the simulation for the further future period.
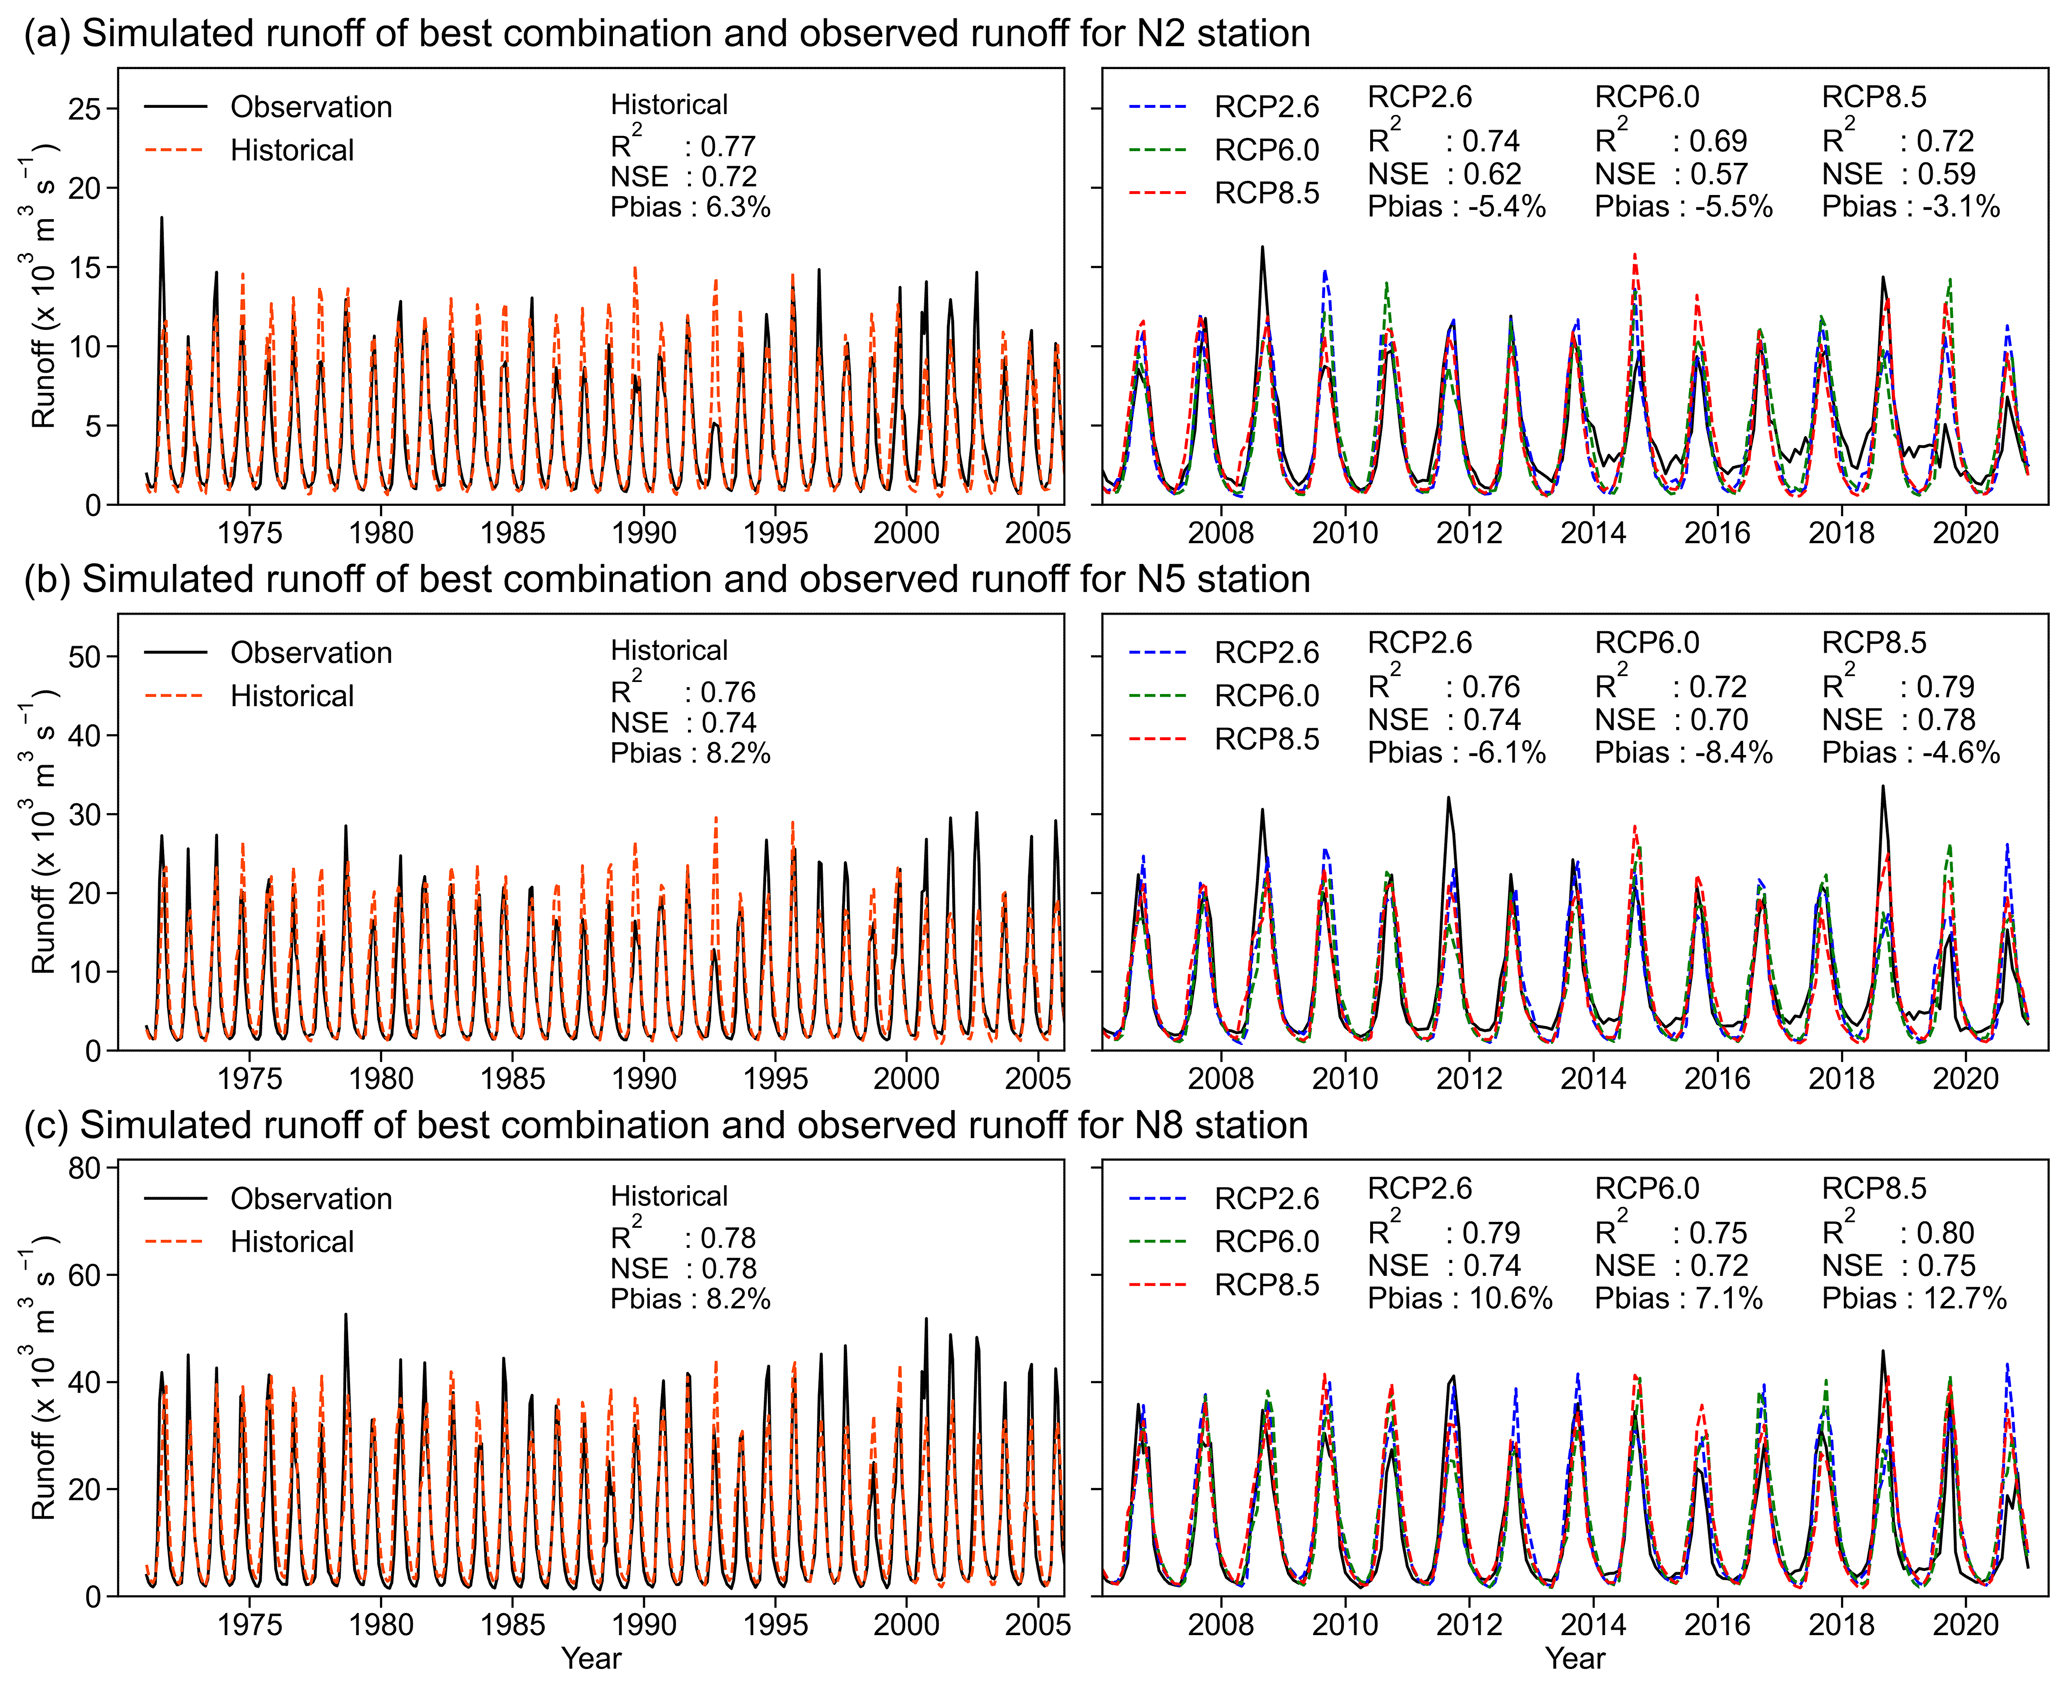
Figure 5Observed and simulated monthly runoff for historical validation time periods (1971–2020) under the best combination (GCM ensemble average and WaterGAP2). The three rows correspond to three hydrological stations (N2, N5, and N8). In each panel, the solid black line is observed runoff, and the dashed coloured lines (orange, blue, green, and red) are simulated runoff under different scenarios (historical, RCP2.6, RCP6.0, and RCP8.5).
Through validation using historical data and comparing to future scenarios, it is seen that WaterGAP2 performs the best, suggesting that the model would be the best suited for the MRB runoff simulations. At the same time, the results show that the ensemble-averaged results of GCMs can reduce the uncertainty of future climate projections. Another comparison made is to take the historical observed runoff of a representative station in the upper, middle, and lower reaches of the MRB and use the combination of the ensemble average of the GCMs and the simulated runoff under the WaterGAP2 (Fig. 5). The R2 and Pbias are around 0.75 % and 5 %, respectively, in the historical period and the RCPs real-time period. The above verification metrics indicate that the simulation performance of the combination at the three representative stations is satisfactory. Based on the above verification results, the GCM ensemble average and WaterGAP2 combination are used to analyse the future runoff of MRB. It is also determined that the results of a single GCM are also of significance.
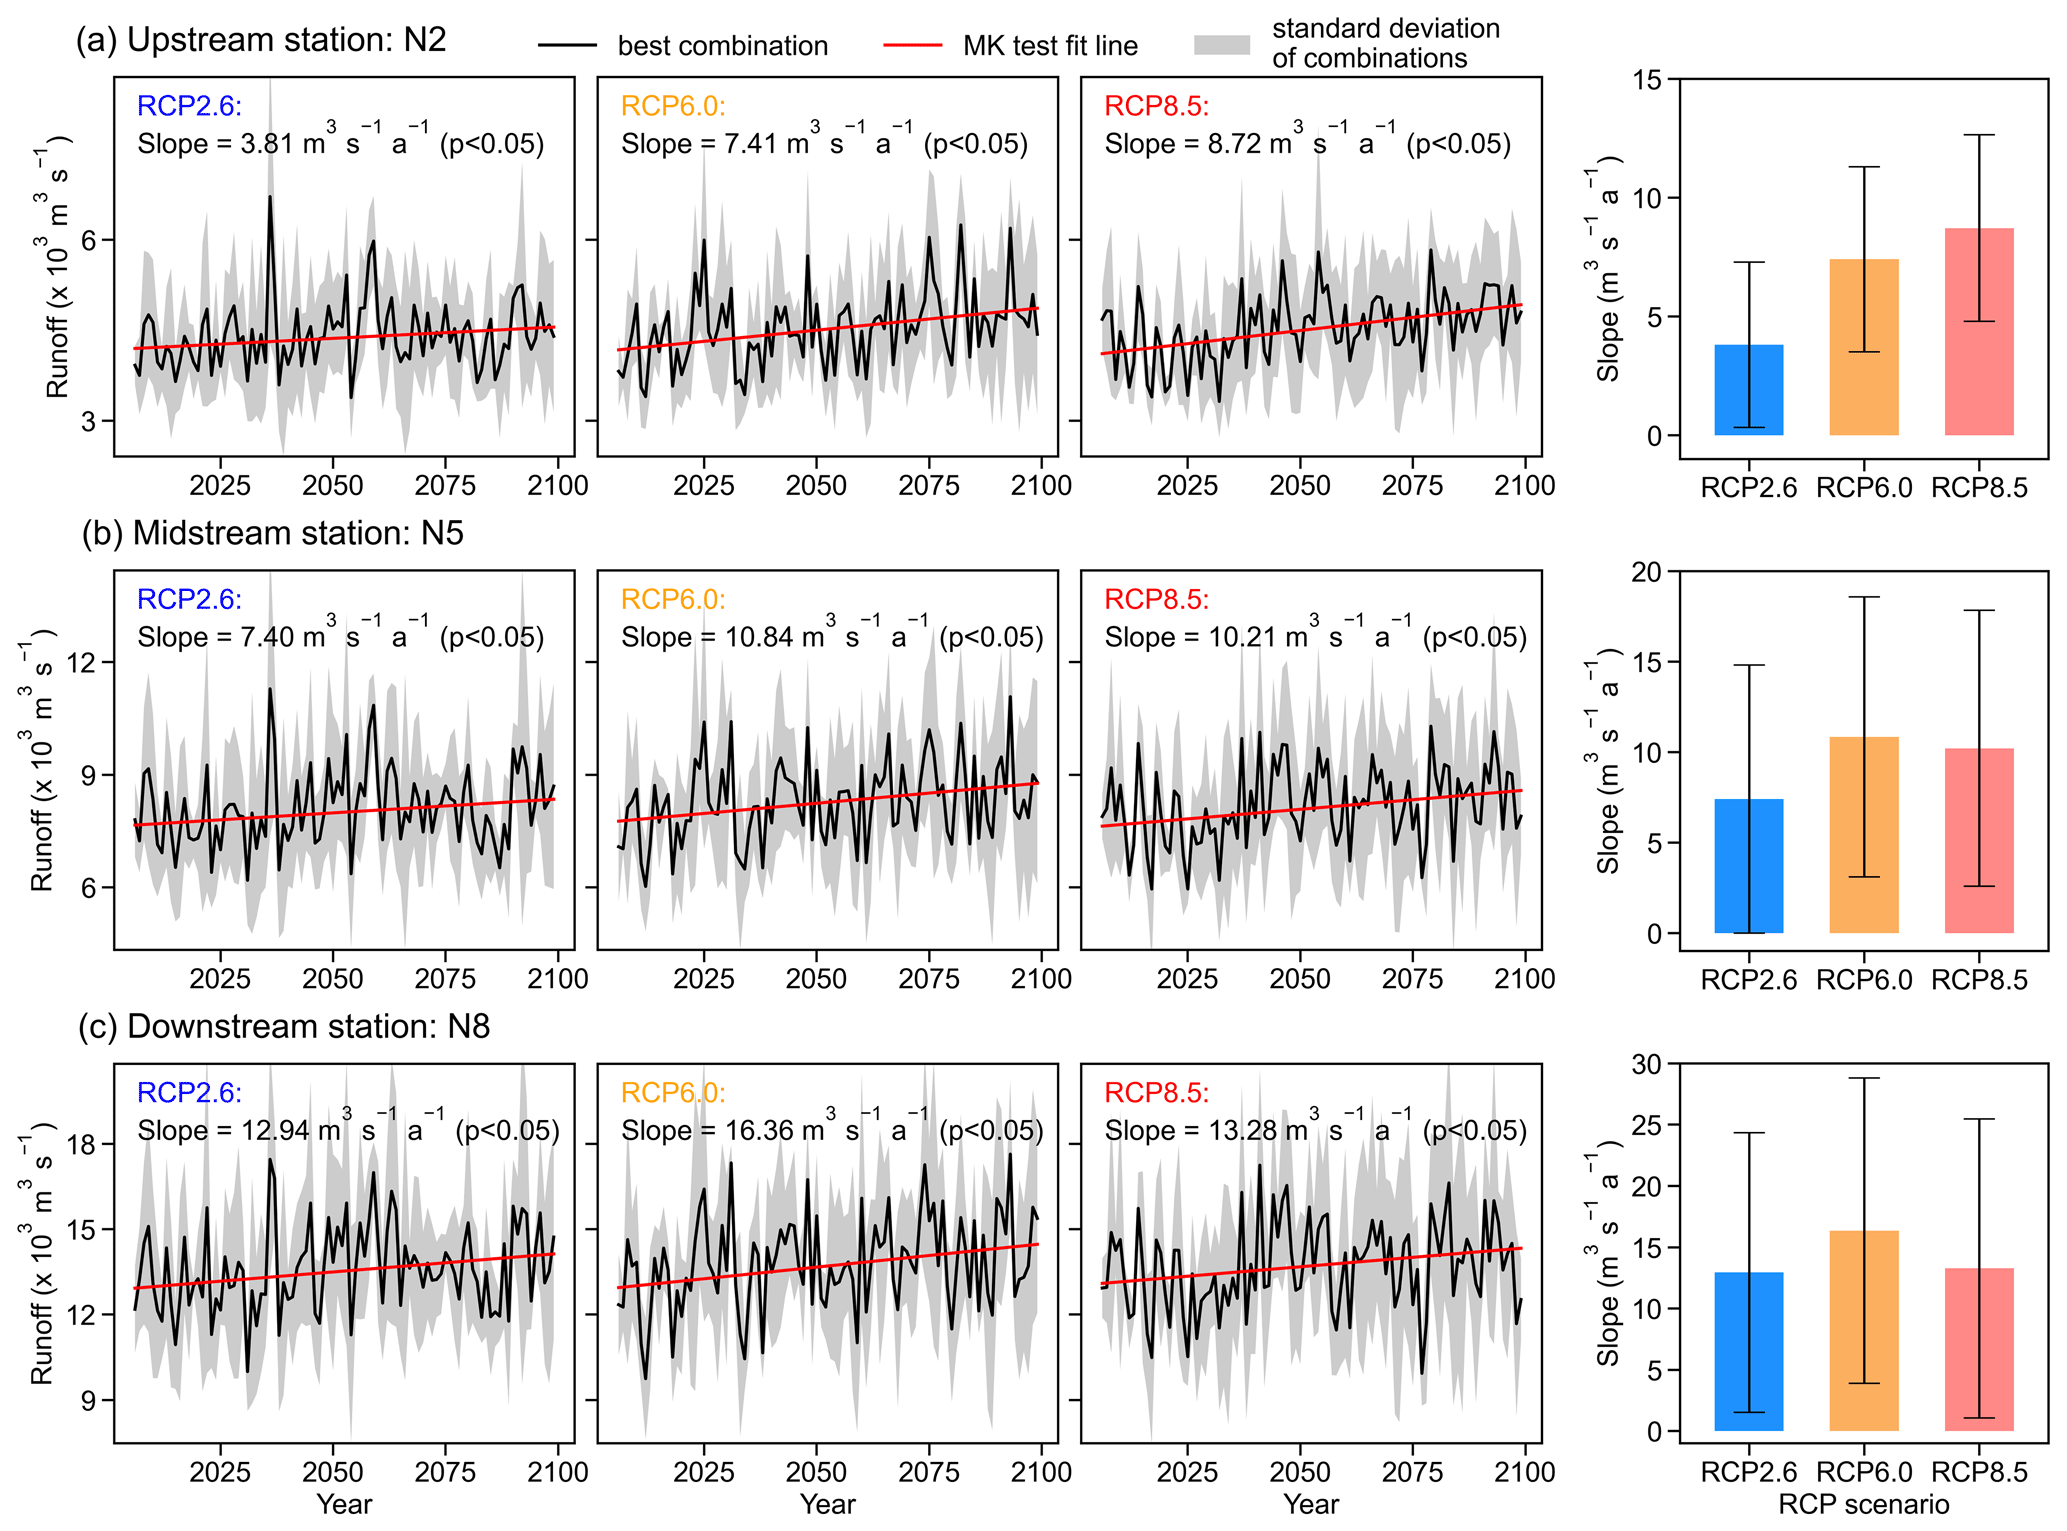
Figure 6ISIMIP projections of annual discharges for 2006–2099 under different RCP scenarios. The three rows correspond to future projections of three hydrological stations (N2, N5, and N8). In each row, three panels on the left are runoff time series for three RCP scenarios (RCP2.6, RCP6.0, and RCP8.5), while one panel on the right summarises the changing rate in annual runoff under the three RCPs. Then, in the right panel, the different coloured bars are for the runoff changing rate under each RCP, and the error bars are the uncertainty range.
3.3 ISIMIP future projections
3.3.1 Annual runoff change
MK significance tests are performed on future annual runoff changing at representative stations of the MRB (upstream is N2, midstream is N5, and downstream is N8). First, the overall result (Fig. 6) is that under different RCP scenarios, the runoff in each station increases significantly (p<0.05) in the MRB. Second, in terms of spatial distribution, the impact of future climate on the runoff change in the MRB becomes higher when moving from upstream to downstream. Specifically, under a given RCP scenario, the increasing rate of annual runoff at downstream stations is always higher than that at upstream stations. For example, under the RCP2.6 scenario (see the first column in Fig. 6), the annual runoff changing rate of the upstream N2 station, midstream N5 station, and downstream N8 station increased from 3.81 ± 3.47 and 7.40 ± 7.41 to 12.94 ± 11.41 , respectively. There are the same results under RCP6.0 and RCP8.5 scenarios. This shows that under the future scenarios, the downstream runoff will be more affected, resulting in a higher interannual variability.
As the RCPs change (for example, from RCP2.6 and RCP6.0 to RCP8.5), not all stations have an increasing annual runoff increment with the scenario change. In other words, the annual runoff increasing rate under RCP8.5 is not necessarily greater than those under RCP2.6 and RCP6.0. The upstream station (N2) has the lowest runoff increasing rate (3.81 ± 3.47 ) under the RCP2.6 scenario and the highest runoff increasing rate (8.72 ± 3.93 ) under the RCP8.5 scenario. At this station, precipitation and glacier snowmelt dominate the increase in runoff. The increases in the precipitation and glacier snowmelt under the RCP8.5 scenario is higher than those of RCP2.6 and RCP6.0 scenarios, which lead to the highest increasing rate of runoff at this station under the RCP8.5 scenario. Different from the above N2 station results, the midstream station (N5) has the lowest runoff increasing rate (7.40 ± 7.41 ) under the RCP2.6 scenario, while the runoff increasing rate (10.84 ± 7.73 ) in the RCP6.0 scenario is larger than that (10.21 ± 7.62 ) in the RCP8.5 scenario, although the precipitation increases in the RCP8.5 scenario is the highest. A possible explanation for this is that within the catchment range of these two stations, the effects of upstream glacial snowmelt and increased precipitation are attenuated by the increase in evapotranspiration caused by warming, so that the increase in runoff is also reduced at the N5 station. Guan et al. (2021) reported similar results in a typical watershed in southern China. Their study points out that the rising air temperature tends to evaporate more water and offset the effect of precipitation increase to some extent, which is more pronounced at lower latitudes. The MR is a north–south river, and the latitude of the midstream N5 station is lower than that of the upstream N2 station. Therefore, the midstream N5 station has the highest runoff increasing rate under the RCP6.0 scenario. Consistent with the above N5 station results, there is the highest increasing rate (16.36 ± 12.44 ) of the downstream station (N8) under RCP6.0. Only 16 % of the total runoff in the Lower Mekong comes from China Li et al. (2017); Ruiz-Barradas and Nigam (2018). This shows that the glacial snowmelt brought by warming has a limited impact on the downstream, and evapotranspiration and precipitation are the main factors affecting the downstream runoff. At the same time, at lower latitudes than the N5 station, the rising air temperature tends to increase evapotranspiration and offsets the effect of precipitation increases to a higher extent (Guan et al., 2021).
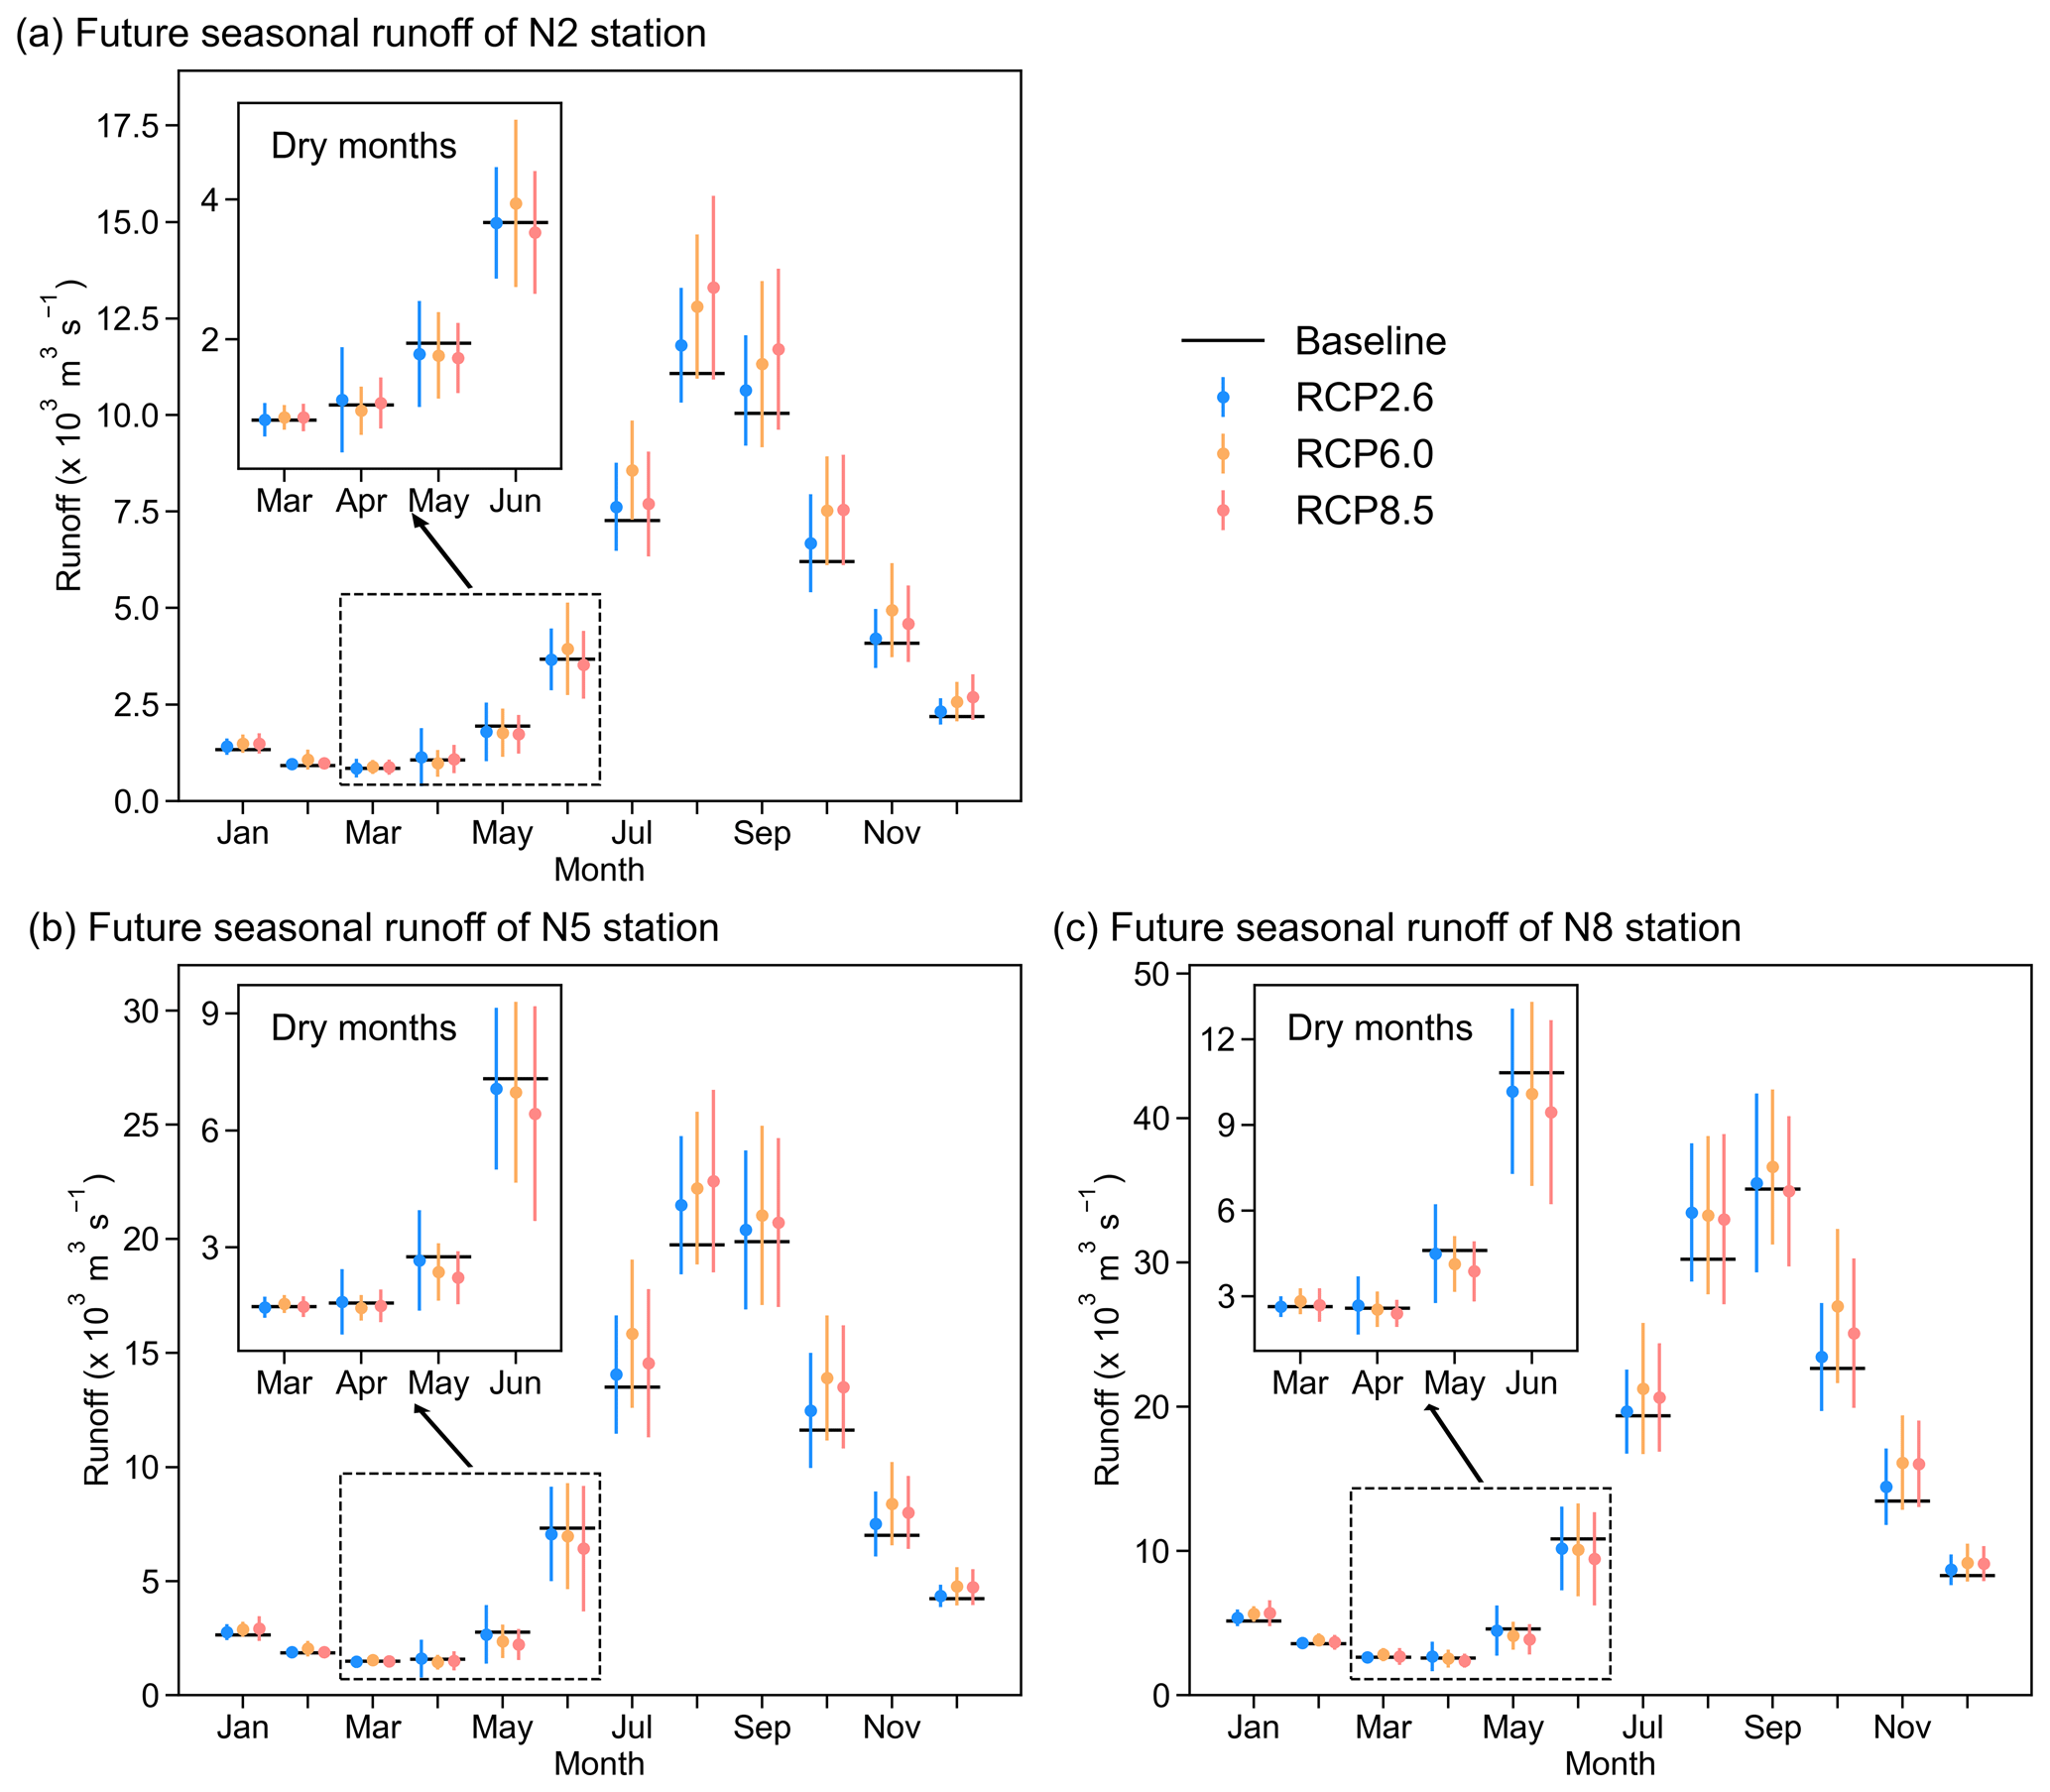
Figure 7Seasonal runoff changes under different RCPs scenarios at representative hydrological stations. The three panels correspond to future projections of three hydrological stations (N2, N5, and N8). In each panel, the horizontal black line is the baseline seasonal runoff, and the three coloured (blue, yellow, and red) dots and vertical lines are the projected seasonal runoff and its uncertainty range under the three RCPs (RCP2.6, RCP6.0, and RCP8.5).
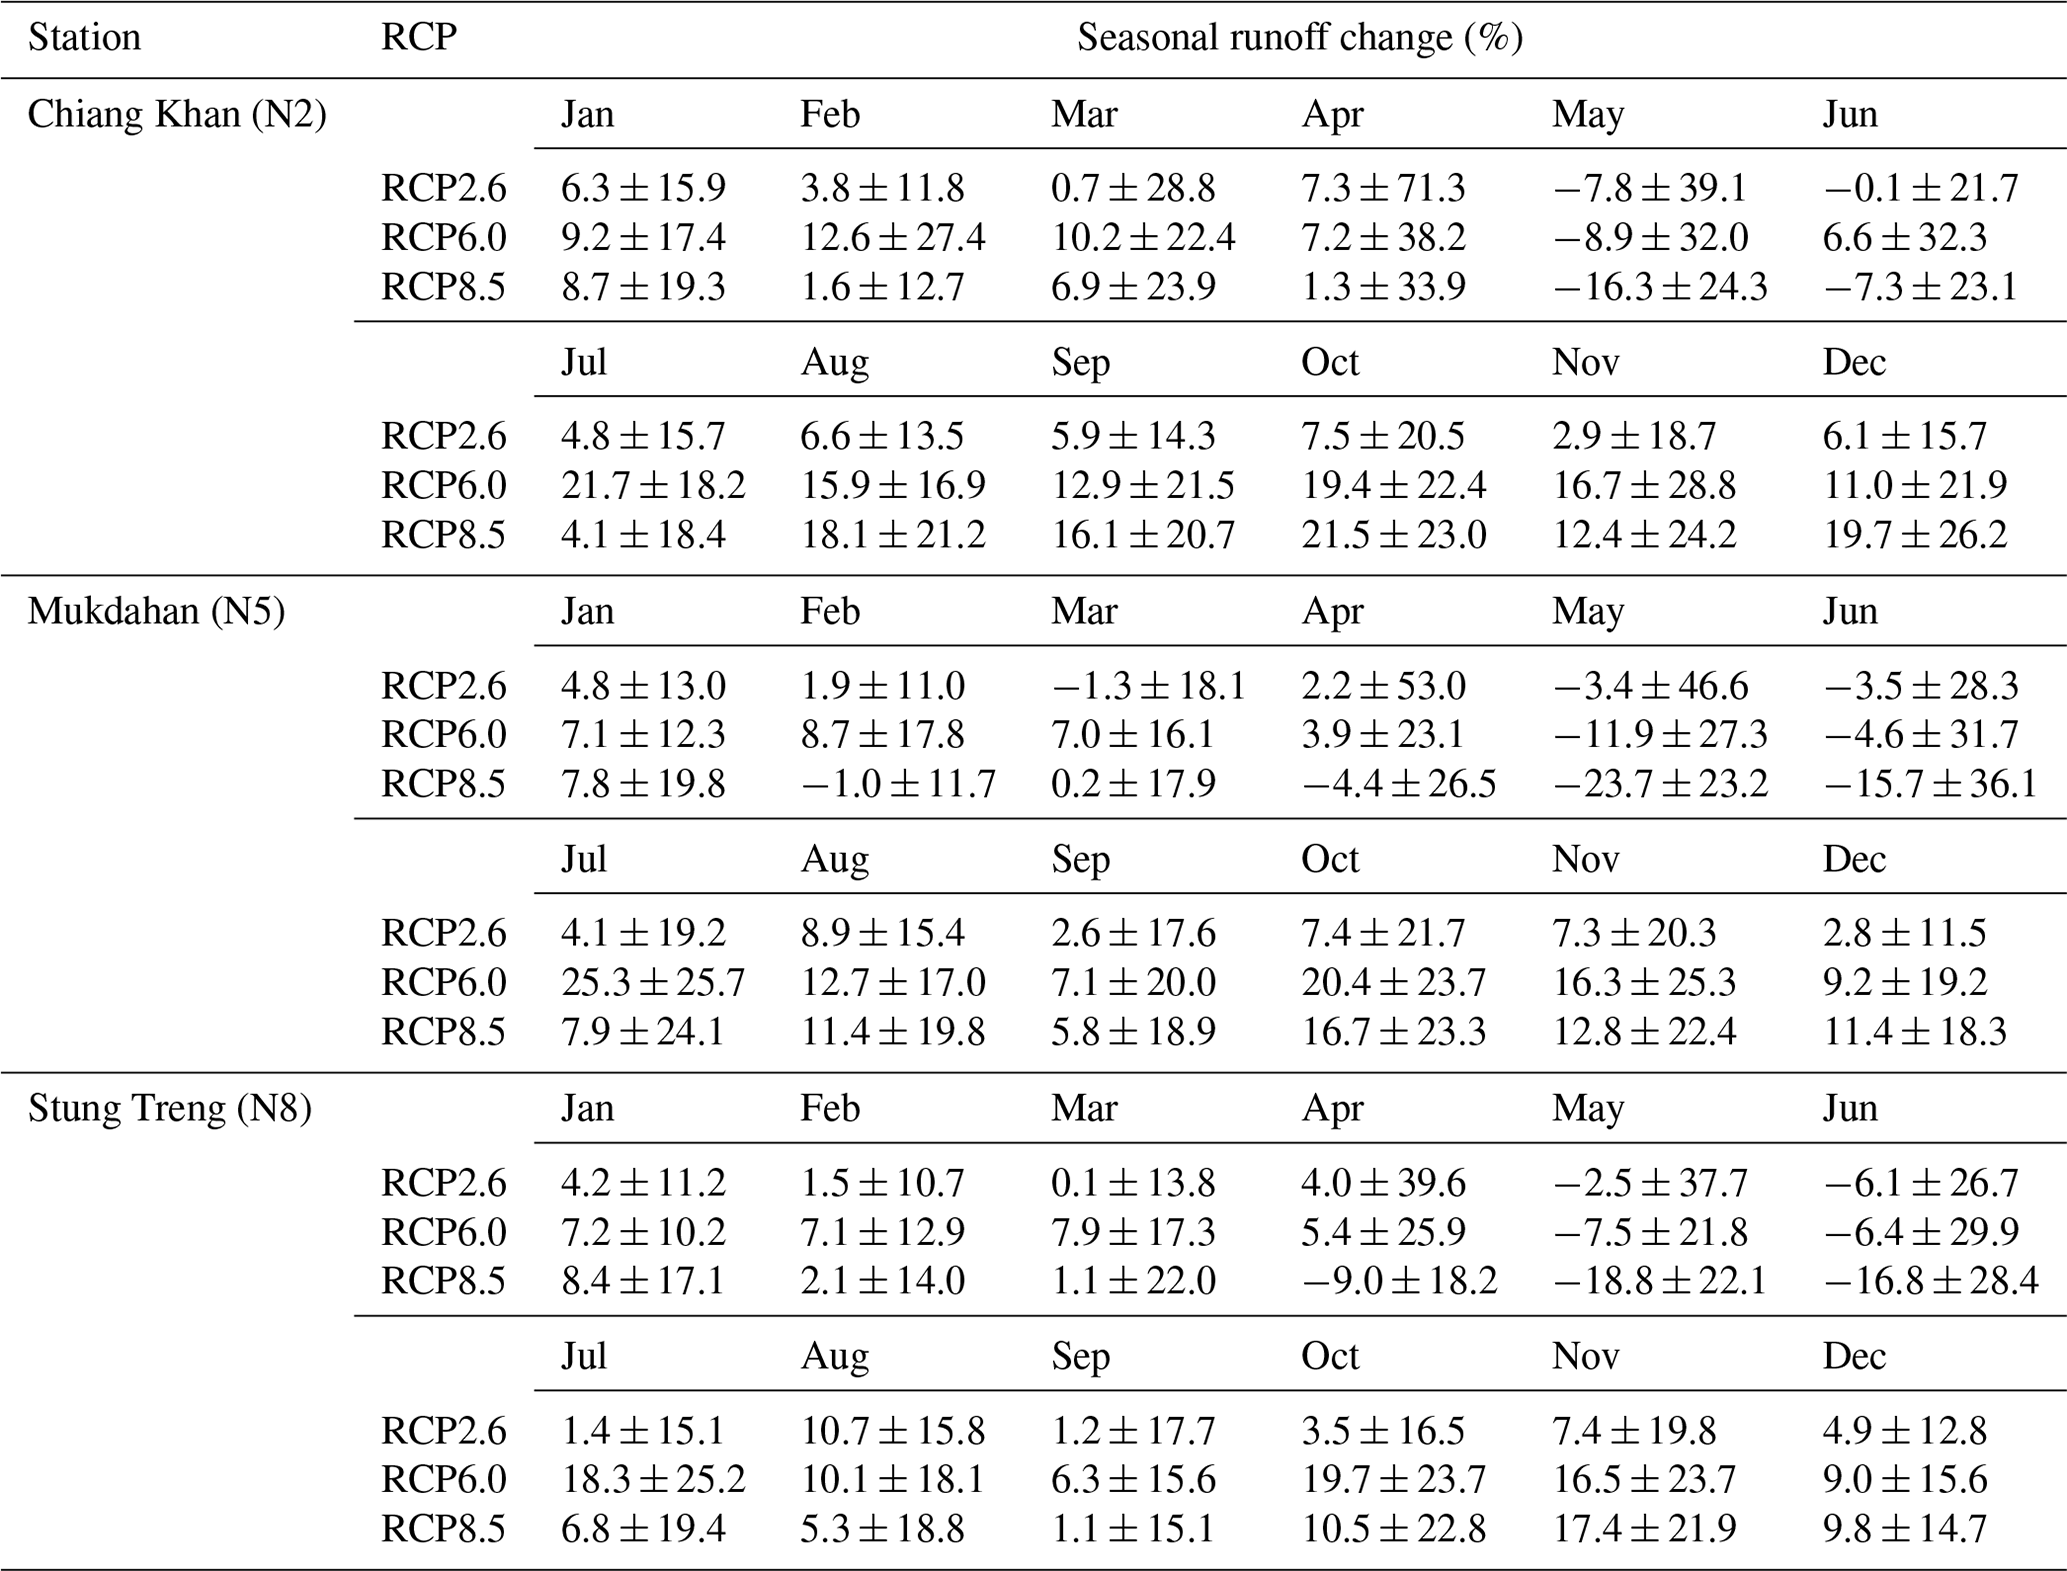
Table 3Percentage of runoff change in different months under different RCP scenarios at representative stations.
3.3.2 Seasonal runoff change
In order to analyse the seasonal runoff changes in MRB in different RCPs, the base period of 1991–2020 and the future period of 2070–2099 are chosen. Figure 7 shows the intra-annual runoff change under different scenarios for representative MRB stations. Table 3 presents the percentage change in the respective runoff. Overall, the GCM scenario ensemble results show that monthly runoff increases at representative stations, except for a decrease in May–June. The study (Hoang et al., 2016) also finds higher monthly runoff at all MRB stations, except for a slight reduction in June. In terms of time distribution within a year, the annual runoff distribution within MRB will be more uneven in the future. Specifically, the runoff increase in the representative stations is concentrated in the rainy-season months, while the runoff even decreases in specific dry-season months (such as May). The above results indicate that the wet months will get wetter and the dry months will get drier within MRB under the three RCP scenarios. Furthermore, this phenomenon is more prominent in the RCP8.5 scenario. For example, under this scenario, the runoff of the midstream station will reduce by 23.7 ± 23.2 % in May and increase by 16.7 ± 23.3 % in October. In terms of the spatial distribution, the runoff changes under different RCP scenarios are particularly complex and different. For example, in October of the rainy season, the upstream station has the highest runoff increase (+21.5 ± 23.0 %) under RCP8.5, while the midstream station and the downstream station have the highest runoff increase (N5 has +20.4 ± 23.7 %; N8 has +19.7 ± 23.7 %) under RCP6.0. On the other hand, in the dry season of May, the three representative stations all have the most prominent runoff declines (N2 has −16.5 ± 24.3 %; N5 has −23.7 ± 23.2 %; N8 has −18.8 ± 22.1 %) under RCP8.5. The reasons for the different increases under different RCP scenarios are related to the latitude of the stations. The detailed reasons for the above results are seen in Sect. 3.3.1.
This study systematically analyses the performance and uncertainty in the runoff simulations from five GHMs driven by four GCMs within the MRB during historical periods. An interesting finding is that the variability introduced by the GCMs was similar to or even greater than that introduced by the GHMs on the runoff simulation (Figs. 3 and 4). For example, in Fig. 3a, the median R2 of different GHMs under the same GCM driver can differ by 0.20, but the median R2 of the same GHM under different GCMs drivers can differ by more than 0.20. To reduce the variability in the runoff simulation, on the one hand, we can obtain a well-performing GHM through comprehensive evaluation. In this study, three performance indicators were combined under eight hydrological stations, and WaterGAP2 (i.e. GHM) was found to have the best performance (highest R2 and NSE and lowest Pbias) under four GCM drivers in the MRB. In addition, even a good GHM has high uncertainty for future runoff projection under different GCM drivers. A feasible approach at this time should be to combine the ensemble average of runoff results from the GHM driven by different GCMs, which can help reduce the uncertainty from climate models in future projections. At the same time, the standard deviation of runoff results from the GHM driven by different GCMs can be used to quantify the uncertainty in future runoff projections. This approach gives equal weight to each GCM, often referred to as “model democracy”, and has been widely used in climate impact assessments (Taylor et al., 2012; Collins et al., 2013). Another approach that can potentially reduce uncertainty is a weighting scheme that considers the performance of the GCMs (Knutti et al., 2017; Yang et al., 2017). The GCMs are weighted by different statistics in the past or present, and the weighting coefficients are applied to the future projections of the GCMs. However, there is a risk that a GCM that performs poorly in the current climate may perform better when environmental conditions are beyond the contemporary range of change (Yang et al., 2017). It is worth mentioning that a novel and promising approach to constrain uncertainties is the emergent constraints (ECs). The EC approach consists of statistical (emergent) relationships between an observable quantity (X) in the past or present climate and a quantity (Y) related to the future climate across GCMs (Brient, 2020; Hall et al., 2019; Schlund et al., 2020). Combining emergent relationships with observations can potentially reduce uncertainty in future projections, and several published ECs have shown us positive effects (Schlund et al., 2020; Shiogama et al., 2022). We encourage further experimentation with various approaches, including those described above, to overcome the uncertainty among GCMs in the MRB.
Another point is that under different RCPs, the interannual runoff of the three representative sites has a significant (p<0.05) increasing trend, which is consistent with the previous relevant studies suggesting that MRB runoff would increase in the future due to climate change (Hoang et al., 2019; Liu et al., 2022). A novel finding is that the upstream, midstream, and downstream stations in the MRB show different patterns of runoff change under three RCP scenarios. The increase in runoff at the upstream station N2 increased sequentially as the scenarios changed from RCP2.6 and RCP6.0 to RCP8.5. The difference is that the downstream station N8 has the highest runoff increase under the RCP6.0 scenario, while this is not the case under the RCP8.5 scenario. This behaviour is closely related to the combined effects of temperature and precipitation on runoff under different RCP scenarios. Specifically, at upstream stations, the synergistic effect of increased glacial meltwater and increased precipitation caused by warming under different scenarios is greater than the effect of increased evapotranspiration caused by warming. This results in the highest runoff increase under RCP8.5. At downstream stations, the proportion of glacier meltwater to total water volume decreased, suggesting that its impact on total runoff was also lower. In addition, the increase in evapotranspiration due to warming increases with decreasing downstream latitude. Under the combined effect of these factors, the runoff increases under the RCP6.0 scenario (16.36 ± 12.44 ) and is higher than that under the RCP8.5 scenario (13.28 ± 12.20 ). This means that the risk of future flooding in the middle and lower reaches of the MRB is still likely to remain a high level, even if we try to manage to stay on a moderate emissions path (i.e. RCP6.0). The novel change patterns of the upper, middle, and lower reaches explored in the study may be able to provide a scientific basis for the future implementation of local water resource management schemes in each reach of the MRB.
Furthermore, in the far future period (2070–2099), the distribution of seasonal runoff within the MRB is more complex. Despite the apparent increase in interannual runoff, water stress in the dry season would not decrease or become more severe. Under all RCP scenarios, runoff will decrease in future dry-season months (e.g. May). Even under the RCP8.5 scenario, the percentage of runoff reduction at representative sites in May was above 15 %, reaching a maximum of 24 %. This can exacerbate water shortages during the dry season and will have particular impact on Cambodia, which, as noted above, relies on the Mekong to fill the Tonlé Sap, and on the Mekong Delta in Vietnam. The increase in interannual runoff is mainly reflected in the rainy months. For example, under the RCP6.0 scenario, the midstream representative station (N5) will have a runoff increase of 25 % in July. This behaviour will increase flood events in the basin, affecting human safety, normal livelihood, and economic activities. Although studies (Yun et al., 2021; Lauri et al., 2012; Wang et al., 2017) have shown that rational reservoir operation can mitigate hydrological extremes in the basin, the management of such transboundary rivers requires closer cooperation among all the countries in the MRB. It is worth mentioning that our current study focuses on the impacts of future climate change on runoff in the MRB without quantifying dam- and/or reservoir-induced changes in runoff, due to the limited availability of dam and/or reservoir data. In future work, we expect to be able to quantitatively analyse the impacts of human activities and climate change on runoff by acquiring or collecting dam and/or reservoir data to explore the potential of reservoir operations to mitigate the extreme hydrological events under complex future runoff change scenarios (e.g. droughts and floods).
From the 1970s to the present, there has been no significant (p>0.05) change in the runoff of the MRB. In the early operation stages of the reservoirs built in the 1990s, the annual runoff decreased obviously. However, the impact of the reservoir on the annual runoff after the completion of water storage is small. The ensemble-averaged results of GCMs can reduce the uncertainty in the runoff simulations by different climate models. Moreover, WaterGAP2 performs the best runoff simulation at each station, with the average R2, NSE, and Pbias of the stations being 0.78 %, 0.68 %, and 5.5 %, respectively. Based on these evaluation results, the WaterGAP2 runoff simulation has been used in the MRB to analyse runoff changes under future scenarios.
Under the RCP scenarios, the future interannual runoff of the MRB increases significantly (p<0.05). Notably, the upper and lower reaches of the MRB show different patterns of runoff change under three RCP scenarios, which are associated with the combined effects of temperature and precipitation on runoff for each reach. Under the RCP6.0 scenario, the MRB has the highest increase in interannual runoff. Seasonal changes in annual runoff in the MRB under a future climate are more complex. Under the RCP2.6 and RCP6.0 scenarios, the runoff of the MR during the rainy season will increase, and the increase in the RCP6.0 scenario is higher than that in the RCP2.6 scenario. The changes in runoff in the dry season are relatively stable under the two scenarios. However, the seasonal runoff changes in the MRB under the RCP8.5 scenario are extremely complex. The specific performance of the ensemble average of the GCMs and the WaterGAP2 combination suggests that the dry season will become drier, the rainy season wetter, and the distribution of water resources over the year more uneven. Overall, this study provides novel insights for future runoff projections from a whole river system perspective and may be able to offer a scientific basis for the future implementation of water resource management schemes in the MRB.
The observed runoff data can be obtained by contacting the Mekong River Commission (MRC; https://portal.mrcmekong.org/, last access: 26 October 2021). All model result data used are openly available from the Inter-Sectoral Impact Model Intercomparison Project (ISIMIP; https://data.isimip.org/search/, last access: 13 December 2021). The codes for data processing and result visualisation are available upon request from the corresponding author.
AC conceived and designed the study. AC and CW collected the data, performed the analysis, and drafted the original paper. SL, LL, XS, JM, YZ, and AC made suggestions and revised the paper. All authors contributed to the discussion.
At least one of the (co-)authors is a member of the editorial board of Earth System Dynamics. The peer-review process was guided by an independent editor, and the authors also have no other competing interests to declare.
Publisher's note: Copernicus Publications remains neutral with regard to jurisdictional claims made in the text, published maps, institutional affiliations, or any other geographical representation in this paper. While Copernicus Publications makes every effort to include appropriate place names, the final responsibility lies with the authors.
We acknowledge the Mekong River Commission (MRC) for providing the observed runoff data and the Inter-Sectoral Impact Model Intercomparison Project (ISIMIP) for providing the impact model results.
This research has been supported by the National Natural Science Foundation of China (grant nos. 92047302 and 51961125203). Xiaoying Shi and Jiafu Mao have been supported by the Reducing Uncertainties in Biogeochemical Interactions through Synthesis and Computation Scientific Focus Area (RUBISCO SFA) project funded through the Earth and Environmental Systems Sciences Division of the Biological and Environmental Research Office in the U.S. Department of Energy (DOE) Office of Science. Oak Ridge National Laboratory is supported by the Office of Science of the DOE (grant no. DE-AC05-00OR22725). Li Li is supported by the U.S. Department of Energy Environmental System Science Program (grant no. DE-SC0020146).
This paper was edited by Somnath Baidya Roy and reviewed by two anonymous referees.
Adamson, P. T., Rutherfurd, I. D., Peel, M. C., and Conlan, I. A.: The hydrology of the Mekong River, in: The Mekong, edited by: Campbell, I. C., Elsevier, 53–76, https://doi.org/10.1016/B978-0-12-374026-7.00004-8, 2009. a
Alcamo, J., Döll, P., Henrichs, T., Kaspar, F., Lehner, B., Rösch, T., and Siebert, S.: Development and testing of the WaterGAP 2 global model of water use and availability, Hydrolog. Sci. J., 48, 317–337, 2003. a
Arnell, N. W. and Gosling, S. N.: The impacts of climate change on river flood risk at the global scale, Climatic Change, 134, 387–401, 2016. a
Arnell, N. W., van Vuuren, D. P., and Isaac, M.: The implications of climate policy for the impacts of climate change on global water resources, Global Environ. Chang., 21, 592–603, 2011. a
Bihrat, Ö. and Bayazit, M.: The power of statistical tests for trend detection, Turkish Journal of Engineering and Environmental Sciences, 27, 247–251, 2003. a
Brient, F.: Reducing uncertainties in climate projections with emergent constraints: concepts, examples and prospects, Adv. Atmos. Sci., 37, 1–15, 2020. a
Chen, H., Liu, J., Mao, G., Wang, Z., Zeng, Z., Chen, A., Wang, K., and Chen, D.: Intercomparison of ten ISI-MIP models in simulating discharges along the Lancang-Mekong River basin, Sci. Total Environ., 765, 144494, https://doi.org/10.1016/j.scitotenv.2020.144494, 2021. a, b, c, d
Cochrane, T. A., Arias, M. E., and Piman, T.: Historical impact of water infrastructure on water levels of the Mekong River and the Tonle Sap system, Hydrol. Earth Syst. Sci., 18, 4529–4541, https://doi.org/10.5194/hess-18-4529-2014, 2014. a
Collins, M., Knutti, R., Arblaster, J., Dufresne, J.-L., Fichefet, T., Friedlingstein, P., Gao, X., Gutowski, W. J., Johns, T., Krinner, G., Shongwe, M., Tebaldi, C., Weaver, A. J., and Wehner, M.: Climate Change 2013: The Physical Science Basis, IPCC Working Group I Contribution to AR5, Chapter 12 – Long-term climate change: Projections, commitments and irreversibility, IPCC, Cambridge University Press, Cambridge, https://doi.org/10.1017/CBO9781107415324.024, 2013. a
Eyler, B.: Last days of the mighty Mekong, Bloomsbury Publishing, Zed Books Ltd, London, https://doi.org/10.5040/9781350221031, 2019. a, b
Field, C. B. and Barros, V. R.: Climate Change 2014–Impacts, Adaptation and Vulnerability: Global and Sectoral Aspects, Cambridge University Press, Cambridge University Press, Cambridge, https://doi.org/10.1017/CBO9781107415386, 2014. a
Frieler, K., Lange, S., Piontek, F., Reyer, C. P. O., Schewe, J., Warszawski, L., Zhao, F., Chini, L., Denvil, S., Emanuel, K., Geiger, T., Halladay, K., Hurtt, G., Mengel, M., Murakami, D., Ostberg, S., Popp, A., Riva, R., Stevanovic, M., Suzuki, T., Volkholz, J., Burke, E., Ciais, P., Ebi, K., Eddy, T. D., Elliott, J., Galbraith, E., Gosling, S. N., Hattermann, F., Hickler, T., Hinkel, J., Hof, C., Huber, V., Jägermeyr, J., Krysanova, V., Marcé, R., Müller Schmied, H., Mouratiadou, I., Pierson, D., Tittensor, D. P., Vautard, R., van Vliet, M., Biber, M. F., Betts, R. A., Bodirsky, B. L., Deryng, D., Frolking, S., Jones, C. D., Lotze, H. K., Lotze-Campen, H., Sahajpal, R., Thonicke, K., Tian, H., and Yamagata, Y.: Assessing the impacts of 1.5 ∘C global warming – simulation protocol of the Inter-Sectoral Impact Model Intercomparison Project (ISIMIP2b), Geosci. Model Dev., 10, 4321–4345, https://doi.org/10.5194/gmd-10-4321-2017, 2017. a
Giuntoli, I., Vidal, J.-P., Prudhomme, C., and Hannah, D. M.: Future hydrological extremes: the uncertainty from multiple global climate and global hydrological models, Earth Syst. Dynam., 6, 267–285, https://doi.org/10.5194/esd-6-267-2015, 2015. a
Gosling, S. N. and Arnell, N. W.: Simulating current global river runoff with a global hydrological model: model revisions, validation, and sensitivity analysis, Hydrol. Process., 25, 1129–1145, 2011. a
Guan, X., Zhang, J., Bao, Z., Liu, C., Jin, J., and Wang, G.: Past variations and future projection of runoff in typical basins in 10 water zones, China, Sci. Total Environ., 798, 149277, https://doi.org/10.1016/j.scitotenv.2021.149277, 2021. a, b, c
Hagemann, S., Chen, C., Clark, D. B., Folwell, S., Gosling, S. N., Haddeland, I., Hanasaki, N., Heinke, J., Ludwig, F., Voss, F., and Wiltshire, A. J.: Climate change impact on available water resources obtained using multiple global climate and hydrology models, Earth Syst. Dynam., 4, 129–144, https://doi.org/10.5194/esd-4-129-2013, 2013. a
Hall, A., Cox, P., Huntingford, C., and Klein, S.: Progressing emergent constraints on future climate change, Nat. Clim. Change, 9, 269–278, 2019. a
Hamed, K. H.: Improved finite-sample Hurst exponent estimates using rescaled range analysis, Water Resour. Res., 43, https://doi.org/10.1029/2006WR005111, 2007. a
Hanasaki, N., Yoshikawa, S., Pokhrel, Y., and Kanae, S.: A global hydrological simulation to specify the sources of water used by humans, Hydrol. Earth Syst. Sci., 22, 789–817, https://doi.org/10.5194/hess-22-789-2018, 2018. a
Hoang, L. P., Lauri, H., Kummu, M., Koponen, J., van Vliet, M. T. H., Supit, I., Leemans, R., Kabat, P., and Ludwig, F.: Mekong River flow and hydrological extremes under climate change, Hydrol. Earth Syst. Sci., 20, 3027–3041, https://doi.org/10.5194/hess-20-3027-2016, 2016. a, b
Hoang, L. P., van Vliet, M. T., Kummu, M., Lauri, H., Koponen, J., Supit, I., Leemans, R., Kabat, P., and Ludwig, F.: The Mekong's future flows under multiple drivers: How climate change, hydropower developments and irrigation expansions drive hydrological changes, Sci. Total Environ., 649, 601–609, 2019. a
IPCC: Climate Change 2021: The Physical Science Basis. Contribution of Working Group I to the Sixth Assessment Report of the Intergovernmental Panel on Climate Change, vol. in press, Cambridge University Press, Cambridge, United Kingdom and New York, NY, USA, https://doi.org/10.1017/9781009157896, 2021. a, b
Johnston, R. and Kummu, M.: Water resource models in the Mekong Basin: a review, Water Resour. Manag., 26, 429–455, 2012. a
Kingston, D. G., Thompson, J. R., and Kite, G.: Uncertainty in climate change projections of discharge for the Mekong River Basin, Hydrol. Earth Syst. Sci., 15, 1459–1471, https://doi.org/10.5194/hess-15-1459-2011, 2011. a, b
Knutti, R., Sedláček, J., Sanderson, B. M., Lorenz, R., Fischer, E. M., and Eyring, V.: A climate model projection weighting scheme accounting for performance and interdependence, Geophys. Res. Lett., 44, 1909–1918, 2017. a
Krysanova, V., Donnelly, C., Gelfan, A., Gerten, D., Arheimer, B., Hattermann, F., and Kundzewicz, Z. W.: How the performance of hydrological models relates to credibility of projections under climate change, Hydrolog. Sci. J., 63, 696–720, 2018. a, b, c, d, e
Lauri, H., de Moel, H., Ward, P. J., Räsänen, T. A., Keskinen, M., and Kummu, M.: Future changes in Mekong River hydrology: impact of climate change and reservoir operation on discharge, Hydrol. Earth Syst. Sci., 16, 4603–4619, https://doi.org/10.5194/hess-16-4603-2012, 2012. a
Leng, G., Huang, M., Tang, Q., and Leung, L. R.: A modeling study of irrigation effects on global surface water and groundwater resources under a changing climate, J. Adv. Model. Earth Sy., 7, 1285–1304, 2015. a
Li, D., Long, D., Zhao, J., Lu, H., and Hong, Y.: Observed changes in flow regimes in the Mekong River basin, J. Hydrol., 551, 217–232, 2017. a, b, c, d
Baiyinbaoligao, Liu, H., Chen, X., and Mu, X.: Overview of the Mekong River Basin, in: Flood Prevention and Drought Relief in Mekong River Basin, edited by: Liu, H., Springer Singapore, Singapore, 1–25, https://doi.org/10.1007/978-981-15-2006-8_1, 2020. a
Liu, J., Chen, D., Mao, G., Irannezhad, M., and Pokhrel, Y.: Past and future changes in climate and water resources in the lancang–mekong River Basin: Current understanding and future research directions, Engineering, 13, 144–152, 2022. a
Lu, X. X. and Siew, R. Y.: Water discharge and sediment flux changes over the past decades in the Lower Mekong River: possible impacts of the Chinese dams, Hydrol. Earth Syst. Sci., 10, 181–195, https://doi.org/10.5194/hess-10-181-2006, 2006. a
Lu, X. X., Li, S., Kummu, M., Padawangi, R., and Wang, J.: Observed changes in the water flow at Chiang Saen in the lower Mekong: Impacts of Chinese dams?, Quatern. Int., 336, 145–157, 2014. a, b
Lv, X., Zuo, Z., Ni, Y., Sun, J., and Wang, H.: The effects of climate and catchment characteristic change on streamflow in a typical tributary of the Yellow River, Sci. Rep.-UK, 9, 14535, https://doi.org/10.1038/s41598-019-51115-x, 2019. a
Milly, P. C., Dunne, K. A., and Vecchia, A. V.: Global pattern of trends in streamflow and water availability in a changing climate, Nature, 438, 347–350, 2005. a
Müller Schmied, H., Adam, L., Eisner, S., Fink, G., Flörke, M., Kim, H., Oki, T., Portmann, F. T., Reinecke, R., Riedel, C., Song, Q., Zhang, J., and Döll, P.: Variations of global and continental water balance components as impacted by climate forcing uncertainty and human water use, Hydrol. Earth Syst. Sci., 20, 2877–2898, https://doi.org/10.5194/hess-20-2877-2016, 2016. a
Prudhomme, C., Giuntoli, I., Robinson, E. L., Clark, D. B., Arnell, N. W., Dankers, R., Fekete, B. M., Franssen, W., Gerten, D., Gosling, S. N., Hagemann, S., Hannah, D. M., Kim, H., Masaki, Y., Satoh, Y., Stacke, T., Wada, Y., and Wisser, D.: Hydrological droughts in the 21st century, hotspots and uncertainties from a global multimodel ensemble experiment, P. Natl. Acad. Sci. USA, 111, 3262–3267, 2014. a
Ruiz-Barradas, A. and Nigam, S.: Hydroclimate variability and change over the Mekong River basin: Modeling and predictability and policy implications, J. Hydrometeorol., 19, 849–869, 2018. a
Schewe, J., Heinke, J., Gerten, D., Haddeland, I., Arnell, N. W., Clark, D. B., Dankers, R., Eisner, S., Fekete, B. M., Colón-González, F. J., Gosling, S. N., Kim, H., Liu, X., Masaki, Y., Portmann, F. T., Satoh, Y., Stacke, T., Tang, Q., Wada, Y., Wisser, D., Albrecht, T., Frieler, K., Piontek, F., Warszawski, L., and Kabat, P.: Multimodel assessment of water scarcity under climate change, P. Natl. Acad. Sci. USA, 111, 3245–3250, 2014. a
Schlund, M., Lauer, A., Gentine, P., Sherwood, S. C., and Eyring, V.: Emergent constraints on equilibrium climate sensitivity in CMIP5: do they hold for CMIP6?, Earth Syst. Dynam., 11, 1233–1258, https://doi.org/10.5194/esd-11-1233-2020, 2020. a, b
Shiogama, H., Watanabe, M., Kim, H., and Hirota, N.: Emergent constraints on future precipitation changes, Nature, 602, 612–616, 2022. a
Sitch, S., Smith, B., Prentice, I. C., Arneth, A., Bondeau, A., Cramer, W., Kaplan, J. O., Levis, S., Lucht, W., Sykes, M. T., and Thonicke, K.: Evaluation of ecosystem dynamics, plant geography and terrestrial carbon cycling in the LPJ dynamic global vegetation model, Glob. Change Biol., 9, 161–185, 2003. a
Takata, K., Emori, S., and Watanabe, T.: Development of the minimal advanced treatments of surface interaction and runoff, Global Planet. Change, 38, 209–222, 2003. a
Taylor, K. E., Stouffer, R. J., and Meehl, G. A.: An Overview of CMIP5 and the Experiment Design, B. Am. Meteorol. Soc., 93, 485–498, https://doi.org/10.1175/BAMS-D-11-00094.1, 2012. a
Tran, D. D., van Halsema, G., Hellegers, P. J., Ludwig, F., and Wyatt, A.: Questioning triple rice intensification on the Vietnamese mekong delta floodplains: An environmental and economic analysis of current land-use trends and alternatives, J. Environ. Manage., 217, 429–441, 2018. a
Ul Hasson, S., Pascale, S., Lucarini, V., and Böhner, J.: Seasonal cycle of precipitation over major river basins in South and Southeast Asia: A review of the CMIP5 climate models data for present climate and future climate projections, Atmos. Res., 180, 42–63, 2016. a
Wang, F., Shao, W., Yu, H., Kan, G., He, X., Zhang, D., Ren, M., and Wang, G.: Re-evaluation of the power of the mann-kendall test for detecting monotonic trends in hydrometeorological time series, Front. Earth Sci., 8, 14, https://doi.org/10.3389/feart.2020.00014, 2020. a
Wang, S., Zhang, L., She, D., Wang, G., and Zhang, Q.: Future projections of flooding characteristics in the Lancang-Mekong River Basin under climate change, J. Hydrol., 602, 126778, https://doi.org/10.1016/j.jhydrol.2021.126778, 2021. a, b, c, d, e
Wang, W., Lu, H., Ruby Leung, L., Li, H.-Y., Zhao, J., Tian, F., Yang, K., and Sothea, K.: Dam construction in Lancang-Mekong River Basin could mitigate future flood risk from warming-induced intensified rainfall, Geophys. Res. Lett., 44, 10–378, 2017. a
Warszawski, L., Frieler, K., Huber, V., Piontek, F., Serdeczny, O., and Schewe, J.: The inter-sectoral impact model intercomparison project (ISI–MIP): project framework, P. Natl. Acad. Sci. USA, 111, 3228–3232, 2014. a
Yang, H., Zhou, F., Piao, S., Huang, M., Chen, A., Ciais, P., Li, Y., Lian, X., Peng, S., and Zeng, Z.: Regional patterns of future runoff changes from Earth system models constrained by observation, Geophys. Res. Lett., 44, 5540–5549, 2017. a, b, c, d
Yun, X., Tang, Q., Wang, J., Liu, X., Zhang, Y., Lu, H., Wang, Y., Zhang, L., and Chen, D.: Impacts of climate change and reservoir operation on streamflow and flood characteristics in the Lancang-Mekong River Basin, J. Hydrol., 590, 125472, https://doi.org/10.1016/j.jhydrol.2020.125472, 2020. a
Yun, X., Tang, Q., Sun, S., and Wang, J.: Reducing Climate Change Induced Flood at the Cost of Hydropower in the Lancang-Mekong River Basin, Geophys. Res. Lett., 48, e2021GL094243, https://doi.org/10.1029/2021GL094243, 2021. a