the Creative Commons Attribution 4.0 License.
the Creative Commons Attribution 4.0 License.
 | 27 May 2024
Rate-induced tipping cascades arising from interactions between the Greenland Ice Sheet and the Atlantic Meridional Overturning Circulation
Ann Kristin Klose
Jonathan F. Donges
Ulrike Feudel
Ricarda Winkelmann
The Greenland Ice Sheet (GIS) and Atlantic Meridional Overturning Circulation (AMOC) are considered tipping elements in the climate system, where global warming exceeding critical threshold levels in forcing can lead to large-scale and nonlinear reductions in ice volume and overturning strength, respectively. The positive–negative feedback loop governing their interaction with a destabilizing effect on the AMOC due to ice loss and subsequent freshwater flux into the North Atlantic as well as a stabilizing effect of a net cooling around Greenland with an AMOC weakening may determine the long-term stability of both tipping elements. Here we explore the potential dynamic regimes arising from this positive–negative tipping feedback loop in a physically motivated conceptual model. Under idealized forcing scenarios we identify conditions under which different kinds of tipping cascades can occur: herein, we distinguish between overshoot/bifurcation tipping cascades, leading to tipping of both GIS and AMOC, and rate-induced tipping cascades, where the AMOC, despite not having crossed its own intrinsic tipping point, tips nonetheless due to the fast rate of ice loss from Greenland. The occurrence of these different cascades is affected by the ice sheet disintegration time and thus eventually by the imposed forcing and its timescales. Our results suggest that it is necessary not only to avoid surpassing the respective critical levels of the environmental drivers for the Greenland Ice Sheet and Atlantic Meridional Overturning Circulation, but also to respect safe rates of environmental change to mitigate potential domino effects.
- Article
(2824 KB) - Full-text XML
-
Supplement
(460 KB) - BibTeX
- EndNote


The Greenland Ice Sheet (GIS) and the Atlantic Meridional Overturning Circulation (AMOC) have been identified as possible interacting tipping elements of the climate system, transitioning into a qualitatively different state once a critical threshold in forcing levels of their respective environmental drivers is crossed (Lenton et al., 2008; Armstrong McKay et al., 2022).
Both components of the Earth system may be propelled towards an alternative state by positive feedback mechanisms with the crossing of a tipping point (Levermann et al., 2012), such as the melt–elevation feedback in Greenland (e.g. Robinson et al., 2012) or the salt–advection feedback relevant for AMOC dynamics (e.g. Rahmstorf, 1996). From a mathematical viewpoint, different mechanisms for critical transitions have been identified (Ashwin et al., 2012; Halekotte and Feudel, 2020). Tipping towards a qualitatively different state may be induced when a bifurcation point is transgressed by a slowly changing control parameter of the system (bifurcation-induced tipping) (Ashwin et al., 2012). By contrast, a system in its bistable regime may be driven to its alternative state by noise without a change in external conditions (noise-induced tipping) (Ashwin et al., 2012; Ditlevsen and Johnsen, 2010). Moreover, a system can be pushed into another state by one singular shock perturbation or extreme event (shock tipping) (Halekotte and Feudel, 2020; Schoenmakers and Feudel, 2021). Finally, a transition to a different system state due to a control parameter change exceeding a critical rate at which the system fails to track its changing quasi-steady equilibrium is called rate-induced tipping (Wieczorek et al., 2011; Ashwin et al., 2012; Vanselow et al., 2019; Lohmann and Ditlevsen, 2021).
The Greenland Ice Sheet and Atlantic Meridional Overturning Circulation are strongly linked via freshwater fluxes into the North Atlantic originating from a melting GIS on the one hand and via a relative cooling around Greenland with a slowdown of the AMOC on the other hand (Kriegler et al., 2009; Bamber et al., 2012, 2018; Vellinga and Wood, 2002, 2008; Jackson et al., 2015). More specifically, the increasing Greenland mass loss (Shepherd et al., 2020; Mouginot et al., 2019; Van den Broeke et al., 2016) results in a freshwater input to the North Atlantic (Bamber et al., 2012, 2018; Trusel et al., 2018), which may weaken the AMOC by decreasing seawater density and thereby weakening deep-water formation (Caesar et al., 2018; Rahmstorf et al., 2015; Golledge et al., 2019). The weakening or even tipping of the AMOC may be accompanied by a reduced northward heat transport and thus a relative cooling around Greenland (Vellinga and Wood, 2002, 2008; Jackson et al., 2015; Madsen et al., 2022), which, in turn, may act in a stabilizing way on the melting processes of the Greenland Ice Sheet (Kriegler et al., 2009). There is still a knowledge gap regarding the effect of this positive–negative feedback loop on the overall stability of the coupled system of climatic tipping elements.
The potential for cascades arising from tipping element interactions such as the feedback loop between the ice sheet on Greenland and the Atlantic Meridional Overturning Circulation has been addressed by modelling efforts of different complexity. Building on Abraham et al. (1991) and Brummitt et al. (2015), the qualitatively different dynamics arising from interactions of idealized tipping elements and preconditions for the emergence of tipping cascades have been studied (Dekker et al., 2018; Klose et al., 2020, 2021). The propagation of tipping cascades on complex networks is affected by the network topology, with clustering and spatial organization increasing the susceptibility to cascades (Krönke et al., 2020). In particular, small-scale motifs promote tipping cascades by decreasing the critical coupling strength to trigger a tipping cascade (Wunderling et al., 2020b).
Within the climate system, interactions between several large-scale tipping elements including the AMOC and the Greenland Ice Sheet as well as the West Antarctic Ice Sheet and the Amazon rainforest have been described (Kriegler et al., 2009; Gaucherel and Moron, 2017), and the arising dynamics may involve cascades (Lenton et al., 2019; Rocha et al., 2018). The interactions between these four key climate tipping elements tend to be overall destabilizing under ongoing warming as suggested by integrating expert knowledge and including uncertainties of critical temperature thresholds and interaction strengths into a risk analysis approach for these interacting tipping elements (Wunderling et al., 2023, 2021, 2020a). Employing physically motivated but still conceptual models, it was demonstrated that the intensification of ENSO, which is associated with growing oscillations of eastern Pacific sea surface temperatures after the crossing of a Hopf bifurcation, may be initiated by an AMOC collapse (Dekker et al., 2018). The dynamics of the AMOC and ice sheets in Greenland and West Antarctica as a chain of tipping elements were assessed by Sinet et al. (2023). Here, the AMOC may be stabilized by a disintegration of the West Antarctic Ice Sheet, thereby potentially hindering cascading tipping in the climate system. The stabilizing effect of a net cooling around Greenland with an AMOC weakening is not included in the modelling approach of Sinet et al. (2023).
Significant changes in both systems are observed at present with an acceleration of GIS mass loss (Shepherd et al., 2020; Trusel et al., 2018) as well as a weakening of the AMOC (Caesar et al., 2018), though AMOC reconstructions are associated with high uncertainties (Moffa-Sánchez et al., 2019). There is limited evidence that these changes may be related to the approach of a critical threshold with ongoing global warming (Boers and Rypdal, 2021; Boers, 2021; van Westen et al., 2024). In addition, triggering and transmission of abrupt changes of these systems by ice–ocean interactions may have occurred in the past as suggested by paleo-evidence (Brovkin et al., 2021; Thomas et al., 2020). Guided by present-day observations and insights from paleoclimate records, the potential future dynamics of the coupled GIS–AMOC system have been explored in the framework of e.g. hosing experiments (see Sect. 2 for further details). However, the effects of a possible nonlinear disintegration of the Greenland Ice Sheet with different rates and the additional negative feedback via temperature changes around Greenland for cascading tipping behaviour have not been explicitly considered on long timescales yet.
Here, we qualitatively explore the dynamics and in particular the risk of cascading tipping behaviour emerging from the interaction of GIS and AMOC in a positive–negative feedback loop of freshwater fluxes into the North Atlantic and a relative cooling around Greenland. In Sect. 2 we give more details on changes observed at present, constraints from paleoclimate evidence for the potential future behaviour and previous modelling approaches of the coupled GIS–AMOC system, which motivate our study. The interaction of the GIS and AMOC is captured by coupled physically motivated conceptual models of both climatic tipping elements (Wood et al., 2019; Levermann and Winkelmann, 2016) (Sect. 3). The aim here is not to provide quantitative statements or projections on the emergence of tipping cascades in the climate system. Rather, our approach allows us to examine the qualitative behaviour of the coupled system under a multitude of forcing scenarios and on long timescales, as presented in Sect. 4. Complementing freshwater hosing experiments, we study the AMOC response to a decline of the ice sheet on Greenland under idealized forcing scenarios, yielding a range of ice sheet disintegration times (Sect. 4.2). This includes a rate-induced cascade where the AMOC tips due to the rapid ice loss from Greenland without having crossed its own tipping point yet. To this end, we show that the potentially stabilizing effect of the relative cooling around Greenland due to an AMOC slowdown may prevent a tipping of the ice sheet on Greenland only conditionally for a limited forcing, given that the AMOC resides close to its threshold (Sect. 4.3). These findings are relevant for defining safe pathways of environmental change to maintain the resilience of the Earth system (Sect. 5).
Here, we explore current observations on the state of the individual tipping elements as well as paleo-evidence for past tipping cascades in more detail. These insights form the basis for assessing the future stability of the interacting Greenland Ice Sheet and the AMOC under ongoing global warming. Previous modelling approaches capturing aspects of the coupled GIS–AMOC system and determining potentially arising dynamics are presented and their limitations are discussed.
Observed changes. Observations reveal pronounced changes in both systems: at present, the Greenland Ice Sheet is losing mass at an accelerating rate due to an increase in surface melt and ice discharge (Shepherd et al., 2020; King et al., 2020), totalling a loss of 3902±342 Gt of ice between 1992 and 2018 (Slater et al., 2021). The AMOC may have reached its weakest state in at least a millennium (Caesar et al., 2021) after a slowdown in the past decades (Rahmstorf et al., 2015; Caesar et al., 2018). Based on early warning signals the proximity of a critical threshold in western Greenland (Boers and Rypdal, 2021) and a potential loss of stability of the current strong AMOC mode (Boers, 2021; van Westen et al., 2024) have been suggested.
Paleo-evidence of tipping interactions. In Earth history, strong retreats of the Greenland Ice Sheet (e.g. during the Pliocene and interglacials of the Pleistocene; Dutton et al., 2015; Schaefer et al., 2016; Christ et al., 2021) and a slowdown of the AMOC (e.g. during the last glacial period; Rahmstorf, 2002; Ritz et al., 2013; Lynch-Stieglitz, 2017) have likely occurred. Paleoclimate evidence suggests that some abrupt changes in the AMOC and the Greenland Ice Sheet may have been mediated by cryosphere–ocean interactions (Brovkin et al., 2021; Thomas et al., 2020). Large regional temperature changes in Greenland during the last glacial period are associated with changes in the AMOC (Lynch-Stieglitz, 2017; Barker and Knorr, 2016). In turn, past AMOC regime shifts are connected to freshwater pulses into the North Atlantic originating from a changing cryosphere (Brovkin et al., 2021).
Previous modelling approaches. The fate of the AMOC in response to a freshwater flux from Greenland, i.e. the effects of a unidirectional coupling of the Greenland Ice Sheet towards the AMOC, was studied in terms of freshwater hosing experiments in general circulation models (GCMs) (Hu et al., 2009; Jungclaus et al., 2006; Stouffer et al., 2006; Swingedouw et al., 2013, 2015; Rahmstorf, 1995). In addition, experiments with coupled climate–ice sheet models under global warming were conducted (Fichefet et al., 2003; Ridley et al., 2005; Winguth et al., 2005; Swingedouw et al., 2006; Driesschaert et al., 2007; Mikolajewicz et al., 2007; Gierz et al., 2015; Golledge et al., 2019; Madsen et al., 2022). In general, the AMOC response to a freshwater flux associated with a GIS melting ranges from no significant weakening to an observable effect on the AMOC strength (Fichefet et al., 2003; Ridley et al., 2005; Winguth et al., 2005; Swingedouw et al., 2006; Jungclaus et al., 2006; Mikolajewicz et al., 2007; Driesschaert et al., 2007; Hu et al., 2009; Gierz et al., 2015; Golledge et al., 2019; Madsen et al., 2022). A collapse of the AMOC was found by Stouffer et al. (2006) in response to a freshwater input of 1.0 Sv (106 m3 s−1) for 100 years and by Fichefet et al. (2003) in simulations of the 21st century climate. The AMOC trajectory under temporary freshwater input depends among others on the sensitivity of the considered model and the background climate state (Swingedouw et al., 2013, 2015). However, freshwater inputs into the North Atlantic in such hosing experiments are highly idealized, vary in terms of their magnitude as well as spatial and temporal characteristics, and do not take into account the nonlinear melting characteristics of a tipping of the ice sheet on Greenland (Trusel et al., 2018; Robinson et al., 2012). In addition, the potential stabilizing effect of relatively colder temperatures in Greenland on the ice sheet (Jackson et al., 2015; Madsen et al., 2022) is not included. Many Earth system models are debated to be biased towards an AMOC that is too stable and hence may not be able to resolve its nonlinear behaviour due to missing couplings, processes and feedbacks, uncertainties in their representation, and biases in fluxes of salt and heat between ocean basins (Liu et al., 2017; Valdes, 2011; Weijer et al., 2019). Finally, computational constraints impede assessing multiple potential AMOC trajectories under uncertain parameters and climate forcings on long timescales (Wood et al., 2019; Jackson and Wood, 2018). However, considerations on long timescales are relevant given the rather slow ice sheet response to perturbations in its climatic boundary conditions but also to determine the state to which the AMOC eventually converges after a freshwater perturbation (Fichefet et al., 2003; Jackson and Wood, 2018; Weijer et al., 2019; Madsen et al., 2022). The hosing experiments were supplemented by more conceptual approaches allowing for an uncertainty analysis of the future development of the AMOC overturning strength under global warming and ice sheet melting (Zickfeld et al., 2004; Bakker et al., 2016).
Recently, a possible rate-induced tipping (Ashwin et al., 2012) of the AMOC for a quickly changing, time-dependent freshwater forcing in a three-dimensional ocean model (Lohmann and Ditlevsen, 2021) confirmed the suggested sensitivity of the AMOC to the rate of driver change (Stocker and Schmittner, 1997; Alkhayuon et al., 2019). It may further hint to cascading tipping of the interacting GIS and AMOC due to timescale differences between e.g. the freshwater input and the AMOC response timescale (Lohmann et al., 2021; Lohmann and Ditlevsen, 2021). In particular, the rate of melting of the ice sheet on Greenland was suggested to depend on the magnitude of the surface warming above its tipping point (Robinson et al., 2012; Bochow et al., 2023). Such a rate-induced cascade induced by crossing critical rates of environmental change complements the commonly suspected tipping cascades involving bifurcation-induced tipping (Dekker et al., 2018; Klose et al., 2021; Wunderling et al., 2021).
In the following, we introduce conceptual physically motivated models representing the dynamics of the individual tipping elements. The one-dimensional ice sheet model depicting the potential tipping behaviour of the Greenland Ice Sheet and the box model capturing the AMOC thresholds are outlined in Sect. 3.1 and 3.2, respectively. In Sect. 3.3, our approach of modelling the interactions of GIS and AMOC via freshwater fluxes and temperature changes is presented.
3.1 Greenland Ice Sheet evolution with a one-dimensional ice sheet model including melt–elevation feedback
To describe the behaviour of the Greenland Ice Sheet, we use a well-established flowline model in the x–z plane, where the ice sheet rests on a flat, rigid bed. Basal melting is neglected and the ice softness is assumed to be constant; i.e. it does not depend on the temperature. The evolution of the ice thickness h, based on the shallow-ice approximation (Hutter, 1983), can then be described by the following governing equation (Greve and Blatter, 2009):
with the ice softness A, Glen's flow law exponent n, the ice density ρ, the gravitational acceleration g and the surface mass balance as. The surface mass balance of an ice sheet is the sum of mass gain through precipitation and mass loss through runoff, erosion and sublimation at its surface. Changes in ice thickness h depend on the divergence of the ice flux F and the mass balance at the surface as (first and second term on right-hand side of Eq. 1, respectively). We assume a horizontal ice sheet extent of 2L from to x=L being symmetric around the ice dome with zero ice thickness at the boundary (Jouvet et al., 2011), associated with a continent bounded by the ocean without floating ice shelves (Oerlemans, 1981). If not stated otherwise, the parameter values in Table S1 in the Supplement are used, representing conditions similar to present-day Greenland. The ice thickness equation, Eqs. (1)–(2), is combined with a simple parameterization of the melt–elevation feedback (Zeitz et al., 2022) following Levermann and Winkelmann (2016) to capture the nonlinear dynamics and tipping behaviour of the ice sheet on Greenland (Robinson et al., 2012). That is, a lowering of the ice sheet surface enhances surface melt as the ice sheet surface is exposed to warmer air temperatures according to the atmospheric lapse rate Γ. Thereby, the surface mass balance as is reduced and further ice loss is promoted. In particular, it is assumed that the surface mass balance as depends linearly on the ice thickness h (here equivalent to the ice sheet surface elevation) such that a changing ice thickness alters the surface mass balance as follows:
with the atmospheric lapse rate Γ>0 and the surface melt sensitivity γ describing the variation in surface melt with temperature changes (Levermann and Winkelmann, 2016). The surface mass balance for h=0, which is , is not spatially dependent. Based on the thickness h(x,t) of the ice sheet with a horizontal extent 2L (Fig. 1a), the ice volume is approximated using a constant ice sheet length w= 1000 km (Fig. 1a). The value of the ice sheet length is chosen such that the present-day GIS ice volume (Morlighem et al., 2017) is approximately obtained for the initial ice sheet configuration at the start of our experiments. Note that the ice sheet length w is kept constant irrespective of a possible change in the GIS ice thickness h(x,t).
The ice thickness evolution equation, Eqs. (1)–(2), together with the melt–elevation feedback, Eq. (3), has been shown to generally capture the hysteresis behaviour of the Greenland Ice Sheet (Levermann and Winkelmann, 2016): for a stable ice sheet is built up, where denotes the glaciation threshold. Two configurations of the ice sheet exist for , where the ice sheet will either evolve into a stable state with the ice volume close to present day, or an ice-free state is obtained depending on the initial conditions. Crossing the deglaciation threshold leads to a complete disintegration of the ice sheet. Note that the ice-free state is obtained by enforcing a non-negative ice thickness (Hindmarsh, 2001; Van den Berg et al., 2006). Obtaining a small remaining ice cap under warming as suggested by fully dynamic ice sheet models (e.g. Robinson et al., 2012) requires including additional processes beyond those considered here.
3.2 AMOC evolution using a box model of the global ocean
The dynamics of the AMOC are described by a global ocean box model (Wood et al., 2019; Alkhayuon et al., 2019), which consists of five boxes: the North Atlantic (N), the tropical Atlantic (T) and the Indo-Pacific (IP) box connected via the Southern Ocean (S) box and a box corresponding to the bottom waters (B). Following Wood et al. (2019), it is assumed that the temperature TN of the North Atlantic box is linearly dependent on the AMOC strength q,
with the North Pacific temperature T0 and the constant μ, while the temperatures of the other boxes are fixed. The AMOC strength q is determined by the density difference between the North Atlantic and the Southern Ocean box:
where λ is a hydraulic constant and α and β are the thermal and haline coefficients, respectively (Wood et al., 2019).
By salt conservation, the salinities Si with for q> 0 are described by
with the box volumes Vi, the surface freshwater fluxes Fi and the gyre coefficients Ki as coefficients of a diffusive flux representing a wind-driven salinity transport between the boxes where . The parameter η describes the mixing between the Southern Ocean and the bottom-water box. κ gives the proportion of the cold-water path as the AMOC flow returning via the South Pacific and the Drake Passage (Wood et al., 2019). If not stated otherwise, the parameters displayed in Table S1 are used. A second set of equations for the salinity evolution in each box in the case q< 0 can also be formulated based on salt conservation. The salinity SB in the bottom-water box is determined by assuming a constant total salt content (C=const., determined by the initial conditions for the salinities following Alkhayuon et al., 2019, see Table S2),
given that the surface freshwater fluxes satisfy . A hosing H resulting in the surface freshwater fluxes of the form
is applied where . Here, is considered to represent baseline surface freshwater fluxes of the respective ocean boxes under pre-industrial conditions, and Ai represents multiplicative factors distributing additional surface freshwater fluxes across the boxes based on the hosing H (Wood et al., 2019). The hosing surface freshwater flux pattern follows Wood et al. (2019) as shown in Table S3 and corresponds to an additional freshwater input into parts of the North Atlantic and tropical Atlantic box (i.e. the North Atlantic over 20–50° N) and a freshwater removal elsewhere. These additional surface freshwater fluxes based on the hosing H are considered here to be increased river runoff and precipitation over the ocean into the North Atlantic with a warmer climate. Note that freshwater fluxes are introduced as virtual salinity fluxes based on a reference salinity as in previous ocean box models (e.g. Rahmstorf, 1996; Lucarini and Stone, 2005) and likewise in some GCMs (e.g. Swingedouw et al., 2013; Yin et al., 2010; Rahmstorf, 1996) that often apply a rigid lid approximation. Thus, their effect on the mass balance is neglected, keeping the ocean volume constant.
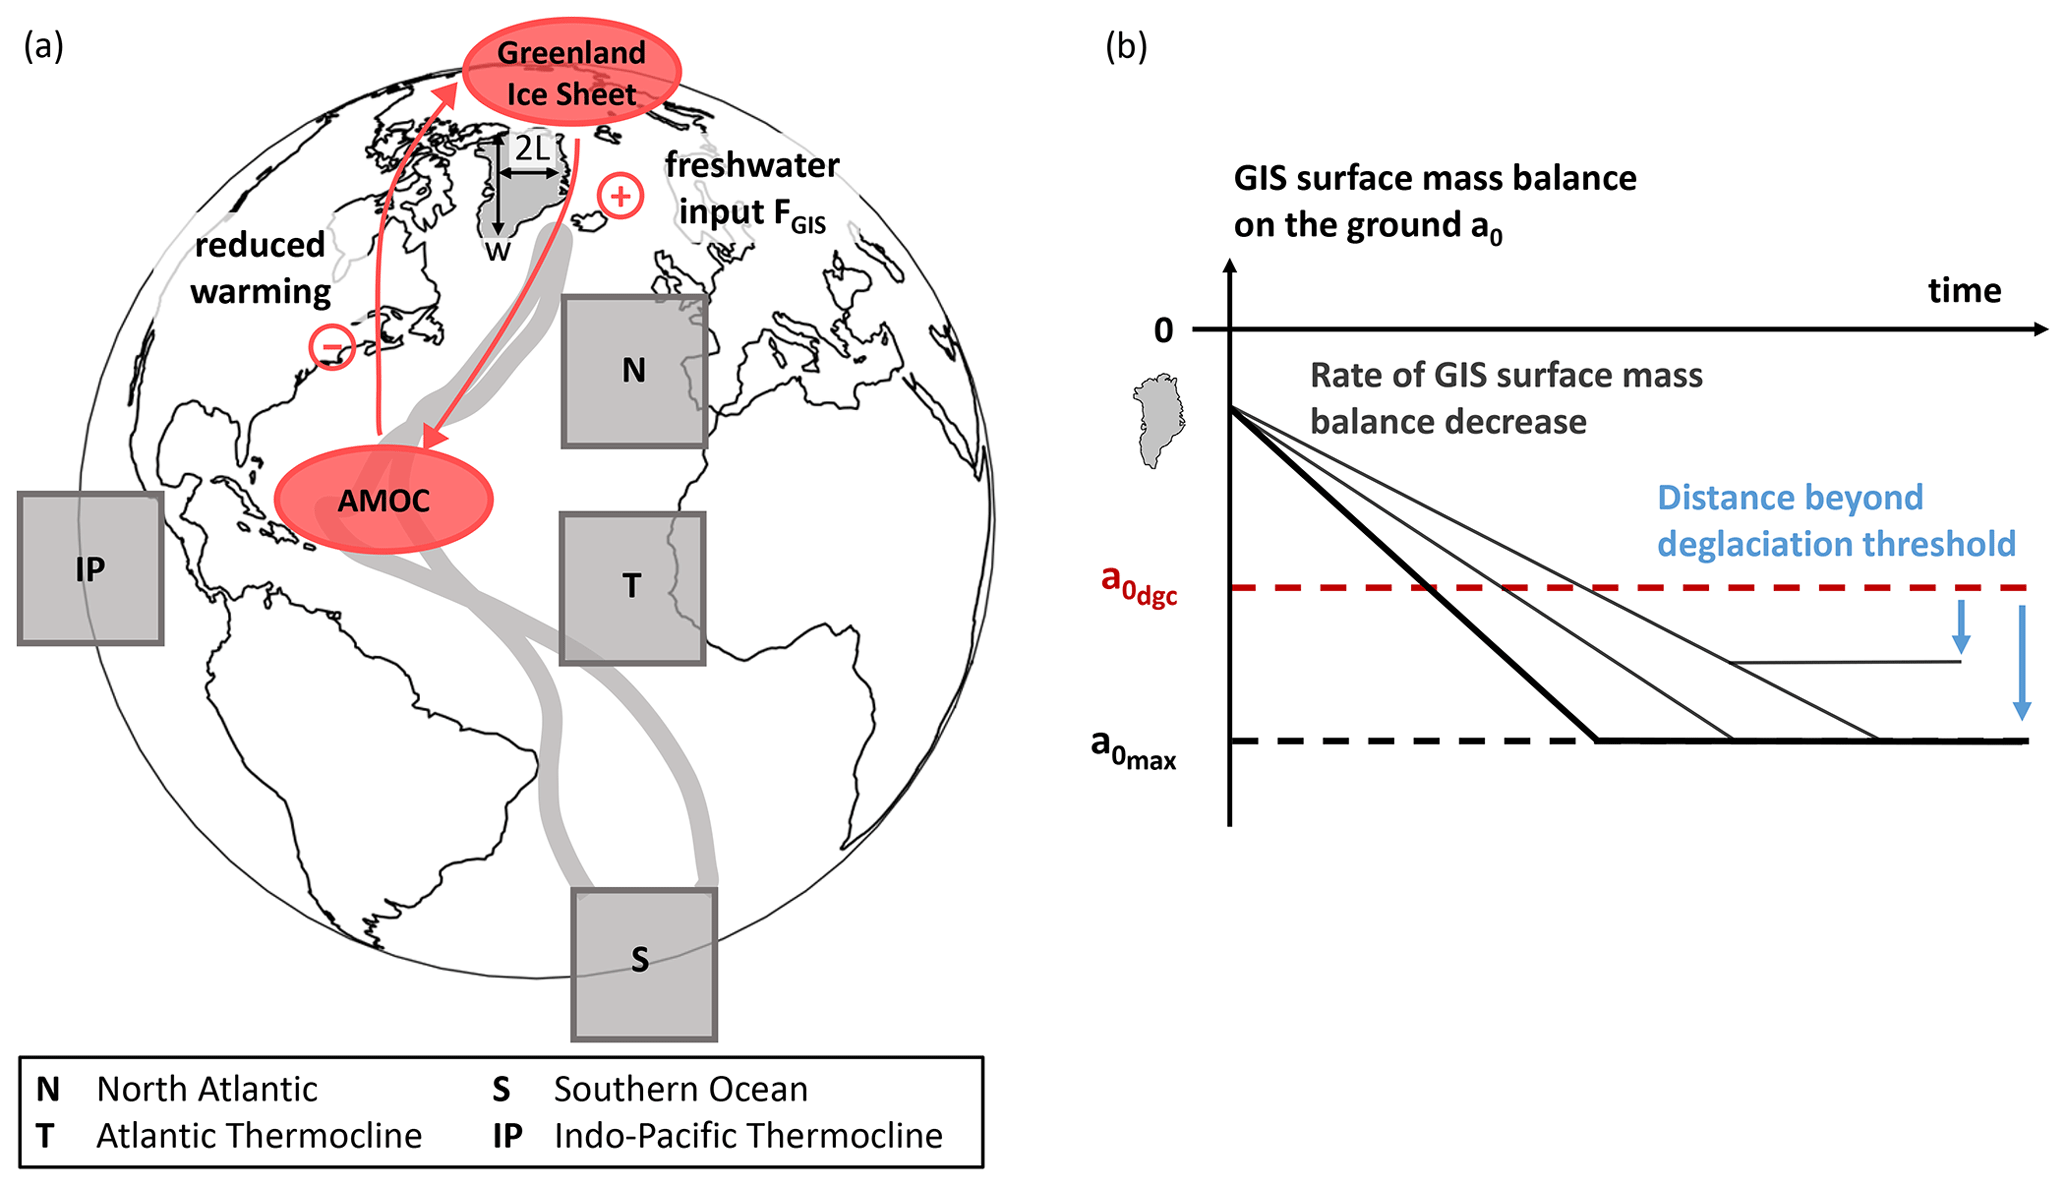
Figure 1Interactions between the Greenland Ice Sheet (GIS) and the Atlantic Meridional Overturning Circulation (AMOC). (a) The model presented here investigates the positive–negative feedback loop between the two tipping elements via freshwater fluxes from Greenland ice loss and temperature changes due to changes in the overturning circulation. The dynamics of the Greenland Ice Sheet are modelled by a simplified approach including the melt–elevation feedback (see Eqs. 1–3). The ice sheet extent is captured by its horizontal width 2L and a constant length w, as indicated in the figure. The AMOC is represented by a box model (see Eqs. 4–11). (b) The GIS surface mass balance at the ground level decreases linearly in time in our experiments across the deglaciation threshold with a ramping rate towards a final value (Sect. 4.2). Both the ramping rate and the final value are varied across the experiments presented here, as indicated by the distinct lines in (b).
3.3 Modelling interactions of GIS and AMOC via freshwater fluxes and temperature
GIS and AMOC interact via freshwater fluxes into the North Atlantic originating from a melting GIS on the one hand and via a relative cooling around Greenland with a slowdown of the AMOC on the other. These suggested interactions are included in our study by the coupling of the models described above as follows: the relative cooling in the North Atlantic with a weakening of the AMOC (Vellinga and Wood, 2002, 2008; Jackson et al., 2015) is assumed to imprint on the atmosphere and is related to the surface mass balance of the Greenland Ice Sheet via a constant factor doa and the ice melting sensitivity γ. The GIS surface mass balance in Eq. (3) is then replaced by
where is a reference temperature in the North Atlantic box given with respect to a reference hosing Href. We will refer to a0 as the surface mass balance at the ground level. In the following, Href= 0 Sv is chosen, corresponding to the quasi-equilibrated AMOC under pre-industrial atmospheric CO2 concentration conditions. With H>Href, the AMOC overturning strength q declines. Driven by Eq. (4), the temperature TN in the North Atlantic box then declines as well. For doa= 0, we obtain a unidirectional coupling, where Greenland is not exposed to any changes in the North Atlantic (Eq. 12).
In addition, the freshwater flux into the ocean along Greenland's coast resulting from the mass loss of the ice sheet (Bamber et al., 2012, 2018; Trusel et al., 2018) is added as FGIS to the combined freshwater into the surface North Atlantic box as
The GIS freshwater flux FGIS is determined by integrating the ice sheet thickness change over its spatial horizontal extent and approximated into a volume loss by the constant ice sheet length w (Sect. 3.1). It eventually acts as a virtual salinity flux, while assuming a constant ocean volume (see Sect. 3.2). The freshwater flux FGIS from the ice sheet is set to zero (FGIS= 0 Sv) if it resides in a steady-state configuration (or grows). Hence, the freshwater flux FGIS is non-zero (FGIS> 0 Sv) only during a height (or volume) loss of the Greenland Ice Sheet over time corresponding to the ice sheet decline.
4.1 AMOC bifurcation structure for varying freshwater fluxes
Depending on the hosing H, a strong “on” and a weak “off” AMOC configuration may coexist as stable states in the global ocean box model (Fig. 2a, indicated in blue). The AMOC “on” state loses stability via a subcritical Hopf bifurcation upon crossing the hosing threshold HHopf, as shown by Alkhayuon et al. (2019). It eventually disappears when it meets the separating saddle (Fig. 2a, indicated as dashed blue) in a fold.
The freshwater flux FGIS from the Greenland Ice Sheet supplements the hosing H and additionally controls the long-term stability of the AMOC. It has an additive effect on the total freshwater flux into the Atlantic Ocean, which increases the already existing hosing H and may thus take the AMOC to its “off” state if reaching a critical value throughout the GIS decline. As indicated in Fig. 2a (black and grey lines), for a fixed hosing there is a critical threshold const.) on varying the freshwater flux FGIS beyond which the “on” state of the AMOC is not stable anymore. In particular, the upper stable branch loses stability via a subcritical Hopf bifurcation at (indicated by green point in Fig. 2a). The upper branch disappears when it meets the unstable middle branch at a turning point of the bifurcation curve. Note that the Hopf bifurcation and the turning point are very close to each other and therefore cannot be clearly distinguished in Fig. 2a. Figure 2b illustrates how the GIS freshwater flux threshold changes depending on the hosing H. With increasing hosing H and thus by getting closer to the hosing threshold HHopf (Alkhayuon et al., 2019), the threshold is shifted to smaller values. Note that, while the GIS freshwater flux FGIS has been discussed in the style of an external control parameter here, it is actually a state variable in transient experiments that represents the freshwater flux into the North Atlantic due to the time-dependent decline of the ice sheet on Greenland.
4.2 Tipping cascades between GIS and AMOC without negative feedback
We explore the dynamics and possible tipping outcomes of the interacting GIS and AMOC, which are represented by the model introduced in Sect. 3 and coupled via freshwater fluxes and temperature changes as outlined above, in response to a changing surface mass balance at the ground level a0, as observed over the past decades and projected with progressing global warming (Shepherd et al., 2020; van den Broeke et al., 2017; Fettweis et al., 2013). More specifically, the surface mass balance at the ground level a0 is decreased linearly with a ramping rate towards or across the deglaciation threshold . Once this deglaciation threshold is crossed, a stable ice sheet cannot be sustained. The surface mass balance at the ground level is then kept constant after a final value is reached (Fig. 1b). For all experiments, it is assumed that the Greenland Ice Sheet initially resides in a steady state with an intact ice sheet for a surface mass balance at the ground level m a−1 and the AMOC is initially in its “on” state corresponding to the fixed hosing .
In a first step, we study the AMOC response to a disintegration of the Greenland Ice Sheet by choosing a coupling strength doa= 0 under idealized forcing scenarios (as described above and indicated in Fig. 1b), complementing previous freshwater hosing experiments (Hu et al., 2009; Jungclaus et al., 2006; Stouffer et al., 2006; Swingedouw et al., 2013, 2015; Rahmstorf, 1995). Different types of cascading tipping can be identified (Sect. 4.2.1). The occurrence of these qualitatively different tipping pathways is quantified in the space of parameters that determine the evolution of the environmental drivers for GIS and AMOC (Sect. 4.2.2). For example, by increasing the hosing H the AMOC is brought closer to its critical (hosing) threshold, changing its susceptibility to an additional freshwater flux from Greenland.
4.2.1 Types of tipping cascades
By decreasing the surface mass balance at the ground level associated with progressing warming as qualitatively displayed in Fig. 1b, the Greenland Ice Sheet is forced across its deglaciation threshold and eventually disintegrates completely when neglecting the negative temperature feedback. The freshwater volume loss resulting from the forced deglaciation of Greenland corresponds to a time-varying GIS freshwater flux FGIS into the North Atlantic. This time-dependent GIS freshwater flux first increases as the ice sheet disintegrates. Consequently, the AMOC overturning strength declines, potentially overshooting its threshold (Ritchie et al., 2021). The GIS freshwater flux eventually returns to FGIS= 0 Sv with a disintegration of the ice sheet on Greenland under otherwise constant hosing (Fig. 2a, with AMOC trajectory approximately following black and grey lines). Depending on the GIS disintegration time and positions of the AMOC relative to its hosing threshold we can identify different types of cascading tipping of the GIS and the AMOC. The identified types of cascading tipping are qualitatively comparable to AMOC responses to an artificial freshwater flux as detected in previous hosing experiments using GCMs.
In particular, the AMOC may transition to its “off” state in response to the disintegration of the Greenland Ice Sheet with a temporary overshoot of the GIS freshwater flux threshold , resulting in an overshoot/bifurcation cascade (Fig. 2c). The increasing GIS freshwater flux takes the AMOC out of the basin of attraction of the “on” state, and the AMOC does not recover after the decline of the GIS freshwater flux with the deglaciation of Greenland. In this example, the surface mass balance is decreased substantially beyond the deglaciation threshold to m a−1 within about 3000 years, which results in a complete deglaciation of Greenland in this time period. This deglaciation timescale and the resulting freshwater flux are of a comparable order of magnitude as determined for the ice sheet collapse given a constant regional summer temperature rise of 8 °C in Greenland in a fully dynamic ice sheet model (Robinson et al., 2012). The resulting GIS freshwater flux is sufficiently slow such that the AMOC closely follows its “on” state. Note that the AMOC is already shifted towards its hosing threshold HHopf along the upper stable branch with a hosing H= 0.16 Sv. Hence, the overshoot/bifurcation cascade does not necessarily contradict the AMOC weakening without tipping, as commonly detected in hosing experiments (Mikolajewicz et al., 2007, see Sect. 4.2.2 for further discussion).
A faster and stronger decrease in the surface mass balance may drive a more extreme collapse of the ice sheet on Greenland within about 1000 years, which is comparable to Greenland becoming ice-free until the end of the millennium under the higher-emission pathway RCP8.5 in Aschwanden et al. (2019). In our experiments, the AMOC may then undergo a critical transition to its “off” state without a crossing of the GIS freshwater flux threshold in a rate-induced cascade (Fig. 2d) as recently described for the AMOC due to an abrupt decline in sea ice cover (Lohmann et al., 2021). With the relatively fast deglaciation of Greenland, the AMOC cannot keep up with the stable “on” state, leaves the stable “on” state and then crosses the moving basin boundary. Rate-induced transitions of the AMOC have already been explored by Stocker and Schmittner (1997) for varying CO2 emission rates. More recently, Lohmann and Ditlevsen (2021) confirmed the suggested sensitivity of the AMOC to the rate of change of a time-dependent freshwater flux by demonstrating rate-induced tipping in a complex ocean model. Here, it is assumed that both the ice sheet on Greenland and the AMOC are initially in equilibrium. However, small disturbances, e.g. in initial box salinities, are always present in the real world. Initial conditions may additionally be important for the response of the AMOC to a GIS decline as studied, e.g. as scenario-dependent basins of attraction (Kaszás et al., 2019).
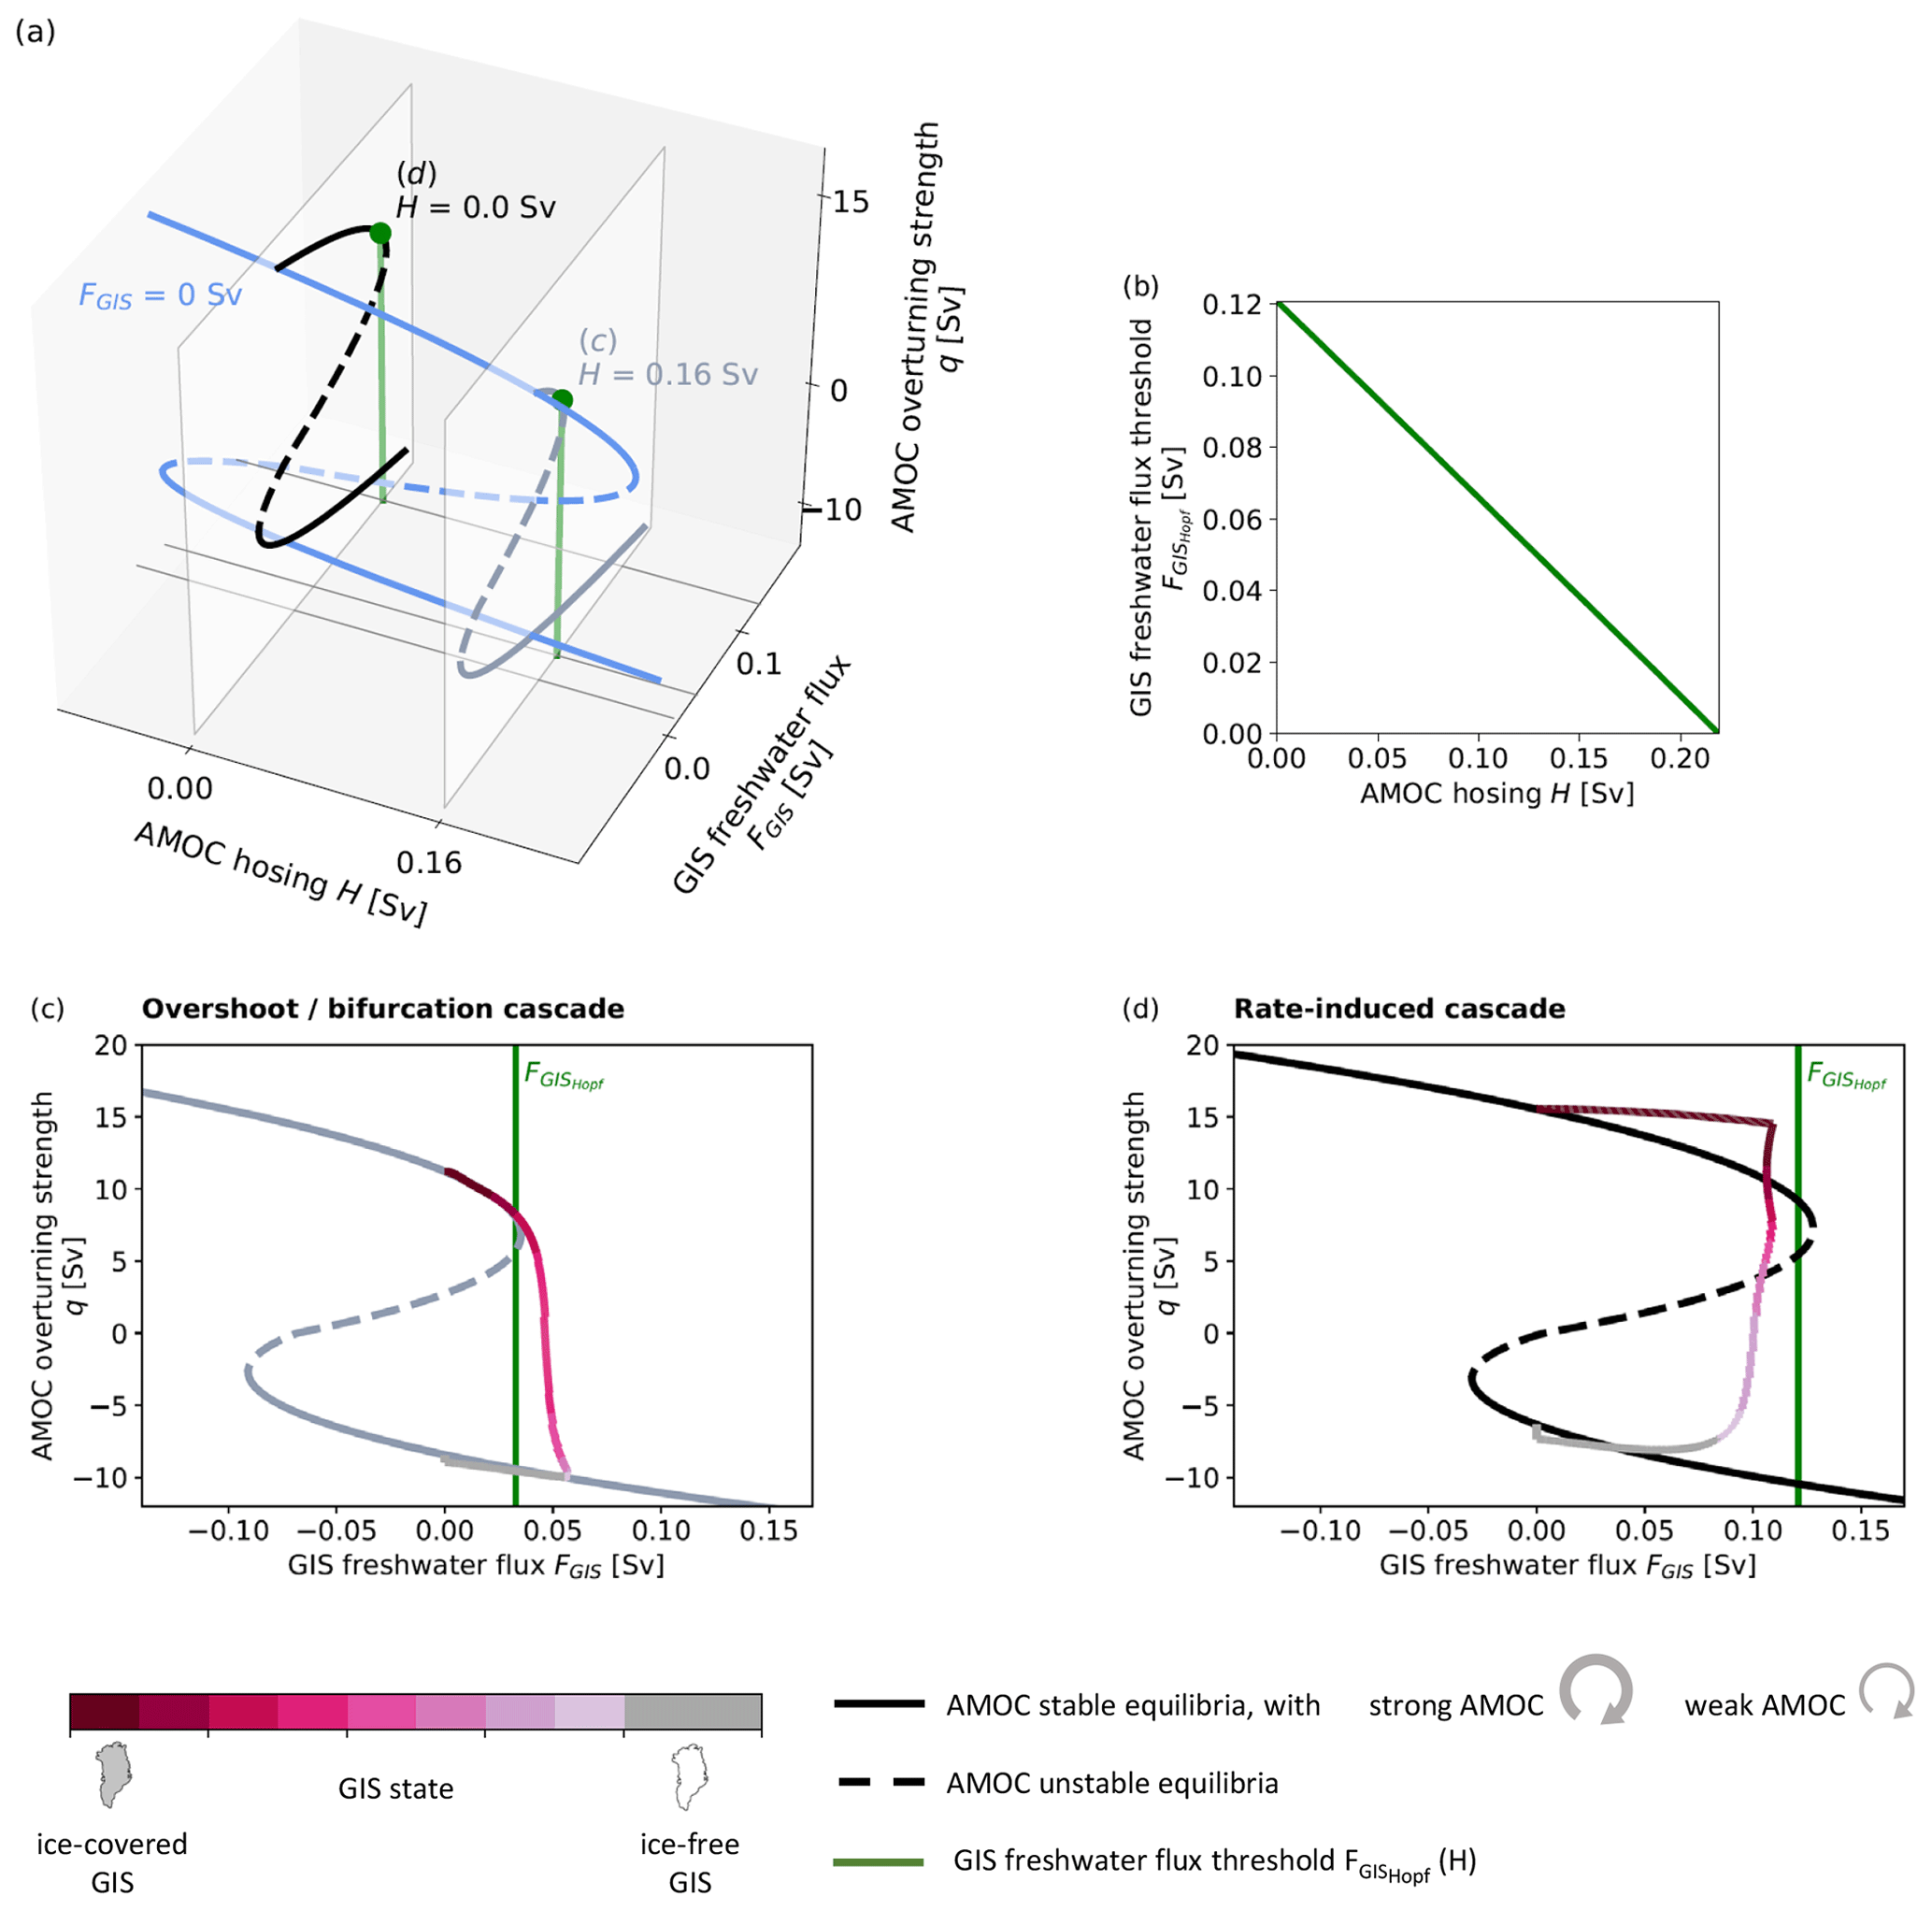
Figure 2Cascading tipping of the Greenland Ice Sheet and the Atlantic Meridional Overturning Circulation for unidirectional coupling. (a) Long-term behaviour of the AMOC overturning strength q as a function of the hosing H and the GIS freshwater flux FGIS. The uncoupled case with zero freshwater flux FGIS= 0 Sv is indicated in blue; two cases under varying GIS freshwater flux with constant hosing H= 0 and H= 0.16 Sv are shown in black and light grey, respectively. Stable fixed points are given by the solid lines, while unstable fixed points are given by the dashed lines. The critical GIS freshwater flux threshold for AMOC hosing H= 0 and H= 0.16 Sv is indicated in green. (b) GIS freshwater flux threshold depending on the AMOC hosing H. (c, d) Response of the AMOC (pink to grey colouring indicating the respective state of the GIS at that point in time) in terms of the overturning strength q to the deglaciation of Greenland and the resulting freshwater flux FGIS for a constant hosing H. The negative feedback via a relative cooling around Greenland is neglected with a coupling strength doa= 0. (c) Overshoot/bifurcation cascade for hosing H= 0.16 Sv and an evolution of the surface mass balance at the ground level a0 with a ramping rate m a−2 and final value m a−1 (see Sect. 4.2), leading to tipping of the AMOC in response to a deglaciation of Greenland. (d) Rate-induced cascade for hosing H= 0 Sv, ramping rate m a−2 and final value m a−1, where the AMOC tips in response to the rapid ice loss from Greenland albeit not having crossed its own respective tipping point yet.
4.2.2 Emergent dynamic regimes
We identify qualitatively different cascading dynamics of an AMOC transition in response to a deglaciation of Greenland in our model as an overshoot/bifurcation cascade and a rate-induced cascade. The conceptual nature of the model allows studying these cascading dynamics with respect to the GIS disintegration timescales as well as the AMOC position relative to its hosing threshold. The deglaciation of Greenland in response to an idealized linear decrease in the surface mass balance at the ground level (Fig. 1b) is determined by how fast (rate of change in the surface mass balance at the ground level ) and how far (final value beyond the deglaciation threshold ) the Greenland Ice Sheet is driven across its tipping point. By varying the ramping rate and the final value of the GIS surface mass balance at the ground level, we systematically explore the occurrence of these different dynamic regimes: that is, the overshoot/bifurcation cascade and the rate-induced cascade of the Greenland Ice Sheet and AMOC. Thereby, we are able to qualitatively identify safe and dangerous pathways (Armstrong McKay et al., 2022) for the evolution of the tipping element drivers in our model.
Figure 3 shows the overall tipping outcome (indicated by the colouring) depending on the timescale of GIS decline. A range of disintegration times of the Greenland Ice Sheet is assessed by varying the rate of change in the surface mass balance along the outer vertical axis and the final value of the surface mass balance along the outer horizontal axis. In addition, the distance of the AMOC to its hosing threshold is taken into account by varying the constant hosing from H= 0 Sv to close to the hosing threshold HHopf along the vertical axis of the respective bar. The hosing value above which additional freshwater from Greenland gives rise to the stability loss of the AMOC “on” state (see Fig. 2a and b) is denoted by the green line in Fig. 3.
For slowly driving the Greenland Ice Sheet slightly across its deglaciation threshold (lower left corner in Fig. 3), the occurrence of the overshoot/bifurcation cascade with an overshoot of the GIS freshwater flux threshold (see Fig. 2c) is limited to relatively high hosing values sufficiently close to the AMOC hosing threshold HHopf (solid grey area above the green line). For relatively lower hosing values and, thus, for the AMOC residing at a greater distance from its hosing threshold HHopf, the AMOC temporarily weakens with freshwater input from Greenland but eventually remains in its “on” state (as commonly detected in hosing experiments) in response to a slow GIS deglaciation. The GIS freshwater flux threshold is not crossed (dashed grey area below the green line). Thus, for an overshoot/bifurcation cascade to occur with a slow ice sheet decline, a high hosing determining the fixed surface freshwater flux hosing pattern might be necessary in addition to the freshwater from the ice sheet on Greenland. In other words, the AMOC has to be shifted closer to its hosing tipping point by increasing the hosing for a propagation of tipping from the Greenland Ice Sheet to the AMOC.
The relative size of the region in the parameter space which gives rise to an overshoot/bifurcation cascade changes by variations of the Greenland Ice Sheet's disintegration time. More specifically, a faster decrease in the surface mass balance and an increasing distance beyond the deglaciation threshold of Greenland (going from the lower left corner to the centre of Fig. 3) result in a more rapid ice sheet collapse. The overshoot/bifurcation cascade is then already found for lower values of the hosing (solid grey area above the green line). Hence, an AMOC collapse due to overshooting the respective tipping point with a GIS deglaciation may already occur for larger distances of the AMOC from its hosing tipping point.
Finally, a more rapid ice sheet decline with a fast onset of GIS melting and a sufficiently long period of sustained, high freshwater input from Greenland allows a rate-induced cascade to emerge (see Fig. 2d). The AMOC collapses due to the rapid ice loss from Greenland without having crossed its respective tipping point (going from the centre to the upper right corner of Fig. 3, solid grey area below the green line). We are thus able to detect a rate-induced transition of the AMOC, which occurs before the strong AMOC state loses stability and hence without crossing critical magnitudes of freshwater flux.
The ocean box model (Wood et al., 2019) may additionally allow for avoiding an AMOC collapse despite overshooting the respective tipping point. Such a safe overshoot requires a fast onset of GIS melting followed by a fast enough decrease in the freshwater flux (Alkhayuon et al., 2019; Wunderling et al., 2023). Starting from a Greenland Ice Sheet which approximately resembles present-day conditions, safe overshoots of the AMOC tipping point are not found in our model for the range of GIS disintegration timescales considered here.
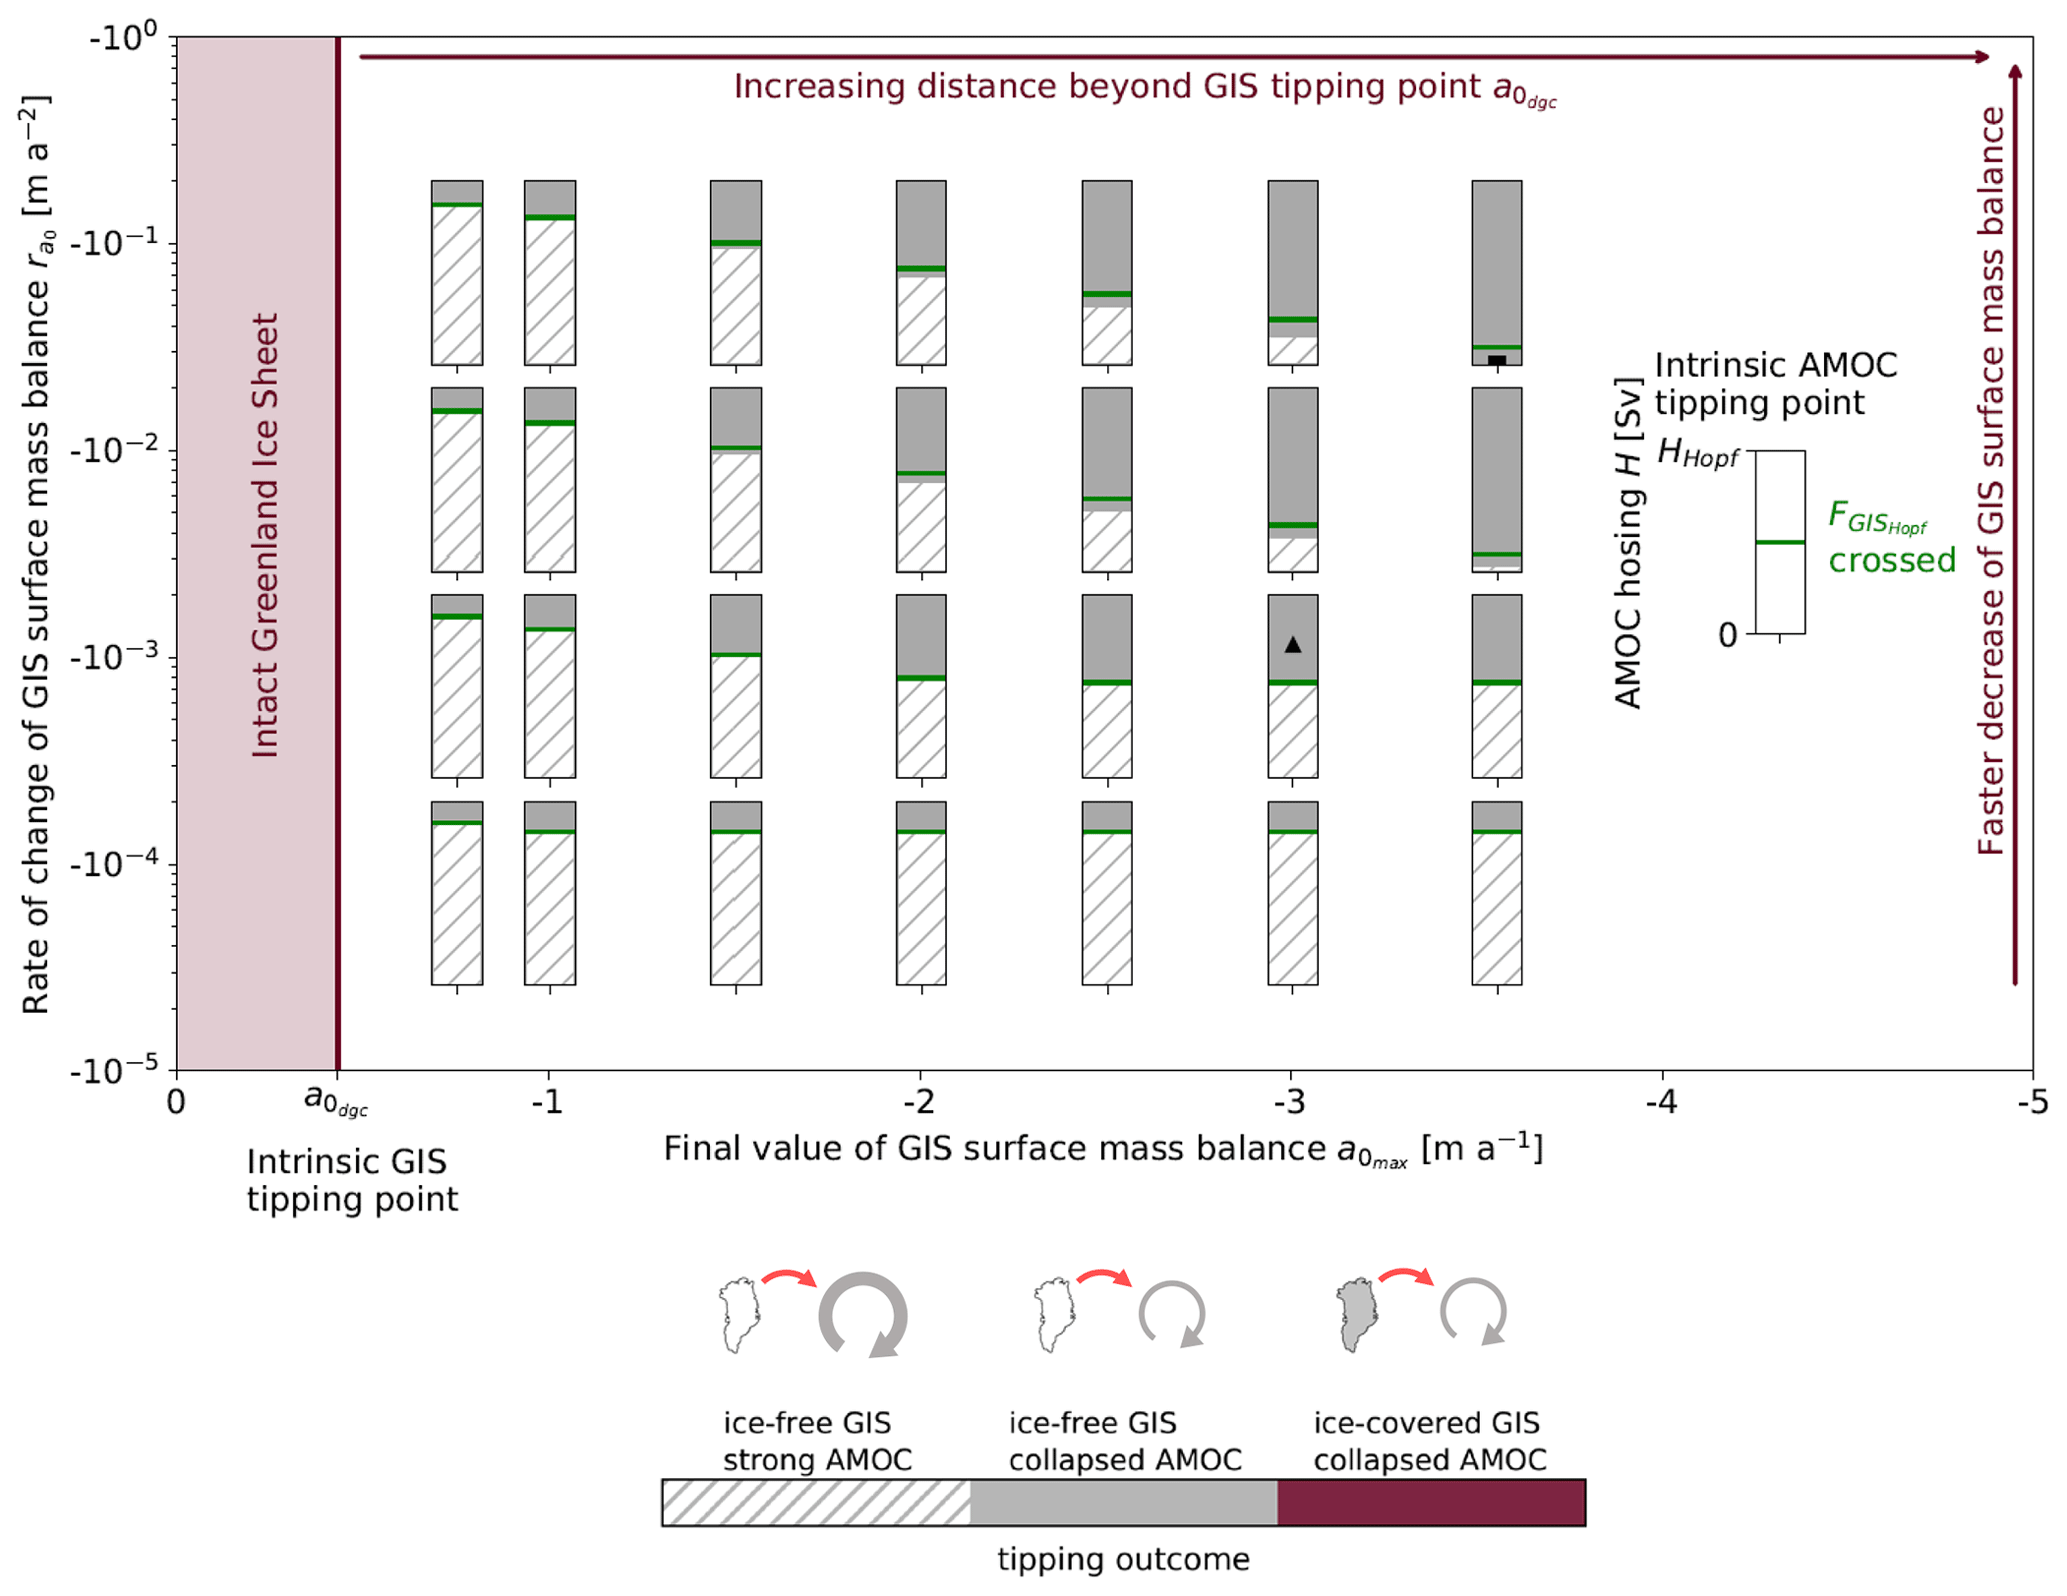
Figure 3Emergent dynamic regimes of the Greenland Ice Sheet and the Atlantic Meridional Overturning Circulation for unidirectional coupling. Tipping outcomes in response to a GIS decline by linearly decreasing its surface mass balance at the ground level (associated with progressing warming) with a ramping rate (varied along outer vertical axis) to a final value (varied along the outer horizontal axis) beyond the GIS deglaciation threshold. The AMOC hosing (vertical axis of bars) is kept constant between H=0 Sv and the AMOC hosing threshold HHopf. The respective tipping outcome is indicated by the colouring (grey: GIS deglaciation, pink: no GIS deglaciation; stripes additionally indicate the AMOC in its “on” state). The hosing above which the GIS freshwater flux threshold is crossed temporarily by the freshwater flux arising from the GIS decline is indicated by the green line within each bar. The black diamond and the black rectangle indicate the combination of tipping element drivers for the overshoot/bifurcation cascade and rate-induced cascade, respectively, as displayed in Fig. 2c and d.
4.3 Limited potential for stabilization with additional negative feedback
Finally, we explore the suggested stabilizing effect of the additional negative feedback from a relative cooling around Greenland with a weakened AMOC (Gaucherel and Moron, 2017) for the overall system behaviour.
Considering this negative feedback, the intrinsic tipping point of the Greenland Ice Sheet (that is, the critical threshold of the Greenland Ice Sheet without any coupling, see Klose et al., 2020, Fig. 4c and f, dashed grey) is replaced by two separate effective GIS deglaciation thresholds and (Fig. 4c and f, solid black), depending on the state of the AMOC. This is based on the theoretical foundations of cascading dynamics for linearly coupled driving (or “master”) and responding tipping elements, formulated in Klose et al. (2020): interactions shift the critical threshold of a responding system beyond which tipping is expected to lower or higher values compared to the intrinsic tipping point depending on the direction of coupling and the state of the driving tipping element, giving rise to the effective tipping point(s) of the responding system. Here, when considering the stabilizing effect of an AMOC weakening on the ice sheet (Eq. 12), the AMOC could be considered to be the driving system, while the ice sheet on Greenland would represent the responding system. Based on Eq. (12), which linearly relates the AMOC state in terms of the North Atlantic box temperature and the GIS surface mass balance, two deglaciation thresholds and may then be crossed with a decreasing surface mass balance in a warming climate: for a complete melting of the ice sheet on Greenland is obtained given that the AMOC resides and remains in its “on” state. Given that the AMOC resides in its “off” state, the ice sheet melts down completely for . These separate tipping thresholds suggest a limited decrease in the surface mass balance at the ground level to as well as a strong decrease in the surface mass balance at the ground level beyond the effective deglaciation threshold as different forcing scenarios.
Decreasing the surface mass balance emulating a warming climate beyond its effective threshold may not allow for a GIS stabilization (Fig. 4a and b). Instead, for an AMOC residing sufficiently close to its hosing threshold HHopf, a GIS deglaciation and tipping of the AMOC to the “off” state are detected (trajectory for H= 0.205 Sv in Fig. 4a and corresponding grey area in Fig. 4c). Given a lower freshwater hosing, the AMOC remains in its “on” state with the deglaciation of the Greenland Ice Sheet (trajectory for H= 0.16 Sv in Fig. 4b and corresponding dashed grey area in Fig. 4c). Hence, for a strong surface mass balance decrease, the potential dynamic regimes with Greenland becoming ice-free as well as a strong or a collapsed AMOC depending on the hosing (Fig. 4c) are comparable to the dynamics detected when neglecting the negative feedback (Fig. 3).
A limited decrease in the surface mass balance may allow for a GIS stabilization by the negative temperature feedback. As shown for a constant AMOC hosing H= 0.205 Sv in Fig. 4d, the AMOC leaves its “on” state and approaches its “off” state with an initial melting event of the ice sheet. With this AMOC tipping, a relative cooling of the North Atlantic box follows, given the assumed linear dependence of the North Atlantic box temperature on the AMOC overturning strength (Eq. 4). Eventually, the Greenland Ice Sheet does not continue melting after the initial melting event (see the colour coding in Fig. 4d). The deglaciation of Greenland is avoided and the ice sheet is stabilized for at least the time period covered in the simulations by the tipping AMOC in response to a pronounced initial melting. However, the AMOC is required to reside close to its hosing threshold for the GIS stabilization to unfold and additionally to undergo a critical transition itself as indicated by the stabilization corridor (Fig. 4f, pink corridor). For pathways of a (limited) surface mass balance decrease outside of this stabilization corridor, the ice sheet on Greenland melts down completely, while the AMOC remains in its “on” state (trajectory for H= 0.16 Sv in Fig. 4e and corresponding dashed grey area in Fig. 4f).
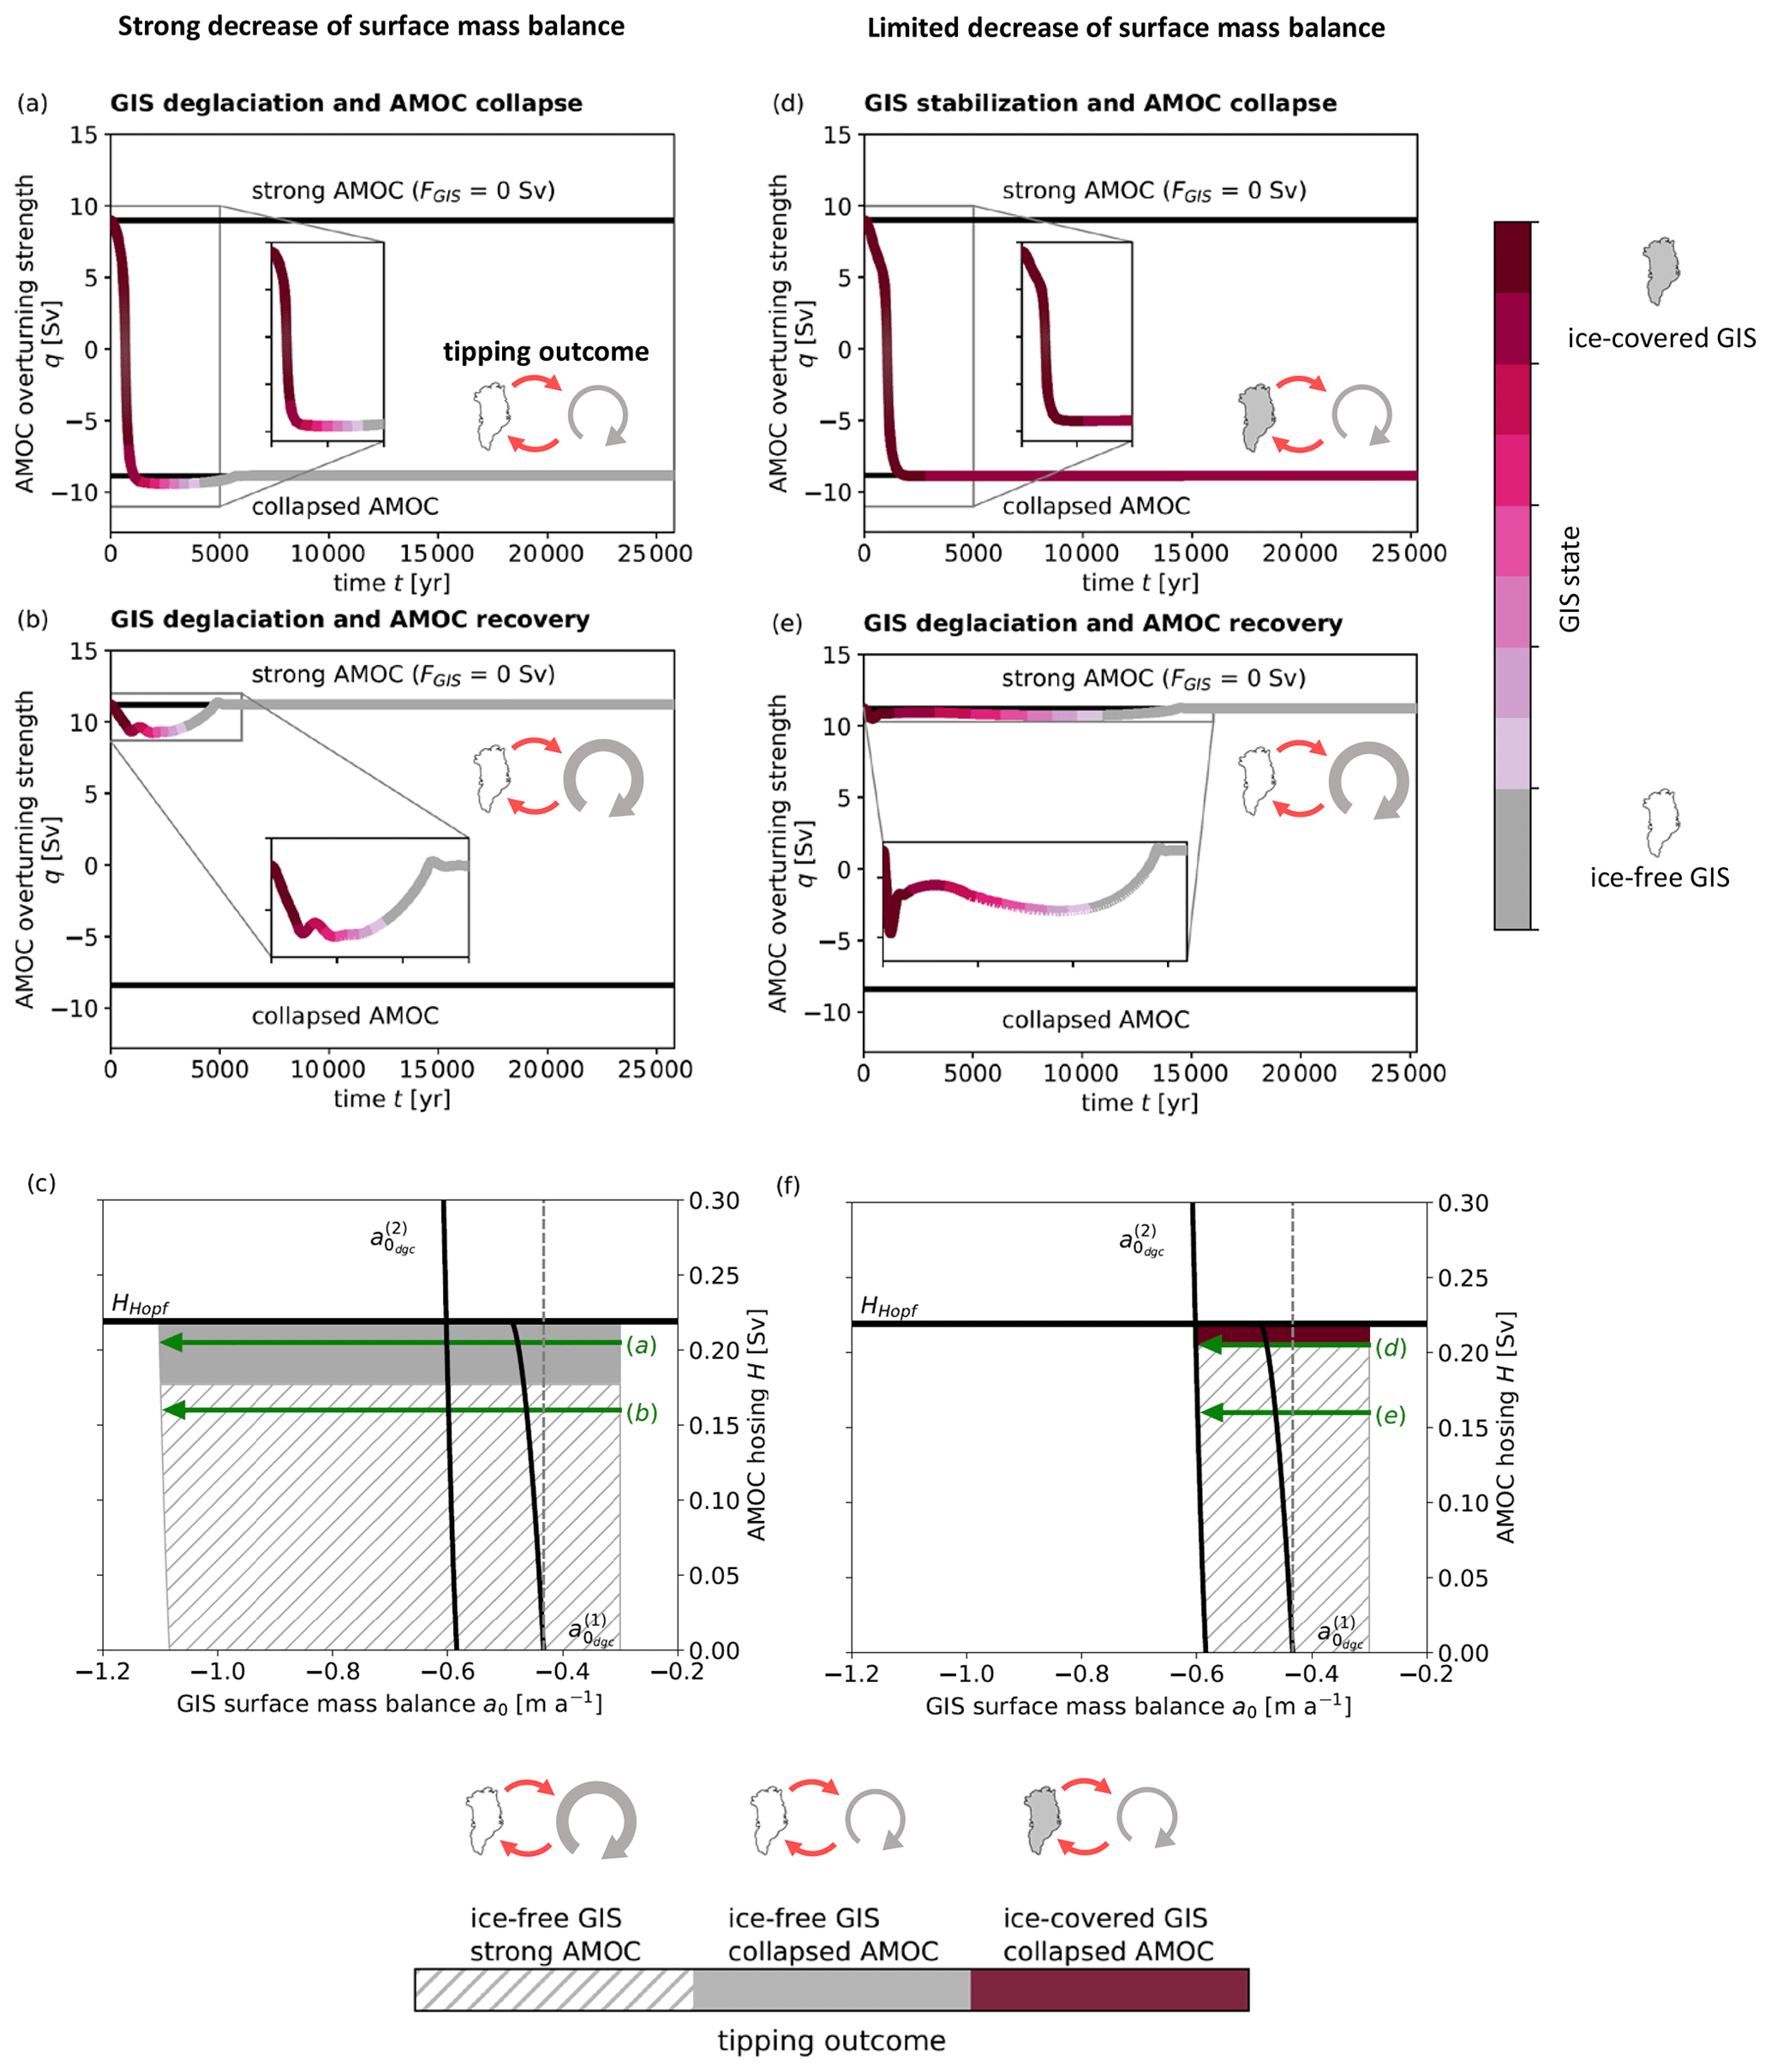
Figure 4Tipping dynamics for bidirectional coupling between the Greenland Ice Sheet and the Atlantic Meridional Overturning Circulation. Shown is the AMOC overturning strength, also taking into account the negative feedback via relative cooling around Greenland with a coupling strength doa= 2.857 for a ramping rate m a−2 with a strong decrease in the GIS surface mass balance (left column) and a limited decrease in the GIS surface mass balance (right column) under a constant hosing H. (a–b, d–e) Dynamics of the AMOC in terms of the overturning strength q over time. In addition, the GIS state in terms of the percentage of the initial GIS ice volume is shown in terms of the colouring declining from pink (100 %) to grey (0 %); see the colour bar on the right. The black lines indicate the “on” and the “off” state of the AMOC for the respective constant hosing without an additional freshwater input from Greenland (FGIS= 0 Sv). (c, f) Tipping outcomes of GIS and AMOC for pathways of surface mass balance decrease with distinct constant hosing H within the (a0,H) plane. The respective tipping outcome is indicated by the colouring (grey: GIS deglaciation, pink: no GIS deglaciation; stripes additionally indicate the AMOC in its “on” state; see the colour bar at the bottom of the figure). Solid black lines indicate the critical thresholds of the GIS and the AMOC. The intrinsic thresholds , which arise by neglecting the coupling via the temperature with a coupling strength doa= 0, are indicated as dashed grey lines.
In summary, qualitatively distinct cascading dynamics may arise from the interaction of the Greenland Ice Sheet and the Atlantic Meridional Overturning Circulation in a positive–negative feedback loop as suggested by a physically motivated conceptual model. The model captures the main positive feedback mechanisms for the potential tipping behaviour of both tipping elements as well as their interaction via ice loss from Greenland introduced into the North Atlantic and a net cooling around Greenland with an AMOC weakening. Accompanied by a temporary overshoot of its critical threshold by the freshwater flux from a deglaciation of the Greenland Ice Sheet, the AMOC may undergo a critical transition in an overshoot/bifurcation cascade. By contrast, tipping of the AMOC may occur without the exceedance of the GIS freshwater flux threshold in a rate-induced cascade given a fast onset of GIS decline. Finally, an unfolding of the negative feedback via a relative cooling around Greenland and a stabilization of the ice sheet is conditional on an AMOC collapse in our model. Our results stress that the interplay of applied external and corresponding internal forcing timescales relative to the response timescales of the tipping elements is of importance for interacting tipping elements of the climate system as theses timescales may eventually determine the tipping dynamics.
Accordingly, the occurrence of qualitatively distinct tipping dynamics and outcomes vary with the ice sheet disintegration time. This implies that safe pathways for the evolution of tipping element drivers preventing cascading tipping and their boundary to dangerous pathways involving cascades are controlled by rates of changes of the responsible control parameters in addition to their magnitude. Hence, our model qualitatively suggests that it is not only necessary to stay below critical thresholds in terms of the magnitude of some environmental condition (Schellnhuber et al., 2016) as intended by the Paris Agreement (UNFCCC, 2015) to hinder tipping cascades. In addition, it is required to respect safe rates of environmental change to mitigate domino effects as concluded previously for individual tipping elements (Ashwin et al., 2012; Luke and Cox, 2011; Petschel-Held et al., 1999; Stocker and Schmittner, 1997; Wieczorek et al., 2011; Schoenmakers and Feudel, 2021) but not yet incorporated in management strategies to maintain the resilience of the Earth system (Rockström et al., 2009; Steffen et al., 2015; UNFCCC, 2015; Rockström et al., 2023).
The Greenland Ice Sheet is at risk of crossing its tipping point with >1.5 °C global warming (Robinson et al., 2012; Armstrong McKay et al., 2022). At present, the ice sheet's mass loss is accelerating (Shepherd et al., 2020), and there is limited evidence that its western parts may already be approaching a critical transition (Boers and Rypdal, 2021). While the crossing of the critical temperature threshold itself does not imply a fast collapse, the time needed to melt the ice sheet on Greenland decreases with a higher temperature level above its tipping point (as qualitatively obtained with our model as well as quantified using a three-dimensional polythermal ice sheet model by Robinson et al., 2012; Bochow et al., 2023). As a consequence, the future level of warming controls the rates of mass loss from Greenland even if having transgressed the threshold. It may, thereby, among others, be decisive for its impacts on cascading tipping of the AMOC.
In addition, the fate of the AMOC in response to freshwater input from the Greenland Ice Sheet is strongly dependent on the AMOC position relative to the hosing threshold in our model. Given that the AMOC remains relatively far from its hosing threshold, it may remain in its currently attained strong state. However, shifting the AMOC towards its hosing threshold, e.g. with increasing precipitation in the North Atlantic, could bring it into a region where freshwater from a GIS decline may induce a collapse. This collapse may be triggered either by overshooting the respective tipping point or with a fast onset of GIS melting. This suggests that AMOC weakening in hosing experiments and the inferred risk of an AMOC collapse with ongoing global warming have to be evaluated from a dynamical systems point of view (see Weijer et al., 2019) and with respect to the distance of the present-day AMOC from its tipping point, which is still relatively unknown (e.g. Armstrong McKay et al., 2022). At the same time, the AMOC may already be shifted closer to its tipping point: a decline of 15 % in the strength of the overturning circulation since the mid-twentieth century is found in the observed sea surface temperature trend (Caesar et al., 2018), and it is suggested that the current AMOC state might lose stability (Boers, 2021; van Westen et al., 2024).
Utilizing idealized (Dekker et al., 2018; Klose et al., 2020; Wunderling et al., 2021) or physically motivated conceptual representations of climatic tipping elements (such as by Dekker et al., 2018; Lohmann et al., 2021, and as for the Greenland Ice Sheet and the AMOC here) allows for a qualitative understanding of possible cascading dynamics in the Earth's climate system arising from tipping element interactions on long timescales. At the same time, conclusions to be drawn are limited because of simplifications in the representation of the individual tipping elements, e.g. by a one-dimensional ice sheet on a flat bed, and in their coupling, e.g. by the approximation of freshwater fluxes. Further extending the presented conceptual model capturing the interactions of the GIS and the AMOC by an evolution of ocean box temperatures or by adding climatic tipping elements and their respective interactions may enable a probabilistic assessment of the risk of cascading behaviour in the network of tipping elements under global warming taking into account uncertainties. For example, an additional freshwater flux into the Southern Ocean from a retreat of the West Antarctic Ice Sheet may prevent a collapse of the AMOC despite a deglaciation of Greenland under certain conditions as suggested recently by a model of comparable complexity (Sinet et al., 2023). The stabilizing effect of a net cooling around Greenland with an AMOC weakening, however, is not included in the conceptual model of Sinet et al. (2023). To the end, we are still lacking quantitative insights on (1) the position of climatic tipping elements under current climate conditions with respect to their tipping points, (2) the strength of their interactions and, subsequently, (3) the role of tipping cascades in the future evolution of the Earth system, in particular under global warming. These may be obtained given an ongoing improvement of climate models e.g. by including ice sheet dynamics (De Rydt and Gudmundsson, 2016; Gierz et al., 2020; Kreuzer et al., 2021; Madsen et al., 2022). Finally, linking modelling approaches to modern but also paleoclimate data (Thomas et al., 2020) may help to reduce uncertainties in the emergence of tipping cascades in the past and in the future.
Relevant code for this research work has been archived within the Zenodo repository: https://doi.org/10.5281/zenodo.10807865 (Klose, 2024).
The supplement related to this article is available online at: https://doi.org/10.5194/esd-15-635-2024-supplement.
AKK, JFD, UF and RW conceived of and designed the study. AKK performed the analysis, led the writing of the paper, and created figures and tables. JFD, UF and RW provided feedback on the analysis and input to the paper.
One of the (co-)authors is a member of the editorial board of Earth System Dynamics. The peer-review process was guided by an independent editor, and the authors also have no other competing interests to declare.
Publisher's note: Copernicus Publications remains neutral with regard to jurisdictional claims made in the text, published maps, institutional affiliations, or any other geographical representation in this paper. While Copernicus Publications makes every effort to include appropriate place names, the final responsibility lies with the authors.
This article is part of the special issue “Tipping points in the Anthropocene”. It is a result of the “Tipping Points: From Climate Crisis to Positive Transformation” international conference hosted by the Global Systems Institute (GSI) and University of Exeter (12–14 September 2022), as well as the associated creation of a Tipping Points Research Alliance by GSI and the Potsdam Institute for Climate Research, Exeter, Great Britain, 12–14 September 2022.
This work has been performed in the context of the FutureLab on Earth Resilience in the Anthropocene at the Potsdam Institute for Climate Impact Research. The authors gratefully acknowledge the European Regional Development Fund (ERDF), the German Federal Ministry of Education and Research (BMBF) and the Land Brandenburg for supporting this project by providing resources on the high-performance computer system at the Potsdam Institute for Climate Impact Research. Ann Kristin Klose and Ricarda Winkelmann acknowledge support by the European Union's Horizon 2020 research and innovation programme under grant agreement no. 820575 (TiPACCs) and no. 869304 (PROTECT). Jonathan F. Donges is grateful for financial support from the Leibniz Association (project DominoES), the European Research Council (ERC) under the European Union's Horizon 2020 Research and Innovation Programme (ERC grant agreement no. 743080 ERA), and BMBF within the framework “PIK Change” (grant no. 01LS2001A). Ulrike Feudel acknowledges support from the European Union's Marie Sklodowska–Curie Innovation Training Network under grant agreement no. 956170 (Critical Earth). Ann Kristin Klose thanks Maria Zeitz and Ronja Reese for helpful discussions.
This research has been supported by Horizon 2020 (grant nos. 820575 and 869304), the European Research Council, H2020 European Research Council (grant no. 743080), the Bundesministerium für Bildung und Forschung (grant no. 01LS2001A), the Leibniz-Gemeinschaft (grant no. project DominoES), and the H2020 Marie Skłodowska-Curie Actions (grant no. 956170).
The publication of this article was funded by the Open Access Fund of the Leibniz Association.
This paper was edited by Gabriele Messori and reviewed by three anonymous referees.
Abraham, R., Keith, A., Koebbe, M., and Mayer-Kress, G.: Computational unfolding of double–cusp models of opinion formation, Int. J. Bifurcat. Chaos, 1, 417–430, https://doi.org/10.1142/S0218127491000324, 1991. a
Alkhayuon, H., Ashwin, P., Jackson, L. C., Quinn, C., and Wood, R. A.: Basin bifurcations, oscillatory instability and rate–induced thresholds for Atlantic meridional overturning circulation in a global oceanic box model, P. Roy. Soc. A, 475, 20190051, https://doi.org/10.1098/rspa.2019.0051, 2019. a, b, c, d, e, f
Armstrong McKay, D. I., Staal, A., Abrams, J. F., Winkelmann, R., Sakschewski, B., Loriani, S., Fetzer, I., Cornell, S. E., Rockström, J., and Lenton, T. M.: Exceeding 1.5°C global warming could trigger multiple climate tipping points, Science, 377, eabn7950, https://doi.org/10.1126/science.abn7950, 2022. a, b, c, d
Aschwanden, A., Fahnestock, M. A., Truffer, M., Brinkerhoff, D. J., Hock, R., Khroulev, C., Mottram, R., and Khan, S. A.: Contribution of the Greenland Ice Sheet to sea level over the next millennium, Sci. Adv., 5, eaav9396, https://doi.org/10.1126/sciadv.aav9396, 2019. a
Ashwin, P., Wieczorek, S., Vitolo, R., and Cox, P.: Tipping points in open systems: bifurcation, noise–induced and rate–dependent examples in the climate system, Philos. T. Roy. Soc. A, 370, 1166–1184, https://doi.org/10.1098/rsta.2011.0306, 2012. a, b, c, d, e, f
Bakker, P., Schmittner, A., Lenaerts, J. T. M., Abe-Ouchi, A., Bi, D., van den Broeke, M. R., Chan, W.-L., Hu, A., Beadling, R. L., Marsland, S. J., Mernild, S. H., Saenko, O. A., Swingedouw, D., Sullivan, A., and Yin, J.: Fate of the Atlantic Meridional Overturning Circulation: Strong decline under continued warming and Greenland melting, Geophys. Res. Lett., 43, 12252–12260, https://doi.org/10.1002/2016GL070457, 2016. a
Bamber, J. L., van den Broeke, M., Ettema, J., Lenaerts, J., and Rignot, E.: Recent large increases in freshwater fluxes from Greenland into the North Atlantic, Geophys. Res. Lett., 39, L19501, https://doi.org/10.1029/2012GL052552, 2012. a, b, c
Bamber, J. L., Tedstone, A. J., King, M. D., Howat, I. M., Enderlin, E. M., van den Broeke, M. R., and Noel, B.: Land ice freshwater budget of the Arctic and North Atlantic Oceans: 1. Data, methods, and results, J. Geophys. Res.-Oceans, 123, 1827–1837, https://doi.org/10.1002/2017JC013605, 2018. a, b, c
Barker, S. and Knorr, G.: A paleo–perspective on the AMOC as a tipping element, PAGES Magazine, 24, 14–15, https://doi.org/10.22498/pages.24.1.14, 2016. a
Bochow, N., Poltronieri, A., Robinson, A., Montoya, M., Rypdal, M., and Boers, N.: Overshooting the critical threshold for the Greenland ice sheet, Nature, 622, 528–536, 2023. a, b
Boers, N.: Observation–based early–warning signals for a collapse of the Atlantic Meridional Overturning Circulation, Nat. Clim. Change, 11, 680–688, https://doi.org/10.1038/s41558-021-01097-4, 2021. a, b, c
Boers, N. and Rypdal, M.: Critical slowing down suggests that the western Greenland Ice Sheet is close to a tipping point, P. Natl. Acad. Sci. USA, 118, e2024192118, https://doi.org/10.1073/pnas.2024192118, 2021. a, b, c
Brovkin, V., Brook, E., Williams, J. W., Bathiany, S., Lenton, T. M., Barton, M., DeConto, R. M., Donges, J. F., Ganopolski, A., McManus, J., Praetorius, S., de Vernal, A., Abe-Ouchi, A., Cheng, H., Claussen, M., Crucifix, M., Gallopin, G., Iglesias, V., Kaufman, D. S., Kleinen, T., Lambert, F., van der Leeuw, S., Liddy, H., Loutre, M.-F., McGee, D., Rehfeld, K., Rhodes, R., Seddon, A. W. R., Trauth, M. H., Vanderveken, L., and Yu, Z.: Past abrupt changes, tipping points and cascading impacts in the Earth system, Nat. Geosci., 14, 550–558, https://doi.org/10.1038/s41561-021-00790-5, 2021. a, b, c
Brummitt, C. D., Barnett, G., and D'Souza, R. M.: Coupled catastrophes: sudden shifts cascade and hop among interdependent systems, J. R. Soc. Interface, 12, 20150712, https://doi.org/10.1098/rsif.2015.0712, 2015. a
Caesar, L., Rahmstorf, S., Robinson, A., Feulner, G., and Saba, V.: Observed fingerprint of a weakening Atlantic Ocean overturning circulation, Nature, 556, 191–196, 2018. a, b, c, d
Caesar, L., McCarthy, G., Thornalley, D., Cahill, N., and Rahmstorf, S.: Current Atlantic meridional overturning circulation weakest in last millennium, Nat. Geosci., 14, 118–120, https://doi.org/10.1038/s41561-021-00699-z, 2021. a
Christ, A. J., Bierman, P. R., Schaefer, J. M., Dahl-Jensen, D., Steffensen, J. P., Corbett, L. B., Peteet, D. M., Thomas, E. K., Steig, E. J., Rittenour, T. M., Tison, J.-L., Blard, P.-H., Perdrial, N., Dethier, D. P., Lini, A., Hidy, A. J., Caffee, M. W., and Southon, J.: A multimillion–year–old record of Greenland vegetation and glacial history preserved in sediment beneath 1.4 km of ice at Camp Century, P. Natl. Acad. Sci. USA, 118, e2021442118, https://doi.org/10.1073/pnas.2021442118, 2021. a
De Rydt, J. and Gudmundsson, G. H.: Coupled ice shelf–ocean modeling and complex grounding line retreat from a seabed ridge, J. Geophys. Res.-Earth, 121, 865–880, https://doi.org/10.1002/2015JF003791, 2016. a
Dekker, M. M., von der Heydt, A. S., and Dijkstra, H. A.: Cascading transitions in the climate system, Earth Syst. Dynam., 9, 1243–1260, https://doi.org/10.5194/esd-9-1243-2018, 2018. a, b, c, d, e
Ditlevsen, P. D. and Johnsen, S. J.: Tipping points: early warning and wishful thinking, Geophys. Res. Lett., 37, L19703, https://doi.org/10.1029/2010GL044486, 2010. a
Driesschaert, E., Fichefet, T., Goosse, H., Huybrechts, P., Janssens, I., Mouchet, A., Munhoven, G., Brovkin, V., and Weber, S. L.: Modeling the influence of Greenland ice sheet melting on the Atlantic meridional overturning circulation during the next millennia, Geophys. Res. Lett., 34, L10707, https://doi.org/10.1029/2007GL029516, 2007. a, b
Dutton, A., Carlson, A. E., Long, A. J., Milne, G. A., Clark, P. U., DeConto, R., Horton, B. P., Rahmstorf, S., and Raymo, M. E.: Sea–level rise due to polar ice-sheet mass loss during past warm periods, Science, 349, aaa4019, https://doi.org/10.1126/science.aaa4019, 2015. a
Fettweis, X., Franco, B., Tedesco, M., van Angelen, J. H., Lenaerts, J. T. M., van den Broeke, M. R., and Gallée, H.: Estimating the Greenland ice sheet surface mass balance contribution to future sea level rise using the regional atmospheric climate model MAR, The Cryosphere, 7, 469–489, https://doi.org/10.5194/tc-7-469-2013, 2013. a
Fichefet, T., Poncin, C., Goosse, H., Huybrechts, P., Janssens, I., and Le Treut, H.: Implications of changes in freshwater flux from the Greenland ice sheet for the climate of the 21st century, Geophys. Res. Lett., 30, 1911, https://doi.org/10.1029/2003GL017826, 2003. a, b, c, d
Gaucherel, C. and Moron, V.: Potential stabilizing points to mitigate tipping point interactions in Earth's climate, Int. J. Climatol., 37, 399–408, https://doi.org/10.1002/joc.4712, 2017. a, b
Gierz, P., Lohmann, G., and Wei, W.: Response of Atlantic overturning to future warming in a coupled atmosphere–ocean–ice sheet model, Geophys. Res. Lett., 42, 6811–6818, https://doi.org/10.1002/2015GL065276, 2015. a, b
Gierz, P., Ackermann, L., Rodehacke, C. B., Krebs-Kanzow, U., Stepanek, C., Barbi, D., and Lohmann, G.: Simulating interactive ice sheets in the multi-resolution AWI-ESM 1.2: A case study using SCOPE 1.0, Geosci. Model Dev. Discuss. [preprint], https://doi.org/10.5194/gmd-2020-159, 2020. a
Golledge, N. R., Keller, E. D., Gomez, N., Naughten, K. A., Bernales, J., Trusel, L. D., and Edwards, T. L.: Global environmental consequences of twenty–first–century ice–sheet melt, Nature, 566, 65–72, https://doi.org/10.1038/s41586-019-0889-9, 2019. a, b, c
Greve, R. and Blatter, H.: Dynamics of ice sheets and glaciers, Advances in Geophysical and Environmental Mechanics and Mathematics, Springer Berlin Heidelberg, Berlin, Heidelberg, https://doi.org/10.1007/978-3-642-03415-2, 2009. a
Halekotte, L. and Feudel, U.: Minimal fatal shocks in multistable complex networks, Sci. Rep., 10, 11783, https://doi.org/10.1038/s41598-020-68805-6, 2020. a, b
Hindmarsh, R. C.: Notes on basic glaciological computational methods and algorithms, Continuum Mechanics and Applications in Geophysics and the Environment, 222–249, https://doi.org/10.1007/978-3-662-04439-1_13, 2001. a
Hu, A., Meehl, G. A., Han, W., and Yin, J.: Transient response of the MOC and climate to potential melting of the Greenland Ice Sheet in the 21st century, Geophys. Res. Lett., 36, L10707, https://doi.org/10.1029/2009GL037998, 2009. a, b, c
Hutter, K.: Theoretical glaciology: material science of ice and the mechanics of glaciers and ice sheets, Springer, https://doi.org/10.1007/978-94-015-1167-4, 1983. a
Jackson, L. C. and Wood, R. A.: Hysteresis and Resilience of the AMOC in an Eddy–Permitting GCM, Geophys. Res. Lett., 45, 8547–8556, https://doi.org/10.1029/2018GL078104, 2018. a, b
Jackson, L. C., Kahana, R., Graham, T., Ringer, M. A., Woollings, T., Mecking, J. V., and Wood, R. A.: Global and European climate impacts of a slowdown of the AMOC in a high resolution GCM, Clim. Dynam., 45, 3299–3316, https://doi.org/10.1007/s00382-015-2540-2, 2015. a, b, c, d
Jouvet, G., Rappaz, J., Bueler, E., and Blatter, H.: Existence and stability of steady-state solutions of the shallow-ice-sheet equation by an energy-minimization approach, J. Glaciol., 57, 345–354, 2011. a
Jungclaus, J. H., Haak, H., Esch, M., Roeckner, E., and Marotzke, J.: Will Greenland melting halt the thermohaline circulation?, Geophys. Res. Lett., 33, L17708, https://doi.org/10.1029/2006GL026815, 2006. a, b, c
Kaszás, B., Feudel, U., and Tél, T.: Tipping phenomena in typical dynamical systems subjected to parameter drift, Sci. Rep., 9, 8654, https://doi.org/10.1038/s41598-019-44863-3, 2019. a
King, M. D., Howat, I. M., Candela, S. G., Noh, M. J., Jeong, S., Noël, B. P., van den Broeke, M. R., Wouters, B., and Negrete, A.: Dynamic ice loss from the Greenland Ice Sheet driven by sustained glacier retreat, Commun. Earth Environ., 1, 1–7, https://doi.org/10.1038/s43247-020-0001-2, 2020. a
Klose, A. K.: TippingInteractions_GIS-AMOC, Zenodo [code], https://doi.org/10.5281/zenodo.10807865, 2024. a
Klose, A. K., Karle, V., Winkelmann, R., and Donges, J. F.: Emergence of cascading dynamics in interacting tipping elements of ecology and climate, Roy. Soc. Open Sci., 7, 200599, https://doi.org/10.1098/rsos.200599, 2020. a, b, c, d
Klose, A. K., Wunderling, N., Winkelmann, R., and Donges, J. F.: What do we mean, “tipping cascade”?, Environ. Res. Lett., 16, 125011, https://doi.org/10.1088/1748-9326/ac3955, 2021. a, b
Kreuzer, M., Reese, R., Huiskamp, W. N., Petri, S., Albrecht, T., Feulner, G., and Winkelmann, R.: Coupling framework (1.0) for the PISM (1.1.4) ice sheet model and the MOM5 (5.1.0) ocean model via the PICO ice shelf cavity model in an Antarctic domain, Geosci. Model Dev., 14, 3697–3714, https://doi.org/10.5194/gmd-14-3697-2021, 2021. a
Kriegler, E., Hall, J. W., Held, H., Dawson, R., and Schellnhuber, H. J.: Imprecise probability assessment of tipping points in the climate system, P. Natl. Acad. Sci. USA, 106, 5041–5046, https://doi.org/10.1073/pnas.0809117106, 2009. a, b, c
Krönke, J., Wunderling, N., Winkelmann, R., Staal, A., Stumpf, B., Tuinenburg, O. A., and Donges, J. F.: Dynamics of tipping cascades on complex networks, Phys. Rev. E, 101, 042311, https://doi.org/10.1103/PhysRevE.101.042311, 2020. a
Lenton, T. M., Held, H., Kriegler, E., Hall, J. W., Lucht, W., Rahmstorf, S., and Schellnhuber, H. J.: Tipping elements in the Earth's climate system, P. Natl. Acad. Sci. USA, 105, 1786–1793, https://doi.org/10.1073/pnas.0705414105, 2008. a
Lenton, T. M., Rockström, J., Gaffney, O., Rahmstorf, S., Richardson, K., Steffen, W., and Schellnhuber, H. J.: Climate tipping points–too risky to bet against, Nature, 575, 592–595, https://doi.org/10.1038/d41586-019-03595-0, 2019. a
Levermann, A. and Winkelmann, R.: A simple equation for the melt elevation feedback of ice sheets, The Cryosphere, 10, 1799–1807, https://doi.org/10.5194/tc-10-1799-2016, 2016. a, b, c, d
Levermann, A., Bamber, J. L., Drijfhout, S., Ganopolski, A., Haeberli, W., Harris, N. R., Huss, M., Krüger, K., Lenton, T. M., Lindsay, R. W., Notz, D., Wadhams, P., and Weber, S.: Potential climatic transitions with profound impact on Europe, Climatic Change, 110, 845–878, https://doi.org/10.1007/s10584-011-0126-5, 2012. a
Liu, W., Xie, S.-P., Liu, Z., and Zhu, J.: Overlooked possibility of a collapsed Atlantic Meridional Overturning Circulation in warming climate, Sci. Adv., 3, e1601666, https://doi.org/10.1126/sciadv.1601666, 2017. a
Lohmann, J. and Ditlevsen, P. D.: Risk of tipping the overturning circulation due to increasing rates of ice melt, P. Natl. Acad. Sci. USA, 118, e2017989118, https://doi.org/10.1073/pnas.2017989118, 2021. a, b, c, d
Lohmann, J., Castellana, D., Ditlevsen, P. D., and Dijkstra, H. A.: Abrupt climate change as a rate-dependent cascading tipping point, Earth Syst. Dynam., 12, 819–835, https://doi.org/10.5194/esd-12-819-2021, 2021. a, b, c
Lucarini, V. and Stone, P. H.: Thermohaline circulation stability: A box model study. Part I: Uncoupled model, J. Climate, 18, 501–513, 2005. a
Luke, C. M. and Cox, P. M.: Soil carbon and climate change: from the Jenkinson effect to the compost–bomb instability, Eur. J. Soil Sci., 62, 5–12, https://doi.org/10.1111/j.1365-2389.2010.01312.x, 2011. a
Lynch-Stieglitz, J.: The Atlantic Meridional Overturning Circulation and Abrupt Climate Change, Annu. Rev. Mar. Sci., 9, 83–104, https://doi.org/10.1146/annurev-marine-010816-060415, 2017. a, b
Madsen, M., Yang, S., Aðalgeirsdóttir, G., Svendsen, S., Rodehacke, C., and Ringgaard, I.: The role of an interactive Greenland ice sheet in the coupled climate-ice sheet model EC-Earth-PISM, Clim. Dynam., 59, 1189–1211, 2022. a, b, c, d, e, f
Mikolajewicz, U., Vizcaino, M., Jungclaus, J., and Schurgers, G.: Effect of ice sheet interactions in anthropogenic climate change simulations, Geophys. Res. Lett., 34, L18706, https://doi.org/10.1029/2007GL031173, 2007. a, b, c
Moffa-Sánchez, P., Moreno-Chamarro, E., Reynolds, D.J., Ortega, P., Cunningham, L., Swingedouw, D., Amrhein, D. E., Halfar, J., Jonkers, L., Jungclaus, J. H., Perner, K., Wanamaker, A., and Yeager, S.: Variability in the northern North Atlantic and Arctic oceans across the last two millennia: A review, Paleoceanogr. Paleocl., 34, 1399–1436, 2019. a
Morlighem, M., Williams, C. N., Rignot, E., An, L., Arndt, J. E., Bamber, J. L., Catania, G., Chauché, N., Dowdeswell, J. A., Dorschel, B., Fenty, I., Hogan, K., Howat, I., Hubbard, A., Jakobsson, M., Jordan, T. M., Kjeldsen, K. K., Millan, R., Mayer, L., Mouginot, J., Noël, B. P. Y., O'Cofaigh, C., Palmer, S., Rysgaard, S., Seroussi, H., Siegert, M. J., Slabon, P., Straneo, F., van den Broeke, M. R., Weinrebe, W., Wood, M., and Zinglersen, K. B.: BedMachine v3: Complete bed topography and ocean bathymetry mapping of Greenland from multibeam echo sounding combined with mass conservation, Geophys. Res. Lett., 44, 11–051, https://doi.org/10.1002/2017GL074954, 2017. a
Mouginot, J., Rignot, E., Bjørk, A. A., Van den Broeke, M., Millan, R., Morlighem, M., Noël, B., Scheuchl, B., and Wood, M.: Forty–six years of Greenland Ice Sheet mass balance from 1972 to 2018, P. Natl. Acad. Sci. USA, 116, 9239–9244, https://doi.org/10.1073/pnas.1904242116, 2019. a
Oerlemans, J.: Some basic experiments with a vertically-integrated ice sheet model, Tellus, 33, 1–11, 1981. a
Petschel-Held, G., Schellnhuber, H.-J., Bruckner, T., Toth, F. L., and Hasselmann, K.: The tolerable windows approach: theoretical and methodological foundations, Climatic Change, 41, 303–331, https://doi.org/10.1023/A:1005487123751, 1999. a
Rahmstorf, S.: Bifurcations of the Atlantic thermohaline circulation in response to changes in the hydrological cycle, Nature, 378, 145–149, https://doi.org/10.1038/378145a0, 1995. a, b
Rahmstorf, S.: On the freshwater forcing and transport of the Atlantic thermohaline circulation, Clim. Dynam., 12, 799–811, https://doi.org/10.1007/s003820050144, 1996. a, b, c
Rahmstorf, S.: Ocean circulation and climate during the past 120,000 years, Nature, 419, 207–214, https://doi.org/10.1038/nature01090, 2002. a
Rahmstorf, S., Box, J. E., Feulner, G., Mann, M. E., Robinson, A., Rutherford, S., and Schaffernicht, E. J.: Exceptional twentieth–century slowdown in Atlantic Ocean overturning circulation, Nat. Clim. Change, 5, 475–480, https://doi.org/10.1038/nclimate2554, 2015. a, b
Ridley, J. K., Huybrechts, P., Gregory, J. M., and Lowe, J. A.: Elimination of the Greenland Ice Sheet in a High CO2 Climate, J. Climate, 18, 3409–3427, 2005. a, b
Ritchie, P. D., Clarke, J. J., Cox, P. M., and Huntingford, C.: Overshooting tipping point thresholds in a changing climate, Nature, 592, 517–523, https://doi.org/10.1038/s41586-021-03263-2, 2021. a
Ritz, S. P., Stocker, T. F., Grimalt, J. O., Menviel, L., and Timmermann, A.: Estimated strength of the Atlantic overturning circulation during the last deglaciation, Nat. Geosci., 6, 208–212, https://doi.org/10.1038/ngeo1723, 2013. a
Robinson, A., Calov, R., and Ganopolski, A.: Multistability and critical thresholds of the Greenland ice sheet, Nat. Clim. Change, 2, 429–432, https://doi.org/10.1038/nclimate1449, 2012. a, b, c, d, e, f, g, h
Rocha, J. C., Peterson, G., Bodin, Ö., and Levin, S.: Cascading regime shifts within and across scales, Science, 362, 1379–1383, https://doi.org/10.1126/science.aat7850, 2018. a
Rockström, J., Steffen, W., Noone, K., Persson, Å., Chapin, F. S., Lambin, E. F., Lenton, T. M., Scheffer, M., Folke, C., Schellnhuber, H. J., Nykvist, B., de Wit, C. A., Hughes, T., van der Leeuw, S., Rodhe, H., Sörlin, S., Snyder, P. K., Costanza, R., Svedin, U., Falkenmark, M., Karlberg, L., Corell, R. W., Fabry, V. J., Hansen, J., Walker, B., Liverman, D., Richardson, K., Crutzen, P., and Foley, J. A.: A safe operating space for humanity, Nature, 461, 472–475, https://doi.org/10.1038/461472a, 2009. a
Rockström, J., Gupta, J., Qin, D., Lade, S. J., Abrams, J. F., Andersen, L., Armstrong McKay, D. I., Bai, X., Bala, G., Bunn, S. E., Ciobanu, D., DeClerck, F., Ebi, K., Gifford, L., Gordon, C., Hasan, S., Kanie, N., Lenton, T. M., Loriani, S., Liverman, D. M., Mohamed, A., Nakicenovic, N., Obura, D., Ospina, D., Prodani, K., Rammelt, C., Sakschewski, B., Scholtens, J., Stewart-Koster, B., Tharammal, T., van Vuuren, D., Verburg, P. H., Winkelmann, R., Zimm, C., Bennett, E. M., Bringezu, S., Broadgate, W., Green, P. A., Huang, L., Jacobson, L., Ndehedehe, C., Pedde, S., Rocha, J., Scheffer, M., Schulte-Uebbing, L., de Vries, W., Xiao, C., Xu, C., Xu, X., Zafra-Calvo, N., and Zhang, X.: Safe and just Earth system boundaries, Nature, 619, 102–111, https://doi.org/10.1038/s41586-023-06083-8, 2023. a
Schaefer, J. M., Finkel, R. C., Balco, G., Alley, R. B., Caffee, M. W., Briner, J. P., Young, N. E., Gow, A. J., and Schwartz, R.: Greenland was nearly ice–free for extended periods during the Pleistocene, Nature, 540, 252–255, https://doi.org/10.1038/nature20146, 2016. a
Schellnhuber, H. J., Rahmstorf, S., and Winkelmann, R.: Why the right climate target was agreed in Paris, Nat. Clim. Change, 6, 649–653, https://doi.org/10.1038/nclimate3013, 2016. a
Schoenmakers, S. and Feudel, U.: A resilience concept based on system functioning: A dynamical systems perspective, Chaos: An Interdisciplinary J. Nonlinear Sci., 31, 053126, https://doi.org/10.1063/5.0042755, 2021. a, b
Shepherd, A., Ivins, E., Rignot, E., Smith, B., van den Broeke, M., Velicogna, I., Whitehouse, P., Briggs, K., Joughin, I., Krinner, G., Nowicki, S., Payne, T., Scambos, T., Schlegel, N., A, G., Agosta, C., Ahlstrøm, A., Babonis, G., Barletta, V. R., Bjørk, A. A., Blazquez, A., Bonin, J., Colgan, W., Csatho, B., Cullather, R., Engdahl, M. E., Felikson, D., Fettweis, X., Forsberg, R., Hogg, A. E., Gallee, H., Gardner, A., Gilbert, L., Gourmelen, N., Groh, A., Gunter, B., Hanna, E., Harig, C., Helm, V., Horvath, A., Horwath, M., Khan, S., Kjeldsen, K. K., Konrad, H., Langen, P. L., Lecavalier, B., Loomis, B., Luthcke, S., McMillan, M., Melini, D., Mernild, S., Mohajerani, Y., Moore, P., Mottram, R., Mouginot, J., Moyano, G., Muir, A., Nagler, T., Nield, G., Nilsson, J., Noël, B., Otosaka, I., Pattle, M. E., Peltier, W. R., Pie, N., Rietbroek, R., Rott, H., Sandberg Sørensen, L., Sasgen, I., Save, H., Scheuchl, B., Schrama, E., Schröder, L., Seo, K.-W., Simonsen, S. B., Slater, T., Spada, G., Sutterley, T., Talpe, M., Tarasov, L., van de Berg, W. J., van der Wal, W., van Wessem, M., Vishwakarma, B. D., Wiese, D., Wilton, D., Wagner, T., Wouters, B., and Wuite, J.: Mass balance of the Greenland Ice Sheet from 1992 to 2018, Nature, 579, 233–239, https://doi.org/10.1038/s41586-019-1855-2, 2020. a, b, c, d, e
Sinet, S., von der Heydt, A., and Dijkstra, H.: AMOC stabilization under the interaction with tipping polar ice sheets, Geophys. Res. Lett., 50, e2022GL100305, https://doi.org/10.1029/2022GL100305, 2023. a, b, c, d
Slater, T., Lawrence, I. R., Otosaka, I. N., Shepherd, A., Gourmelen, N., Jakob, L., Tepes, P., Gilbert, L., and Nienow, P.: Review article: Earth's ice imbalance, The Cryosphere, 15, 233–246, https://doi.org/10.5194/tc-15-233-2021, 2021. a
Steffen, W., Richardson, K., Rockström, J., Cornell, S. E., Fetzer, I., Bennett, E. M., Biggs, R., Carpenter, S. R., de Vries, W., de Wit, C. A., Folke, C., Gerten, D., Heinke, J., Mace, G. M., Persson, L. M., Ramanathan, V., Reyers, B., and Sörlin, S.: Planetary boundaries: Guiding human development on a changing planet, Science, 347, 1259855, https://doi.org/10.1126/science.1259855, 2015. a
Stocker, T. F. and Schmittner, A.: Influence of CO2 emission rates on the stability of the thermohaline circulation, Nature, 388, 862–865, https://doi.org/10.1038/42224, 1997. a, b, c
Stouffer, R. J., Yin, J., Gregory, J. M., Dixon, K. W., Spelman, M. J., Hurlin, W., Weaver, A. J., Eby, M., Flato, G. M., Hasumi, H., Hu, A., Jungclaus, J. H., Kamenkovich, I. V., Levermann, A., Montoya, M., Murakami, S., Nawrath, S., Oka, A., Peltier, W. R., Robitaille, D. Y., Sokolov, A., Vettoretti, G., and Weber, S. L.: Investigating the causes of the response of the thermohaline circulation to past and future climate changes, J. Climate, 19, 1365–1387, https://doi.org/10.1175/JCLI3689.1, 2006. a, b, c
Swingedouw, D., Braconnot, P., and Marti, O.: Sensitivity of the Atlantic Meridional Overturning Circulation to the melting from northern glaciers in climate change experiments, Geophys. Res. Lett., 33, L07711, https://doi.org/10.1029/2006GL025765, 2006. a, b
Swingedouw, D., Rodehacke, C. B., Behrens, E., Menary, M., Olsen, S. M., Gao, Y., Mikolajewicz, U., Mignot, J., and Biastoch, A.: Decadal fingerprints of freshwater discharge around Greenland in a multi–model ensemble, Clim. Dynam., 41, 695–720, https://doi.org/10.1007/s00382-012-1479-9, 2013. a, b, c, d
Swingedouw, D., Rodehacke, C. B., Olsen, S. M., Menary, M., Gao, Y., Mikolajewicz, U., and Mignot, J.: On the reduced sensitivity of the Atlantic overturning to Greenland ice sheet melting in projections: a multi-model assessment, Clim. Dynam., 44, 3261–3279, https://doi.org/10.1007/s00382-014-2270-x, 2015. a, b, c
Thomas, Z. A., Jones, R. T., Turney, C. S. M., Golledge, N., Fogwill, C., Bradshaw, C. J. A., Menviel, L., McKay, N. P., Bird, M., Palmer, J., Kershaw, P., Wilmshurst, J., and Muscheler, R.: Tipping elements and amplified polar warming during the Last Interglacial, Quaternary Sci. Rev., 233, 106222, https://doi.org/10.1016/j.quascirev.2020.106222, 2020. a, b, c
Trusel, L. D., Das, S. B., Osman, M. B., Evans, M. J., Smith, B. E., Fettweis, X., McConnell, J. R., Noël, B. P. Y., and van den Broeke, M. R.: Nonlinear rise in Greenland runoff in response to post–industrial Arctic warming, Nature, 564, 104–108, https://doi.org/10.1038/s41586-018-0752-4, 2018. a, b, c, d
UNFCCC: Adoption of the Paris Agreement, https://unfccc.int/documents/9097 (last access: 26 April 2024), 2015. a, b
Valdes, P.: Built for stability, Nat. Geosci., 4, 414–416, https://doi.org/10.1038/ngeo1200, 2011. a
Van den Berg, J., Van de Wal, R., and Oerlemans, J.: Effects of spatial discretization in ice-sheet modelling using the shallow–ice approximation, J. Glaciol., 52, 89–98, https://doi.org/10.3189/172756506781828935, 2006. a
van den Broeke, M., Box, J., Fettweis, X., Hanna, E., Noël, B., Tedesco, M., van As, D., van de Berg, W. J., and van Kampenhout, L.: Greenland ice sheet surface mass loss: recent developments in observation and modeling, Current Climate Change Reports, 3, 345–356, 2017. a
van den Broeke, M. R., Enderlin, E. M., Howat, I. M., Kuipers Munneke, P., Noël, B. P. Y., van de Berg, W. J., van Meijgaard, E., and Wouters, B.: On the recent contribution of the Greenland ice sheet to sea level change, The Cryosphere, 10, 1933–1946, https://doi.org/10.5194/tc-10-1933-2016, 2016. a
van Westen, R. M., Kliphuis, M., and Dijkstra, H. A.: Physics-based early warning signal shows that AMOC is on tipping course, Sci. Adv., 10, eadk1189, https://doi.org/10.1126/sciadv.adk1189, 2024. a, b, c
Vanselow, A., Wieczorek, S., and Feudel, U.: When very slow is too fast–collapse of a predator–prey system, J. Theor. Biol., 479, 64–72, https://doi.org/10.1016/j.jtbi.2019.07.008, 2019. a
Vellinga, M. and Wood, R. A.: Global Climatic Impacts of a Collapse of the Atlantic Thermohaline Circulation, Climatic Change, 54, 251–267, https://doi.org/10.1023/A:1016168827653, 2002. a, b, c
Vellinga, M. and Wood, R. A.: Impacts of thermohaline circulation shutdown in the twenty–first century, Climatic Change, 91, 43–63, https://doi.org/10.1007/s10584-006-9146-y, 2008. a, b, c
Weijer, W., Cheng, W., Drijfhout, S. S., Fedorov, A. V., Hu, A., Jackson, L. C., Liu, W., McDonagh, E., Mecking, J., and Zhang, J.: Stability of the Atlantic Meridional Overturning Circulation: A review and synthesis, J. Geophys. Res.-Oceans, 124, 5336–5375, https://doi.org/10.1029/2019JC015083, 2019. a, b, c
Wieczorek, S., Ashwin, P., Luke, C. M., and Cox, P. M.: Excitability in ramped systems: the compost–bomb instability, P. Roy. Soc. A, 467, 1243–1269, https://doi.org/10.1098/rspa.2010.0485, 2011. a, b
Winguth, A., Mikolajewicz, U., Gröger, M., Maier-Reimer, E., Schurgers, G., and Vizcaíno, M.: Centennial–scale interactions between the carbon cycle and anthropogenic climate change using a dynamic Earth system model, Geophys. Res. Lett., 32, L23714, https://doi.org/10.1029/2005GL023681, 2005. a, b
Wood, R. A., Rodríguez, J. M., Smith, R. S., Jackson, L. C., and Hawkins, E.: Observable, low–order dynamical controls on thresholds of the Atlantic Meridional Overturning Circulation, Clim. Dynam., 53, 6815–6834, https://doi.org/10.1007/s00382-019-04956-1, 2019. a, b, c, d, e, f, g, h, i
Wunderling, N., Gelbrecht, M., Winkelmann, R., Kurths, J., and Donges, J. F.: Basin stability and limit cycles in a conceptual model for climate tipping cascades, New J. Phys., 22, 123031, https://doi.org/10.1088/1367-2630/abc98a, 2020a. a
Wunderling, N., Stumpf, B., Krönke, J., Staal, A., Tuinenburg, O. A., Winkelmann, R., and Donges, J. F.: How motifs condition critical thresholds for tipping cascades in complex networks: Linking micro-to macro-scales, Chaos: An Interdisciplinary Journal of Nonlinear Science, 30, 043129, https://doi.org/10.1063/1.5142827, 2020b. a
Wunderling, N., Donges, J. F., Kurths, J., and Winkelmann, R.: Interacting tipping elements increase risk of climate domino effects under global warming, Earth Syst. Dynam., 12, 601–619, https://doi.org/10.5194/esd-12-601-2021, 2021. a, b, c
Wunderling, N., Winkelmann, R., Rockström, J., Loriani, S., Armstrong McKay, D. I., Ritchie, P. D., Sakschewski, B., and Donges, J. F.: Global warming overshoots increase risks of climate tipping cascades in a network model, Nat. Clim. Change, 13, 75–82, 2023. a, b
Yin, J., Stouffer, R. J., Spelman, M. J., and Griffies, S. M.: Evaluating the uncertainty induced by the virtual salt flux assumption in climate simulations and future projections, J. Climate, 23, 80–96, 2010. a
Zeitz, M., Haacker, J. M., Donges, J. F., Albrecht, T., and Winkelmann, R.: Dynamic regimes of the Greenland Ice Sheet emerging from interacting melt–elevation and glacial isostatic adjustment feedbacks, Earth Syst. Dynam., 13, 1077–1096, https://doi.org/10.5194/esd-13-1077-2022, 2022. a
Zickfeld, K., Slawig, T., and Rahmstorf, S.: A low–order model for the response of the Atlantic thermohaline circulation to climate change, Ocean Dynam., 54, 8–26, https://doi.org/10.1007/s10236-003-0054-7, 2004. a
- Abstract
- Introduction
- Greenland Ice Sheet and Atlantic Meridional Overturning Circulation as interacting tipping elements
- Conceptual models describing individual tipping dynamics and interactions
- Results
- Discussion and conclusion
- Code and data availability
- Author contributions
- Competing interests
- Disclaimer
- Special issue statement
- Acknowledgements
- Financial support
- Review statement
- References
- Supplement