the Creative Commons Attribution 4.0 License.
the Creative Commons Attribution 4.0 License.
 | 02 May 2024
First comprehensive assessment of industrial-era land heat uptake from multiple sources
Jesús Fidel González-Rouco
Camilo Melo-Aguilar
Norman Julius Steinert
Elena García-Bustamante
Philip de Vrese
Johann Jungclaus
Stephan Lorenz
Stefan Hagemann
Francisco José Cuesta-Valero
Almudena García-García
Hugo Beltrami
The anthropogenically intensified greenhouse effect has caused a radiative imbalance at the top of the atmosphere during the industrial period. This, in turn, has led to an energy surplus in various components of the Earth system, with the ocean storing the largest part. The land contribution ranks second with the latest observational estimates based on borehole temperature profiles, which quantify the terrestrial energy surplus to be 6 % in the last 5 decades, whereas studies based on state-of-the-art climate models scale it down to 2 %. This underestimation stems from land surface models (LSMs) having a subsurface that is too shallow, which severely constrains the land heat uptake simulated by Earth system models (ESMs). A forced simulation of the last 2000 years with the Max Planck Institute ESM (MPI-ESM) using a deep LSM captures 4 times more heat than the standard shallow MPI-ESM simulations in the historical period, well above the estimates provided by other ESMs. However, deepening the LSM does not remarkably affect the simulated surface temperature. It is shown that the heat stored during the historical period by an ESM using a deep LSM component can be accurately estimated by considering the surface temperatures simulated by the ESM using a shallow LSM and propagating them with a standalone forward model. This result is used to derive estimates of land heat uptake using all available observational datasets, reanalysis products, and state-of-the-art ESM experiments. This approach yields values of 10.5–16.0 ZJ for 1971–2018, which are 12 %–42 % smaller than the latest borehole-based estimates (18.2 ZJ).
- Article
(4754 KB) - Full-text XML
- BibTeX
- EndNote


The climate system has been experiencing a net heat gain in all its components (von Schuckmann et al., 2020) during the industrial period due to a radiative imbalance at the top of the atmosphere (Wild, 2020; Forster et al., 2021). The radiative imbalance is a consequence of the anthropogenically intensified greenhouse effect (Gulev et al., 2021). Accurately estimating the energy surplus partitioning among the different components helps in understanding their interactions and climate change influences on near-surface climate (Forster et al., 2021).
As a result of the energy imbalance at the surface, the land stored around 6 % (4.3 %–6.6 %, 21±2 ZJ) of the terrestrial energy surplus in the last 5 decades, as derived from observational estimates (von Schuckmann et al., 2020; Cuesta-Valero et al., 2021a, 2023), being the second-largest contributor after the ocean (ca. 90 %, 324±8 ZJ; Levitus et al., 2012; Abraham et al., 2013; von Schuckmann et al., 2020) to the total Earth system energy gain. Regardless of whether the amount associated with land heat uptake storage is comparatively small, climate models should realistically represent the partitioning of energy. State-of-the-art climate models quantify the land contribution to be roughly 2 % (Cuesta-Valero et al., 2021a), underestimating observational results. This underestimation of land heat uptake in climate models can alter the surface energy balance (Mottaghy and Rath, 2006; García-García et al., 2023), with impacts on soil hydrology (Krakauer et al., 2013), particularly in permafrost regions (Andresen et al., 2020). The amount of energy absorbed by the ground is also relevant for other soil processes, such as respiration or productivity (Pries et al., 2017), and for its biogeochemical activity (Soong et al., 2021).
Observational land heat uptake estimates have been derived from borehole temperature profile (BTP) log collections (Mareschal and Beltrami, 1992; Huang et al., 2000; Beltrami et al., 2002; Cuesta-Valero et al., 2021b, 2023). BTPs record transient temperature perturbations relative to the steady geothermal gradient. Assuming that the subsurface acts as a half-infinite fully conductive medium (Carslaw and Jaeger, 1959), BTPs provide information about the land heat uptake up to their logging date (Cuesta-Valero et al., 2021b). BTP logs are scarce and show uneven distributions of sampling dates and locations, as well as variable vertical resolution and depths. These factors may potentially have some impact on resulting estimates of land heat uptake (Beltrami et al., 2015; Melo-Aguilar et al., 2018, 2020). Nevertheless, estimates derived from BTPs are the only observational source of information to quantify the land contribution to the terrestrial energy budget so far (Forster et al., 2021; von Schuckmann et al., 2023).
State-of-the-art Earth system models (ESMs; Eyring et al., 2016) have been incapable of properly reproducing observational land heat uptake estimates. Their limited volume to store energy stems from imposing a bottom boundary condition placement (Smerdon and Stieglitz, 2006; Stevens et al., 2007) in their land surface models (LSMs), from ca. 3 to 10 m in the majority of Coupled Model Intercomparison Project Phase 5 (CMIP5; Taylor et al., 2012) and Phase 6 (CMIP6; Eyring et al., 2016) models. These depths are insufficient to account for the heat penetrated into the subsurface in the industrial period, rendering them inadequate for estimating long-term heat storage (Alexeev et al., 2007; MacDougall et al., 2008; González-Rouco et al., 2009; Cuesta-Valero et al., 2016; Steinert et al., 2021a). Only a small number of CMIP6 ESMs impose a deeper LSM depth (ca. 40 m), most of them using the Community Land Model (CLM; Lawrence et al., 2019) as the LSM (see Table 2). Furthermore, longer-term simulations spanning multi-centennial or millennial timescales, like the ones developed within the Paleoclimate Modelling Intercomparison Project (PMIP; Kageyama et al., 2018), should include deeper LSM depths to accommodate longer-lasting and deeper subsurface energy transfer (Smerdon and Stieglitz, 2006; Alexeev et al., 2007; Steinert et al., 2021a).
Some simulation-based efforts have been devoted to deriving unbiased estimates of land heat uptake using deepened LSMs. Standalone one-dimensional half-infinite space heat conduction forward models (González-Rouco et al., 2006, 2009) were used to yield artificial global mean surface temperature histories and heat uptake estimates, forced by either observational-based surface air temperature (SAT) (Huang, 2006) or ESM-simulated ground surface temperature (GST) data (Stevens et al., 2007; MacDougall et al., 2008). More recently, modifications of the LSM depth (Hermoso de Mendoza et al., 2020; González-Rouco et al., 2021) and soil hydrology (Steinert et al., 2021b) have been introduced into LSMs in standalone mode, and their impact on heat uptake and subsurface temperature variability has been extensively discussed. However, the impact of these LSM changes has not yet been explored within a fully coupled ESM.
This work analyzes for the first time a long-term ESM simulation including a deep LSM. A version of the MPI-ESM (Mauritsen et al., 2019), modified to include a deep zero-flux bottom boundary condition, is used to produce a 2000-year-long simulation including a PMIP4 representation of natural and external forcings (Jungclaus et al., 2017). This simulation is compared with another experiment that was made with the same setup, albeit with the standard shallow LSM version and different initial conditions. The land energy storage is computed in the industrial period for the deep and shallow simulations considering the progressive subsurface warming down to their zero-flux bottom boundary condition. In addition, land energy estimates were derived using an offline forward model driven by the GSTs of the shallow and deep simulations as boundary conditions. This constitutes a first assessment of the impacts of deepening the LSM on land energy storage, and it is extended to all available instrumental and modeling datasets. CMIP6 simulations and hybrid model–observational products (i.e., reanalysis) allow us, for the first time, to have a variety of observational and model-based land heat uptake estimates that enable an exhaustive comparison with BTP-based estimates.
Slivinski et al. (2019)Laloyaux et al. (2018)Poli et al. (2016)Muñoz Sabater et al. (2021)Kalnay et al. (1996)Ebita et al. (2011)Tardif et al. (2019)Rohde and Hausfather (2020)Osborn et al. (2021)Lenssen et al. (2019)Zhang et al. (2019)Willmott and Matsuura (2018)Table 1Characteristics of the observational-type global surface temperature datasets used in this work and their trends for various periods. The first seven rows account for reanalysis data, while the last five are for instrumental data. GST data were used, except in the cases marked with (1), for which surface air temperature (SAT) data were used. The soil temperature at the first layer was taken as the GST in every case. Glacier areas (Antarctica and Greenland) were excluded from the calculations. Temperature trends in the three different periods assessed in Fig. 3 (1950–2000, 1960–2020, and 1971–2018) for every dataset and the means for reanalyses and observational subsets are also provided. (2) indicates cases in which the interval of trend evaluation is shorter due to limited data availability.

1 SAT used instead of GST. 2 Temperature trend value is given for a shorter period due to limited data availability.
Table 2CMIP6 experiments used in this work (Col. 1) and their corresponding horizontal resolution (Col. 2) and LSM component (Col. 3). The number of layers (Col. 4) in the LSM and the LSM depth (Col. 5), as well as temperature trends in the three different periods assessed in Fig. 3 (1950–2000, 1960–2020, and 1971–2018; Cols. 6–8) for every CMIP6 model and the multi-model mean, are also provided. Information on the deep LSM configuration of the MPI-ESM1.2-LR is also included and shown in bold.

1.1 MPI-ESM simulations
The first part of this work focuses on two simulations performed with version 1.2 of the Max Planck Institute for Meteorology ESM (MPI-ESM; Mauritsen et al., 2019), spanning the time interval 0–1850 CE and extended over the historical period and the SSP585 scenario. The interval encompassing 0–2100 CE is noted hereafter as P2k+. One of the experiments includes a standard shallow LSM while the other one uses a deep LSM (P2k+s and P2k+d, respectively). The shallow experiment used hereafter is the MPI-ESM contribution to PMIP4 (van Dijk et al., 2022). MPI-ESM comprises the ocean model MPIOM1.6 and the atmosphere model ECHAM6.3 (Stevens et al., 2013). The latter is directly coupled to the LSM JSBACH3.2 (JSBACH; Reick et al., 2021) through the surface exchange of mass, momentum, and heat. The low-resolution configuration (MPI-ESM1.2-LR) has an atmospheric horizontal resolution truncated to T63, corresponding approximately to a 200 km grid cell size. This resolution is shared by the LSM. The CMIP6 version of JSBACH uses a five-soil-layer discretization, with a zero-flux bottom boundary condition imposed at 10 m (P2k+s), which is too shallow to properly account for the conductive propagation of decadal and centennial temperature perturbations (Steinert et al., 2021a). The deeper version of JSBACH (González-Rouco et al., 2021; Steinert et al., 2021b) has a 12-soil-layer scheme down to 1417 m and is used here in the P2k+d experiment. The P2k+ simulations allow us to evaluate the effect of having a deep LSM on surface temperatures at long timescales. Also, having a long millennial P2k+d experiment provides realistic, i.e., consistent with external forcing, preindustrial initial conditions for subsurface temperatures down to the bottom boundary condition in 1850.
In addition to the P2k+ experiments, an ensemble of 30 historical and SSP585 simulations (hereafter denoted as 30ENS) run with the CMIP6 version of the MPI-ESM, MPI-ESM1.2-LR, are considered. The experiments use the same model version as P2k+s and serve the purpose of tackling the uncertainties in historical warming due to internal variability.
1.2 Reanalysis, observational, and CMIP6 model products
Global mean temperatures at the ground surface over land coming from seven global reanalyses and five gridded observational databases have also been used (Table 1) to derive land heat uptake estimates. In all cases, glacier areas were excluded. GST data were used from six of the sources (see Table 1), whilst SAT was taken as a surrogate of the GST evolution when GST was not available (six data sources; see Table 1). This substitution leans on the assumption that SAT and GST are strongly coupled at long-term scales (Melo-Aguilar et al., 2018). All sources cover the whole of the 20th century, except for ERA5-Land, NCEP1, and JRA55. Furthermore, all of them except LMRv2.1 cover the first decade of the 21st century. These datasets will allow us to obtain land heat uptake estimates complementary to BTP-based values.
Additionally, GST and subsurface temperature simulations of the historical period and SSP585 scenario from the available CMIP6 ESMs (Eyring et al., 2016) were used (see Table 2). This added up to 36 simulations stemming from 22 different ESMs and some model variants, 38 if accounting for P2k+ simulations since 1850. Both for reanalyses and CMIP6 ESMs, the temperature at the first soil layer was used as the GST. Only the first ensemble member was selected for every specific ESM. In the case of the CMIP6 historical and the SSP585 simulation ensemble with the MPI-ESM1.2-LR (30ENS), only the first member was considered for the analyses hereafter and is referred to as MPI-ESM1.2-LR. Some features of the LSM of every CMIP6 ESM, such as the number of soil layers, LSM depth, and horizontal resolution, can be found in Table 2. The ensemble of CMIP6 simulations complements land heat uptake estimates derived from the reanalysis and observational data with ESM experiments that considered changes in external forcing since 1850 CE, allowing us to tackle the system energy input regardless of the different realization of the internal variability. It is noteworthy that most CMIP6 ESMs include LSM depths lower than 14 m, which is not sufficient to properly represent the propagation of the annual temperature cycle into the soil column (Smerdon and Stieglitz, 2006). Only 14 out of 38 members impose an LSM depth below 40 m, still shallower than the 200 m LSM depth recommended to correctly simulate the propagation of the centennial climate change signal (González-Rouco et al., 2021; Steinert et al., 2021a). Thus, land heat uptake estimates for CMIP6 in this work will be derived from the integration of the LSM subsurface temperatures from every simulation, and corrected estimates will also be provided by using a standalone forward modeling approach (see Sect. 3).
2.1 Subsurface temperature generation
A half-infinite one-dimensional heat conduction forward model (Mareschal and Beltrami, 1992; Cuesta-Valero et al., 2022, 2023) is used to propagate yearly surface temperature data from the sources in Tables 1 and 2 and the P2k+ simulations (both d and s) and to produce forward temperature anomaly profiles (FTP hereafter):
where T(ti) is the annual mean surface temperature anomaly at time step ti, κ is thermal diffusivity, and z is depth. To compute FTPs at a certain time step, surface temperature data are trimmed to the interval spanning from the initial year (t1; e.g., 1850, 1950, 1960, and 1971) to ti. Temperature anomalies are calculated by computing annual anomalies with respect to the temperature value of the first year of the trimmed interval, t1. This allows us to depart from equilibrium initial conditions. These FTPs are equivalent to the BTPs used to yield observational land heat uptake estimates, which are derived by subtracting the geothermal gradient (mean state) from the absolute log temperature values (Mareschal and Beltrami, 1992; Huang et al., 2000). An ensemble of three different FTPs per time step was obtained using different thermal diffusivity values resulting from a Monte Carlo random sampling method of local properties (Davison and Hinkley, 1997), which accounts for the uncertainty in temporal and spatial soil heterogeneity (Cuesta-Valero et al., 2022). The Monte Carlo method consisted of averaging 100 different global maps of thermal diffusivity with values randomly sampled from a realistic range of 0.5 to m2 s−1. The sample size was the original number of grid points over land for every data source in Tables 1 and 2. Then, percentiles 2.5, 50, and 97.5 of the 100 values were taken as the three thermal diffusivity values for computing the global FTPs. This is the approach for every data source except for the P2k+ simulations, for which m2 s−1 is taken as the thermal diffusivity to produce the FTP, the actual value used by JSBACH to resolve the temperature vertical scheme (Reick et al., 2021). All the FTPs were resolved down to a common depth of 1417 m so that results could be comparable to the estimates derived from the P2k+d simulation, limited by a zero-flux bottom boundary condition at 1417 m. This comparison is possible since this LSM depth ensures the thermal decoupling between the ground surface and the bottom layer, which is equivalent to the subsurface acting as a half-infinite conductive medium (González-Rouco et al., 2021; Steinert et al., 2021a). As the uncertainties associated with local thermal properties and subsurface depth are tackled when calculating the FTPs, global differences between mean FTPs and land heat uptake estimates from different sources cannot be due to these factors.
In addition, subsurface temperature data coming from both P2k+ and CMIP6 simulations are used. Temperatures at different subsurface levels for every time step are aggregated to yield subsurface temperature profiles. Subsurface temperature anomaly profiles (STPs hereafter) are subsequently computed by subtracting the initial temperature profile from this T(ti,z), as follows:
where T(ti,z) is the subsurface temperature at depth z and time step ti (i.e., the subsurface temperature profile at time step ti) and T(t1,z) is the initial subsurface temperature profile.

Figure 1Temperature evolution in MPI-ESM. Past 2k, historical, and SSP585 (P2k+) global means for (a) SAT, (b) GST, and (c) ST5 anomalies over land areas (excluding Greenland and Antarctica) in 0–2000 CE relative to 1850–1900 for a simulation run with the MPI-ESM1.2-LR with a shallow (subscript s, red lines) and a deep (subscript d, blue lines) version of its LSM, JSBACH. Annual time series are shown in light colors, while 31-year moving averages are portrayed in dark colors. (d) 31-year moving averages in panels a to c (see legend for colors) are represented here together with the ensemble of 30 MPI-ESM1.2-LR CMIP6 standard shallow historical and SSP585 simulations (30ENS, gray lines) in 1850–2100 CE for comparison. (e) SAT (black), GST (purple), and ST5 (pink) differences between P2k+s and P2k+d, filtered with a 31-year moving average. For panels a, b, c, d, and e, solid vertical lines indicate the 6 strongest volcanic events of 0–1850 CE, while dashed vertical lines indicate the 19 weakest events. (f, g, h) Range of temperature variability in annual (A) and 31 year moving average (MA31) time series in the preindustrial period (0–1850 CE) for SAT (f), GST (g), and ST5 (h). Whiskers represent percentiles 10 and 90 and boxes 25 and 75, respectively. (i) Temperature anomaly at 2100 with respect to 0–1850 CE (K) in P2k+ (see legend for colors). In this case, whiskers show the range of variability (percentiles 10 and 90) of the total warming (K) in 30ENS.
2.2 Land heat uptake estimation
The annual time evolution of the land heat uptake, Qs(t), can be estimated by integrating the FTP anomalies along the whole soil column at every yearly time step as follows:
where Δz(j), Cv(j), and FTP(t,j) are the thickness, volumetric heat capacity, and global mean FTP of layer j, respectively, and A is the Earth's land surface area excluding glaciers (1.34×10¹⁴ m2; Cuesta-Valero et al., 2023). FTPs were calculated using an evenly spaced layering of 1 m thickness. Land heat uptake from both P2k+ and CMIP6 (Table 2) was also calculated from the simulated model subsurface temperatures down to the zero-flux bottom boundary condition, i.e., STPs, by making use of Eq. (2), albeit with unevenly spaced temperature layers in these cases. Soil layering thickness for both shallow and deep configurations of JSBACH is given by González-Rouco et al. (2021), whilst it can be found in the references in Table 2 for CMIP6 models. Analogous to what is done to compute thermal diffusivity (see Sect. 3.1), three values of volumetric heat capacity were derived using a Monte Carlo approach (Davison and Hinkley, 1997; Cuesta-Valero et al., 2022) for every source in Tables 1 and 2 using randomly sampled values between 2.5 and 3.5×10⁶ Jm−3 K−1. The combination of three values for volumetric heat capacity and three for thermal diffusivity yields nine land heat uptake estimates, which are represented here in terms of mean and variability (2 standard deviations).

Figure 2Land heat uptake in the MPI-ESM. (a) FTPs (continuous lines) and MPI-ESM STPs (symbols; see legend) for P2k+d (blue) and P2k+s (red) and for the 30-member ensemble mean of MPI-ESM historical and SSP585 simulations (30ENS, black) in the years 2014 and 2100. The y axis is logarithmic. (b) Land heat uptake derived from the yearly time-step-wise vertical integration of FTPs and STPs for P2k+d (blue), P2k+s (red), and 30ENS (black). The time x axis is unevenly spaced to enhance land heat gain since 1850. For the 30ENS, the confidence interval is also shown in gray (p<0.05).
3.1 Influence of a realistically deep LSM
The comparison of the MPI-ESM P2k+s and P2k+d simulated SAT, GST, and soil temperature at layer 5 (ST5) allows us to assess the thermal impact of increasing the LSM depth (Fig. 1). ST5 is selected because it is the deepest level for P2k+s, reaching 9.83 m, and it can be compared with the corresponding layer in P2k+d. Figure 1a to d shows the time evolution of SAT, GST, and ST5 for the two simulations, both in annual averages and with 31-year running means to emphasize the low-frequency response. The response to the common external forcing during the last 2 millennia (Jungclaus et al., 2017) generates similar interannual (e.g., volcanic events), multidecadal, and centennial variability in P2k+s and P2k+d for SAT and GST (Fig. 1a, b, and d), indicating no systematic changes in preindustrial mean state (Fig. 1f) and variability (Fig. 1g and h) from using the deep or shallow versions of the model. The resulting SAT and GST warming of about 5.5 °C at the end of the 21st century agrees well with the range of warming in the ensemble of MPI-ESM runs (Fig. 1e) and with a climate sensitivity of 3.2 °C (Mauritsen and Roeckner, 2020). Note that for each simulation SAT and GST virtually overlap, showing long-term SAT–GST coupling (Melo-Aguilar et al., 2018). However, the impacts of deepening the LSM are noticeable in ST5, consistent with González-Rouco et al. (2021), with P2k+d showing lower high-frequency volcanic cooling (e.g., 1257, 1457, and 1815; Fig. 1c), preindustrial variability (Fig. 1f, g, and h), and warming (0.8 °C by 2100; Fig. 1e and i) than P2k+s. The reduced warming is significant if compared to the range of 21st-century warming values produced by the 30ENS of MPI-ESM simulations.
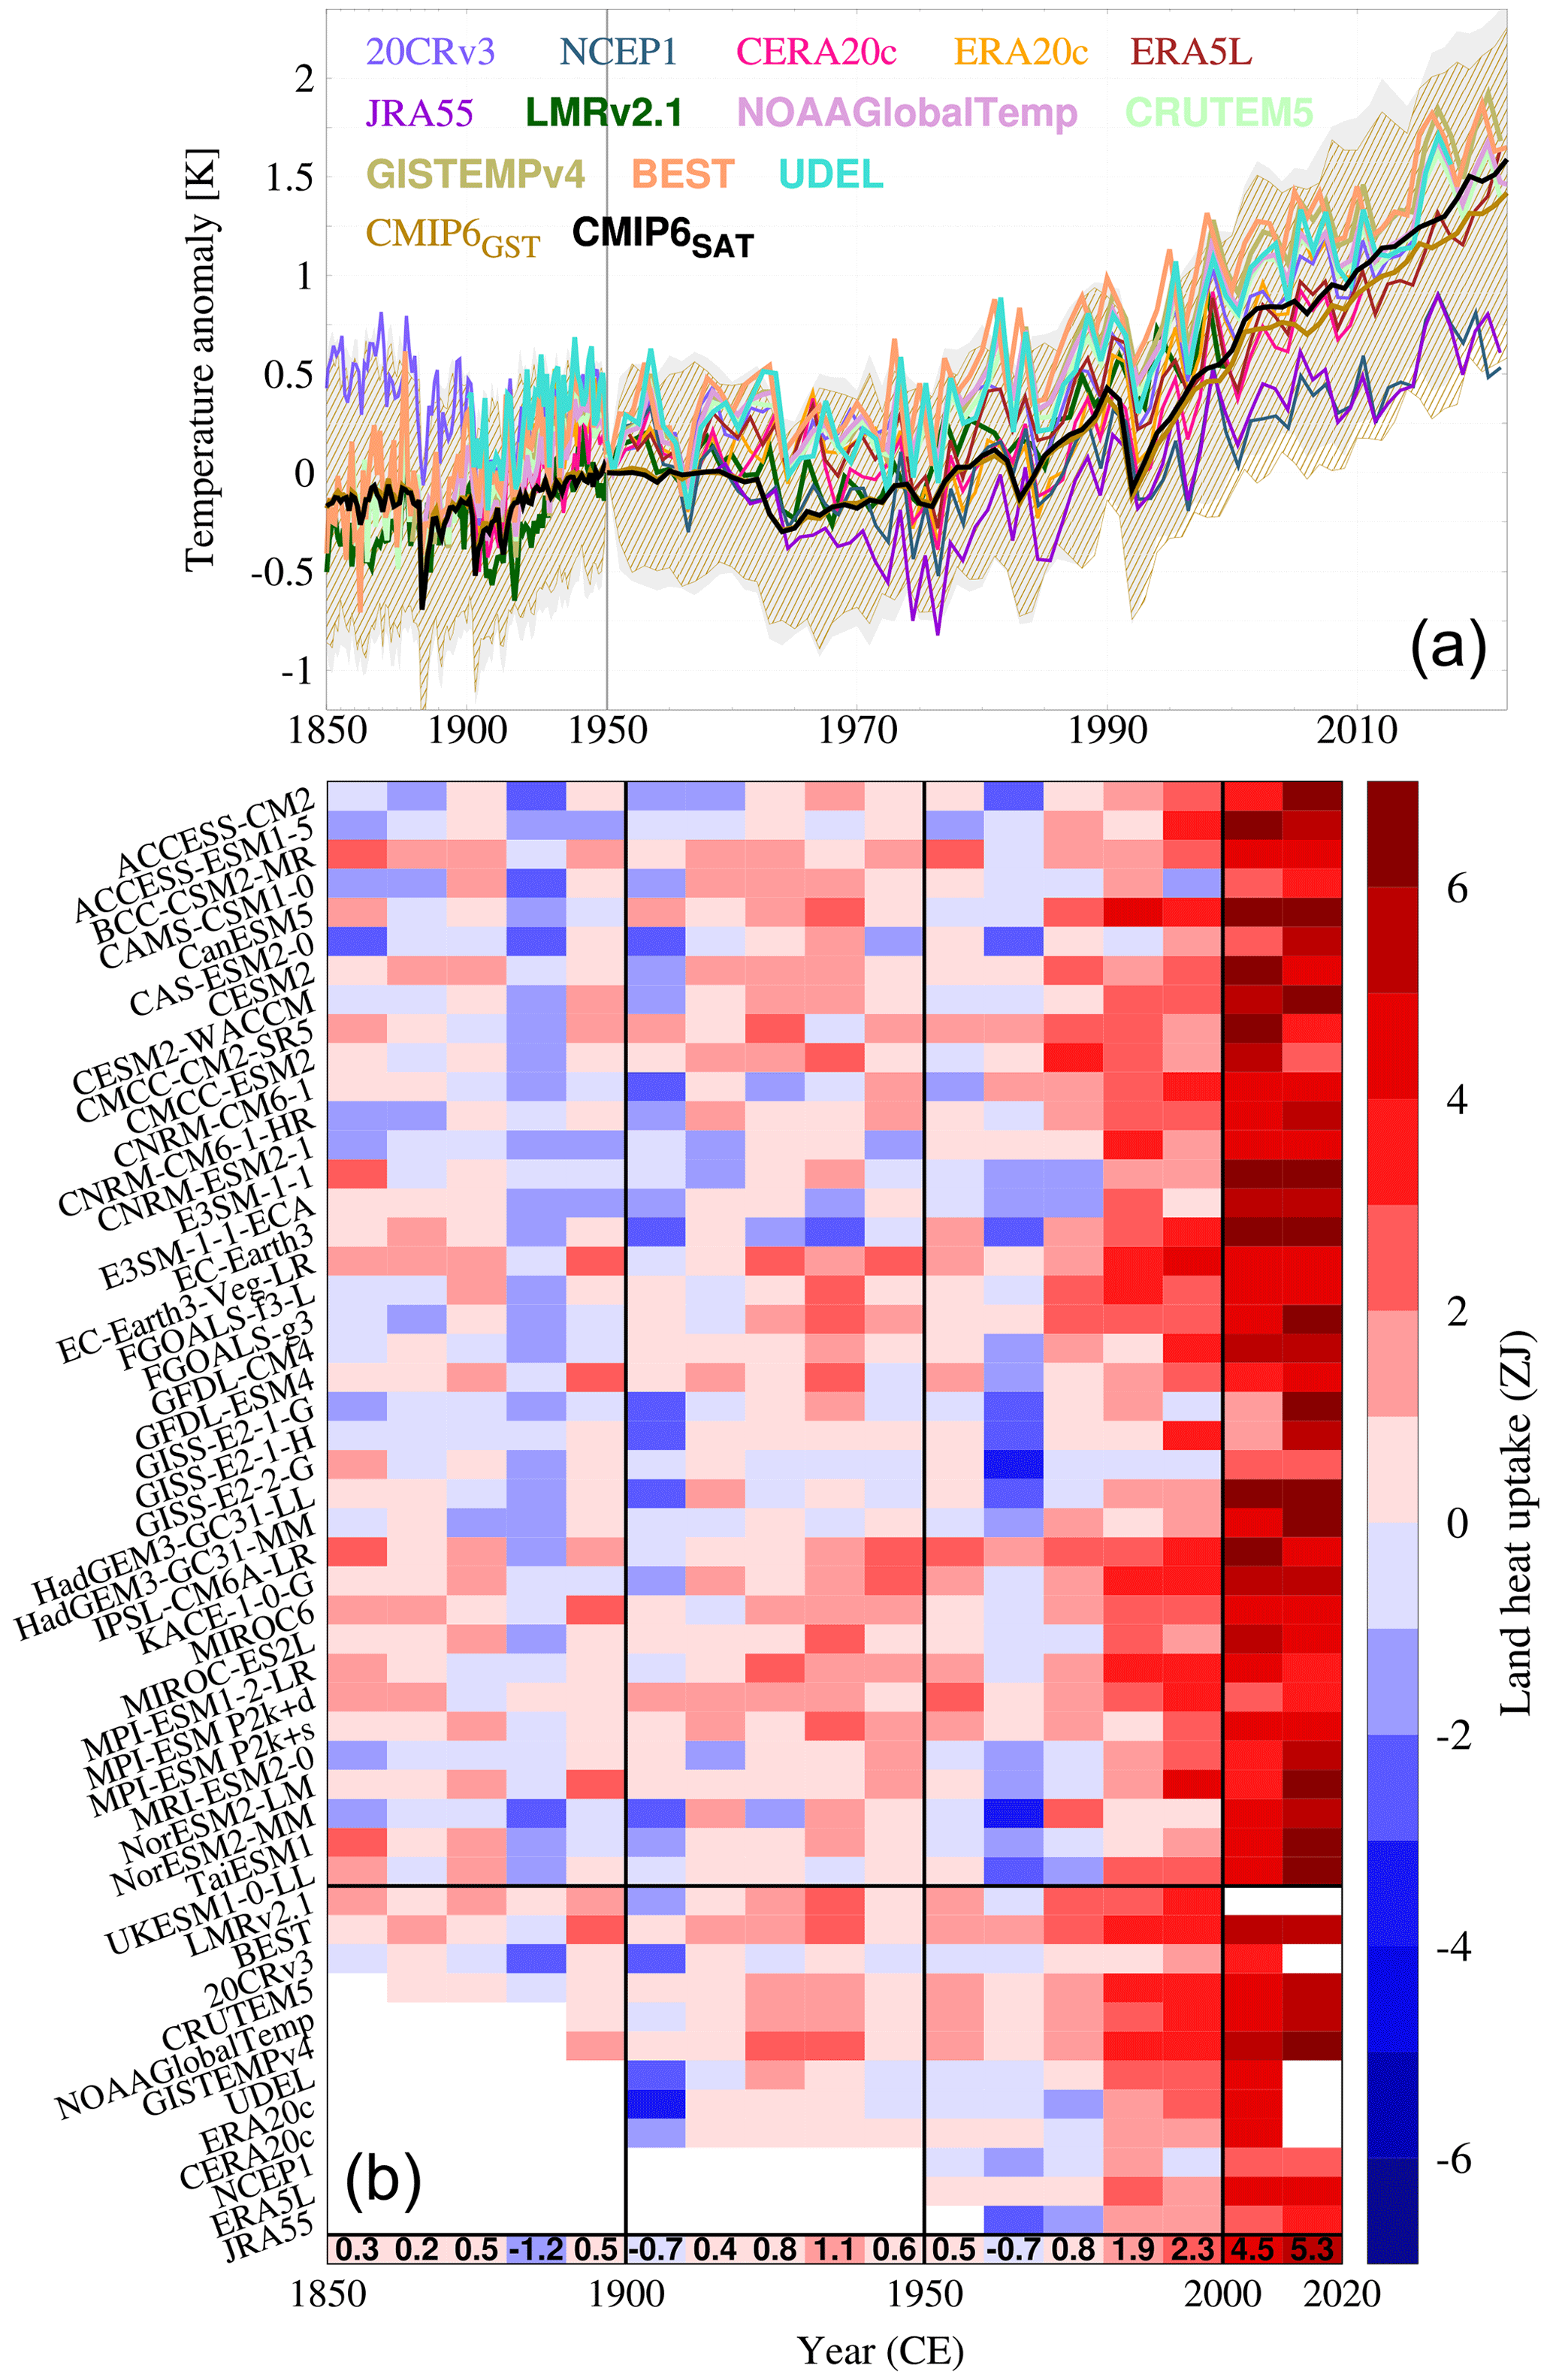
Figure 3Decadal multi-source surface temperature and heat uptake variability. (a) Global land mean temperature anomaly in 1850–2020 with respect to 1950 for reanalyses, observational, and a 38-member CMIP6 ensemble. The SAT is plotted both for observational and CMIP6 sources and LMRv2.1 (tags in bold), whereas the GST is given for the remaining reanalyses and CMIP6 simulations (see Tables 1, 2). GST and SAT spread ranges for the CMIP6 ensemble are also portrayed (p<0.05). (b) Decadal global land heat uptake in the industrial period (1850–2020) from the different data sources in (a). Red and blue tones in the heatmap represent decadal energy gains and losses, respectively. The horizontal black line separates CMIP6 models (38 members), including MPI-ESM P2k+ simulations, from reanalysis and observational data sources (12 members). CMIP6 sources are sorted downwards alphabetically, while the rest are ordered by length of decreasing periods. The last row represents the multi-source decadal mean.
Therefore, increasing the depth of the LSM produces significant changes in the subsurface temperatures, yet it does not change surface temperatures. The GSTs of the P2k+s and P2k+d can be considered equal in terms of their range of variability and long-term trends, indicating that the surface temperatures simulated by an LSM are not affected by its depth. This result offers the potential to use GSTs from different sources, e.g., reanalysis or CMIP6 simulations, as a boundary condition for forcing an infinite half-space standalone forward model and deriving realistic land energy storage estimates. This is first verified in Fig. 2 using the P2k+ runs. Figure 2a shows STPs from both P2k+s and P2k+d, the ensemble mean STP from 30ENS, and their respective FTPs by the end of the historical period (2014) and SSP585 (2100). Both STPs and FTPs can capture the different degrees of warming between 2014 and 2100 and agree to portray their penetration down to a depth of about 150 m (Fig. 2a). However, there is a remarkable difference when comparing the FTPs and STPs for P2k+s, P2k+d, and the 30ENS. Whilst the P2k+d FTP is capable of reproducing its analogous STP, FTPs and STPs for P2k+s diverge in depth. This is because the forward model is run with no zero-flux bottom boundary condition imposed, which can be considered analogous to the deep configuration of JSBACH (1417 m). Consequently, FTP warm anomalies are smaller in depth than the ones corresponding to the STP, which complies with a zero-flux bottom boundary condition at 10 m. Imposing a shallow boundary condition generates a warm bias with depth since the ground heat flux is halted from penetrating downwards due to the existence of a zero-flux condition (Smerdon and Stieglitz, 2006; Alexeev et al., 2007; Steinert et al., 2021a). Thus, FTPs derived from P2k+s and 30ENS reproduce P2k+d STP and FTP, realistically representing the half-infinite space thermal conduction that governs heat propagation in observational BTPs (Mareschal and Beltrami, 1992; Cuesta-Valero et al., 2021c).
Figure 2b shows the land heat uptake since 0 CE resulting from the stepwise integration of FTPs and STPs for the P2k+ simulations and FTPs for 30ENS. Both STP- and FTP-derived land heat uptake estimates for P2k+d and FTP-derived estimates for P2k+s depict a preindustrial land heat loss, which becomes more acute in the Little Ice Age (from 1400 to 1850; Miller et al., 2012), and a noticeable heat uptake since 1900. The STP-based heat uptake evolution for P2k+s misses the simulation of heat loss and largely underestimates the magnitude of the subsequent heat uptake shown by P2k+d, yielding a heat uptake of around 18 ZJ by the end of the 21st century, which is 4 times smaller than the values derived from deep FTPs and the P2k+d STP (about 75 ZJ). The agreement of P2k+s and P2k+d on the land heat uptake when the forward modeling approach is used evidences the viability of using surface temperatures as boundary conditions to derive FTPs and to estimate heat uptake when subsurface thermal schemes are too shallow.
3.2 Multi-source land heat uptake estimates
The previous analysis opens the possibility of estimating land heat uptake from a variety of sources. Global mean land surface temperature anomalies with respect to 1950 for the seven reanalyses, five observational databases, and the CMIP6 model ensemble are shown in Fig. 3a. By averaging 38 CMIP6 members, the effect of internal variability is minimized, thus emphasizing the response to forced variability. It can be seen that both SAT and GST CMIP6 multi-model means (thick lines) are fully coupled up to 2000, depicting sudden cooling events in the 1880 and 1990 decades, associated with the volcanic activity of Krakatoa or later El Chichón and Pinatubo (Self and Rampino, 1981; Mccormick et al., 1995). They also capture the cooling during the 1950s and 1960s and the subsequent warming. However, the warming trend is slightly higher for SAT than for GST, which produces a small temperature offset of about 0.1 K by 2020. This offset is negligible compared to the range in temperature variability of the 38 members (SAT, shaded gray; GST, scratched gold), so SAT and GST can be considered as coupled; therefore, SAT can be used as alternative boundary information to feed the forward model when GST data are not available. Regarding the observational and reanalysis datasets, surface temperatures lie within the range of CMIP6 multi-model variability. Nevertheless, observational data render higher temperature anomaly values than all the reanalyses, showing higher temperature trends in 1950–2000 and 1960–2020 (Table 1). Moreover, NCEP1 and JRA55 depict the coldest GST evolutions of all observational-based sources, even lying beneath the multi-model spread of CMIP6 models in some instances in the mid-70s.

Figure 4Land heat uptake estimates from different sources and periods. Land heat uptake during 1950–2000 (a), 1960–2020 (b), and 1971–2018 (c) derived from FTPs (hollow points) of reanalysis and observational databases (Table 1), CMIP6 FTPs (right-hand hollow points) and direct integration of CMIP6 STPs (left-hand solid points; Table 2), and previous estimates (orange crosses): B02 (Beltrami, 2002), B02b (Beltrami et al., 2002), H06 (Huang, 2006), vS20 (von Schuckmann et al., 2020), and CV23 (Cuesta-Valero et al., 2023). The vS20 and CV23 estimates for 1950–2000 refer in fact to 1960–2000 and are marked with a star. The LSM depth for every CMIP6 model used in this work is given by gray shading (see legend above), while the multi-model mean for both the STP and FTP-based values is given by gold crosses. MPI-ESM P2k+d estimates are plotted in dark blue, and MPI-ESM P2k+s estimates are plotted in red.
The decadal evolution of the different surface temperature datasets impacts their land heat uptake, as shown in Fig. 3b, where decadal heat gains and losses are assembled for the time span of each of the 50 datasets collected in this work. All the sources agree on depicting a progressive land warming, only interrupted by transient coolings in the 1880s, 1900s, and 1960s, which coincide with the volcanic eruptions of Krakatoa (Self and Rampino, 1981), Péleé (Gueugneau et al., 2020), and Agung (Hansen et al., 1978). Moreover, heat gain is enhanced in 1980–2020, rendering a land uptake of around 14 ZJ. Even though land heat uptake intensifies in these decades, its increase is not linear, with 1990–2000 and 2010–2020 showing a deceleration in the heat uptake trend (0.4 and 0.8 ZJ, respectively) with respect to the 1970–2020 values (increasing land heat uptake of 1.2 ZJ per decade on average). The uncertainty associated with variability in soil properties is negligible and accounts for less than 0.1 ZJ decadally. Differences between sources in the intensity or the time occurrence of decadal heat gains or losses can result from differences in the representation of internal variability, as suggested by the higher consistency among estimates from observations compared to those from CMIP6 models. Products showing the greatest decadal temperature trends in Tables 1 and 2, such as ACCESS-ESM1-5 or GISTEMPv4, generate the largest storage of energy, with 16.4 and 17.2 ZJ during 1980–2020, respectively.
The estimates of land heat uptake derived from reanalyses, observational data, and CMIP6 models (Fig. 3) are compared to values previously reported in the literature derived from logged BTPs (Beltrami et al., 2002; Beltrami, 2002; von Schuckmann et al., 2020; Cuesta-Valero et al., 2023) and CRUTEM2 SAT (Huang, 2006) for the periods 1950–2000, 1960–2020, and 1971–2018 (Fig. 4). The selection of these time intervals enables the comparison with previous works. In the case of CMIP6 models, the heat estimates obtained through direct integration of both the STPs and FTPs are depicted. The MPI-ESM P2k+ estimates (Fig. 2) are also included. All the estimates from this work and the previous literature show an increasing trend in land heat uptake towards the present. The 1950–2000 interval (Fig. 4a) shows less warming in the reanalyses than in the observational derived estimates, which is particularly noteworthy for LMRv2.1 and JRA55. These two reanalyses show no heat uptake in 1950–2000, which stems from a long-lasting negative temperature anomaly in 1950–1980 that is not shown by the rest of the sources (Fig. 3a). Furthermore, CMIP6 depth-corrected estimates using FTPs are in range with the reanalysis and slightly below the observational estimates. Hence, all estimates based on FTPs agree overall with the previous estimates, with von Schuckmann et al. (2020) giving the highest land heat uptake values across all datasets. Figure 4b and c portray similar results for the periods 1960–2020 and 1971–2018, respectively. In both cases, the estimates derived from the different FTPs are consistent, with observational estimates at the upper end and some reanalyses showing the smallest land heat uptake values. For instance, land heat uptake estimates for the period 1971–2018 (Fig. 4c) range from 10.5 to 16.0 ZJ, yielding an ensemble mean of 13.9 ZJ for the CMIP6 FTPs, 12.2 ZJ for the reanalyses, and 15.0 ZJ for the observational-driven estimates. These differences are due to the smaller temperature trends shown by reanalyses and CMIP6 models when compared to observational datasets from the 1970s to the present, as shown by Fig. 3a (see Tables 1, 2 for the exact trend values).
Furthermore, Fig. 4 shows the dependency of land heat uptake on LSM depth for CMIP6 STP-derived estimates (note gray shading on the left side), evidencing a significant increase when the forward model is applied to correct estimates stemming from shallow ESMs (from 6.9 to 12.6 ZJ in 1960–2020, Fig. 4b, and from 7.0 to 13.9 ZJ in 1971–2018, Fig. 4c). Since 1950–2000 warming is very small for most of the CMIP6 models and very sensitive to the internal variability in each one (see Table 2), correcting the estimates in this case does not make a remarkable difference (Fig. 4a). Even after correcting the LSM depth bias on land heat uptake, the range in CMIP6 multi-model variability is still very large, with a standard deviation of 5.4 ZJ in 1960–2020 and 5.1 ZJ in 1971–2018. This large variability is explained by some outlier estimates (e.g., CAMS-CSM1-0 and GISS-E2-2-G) which yield very small or even negative land heat uptakes, linked to the small climate sensitivity of these models in the periods of study, as shown in Table 2. By contrast, the CMIP6 simulations showing the greatest temperature trends also show the largest corrected FTP values, some of them yielding greater estimates than the state-of-the-art estimates from von Schuckmann et al. (2020) and Cuesta-Valero et al. (2023). In all periods shown in Fig. 4, the multi-model CMIP6 mean is consistent with estimates yielded by reanalyses and observational datasets. Despite the consistency among the estimates obtained from the different datasets in this work, all of them yield results in the range of past literature values for the 1950–2000 period (Beltrami et al., 2002; Beltrami, 2002; Huang, 2006) but are lower than those in recent literature for 1960–2020 and 1971–2018, which quantified land heat uptake to be between 18.6 and 25 ZJ in 1971–2018 (von Schuckmann et al., 2020; Forster et al., 2021) and subsequently narrowed and lowered this range to be 18.0–18.4 ZJ (Cuesta-Valero et al., 2023).
We compare land surface and soil temperatures, as well as land heat uptake, from two simulations of the period 0–2100 CE made with two versions of the MPI-ESM: one including a standard shallow and the other one including a more realistic deep LSM. The deep LSM included in MPI-ESM generates about 4 times more heat uptake than the shallow version by the end of the historical period. This underestimation by the shallow LSM version only grows up to the end of the 21st century, reaching 18 ZJ for shallow and 75 ZJ for deep LSM versions. Also, while deepening the LSM produces relatively colder near-surface soil temperatures after 1850 CE, GST low-frequency variability and trends remain unchanged. This finding suggests the potential utility of employing GSTs to drive a forward model and of obtaining deep FTPs and subsequently unbiased estimates of land heat uptake. The concurrence of estimates from both STPs of P2k+d and FTPs of P2k+s and P2k+d supports the application of the forward modeling method to correct insufficient land heat uptake values stemming from shallow LSMs. The results portray a land heat gain in the industrial period which has intensified in the last decades of the 20th century and the first 2 decades of the 21st century. The FTP strategy is also applied to estimate land heat uptake from both observation-based products and CMIP6 simulations. Results are compared with previous estimates based on observational BTPs, thus providing additional information to assess consistency between model and observational-based estimates. Land heat uptake in 1971–2018 is between 10 and 16 ZJ for all sources, being around 14 ZJ for CMIP6 models. This figure doubles the 7 ZJ that CMIP6 models capture when their heat uptake capability is constrained by imposing a shallow zero-flux bottom boundary condition, which shows the relevance of the forward model in correcting model-based estimates. Reanalysis-based estimates are slightly smaller than those obtained from applying the forward model driven by observational gridded datasets or corrected CMIP6 simulations, consistent with the generally smaller reanalyses warming since 1950 relative to other datasets. SAT observation-based estimates render the highest values, consistent with SAT trends being slightly larger than those of GST. SAT-related values can thus be regarded as an upper-limit land heat uptake estimate.
Nevertheless, all observational-based and corrected CMIP6 estimates underestimate the most recent values of land heat uptake based on BTPs. This discrepancy may stem from different sources of uncertainty. One possibility is that since borehole-derived surface temperature and ground heat flux stories have a low time resolution (e.g., 25-year time step in Cuesta-Valero et al., 2021b), they may not consider the decadal cold anomalies occurring in 1960–1980 (Fig. 3). This discrepancy may play a major role since decadal surface temperature differences might alter inter-decadal land heat imbalance due to subsurface thermal inertia (Beltrami et al., 2015). Moreover, BTP logs are scarce in the last decades and non-existent after the 2000s, so borehole-based estimates for the last 2 decades stemming from von Schuckmann et al. (2020) and Cuesta-Valero et al. (2023) for 1960–2020 and 1971–2018 are yielded by extrapolating the ground heat flux temperature reconstructed in the last decades of the 20th century to the 21st century (2000–2018 and 2000–2020, respectively). This could be overlooking the global warming hiatus (1998–2012; Karl et al., 2015) effect on a relative slowdown in land heat uptake. Furthermore, the different methodological approaches used to yield observational and simulation-based (STP and FTP) heat uptake estimates might play a role. While STP- and FTP-based heat uptake values in a certain time period are rendered by integrating the differences in the temperature profiles between the initial and the final time steps of that period, previous observational land heat uptake values are yielded by estimating ground heat flux stories based on single-time BTPs at different locations to then reconstruct the global heat uptake evolution (Beltrami et al., 2002; Cuesta-Valero et al., 2023). This entails BTP-based estimates not representing net land heat variations in a certain time span but rather representing a continuous variation in land heat uptake by aggregating logs taken at different dates and locations. This subsequently implies that this methodology preserves land energy changes due to past climate signals (Beltrami et al., 2017), which may contribute to comparatively greater heat uptake estimates in recent decades. With these differences reconciled, this work contributes to bringing observational and model-based land heat uptake estimates to the same frame of comparison, by removing the bias associated with imposing LSM depths that are too shallow. The comparison between CMIP6-based and observational data-driven land heat uptake estimates can also serve as an additional metric to assess the realism of ESMs in reproducing current global warming.
MPI-ESM P2k+d SAT, GST, and subsurface temperature data in yearly resolution were stored in the following Zenodo repository: https://doi.org/10.5281/zenodo.10364950; García-Pereira et al., 2023. This repository also includes the land mask, heat capacity, and volumetric heat capacity maps used by MPI-ESM to resolve the vertical subsurface thermal scheme. Both MPI-ESM P2k+s (MPI-ESM1.2-LR, Experiment ID: past2k) and CMIP6 surface and subsurface temperature data are publicly available on the different data servers provided by ESGF (https://esgf-node.llnl.gov/projects/cmip6/, CMIP, 2019). Reanalysis and observational gridded datasets stem from different open sources, whose links can be found in the referenced papers in Table 1. Previous observational estimates for the land heat uptake were taken directly from the published papers for Beltrami (2002), Beltrami et al. (2002), and Huang (2006) and from GCOS EHI database (https://hdl.handle.net/21.14106/279f535efb48324f4f604bb390f74deadf268812; von Schuckmann et al., 2022) for von Schuckmann et al. (2020) and Cuesta-Valero et al. (2023). The half-infinite forward model used in this work is provided by CIBOR (https://github.com/cuestavalero/CIBOR; Cuesta-Valero, 2022; Cuesta-Valero et al., 2022). A numerical version of the forward model, ConForM (v1.0), which allows us to impose a finite-depth (non-)zero flux bottom boundary condition and a geothermal gradient, is also available at the following Zenodo repository: https://doi.org/10.5281/zenodo.10371439; Garcia-Pereira and González-Rouco, 2023.
FGP and JFGR conceptualized the study. FGP, CMA, and NJS assembled and processed the data, and FGP performed the calculations. All co-authors contributed to the analysis and discussion of the results. FGP and JFGR prepared the article with contributions from all co-authors.
The contact author has declared that none of the authors has any competing interests.
Publisher’s note: Copernicus Publications remains neutral with regard to jurisdictional claims made in the text, published maps, institutional affiliations, or any other geographical representation in this paper. While Copernicus Publications makes every effort to include appropriate place names, the final responsibility lies with the authors.
This work has been developed within the framework of GreatModelS (project no. RTI2018-102305-BC21) and SMILEME (project no. PID2021-126696OB-C21) from the Spanish Ministry of Science and Innovation (MICINN) and CSIC Interdisciplinary Thematic Platform (PTI) Polar Zone Observatory (PTI-POLARCSIC). We would also like to thank the Deutsches Klimarechenzentrum (DKRZ) for the resources granted by its Scientific Steering Committee (WLA) to run the MPIESM1.2-LR P2k+d simulation under project ID bm1026. We also appreciate the efforts of the World Climate Research Programme's Working Group on Coupled Modeling, responsible for CMIP, and the climate modeling groups responsible for the model simulations used herein (Table 2) in making their simulation outputs accessible.
This research has been financially supported by SMILEME (project no. PID2021-126696OBC21), funded by call no. MCIN/AEI/10.13039/501100011033 from the Spanish Ministry of Science and Innovation (MICINN). Félix García-Pereira was funded by contract no. PRE2019-090694 of the MICINN. The scientific contribution from Elena García-Bustamante is connected with the research developed for the Spanish project SmileAtYou (project no. PID2022-139719OB-I00). Francisco José Cuesta-Valero was partially supported as a Research Fellow of the Alexander von Humboldt Foundation and by ESA as part of the Climate Change Initiative (CCI) fellowship program. Hugo Beltrami is supported by a Natural Sciences and Engineering Research Council of Canada Discovery Grant (contract no. NSERC DG 140576948), the Canada Research Chairs Program (CRC 230687), and AceNet.
This paper was edited by Rui A. P. Perdigão and reviewed by two anonymous referees.
Abraham, J. P., Baringer, M., Bindoff, N. L., Boyer, T., Cheng, L. J., Church, J. A., Conroy, J. L., Domingues, C. M., Fasullo, J. T., Gilson, J., Goni, G., Good, S. A., Gorman, J. M., Gouretski, V., Ishii, M., Johnson, G. C., Kizu, S., Lyman, J. M., Macdonald, A. M., Minkowycz, W. J., Moffitt, S. E., Palmer, M. D., Piola, A. R., Reseghetti, F., Schuckmann, K., Trenberth, K. E., Velicogna, I., and Willis, J. K.: A review of global ocean temperature observations: Implications for ocean heat content estimates and climate change, Rev. Geophys., 51, 450–483, https://doi.org/10.1002/rog.20022, 2013. a
Alexeev, V. A., Nicolsky, D. J., Romanovsky, V. E., and Lawrence, D. M.: An evaluation of deep soil configurations in the CLM3 for improved representation of permafrost, Geophys. Res. Lett., 34, L09502, https://doi.org/10.1029/2007GL029536, 2007. a, b, c
Andresen, C. G., Lawrence, D. M., Wilson, C. J., McGuire, A. D., Koven, C., Schaefer, K., Jafarov, E., Peng, S., Chen, X., Gouttevin, I., Burke, E., Chadburn, S., Ji, D., Chen, G., Hayes, D., and Zhang, W.: Soil moisture and hydrology projections of the permafrost region – a model intercomparison, The Cryosphere, 14, 445–459, https://doi.org/10.5194/tc-14-445-2020, 2020. a
Beltrami, H.: Climate from borehole data: Energy fluxes and temperatures since 1500, Geophys. Res. Lett., 29, 26-1–26-4, https://doi.org/10.1029/2002GL015702, 2002. a, b, c, d
Beltrami, H., Smerdon, J. E., Pollack, H. N., and Huang, S.: Continental heat gain in the global climate system, Geophys. Res. Lett., 29, 8-1–8-3, https://doi.org/10.1029/2001GL014310, 2002. a, b, c, d, e, f
Beltrami, H., Matharoo, G. S., and Smerdon, J. E.: Impact of borehole depths on reconstructed estimates of ground surface temperature histories and energy storage, J. Geophys. Res.-Earth, 120, 763–778, https://doi.org/10.1002/2014JF003382, 2015. a, b
Beltrami, H., Matharoo, G. S., Smerdon, J. E., Illanes, L., and Tarasov, L.: Impacts of the Last Glacial Cycle on ground surface temperature reconstructions over the last millennium, Geophys. Res. Lett., 44, 355–364, https://doi.org/10.1002/2016GL071317, 2017. a
Bi, D., Dix, M., Marsland, S., O'Farrell, S., Sullivan, A., Bodman, R., Law, R., Harman, I., Jhan, S., Rashid, H., Dobrohotoff, P., Chloe, M., Hailin, Y., Tony, H., Savita, A., Dias, F., Fiedler, R., and Heerdegen, A.: Configuration and spin-up of ACCESS-CM2, the new generation Australian Community Climate and Earth System Simulator Coupled Model, Journal of Southern Hemisphere Earth System Science, 70, 225–251, https://doi.org/10.1071/ES19040, 2020. a
Boucher, O., Servonnat, J., Albright, A. L., Aumont, O., Balkanski, Y., Bastrikov, V., Bekki, S., Bonnet, R., Bony, S., Bopp, L., Braconnot, P., Brockmann, P., Cadule, P., Caubel, A., Cheruy, F., Codron, F., Cozic, A., Cugnet, D., D'Andrea, F., Davini, P., de Lavergne, C., Denvil, S., Deshayes, J., Devilliers, M., Ducharne, A., Dufresne, J.-L., Dupont, E., Éthé, C., Fairhead, L., Falletti, L., Flavoni, S., Foujols, M.-A., Gardoll, S., Gastineau, G., Ghattas, J., Grandpeix, J.-Y., Guenet, B., Guez, Lionel, E., Guilyardi, E., Guimberteau, M., Hauglustaine, D., Hourdin, F., Idelkadi, A., Joussaume, S., Kageyama, M., Khodri, M., Krinner, G., Lebas, N., Levavasseur, G., Lévy, C., Li, L., Lott, F., Lurton, T., Luyssaert, S., Madec, G., Madeleine, J.-B., Maignan, F., Marchand, M., Marti, O., Mellul, L., Meurdesoif, Y., Mignot, J., Musat, I., Ottlé, C., Peylin, P., Planton, Y., Polcher, J., Rio, C., Rochetin, N., Rousset, C., Sepulchre, P., Sima, A., Swingedouw, D., Thiéblemont, R., Traore, A. K., Vancoppenolle, M., Vial, J., Vialard, J., Viovy, N., and Vuichard, N.: Presentation and Evaluation of the IPSL-CM6A-LR Climate Model, J. Adv. Model. Earth Sy., 12, e2019MS002010, https://doi.org/10.1029/2019MS002010, 2020. a
Carslaw, H. S. and Jaeger, J. C.: Conduction of heat in solids, vol. 2nd ed., Clarendon Press, Oxford University Press, Oxford, United Kingdom, ISBN 0198533683, 1959. a
Chen, H.-M., Li, J., Su, J.-Z., Hua, L.-J., Rong, X.-Y., Xin, Y.-F., and Zhang, Z.-Q.: Introduction of CAMS-CSM model and its participation in CMIP6, Advances in Climate Change Research, 15, 540, https://doi.org/10.12006/j.issn.1673-1719.2019.186, 2019. a
Cherchi, A., Fogli, P. G., Lovato, T., Peano, D., Iovino, D., Gualdi, S., Masina, S., Scoccimarro, E., Materia, S., Bellucci, A., and Navarra, A.: Global Mean Climate and Main Patterns of Variability in the CMCC-CM2 Coupled Model, J. Adv. Model. Earth Sy., 11, 185–209, https://doi.org/10.1029/2018MS001369, 2019. a
CMIP: Coupled Model Intercomparison Project (Phase 6), Earth System Grid Federation – ESGF [data set], https://esgf-node.llnl.gov/projects/cmip6/ (last access: 17 January 2023), 2019. a
Cuesta-Valero, F. J.: CIBOR: Codes for Inverting BOReholes (Version 1.0.0), GitHub [code], https://github.com/cuestavalero/CIBOR (last access: 24 November 2023), 2022. a
Cuesta-Valero, F. J., García-García, A., Beltrami, H., and Smerdon, J. E.: First assessment of continental energy storage in CMIP5 simulations, Geophys. Res. Lett., 43, 5326–5335, https://doi.org/10.1002/2016GL068496, 2016. a
Cuesta-Valero, F. J., García-García, A., Beltrami, H., and Finnis, J.: First assessment of the earth heat inventory within CMIP5 historical simulations, Earth Syst. Dynam., 12, 581–600, https://doi.org/10.5194/esd-12-581-2021, 2021a. a, b
Cuesta-Valero, F. J., García-García, A., Beltrami, H., González-Rouco, J. F., and García-Bustamante, E.: Long-term global ground heat flux and continental heat storage from geothermal data, Clim. Past, 17, 451–468, https://doi.org/10.5194/cp-17-451-2021, 2021b. a, b, c
Cuesta-Valero, F. J., García-García, A., Beltrami, H., González-Rouco, J. F., and García-Bustamante, E.: Xibalbá: Underground Temperature Database, figshare, https://doi.org/10.6084/m9.figshare.13516487.v4, 2021c. a
Cuesta-Valero, F. J., Beltrami, H., Gruber, S., García-García, A., and González-Rouco, J. F.: A new bootstrap technique to quantify uncertainty in estimates of ground surface temperature and ground heat flux histories from geothermal data, Geosci. Model Dev., 15, 7913–7932, https://doi.org/10.5194/gmd-15-7913-2022, 2022. a, b, c, d
Cuesta-Valero, F. J., Beltrami, H., García-García, A., Krinner, G., Langer, M., MacDougall, A. H., Nitzbon, J., Peng, J., von Schuckmann, K., Seneviratne, S. I., Thiery, W., Vanderkelen, I., and Wu, T.: Continental heat storage: contributions from the ground, inland waters, and permafrost thawing, Earth Syst. Dynam., 14, 609–627, https://doi.org/10.5194/esd-14-609-2023, 2023. a, b, c, d, e, f, g, h, i, j, k
Danabasoglu, G., Lamarque, J.-F., Bacmeister, J., Bailey, D. A., DuVivier, A. K., Edwards, J., Emmons, L. K., Fasullo, J., Garcia, R., Gettelman, A., Hannay, C., Holland, M. M., Large, W. G., Lauritzen, P. H., Lawrence, D. M., Lenaerts, J. T. M., Lindsay, K., Lipscomb, W. H., Mills, M. J., Neale, R., Oleson, K. W., Otto-Bliesner, B., Phillips, A. S., Sacks, W., Tilmes, S., van Kampenhout, L., Vertenstein, M., Bertini, A., Dennis, J., Deser, C., Fischer, C., Fox-Kemper, B., Kay, J. E., Kinnison, D., Kushner, P. J., Larson, V. E., Long, M. C., Mickelson, S., Moore, J. K., Nienhouse, E., Polvani, L., Rasch, P. J., and Strand, W. G.: The Community Earth System Model Version 2 (CESM2), J. Adv. Model. Earth Sy., 12, e2019MS001916, https://doi.org/10.1029/2019MS001916, 2020. a
Davison, A. C. and Hinkley, D. V.: Bootstrap Methods and their Application, Cambridge Series in Statistical and Probabilistic Mathematics, Cambridge University Press, https://doi.org/10.1017/CBO9780511802843, 1997. a, b
Döscher, R., Acosta, M., Alessandri, A., Anthoni, P., Arsouze, T., Bergman, T., Bernardello, R., Boussetta, S., Caron, L.-P., Carver, G., Castrillo, M., Catalano, F., Cvijanovic, I., Davini, P., Dekker, E., Doblas-Reyes, F. J., Docquier, D., Echevarria, P., Fladrich, U., Fuentes-Franco, R., Gröger, M., v. Hardenberg, J., Hieronymus, J., Karami, M. P., Keskinen, J.-P., Koenigk, T., Makkonen, R., Massonnet, F., Ménégoz, M., Miller, P. A., Moreno-Chamarro, E., Nieradzik, L., van Noije, T., Nolan, P., O'Donnell, D., Ollinaho, P., van den Oord, G., Ortega, P., Prims, O. T., Ramos, A., Reerink, T., Rousset, C., Ruprich-Robert, Y., Le Sager, P., Schmith, T., Schrödner, R., Serva, F., Sicardi, V., Sloth Madsen, M., Smith, B., Tian, T., Tourigny, E., Uotila, P., Vancoppenolle, M., Wang, S., Wårlind, D., Willén, U., Wyser, K., Yang, S., Yepes-Arbós, X., and Zhang, Q.: The EC-Earth3 Earth system model for the Coupled Model Intercomparison Project 6, Geosci. Model Dev., 15, 2973–3020, https://doi.org/10.5194/gmd-15-2973-2022, 2022. a, b
Dunne, J. P., Horowitz, L. W., Adcroft, A. J., Ginoux, P., Held, I. M., John, J. G., Krasting, J. P., Malyshev, S., Naik, V., Paulot, F., Shevliakova, E., Stock, C. A., Zadeh, N., Balaji, V., Blanton, C., Dunne, K. A., Dupuis, C., Durachta, J., Dussin, R., Gauthier, P. P. G., Griffies, S. M., Guo, H., Hallberg, R. W., Harrison, M., He, J., Hurlin, W., McHugh, C., Menzel, R., Milly, P. C. D., Nikonov, S., Paynter, D. J., Ploshay, J., Radhakrishnan, A., Rand, K., Reichl, B. G., Robinson, T., Schwarzkopf, D. M., Sentman, L. T., Underwood, S., Vahlenkamp, H., Winton, M., Wittenberg, A. T., Wyman, B., Zeng, Y., and Zhao, M.: The GFDL Earth System Model Version 4.1 (GFDL-ESM 4.1): Overall Coupled Model Description and Simulation Characteristics, J. Adv. Model. Earth Sy., 12, e2019MS002015, https://doi.org/10.1029/2019MS002015, 2020. a
Ebita, A., Kobayashi, S., Ota, Y., Moriya, M., Kumabe, R., Onogi, K., Harada, Y., Yasui, S., Miyaoka, K., Takahashi, K., Kamahori, H., Kobayashi, C., Endo, H., Soma, M., Oikawa, Y., and Ishimizu, T.: The Japanese 55-year Reanalysis JRA-55: An Interim Report, SOLA, 7, 149–152, https://doi.org/10.2151/sola.2011-038, 2011. a
Eyring, V., Bony, S., Meehl, G. A., Senior, C. A., Stevens, B., Stouffer, R. J., and Taylor, K. E.: Overview of the Coupled Model Intercomparison Project Phase 6 (CMIP6) experimental design and organization, Geosci. Model Dev., 9, 1937–1958, https://doi.org/10.5194/gmd-9-1937-2016, 2016. a, b, c
Forster, P., Storelvmo, T., Armour, K., Collins, W., Dufresne, J.-L., Frame, D., Lunt, D., Mauritsen, T., Palmer, M., Watanabe, M., Wild, M., and Zhang, H.: The Earth's Energy Budget, Climate Feedbacks, and Climate Sensitivity, in: Climate Change 2021: The Physical Science Basis, Contribution of Working Group I to the Sixth Assessment Report of the Intergovernmental Panel on Climate Change, edited by: Masson-Delmotte, V., Zhai, P., Pirani, A., Connors, S. L., Péan, C., Berger, S., Caud, N., Chen, Y., Goldfarb, L., Gomis, M. I., Huang, M., Leitzell, K., Lonnoy, E., Matthews, J. B. R., Maycock, T. K., Waterfield, T., Yelekçi, O., Yu, R., and Zhou, B., 923–1054, Cambridge University Press, Cambridge, https://doi.org/10.1017/9781009157896.009, 2021. a, b, c, d
García-García, A., Cuesta-Valero, F. J., Miralles, D. G., Mahecha, M. D., Quaas, J., Reichstein, M., Zscheischler, J., and Peng, J.: Soil heat extremes can outpace air temperature extremes, Nat. Clim. Change, 13, 1237–1241, https://doi.org/10.1038/s41558-023-01812-3, 2023. a
Garcia-Pereira, F. and González-Rouco, J. F.: ConForM: a one-dimensional heat Conduction Forward Model, Zenodo [code], https://doi.org/10.5281/zenodo.10371439, 2023. a
García-Pereira, F., González-Rouco, J. F., and Johann, J.: MPI-ESM1.2-LR P2k+ with a deep version of JSBACH (MPI-ESM P2k+d), Zenodo [data set], https://doi.org/10.5281/zenodo.10364950, 2023. a
Gettelman, A., Mills, M. J., Kinnison, D. E., Garcia, R. R., Smith, A. K., Marsh, D. R., Tilmes, S., Vitt, F., Bardeen, C. G., McInerny, J., Liu, H.-L., Solomon, S. C., Polvani, L. M., Emmons, L. K., Lamarque, J.-F., Richter, J. H., Glanville, A. S., Bacmeister, J. T., Phillips, A. S., Neale, R. B., Simpson, I. R., DuVivier, A. K., Hodzic, A., and Randel, W. J.: The Whole Atmosphere Community Climate Model Version 6 (WACCM6), J. Geophys. Res.-Atmos., 124, 12380–12403, https://doi.org/10.1029/2019JD030943, 2019. a
Golaz, J.-C., Caldwell, P. M., Van Roekel, L. P., Petersen, M. R., Tang, Q., Wolfe, J. D., Abeshu, G., Anantharaj, V., Asay-Davis, X. S., Bader, D. C., Baldwin, S. A., Bisht, G., Bogenschutz, P. A., Branstetter, M., Brunke, M. A., Brus, S. R., Burrows, S. M., Cameron-Smith, P. J., Donahue, A. S., Deakin, M., Easter, R. C., Evans, K. J., Feng, Y., Flanner, M., Foucar, J. G., Fyke, J. G., Griffin, B. M., Hannay, C., Harrop, B. E., Hoffman, M. J., Hunke, E. C., Jacob, R. L., Jacobsen, D. W., Jeffery, N., Jones, P. W., Keen, N. D., Klein, S. A., Larson, V. E., Leung, L. R., Li, H.-Y., Lin, W., Lipscomb, W. H., Ma, P.-L., Mahajan, S., Maltrud, M. E., Mametjanov, A., McClean, J. L., McCoy, R. B., Neale, R. B., Price, S. F., Qian, Y., Rasch, P. J., Reeves Eyre, J. E. J., Riley, W. J., Ringler, T. D., Roberts, A. F., Roesler, E. L., Salinger, A. G., Shaheen, Z., Shi, X., Singh, B., Tang, J., Taylor, M. A., Thornton, P. E., Turner, A. K., Veneziani, M., Wan, H., Wang, H., Wang, S., Williams, D. N., Wolfram, P. J., Worley, P. H., Xie, S., Yang, Y., Yoon, J.-H., Zelinka, M. D., Zender, C. S., Zeng, X., Zhang, C., Zhang, K., Zhang, Y., Zheng, X., Zhou, T., and Zhu, Q.: The DOE E3SM Coupled Model Version 1: Overview and Evaluation at Standard Resolution, J. Adv. Model. Earth Sy., 11, 2089–2129, https://doi.org/10.1029/2018MS001603, 2019. a, b
González-Rouco, J. F., Beltrami, H., Zorita, E., and von Storch, H.: Simulation and inversion of borehole temperature profiles in surrogate climates: Spatial distribution and surface coupling, Geophys. Res. Lett., 33, L01703, https://doi.org/10.1029/2005GL024693, 2006. a
González-Rouco, J. F., Beltrami, H., Zorita, E., and Stevens, M. B.: Borehole climatology: a discussion based on contributions from climate modeling, Clim. Past, 5, 97–127, https://doi.org/10.5194/cp-5-97-2009, 2009. a, b
González-Rouco, J. F., Steinert, N. J., García-Bustamante, E., Hagemann, S., de Vrese, P., Jungclaus, J. H., Lorenz, S. J., Melo-Aguilar, C., García-Pereira, F., and Navarro, J.: Increasing the Depth of a Land Surface Model. Part I: Impacts on the Subsurface Thermal Regime and Energy Storage, J. Hydrometeorol., 22, 3211–3230, https://doi.org/10.1175/JHM-D-21-0024.1, 2021. a, b, c, d, e, f, g
Gueugneau, V., Kelfoun, K., Charbonnier, S., Germa, A., and Carazzo, G.: Dynamics and Impacts of the May 8th, 1902 Pyroclastic Current at Mount Pelée (Martinique): New Insights From Numerical Modeling, Front. Earth Sci., 8, 279, https://doi.org/10.3389/feart.2020.00279, 2020. a
Gulev, S., Thorne, P., Ahn, J., Dentener, F., Domingues, C., Gerland, S., Gong, D., Kaufman, D., Nnamchi, H., Quaas, J., Rivera, J., Sathyendranath, S., Smith, S., Trewin, B., von Schuckmann, K., and Vose, R.: Changing State of the Climate System, in: Climate Change 2021: The Physical Science Basis. Contribution of Working Group I to the Sixth Assessment Report of the Intergovernmental Panel on Climate Change, edited by: Masson-Delmotte, V., Zhai, P., Pirani, A., Connors, S. L., Péan, C., Berger, S., Caud, N., Chen, Y., Goldfarb, L., Gomis, M. I., Huang, M., Leitzell, K., Lonnoy, E., Matthews, J. B. R., Maycock, T. K., Waterfield, T., Yelekçi, O., Yu, R., and Zhou, B., 287–422, Cambridge University Press, Cambridge, https://doi.org/10.1017/9781009157896.004, 2021. a
Hajima, T., Watanabe, M., Yamamoto, A., Tatebe, H., Noguchi, M. A., Abe, M., Ohgaito, R., Ito, A., Yamazaki, D., Okajima, H., Ito, A., Takata, K., Ogochi, K., Watanabe, S., and Kawamiya, M.: Development of the MIROC-ES2L Earth system model and the evaluation of biogeochemical processes and feedbacks, Geosci. Model Dev., 13, 2197–2244, https://doi.org/10.5194/gmd-13-2197-2020, 2020. a
Hansen, J. E., Wang, W.-C., and Lacis, A. A.: Mount Agung Eruption Provides Test of a Global Climatic Perturbation, Science, 199, 1065–1068, https://doi.org/10.1126/science.199.4333.1065, 1978. a
He, B., Yu, Y., Bao, Q., Lin, P., Liu, H., Li, J., Wang, L., Liu, Y., Wu, G., Chen, K., Guo, Y., Zhao, S., Zhang, X., Song, M., and Xie, J.: CAS FGOALS-f3-L model dataset descriptions for CMIP6 DECK experiments, Atmospheric and Oceanic Science Letters, 13, 582–588, https://doi.org/10.1080/16742834.2020.1778419, 2020. a
Held, I. M., Guo, H., Adcroft, A., Dunne, J. P., Horowitz, L. W., Krasting, J., Shevliakova, E., Winton, M., Zhao, M., Bushuk, M., Wittenberg, A. T., Wyman, B., Xiang, B., Zhang, R., Anderson, W., Balaji, V., Donner, L., Dunne, K., Durachta, J., Gauthier, P. P. G., Ginoux, P., Golaz, J.-C., Griffies, S. M., Hallberg, R., Harris, L., Harrison, M., Hurlin, W., John, J., Lin, P., Lin, S.-J., Malyshev, S., Menzel, R., Milly, P. C. D., Ming, Y., Naik, V., Paynter, D., Paulot, F., Rammaswamy, V., Reichl, B., Robinson, T., Rosati, A., Seman, C., Silvers, L. G., Underwood, S., and Zadeh, N.: Structure and Performance of GFDL's CM4.0 Climate Model, J. Adv. Model. Earth Sy., 11, 3691–3727, https://doi.org/10.1029/2019MS001829, 2019. a
Hermoso de Mendoza, I., Beltrami, H., MacDougall, A. H., and Mareschal, J.-C.: Lower boundary conditions in land surface models – effects on the permafrost and the carbon pools: a case study with CLM4.5, Geosci. Model Dev., 13, 1663–1683, https://doi.org/10.5194/gmd-13-1663-2020, 2020. a
Huang, S.: 1851–2004 annual heat budget of the continental landmasses, Geophys. Res. Lett., 33, L04707, https://doi.org/10.1029/2005GL025300, 2006. a, b, c, d, e
Huang, S., Pollack, H., and Shen, P.: Temperature trends over the five past centuries reconstructed from borehole temperature, Nature, 403, 756–758, https://doi.org/10.1038/35001556, 2000. a, b
Jungclaus, J. H., Bard, E., Baroni, M., Braconnot, P., Cao, J., Chini, L. P., Egorova, T., Evans, M., González-Rouco, J. F., Goosse, H., Hurtt, G. C., Joos, F., Kaplan, J. O., Khodri, M., Klein Goldewijk, K., Krivova, N., LeGrande, A. N., Lorenz, S. J., Luterbacher, J., Man, W., Maycock, A. C., Meinshausen, M., Moberg, A., Muscheler, R., Nehrbass-Ahles, C., Otto-Bliesner, B. I., Phipps, S. J., Pongratz, J., Rozanov, E., Schmidt, G. A., Schmidt, H., Schmutz, W., Schurer, A., Shapiro, A. I., Sigl, M., Smerdon, J. E., Solanki, S. K., Timmreck, C., Toohey, M., Usoskin, I. G., Wagner, S., Wu, C.-J., Yeo, K. L., Zanchettin, D., Zhang, Q., and Zorita, E.: The PMIP4 contribution to CMIP6 – Part 3: The last millennium, scientific objective, and experimental design for the PMIP4 past1000 simulations, Geosci. Model Dev., 10, 4005–4033, https://doi.org/10.5194/gmd-10-4005-2017, 2017. a, b
Kageyama, M., Braconnot, P., Harrison, S. P., Haywood, A. M., Jungclaus, J. H., Otto-Bliesner, B. L., Peterschmitt, J.-Y., Abe-Ouchi, A., Albani, S., Bartlein, P. J., Brierley, C., Crucifix, M., Dolan, A., Fernandez-Donado, L., Fischer, H., Hopcroft, P. O., Ivanovic, R. F., Lambert, F., Lunt, D. J., Mahowald, N. M., Peltier, W. R., Phipps, S. J., Roche, D. M., Schmidt, G. A., Tarasov, L., Valdes, P. J., Zhang, Q., and Zhou, T.: The PMIP4 contribution to CMIP6 – Part 1: Overview and over-arching analysis plan, Geosci. Model Dev., 11, 1033–1057, https://doi.org/10.5194/gmd-11-1033-2018, 2018. a
Kalnay, E., Kanamitsu, M., Kistler, R., Collins, W., Deaven, D., Gandin, L., Iredell, M., Saha, S., White, G., Woollen, J., Zhu, Y., Chelliah, M., Ebisuzaki, W., Higgins, W., Janowiak, J., Mo, K. C., Ropelewski, C., Wang, J., Leetmaa, A., Reynolds, R., Jenne, R., and Joseph, D.: The NCEP/NCAR 40-Year Reanalysis Project, B. Am. Meteor. Soc., 77, 437–472, https://doi.org/10.1175/1520-0477(1996)077<0437:TNYRP>2.0.CO;2, 1996. a
Karl, T. R., Arguez, A., Huang, B., Lawrimore, J. H., McMahon, J. R., Menne, M. J., Peterson, T. C., Vose, R. S., and Zhang, H.-M.: Possible artifacts of data biases in the recent global surface warming hiatus, Science, 348, 1469–1472, https://doi.org/10.1126/science.aaa5632, 2015. a
Kelley, M., Schmidt, G. A., Nazarenko, L. S., Bauer, S. E., Ruedy, R., Russell, G. L., Ackerman, A. S., Aleinov, I., Bauer, M., Bleck, R., Canuto, V., Cesana, G., Cheng, Y., Clune, T. L., Cook, B. I., Cruz, C. A., Del Genio, A. D., Elsaesser, G. S., Faluvegi, G., Kiang, N. Y., Kim, D., Lacis, A. A., Leboissetier, A., LeGrande, A. N., Lo, K. K., Marshall, J., Matthews, E. E., McDermid, S., Mezuman, K., Miller, R. L., Murray, L. T., Oinas, V., Orbe, C., García-Pando, C. P., Perlwitz, J. P., Puma, M. J., Rind, D., Romanou, A., Shindell, D. T., Sun, S., Tausnev, N., Tsigaridis, K., Tselioudis, G., Weng, E., Wu, J., and Yao, M.-S.: GISS-E2.1: Configurations and Climatology, J. Adv. Model. Earth Sy., 12, e2019MS002025, https://doi.org/10.1029/2019MS002025, 2020. a, b
Krakauer, N. Y., Puma, M. J., and Cook, B. I.: Impacts of soil–aquifer heat and water fluxes on simulated global climate, Hydrol. Earth Syst. Sci., 17, 1963–1974, https://doi.org/10.5194/hess-17-1963-2013, 2013. a
Laloyaux, P., de Boisseson, E., Balmaseda, M., Bidlot, J.-R., Broennimann, S., Buizza, R., Dalhgren, P., Dee, D., Haimberger, L., Hersbach, H., Kosaka, Y., Martin, M., Poli, P., Rayner, N., Rustemeier, E., and Schepers, D.: CERA-20C: A Coupled Reanalysis of the Twentieth Century, J. Adv. Model. Earth Sy., 10, 1172–1195, https://doi.org/10.1029/2018MS001273, 2018. a
Lawrence, D. M., Fisher, R. A., Koven, C. D., Oleson, K. W., Swenson, S. C., Bonan, G., Collier, N., Ghimire, B., van Kampenhout, L., Kennedy, D., Kluzek, E., Lawrence, P. J., Li, F., Li, H., Lombardozzi, D., Riley, W. J., Sacks, W. J., Shi, M., Vertenstein, M., Wieder, W. R., Xu, C., Ali, A. A., Badger, A. M., Bisht, G., van den Broeke, M., Brunke, M. A., Burns, S. P., Buzan, J., Clark, M., Craig, A., Dahlin, K., Drewniak, B., Fisher, J. B., Flanner, M., Fox, A. M., Gentine, P., Hoffman, F., Keppel-Aleks, G., Knox, R., Kumar, S., Lenaerts, J., Leung, L. R., Lipscomb, W. H., Lu, Y., Pandey, A., Pelletier, J. D., Perket, J., Randerson, J. T., Ricciuto, D. M., Sanderson, B. M., Slater, A., Subin, Z. M., Tang, J., Thomas, R. Q., Val Martin, M., and Zeng, X.: The Community Land Model Version 5: Description of New Features, Benchmarking, and Impact of Forcing Uncertainty, J. Adv. Model. Earth Sy., 11, 4245–4287, https://doi.org/10.1029/2018MS001583, 2019. a
Lee, J., Kim, J., Sun, M.-A., Kim, B.-H., Moon, H., Sung, H. M., Kim, J., and Byun, Y.-H.: Evaluation of the Korea Meteorological Administration Advanced Community Earth-System model (K-ACE), Asia-Pac. J. Atmos. Sci., 56, 381–395, https://doi.org/10.1007/s13143-019-00144-7, 2019. a
Lenssen, N. J. L., Schmidt, G. A., Hansen, J. E., Menne, M. J., Persin, A., Ruedy, R., and Zyss, D.: Improvements in the GISTEMP Uncertainty Model, J. Geophys. Res.-Atmos., 124, 6307–6326, https://doi.org/10.1029/2018JD029522, 2019. a
Levitus, S., Antonov, J. I., Boyer, T. P., Baranova, O. K., Garcia, H. E., Locarnini, R. A., Mishonov, A. V., Reagan, J. R., Seidov, D., Yarosh, E. S., and Zweng, M. M.: World ocean heat content and thermosteric sea level change (0–2000 m), 1955–2010, Geophys. Res. Lett., 39, L10603, https://doi.org/10.1029/2012GL051106, 2012. a
Li, L., Yu, Y., Tang, Y., Lin, P., Xie, J., Song, M., Dong, L., Zhou, T., Liu, L., Wang, L., Pu, Y., Chen, X., Chen, L., Xie, Z., Liu, H., Zhang, L., Huang, X., Feng, T., Zheng, W., Xia, K., Liu, H., Liu, J., Wang, Y., Wang, L., Jia, B., Xie, F., Wang, B., Zhao, S., Yu, Z., Zhao, B., and Wei, J.: The Flexible Global Ocean-Atmosphere-Land System Model Grid-Point Version 3 (FGOALS-g3): Description and Evaluation, J. Adv. Model. Earth Sy., 12, e2019MS002012, https://doi.org/10.1029/2019MS002012, 2020. a
Lovato, T., Peano, D., Butenschön, M., Materia, S., Iovino, D., Scoccimarro, E., Fogli, P. G., Cherchi, A., Bellucci, A., Gualdi, S., Masina, S., and Navarra, A.: CMIP6 Simulations With the CMCC Earth System Model (CMCC-ESM2), J. Adv. Model. Earth Sy., 14, e2021MS002814, https://doi.org/10.1029/2021MS002814, 2022. a
MacDougall, A. H., González-Rouco, J. F., Stevens, M. B., and Beltrami, H.: Quantification of subsurface heat storage in a GCM simulation, Geophys. Res. Lett., 35, L13702, https://doi.org/10.1029/2008GL034639, 2008. a, b
Mareschal, J. and Beltrami, H.: Evidence for recent warming from perturbed geothermal gradients: examples from eastern Canada, Clim. Dynam., 6, 135–143, https://doi.org/10.1007/BF00193525, 1992. a, b, c, d
Mauritsen, T. and Roeckner, E.: Tuning the MPI-ESM1.2 Global Climate Model to Improve the Match With Instrumental Record Warming by Lowering Its Climate Sensitivity, J. Adv. Model. Earth Sy., 12, e2019MS002037, https://doi.org/10.1029/2019MS002037, 2020. a
Mauritsen, T., Bader, J., Becker, T., Behrens, J., Bittner, M., Brokopf, R., Brovkin, V., Claussen, M., Crueger, T., Esch, M., Fast, I., Fiedler, S., Fläschner, D., Gayler, V., Giorgetta, M., Goll, D. S., Haak, H., Hagemann, S., Hedemann, C., Hohenegger, C., Ilyina, T., Jahns, T., Jimenéz-de-la Cuesta, D., Jungclaus, J., Kleinen, T., Kloster, S., Kracher, D., Kinne, S., Kleberg, D., Lasslop, G., Kornblueh, L., Marotzke, J., Matei, D., Meraner, K., Mikolajewicz, U., Modali, K., Möbis, B., Müller, W. A., Nabel, J. E. M. S., Nam, C. C. W., Notz, D., Nyawira, S.-S., Paulsen, H., Peters, K., Pincus, R., Pohlmann, H., Pongratz, J., Popp, M., Raddatz, T. J., Rast, S., Redler, R., Reick, C. H., Rohrschneider, T., Schemann, V., Schmidt, H., Schnur, R., Schulzweida, U., Six, K. D., Stein, L., Stemmler, I., Stevens, B., von Storch, J.-S., Tian, F., Voigt, A., Vrese, P., Wieners, K.-H., Wilkenskjeld, S., Winkler, A., and Roeckner, E.: Developments in the MPI-M Earth System Model version 1.2 (MPI-ESM1.2) and Its Response to Increasing CO2, J. Adv. Model. Earth Sy., 11, 998–1038, https://doi.org/10.1029/2018MS001400, 2019. a, b, c
Mccormick, M., Thomason, L., and Trepte, C.: Atmospheric effects of the Mt Pinatubo eruption, Nature, 373, 399–404, https://doi.org/10.1038/373399a0, 1995. a
Melo-Aguilar, C., González-Rouco, J. F., García-Bustamante, E., Navarro-Montesinos, J., and Steinert, N.: Influence of radiative forcing factors on ground–air temperature coupling during the last millennium: implications for borehole climatology, Clim. Past, 14, 1583–1606, https://doi.org/10.5194/cp-14-1583-2018, 2018. a, b, c
Melo-Aguilar, C., González-Rouco, J. F., García-Bustamante, E., Steinert, N., Jungclaus, J. H., Navarro, J., and Roldán-Gómez, P. J.: Methodological and physical biases in global to subcontinental borehole temperature reconstructions: an assessment from a pseudo-proxy perspective, Clim. Past, 16, 453–474, https://doi.org/10.5194/cp-16-453-2020, 2020. a
Miller, G. H., Geirsdóttir, A., Zhong, Y., Larsen, D. J., Otto-Bliesner, B. L., Holland, M. M., Bailey, D. A., Refsnider, K. A., Lehman, S. J., Southon, J. R., Anderson, C., Björnsson, H., and Thordarson, T.: Abrupt onset of the Little Ice Age triggered by volcanism and sustained by sea-ice/ocean feedbacks, Geophys. Res. Lett., 39, L02708, https://doi.org/10.1029/2011GL050168, 2012. a
Mottaghy, D. and Rath, V.: Latent heat effects in subsurface heat transport modelling and their impact on palaeotemperature reconstructions, Geophys. J. Int., 164, 236–245, https://doi.org/10.1111/j.1365-246X.2005.02843.x, 2006. a
Muñoz-Sabater, J., Dutra, E., Agustí-Panareda, A., Albergel, C., Arduini, G., Balsamo, G., Boussetta, S., Choulga, M., Harrigan, S., Hersbach, H., Martens, B., Miralles, D. G., Piles, M., Rodríguez-Fernández, N. J., Zsoter, E., Buontempo, C., and Thépaut, J.-N.: ERA5-Land: a state-of-the-art global reanalysis dataset for land applications, Earth Syst. Sci. Data, 13, 4349–4383, https://doi.org/10.5194/essd-13-4349-2021, 2021. a
Osborn, T. J., Jones, P. D., Lister, D. H., Morice, C. P., Simpson, I. R., Winn, J. P., Hogan, E., and Harris, I. C.: Land Surface Air Temperature Variations Across the Globe Updated to 2019: The CRUTEM5 Data Set, J. Geophys. Res.-Atmos., 126, e2019JD032352, https://doi.org/10.1029/2019JD032352, 2021. a
Poli, P., Hersbach, H., Dee, D. P., Berrisford, P., Simmons, A. J., Vitart, F., Laloyaux, P., Tan, D. G. H., Peubey, C., Thépaut, J.-N., Trémolet, Y., Hólm, E. V., Bonavita, M., Isaksen, L., and Fisher, M.: ERA-20C: An Atmospheric Reanalysis of the Twentieth Century, J. Climate, 29, 4083–4097, https://doi.org/10.1175/JCLI-D-15-0556.1, 2016. a
Pries, C. E. H., Castanha, C., Porras, R. C., and Torn, M. S.: The whole-soil carbon flux in response to warming, Science, 355, 1420–1423, https://doi.org/10.1126/science.aal1319, 2017. a
Reick, C. H., Gayler, V., Goll, D., Hagemann, S., Heidkamp, M., Nabel, J. E. M. S., Raddatz, T., Roeckner, E., Schnur, R., and Wilkenskjeld, S.: JSBACH 3 – The land component of the MPI Earth System Model: documentation of version 3.2, Hamburg: MPI für Meteorologie, https://doi.org/10.17617/2.3279802, 2021. a, b
Rind, D., Orbe, C., Jonas, J., Nazarenko, L., Zhou, T., Kelley, M., Lacis, A., Shindell, D., Faluvegi, G., Romanou, A., Russell, G., Tausnev, N., Bauer, M., and Schmidt, G.: GISS Model E2.2: A Climate Model Optimized for the Middle Atmosphere–Model Structure, Climatology, Variability, and Climate Sensitivity, J. Geophys. Res.-Atmos., 125, e2019JD032204, https://doi.org/10.1029/2019JD032204, 2020. a
Rohde, R. A. and Hausfather, Z.: The Berkeley Earth Land/Ocean Temperature Record, Earth Syst. Sci. Data, 12, 3469–3479, https://doi.org/10.5194/essd-12-3469-2020, 2020. a
Seland, Ø., Bentsen, M., Olivié, D., Toniazzo, T., Gjermundsen, A., Graff, L. S., Debernard, J. B., Gupta, A. K., He, Y.-C., Kirkevåg, A., Schwinger, J., Tjiputra, J., Aas, K. S., Bethke, I., Fan, Y., Griesfeller, J., Grini, A., Guo, C., Ilicak, M., Karset, I. H. H., Landgren, O., Liakka, J., Moseid, K. O., Nummelin, A., Spensberger, C., Tang, H., Zhang, Z., Heinze, C., Iversen, T., and Schulz, M.: Overview of the Norwegian Earth System Model (NorESM2) and key climate response of CMIP6 DECK, historical, and scenario simulations, Geosci. Model Dev., 13, 6165–6200, https://doi.org/10.5194/gmd-13-6165-2020, 2020. a, b
Self, S. and Rampino, M. R.: The 1883 eruption of Krakatau, Nature, 294, 699–704, https://doi.org/10.1038/294699a0, 1981. a, b
Sellar, A. A., Jones, C. G., Mulcahy, J. P., Tang, Y., Yool, A., Wiltshire, A., O'Connor, F. M., Stringer, M., Hill, R., Palmieri, J., Woodward, S., de Mora, L., Kuhlbrodt, T., Rumbold, S. T., Kelley, D. I., Ellis, R., Johnson, C. E., Walton, J., Abraham, N. L., Andrews, M. B., Andrews, T., Archibald, A. T., Berthou, S., Burke, E., Blockley, E., Carslaw, K., Dalvi, M., Edwards, J., Folberth, G. A., Gedney, N., Griffiths, P. T., Harper, A. B., Hendry, M. A., Hewitt, A. J., Johnson, B., Jones, A., Jones, C. D., Keeble, J., Liddicoat, S., Morgenstern, O., Parker, R. J., Predoi, V., Robertson, E., Siahaan, A., Smith, R. S., Swaminathan, R., Woodhouse, M. T., Zeng, G., and Zerroukat, M.: UKESM1: Description and Evaluation of the U.K. Earth System Model, J. Adv. Model. Earth Sy., 11, 4513–4558, https://doi.org/10.1029/2019MS001739, 2019. a
Slivinski, L. C., Compo, G. P., Whitaker, J. S., Sardeshmukh, P. D., Giese, B. S., McColl, C., Allan, R., Yin, X., Vose, R., Titchner, H., Kennedy, J., Spencer, L. J., Ashcroft, L., Brönnimann, S., Brunet, M., Camuffo, D., Cornes, R., Cram, T. A., Crouthamel, R., Domínguez-Castro, F., Freeman, J. E., Gergis, J., Hawkins, E., Jones, P. D., Jourdain, S., Kaplan, A., Kubota, H., Blancq, F. L., Lee, T.-C., Lorrey, A., Luterbacher, J., Maugeri, M., Mock, C. J., Moore, G. K., Przybylak, R., Pudmenzky, C., Reason, C., Slonosky, V. C., Smith, C. A., Tinz, B., Trewin, B., Valente, M. A., Wang, X. L., Wilkinson, C., Wood, K., and Wyszyński, P.: Towards a more reliable historical reanalysis: Improvements for version 3 of the Twentieth Century Reanalysis system, Q. J. Roy. Meteor. Soc., 145, 2876–2908, https://doi.org/10.1002/qj.3598, 2019. a
Smerdon, J. E. and Stieglitz, M.: Simulating heat transport of harmonic temperature signals in the Earth's shallow subsurface: Lower-boundary sensitivities, Geophys. Res. Lett., 33, L14402, https://doi.org/10.1029/2006GL026816, 2006. a, b, c, d
Soong, J. L., Castanha, C., Pries, C. E. H., Ofiti, N., Porras, R. C., Riley, W. J., Schmidt, M. W., and Torn, M. S.: Five years of whole-soil warming led to loss of subsoil carbon stocks and increased CO2 efflux, Sci. Adv., 7, eabd1343, https://doi.org/10.1126/sciadv.abd1343, 2021. a
Steinert, N. J., González-Rouco, J. F., Melo-Aguilar, C. A., García-Pereira, F., García-Bustamante, E., de Vrese, P., Alexeev, V., Jungclaus, J. H., Lorenz, S. J., and Hagemann, S.: Agreement of Analytical and Simulation-Based Estimates of the Required Land Depth in Climate Models, Geophys. Res. Lett., 48, e2021GL094273, https://doi.org/10.1029/2021GL094273, 2021a. a, b, c, d, e, f
Steinert, N. J., González-Rouco, J. F., de Vrese, P., García-Bustamante, E., Hagemann, S., Melo-Aguilar, C. A., Jungclaus, J. H., and Lorenz, S. J.: Increasing the depth of a Land Surface Model. Part II: Sensitivity to improved coupling between soil hydrology and thermodynamics and associated permafrost response, J. Hydrometeorol., 22, 3231–3254, https://doi.org/10.1175/JHM-D-21-0023.1, 2021b. a, b
Stevens, B., Smerdon, J. E., González-Rouco, J. F., Stieglitz, M., and Beltrami, H.: Effects of bottom boundary placement on subsurface heat storage: Implications for climate model simulations, Geophys. Res. Lett., 34, L02702, https://doi.org/10.1029/2006GL028546, 2007. a, b
Stevens, B., Giorgetta, M., Esch, M., Mauritsen, T., Crueger, T., Rast, S., Salzmann, M., Schmidt, H., Bader, J., Block, K., Brokopf, R., Fast, I., Kinne, S., Kornblueh, L., Lohmann, U., Pincus, R., Reichler, T., and Roeckner, E.: Atmospheric component of the MPI-M Earth System Model: ECHAM6, J. Adv. Model. Earth Sy., 5, 146–172, https://doi.org/10.1002/jame.20015, 2013. a
Swart, N. C., Cole, J. N. S., Kharin, V. V., Lazare, M., Scinocca, J. F., Gillett, N. P., Anstey, J., Arora, V., Christian, J. R., Hanna, S., Jiao, Y., Lee, W. G., Majaess, F., Saenko, O. A., Seiler, C., Seinen, C., Shao, A., Sigmond, M., Solheim, L., von Salzen, K., Yang, D., and Winter, B.: The Canadian Earth System Model version 5 (CanESM5.0.3), Geosci. Model Dev., 12, 4823–4873, https://doi.org/10.5194/gmd-12-4823-2019, 2019. a
Séférian, R., Nabat, P., Michou, M., Saint-Martin, D., Voldoire, A., Colin, J., Decharme, B., Delire, C., Berthet, S., Chevallier, M., Sénési, S., Franchisteguy, L., Vial, J., Mallet, M., Joetzjer, E., Geoffroy, O., Guérémy, J.-F., Moine, M.-P., Msadek, R., Ribes, A., Rocher, M., Roehrig, R., Salas-y Mélia, D., Sanchez, E., Terray, L., Valcke, S., Waldman, R., Aumont, O., Bopp, L., Deshayes, J., Éthé, C., and Madec, G.: Evaluation of CNRM Earth System Model, CNRM-ESM2-1: Role of Earth System Processes in Present-Day and Future Climate, J. Adv. Model. Earth Sy., 11, 4182–4227, https://doi.org/10.1029/2019MS001791, 2019. a
Tardif, R., Hakim, G. J., Perkins, W. A., Horlick, K. A., Erb, M. P., Emile-Geay, J., Anderson, D. M., Steig, E. J., and Noone, D.: Last Millennium Reanalysis with an expanded proxy database and seasonal proxy modeling, Clim. Past, 15, 1251–1273, https://doi.org/10.5194/cp-15-1251-2019, 2019. a
Tatebe, H., Ogura, T., Nitta, T., Komuro, Y., Ogochi, K., Takemura, T., Sudo, K., Sekiguchi, M., Abe, M., Saito, F., Chikira, M., Watanabe, S., Mori, M., Hirota, N., Kawatani, Y., Mochizuki, T., Yoshimura, K., Takata, K., O'ishi, R., Yamazaki, D., Suzuki, T., Kurogi, M., Kataoka, T., Watanabe, M., and Kimoto, M.: Description and basic evaluation of simulated mean state, internal variability, and climate sensitivity in MIROC6, Geosci. Model Dev., 12, 2727–2765, https://doi.org/10.5194/gmd-12-2727-2019, 2019. a
Taylor, K. E., Stouffer, R. J., and Meehl, G. A.: An Overview of CMIP5 and the Experiment Design, B. Am. Meteor. Soc., 93, 485–498, https://doi.org/10.1175/BAMS-D-11-00094.1, 2012. a
van Dijk, E., Jungclaus, J., Lorenz, S., Timmreck, C., and Krüger, K.: Was there a volcanic-induced long-lasting cooling over the Northern Hemisphere in the mid-6th–7th century?, Clim. Past, 18, 1601–1623, https://doi.org/10.5194/cp-18-1601-2022, 2022. a
Voldoire, A., Saint-Martin, D., Sénési, S., Decharme, B., Alias, A., Chevallier, M., Colin, J., Guérémy, J.-F., Michou, M., Moine, M.-P., Nabat, P., Roehrig, R., Salas y Mélia, D., Séférian, R., Valcke, S., Beau, I., Belamari, S., Berthet, S., Cassou, C., Cattiaux, J., Deshayes, J., Douville, H., Ethé, C., Franchistéguy, L., Geoffroy, O., Lévy, C., Madec, G., Meurdesoif, Y., Msadek, R., Ribes, A., Sanchez-Gomez, E., Terray, L., and Waldman, R.: Evaluation of CMIP6 DECK Experiments With CNRM-CM6-1, J. Adv. Model. Earth Sy., 11, 2177–2213, https://doi.org/10.1029/2019MS001683, 2019. a, b
von Schuckmann, K., Cheng, L., Palmer, M. D., Hansen, J., Tassone, C., Aich, V., Adusumilli, S., Beltrami, H., Boyer, T., Cuesta-Valero, F. J., Desbruyères, D., Domingues, C., García-García, A., Gentine, P., Gilson, J., Gorfer, M., Haimberger, L., Ishii, M., Johnson, G. C., Killick, R., King, B. A., Kirchengast, G., Kolodziejczyk, N., Lyman, J., Marzeion, B., Mayer, M., Monier, M., Monselesan, D. P., Purkey, S., Roemmich, D., Schweiger, A., Seneviratne, S. I., Shepherd, A., Slater, D. A., Steiner, A. K., Straneo, F., Timmermans, M.-L., and Wijffels, S. E.: Heat stored in the Earth system: where does the energy go?, Earth Syst. Sci. Data, 12, 2013–2041, https://doi.org/10.5194/essd-12-2013-2020, 2020. a, b, c, d, e, f, g, h, i, j
von Schuckmann, K., Minière, A., Gues, F., Cuesta-Valero, F. J., Kirchengast, G., Adusumilli, S., Straneo, F., Allan, R., Barker, P. M., Beltrami, H., Boyer, T., Cheng, L., Church, J., Desbruyeres, D., Dolman, H., Domingues, C., García-García, A., Giglio, D., Gilson, J., Gorfer, M., Haimberger, L., Hendricks, S., Hosoda, S., Johnson, G. C., Killick, R., King, B. A., Kolodziejczyk, N., Korosov, A., Krinner, G., Kuusela, M., Langer, M., Lavergne, T., Li, Y., Lyman, J., Marzeion, B., Mayer, M., MacDougall, A., Lawrence, I., McDougall, T., Monselesan, D. P., Nitzbon, J., Otosaka, I., Peng, J., Purkey, S., Roemmich, D., Sato, K., Sato, K., Savita, A., Schweiger, A., Shepherd, A., Seneviratne, S. I., Simons, L., Slater, D. A., Slater, T., Smith, N., Steiner, A. K., Suga, T., Szekely, T., Thiery, W., Timmermanns, M.-L., Vanderkelen, I., Wijffels, S. E., Wu, T., and Zemp, M.: Heat stored in the Earth system 1960–2020: Where does the energy go?, World Data Center for Climate (WDCC) at DKRZ [data set], https://hdl.handle.net/21.14106/279f535efb48324f4f604bb390f74deadf268812 (last access: 17 January 2023), 2022. a
von Schuckmann, K., Minière, A., Gues, F., Cuesta-Valero, F. J., Kirchengast, G., Adusumilli, S., Straneo, F., Ablain, M., Allan, R. P., Barker, P. M., Beltrami, H., Blazquez, A., Boyer, T., Cheng, L., Church, J., Desbruyeres, D., Dolman, H., Domingues, C. M., García-García, A., Giglio, D., Gilson, J. E., Gorfer, M., Haimberger, L., Hakuba, M. Z., Hendricks, S., Hosoda, S., Johnson, G. C., Killick, R., King, B., Kolodziejczyk, N., Korosov, A., Krinner, G., Kuusela, M., Landerer, F. W., Langer, M., Lavergne, T., Lawrence, I., Li, Y., Lyman, J., Marti, F., Marzeion, B., Mayer, M., MacDougall, A. H., McDougall, T., Monselesan, D. P., Nitzbon, J., Otosaka, I., Peng, J., Purkey, S., Roemmich, D., Sato, K., Sato, K., Savita, A., Schweiger, A., Shepherd, A., Seneviratne, S. I., Simons, L., Slater, D. A., Slater, T., Steiner, A. K., Suga, T., Szekely, T., Thiery, W., Timmermans, M.-L., Vanderkelen, I., Wjiffels, S. E., Wu, T., and Zemp, M.: Heat stored in the Earth system 1960–2020: where does the energy go?, Earth Syst. Sci. Data, 15, 1675–1709, https://doi.org/10.5194/essd-15-1675-2023, 2023. a
Wang, Y.-C., Hsu, H.-H., Chen, C.-A., Tseng, W.-L., Hsu, P.-C., Lin, C.-W., Chen, Y.-L., Jiang, L.-C., Lee, Y.-C., Liang, H.-C., Chang, W.-M., Lee, W.-L., and Shiu, C.-J.: Performance of the Taiwan Earth System Model in Simulating Climate Variability Compared With Observations and CMIP6 Model Simulations, J. Adv. Model. Earth Sy., 13, e2020MS002353, https://doi.org/10.1029/2020MS002353, 2021. a
Wild, M.: The global energy balance as represented in CMIP6 climate models, Clim. Dynam., 55, 553–577, https://doi.org/10.1007/s00382-020-05282-7, 2020. a
Williams, K. D., Copsey, D., Blockley, E. W., Bodas-Salcedo, A., Calvert, D., Comer, R., Davis, P., Graham, T., Hewitt, H. T., Hill, R., Hyder, P., Ineson, S., Johns, T. C., Keen, A. B., Lee, R. W., Megann, A., Milton, S. F., Rae, J. G. L., Roberts, M. J., Scaife, A. A., Schiemann, R., Storkey, D., Thorpe, L., Watterson, I. G., Walters, D. N., West, A., Wood, R. A., Woollings, T., and Xavier, P. K.: The Met Office Global Coupled Model 3.0 and 3.1 (GC3.0 and GC3.1) Configurations, J. Adv. Model. Earth Sy., 10, 357–380, https://doi.org/10.1002/2017MS001115, 2018. a, b
Willmott, C.J. and Matsuura, K.: Terrestrial Air Temperature and Precipitation: Monthly and Annual Time Series (1900–2017) (Version 5.01), Center for Climatic Research, Department of Geography, University of Delaware [data set], https://www.esrl.noaa.gov/psd/data/gridded/data.UDel_AirT_Precip.html (last access: 17 January 2023), 2018. a
Wu, T., Lu, Y., Fang, Y., Xin, X., Li, L., Li, W., Jie, W., Zhang, J., Liu, Y., Zhang, L., Zhang, F., Zhang, Y., Wu, F., Li, J., Chu, M., Wang, Z., Shi, X., Liu, X., Wei, M., Huang, A., Zhang, Y., and Liu, X.: The Beijing Climate Center Climate System Model (BCC-CSM): the main progress from CMIP5 to CMIP6, Geosci. Model Dev., 12, 1573–1600, https://doi.org/10.5194/gmd-12-1573-2019, 2019. a
Yukimoto, S., Kawai, H., Koshiro, T., Oshima, N., Yoshida, K., Urakawa, S., Tsujino, H., Deushi, M., Tanaka, T., Hosaka, M., Yabu, S., Yoshimura, H., Shindo, E., Mizuta, R., Obata, A., Adachi, Y., and Ishii, M.: The Meteorological Research Institute Earth System Model Version 2.0, MRI-ESM2.0: Description and Basic Evaluation of the Physical Component, J. Meteorol. Soc. Jpn., 97, 931–965, https://doi.org/10.2151/jmsj.2019-051, 2019. a
Zhang, H., Zhang, M., Jin, J., Fei, K., Ji, D., Wu, C., Zhu, J., He, J., Chai, Z., Xie, J., Dong, X., Zhang, D., Bi, X., Cao, H., Chen, H., Chen, K., Chen, X., Gao, X., Hao, H., Jiang, J., Kong, X., Li, S., Li, Y., Lin, P., Lin, Z., Liu, H., Liu, X., Shi, Y., Song, M., Wang, H., Wang, T., Wang, X., Wang, Z., Wei, Y., Wu, B., Xie, Z., Xu, Y., Yu, Y., Yuan, L., Zeng, Q., Zeng, X., Zhao, S., Zhou, G., and Zhu, J.: Description and Climate Simulation Performance of CAS-ESM Version 2, J. Adv. Model. Earth Sy., 12, e2020MS002210, https://doi.org/10.1029/2020MS002210, 2020. a
Zhang, H.-M., Huang, B., Lawrimore, J. H., Menne, M. J., and Smith, T. M.: NOAA Global Surface Temperature Dataset (NOAAGlobalTemp), Version 5.0, NOAA National Centers for Environmental Information, https://doi.org/10.25921/9qth-2p70, 2019. a
Ziehn, T., Chamberlain, M., Law, R., Lenton, A., Bodman, R., Dix, M., Stevens, L., Wang, Y., and Srbinovsky, J.: The Australian Earth System Model: ACCESS-ESM1.5, Journal of Southern Hemisphere Earth Systems Science, 70, 193–214, https://doi.org/10.1071/ES19035, 2020. a