the Creative Commons Attribution 4.0 License.
the Creative Commons Attribution 4.0 License.
 | 20 Mar 2024
Effects of idealized land cover and land management changes on the atmospheric water cycle
Steven J. De Hertog
Carmen E. Lopez-Fabara
Ruud van der Ent
Jessica Keune
Diego G. Miralles
Raphael Portmann
Sebastian Schemm
Felix Havermann
Iris Manola
Quentin Lejeune
Julia Pongratz
Carl-Friedrich Schleussner
Sonia I. Seneviratne
Wim Thiery
Land cover and land management changes (LCLMCs) play an important role in achieving low-end warming scenarios through land-based mitigation. However, their effects on moisture fluxes and recycling remain uncertain, although they have important implications for the future viability of such strategies. Here, we analyse the impact of idealized LCLMC scenarios on atmospheric moisture transport in three different Earth system model (ESMs): the Community Earth System Model (CESM), the Max Planck Institute Earth System Model (MPI-ESM), and the European Consortium Earth System Model (EC-EARTH). The LCLMC scenarios comprise of a full cropland world, a fully afforested world, and a cropland world with unlimited irrigation expansion. The effects of these LCLMC in the different ESMs are analysed for precipitation, evaporation, and vertically integrated moisture flux convergence to understand the LCLMC-induced changes in the atmospheric moisture cycle. Then, a moisture tracking algorithm is applied to assess the effects of LCLMC on moisture recycling at the local (grid cell level) and the global scale (continental moisture recycling). By applying a moisture tracking algorithm on fully coupled ESM simulations we are able to quantify the complete effects of LCLMC on moisture recycling (including circulation changes), which are generally not considered in moisture recycling studies. Our results indicate that cropland expansion is generally causing a drying and reduced local moisture recycling, while afforestation and irrigation expansion generally cause wetting and increased local moisture recycling. However, the strength of this effect varies across ESMs and shows a large dependency on the dominant driver. Some ESMs show a dominance of large-scale atmospheric circulation changes while other ESMs show a dominance of local to regional changes in the atmospheric water cycle only within the vicinity of the LCLMC. Overall, these results corroborate that LCLMC can induce substantial effects on the atmospheric water cycle and moisture recycling, both through local effects and changes in atmospheric circulation. However, more research is needed to constrain the uncertainty of these effects within ESMs to better inform future land-based mitigation strategies.
- Article
(7872 KB) - Full-text XML
- BibTeX
- EndNote


Currently, about three-quarters (∼ 100 × 106 km2) of the ice-free land surface has undergone some kind of anthropogenic land cover or land management change (LCLMC) (Luyssaert et al., 2014; Mbow et al., 2017). All these modifications are important drivers of climate change as they alter the carbon cycle (biogeochemical effects) and affect surface properties, which impact the energy and water balance (biogeophysical effects) (Pongratz et al., 2010; Bonan, 2008; Pongratz et al., 2021) and feed back on the local to global climate (Winckler et al., 2019; Boysen et al., 2020; Portmann et al., 2022; De Hertog et al., 2023). Therefore, future LCLMC are increasingly seen as a viable tool for land-based mitigation and play a crucial role within low-warming emission scenarios (Rogelj et al., 2018; Seneviratne et al., 2018). Hence, exploring and understanding the extent to which LCLMC influences climate has become key to develop effective mitigation and adaptation strategies (Lawrence et al., 2016).
From a biogeophysical perspective, LCLMC leads to changes in the albedo, aerodynamic conductance, and the partitioning between the sensible and latent heat flux, which has an impact on atmospheric temperature and moisture content (Bowen, 1926; Wang et al., 2009; Cui et al., 2022). For example, tropical deforestation is expected to further dry and warm the regional climate (Bonan, 2008; Akkermans et al., 2014; Spracklen et al., 2018; Smith and Spracklen, 2023). In contrast, irrigation expansion can cause a local to regional cooling and moistening of the atmosphere (Mahmood et al., 2014; Thiery et al., 2017, 2020; Hauser et al., 2019; Tuinenburg et al., 2014). Evaporation, being the link between the surface energy and the water balance (Shukla and Mintz, 1982), modulates the influence of LCLMC on atmospheric conditions (van der Ent et al., 2010; Spracklen et al., 2012). Tracking the origins of precipitation back to evaporation and determining the fraction of terrestrial precipitation that originates from land – here referred to as continental precipitation recycling (van der Ent et al., 2010) – can increase our understanding of the effects of future LCLMC on the climate. On the other hand, the fate of land evaporation can be determined and illustrates the reach of local LCLMC; the fraction of terrestrial evaporation precipitating over land is often referred to as continental evaporation recycling (van der Ent et al., 2010). Even though it is well established that LCLMC can affect these moisture recycling strengths (Wang-Erlandsson et al., 2018; Benedict et al., 2020) – i.e. the degree to which terrestrial precipitation depends on land evaporation – this is rarely quantified within dedicated Earth system model (ESM) studies. Most studies that quantify the effects of LCLMC on the atmospheric moisture cycle focus on the changes in moisture fluxes, but they often cannot unravel the role of local and continental moisture recycling in these differences (Tuinenburg et al., 2020; Hoek van Dijke et al., 2022; Baudena et al., 2021; Wunderling et al., 2022; Staal et al., 2018). Those studies that do account for moisture recycling in assessing the effects of future LCLMC (Hoek van Dijke et al., 2022; Baudena et al., 2021; Wunderling et al., 2022; Staal et al., 2018) generally apply reanalysis-based recycling ratios (such as those presented in Tuinenburg et al., 2020) which do not include the second-order effect on moisture recycling caused by LCLMC-induced circulation changes (te Wierik et al., 2021). By analysing dedicated ESM simulations for LCLMC we are able to address these shortcomings and include the potential effects of atmospheric circulation changes on moisture recycling.
Idealized or extensive implementations of LCLMC within ESM simulations are used to cope with weather-induced noise that dampens climatic responses (Winckler et al., 2017a; Boysen et al., 2020). Within such simulations, large-scale atmospheric circulation changes have been shown to occur as a consequence of LCLMC (Goessling and Reick, 2011; Boysen et al., 2020; Portmann et al., 2022; Devaraju et al., 2018; Laguë et al., 2019). However, most studies have only focused on one LCLMC type (e.g. Boysen et al., 2020; Laguë et al., 2019; Devaraju et al., 2018)) and only used a single ESM (e.g. Portmann et al., 2022; de Vrese et al., 2016). Further, these studies generally cannot distinguish explicitly between the influence of local processes (directly induced by the LCLMC) and non-local or remote processes (induced by LCLMC elsewhere, including circulation and advection changes). The study of De Hertog et al. (2023) presented a first multi-model intercomparison using three different ESMs and four different LCLMC types in which a clear distinction between local and non-local biogeophysical effects was established through the chequerboard LCLMC implementation as developed by Winckler et al. (2017a). These simulations facilitated the comparison of the climate changes induced by different LCLMC types and to grasp the multi-model uncertainty.
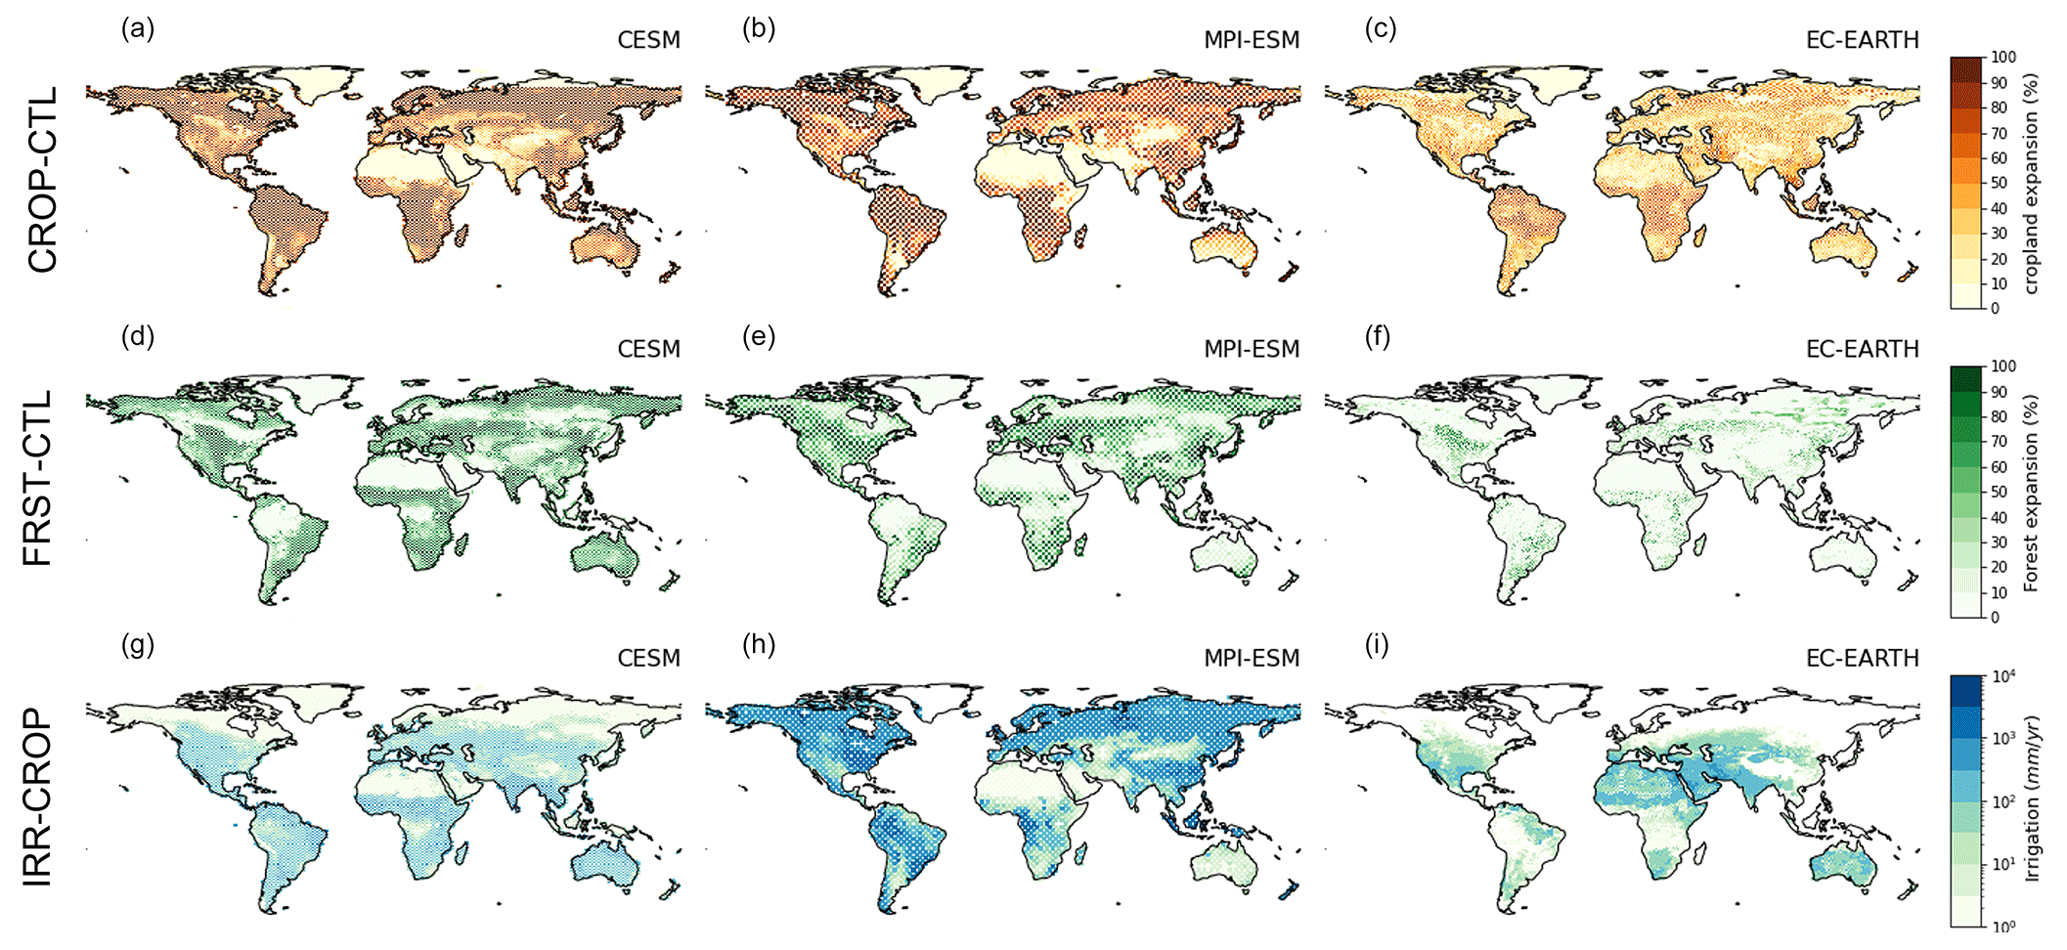
Figure 1Land cover and land management changes as implemented in the three different ESMs. Cropland expansion (CROP-CTL; a–c), afforestation (FRST-CTL; d–f), and irrigation expansion (IRR-CROP; g–i) implemented in CESM, MPI-ESM, and EC-EARTH, respectively. Both cropland expansion and afforestation are shown as a change in area fraction (%), while irrigation expansion is shown through the irrigation flux (in mm yr−1).
Here, we assess the atmospheric water cycle responses to idealized LCLMC scenarios using global simulations of three different ESMs (De Hertog et al., 2023). The simulations comprise different idealized LCLMC scenarios – from afforestation, over cropland expansion to irrigation expansion – and have been implemented in a chequerboard pattern. The simulation setup and the moisture tracking algorithm and its derived metrics are described below (Sect. 2). We first analyse the ESM output for changes in the atmospheric water cycle including evaporation, precipitation, and atmospheric moisture flux convergence (Sect. 3.1). Second, we analyse the moisture tracking algorithm output to assess the direct effects of LCLMC on moisture recycling and unravel local and remote drivers of the analysed moisture flux changes. This is done on a local scale using the concept of “length scales” of moisture recycling (Sect. 3.2) and on a continental scale using continental recycling ratios (Sect. 3.3). Finally we highlight the most important findings and implications of this research (Sects. 4 and 5).
2.1 ESM simulations
The ESM simulations analysed here were conducted within the LAnd MAnagement for CLImate Mitigation and Adaptation (LAMACLIMA) project and are presented in detail in De Hertog et al. (2023). In this project, different sensitivity experiments were performed for three ESMs, i.e. the Community Earth System Model version 2.1.3 (CESM), the European Community Earth-System Model 3-Veg v3.3.3.1 (EC-EARTH), and the Max-Planck Institute Earth System Model 1.2 low resolution (MPI-ESM). We refer to De Hertog et al. (2023) for detailed model descriptions. The experiments comprise four simulations of LCLMC scenarios. One scenario is the control case (hereafter referred to as CTL), which is conducted with a constant land cover corresponding to the year 2015. The three remaining scenarios represent an extreme case of single specific LCLMC, namely afforestation (FRST), cropland expansion (CROP), and irrigation expansion (IRR). Here, irrigation is applied on top of the cropland expansion. Thus, while the impact of afforestation and cropland expansion is always evaluated with respect to the control simulation (i.e. differences are calculated as FRST-CTL and CROP-CTL), the impact of irrigation is evaluated with respect to the cropland expansion simulation (IRR-CROP). All simulations cover a period of 160 years under a present-day climate forcing (corresponding to the year 2015).
The LCLMC scenarios are generated from the CTL scenario land cover by inducing the LCLMC in a chequerboard-like pattern as presented in Winckler et al. (2017a). The resulting LCLMC is shown in Fig. 1. This implies that the different LCLMC are implemented in every other pixel (i.e. only 50 % of hospitable land grid cells have undergone LCLMC), while all other forcings (i.e. greenhouse gas, stratospheric aerosols, etc.) remain identical to the initial CTL scenario configurations. Even though a structured approach was taken to implement the LCLMC in the different ESMs, the geographical extent of irrigation and afforestation differs strongly among different ESMs due to each model's native schemes on irrigation and the transition to forest. This is especially the case for the EC-EARTH afforestation simulation, in which the afforestation simulated was extremely low compared to the other ESMs (Fig. 1d–f). Therefore, the afforestation scenario from EC-EARTH is not considered in this study. Likewise, large discrepancies regarding the simulated irrigation expansion are related to different irrigation parameterizations being implemented in the different ESMs (see Appendix B in De Hertog et al., 2023). Within the model version of EC-EARTH used in this study, irrigation does not cause any effect on atmospheric moisture content (i.e. the water cycle of the land and atmosphere model are not coupled). Hence, the irrigation expansion scenario from EC-EARTH is also not considered in this study.
This implementation of the LCLMC in the ESM land cover maps following a chequerboard pattern enables a signal separation of the ESM response into local and non-local components (Winckler et al., 2017a; De Hertog et al., 2023). The local effects refer to climate effects directly induced by the LCLMC within the grid cell, while the non-local effects refer to climate effects induced by LCLMC elsewhere through changes in atmospheric circulation or advection. These non-local effects can be directly derived from the simulation output as the climate changes occurring over grid cells where no land cover change occurred can only be caused by non-local mechanisms. By interpolating the values of non-local effects within the “no change” grid cells to the “change” grid cells we create a global map of non-local effects due to a certain LCLMC. This global map is then used to subtract the values found in the “change” grid cells, which contain the total signal (i.e. local and non-local effects). After subtraction we obtain values for the local effects over all “change” grid cells. These are again interpolated to create a global map representing the local climate effects. This approach has been explained in detail in previous studies (Winckler et al., 2017a; De Hertog et al., 2023) and is also explained in more detail here in Appendix A.
This separation is only applicable to (near-)surface variables and not to variables representing processes that extend higher into the atmosphere, as there is lateral mixing between different adjacent atmospheric grid cells above the surface. Therefore, the signal separation approach is not applied to the atmospheric variables (i.e. variables that have a vertical dimension into the atmosphere). The analysis presented here focuses on atmospheric processes, specifically moisture recycling, which is computed through a moisture tracking algorithm requiring atmospheric variables. Therefore, we analyse the raw ESM output directly, which represents an extreme case of LCLMC applied in a chequerboard pattern. For the variables where signal separation can be applied, we provide those results to support interpretations of these signals. All calculations are applied over the last 30 years of the simulations and at each ESM's native spatial resolution (latitude × longitude) (i.e. MPI-ESM: 1.88° × 1.88°; CESM: 0.90° × 1.25°; EC-EARTH: 0.7° × 0.7°).
2.2 LCLMC-induced impact on the net water fluxes
To understand the net change in the atmospheric water cycle induced by the different LCLMC, we first analyse their effects on evaporation and precipitation and compare them to the reference simulation of each LCLMC scenario. In addition, the vertically integrated moisture flux convergence (MFC) is computed using the basic principles of conservation of water vapour (Banacos and Schultz, 2005; Cook, 2009; Thiery et al., 2016; Van de Walle et al., 2020), as shown in Eq. (1) below.
Here, g is the gravitational acceleration (m s−2); ρw is the density of water (1000 kg m−3); ps and pTOA are the pressure at surface level and top of the atmosphere, respectively; q represents the specific humidity of an air parcel (kg kg−1); v represents its horizontal wind vector (m s−1); P is the precipitation flux per unit area (m s−1); E is the surface evaporation flux per unit area (m s−1); and ∇⋅(qv) is the atmospheric moisture convergence from the surface to the top of the atmosphere (TOA). The MFC is computed based on 6-hourly data along the available pressure levels of each ESM. For EC-EARTH, only eight atmospheric levels were available, which is insufficient to compute MFC. Hence, P−E is used as a proxy for the MFC in EC-EARTH. Over land, MFC or P−E are often used a proxy for water availability (Van de Walle et al., 2020; Thiery et al., 2016), and changes in these measures can help us to understand the impacts of LCLMC on the redistribution of water over land. The maps for MFC and P−E changes are included in Appendix D.
The comparison of P, E, and MFC changes with respect to the corresponding reference simulation is performed for the three different LCLMC scenarios, i.e. cropland expansion, afforestation, and irrigation. We focus on annual mean values for the analysis. However, seasonal means (DJF: December, January, February; JJA: June, July, August) are shown in Appendix C. As explained in Sect. 2.1 we only apply the signal separation to P and E and not MFC as this metric is computed based on variables covering the entire atmospheric column.
2.3 Moisture tracking analysis
To further quantify the direct influence of LCLMC on precipitation and unravel the reach of locally induced LCLMC on precipitation and water availability, we perform a moisture tracking analysis. Here, we apply the Eulerian moisture tracking model WAM-2layers (van der Ent et al., 2014; Benedict et al., 2020) to identify the origin of precipitation and the fate of evaporation in the ESM simulations and to evaluate the impact of LCLMC-induced evaporation changes on precipitation and water availability. The output of WAM-2layers is then used to compute several metrics relevant to moisture recycling, which can help uncover LCLMC-induced effects within the different ESMs. In this study, we focus on two spatial scales of moisture recycling: (i) local recycling and (ii) continental recycling. Note that local recycling does not imply that only the local effects (following the signal separation approach explained above) are used for the computation of this metric. The moisture tracking algorithm is applied on the raw ESM data as it requires atmospheric variables that cannot be signal separated. Local moisture recycling is defined on the grid cell area of each ESM, which differs by definition (see Sect. 2.1) and makes them hard to compare across the ESMs. Therefore, additional area-independent metrics are used. Evaporation and precipitation length scales (van der Ent et al., 2010) illustrate the distance that moisture travels on average to or from a given grid cell. In the following, all recycling metrics are presented at annual timescales. Details on the setup of WAM-2layers and the definition of moisture recycling metrics are presented in more detail in the following sections.
2.3.1 WAM-2layers
A moisture tracking algorithm, the Water Accounting Model – two layers (WAM-2layers, van der Ent et al., 2014), is applied to analyse the effects of the different LCLMC on moisture recycling. We use a recent version of this algorithm, which was modified to ingest climate model data with limited vertical levels (Benedict et al., 2020). This moisture tracking algorithm uses a Eulerian approach to solve the atmospheric moisture balance over each grid cell and a specified time step (van der Ent et al., 2014). Model outputs comprise the origins of precipitation or evaporation at the local scale or continental scale depending on which tracking is performed and facilitate the quantification of local and continental moisture recycling measures (van der Ent et al., 2010; van der Ent et al., 2014, see below). The algorithm has been applied numerous times in recent years for ESM output (Benedict et al., 2020; Guo et al., 2020; Findell et al., 2019; Bosmans et al., 2020).
Here, the surface and atmospheric data from all ESM simulations at the original spatial resolution (see Sect. 2.1) and the finest temporal resolution (CESM: 6 h; MPI-ESM: 3 h for surface variables and 6 h for atmospheric variables; EC-EARTH: 6 h for surface variables and daily for atmospheric variables) are used as (offline) inputs for WAM-2layers. To avoid stability problems related to the numerical discretization in WAM-2layers (van der Ent et al., 2014), all ESM forcings are linearly interpolated to 15 min time steps. The moisture tracking is applied to the last 30 years within the 160-year simulation period.
2.3.2 Local moisture recycling
Here, two definitions of local moisture recycling are used. First, the local precipitation recycling ratio ρr, i.e. the fraction of precipitation over a region r that originates from evaporation over the same region (see Eq. 2), is calculated. The remaining fraction of precipitation over that region (i.e. 1−ρr) originates from evaporation upwind that is advected into the region r and can be of either land-based or oceanic origin. Second, the local evaporation recycling ratio ϵr, i.e. the fraction of evaporation from a region r that falls as precipitation over the same region (see Eq. 3), is used. The remaining fraction of local evaporation (1−ϵr) is transported away from the region and falls downwind of that region as precipitation.
Using the output from WAM-2layers, precipitation over the region r with area Ar, here referred to as P, can be separated into the precipitation originating from the same region (Pr) and the remaining precipitation that originates from upwind regions (Pa), so that . Using these outputs, the local precipitation recycling ratio can be calculated as
Similarly, the local evaporation recycling ratio can be calculated using evaporation from the region r, here referred to as E, and the evaporation that falls as precipitation over the same region (Er), i.e.
Both local recycling definitions are subject to the area of the region considered (Ar). Here, local recycling is defined on the area of a grid cell. It is noted that this area varies with latitude per definition and in addition varies for the ESM simulations employed here (see Sect. 2.1). The differences between local recycling ratios thus need to be interpreted with caution and are not comparable across different data sources or ESMs. To overcome these shortcomings, we compute length ratios and continental recycling ratios.
2.3.3 Precipitation and evaporation length scales
To assess local moisture recycling independently of the ESM, we compute the length scale of the moisture recycling process as introduced by van der Ent and Savenije (2011). Here we summarize the derivation of extracting the length-scale metric from local moisture recycling ratios, for the complete derivation of how length scales are defined we refer to van der Ent and Savenije (2011). Following Dominguez et al. (2006), the moisture recycling ratio is a function of the distance travelled along a streamline (x), the horizontal wind speed (u), and the moisture flux (M) normalized by the atmospheric storage capacity (Sa):
Here, γr(x) is the moisture recycling ratio (which can be evaporation or precipitation recycling as defined in Eqs. 2 and 3), and M is evaporation (E) for the evaporation recycling ratio and precipitation (P) for the precipitation recycling ratio. This equation is valid for a streamline starting at distance x=0. By definition, the recycling ratio equals one at the origin (x=0) and also in case of zero moisture uptake (M=0). With increasing moisture uptake and distance to the source region, the ratio tends exponentially towards zero, which indicates that the original moisture taken up at the source location is removed from the air. van der Ent and Savenije (2011) subsequently rewrote this equation of the local moisture recycling ratio as a function of the length scale (λγ):
By then filling in Eq. (5) in Eq. (4) and integrating it for the distance, an equation is obtained for the regional average moisture recycling γr:
Here, γr is the moisture recycling ratio over a given region r, with r representing a single grid cell in order to compute the length scale at the local grid cell level. Δx equals the representative length of a grid cell and is computed from the zonal and meridional lengths of a grid cell weighted by the moisture fluxes in the corresponding directions (van der Ent and Savenije, 2011). From this equation the length scale can be isolated and solved based on the local moisture recycling to get the following expression using W as the Lambert W function (e.g. Corless et al., 1996).:
Length scales overcome one of the major shortcomings of local recycling ratios, which are dependent on the shape and size of the source region they are computed over (van der Ent and Savenije, 2011; Theeuwen et al., 2023). This occurs when using regular latitude–longitude grids in which grid cells vary both in shape and size within a model and between models that apply different resolutions. Length scales of local moisture recycling, in contrast, are designed to be area and shape independent, at least for the region over which one can assume the same climatological conditions (i.e. the variables in Eq. 5 do not change much within a given grid cell). The length scales give an indication of the distance over which moisture would travel on average to or from a given grid cell under the given local hydrological and climatological conditions (van der Ent and Savenije, 2011). Hence, they should not be interpreted as an actual travel distance, which depends strongly on environmental conditions over the thousands of kilometres moisture typically travels and thus do not represent recycling strength in the local scope which is aimed for here. The local scope (i.e. ESM grid cell size) is preferred as it allows us to understand changes to moisture recycling as much disconnected from remote changes in LCLMC as possible, thus giving an indication of the local sensitivity of moisture recycling to LCLMC independent on downwind and upwind environmental conditions (see also Appendix E). Length scales should thus be interpreted as a local process-based metric of moisture recycling strength; Eq. 5) expressed in distance units (km). A short length scale indicates that local recycling is strong, and a long length scale indicates that local recycling is weak.
Like local recycling ratios, the length scales can be calculated from a precipitation- or an evaporation-centric perspective (i.e. precipitation recycling ratios λρ or evaporation recycling ratios λϵ). Here the precipitation length scale represents the length scale of precipitation raining down in a given grid cell, and the evaporation length scale represents the length scale of evaporation that travels from a given grid cell before precipitating. Both length scales can be derived from the local recycling ratios presented above (see Sect. 2.3.2). By computing these different length scales for the different simulations representing the different LCLMC, we can assess how the LCLMC affects precipitation and evaporation recycling strength.
2.3.4 Continental moisture recycling
To study the continental contribution to moisture recycling, we compute the continental recycling ratios. Analogous to previous studies (e.g. Brubaker et al., 1993; van der Ent et al., 2010; Gimeno et al., 2012; Findell et al., 2019; Gimeno et al., 2020), we define continental precipitation recycling ratio ρc as the fraction of precipitation over land that originates from land evaporation. The precipitation recycling ratio answers the question “how much of the moisture precipitating over land originates from land?”. The remaining fraction (1−ρc) of the precipitation over land originates from evaporation over oceans. Similarly, continental evaporation recycling ratio ϵc is defined as the fraction of land evaporation that falls as precipitation over land. These ratios can be computed through Eqs. (2) and (3) by defining the region r as all land areas. Hence, in contrast to the local recycling ratios, continental recycling ratios refer to the same area, i.e. the area of all continental land regions Ac, which facilitates a direct comparison of recycling ratios between the ESMs with different spatial resolution employed here. Continental evaporation and precipitation are computed by tracking all continental moisture fluxes at the same time.
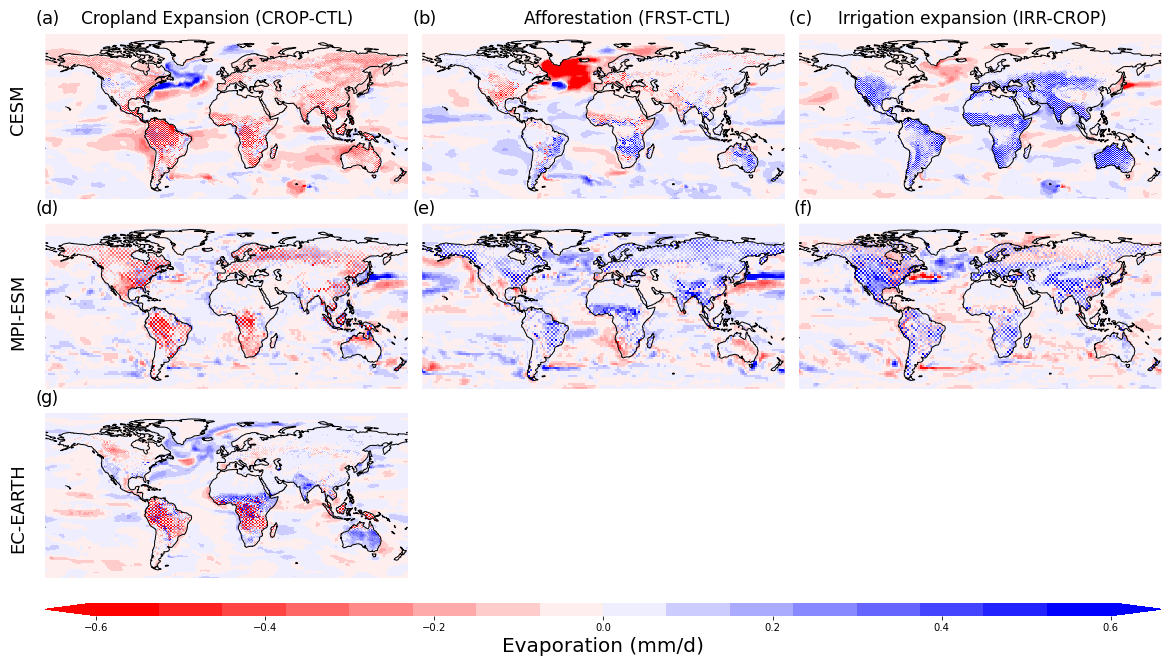
Figure 2The mean annual impacts of land cover and land management changes on evaporation (mm d−1), for cropland expansion (CROP-CTL; a and d), afforestation (FRST-CTL; b and e), and irrigation expansion (IRR-CROP; c and f) for CESM and MPI-ESM, respectively. Cropland expansion for EC-EARTH is shown in (g).
3.1 Changes in atmospheric moisture fluxes due to LCLMC
All ESMs generally show a decrease in evaporation over land due to cropland expansion and an increase in evaporation due to afforestation and irrigation expansion (Fig. 2). However, some of the ESMs' regional signals deviate from this general pattern. For cropland expansion (Fig. 2a, d, and g), CESM and MPI-ESM simulate a quasi-global decrease in evaporation over all land areas. In contrast, some regions also show an increase, such as the central US in CESM and eastern Africa and western Australia in MPI-ESM. The effects over the mid-latitudes exhibit a large seasonality, with an increase in evaporation in JJA and a decrease in DJF. This impact is clearly visible in CESM and also slightly visible in MPI-ESM (Figs. C1 and C2). In EC-EARTH, the annual patterns are less clear, with a large decrease in evaporation following cropland expansion over tropical forests and a slight decrease over the mid-latitudes but a clear increase over sub-tropical and tropical regions, such as the Sahel, eastern Africa, India, and Australia. Moreover, all models clearly distinguish between effects over deforested grid cells and those that have remained unaltered, following the chequerboard implementation of LCLMC (see Sect. 2.1). In EC-EARTH, there are deforested patches that show a distinct decrease in evaporation, while the nearby unaltered grid cells instead show a large increase.
Regarding afforestation, MPI-ESM shows opposite patterns compared to cropland expansion, mostly showing an increase in evaporation (Fig. 2b and e). However, in CESM this increase is only apparent over the Southern Hemisphere tropics while the Northern Hemisphere extratropics and the Sahel show a clear decrease in annual evaporation due to afforestation. It should be noted that the decrease in the extratropics is clearly linked to the boreal summer season (Figs. C1 and C2). Over the North Atlantic, CESM simulates a widespread and large decrease in evaporation, which may be linked to the widespread cooling of the North Atlantic in this ESM (De Hertog et al., 2023). Regarding irrigation expansion, both models for which this simulation is analysed (CESM and MPI-ESM) strongly agree on the sign of evaporation change over land and simulate a global increase (Fig. 2c and f). Differences between both ESMs are mostly related to the extent to which irrigation is applied within the different ESMs (see Fig. 1).
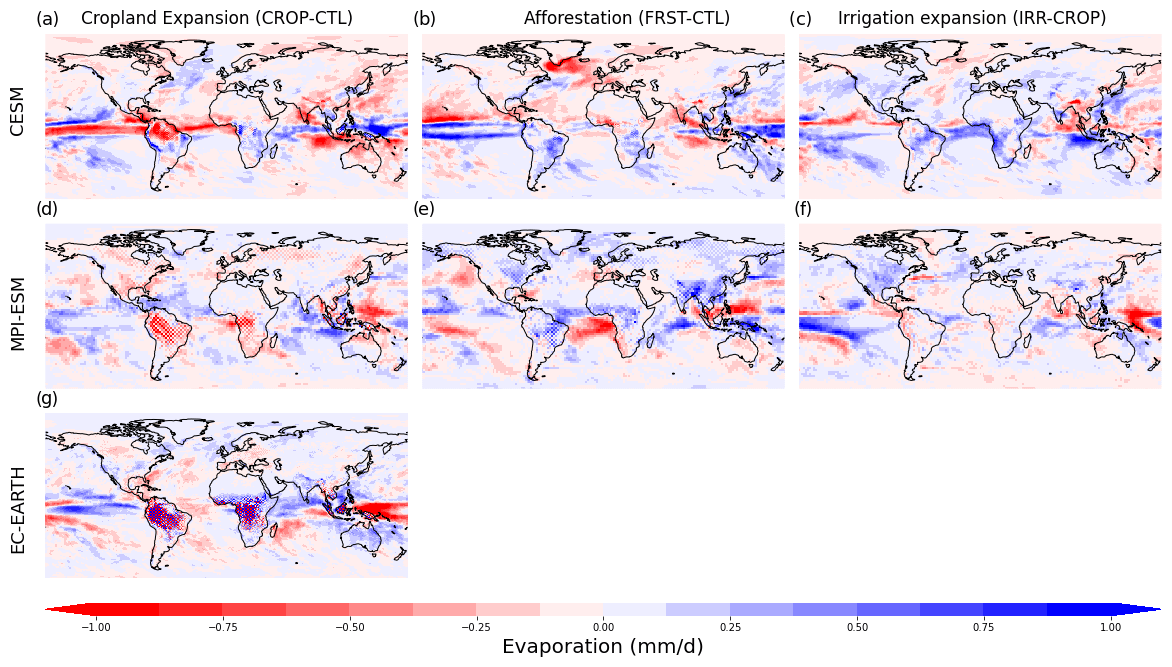
Figure 3The mean annual impacts of land cover and land management changes on precipitation (mm d−1), for cropland expansion (CROP-CTL; a and d), afforestation (FRST-CTL; b and e), and irrigation expansion (IRR-CROP; c and f) for CESM and MPI-ESM, respectively. Cropland expansion for EC-EARTH is shown in (g).
The effects of LCLMC on precipitation are less similar across the models, despite some regionally consistent patterns (Fig. 3). Under the cropland expansion scenario, there is a decrease in precipitation over land in MPI-ESM (Fig. 3b) and CESM, except for the central US, the Congo basin, and eastern Africa (Fig. 3a). The patterns of precipitation changes around the tropics in CESM are similar to those found in Portmann et al. (2022), which showed that deforestation-induced cooling over the Northern extratropics causes large-scale circulation changes such as the intensity of the Hadley cell and the position of the Intertropical Convergence Zone. In line with CESM, the cropland expansion simulation with EC-EARTH simulates the largest changes in precipitation over the tropics, which seems to indicate a shift in tropical rainfall bands. The effects of LCLMC on MFC also show substantial regional differences between CESM and MPI-ESM (Fig. D1). Overall, the patterns in MFC are highly similar to those seen for precipitation (Fig. 3) which indicates that these precipitation changes are likely driven by the changes in MFC.
Afforestation causes widespread increases in precipitation over land (Fig. 3b and e). This increase is quasi-global in MPI-ESM, while in CESM some areas show a precipitation decrease, such as the Indian subcontinent, the Sahel, and Europe. In CESM, the afforestation-induced precipitation differences over the Intertropical Convergence Zone are again similar to those found by Portmann et al. (2022), which indicates that shifts in the large-scale circulation determine the precipitation patterns in this ESM.
For the irrigation expansion scenario, all models simulate a global increase in precipitation. In CESM, it is apparent that Southeast Asia is an exception to this pattern and shows a clear reduction in precipitation despite being an area of large-scale irrigation. This is in line with the hypothesis that regional temperature decreases as a consequence of irrigation expansion (De Hertog et al., 2023) cause a weakening of the Indian summer monsoon and a decrease in precipitation over Southeast Asia, a feedback mechanism that has been documented in several previous studies (de Vrese et al., 2016; Guimberteau et al., 2012; Thiery et al., 2017). This decrease in precipitation over India is to some extent also present in MPI-ESM, although it is not as large as in CESM. For both ESMs it is clear that the response over this region occurs mainly during JJA (Figs. C3 and C4). This regional decrease is also apparent for MFC (Fig. D1c and f), which further supports the weakened Indian summer monsoon hypothesis.
3.2 Local and non-local effects on precipitation
The chequerboard implementation allows for a consistent separation between locally induced effects, which are directly caused by the LCLMC, and non-locally induced effects due to LCLMC elsewhere (See Sect. 2.1 and Appendix A). In this section we focus on the signal-separated results of precipitation for CROP-CTL and IRR-CROP to illustrate this separation in our simulations. The signal-separated maps for FRST-CTL and for evaporation are provided in Appendix B.
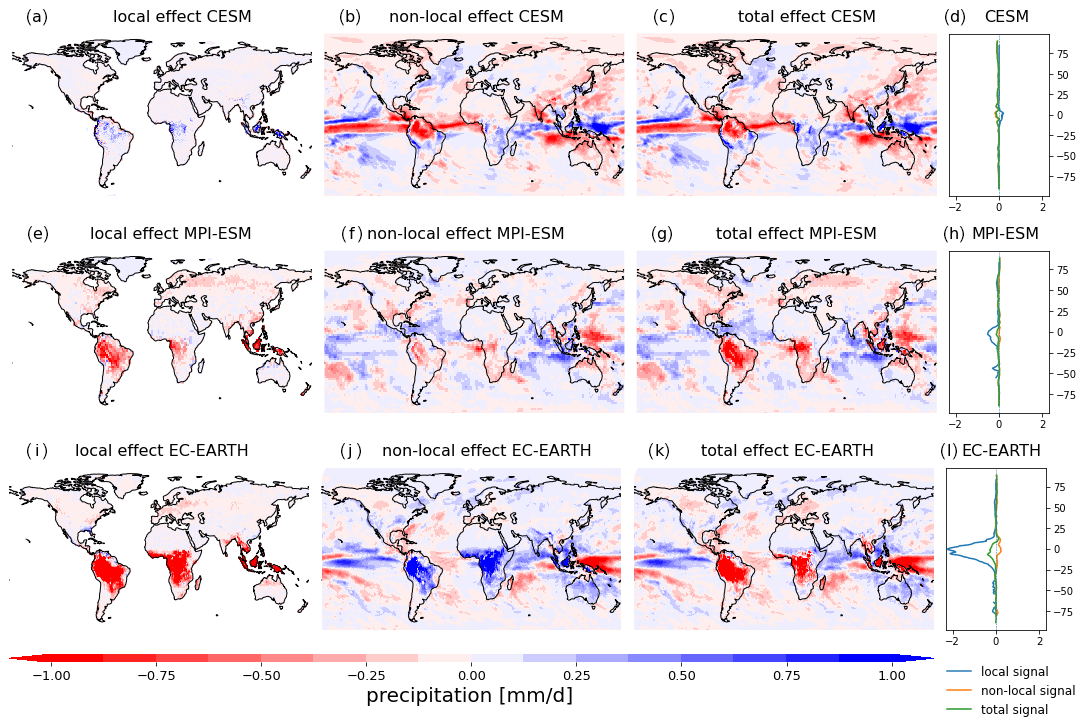
Figure 4Annual mean precipitation response (in mm d−1) to cropland expansion (CROP-CTL) of CESM, MPI-ESM, and EC-EARTH. The local effect in CESM (a), the non-local effect (b), and the total effect (c). The latitudinal average of the local (blue), non-local (yellow), and total (green) signals of CESM (d). Panels (e–h) are the same as (a–d) but for MPI-ESM. Panels (i–l) are the same as (a–d) but for EC-EARTH. The stippling on the maps shows grid cells where all the signs of change are consistent throughout the simulation.
Under the cropland expansion scenario there is a decrease in local precipitation over land in MPI-ESM and EC-EARTH which is especially clear over tropical latitudes (Fig. 4e and i). In CESM, in contrast, the majority of the effects are non-local, largely a decrease in precipitation, with only a relatively small local increase in some parts of the tropics. In MPI-ESM the non-local effects shows a regional decrease in precipitation mostly around areas of intense local effects. In EC-EARTH the non-local effects consist of a strong increase in precipitation, counteracting the local decreases. This is also confirmed by Fig. B1 which shows the signal-separated effects of evaporation for the cropland expansion simulations. Using the chequerboard implementation to separate local and non-local effects, EC-EARTH simulates a clear local decrease in evaporation due to cropland expansion, while the non-local effect causes an increase in evaporation over the tropics, resulting in attenuated total effects (Fig. 2). This pattern of strong decreases over areas of LCLMC and decreases in neighbouring grid cells is also visible for P−E, used here as proxy for MFC, and indicates mesoscale circulation effects induced by the LCLMC implementation in a chequerboard pattern (see Fig. D2g). In both MPI-ESM and EC-EARTH the local effects dominate the total signals, while for CESM the total effect is mostly determined by the non-local effects. This further indicates that the results in CESM appear to be dominated by circulation changes, which is also apparent in the signal-separated results for afforestation (Fig. B4).
For irrigation expansion, both MPI-ESM and CESM indicate a dominant non-local increase in precipitation (Fig. 5), which is mostly apparent in regions of intense irrigation (Fig. 1). In MPI-ESM there are some smaller local increases in precipitation as well, while in CESM the local effect appears unimportant. This general pattern does not hold over India, where both ESMs show a non-local decrease in precipitation over this region despite a strong local increase in evaporation (Fig. B3), which indicates that changes in circulation patterns are dominantly driving this effect. These signal-separated results help in characterizing the effects on the atmospheric water cycle within the different ESMs. However, they do not provide any information on the effects on moisture recycling, which is analysed using the WAM-2layer moisture tracking algorithm in the next section.
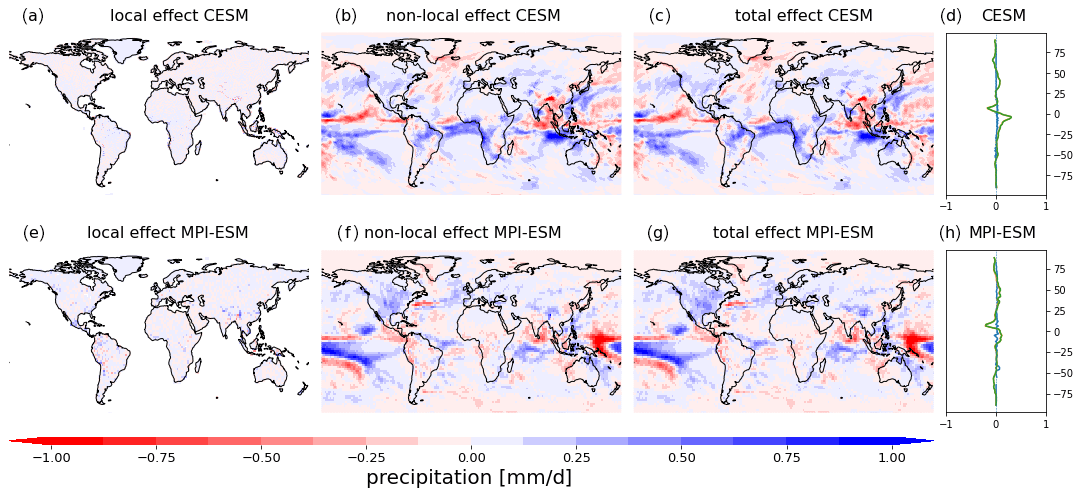
Figure 5Annual mean precipitation response (in mm d−1) to irrigation expansion (IRR-CROP) of CESM and MPI-ESM. The local effect in CESM (a), the non-local effect (b), and the total effect (c). The latitudinal average of the local (blue), non-local (yellow), and total (green) signals of CESM (d). Panels (e–h) are the same as (a–d) but for MPI-ESM. The stippling on the maps shows grid cells where all the sign of change is consistent throughout the simulation.
3.3 Changes in local precipitation and evaporation length scales due to LCLMC
To unravel the direct impact of LCLMC-induced evaporation changes on precipitation over land (and the other way around), we evaluate the outputs from WAM-2layers and show local evaporation and precipitation length scales for each model and LCLMC scenario. Even in their control simulations, the different ESMs show very different magnitudes of length scales of moisture recycling, both for the precipitation length scale (Fig. 6) and the evaporation length scale (Fig. 7). CESM shows the largest length scales, indicating that the importance of local recycling is relatively small. EC-EARTH, in contrast, generally shows very low values of the length scale indicating that local recycling is more important within this ESM. The length scale values captured by the three ESMs in our study lie within the broad range of values found in literature (van der Ent and Savenije, 2011; Theeuwen et al., 2023), even if our results are not directly comparable to the literature as they are based on reanalysis data. To our knowledge, no studies exist presenting length scales for ESMs. However, it is known that ESMs simulate substantial differences in the global water cycle (Li et al., 2022), which logically also translates to substantial differences in length scales. Both reanalysis-based studies (e.g. van der Ent and Savenije, 2011; Theeuwen et al., 2023) present values for the length scales ranging roughly within 1000–7000 km for the majority of the land surface. In general, CESM overestimates the length scales compared to literature, while EC-EARTH shows values at the lower end. Yet, the spatial patterns are quite similar among the ESMs and comparable to those in literature (van der Ent and Savenije, 2011; Theeuwen et al., 2023). The precipitation length scale is smallest over tropical rainforests and mountain ranges (see, for example, the Tibetan Plateau) indicating that these locations mostly get precipitation from nearby evaporation. Similar patterns are apparent for the evaporation length scale, although locations with a dry and continental climate such as Siberia and western North America also show very low values. This implies that evaporation occurring within these locations generally precipitates nearby.
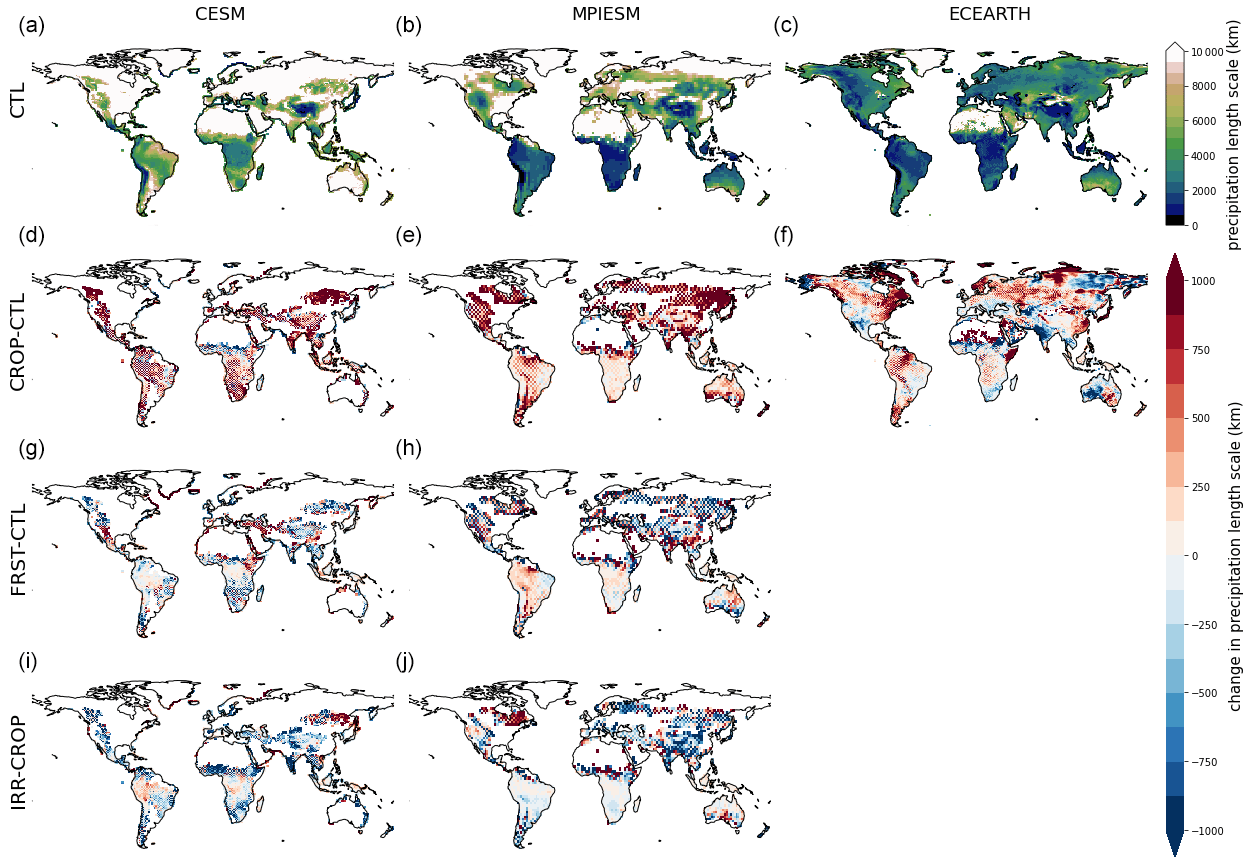
Figure 6The annual mean precipitation length scale (km) for the control (CTL) simulation in CESM (a), MPI-ESM (b) and EC-EARTH (c). The effect of cropland expansion (CROP-CTL) on the annual mean precipitation length scale is shown for CESM (d), MPI-ESM (e) and EC-EARTH (f). The effect of afforestation (FRST-CTL) is shown for CESM (g) and MPI-ESM (h), and finally the effect of irrigation expansion (IRR-CROP) is shown for CESM (i) and MPI-ESM (j). Note that in the difference plots in (d–j), the areas with a reference evaporation length scale higher than 10 000 km are cropped out.
In general, both the precipitation and evaporation length scale increase as a consequence of cropland expansion (see Figs. 6d–f and 7d–f). In MPI-ESM, it seems that the Congo basin is an exception with no clear changes in local recycling occurring there. In EC-EARTH, the patterns are more blurred than in the other ESMs, with a decrease in length scales in some regions, such as the central US and South Africa. However, over regions where the largest cropland expansion occurred (such as the Amazon basin and China; see also Fig. 1), the patterns are consistent with the other ESMs. Over Latin America, a dipole pattern of the change in the evaporation length scale in both EC-EARTH and CESM appears, showing an increase in the west and a decrease in the east. The general increase in length scale due to cropland expansion implies that the LCLMC induces a decrease in local recycling.
Afforestation (Figs. 6g, h and 7g, h) induces a pattern that is opposite to the cropland expansion case, with a decrease in length scale for both precipitation and evaporation. However, in some areas, the patterns diverge from the general trend; e.g. afforestation causes an increase in the evaporation length scale over the Amazon in CESM and an increase in the precipitation length scale over the tropics in MPI-ESM. In general, the changes in both length scales are larger for the extratropics, which is particularly visible for the evaporation length scale. This discrepancy may be explained by the fact that the tropics are already densely forested in the CTL scenario, in contrast to the sparsely forested extratropics (Fig. 1).
Regarding irrigation expansion (Figs. 6i, j and 7i, j), the effects on the evaporation length scale are less clear and generally of small magnitude. Irrigation-induced differences show a tendency towards a decreased evaporation length scale, which is rather consistent in MPI-ESM, but in CESM this pattern is less clear. The effects on the precipitation length scale in both ESMs are larger and consistently decreasing due to irrigation expansion. The change in precipitation length scale is small over the tropics due to the small amount of irrigation applied in this region (Fig. 1).
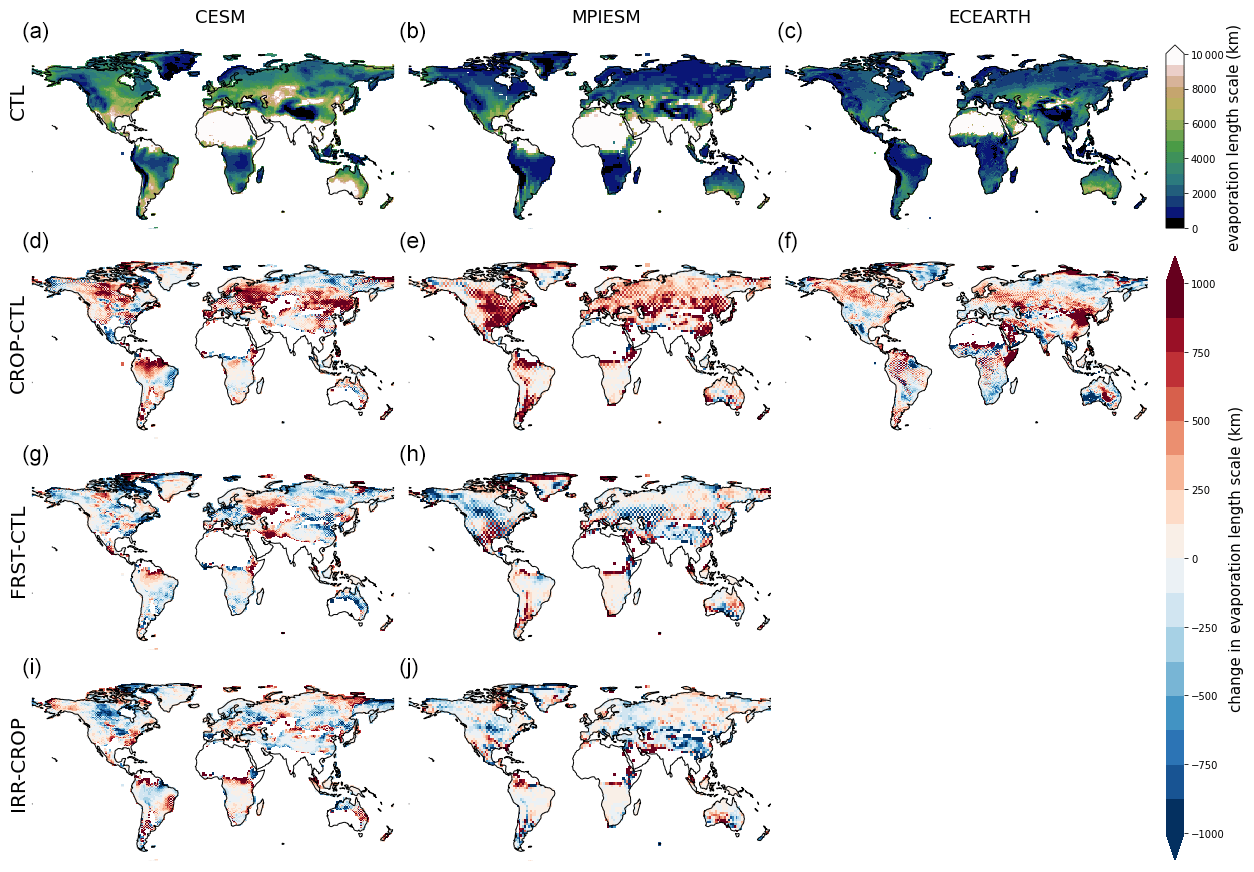
Figure 7The annual mean evaporation length scale (km) for the CTL simulation in CESM (a), MPI-ESM (b), and EC-EARTH (c). The effect of cropland expansion (CROP-CTL) on the annual mean evaporation length scale is shown for CESM (d), MPI-ESM (e) and EC-EARTH (f). The effect of afforestation (FRST-CTL) is shown for CESM (g) and MPI-ESM (h), and finally the effect of irrigation expansion (IRR-CROP) is shown for CESM (i) and MPI-ESM (j). Note that in the difference plots in (d–j), the areas with a reference precipitation length scale higher than 10 000 km are cropped out.
3.4 Changes in continental moisture recycling due to LCLMC
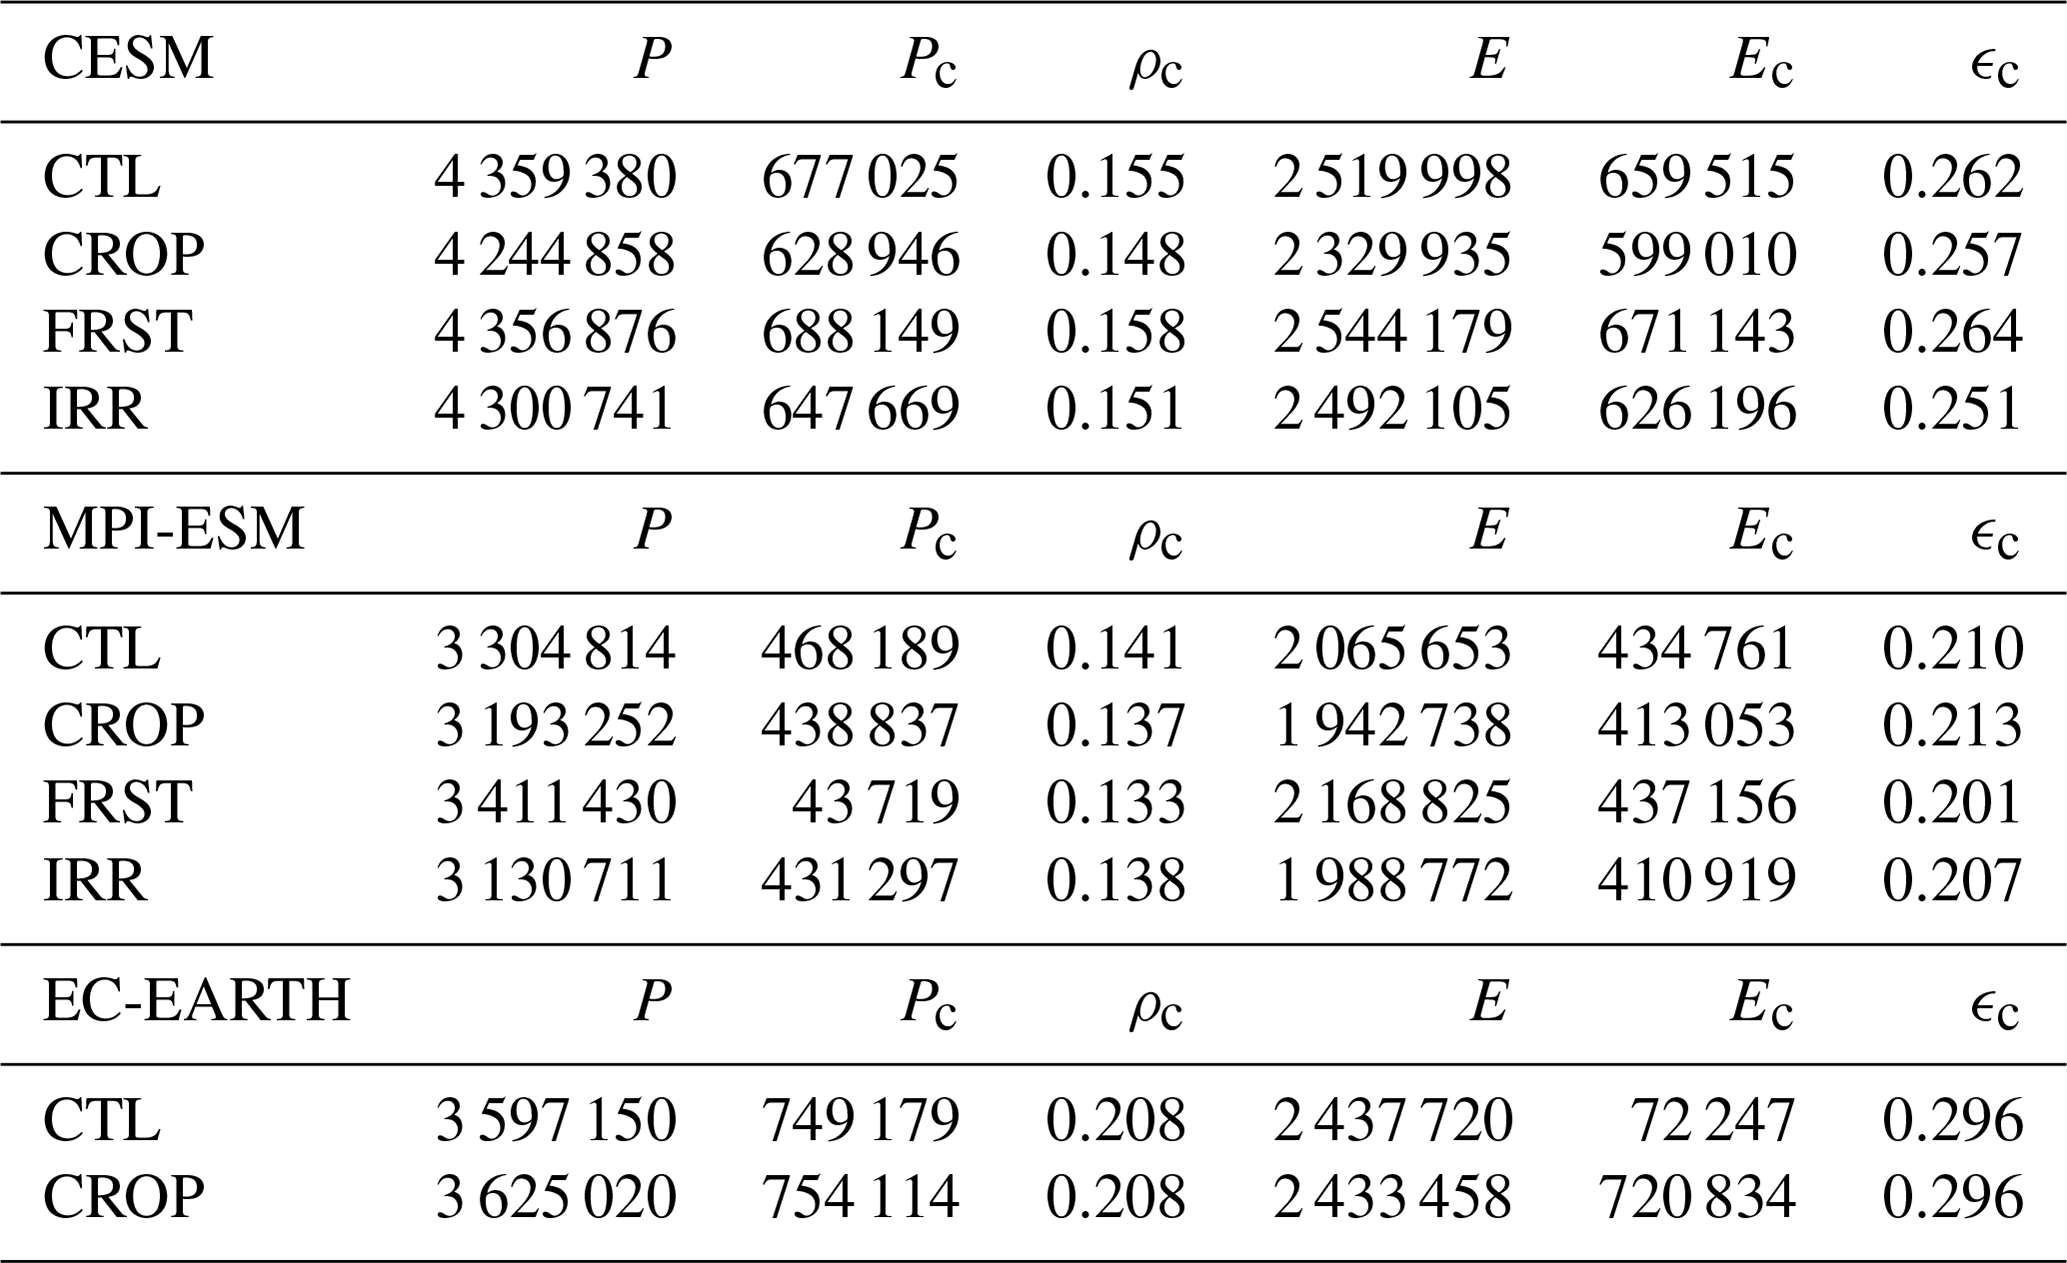
While there are substantial differences in the local effects of LCLMC on the water cycle, their net impact on water availability over land might not be the same. Here, we evaluate how LCLMC impacts E, P, and P−E over land, and we identify the direct impact of LCLMC-induced effects on these fluxes via continental moisture recycling (see Sect. 2.3.4). The values of total annual precipitation (P), continental precipitation (Pc), continental precipitation recycling (ρc), evaporation (E), continental evaporation (Ec) and continental evaporation recycling (ϵc) are included in Appendix F. Cropland expansion causes a net decrease in evaporation from land in CESM and MPI-ESM, while EC-EARTH simulates a small net increase in continental evaporation (Fig. 8a). Through this decrease in evaporation in CESM and MPI-ESM, less moisture is available for continental moisture recycling (dark bars in Fig. 8a) and for precipitation over oceans (light bars in Fig. 8a). Analogously, cropland expansion is causing a net decrease in precipitation over land in CESM and MPI-ESM, but a net increase in EC-EARTH, which is due to contrasting signs of change in different parts of the globe (Fig. F2). In the former two models, the simulated decrease in precipitation mainly results from decreased moisture imports from the ocean (light bars in Fig. 8b), and only 42 % and 26 %, respectively, of the precipitation deficit is estimated to be of continental origin (dark bars in Fig. 8b).
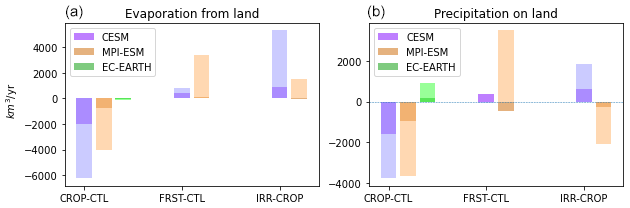
Figure 8The global change in annual mean evaporation (a) and precipitation (b) on land is shown for CESM in blue, MPI-ESM in orange, and EC-EARTH in green for cropland expansion (CROP-CTL), afforestation (FRST-CTL), and irrigation expansion (IRR-CROP). The contribution of continental moisture recycling changes is shown in a darker shade of the ESM's respective colours.
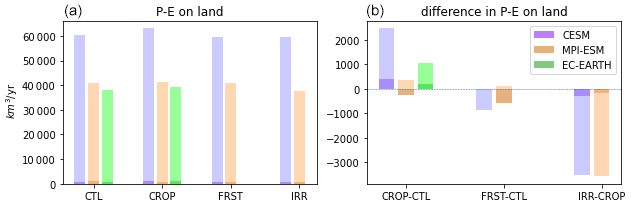
Figure 9The total annual mean P−E on land (a) and change in P−E on land (b) is shown for CESM in blue, MPI-ESM in orange, and EC-EARTH in green for cropland expansion (CROP-CTL), afforestation (FRST-CTL), and irrigation expansion (IRR-CROP). The contribution of continental moisture recycling changes is shown in a darker tone of the ESM's respective colours.
The effects on evaporation from land due to afforestation are consistent in sign and generally cause an increase for both ESMs. A large part of this increase is available for continental moisture recycling (dark bars in Fig. 8a) in CESM (48 %) but is negligible for MPI-ESM (2 %). In MPI-ESM the increase in land evaporation mainly rains out over the oceans (light bars in Fig. 8a). Evaluated over all land regions, afforestation increases precipitation over land in both MPI-ESM and CESM Fig. 8b). The magnitude is much smaller in CESM due to the large spatial heterogeneity in precipitation effects (Fig. F1), which cancel each other out, causing only a small net increase in precipitation over land. For MPI-ESM, there is a large heterogeneity within the signal of change (Fig. F1), causing diverging contributions of moisture for continental precipitation from ocean and land. Atmospheric circulation changes in this model cause an increase in precipitation of oceanic origin on land, while less precipitation is estimated to be of continental origin.
Regarding irrigation expansion, there is a large increase in evaporation from land in CESM, of which most rains out over the oceans (light bar in Fig. 8a), and only a small fraction (17 %) is available for continental moisture recycling (dark bar in Fig. 8a). In MPI-ESM, the effect is smaller due to some areas of decreased recycling (Fig. F2) but the results still show an overall increase in evaporation of which most rains out over the ocean. For precipitation over land, the effect is not consistent across the ESMs. In CESM there is an increase in precipitation over land, of which 34 % is available for continental recycling. In contrast, for MPI-ESM there is a global decrease in continental precipitation, of which 12 % stems from the precipitation deficit over land.
Finally, we can quantify the global effects of LCLMC on global water exports from land towards the ocean by analysing the effects on P−E. In general, P−E is positive for all three ESMs, being substantially larger in CESM than in MPI-ESM and EC-EARTH (Fig. 9a), indicating that the land receives more water from the atmosphere and of oceanic origin than it provides through evaporation. Both evaporation and precipitation decreases for MPI-ESM and CESM due to cropland expansion (Fig. 8), but the decrease in evaporation is larger, causing a net surplus of water at the land surface (i.e. ). There is also a net surplus of water for EC-EARTH, although this is mostly due to increased continental precipitation (Fig. 8). In EC-EARTH and CESM, the contribution due to continental recycling is 16 % and 20 %, respectively (light bars in Figs. 8 and 9b), but the majority comes from changes in oceanic moisture. This differs from MPI-ESM, where less moisture is recycled (dark bar in Fig. 9b). Afforestation, in turn, is causing a net loss of water at the land surface for both ESMs. CESM simulates an increase in water export from land through an increase in land evaporation that rains out over the ocean (Fig. 9b). In contrast, MPI-ESM shows a slight increase in water availability over land due to oceanic moisture, with the effect of continental moisture changes dominating the global decrease in water availability. Following irrigation expansion, both CESM and MPI-ESM simulate a decrease in water available on land. In both simulations, enhanced evaporation through irrigation from land (see Fig. 8a) mostly rains out over the ocean (light bars in Fig. 9b), thus a loss of water on land to the ocean, with the contribution of continental recycling being 8 % and 5 % for CESM and MPI-ESM, respectively.
LCLMC can have substantial effects on atmospheric moisture fluxes and the local and continental recycling of moisture that determine water availability on land. The different ESMs show large differences in their hydrological responses to the different LCLMC scenarios. However, some common patterns do emerge from this multi-model analysis. For cropland expansion, all three ESMs agree that there is a general decrease in land evaporation, and for precipitation the patterns are less clear with large regional differences across ESMs. These changes in moisture fluxes affect the local recycling strength with a general decrease. In contrast, afforestation and irrigation expansion show a general increase in precipitation and evaporation over most regions. Similarly, local recycling strength mostly increases despite large regional differences. Here we will discuss some of the discrepancies between the different ESMs and their implications on moisture fluxes and moisture recycling.
4.1 Different hydroclimatic responses of ESMs to LCLMC
The effects of LCLMC within the different ESMs have strong regional variations (e.g. Figs. 2 and 3). The differing length scales between ESMs (Figs. 6 and 7) illustrate that different processes dominate within the different ESMs: EC-EARTH shows a stronger importance of local processes in contrast to CESM, where atmospheric circulation seems to dominate the effects. This is also illustrated through the signal-separated results (Figs. 4 and 5), where CESM mainly shows non-local effects, while MPI-ESM and EC-EARTH show a stronger importance of local effects. This difference is also clear from the effects on moisture fluxes as EC-EARTH simulates strong mesoscale effects (10 to 100 km), while in CESM global circulation changes appear to dominate. CESM is known to be an ESM with a strong natural variability, as was shown in several other studies (Deser et al., 2012, 2020). It has also been shown to simulate large-scale circulation shifts as a consequence to land cover change (Portmann et al., 2022; Devaraju et al., 2018).
Discrepancies in the CTL length scales estimated for each ESM could also stem from the different spatial resolutions employed here (CESM: 0.90° × 1.25°; MPI-ESM: 1.88° × 1.88°; and EC-EARTH: 0.7° × 0.7°). Although the concept of length scales is independent of the spatial resolution (van der Ent and Savenije, 2011), the capability of ESMs to resolve processes explicitly is resolution dependent. This implies that certain processes, such as mesoscale convection, are potentially better resolved within EC-EARTH than in CESM and MPI-ESM. These strong differences in length scales, despite showing effects from induced LCLMC on local length scales which are consistent in sign, are important as they clearly illustrate some of the challenges involved in modelling the atmospheric water cycle using ESMs. The LCLMC effects on climate simulated by CESM are dominated by circulation effects with lower importance of moisture recycling than a world as simulated by EC-EARTH. A next step to better understand these strong differences could be to evaluate the outputs of ESMs to reanalysis products in order to better understand potential biases in evaporation and precipitation fluxes that could help in explaining these differences.
The way LCLMC is implemented in the different ESMs also causes some discrepancies. Some of the ESMs only represent crops by few generic crop types (such as MPI-ESM) while others have different crop types representing different biophysical properties. CESM has eight different crop types representing common crops around the world (Lombardozzi et al., 2020). In CESM, maize has high evaporation rates which might explain why afforestation over the Northern Hemisphere extratropics is causing a decrease in evaporation, with particularly strong effects during summer (Fig. C1). The discrepancy between the effects due to afforestation and cropland expansion can be partially explained by a saturation effect, as the effects of adding trees are likely non-linear (Winckler et al., 2017b). For example, in the tropics, extreme deforestation will have larger impacts on the hydrological cycle than adding trees in an already densely forested region. This effect could explain some differences between these simulations such as the smaller precipitation length scale changes in afforestation over the tropics.
The implementation of irrigation also causes substantial differences in climatic responses among the ESMs, as the maps of irrigation extent and amounts differ strongly (Fig. 1). Both MPI-ESM and CESM show an increase in precipitation, except for the Indian subcontinent where both ESMs show a decrease in precipitation. As there is a cooling over all irrigated areas (De Hertog et al., 2023), there is a lower land–ocean temperature contrast, which reduces convection over land and therefore precipitation (Figs. 3 and D1). This occurs despite the increases in evaporation (Fig. 2) and enhanced local precipitation recycling (Fig. 6). Considering all of the above, it is likely that the reduced precipitation shown here is caused by a weakened Indian summer monsoon as was highlighted by previous studies (Puma and Cook, 2010; de Vrese et al., 2016; Thiery et al., 2017, 2020).
4.2 Implications of changes in moisture recycling due to LCLMC
LCLMC strongly affects the redistribution of moisture over land in the ESMs. While the absolute length scales of moisture recycling differ among the ESMs, LCLMC-induced changes in local recycling are typically consistent in sign across the ESMs, with cropland expansion mostly causing decreased recycling and afforestation and irrigation expansion mostly causing enhanced local recycling (Figs. 6 and 7). The effects of LCLMC on continental recycling and the continental contribution to and from precipitation and evaporation are less consistent across ESMs (Figs. 8 and 9) but also geographically more heterogeneous within the ESMs (Figs. F1 and F2). This is due to the complex interactions of local effects with non-local effects, such as advection and circulation changes, which all affect the redistribution of water globally.
Although the effects of LCLMC on the precipitation and evaporation changes are substantial, they are not as large as could be expected based on the0 literature (Tuinenburg et al., 2020; Hoek van Dijke et al., 2022; Baudena et al., 2021; Wunderling et al., 2022; Staal et al., 2018). This could partially be due to the less extensive LCLMC scenarios considered here (only 50 % change due to chequerboard approach). However, differences are expected because most previous studies are based on reanalyses and can only estimate the impact of upwind LCLMC changes on downwind precipitation using constant recycling ratios, neglecting any other interactions such as through changes in atmospheric circulation. Therefore, to fully capture the impact of LCLMC on moisture recycling, LCLMC model simulations should be compared to a control simulation, as done here. In fact, the resulting (substantial) differences in recycling ratios show that the interactions that are not considered when basing the studies on reanalysis are not negligible (at least within the context of extensive LCLMC scenarios as considered here). As LCLMC becomes increasingly relevant as a climate mitigation strategy it is important to consider a more holistic view of the influence of these strategies on the water cycle. Consequently, more research is needed to better constrain the effects of LCLMC on moisture recycling, aiming to support science that can guide future land cover planning.
4.3 Circulation effects induced by chequerboard LCLMC implementation
The specific setup of these simulations, with a chequerboard pattern LCLMC, also has limitations and causes some artefacts within the results. This is, for example, illustrated in the clear chequerboard pattern visible for evaporation (Fig. 2) and precipitation changes (Fig. 3) from EC-EARTH, especially over the tropics. Due to the area dependence of the effects of land cover changes on moisture fluxes (Spracklen et al., 2018), mesoscale circulation effects occur in EC-EARTH but do not appear in the other (coarser) ESMs (see for example Fig. 4). This chequerboard-like effect would likely not occur if a full land cover change was simulated instead of the chequerboard implementation of the LCLMC. This implementation could have some important implications, as the non-local effects for EC-EARTH do not represent the effects one would get in a full land cover change simulation, implying that the assumptions behind the chequerboard approach are not met (Winckler et al., 2017a; De Hertog et al., 2023). Moreover, the LCLMC-induced effects on atmospheric circulation and moisture fluxes also affect other climate variables, such as temperature. These chequerboard-induced circulation changes could also explain the differences between the temperature effects found in De Hertog et al. (2023): here, the chequerboard-implementation of cropland expansion in EC-EARTH caused tropical warming, and the simulations from Boysen et al. (2020) with EC-EARTH that simulated full deforestation changes (forest to grass conversion), showed tropical cooling. Further research is required to completely understand the implications of chequerboard-induced climate effects. For example, the LCLMC could be implemented in different densities (, , grid cells that undergo LCLMC) next to a full deforestation experiment to assess whether these effects are true artefacts of the LCLMC patterns. However, this might imply that the chequerboard approach for signal separation requires a rough spatial implementation to avoid mesoscale circulation effects as seen here for EC-EARTH.
In this study, we analysed the effects of land cover and land management changes (LCLMC) on the atmospheric water cycle in a slate of idealized simulations (cropland expansion, afforestation, and irrigation expansion) performed by three different Earth system models (ESMs). We showed that the effects on moisture fluxes are substantial but differ strongly across the ESMs. Cropland expansion typically causes a decrease in evaporation, while for precipitation the sign of change depends on the region and ESM. For afforestation and irrigation expansion there is generally an increase in both precipitation and evaporation, although regional differences are important. The results presented here clearly illustrate that substantial discrepancies exist between the different ESMs, with EC-EARTH displaying important local recycling and mesoscale circulation effects, while CESM shows a dominance of large-scale atmospheric circulation shifts. These differences can have various causes, such as model parameterizations of crucial processes (e.g. convection) or the extent to which different land cover types are implemented within the ESMs on a global scale. Because some of these effects might have been indirectly influenced by the chequerboard LCLMC pattern used in this study, we advocate for more research to assess the implications of possible chequerboard-induced climate effects and the applicability of this approach for signal separation into local and non-local effects. Despite the strong differences between ESMs, the effects on local recycling are generally consistent in sign (with notable regional exceptions), with cropland expansion causing a decreased recycling strength, and afforestation and irrigation expansion generally causing an increased recycling strength. Overall we find that cropland expansion causes a net increase in water availability on land while afforestation and irrigation expansion cause a net decrease. However, these effects on water availability are caused by different changes in continental recycling due to LCLMC across the different ESMs. Our simulations show that changes due to atmospheric circulation patterns play an important role in explaining these patterns and should be taken into account when assessing the effects of future LCLMC on moisture recycling.
This is the first study – to our knowledge – to explicitly consider moisture recycling when assessing the LCLMC-induced effects on moisture fluxes using multiple ESMs. Our results show that the effects of LCLMC on moisture recycling are substantial both on the local and global scale, with clear implications for water availability on land. Our results highlight that large differences between the ESMs remain, which require more research. However, despite these inter-ESM differences it is clear that LCLMC will substantially affect the atmospheric water cycle. Therefore, the inclusion of potential effects of LCLMC on the atmospheric water cycle should be considered in future land cover planning.
The chequerboard approach was developed by Winckler et al. (2017a) for the signal separation into local and non-local effects within dedicated simulations with the MPI-ESM. Subsequently it has been applied to the LCLMC simulations performed within the LAMACLIMA project in a multi-model framework (De Hertog et al., 2023). “Local effects” are defined as the direct climate effect due to the changes in land surface properties within a given grid cell, while “non-local effects” are climate effects caused by changes in atmospheric circulation or advection as a consequence of LCLMC elsewhere (Winckler et al., 2017a). Here we summarize the approach and highlight technical processing steps taken to extract the local and non-local signal from the raw ESM output. The chequerboard approach allows a robust signal separation of local and non-local effects by implementing the LCLMC in a chequerboard pattern, i.e. alternating “change” grid cells, where LCLMC occurs, with “no change” grid cells, which retain the CTL land cover (see Fig. 1). It can then be assumed that any effects in climate variables over the “no change” grid cells can be attributed as a non-local effect while in the “change” grid cells of the raw model output both local and non-local effects occur (Winckler et al., 2017a). The 150-year simulation with constant external forcings is split into five slices of 30 years each. To account for natural variability, we treat each slice as a member of a perturbed initial condition ensemble. In order to apply the signal separation, a multi-year monthly mean is computed over each of these ensemble members (De Hertog et al., 2023). (1) We subtract a reference member from the LCLMC member of interest, i.e. for CROP and FRST this reference member is CTL, while for the IRR simulation it is CROP. (2) We mask the LCLMC grid cells of this difference map, retaining only those grid cells where only non-local effects occur. (3) The grid cells with only non-local effects are spatially interpolated to fill the masked LCLMC grid cells in order to create a global map of the non-local effect. Consequently, to create a global map of the local effects, we mask all “no change” grid cells from the difference map created in (1), and thus only retain the grid cells where both local and non-local effects occur. The values of these grid cells are then corrected by the interpolated non-local values in order to only retain the local effects. Subsequently, the values of the resulting grid cells are again spatially interpolated in order to attain a full global map of local effects. Finally, the sum of both the local and non-local effects then represents the total effect. This is the effect we would expect if an actual idealized LCLMC simulation had been performed without an LCLMC chequerboard pattern, although it should be noted that this total effect can be considered a lower limit as the non-local effects represent only a 50 % change simulation (Winckler et al., 2017a). The chequerboard approach is implemented to each model grid at its native resolution. Hence, grid cell sizes vary across the different ESMs. As we have five ensemble members of 30 years for each simulation, we can extract local and non-local signals for each ensemble member, which are then used as a measure of uncertainty coming from natural variability (De Hertog et al., 2023). Within this study we focus on interpreting the raw ESM output (as this is used in the moisture tracking analysis) and only apply the signal separation for completeness and to support the interpretation of the presented results.
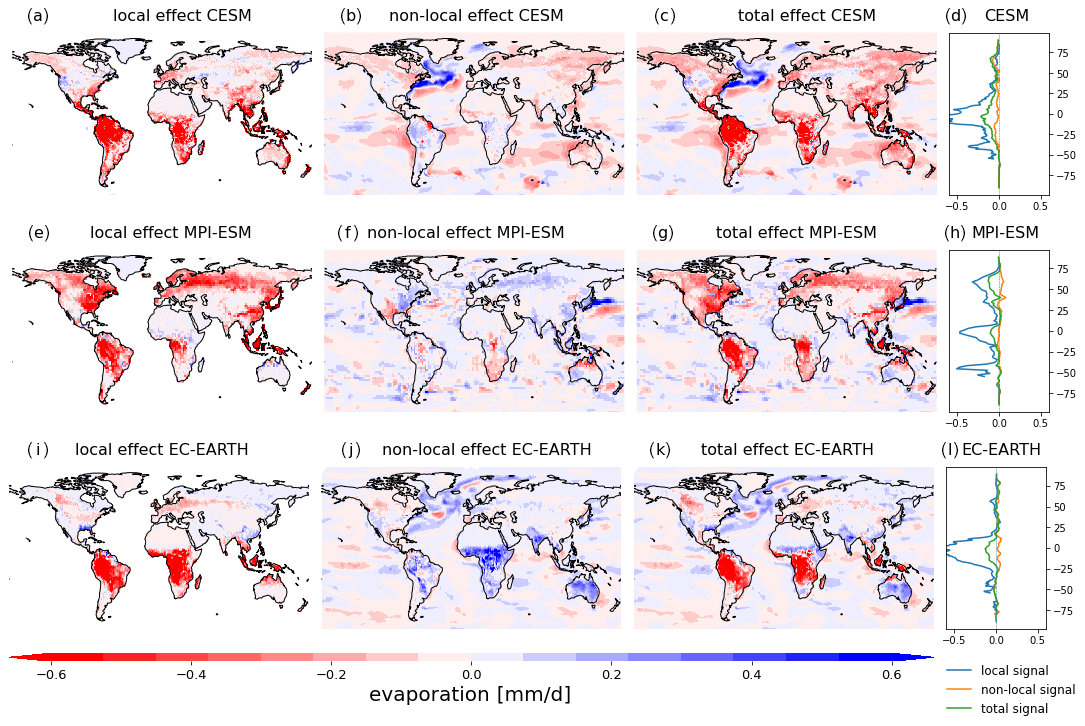
Figure B1Annual mean evaporation response (in mm d−1) to cropland expansion (CROP-CTL) of CESM, MPI-ESM, and EC-EARTH. The local effect in CESM (a), the non-local effect (b), and the total effect (c). The latitudinal average of the local (blue), non-local (yellow), and total (green) signals of CESM (d). Panels (e–h) are the same as (a–d) but for MPI-ESM. Panels (i–l) are the same as (a–d) but for EC-EARTH. The stippling on the maps shows grid cells where all the signs of change are consistent throughout the simulation.
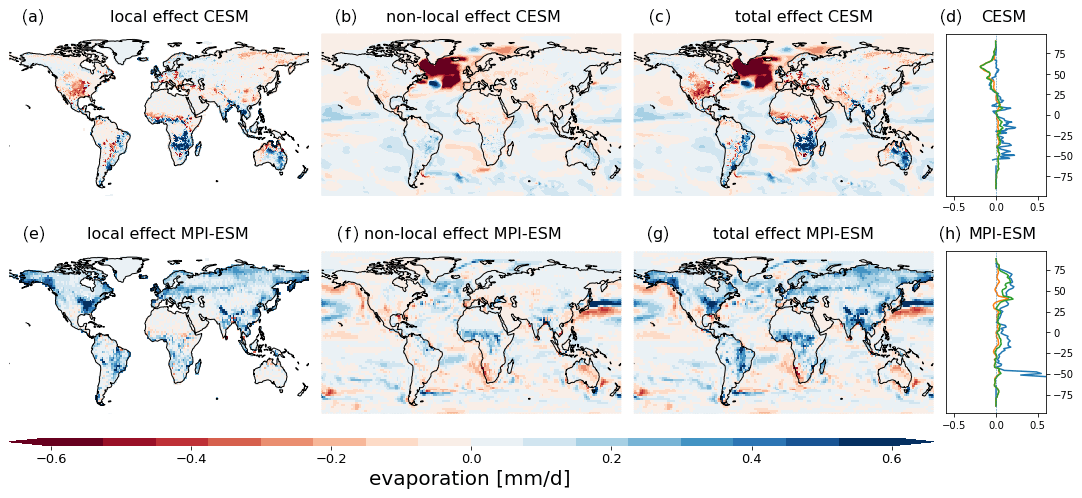
Figure B2Annual mean evaporation response (in mm d−1) to afforestation (FRST-CTL) of CESM and MPI-ESM. The local effect in CESM (a), the non-local effect (b), and the total effect (c). The latitudinal average of the local (blue), non-local (yellow), and total (green) signals of CESM (d). Panels (e–h) are the same as (a–d) but for MPI-ESM. The stippling on the maps shows grid cells where all the signs of change are consistent throughout the simulation.
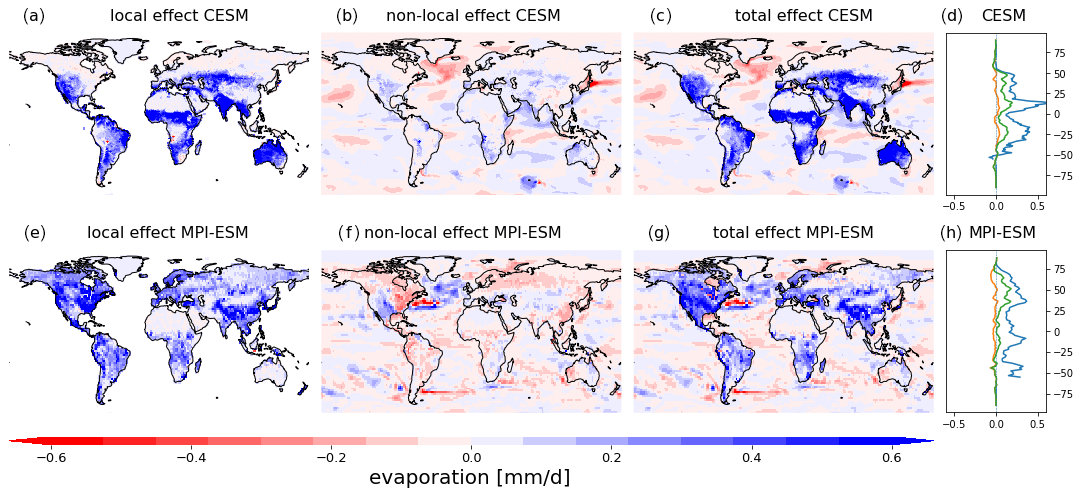
Figure B3Annual mean evaporation response (in mm d−1) to irrigation expansion (IRR-CROP) of CESM and MPI-ESM. The local effect in CESM (a), the non-local effect (b), and the total effect (c). The latitudinal average of the local (blue), non-local (yellow), and total (green) signals of CESM (d). Panels (e–h) are the same as (a–d) but for MPI-ESM. The stippling on the maps shows grid cells where all the signs of change are consistent throughout the simulation.
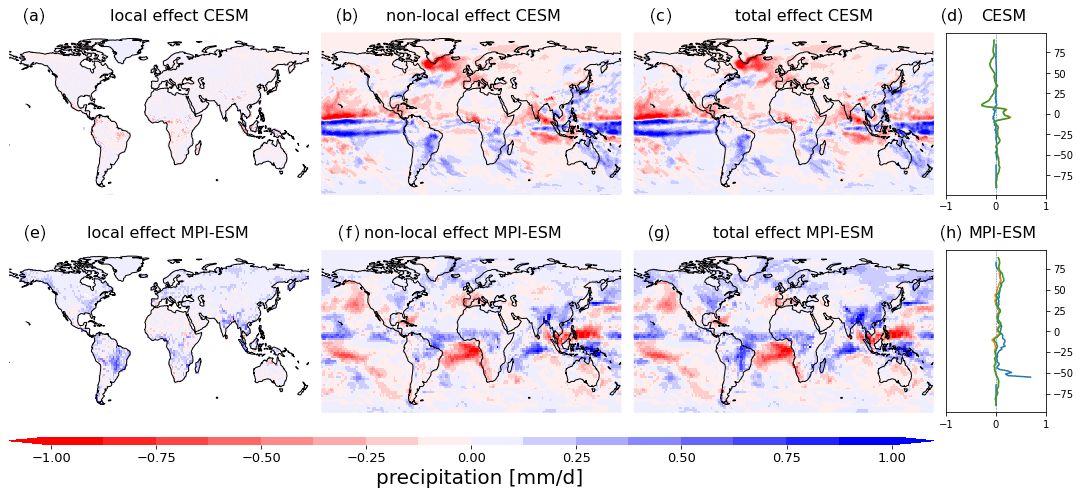
Figure B4Annual mean precipitation response (in mm d−1) to afforestation (FRST-CTL) of CESM and MPI-ESM. The local effect in CESM (a), the non-local effect (b), and the total effect (c). The latitudinal average of the local (blue), non-local (yellow), and total (green) signals of CESM (d). Panels (e–h) are the same as (a–d) but for MPI-ESM. The stippling on the maps shows grid cells where all the signs of change are consistent throughout the simulation.
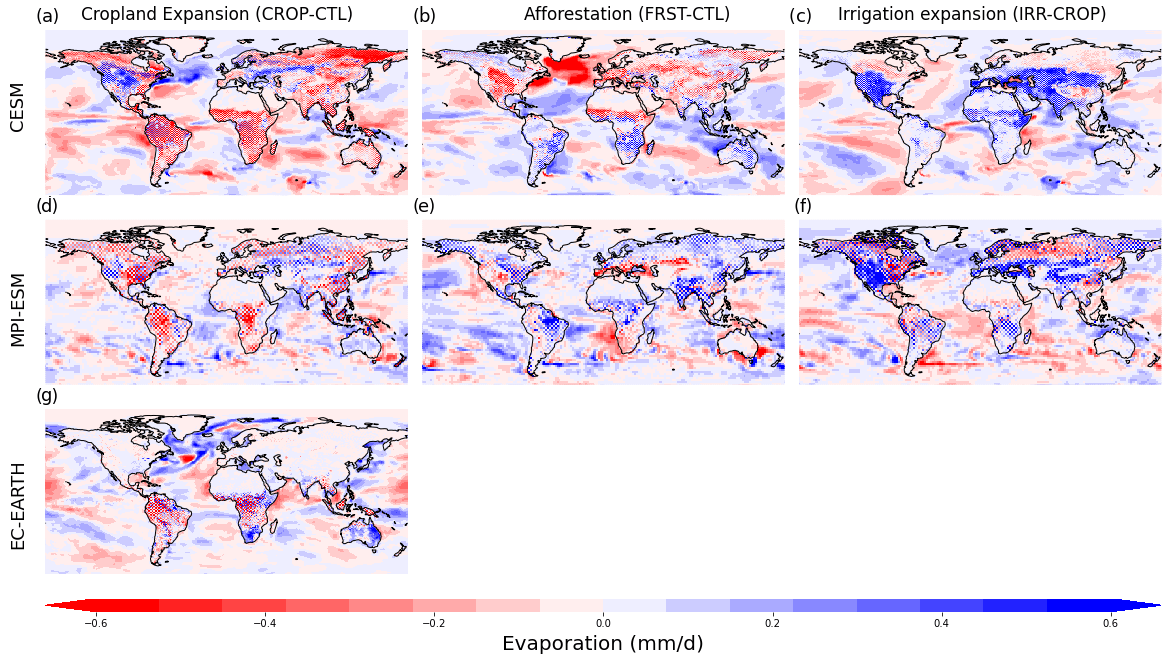
Figure C1The seasonal mean (JJA) effects on evaporation (in mm d−1) as a consequence of cropland expansion (CROP-CTL) in CESM (a), MPI-ESM (d), and EC-EARTH (g) for afforestation (FRST-CTL) in CESM (b) and MPI-ESM (e) and irrigation expansion (IRR-CROP) for CESM (c) and MPI-ESM (f).
Figure C2The seasonal mean (DJF) effects on evaporation (in mm d−1) as a consequence of cropland expansion (CROP-CTL) in CESM (a), MPI-ESM (d), and EC-EARTH (g) for afforestation (FRST-CTL) in CESM (b) and MPI-ESM (e) and irrigation expansion (IRR-CROP) for CESM (c) and MPI-ESM (f).
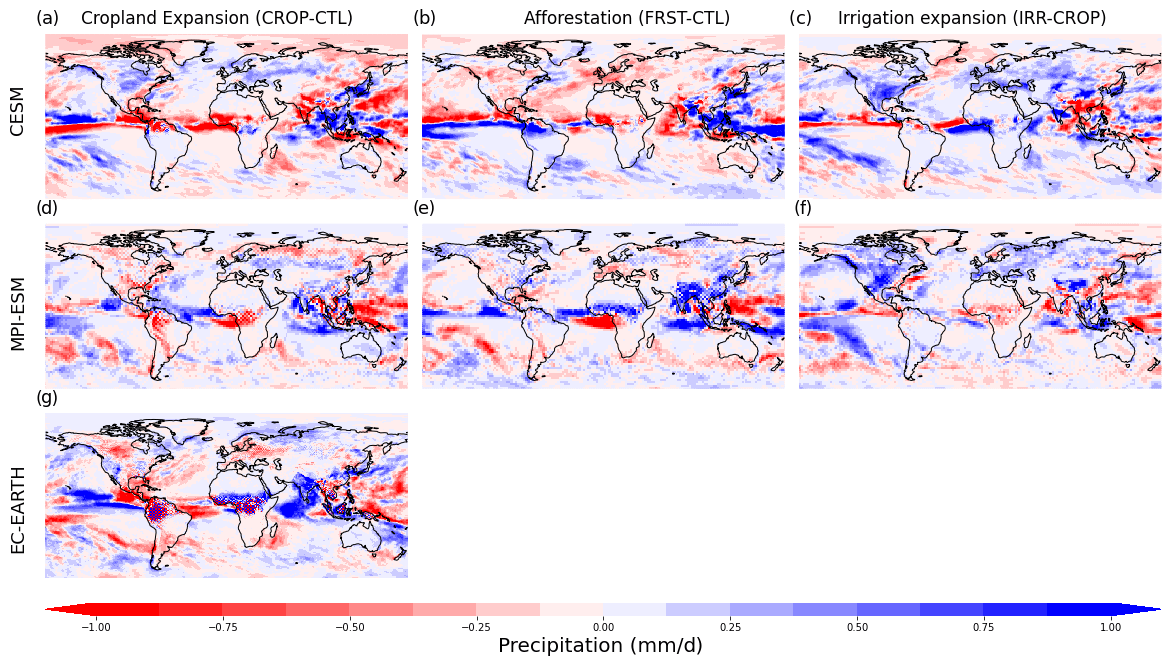
Figure C3The seasonal mean (JJA) effects on precipitation (in mm d−1) as a consequence of cropland expansion (CROP-CTL) in CESM (a), MPI-ESM (d), and EC-EARTH (g) for afforestation (FRST-CTL) in CESM (b) and MPI-ESM (e) and irrigation expansion (IRR-CROP) for CESM (c) and MPI-ESM (f).
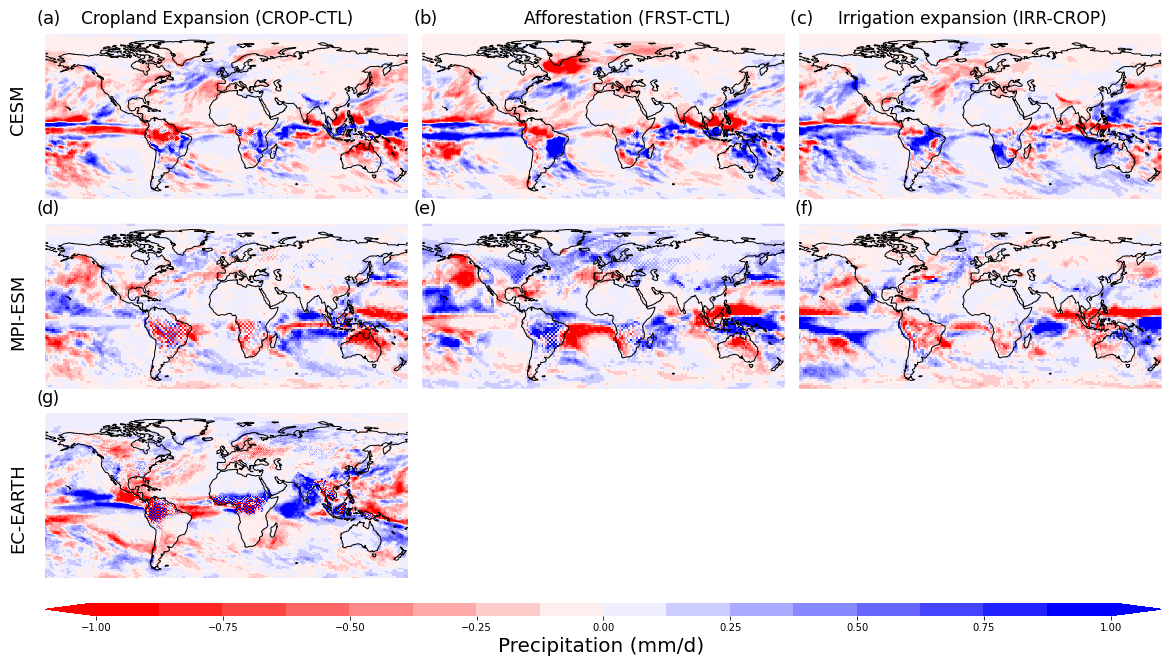
Figure C4The seasonal mean (DJF) effects on precipitation (in mm d−1) as a consequence of cropland expansion (CROP-CTL) in CESM (a), MPI-ESM (d), and EC-EARTH (g) for afforestation (FRST-CTL) in CESM (b) and MPI-ESM (e) and irrigation expansion (IRR-CROP) for CESM (c) and MPI-ESM (f).
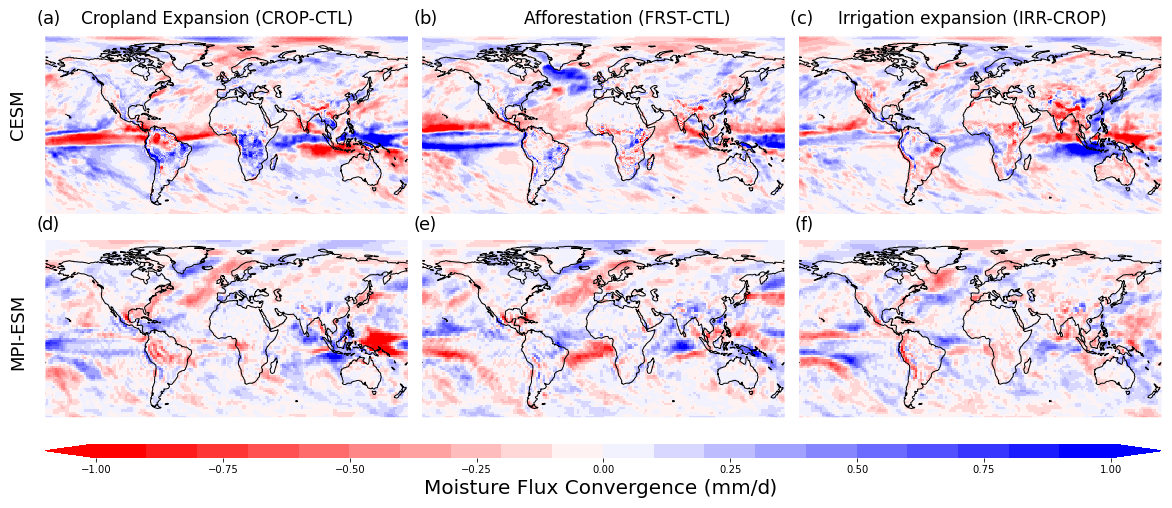
Figure D1The mean annual impacts of land cover and land management changes on moisture flux convergence (MFC) (in mm d−1), for cropland expansion (CROP-CTL; a and d), afforestation (FRST-CTL; b and e), and irrigation expansion (IRR-CROP; c and f) for CESM and MPI-ESM, respectively.
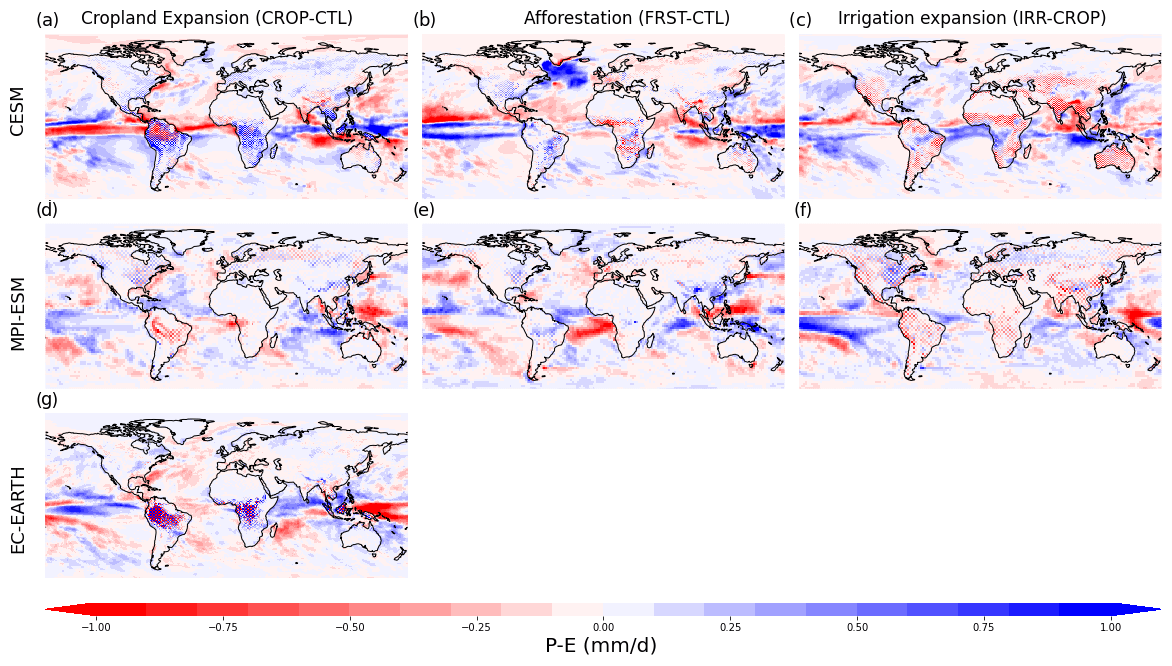
Figure D2The annual mean effects on P−E (in mm d−1) as a consequence of cropland expansion (CROP-CTL) in CESM (a), MPI-ESM (d), and EC-EARTH (g) for afforestation (FRST-CTL) in CESM (b) and MPI-ESM (e) and irrigation expansion (IRR-CROP) for CESM (c) and MPI-ESM (f).
The length scales are a shape- and size-independent metric defined to represent the local moisture recycling strength (van der Ent and Savenije, 2011). They are represented in distance units (typically kilometres) but should not be confused with actual travel distances, an actual travel distance of moisture is not representative of local recycling strength. The actual travel distances as inferred from an air parcel trajectory accumulates the influences of downstream regions on the moisture content of the air parcel along its trajectory, which is typically within the order of thousands of kilometres. The length scale, in contrast, retains solely the local impact and is further independent of other effects, such as the grid cell size.
To illustrate the difference between actual travel distance and local moisture recycling strength, we refer to Fig. 2 from van der Ent and Savenije (2011), shown below. This figure shows the relationship between precipitation recycling strength and distance travelled by the moisture as derived by different authors (Fig. E1). These relationship strongly differs among the different studies, which is to be expected, as each of these studies refers to a different region over which the recycling ratio is defined. However, they all illustrate a certain basic pattern of moisture recycling: the recycling ratio is low at small distances and becomes larger with distance travelled.
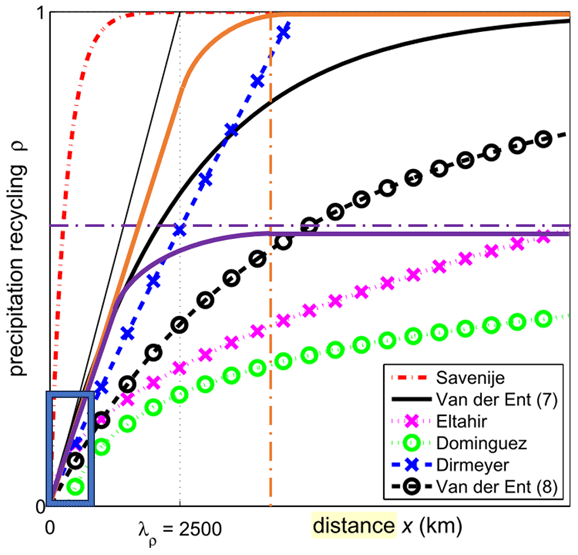
Figure E1The relationship between the precipitation recycling ratios and distance using different formulas as was shown as Fig. 2 in van der Ent et al. (2011). The full orange and purple lines are added here as they illustrate extreme cases where moisture travels over a desert and mountain range, respectively. They have the same local recycling as the full black line, but the distance travelled is very different. The dotted and striped orange line indicates the distance at which the atmospheric flow is blocked by the mountain range and the dotted purple line indicates the moisture recycling ratio while the atmospheric flow travels the desert. Both illustrate very different moisture recycling patterns at a large distance but have the same local recycling (blue box). The length scale then represents the distance if those local conditions would be extrapolated (thin black line), which results in a distance of 2500 km for this case (dotted black line).
Here, we add three additional lines to the original figure of van der Ent and Savenije (2011) to illustrate the influence of the environment on the actual travel distance. These lines illustrate two hypothetical extreme cases where the moisture travels over a hypothetical infinite desert (full purple line) and a hypothetical mountain range (full orange line). For both of these cases the local moisture recycling (i.e. moisture recycling ratio near the source region illustrated by the blue box) is the same as the full black line. However, in the case of the mountain range (full orange line) the atmospheric flow is blocked by the mountain. Consequently, the actual travel distance is low and due to the formation of precipitation the moisture recycling goes towards one (i.e. all water has left the air parcel) which is illustrated in Fig. E1 at the distance of the dotted and striped orange line. For the case of the desert, the water particle reaches the hypothetical infinite desert at which no interaction with the ground occurs, hence the atmospheric flow is not blocked. All moisture is retained in the air parcel, and no additional moisture exchanges are observed. Hence, the moisture recycling ratio remains constant while the actual travel distance will reach near infinite values (dotted and striped purple line in Fig. E1) .
This example clearly illustrates the local nature of the length scale, as this metric is not affected by the different environments across the trajectory that do strongly affect the actual travel distance. The length scale will only be influenced by the local changes (i.e. within the small distance of an ESM grid cell as illustrated by the blue box) and represents the distance moisture would travel if the conditions over this local area would continue along the entire trajectory. This is illustrated by the thin black line, which results in a length scale of 2500 km here (as indicated by the dotted line). This local scope is preferred in this study as it provides the local sensitivity of moisture recycling to local LCLMC without considering any other upstream effects.
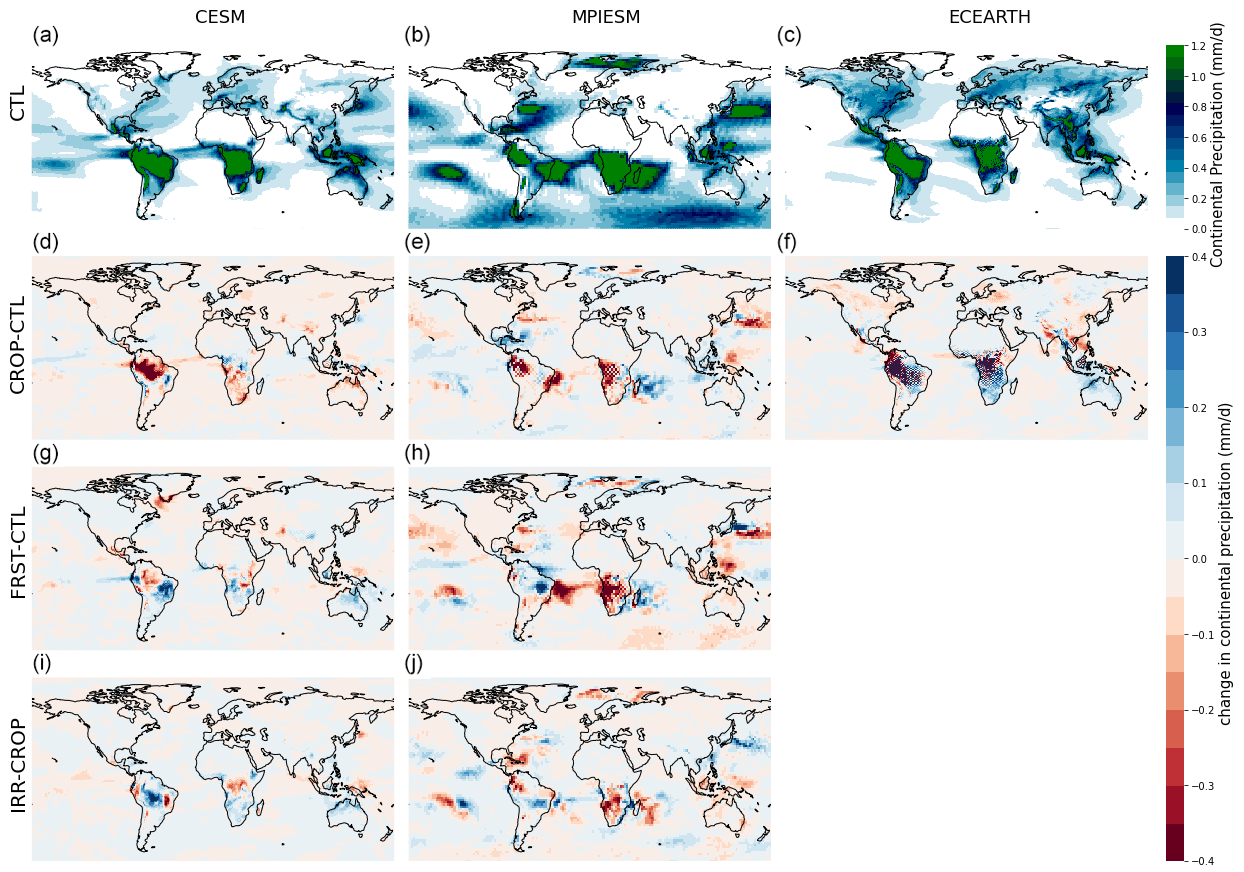
Figure F1The annual mean continental evaporation is shown (in mm d−1) for the CTL simulation in CESM (a), MPI-ESM (b), and EC-EARTH (c). The effect of cropland expansion (CROP-CTL) on the annual mean continental evaporation is shown for CESM (d), MPI-ESM (e), and EC-EARTH (f). The effect of afforestation (FRST-CTL) is shown for CESM (g) and MPI-ESM (h), and finally the effect of irrigation expansion (IRR-CROP) is shown for CESM (i) and MPI-ESM (j).
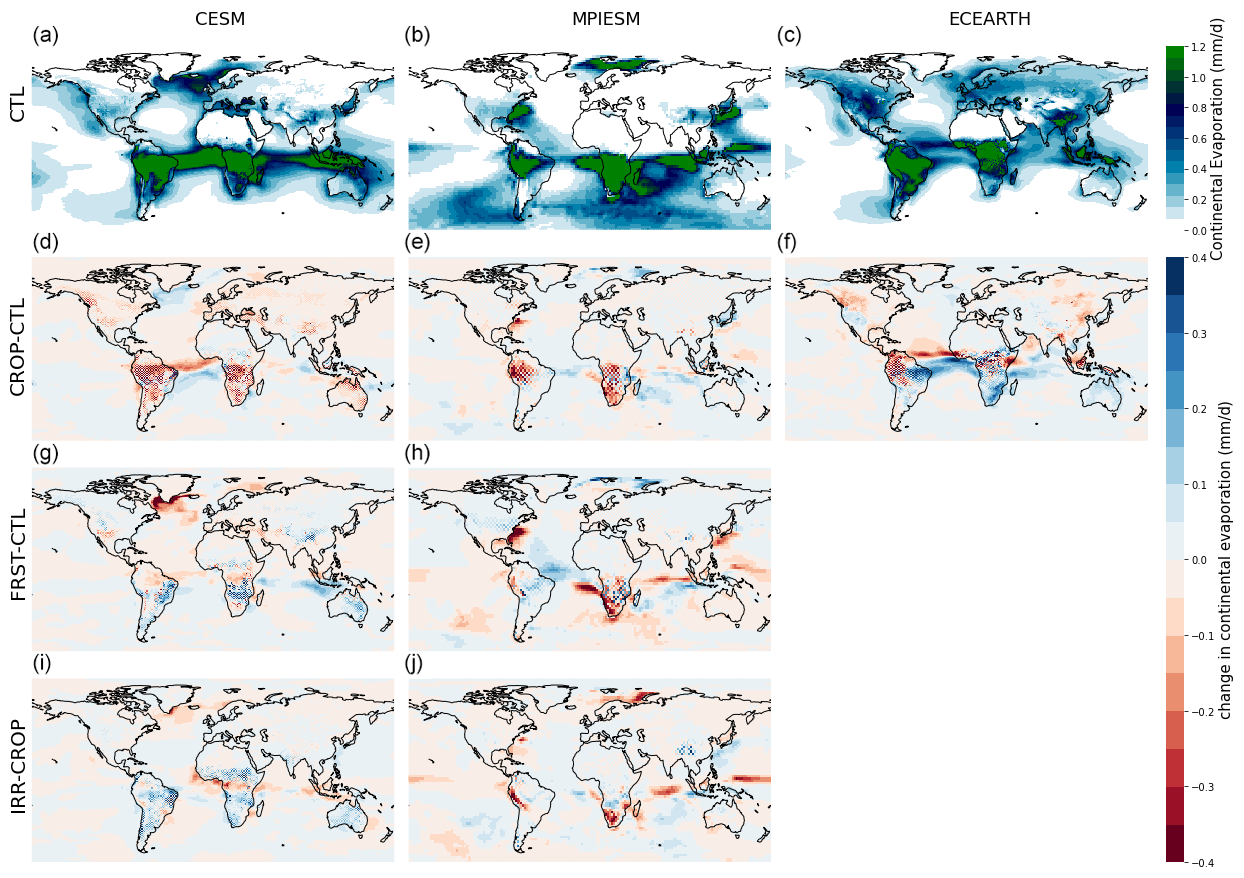
Figure F2The annual mean continental precipitation is shown (in mm d−1) for the CTL simulation in CESM (a), MPI-ESM (b), and EC-EARTH (c). The effect of cropland expansion (CROP-CTL) on the annual mean continental precipitation is shown for CESM (d), MPI-ESM (e), and EC-EARTH (f). The effect of afforestation (FRST-CTL) is shown for CESM (g) and MPI-ESM (h), and finally the effect of irrigation expansion (IRR-CROP) is shown for CESM (i) and MPI-ESM (j).
Table F1Summary of annual total values of P, Pc, ρc, E, Ec, and ϵc for the different simulations and ESMs. The absolute values are given in units of km3 yr−1.
The scripts used for the analysis of the moisture fluxes and the adapted version of WAM-2layers can be found on the GitHub page of the Department of Hydrology and Hydraulic Engineering of VUB (https://github.com/VUB-HYDR/2023, last access: 15 March 2024 and https://doi.org/10.5281/zenodo.10822048, De Hertog, 2024). The simulation data and post-processed data used in this paper are available through DKRZ (https://hdl.handle.net/21.14106/9baff3f5ae3dcc853344217893f475b654e4d559, De Hertog and Thiery, 2023).
WT, SDH, QL, JP, FL, SG, IM, FL, CELF, JK, DM, and RvdE set up the idea for the analysis and helped design the study. SDH and CELF performed the analysis and adapted the WAM-2layers model to ingest the LAMACLIMA simulation data. SDH performed the calculations and wrote the paper. All authors commented on the paper and provided feedback throughout the data analysis.
At least one of the (co-)authors is a member of the editorial board of Earth System Dynamics. The peer-review process was guided by an independent editor, and the authors also have no other competing interests to declare.
Publisher's note: Copernicus Publications remains neutral with regard to jurisdictional claims made in the text, published maps, institutional affiliations, or any other geographical representation in this paper. While Copernicus Publications makes every effort to include appropriate place names, the final responsibility lies with the authors.
This work was funded by the LAMACLIMA (LAnd MAnagement for CLImate Mitigation and Adaptation) project, which is part of AXIS, an ERA-NET initiated by JPI Climate, and funded by DLR/BMBF (DE, grant no. 01LS1905A), NWO (NL, grant no. 438.19.904), RCN (NO, grant no. 300478), and BELSPO (BE, grant no. B2/181/P1) with co-funding by the European Union (grant no. 776608). The computational resources and services used in this work for the simulations and storage of CESM data and postprocessing with the WAM-2layer model were provided by the VSC (Flemish Supercomputer Center), funded by the Research Foundation – Flanders (FWO) and the Flemish Government – department EWI. For the storage of signal-separated results and the simulations of MPI-ESM, this work used resources of the Deutsches Klimarechenzentrum (DKRZ) granted by its Scientific Steering Committee (WLA) under project ID bm1147. Fei Luo acknowledges a VIDI award from the Netherlands Organization for Scientific Research (NWO) (Persistent Summer Extremes “PERSIST”, project no. 016.Vidi.171.011). Jessica Keune is grateful for the support from the Research Foundation–Flanders (FWO) (grant no. 1244122N). All the simulations from EC-EARTH were carried out on European Center for Medium-Range Weather Forecast (ECMWF) platforms.
This work was funded by the LAMACLIMA (LAnd MAnagement for CLImate Mitigation and Adaptation) project, which is part of AXIS, an ERA-NET initiated by JPI Climate and funded by DLR/BMBF (DE, grant no. 01LS1905A), NWO (NL, grant no. 438.19.904), RCN (NO, grant no. 300478), and BELSPO (BE, grant no. B2/181/P1) with co-funding by the European Union (grant no. 776608).
This paper was edited by Anping Chen and reviewed by Arie Staal and one anonymous referee.
Akkermans, T., Thiery, W., and Van Lipzig, N. P.: The regional climate impact of a realistic future deforestation scenario in the Congo Basin, J. Climate, 27, 2714–2734, 2014. a
Banacos, P. and Schultz, D.: The Use of Moisture Flux Convergence in Forecasting Convective Initiation: Historical and Operational Perspectives, Weather Forecast., 20, 351–366, https://doi.org/10.1175/WAF858.1, 2005. a
Baudena, M., Tuinenburg, O. A., Ferdinand, P. A., and Staal, A.: Effects of land-use change in the Amazon on precipitation are likely underestimated, Glob. Change Biol., 27, 5580–5587, 2021. a, b, c
Benedict, I., van Heerwaarden, C., van der Ent, R., Weerts, A., and Hazeleger, W.: Decline in Terrestrial Moisture Sources of the Mississippi River Basin in a Future Climate, J. Hydrometeorol., 21, 299–316, https://doi.org/10.1175/JHM-D-19-0094.1, 2020. a, b, c, d
Bonan, G. B.: Forests and climate change: forcings, feedbacks, and the climate benefits of forests, Science, 320, 1444–1449, 2008. a, b
Bosmans, J., van der Ent, R., Haarsma, R., Drijfhout, S., and Hilgen, F.: Precession-and obliquity-induced changes in moisture sources for enhanced precipitation over the Mediterranean Sea, Paleoceanography and Paleoclimatology, 35, e2019PA003655, https://doi.org/10.1029/2019PA003655, 2020. a
Bowen, I. S.: The ratio of heat losses by conduction and by evaporation from any water surface, Phys. Rev., 27, 779, 1926. a
Boysen, L. R., Brovkin, V., Pongratz, J., Lawrence, D. M., Lawrence, P., Vuichard, N., Peylin, P., Liddicoat, S., Hajima, T., Zhang, Y., Rocher, M., Delire, C., Séférian, R., Arora, V. K., Nieradzik, L., Anthoni, P., Thiery, W., Laguë, M. M., Lawrence, D., and Lo, M.-H.: Global climate response to idealized deforestation in CMIP6 models, Biogeosciences, 17, 5615–5638, https://doi.org/10.5194/bg-17-5615-2020, 2020. a, b, c, d, e
Brubaker, K. L., Entekhabi, D., and Eagleson, P.: Estimation of continental precipitation recycling, J. Climate, 6, 1077–1089, 1993. a
Cook, K.: South American Climate Variability and Change: Remote and Regional Forcing Processes, in: Past Climate Variability in South America and Surrounding Regions, edited by: Vimeux, F., Sylvestre, F., and Khodri, M., Developments in Paleoenvironmental Research, 14, Springer, Dordrecht, https://doi.org/10.1007/978-90-481-2672-9_8, 2009. a
Corless, R. M., Gonnet, G. H., Hare, D. E., Jeffrey, D. J., and Knuth, D. E.: On the LambertW function, Adv. Computat. Math., 5, 329–359, 1996. a
Cui, J., Lian, X., Huntingford, C., Gimeno, L., Wang, T., Ding, J., He, M., Xu, H., Chen, A., Gentine, P., and Piao, S.: Global water availability boosted by vegetation-driven changes in atmospheric moisture transport, Nat. Geosci., 15, 982–988, 2022. a
De Hertog, S.: VUB-HYDR/2023_De-Hertog_etal_ESD, Zenodo [data set], https://doi.org/10.5281/zenodo.10822048, 2024. a
De Hertog, S. and Thiery, W.: Data for “Effects of idealised land cover and land management changes on the atmospheric water cycle” by De Hertog et al. (2023), DOKU at DKRZ [data set], https://hdl.handle.net/21.14106/9baff3f5ae3dcc853344217893f475b654e4d559 (last access: 13 March 2024), 2023. a
De Hertog, S. J., Havermann, F., Vanderkelen, I., Guo, S., Luo, F., Manola, I., Coumou, D., Davin, E. L., Duveiller, G., Lejeune, Q., Pongratz, J., Schleussner, C.-F., Seneviratne, S. I., and Thiery, W.: The biogeophysical effects of idealized land cover and land management changes in Earth System Models, EGUsphere [preprint], https://doi.org/10.5194/egusphere-2023-253, 2023. a, b, c, d, e, f, g, h, i, j, k, l, m, n, o, p
de Vrese, P., Hagemann, S., and Claussen, M.: Asian irrigation, African rain: Remote impacts of irrigation, Geophys. Res. Lett., 43, 3737–3745, https://doi.org/10.1002/2016GL068146, 2016. a, b, c
Deser, C., Knutti, R., Solomon, S., and Phillips, A. S.: Communication of the role of natural variability in future North American climate, Nat. Clim. Change, 2, 775–779, 2012. a
Deser, C., Lehner, F., Rodgers, K. B., Ault, T., Delworth, T. L., DiNezio, P. N., Fiore, A., Frankignoul, C., Fyfe, J. C., Horton, D. E., and Kay, J. E.: Insights from Earth system model initial-condition large ensembles and future prospects, Nat. Clim. Change, 10, 277–286, 2020. a
Devaraju, N., de Noblet-Ducoudré, N., Quesada, B., and Bala, G.: Quantifying the relative importance of direct and indirect biophysical effects of deforestation on surface temperature and teleconnections, J. Climate, 31, 3811–3829, https://doi.org/10.1175/JCLI-D-17-0563.1, 2018. a, b, c
Dominguez, F., Kumar, P., Liang, X.-Z., and Ting, M.: Impact of atmospheric moisture storage on precipitation recycling, J. Climate, 19, 1513–1530, 2006. a
Findell, K. L., Keys, P. W., van der Ent, R. J., Lintner, B. R., Berg, A., and Krasting, J. P.: Rising temperatures increase importance of oceanic evaporation as a source for continental precipitation, J. Climate, 32, 7713–7726, 2019. a, b
Gimeno, L., Stohl, A., Trigo, R. M., Dominguez, F., Yoshimura, K., Yu, L., Drumond, A., Durán-Quesada, A. M., and Nieto, R.: Oceanic and terrestrial sources of continental precipitation, Rev. Geophys., 50, https://doi.org/10.1029/2012RG000389, 2012. a
Gimeno, L., Vázquez, M., Eiras-Barca, J., Sorí, R., Stojanovic, M., Algarra, I., Nieto, R., Ramos, A. M., Durán-Quesada, A. M., and Dominguez, F.: Recent progress on the sources of continental precipitation as revealed by moisture transport analysis, Earth-Sci. Rev., 201, 103070, https://doi.org/10.1016/j.earscirev.2019.103070, 2020. a
Goessling, H. F. and Reick, C. H.: What do moisture recycling estimates tell us? Exploring the extreme case of non-evaporating continents, Hydrol. Earth Syst. Sci., 15, 3217–3235, https://doi.org/10.5194/hess-15-3217-2011, 2011. a
Guimberteau, M., Laval, K., Perrier, A., and Polcher, J.: Global effect of irrigation and its impact on the onset of the Indian summer monsoon, Clim. Dynam., 39, 1329–1348, 2012. a
Guo, L., van der Ent, R. J., Klingaman, N. P., Demory, M.-E., Vidale, P. L., Turner, A. G., Stephan, C. C., and Chevuturi, A.: Effects of horizontal resolution and air–sea coupling on simulated moisture source for East Asian precipitation in MetUM GA6/GC2, Geosci. Model Dev., 13, 6011–6028, https://doi.org/10.5194/gmd-13-6011-2020, 2020. a
Hauser, M., Thiery, W., and Seneviratne, S. I.: Potential of global land water recycling to mitigate local temperature extremes, Earth Syst. Dynam., 10, 157–169, https://doi.org/10.5194/esd-10-157-2019, 2019. a
Hoek van Dijke, A. J., Herold, M., Mallick, K., Benedict, I., Machwitz, M., Schlerf, M., Pranindita, A., Theeuwen, J. J., Bastin, J.-F., and Teuling, A. J.: Shifts in regional water availability due to global tree restoration, Nat. Geosci., 15, 363–368, 2022. a, b, c
Laguë, M. M., Bonan, G. B., and Swann, A. L.: Separating the impact of individual land surface properties on the terrestrial surface energy budget in both the coupled and uncoupled land–atmosphere system, J. Climate, 32, 5725–5744, https://doi.org/10.1175/JCLI-D-18-0812.1, 2019. a, b
Lawrence, D. M., Hurtt, G. C., Arneth, A., Brovkin, V., Calvin, K. V., Jones, A. D., Jones, C. D., Lawrence, P. J., de Noblet-Ducoudré, N., Pongratz, J., Seneviratne, S. I., and Shevliakova, E.: The Land Use Model Intercomparison Project (LUMIP) contribution to CMIP6: rationale and experimental design, Geosci. Model Dev., 9, 2973–2998, https://doi.org/10.5194/gmd-9-2973-2016, 2016. a
Li, Z., Liu, T., Huang, Y., Peng, J., and Ling, Y.: Evaluation of the CMIP6 precipitation simulations over global land, Earths Future, 10, e2021EF002500, https://doi.org/10.1029/2021EF002500, 2022. a
Lombardozzi, D. L., Lu, Y., Lawrence, P. J., Lawrence, D. M., Swenson, S., Oleson, K. W., Wieder, W. R., and Ainsworth, E. A.: Simulating agriculture in the Community Land Model version 5, J. Geophys. Res.-Biogeo., 125, e2019JG005529, https://doi.org/10.1029/2019JG005529, 2020. a
Luyssaert, S., Jammet, M., Stoy, P. C., Estel, S., Pongratz, J., Ceschia, E., Churkina, G., Don, A., Erb, K., Ferlicoq, M., and Gielen, B.: Land management and land-cover change have impacts of similar magnitude on surface temperature, Nat. Clim. Change, 4, 389–393, 2014. a
Mahmood, R., Pielke Sr, R. A., Hubbard, K. G., Niyogi, D., Dirmeyer, P. A., McAlpine, C., Carleton, A. M., Hale, R., Gameda, S., Beltrán-Przekurat, A., and Baker, B.: Land cover changes and their biogeophysical effects on climate, Int. J. Climatol., 34, 929–953, 2014. a
Mbow, H.-O. P., Reisinger, A., Canadell, J., and O'Brien, P.: Special Report on climate change, desertification, land degradation, sustainable land management, food security, and greenhouse gas fluxes in terrestrial ecosystems (SR2), IPCC, Ginevra, 2017. a
Pongratz, J., Reick, C., Raddatz, T., and Claussen, M.: Biogeophysical versus biogeochemical climate response to historical anthropogenic land cover change, Geophys. Res. Lett., 37, https://doi.org/10.1029/2010GL043010, 2010. a
Pongratz, J., Schwingshackl, C., Bultan, S., Obermeier, W., Havermann, F., and Guo, S.: Land use effects on climate: current state, recent progress, and emerging topics, Current Climate Change Reports, 7, 99–120, https://doi.org/10.1007/s40641-021-00178-y, 2021. a
Portmann, R., Beyerle, U., Davin, E., Fischer, E. M., De Hertog, S., and Schemm, S.: Global forestation and deforestation affect remote climate via adjusted atmosphere and ocean circulation, Nat. Commun., 13, 1–11, 2022. a, b, c, d, e, f
Puma, M. and Cook, B.: Effects of irrigation on global climate during the 20th century, J. Geophys. Res.-Atmos., 115, https://doi.org/10.1029/2010JD014122, 2010. a
Rogelj, J., Shindell, D., Jiang, K., Fifita, S., Forster, P., Ginzburg, V., Handa, C., Kheshgi, H., Kobayashi, S., Kriegler, E., Mundaca, L., Séférian, R., Vilarino, M. V., Calvin, K., de Oliveira de Portugal Pereira, J. C., Edelenbosch, O., Emmerling, J., Fuss, S., Gasser, T., Gillett, N., He, C., Hertwich, E., Höglund-Isaksson, L., Huppmann, D., Luderer, G., Markandya, A., Meinshausen, M., McCollum, D., Millar, R., Popp, A., Purohit, P., Riahi, K., Ribes, A., Saunders, H., Schädel, C., Smith, C., Smith, P., Trutnevyte, E., Xu, Y., Zhou, W., and Zickfeld, K.: Mitigation Pathways Compatible with 1.5°C in the Context of Sustainable Development, in: Global warming of 1.5°C, (IPCC Special Report), edited by: Masson-Delmotte, V., Zhai, P., Pörtner, H. O., Roberts, D., Skea, J., Shukla, P. R., Pirani, A., Moufouma-Okia, W., Péan, C., Pidcock, R., Connors, S., Matthews, J. B. R., Chen, Y., Zhou, X., Zhou, M. I., Lonnoy, E., Maycock, T., Tignor, M., and Waterfield, T., Geneva, Intergovernmental Panel on Climate Change, 93–174, 2018. a
Seneviratne, S. I., Wartenburger, R., Guillod, B. P., Hirsch, A. L., Vogel, M. M., Brovkin, V., van Vuuren, D. P., Schaller, N., Boysen, L., Calvin, K. V., and Doelman, J.: Climate extremes, land–climate feedbacks and land-use forcing at 1.5 °C, Philos. T. R. Soc. A, 376, 20160450, https://doi.org/10.1098/rsta.2016.0450, 2018. a
Shukla, J. and Mintz, Y.: Influence of land-surface evapotranspiration on the Earth's climate, Science, 215, 1498–1501, 1982. a
Smith, C. and Spracklen, D. V.: reductions in rainfall due to tropical deforestation, Nature, 615, 270–275, https://doi.org/10.1038/s41586-022-05690-1, 2023. a
Spracklen, D., Baker, J., Garcia-Carreras, L., and Marsham, J.: The effects of tropical vegetation on rainfall, Annu. Rev. Env. Resour., 43, 193–218, https://doi.org/10.1146/annurev-environ-102017-030136, 2018. a, b
Spracklen, D. V., Arnold, S. R., and Taylor, C.: Observations of increased tropical rainfall preceded by air passage over forests, Nature, 489, 282–285, 2012. a
Staal, A., Tuinenburg, O. A., Bosmans, J. H., Holmgren, M., van Nes, E. H., Scheffer, M., Zemp, D. C., and Dekker, S. C.: Forest-rainfall cascades buffer against drought across the Amazon, Nat. Clim. Change, 8, 539–543, 2018. a, b, c
te Wierik, S. A., Cammeraat, E. L., Gupta, J., and Artzy-Randrup, Y. A.: Reviewing the impact of land use and land-use change on moisture recycling and precipitation patterns, Water Resour. Res., 57, e2020WR029234, https://doi.org/10.1029/2020WR029234, 2021. a
Theeuwen, J. J. E., Staal, A., Tuinenburg, O. A., Hamelers, B. V. M., and Dekker, S. C.: Local moisture recycling across the globe, Hydrol. Earth Syst. Sci., 27, 1457–1476, https://doi.org/10.5194/hess-27-1457-2023, 2023. a, b, c, d
Thiery, W., Davin, E. L., Seneviratne, S. I., Bedka, K., Lhermitte, S., and van Lipzig, N. P.: Hazardous thunderstorm intensification over Lake Victoria, Nat. Commun., 7, 1–7, 2016. a, b
Thiery, W., Davin, E. L., Lawrence, D. M., Hirsch, A. L., Hauser, M., and Seneviratne, S. I.: Present-day irrigation mitigates heat extremes, J. Geophys. Res., 122, 1403–1422, https://doi.org/10.1002/2016JD025740, 2017. a, b, c
Thiery, W., Visser, A. J., Fischer, E. M., Hauser, M., Hirsch, A. L., Lawrence, D. M., Lejeune, Q., Davin, E. L., and Seneviratne, S. I.: Warming of hot extremes alleviated by expanding irrigation, Nat. Commun., 11, 1–7, 2020. a, b
Tuinenburg, O., Hutjes, R., Stacke, T., Wiltshire, A., and Lucas-Picher, P.: Effects of irrigation in India on the atmospheric water budget, J. Hydrometeorol., 15, 1028–1050, 2014. a
Tuinenburg, O. A., Theeuwen, J. J. E., and Staal, A.: High-resolution global atmospheric moisture connections from evaporation to precipitation, Earth Syst. Sci. Data, 12, 3177–3188, https://doi.org/10.5194/essd-12-3177-2020, 2020. a, b, c
Van de Walle, J., Thiery, W., Brousse, O., Souverijns, N., Demuzere, M., and Lipzig, N.: A convection-permitting model for the Lake Victoria Basin: evaluation and insight into the mesoscale versus synoptic atmospheric dynamics, Clim. Dynam., 54, 1779–1799, https://doi.org/10.1007/s00382-019-05088-2, 2020. a, b
van der Ent, R. J. and Savenije, H. H. G.: Length and time scales of atmospheric moisture recycling, Atmos. Chem. Phys., 11, 1853–1863, https://doi.org/10.5194/acp-11-1853-2011, 2011. a, b, c, d, e, f, g, h, i, j, k, l, m
van der Ent, R. J., Wang-Erlandsson, L., Keys, P. W., and Savenije, H. H. G.: Contrasting roles of interception and transpiration in the hydrological cycle – Part 2: Moisture recycling, Earth Syst. Dynam., 5, 471–489, https://doi.org/10.5194/esd-5-471-2014, 2014. a, b, c, d, e
van der Ent, R. J., Savenije, H. H., Schaefli, B., and Steele-Dunne, S. C.: Origin and fate of atmospheric moisture over continents, Water Resour. Res., 46, 1–12, https://doi.org/10.1029/2010WR009127, 2010. a, b, c, d, e, f
Wang, J., Chagnon, F., Williams, E., Betts, A., Rennó, N., Machado, L., Bisht, G., Knox, R., and Bras, R.: Impact of deforestation in the Amazon Basin on cloud climatology, P. Natl. Acad. Sci. USA, 106, 3670–4, https://doi.org/10.1073/pnas.0810156106, 2009. a
Wang-Erlandsson, L., Fetzer, I., Keys, P. W., van der Ent, R. J., Savenije, H. H. G., and Gordon, L. J.: Remote land use impacts on river flows through atmospheric teleconnections, Hydrol. Earth Syst. Sci., 22, 4311–4328, https://doi.org/10.5194/hess-22-4311-2018, 2018. a
Winckler, J., Reick, C. H., and Pongratz, J.: Robust identification of local biogeophysical effects of land-cover change in a global climate model, J. Climate, 30, 1159–1176, 2017a. a, b, c, d, e, f, g, h, i, j
Winckler, J., Reick, C. H., and Pongratz, J.: Why does the locally induced temperature response to land cover change differ across scenarios?, Geophys. Res. Lett., 44, 3833–3840, 2017b. a
Winckler, J., Lejeune, Q., Reick, C. H., and Pongratz, J.: Nonlocal effects dominate the global mean surface temperature response to the biogeophysical effects of deforestation, Geophys. Res. Lett., 46, 745–755, 2019. a
Wunderling, N., Staal, A., Sakschewski, B., Hirota, M., Tuinenburg, O. A., Donges, J. F., Barbosa, H. M., and Winkelmann, R.: Recurrent droughts increase risk of cascading tipping events by outpacing adaptive capacities in the Amazon rainforest, P. Natl. Acad. Sci. USA, 119, e2120777119, 2022. a, b, c
- Abstract
- Introduction
- Methods
- Results
- Discussion
- Conclusions
- Appendix A: Summary of chequerboard approach for signal separation
- Appendix B: Signal-separated plots of evaporation and precipitation
- Appendix C: Seasonal effects on evaporation and precipitation
- Appendix D: Moisture flux convergence and P−E
- Appendix E: Difference between length scale and actual travel distance
- Appendix F: Moisture fluxes of continental origin
- Code and data availability
- Author contributions
- Competing interests
- Disclaimer
- Acknowledgements
- Financial support
- Review statement
- References