the Creative Commons Attribution 4.0 License.
the Creative Commons Attribution 4.0 License.
 | 19 Feb 2024
Atmospheric teleconnections between the Arctic and the Baltic Sea region as simulated by CESM1-LE
Erko Jakobson
Liisi Jakobson
This paper examines teleconnections between the Arctic and the Baltic Sea region and is based on two cases of Community Earth System Model version 1 large ensemble (CESM-LE) climate model simulations: the stationary case with pre-industrial radiative forcing and the climate change case with RCP8.5 radiative forcing.
The stationary control simulation's 1800-year long time series were used for stationary teleconnection and a 40-member ensemble from the period 1920–2100 is used for teleconnections during ongoing climate change. We analyzed seasonal temperature at a 2 m level, sea-level pressure, sea ice concentration, precipitation, geopotential height, and 10 m level wind speed. The Arctic was divided into seven areas.
The Baltic Sea region climate has strong teleconnections with the Arctic climate; the strongest connections are with Svalbard and Greenland region. There is high seasonality in the teleconnections, with the strongest correlations in winter and the lowest correlations in summer, when the local meteorological factors are stronger. North Atlantic Oscillation (NAO) and Arctic Oscillation (AO) climate indices can explain most teleconnections in winter and spring. During ongoing climate change, the teleconnection patterns did not show remarkable changes by the end of the 21st century. Minor pattern changes are between the Baltic Sea region temperature and the sea ice concentration.
We calculated the correlation between the parameter and its ridge regression estimation to estimate different Arctic regions' collective statistical connections with the Baltic Sea region. The seasonal coefficient of determination, R2, was highest for winter: for T2 m, R2=0.64; for sea level pressure (SLP), R2=0.44; and for precipitation (PREC), R2=0.35. When doing the same for the seasons' previous month values in the Arctic, the relations are considerably weaker, with the highest R2=0.09 being for temperature in the spring. Hence, Arctic climate data forecasting capacity for the Baltic Sea region is weak.
Although there are statistically significant teleconnections between the Arctic and Baltic Sea region, the Arctic impacts are regional and mostly connected with climate indexes. There are no simple cause-and-effect pathways. By the end of the 21st century, the Arctic ice concentration has significantly decreased. Still, the general teleconnection patterns between the Arctic and the Baltic Sea region will not change considerably by the end of the 21st century.
- Article
(2291 KB) - Full-text XML
- BibTeX
- EndNote


The Arctic region is warming at least twice (IPCC, 2021; Nakamura and Sato, 2022; Overland et al., 2018; Meleshko et al., 2020), and according to some authors nearly four times (Rantanen et al., 2022), as fast as the whole planet. In addition, the Baltic Sea region is warming faster than the global average (BACC II, 2015). The question of the faster warming in the Arctic region affecting midlatitudes has been under debate for a long time. We want to address the Baltic Sea region and find out if it is affected by the changing Arctic and if this information can be used in long-term weather forecasts.
The faster warming in the Arctic compared to the global mean, a phenomenon known as Arctic amplification (AA), is a result of interacting processes: sea ice loss (Simmonds and Li, 2021) and surface albedo feedback (Laîné et al., 2016; Yoshimori et al., 2014; Serreze et al., 2009; Screen and Simmonds, 2010), changes in longwave (Lee et al., 2017) and temperature feedbacks (Dai and Jenkins, 2023; Jenkins and Dai, 2021; Duan et al., 2019; Pithan and Mauritzen, 2014; Lu and Cai, 2009), cloud changes (Taylor et al., 2022, 2015, 2013; Boeke and Taylor, 2018; Francis and Hunter, 2006; Vavrus, 2004), intraseasonal cycling of heat (Clark et al., 2021; Bintanja and Krikken, 2016; Bintanja and Linden, 2013), and poleward energy transport (Sang et al., 2022; Spielhagen et al., 2011). However, the relative weight of these different factors is still under debate (Taylor et al., 2022; Dai et al., 2019).
The assessment of the potential for AA to influence broader hemispheric weather (referred to as teleconnections) is complex and controversial (Dai and Song, 2020; Francis and Vavrus, 2015; Barnes and Screen, 2015; Sun et al., 2016) and many details of teleconnection mechanisms remain elusive (Sun et al., 2018).
For a long time, it has been recognized that ice conditions in the Greenland region might be connected to several variables in Europe (Hildebrandsson, 1914; Wiese, 1924; Schell, 1956; etc.). Zhuo et al. (2023) found that the Greenland region is the most influential of all Arctic regions on teleconnections to the Baltic region. Deng et al. (2018) showed that the Greenland region was the most important of Arctic regions considering heat waves in eastern Europe.
AA is expected to be related to further changes that affect midlatitudes and the rest of the world (Jung et al., 2015; Vihma et al., 2019). According to Overland et al. (2015), potential Arctic teleconnections with Europe are less clear than with North America and Asia. The teleconnections between the Arctic and midlatitudes depend strongly on the season and geographical region (Zhuo et al., 2023; Coumou et al., 2018; Jakobson et al., 2017). Furthermore, it has been recognized that extratropical impacts depend highly on the regional structure of the anomalous Arctic climate state (Kug et al., 2015). It appears that Arctic impacts will be regional and intermittent, clouding the identification of cause and effect and raising the issue of how to effectively communicate potential Arctic impacts (Overland et al., 2021; Rudeva and Simmonds, 2021; Luo et al., 2019; Cohen et al., 2018).
The Baltic Sea region is very sensitive to climate change; it is a region with spatially varying climate and diverse ecosystems (Christensen et al., 2022). Climate change may bring profound ecological changes in the region (Halkka, 2022). During the last half-century, the duration of seasonal snow cover and snow depth have decreased (Viru and Jaagus, 2020); during the last few decades, there has been a major increase in both extreme mild ice winters and severe ice winters and a minor increase in intense precipitation, heat waves, and cold spells (Rutgersson et al., 2022). Because of the closeness to the Arctic, the Baltic Sea region receives influences from the Arctic either remotely (teleconnections) or directly. The weather in the region depends highly on the position of the polar front: it can be located northward or southward of the area (Jakobson et al., 2017).
Furthermore, some direct impacts are influenced by remote processes in the Arctic. For example, the Barents and Kara seas warming associated with the sea ice loss possibly affects the Ural blocking (Peings et al., 2023; Yao et al., 2017; Luo et al., 2017), which has been identified as a precursor of sudden stratospheric warming (Statnaia et al., 2020; Lee et al., 2019; Martius et al., 2009) and extreme temperature and precipitation anomalies over Europe (Yang et al., 2022; Peings, 2019; Cattiaux et al., 2010).
Widely used climate model simulations, such as those from the Coupled Model Intercomparison Project (CMIP6), combine internal and inter-model variability caused by differing physics, dynamical cores, and resolutions, making it almost impossible to assess the portion of uncertainty caused by internal variability alone (Kay et al., 2015). To enable quantification of internal variability in the midst of transient climate change, large ensembles with individual models have been performed. Comparison across ensemble members simulated with the same model and external forcing provides a measure of simulated internal variability. Here, we use the Community Earth System Model version 1 large ensemble (CESM-LE; Kay et al., 2015) to diagnose connections between the Arctic and Baltic regions. In the last few years, CESM-LE has aimed to better understand internal variability (Rondeau-Genesse and Braun, 2019). The CESM-LE has been used in multiple studies of Arctic sea ice cover, performing well overall (Smith and Jahn, 2019; Labe et al., 2018; Jahn, 2018; Massonnet et al., 2018; Barnhart et al., 2016; Jahn et al., 2016; Swart et al., 2015). The CESM-LE also produces credible North Atlantic Oscillation (NAO) interannual aspects, given the length of the observational record available for assessment (93 years) (Deser et al., 2017).
Our previous research studied Arctic–Baltic teleconnections and physical mechanisms behind Arctic–Baltic teleconnections (Jakobson et al., 2017) using ERA-Interim and NCEP-CFSR reanalyses. In this paper, we used the CESM-LE model time series to verify previous results, examine climate change's influence on teleconnections, and study different Arctic regions' collective forecasting capabilities. CESM-LE differs from reanalyses in that it uses a much longer time series and as it is not constrained by observations, allowing for projections. The purpose of the study is to understand which Arctic factors influence the Baltic Sea, how strong these connections are, how AA is affecting these relationships, and if the knowledge can be used in long-term weather forecasting for following months in the Baltic Sea region.
The paper is organized as follows. Section 2 describes the used datasets and methodology. Section 3 explains the results of the spatial correlations of climatic variables (stationary, 20-year periods up to the year 2100 and lagged correlations), whereas Sect. 4 provides a discussion of the results and conclusions.
We used the CESM Large Ensemble Project (CESM-LE) set of climate model simulations on a horizontal grid (Kay et al., 2015). The CESM1 is a fully coupled model described by Hurrell et al. (2013). A control simulation under pre-industrial (1850) radiative forcing conditions was run for 1800 years. A single ensemble member was branched from this control and ran from 1850 to 1920 with transient forcing. A 40-member ensemble was then performed for the period 1920–2100. All 40 CESM-LE ensemble members use the same model and the same external forcing. Each ensemble member has a unique climate trajectory because of small round-off level differences in their initial atmospheric conditions. Simply put, the CESM-LE ensemble spread results from internally generated climate variability alone (Kay et al., 2015). Each member is subject to the same radiative forcing scenario (historical up to 2005 and RCP8.5 thereafter).
We used Pearson's correlation coefficient to measure the dependence between two variables. To measure the strength of a relationship between two variables without the possible controlling effect of a third variable, we used partial correlation:
where R(A,B) is the regular Pearson correlation. The partial correlation difference from Pearson correlation reveals the controlling factor Z effect on input variables X and Y.
The following parameters were analyzed: the temperature at 2 m level (T2 m), sea level pressure (SLP), sea ice concentration (SIC), precipitation (PREC) as the sum of large-scale and convective precipitation, geopotential height at 500 hPa (Z500), and wind speed at 10 m level (U10). The following large-scale indices of the atmospheric circulation, North Atlantic Oscillation (NAO), Arctic Oscillation (AO), and Barents Oscillation (BO), were calculated from the model data using eofs.xarray module in Python. NAO is defined as EOF–1 of seasonal SLP anomalies for 20–80∘ N; 80∘ W–40∘ E, BO as EOF–2 of seasonal SLP anomalies for 30–90∘ N, 90∘ W–90∘ E; and AO as EOF–1 of seasonal geopotential anomalies for 20–90∘ N.
Correlations with and without the effect of the large-scale indices of the atmospheric circulation were analyzed. For that purpose, partial correlations between atmospheric variables with the controlling impact of the teleconnection index were calculated.
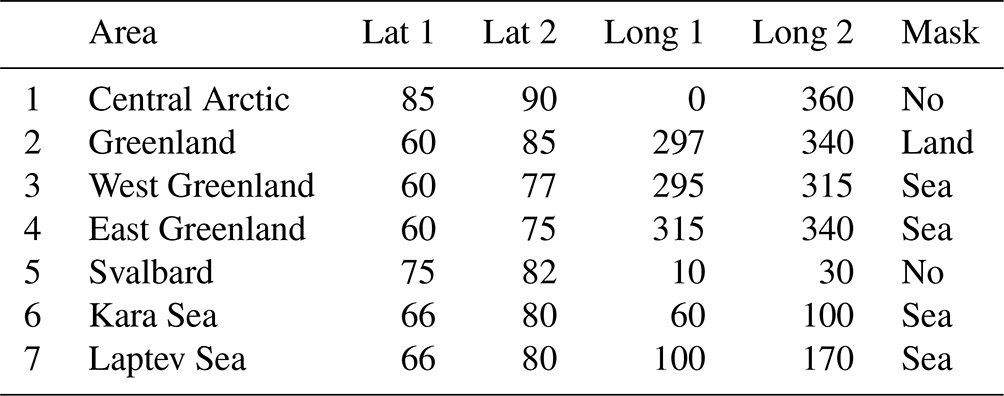
For the testing area (TA), we chose a region around the Baltic Sea (50–65∘ N, 10–40∘ E). For the Arctic, we looked at the area north of 60∘ N. We chose seven important areas (IA) in the Arctic, where the correlations with TA were stronger, to analyze the relationships between regions in the Arctic and TA (Fig. 1, Table 1). Initially, we also looked at the Chukchi Sea and Canada Basin regions, but the correlations between climate parameters between TA and these regions were clearly weaker.
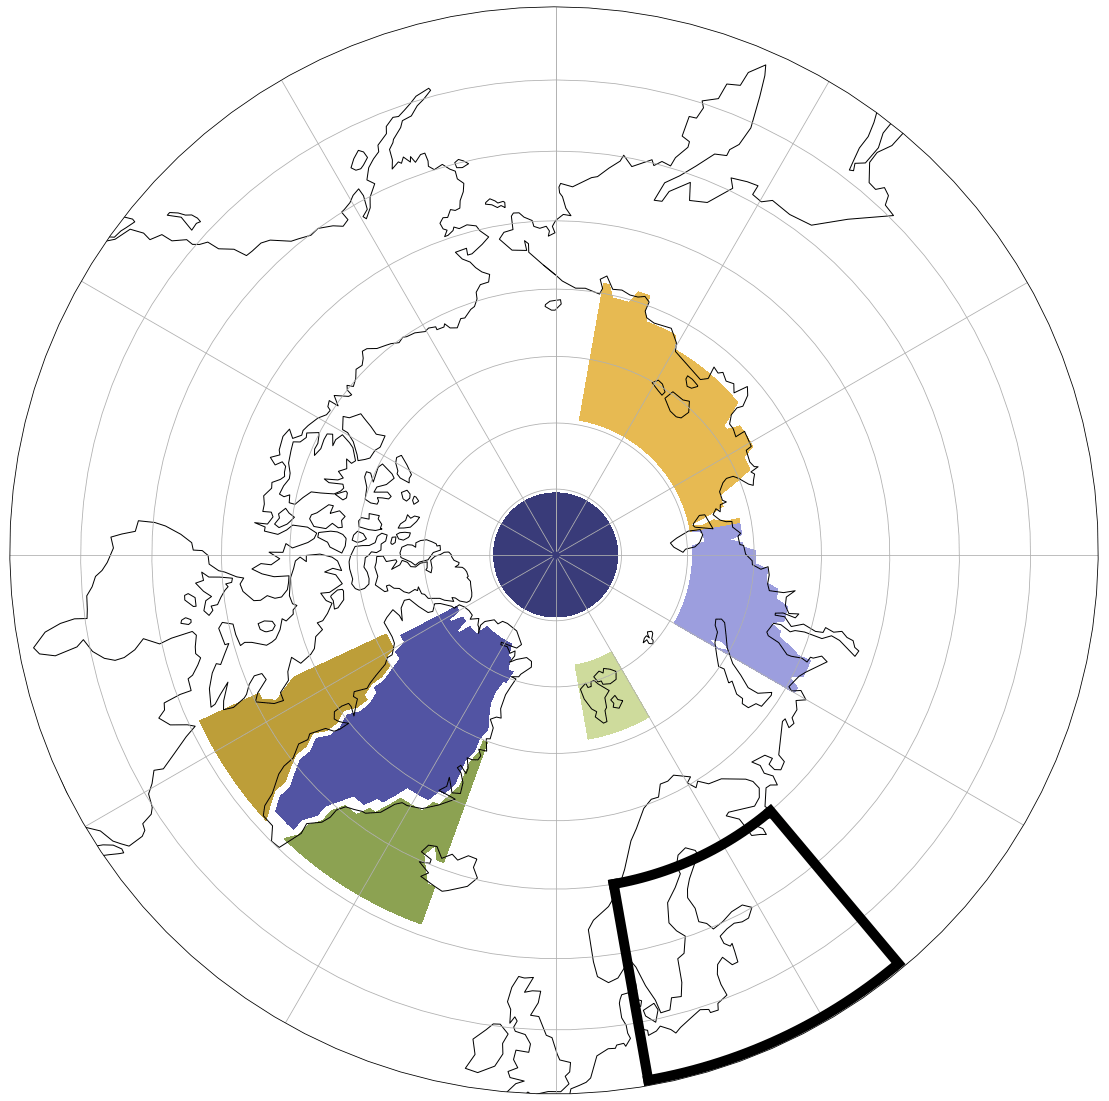
Figure 1Important areas (IA, colored areas) in the Arctic and test area (TA, black rectangle).
We assessed the control simulation to reveal statistically significant seasonal correlations between TA and the Arctic region. For 1800-year-long control simulation time series, all correlations stronger than ±0.046 are statistically significant at the confidence level of 95 %. To analyze the strength and shape changes in teleconnections during climate change, we looked at 20-year periods of the ensemble simulation from 1980 to 2100. For every ensemble simulation, using 20-year-long periods with 40 ensemble members (in a total of 800 events), all correlations stronger than ±0.069 are statistically significant at the confidence level of 95 %. In order to make the connections clearer, we do not show weaker correlations than ±0.1, though they were still statistically significant. For control simulations, this gives a confidence level of 99.998 %, while for ensemble simulations of 20-year-long series, the confidence level is 99.5 %. Still, the relationship shown by the correlations may not be causal; there can be indirect connections, and we cannot rule out model-internal feedback-generated correlations.
For understanding correlation maps, the first correlation parameter always marks the TA areal average, and the second one is from the Arctic. We also calculated correlations between TA and IA areal seasonal averages. We computed correlations with IA's previous month's averages to investigate the Arctic region's capability to forecast TA seasonal averages.
Ridge regression (Saleh et al., 2019) is a multiple-regression method developed for cases with a strong correlation between input parameters. We used the ridge regression method to estimate the IA collective forecasting capability using the module sklearn.linear_model in Python with complexity parameter alpha of 1.0.
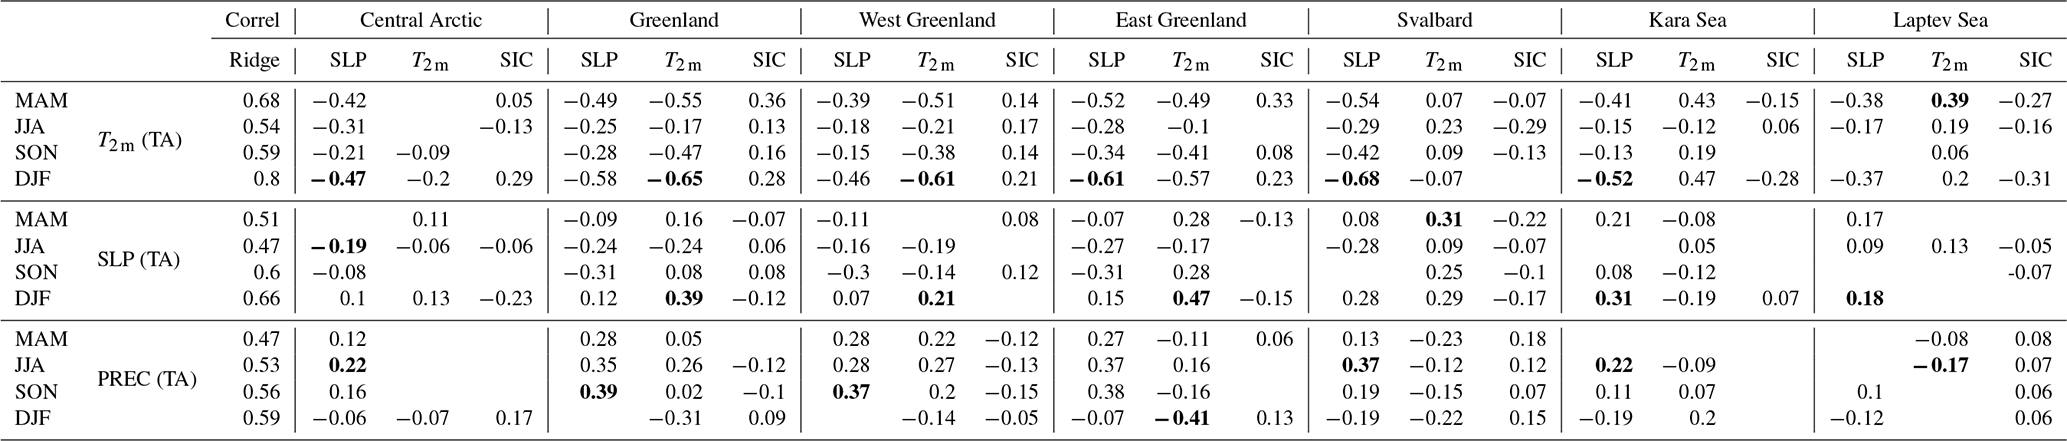
Table 2Seasonal correlations of 1800-year-long control run data between areal averages of testing area (TA, rows) and important area (IA, columns) parameters. The first column is the correlation between the parameter in TA and its estimation using ridge regression over all parameters in IA data. All shown correlations are statistically significant at the 95 % confidence level. For each TA parameter in each IA dataset, the strongest correlation is highlighted in bold.
3.1 Stationary spatial correlations of climatic variables
The climatic variables of separate areas are usually dependent, but the strength of the correlation depends on the distance and concrete variables. In addition to natural spatial correlations between climatic variables within short distances, correlations also emerge within longer distances. To reveal stationary connections between remote regions, we used the CESM-LE 1800-year-long stationary control run. This model run is very stable without significant trends, as the radiative forcing conditions were constantly at the year 1850 level during the whole period.
We found significant correlations between several variables between the Baltic Sea testing area (TA; shown with the rectangle in Figs. 1–4) and different Arctic areas. The most robust results were found for T2 m: the negative correlation between TA and the Greenland area is in winter and only slightly weaker in spring and autumn (Fig. 2, row 1).
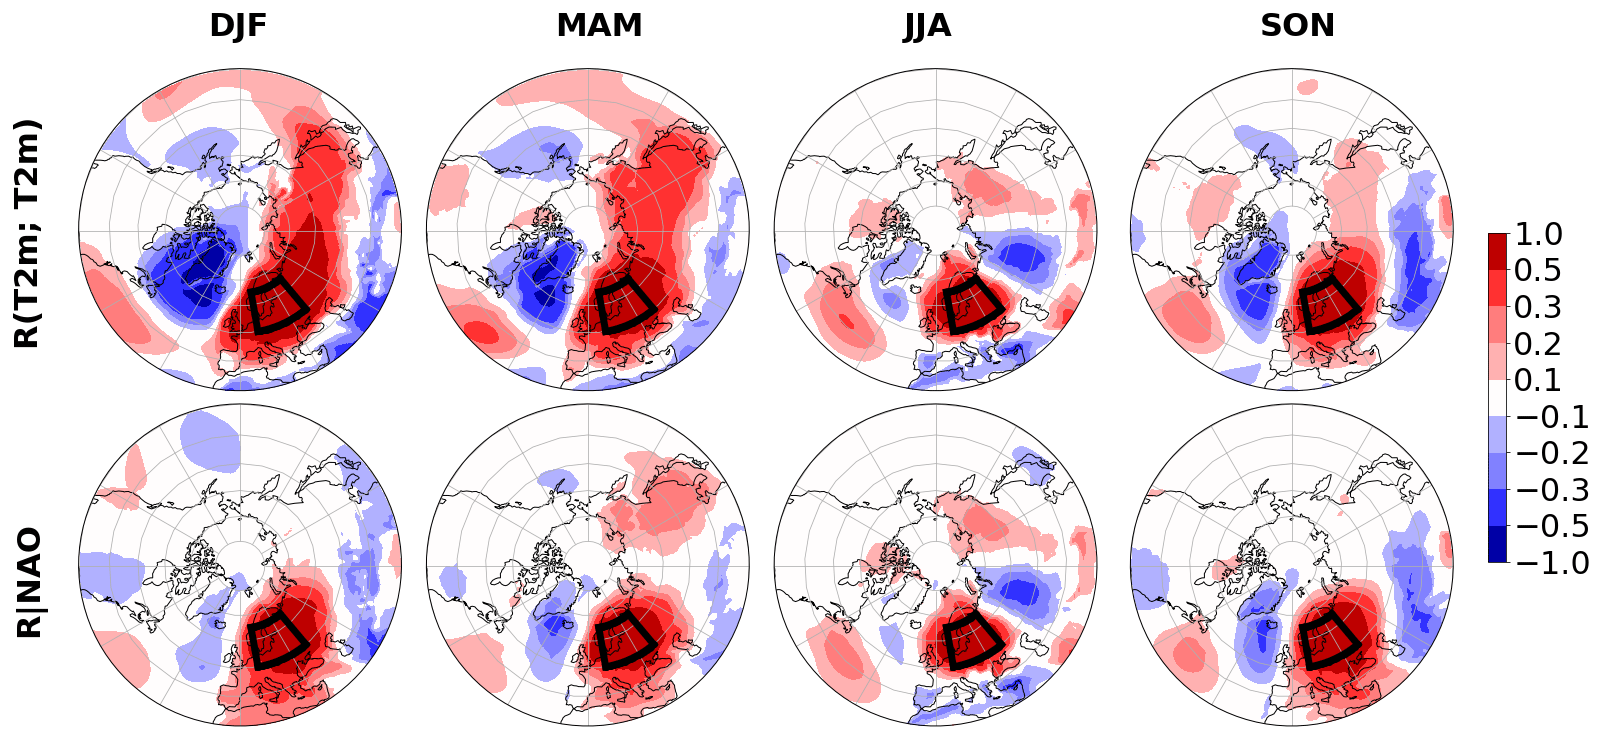
Figure 2The 2 m temperature (T2 m) seasonal correlations between the testing area (black rectangle) and surrounding areas according to the CESM-LE 1800-year control run. The second row shows the partial correlation with the controlling factor NAO.
The summer is more influenced by local circulations, and remote correlations are weak. Most of these correlations are related to the NAO index – the same partial correlation with the controlling factor NAO has values in the Greenland area in winter weaker than −0.2 (Fig. 2, row 2) and in spring and autumn mostly weaker than −0.3. Teleconnections with TA that are not controlled by the NAO index are strongest at the Atlantic Ocean east to Iceland, but the correlation strength exceeds 0.3 only in spring and autumn. The AO index effect is similar to the NAO index, with a slightly weaker impact in the Iceland region but stronger in Siberia (not shown). The BO index effect was clearly lower than that of NAO and AO (not shown). The volume of physics-based analysis of these correlations does not fit in this paper, some methods and ideas can be found in Luo et al. (2016). TA parameter correlations with Z500 or U10 were weaker than with T2 m, SIC, and PREC and were not included in the following analysis.
To generalize the results, we divided the Arctic region into important areas (IA, Fig. 1) and calculated correlations between IA and TA seasonal averages (Table 2).
The strongest correlations for IAs are between T2 m in TA and SLP in Svalbard, and seasonally the correlation was strongest in winter (). Meanwhile, correlations with Svalbard T2 m and SIC are much weaker, with in all seasons. TA T2 m correlations with the Greenland region IA SLP are comparable to Svalbard, but correlations with T2 m are much stronger. The correlations between T2 m values in the Greenland region in winter and spring are and in autumn .
Correlations between TA and IA parameters are the weakest in summer, where the strongest correlations are R=0.37 between PREC in TA and SLP in both East Greenland and Svalbard. Correlations in summer between T2 m in TA and SLP are even weaker, with the strongest correlation in the Central Arctic. SIC in IA have generally weaker correlations with TA parameters than SLP or T2 m.
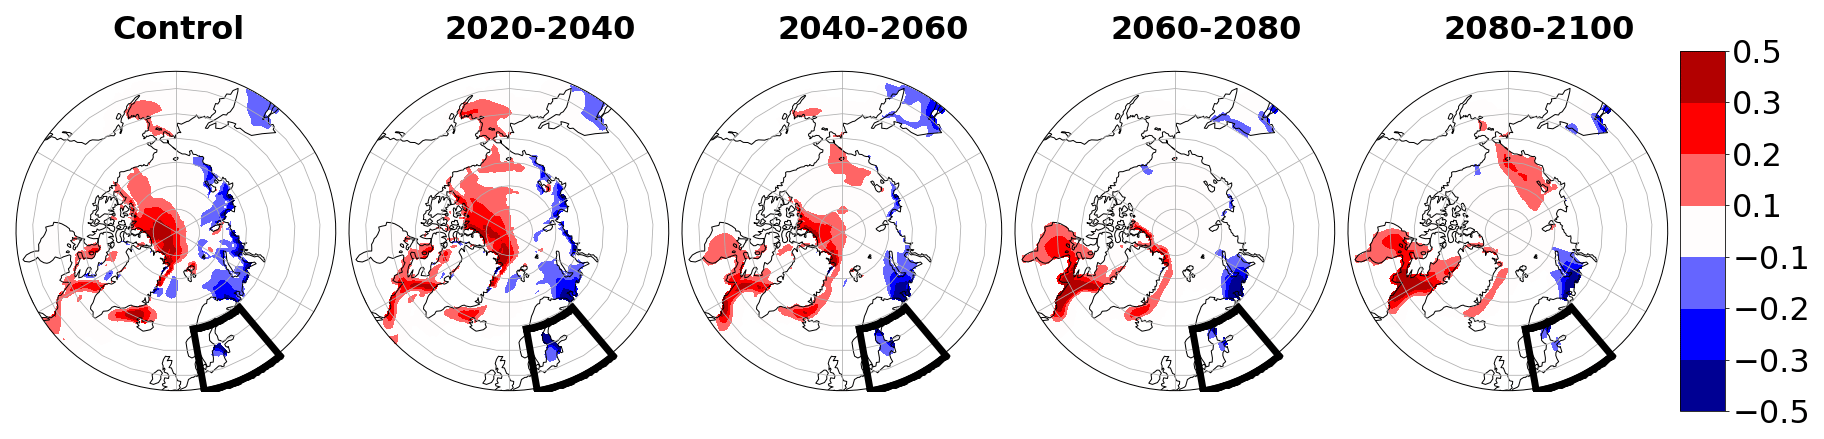
Figure 3The correlation in DJF between 2 m temperature (T2 m) in the testing area (black box) and sea ice concentration (SIC) in the control run and 20-year periods from ensemble simulations at the period 2020–2100.
Central Arctic parameters correlation with TA is stronger than 0.4 only between TA T2 m and Central Arctic SLP in winter and spring. Laptev Sea parameter correlations with TA parameters were weaker than in other IAs, with a correlation stronger than occurring with TA T2 m only in spring and winter.
To estimate the collective forecasting capability of IAs, we calculated the correlation between the parameter in TA and its ridge regression estimation (Table 2, first column). All IA seasonal SLP, T2 m, and SIC values were used for the ridge regression estimation. The correlation between T2 m in TA and its ridge regression estimation varies from 0.54 in summer to 0.8 in winter. The correlation between SLP in TA and its ridge regression estimation is from 0.47 in summer to 0.66 in winter. The correlation between PREC in TA and its ridge regression estimation is from 0.47 in spring to 0.59 in winter. As correlation square is the measure of the proportion of variance explained, then 0.82=64 % of T2 m variability in TA in winter can be explained by SLP, T2 m, and SIC variability in Arctic IAs. The weakest connection with the Arctic is the TA SLP in summer and PREC in spring, with %.
Local correlations (at the same spot, not shown) are necessary to better understand teleconnections between different parameters. The abovementioned strong correlation between T2 m in the Greenland region and TA can be connected through local relationships with other parameters. There is a robust local connection between T2 m and SIC, especially in the areas of the ice margin (). The SIC correlation between TA and the Greenland region reaches ; the correlation between T2 m at TA and SIC in the Greenland region reaches R=0.5.
The local correlation between SIC and U10 is mostly strongly negative (strength up to −0.8, not shown), especially in the regions where SIC is lower than 0.8. No significant local correlation exists between SIC and SLP in the Greenland Sea.
3.2 Spatial correlations of climatic variables during 2020–2100
To analyze how teleconnections are modified by climate change, we investigated the differences between 20-year periods and the control run. Depending on the variable, the correlation might change its spatial pattern and value between different 20-year periods. The correlations between the following variables were analyzed: T2 m, SLP, SIC, PREC, and Z500. To get statistically significant results, we used all 40 ensemble members for every 20-year period, and thus we had a total of 800 values for each period. Most of the correlations did not show significant changes in 20-year periods from the control run, including the most emphasized correlation between T2 m in TA and the Arctic region.
However, there are some statistically significant changes in correlations between T2 m in the TA and SIC in the Arctic. Positive correlations between T2 m in the TA and SIC in winter (DJF) simultaneously show a remarkable weakening in the North Pole region but a significant strengthening in the Davis Strait and Hudson Bay region (Fig. 3).
The strong positive correlation in the Davis Strait is also remarkable in spring (MAM), but it does not strengthen as much as in winter (not shown). The correlation in winter in the region between Greenland and Iceland weakens. The negative correlation between T2 m and SIC in the control run in the coastal areas of Russia becomes negligible after 2040, except in the Barents Sea, where it strengthens. A positive correlation is found in the East Siberian Sea in 2080–2100 (Fig. 3), supposedly connected with the decrease in the SIC (Fig. 4).
In regions of changing correlations, the average SIC in winter will be lessening in the Barents Sea, Hudson Bay, and between Greenland and Iceland (Fig. 4). SIC in the North Pole region and coastal areas of Siberia eastward of the Barents Sea do not decrease in winter.
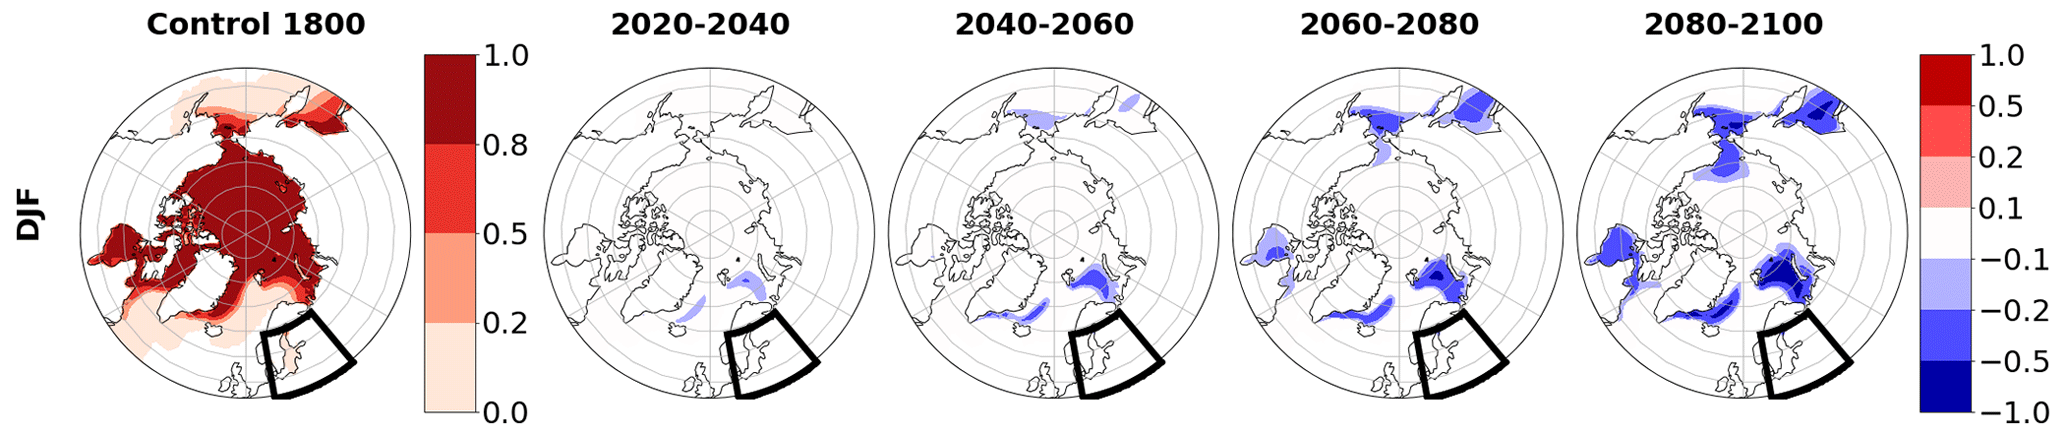
Figure 4The difference in 20-year-average sea ice concentration (SIC) in DJF from the control run average (first column) for the 20-year-long periods between 2020 and 2100.
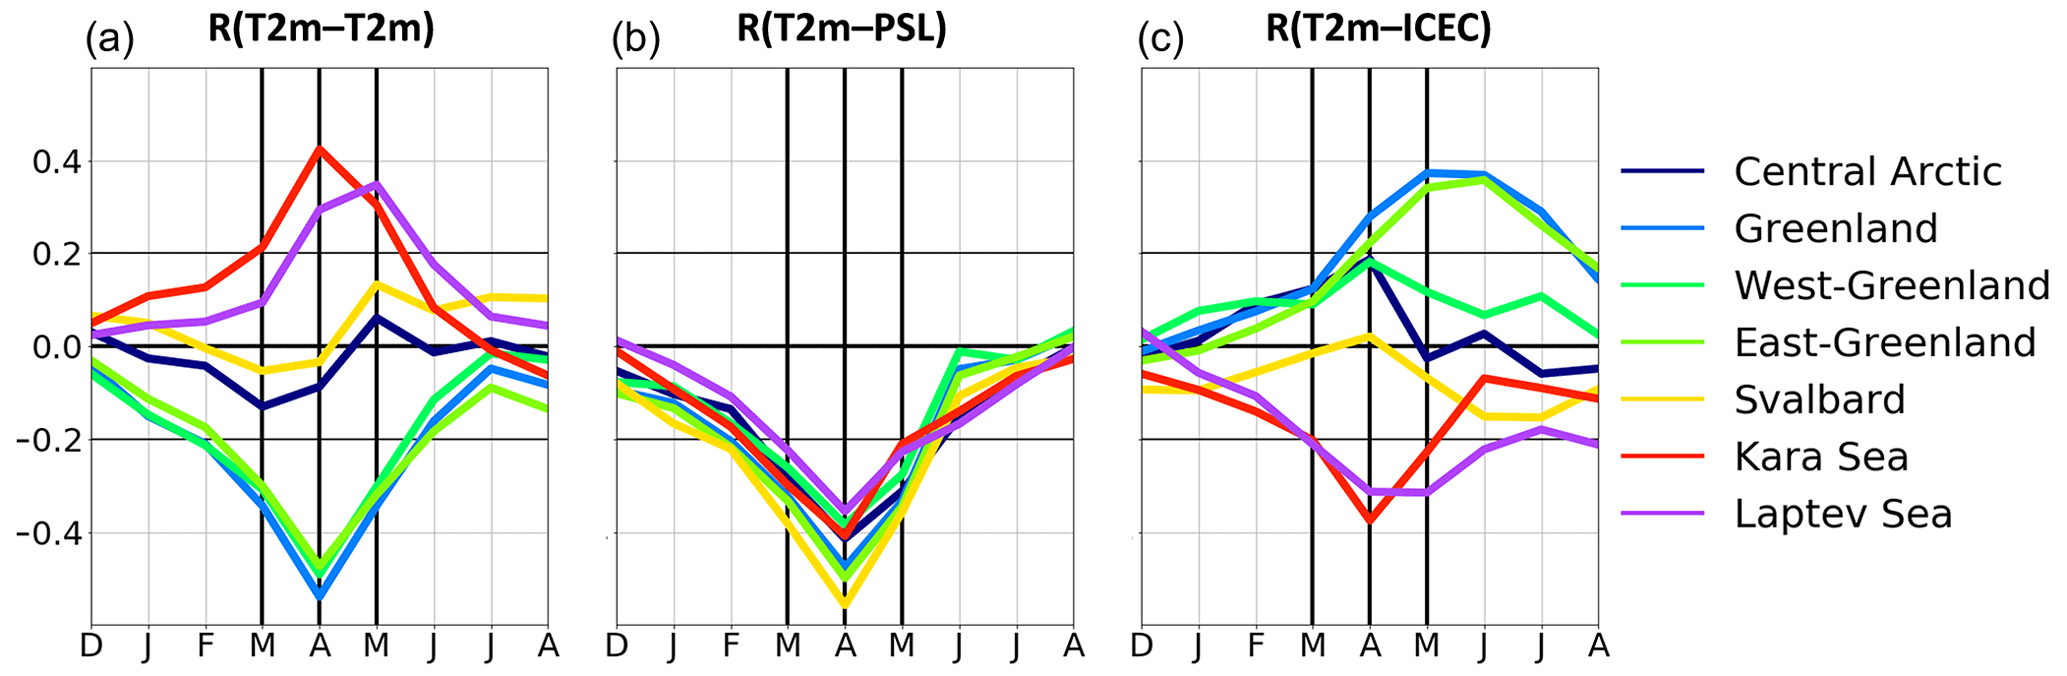
Figure 5Lagged correlation between spring (MAM) mean 2 m temperature (T2 m) in TA and IA monthly means of (1) T2 m (a), (2) sea level pressure (SLP, b), and (3) sea ice concentration (SIC, c). On the x axis are the monthly means in IAs. All correlations stronger than ±0.046 are statistically significant at the confidence level of 95 %.
3.3 Lagged correlations
We are interested in factors driving variations in the Baltic Sea region and whether prior conditions may provide predictive capability. Given this, we studied the connections between earlier months (November for DJF, etc.) average values of different parameters in the Arctic region and seasonal values of TA conditions. The strongest correlations were between spring (MAM) T2 m in TA and the previous month's (February) average T2 m and SLP (Fig. 5). The correlation values were −0.22 in the Svalbard and Greenland regions; correlations between other parameters showed a weaker correlation (). Analogous correlations during other seasons were weaker. We used ridge regression to determine the predictive capability of all previous months' average SLP, T2 m, and SIC values in all IAs to TA next-season conditions. Using ridge regression did not improve the predictability much – the strongest correlation was R=0.30 for T2 m in MAM. Thus, even for the best case, the previous month's average values over the Arctic describe less than 10 % of the variance of the next season's TA average climate state variance.
We focused on the testing area and searched for information at which rate the Arctic region climate parameters are statistically connected with parameters in the testing area. For several variables, the connection also worked contrariwise, where the values of the testing area variables can give information about the value of the Arctic region variables. For example, the spring average T2 m in TA has R>0.35 with SIC in June at Greenland and East Greenland. Stronger lagged correlations from TA to the Arctic can be explained by different averaging intervals – the monthly average in the Arctic has a lower influence on the next seasonal average in the TA than the TA seasonal average has on the following month's average in the Arctic.
The advantage of this study is the length of the stationary 1800-year-long CESM-LE control database, which also reveals relations with a weaker strength (correlations stronger than ±0.046 are statistically significant at the confidence level of 95 %). The CESM-LE 40-member ensemble forecast until 2100 allows us to investigate how relationships may change in the changing climate. The most important teleconnections for the testing area are T2 m, SLP, and SIC in regions around Greenland and Svalbard (Fig. 1, Table 1). Our results confirmed that the Greenland region is the most influential of all Arctic regions on teleconnection to the Baltic region (as also found by Zhuo et al., 2023) but did not confirm the old hypothesis that the mean winter conditions over Europe depend on the summer sea ice extent in Greenland (Hildebrandsson, 1914). The lagged correlation between summer SIC in the Greenland Sea did not significantly correlate with any primary TA parameter in the following winter. It has to be considered that our testing area is only part of the area Hildebrandsson investigated.
As far as we know, the first attempt to reveal the teleconnections between the Baltic Sea region and the Arctic was made by our workgroup in 2017 (Jakobson et al., 2017). It was based on NCEP-CFSR and the ERA-Interim reanalyses models for 1979–2015. Differences between the model parameters and different periods from the CESM-LE ensemble complicated the comparison with the present study. The comparison of T2 m in the present study and temperature at the 1000 hPa level in the study made in 2017 showed a different extent in the Greenland region but similar negative correlation strength in winter. In the present study, spring and autumn showed a much stronger correlation in much wider regions around Greenland. Summer showed a very weak correlation in both studies, probably due to the more emphasized local circulation.
In investigating the influence of climatic parameters of the Arctic region on the testing area, we have to also consider the local correlations. Our results from the 1800-year-long CESM-LE ensemble confirmed a strong () local connection between T2 m and SIC, as found in many other studies (e.g., Olonscheck et al., 2019; Vihma et al., 2014; Outten and Esau, 2012). Our results also confirm the strong negative local correlation between SIC and U10 in the ice margin regions (strength of up to −0.8), as shown in Jakobson et al. (2019). The negative correlation between SIC and W10 originates from the reduction in both stratification and aerodynamic surface roughness with a reduction in SIC (Vavrus and Alkama, 2022; Jakobson et al., 2019). Many scientists have found a lower SLP over the shrunk ice areas (Cassano et al., 2013; Alexander et al., 2004; Deser et al., 2000; Agnew, 1993), suggesting increased surface heating as a possible cause. Although Deser et al. (2000) found that mean SLP has decreased over the retracted ice margin in the Greenland Sea (according to 1958–1997 reanalysis products), our results did not show a significant correlation between SIC and SLP in the Greenland Sea region during any season. According to Agnew (1993), the reason why the correlation is not present in the Greenland Sea may be due to the important role that ice export through Fram Strait and ocean currents play in determining ice extent in this region.
Barents Oscillation (BO) is related to natural variability (the variation that humans do not cause) of Arctic surface air temperature (SAT) through meridional flow and zonal wind anomalies (Chen et al., 2013). Our T2 m–T2 m correlation pattern in winter (Fig. 2) was similar to the BO winter pattern. We tested the BO index influence on correlations between Arctic and TA using partial correlation. The BO index effect was insignificant or more negligible than the NAO and AO index influence on all parameters we checked in all seasons. NAO and AO index had the largest impact in winter. In summer, the local effects are more dominant and the influence of climate indices is weaker.
We also aimed to reveal the ongoing climate change, especially AA's influence on teleconnections between TA and the Arctic until 2100. Most of the correlations of 20-year periods did not show remarkable differences from the control run. Changes in the TA T2 m correlations with SIC in the Arctic concur with negative trends in SIC and positive trends in T2 m in TA. Changes in the correlations in winter with regions with high and stable SIC values are hard to suspect of having any direct physical basis. The strongest correlation between TA and Arctic region parameters was T2 m in TA and T2 m in the Greenland region (Table 2). This correlation is constant up to 2100 (not shown). Sun et al. (2016) declared that the “Warm Arctic, Cold Continents” regime is transient and becoming increasingly unlikely as the climate continues to warm. There seems to be a discrepancy between these two results, but it is not necessary. A strong negative correlation in winter means that warmer than average Arctic conditions concur with colder than average Baltic Sea region conditions; it does not exclude that both regions' climates can continue to warm simultaneously.
To generalize separate Arctic regions' statistical connections with the TA, we used the ridge regression. SLP, T2 m, and SIC variability in Arctic IAs can explain from 22 % of spring PREC to 64 % of winter T2 m variability in TA. Climate indices can explain a substantial amount of it. The previous month's IA-average forecasting capacity for the TA seasonal average is much weaker – TA spring T2 m has the highest coefficient of determination R2=9 % with the ridge regression estimation. Thus, we have to conclude that using Arctic climate data could not improve the Baltic Sea region's weather forecasting.
In conclusion – the Baltic Sea region climate has strong teleconnections with the Arctic climate; the strongest connections are with the Svalbard and Greenland region. There is high seasonality in the teleconnections, with the strongest correlations in winter and the weakest correlations in summer, when the local meteorological factors are stronger. The majority of teleconnections in winter and spring can be explained by climate indexes NAO and AO.
By the end of the 21st century, the Arctic ice concentration will significantly decrease. There will also be slight changes in the teleconnection locations and strength. Still, the general teleconnection patterns between the Arctic and Baltic Sea regions will not change during the 21st-century climate change.
The most important Arctic factors influencing the Baltic Sea are T2 m and SLP, and the most important Arctic regions are Greenland and Svalbard, but the mechanisms for these teleconnections remain unknown. We have to agree with Overland et al. (2016) that there are no simple cause-and-effect pathways in the Arctic and midlatitude weather and climate teleconnections.
The CESM1-LE data are available online at https://www.cesm.ucar.edu/community-projects/lens/data-sets (last access: 21 July 2023).
EJ and LJ designed the experiments, analyzed the results, and wrote the paper. EJ performed the experiments and generated the figures.
The contact author has declared that neither of the authors has any competing interests.
Publisher's note: Copernicus Publications remains neutral with regard to jurisdictional claims made in the text, published maps, institutional affiliations, or any other geographical representation in this paper. While Copernicus Publications makes every effort to include appropriate place names, the final responsibility lies with the authors.
We thank Marika Holland, Frederic Castruccio, and the whole NCAR Oceanography Section for hosting our visit, for access and support provided for the use of NCAR supercomputers, and for the helpful discussions.
The study received funding from the Baltic-American Freedom Foundation for Erko Jakobson's visit to NCAR via the BAFF Research Scholar Program.
This paper was edited by Ben Kravitz and reviewed by three anonymous referees.
Agnew, T.: Simultaneous winter sea-ice and atmospheric circulation anomaly patterns, Atmos.-Ocean, 31, 259–280, https://doi.org/10.1080/07055900.1993.9649471, 1993.
Alexander, M. A., Bhatt, U. S., Walsh, J. E., Timlin, M. S., Miller, J. S., and Scott, J. D.: The atmospheric response to realistic Arctic sea ice anomalies in an AGCM during winter, J. Climate, 17, 890–905, https://doi.org/10.1175/1520-0442(2004)017<0890:TARTRA>2.0.CO;2, 2004.
BACC II Author Team: Second Assessment of Climate Change for the Baltic Sea Basin, Springer Open, 501 pp., https://doi.org/10.1007/978-3-319-16006-1, 2015.
Barnes, E. A. and Screen, J.: The impact of Arctic warming on the midlatitude jet-stream: Can it? Has it? Will it? Wiley Interdiscip. Rev. Clim. Change, 6, 277–286, https://doi.org/10.1002/wcc.337, 2015.
Barnhart, K. R., Miller, C. R., Overeem, I., and Kay, J. E.: Mapping the future expansion of Arctic open water, Nat. Clim. Change, 6, 280–285, https://doi.org/10.1038/nclimate2848, 2016.
Bintanja, R. and Krikken, F.: Magnitude and pattern of Arctic warming governed by the seasonality of radiative forcing, Sci. Rep., 6, 38287, https://doi.org/10.1038/srep38287, 2016.
Bintanja, R. and van der Linden, E. C.: The changing seasonal climate in the Arctic, Sci. Rep., 3, srep01556, https://doi.org/10.1038/srep01556, 2013.
Boeke, R. C. and Taylor, P. C.: Seasonal Energy Exchange in Sea Ice Retreat Regions Contributes to Differences in Projected Arctic Warming, Nat. Commun, 9, 5017, https://doi.org/10.1038/s41467-018-07061-9, 2018.
Cassano, E. N., Cassano, J. J., Higgins, M. E., and Serreze, M. C.: Atmospheric impacts of an Arctic sea ice minimum as seen in the Community Atmosphere Model, Int. J. Climatol., 34, 766–779, https://doi.org/10.1002/joc.3723, 2013.
Cattiaux, J., Vautard, R., Cassou, C., Yiou, P., Masson-Delmotte, V., and Codron, F.: Winter 2010 in Europe: A cold extreme in a warming climate, Geophys. Res. Lett., 37, L20704, https://doi.org/10.1029/2010GL044613, 2010.
Chen, H. W., Zhang, Q., Körnich, H., and Chen, D.: A robust mode of climate variability in the Arctic: The Barents Oscillation, Geophys. Res. Lett., 40, 2856–2861, https://doi.org/10.1002/grl.50551, 2013.
Christensen, O. B., Kjellström, E., Dieterich, C., Gröger, M., and Meier, H. E. M.: Atmospheric regional climate projections for the Baltic Sea region until 2100, Earth Syst. Dynam., 13, 133–157, https://doi.org/10.5194/esd-13-133-2022, 2022.
Clark, J., Shenoy, V., Feldstein, S., Lee, S., and Goss, M.: The Role of Horizontal Temperature Advection in Arctic Amplification, J. Climate, 34, 8, 2957–2976, https://doi.org/10.1175/JCLI-D-19-0937.1, 2021.
Cohen, J., Zhang, X., Francis, J., Jung, T., Kwok, R., Overland, J., Ballinger, T., Blackport, R., Bhatt, U. S., Chen, H., Coumou, D., Feldstein, S., Handorf, D., Hell, M., Henderson, G., Ionita, M., Kretschmer, M., Laliberte, F., Lee, S., Linderholm, H., Maslowski, W., Rigor, I., Routson, C., Screen, J., Semmler, T., Singh, D., Smith, D., Stroeve, J., Taylor, PC., Vihma, T., Wang, M., Wang, S., Wu, Y., Wendisch, M., and Yoon J.: Arctic change and possible influence on mid-latitude climate and weather: A US CLIVAR White Paper, US CLIVAR Rep., https://doi.org/10.5065/D6TH8KGW, 2018.
Coumou, D., Di Capua, G., Vavrus, S., Wang, L., and Wang, S.: The influence of Arctic amplification on mid-latitude summer circulation, Nat. Commun., 9, 2959, https://doi.org/10.1038/s41467-018-05256-8, 2018.
Dai, A. and Song, M.: Little influence of Arctic amplification on mid-latitude climate, Nat. Clim. Change, 10, 231–237, https://doi.org/10.1038/s41558-020-0694-3, 2020.
Dai, A. and Jenkins, M.: Relationships among Arctic warming, sea-ice loss, stability, lapse rate feedback, and Arctic amplification, Clim. Dynam., 61, 5217–5232, https://doi.org/10.1007/s00382-023-06848-x, 2023.
Dai, A., Luo, D., Song, M., and Liu, J.: Arctic amplification is caused by sea-ice loss under increasing CO2, Nat. Commun., 10, 121, https://doi.org/10.1038/s41467-018-07954-9, 2019.
Deng, K., Yang, S., Ting, M., Lin, A., and Wang, Z.: An intensified mode of variability modulating the summer heatwaves in eastern Europe and Northern China, Geophys. Res. Lett., 45, 11, 361–369, https://doi.org/10.1029/2018GL079836, 2018.
Deser, C., Walsh, J.E., and Timlin, M.S.: Arctic Sea Ice Variability in the Context of Recent Atmospheric Circulation Trends, J. Climate, 13, 3, https://doi.org/10.1175/1520-0442(2000)013<0617:ASIVIT>2.0.CO;2, 2000.
Deser, C., Hurrell, J. W., and Phillips, A. S.: The role of the North Atlantic Oscillation in European climate projections, Clim. Dynam., 49, 3141–3157, https://doi.org/10.1007/s00382-016-3502-z, 2017.
Duan, L., Cao, L., and Caldeira, K.: Estimating Contributions of Sea Ice and Land Snow to Climate Feedback, J. Geophys. Res.-Atmos., 124, 199–208, https://doi.org/10.1029/2018JD029093, 2019.
Francis, J. A. and Hunter, E.: New insight into the disappearing Arctic sea ice. EOS, 87, 509–511, https://doi.org/10.1029/2006EO460001, 2006.
Francis, J. A. and Vavrus, S. J.: Evidence for a wavier jet stream in response to rapid Arctic warming, Environ. Res. Lett., 10, 014005, https://doi.org/10.1088/1748-9326/10/1/014005, 2015.
Halkka, A.: Changing climate and the Baltic region biota, Doctoral dissertation, Faculty of Biological and Environmental Sciences, University of Helsinki, Helsinki, Finland, 52 pp., http://urn.fi/URN:ISBN:978-951-51-6021-8 (last access: 16 February 2022), 2020.
Hildebrandsson, H. H.: Quelques recherches sur les centres d'action de l'atmosphere, Kungl, Svenska vetenskapsakademiens handlingar, 51, 3–16, 1914.
Hurrell, J. W., Holland, M. M., Gent, P. R., Ghan, S., Kay, J. E., Kushner, P. J., Lamarque, J., Large, W. G., Lawrence, D., Lindsay, K., Lipscomb, W. H., Long, M. C., Mahowald, N., Marsh, D. R., Neale, R. B., Rasch, P., Vavrus, S., Vertenstein, M., Bader, D., Collins, W. D., Hack, J. J., Kiehl, J., and Marshall, S.: The Community Earth System Model: A Framework for Collaborative Research, B. Am. Meteorol. Soc., 94, 1339–1360, https://doi.org/10.1175/BAMS-D-12-00121.1, 2013.
IPCC 2021: Climate Change 2021: The Physical Science Basis. Contribution of Working Group I to the Sixth Assessment Report of the Intergovernmental Panel on Climate Change, edited by: Masson-Delmotte, V., Zhai, P., Pirani, A., Connors, S. L., Péan, C., Berger, S., Caud, N., Chen, Y., Goldfarb, L., Gomis, M. I., Huang, M., Leitzell, K., Lonnoy, E., Matthews, J. B. R., Maycock, T. K., Waterfield, T., Yelekçi, O., Yu, R., and Zhou, B., Cambridge University Press, in Press, https://doi.org/10.1017/9781009157896, 2021.
Jahn, A.: Reduced probability of ice-free summers for 1.5 ∘C compared to 2 ∘C warming, Nat. Clim. Change, 8, 409–413, https://doi.org/10.1038/s41558-018-0127-8, 2018.
Jahn, A., Kay, J. E., Holland, M. M., and Hall, D. M.: How predictable is the timing of a summer ice-free Arctic?, Geophys. Res. Lett., 43, 9113–9120, https://doi.org/10.1002/2016GL070067, 2016.
Jakobson, L., Jakobson, E., Post, P., and Jaagus, J.: Atmospheric teleconnections between the Arctic and the eastern Baltic Sea regions, Earth Syst. Dynam., 8, 1019–1030, https://doi.org/10.5194/esd-8-1019-2017, 2017.
Jakobson, L., Vihma, T., and Jakobson, E.: Relationships between Sea Ice Concentration and Wind Speed over the Arctic Ocean during 1979–2015, J. Climate, 32, 22, https://doi.org/10.1175/JCLI-D-19-0271.1, 2019.
Jenkins, M. and Dai, A.: The Impact of Sea-Ice Loss on Arctic Climate Feedbacks and Their Role for Arctic Amplification, Geophys. Res. Lett., 48, 15, https://doi.org/10.1029/2021GL094599, 2021.
Jung, T., Doblas-Reyes, F., Goessling, H., Guemas, V., Bitz, C., Buontempo, C., Caballero, R., Jakobson, E., Jungclaus, J., Karcher, M., Koenigk, T., Matei, D., Overland, J., Spengler, T., and Yang, S.: Polar lower-latitude linkages and their role in weather and climate prediction, B. Am. Meteorol. Soc., 96, 197–200, https://doi.org/10.1175/BAMS-D-15-00121.1, 2015.
Kay, J. E., Deser, C., Phillips, A., Mai, A., Hannay, C., Strand, G., Arblaster, J. M., Bates, S. C., Danabasoglu, G., Edwards, J., Holland, M., Kushner, P., Lamarque, J., Lawrence, D., Lindsay, K., Middleton, A., Munoz, E., Neale, R., Oleson, K., Polvani, L., and Vertenstein, M.: The Community Earth System Model (CESM) large ensemble project: A community resource for studying climate change in the presence of internal climate variability. B. Amer. Meteor. Soc., 96, 1333–1349, https://doi.org/10.1175/BAMS-D-13-00255.1, 2015.
Kug, J. S., Jeong, J. H., Jang, Y. S., Kim, B. M., Folland, C. K., Min, S. K., and Son, S. W.: Two distinct influences of Arctic warming on cold winters over North America and East Asia, Nat. Geosci., 8, 759–762, https://doi.org/10.1038/ngeo2517, 2015.
Labe, Z., Magnusdottir, G., and Stern, H.: Variability of Arctic sea ice thickness using PIOMAS and the CESM Large Ensemble, J. Climate, 31, 3233–3247, https://doi.org/10.1175/JCLI-D-17-0436.1, 2018.
Laîné, A., Yoshimori, M., and Abe-Ouchi, A.: Surface Arctic amplification factors in CMIP5 models: land and oceanic surfaces and seasonality, J. Climate, 29, 3297–3316, https://doi.org/10.1175/JCLI-D-15-0497.1, 2016.
Lee J. and Cai, M.: Seasonality of polar surface warming amplification in climate simulations, Geophys. Res. Lett., 36, L16704, https://doi.org/10.1029/2009GL040133, 2009.
Lee, S., Gong, T., Feldstein, S. B., Screen, J. A., and Simmonds, I.: Revisiting the cause of the 1989–2009 Arctic surface warming using the surface energy budget: Downward infrared radiation dominates the surface fluxes, Geophys. Res. Lett., 44, 654–661, https://doi.org/10.1002/2017GL075375, 2017.
Lee, S. H., Charlton-Perez, A. J., Furtado, J. C., and Woolnough, S. J.: Abrupt stratospheric vortex weakening associated with North Atlantic anticyclonic wave breaking, J. Geophys. Res.-Atmos., 124, 8563–8575, https://doi.org/10.1029/2019JD030940, 2019.
Luo, D., Y. Xiao, Y., Diao, Y., Dai, A., Franzke, C., and Simmonds, I.: Impact of Ural Blocking on winter Warm Arctic–Cold Eurasian anomalies, Part II: The link to the North Atlantic Oscillation, J. Climate, 29, 3949–3971, https://doi.org/10.1175/JCLI-D-15-0612.1, 2016.
Luo, D., Yao, Y., Dai, A., Simmonds, I., and Zhong, L.: Increased quasi-stationarity and persistence of winter Ural Blocking and Eurasian extreme cold events in response to Arctic warming, Part II: A theoretical explanation, J. Climate, 30, 3569–3587, https://doi.org/10.1175/JCLI-D-16-0262.1, 2017.
Luo, D., Chen, X., Overland, J., Simmonds, I., Wu, Y., and Zhang, P.: Weakened potential vorticity barrier linked to recent winter Arctic sea ice loss and midlatitude cold extremes, J. Climate, 32, 4235–4261, https://doi.org/10.1175/JCLI-D-18-0449.1, 2019.
Martius, O., Polvani, L. M., and Davies, H. C.: Blocking precursors to stratospheric sudden warming events, Geophys. Res. Lett., 36, 1–5, https://doi.org/10.1029/2009GL038776, 2009.
Massonnet, F., Vancoppenolle, M., Goosse, H., Docquier, D., Fifechet, T., and Blanchard-Wrigglesworth, E.: Arctic sea-ice change tied to its mean state through thermodynamic processes, Nat. Clim. Change, 8, 599–603, https://doi.org/10.1038/s41558-018-0204-z, 2018.
Meleshko, V. P., Pavlova, T., Bobylev, L. P., and Golubkin, P.: Current and Projected Sea Ice in the Arctic in the Twenty-First Century, in: Sea Ice in the Arctic: Past, Present and Future, Springer Polar Sciences, edited by: Johannessen, O. M., Bobylev, L. P., Shalina, E. V., Sandven, S., Springer International Publishing, Cham, 399–463, https://doi.org/10.1007/978-3-030-21301-5_10, 2020.
Nakamura, T. and Sato, T.: A possible linkage of Eurasian heat wave and East Asian heavy rainfall in Relation to the Rapid Arctic warming, Environ. Res., 209, 112881, https://doi.org/10.1016/j.envres.2022.112881, 2022.
Olonscheck, D., Mauritsen, T., and Notz, D.: Arctic sea-ice variability is primarily driven by atmospheric temperature fluctuations, Nat. Geosci., 12, 430–434, https://doi.org/10.1038/s41561-019-0363-1, 2019.
Outten, S. and Esau, I.: A link between Arctic sea ice and recent cooling trends over Eurasia, Clim. Change, 110, 1069–1075, https://doi.org/10.1007/s10584-011-0334-z, 2012.
Overland, J. E., Francis, J., Hall, R., Hanna, E., Kim, S. J., and Vihma, T.: The melting Arctic and mid-latitude weather patterns: Are they connected?, J. Climate, 28, 7917–7932, https://doi.org/10.1175/JCLI-D-14-00822.1, 2015.
Overland, J. E., Hanna, E., Hanssen-Bauer, I., Kim, S.-J., Walsh, J. E., Wang, M., Bhatt, U. S., and Thoman, R. L.: Surface air temperature, (in Arctic Report Card 2018), https://www.arctic.noaa.gov/Report-Card (last access: 21 July 2023), 2018.
Overland, J. E., Ballinger, T. J., Cohen, J., Francis, J. A., Hanna, E., Jaiser, R., Kim, B.-M., Kim, S.-J., Ukita, J., Vihma, T., Wang, M., and Zhang, X.: How do intermittency and simultaneous processes obfuscate the Arctic influence on midlatitude winter extreme weather events?, Environ Res. Lett., 16, 043002, https://doi.org/10.1088/1748-9326/abdb5d, 2021.
Peings, Y.: Ural Blocking as a Driver of Early-Winter Stratospheric Warming, Geophys. Res. Lett., 46, 5460–5468, https://doi.org/10.1029/2019GL082097, 2019.
Peings, Y., Davini, P., and Magnusdottir, G.: Impact of Ural Blocking on Early Winter Climate Variability Under Different Barents-Kara Sea Ice Conditions, J. Geophys. Res.-Atmos., 128, e2022JD036994, https://doi.org/10.1029/2022JD036994, 2023.
Pithan, F. and Mauritsen, T.: Arctic amplification dominated by temperature feedbacks in contemporary climate models, Nat. Geosci., 7, 181–184, https://doi.org/10.1038/ngeo2071, 2014.
Rantanen, M., Karpechko, A. Y., Lipponen, A., Nordling, K., Hyvärinen, O., Ruosteenoja, K., Vihma, T., and Laaksonen, A.: The Arctic has warmed nearly four times faster than the globe since 1979, Commun. Earth Environ., 3, 168, https://doi.org/10.1038/s43247-022-00498-3, 2022.
Rondeau-Genesse, G. and Braun, M.: Impact of internal variability on climate change for the upcoming decades: analysis of the CanESM2-LE and CESM-LE large ensembles, Clim. Change, 156, 299–314, https://doi.org/10.1007/s10584-019-02550-2, 2019.
Rudeva, I. and Simmonds, I.: Midlatitude winter extreme temperature events and connections with anomalies in the Arctic and tropics, J. Climate, 34, 3733–3749, https://doi.org/10.1175/JCLI-D-20-0371.1, 2021.
Rutgersson, A., Kjellström, E., Haapala, J., Stendel, M., Danilovich, I., Drews, M., Jylhä, K., Kujala, P., Larsén, X. G., Halsnæs, K., Lehtonen, I., Luomaranta, A., Nilsson, E., Olsson, T., Särkkä, J., Tuomi, L., and Wasmund, N.: Natural hazards and extreme events in the Baltic Sea region, Earth Syst. Dynam., 13, 251–301, https://doi.org/10.5194/esd-13-251-2022, 2022.
Schell, I. I.: Interrelations of Arctic ice with the atmosphere and the ocean in the North Atlantic-Arctic and adjacent areas, J. Atmos. Sci., 13, 1, https://doi.org/10.1175/1520-0469(1956)013< 0046:IOAIWT>2.0.CO;2, 1956.
Saleh, A. K., Arashi, M., and Kibria Golam, B. M.: Theory of Ridge Regression Estimation with Applications, New York: John Wiley & Sons, ISBN 978-1-118-64461-4, 2019.
Sang, X., Yang, X. Q., Tao, L., Fang, J., and Sun, X.: Decadal changes of wintertime poleward heat and moisture transport associated with the amplified Arctic warming, Clim. Dynam., 58, 137–159, https://doi.org/10.1007/s00382-021-05894-7, 2022.
Screen, J. A. and Simmonds, I.: Increasing fall-winter energy loss from the Arctic Ocean and its role in Arctic temperature amplification, Geophys. Res. Lett., 37, L16707, https://doi.org/10.1029/2010GL044136, 2010.
Serreze, M. C., Barrett, A. P., Stroeve, J. C., Kindig, D. N., and Holland, M. M.: The emergence of surface-based Arctic amplification, The Cryosphere, 3, 11–19, https://doi.org/10.5194/tc-3-11-2009, 2009.
Simmonds, I. and Li, M.: Trends and variability in polar sea ice, global atmospheric circulations and baroclinicity, Ann. NY Acad. Sci., 1504, 167–186, https://doi.org/10.1111/nyas.14673, 2021.
Smith, A. and Jahn, A.: Definition differences and internal variability affect the simulated Arctic sea ice melt season, The Cryosphere, 13, 1–20, https://doi.org/10.5194/tc-13-1-2019, 2019.
Spielhagen, R. F., Werner, K., Sørensen, S. A., Zamelczyk, K., Kandiano, E., Budeus, G., Husum, K., Marchitto, T. M., and Hald, M.: Enhanced modern heat transfer to the Arctic by warm Atlantic water, Science, 331, 450–453, https://doi.org/10.1126/science.1197397, 2011.
Statnaia, I. A., Karpechko, A. Y., and Järvinen, H. J.: Mechanisms and predictability of sudden stratospheric warming in winter 2018, Weather Clim. Dynam., 1, 657–674, https://doi.org/10.5194/wcd-1-657-2020, 2020.
Sun, L., Perlwitz, J., and Hoerling, M.: What caused the recent “Warm Arctic, Cold Continents” trend pattern in winter temperatures?, Geophys. Res. Lett., 43, 5345–5352, https://doi.org/10.1002/2016gl069024, 2016.
Sun, L., Alexander, M. A., and Deser, C.: Evolution of the global coupled climate response to Arctic sea ice loss during 1990–2090 and its contribution to climate change, J. Climate, 31, 7823–7843, https://doi.org/10.1175/JCLI-D-18-0134.1, 2018.
Swart, N. C., Fyfe, J. C., Hawkins, E., Kay, J. E., and Jahn, A.: Influence of internal variability on Arctic sea-ice trends, Nat. Climate Change, 5, 86–89, https://doi.org/10.1038/nclimate2483, 2015.
Taylor, P., Boeke, R., Boisvert, L., Feldl, N., Henry, M., Huang, Y., Langen, P., Liu, W., Pithan, F., Sejas, S., and Tan, I.: Process Drivers, Inter-Model Spread, and the Path Forward: A Review of Amplified Arctic Warming, Front. Earth Sci., 9, 1–29, https://doi.org/10.3389/feart.2021.758361, 2022.
Taylor, P. C., Kato, S., Xu, K.-M., and Cai, M.: Covariance between Arctic sea ice and clouds within atmospheric state regimes at the satellite footprint level. J. Geophys. Res.-Atmos., 120, 12656–12678, https://doi.org/10.1002/2015JD023520, 2015.
Taylor, P. C., Cai, M., Hu, A., Meehl, J., Washington, W., and Zhang, G. J.: A Decomposition of Feedback Contributions to Polar Warming Amplification, J. Climate, 26, 7023–7043, https://doi.org/10.1175/JCLI-D-12-00696.1, 2013.
Vavrus, S.: The impact of cloud feedbacks on Arctic climate under greenhouse forcing. J. Climate, 17, 603–615, https://doi.org/10.1175/1520-0442(2004)017<0603:TIOCFO>2.0.CO;2, 2004.
Vavrus, S. J. and Alkama, R.: Future trends of arctic surface wind speeds and their relationship with sea ice in CMIP5 climate model simulations, Clim. Dynam., 59, 1833–1848, https://doi.org/10.1007/s00382-021-06071-6, 2022.
Vihma, T.: Effects of Arctic Sea Ice Decline on Weather and Climate: A Review, Surv. Geophys., 35, 1175–1214, https://doi.org/10.1007/s10712-014-9284-0, 2014.
Vihma, T., Graversen, R., Chen, L., Handorf, D., Skific, N., Francis, JA., Tyrrell, N., Hall, R., Hanna, E., uotila, P., Dethloff, K., Karpechko, AY., Björnsson, H., and Overland, JE.: Effects of the tropospheric large-scale circulation on European winter temperatures during the period of amplified Arctic warming, J. Climatol., 40, 509–529, https://doi.org/10.1002/joc.6225, 2019.
Viru, B. and Jaagus, J.: Spatio-temporal variability and seasonal dynamics of snow cover regime in Estonia, Theor. Appl. Climatol., 139, 759–771, https://doi.org/10.1007/s00704-019-03013-5, 2020.
Wiese, W.: Polareis und atmosphärische Schwankungen, Geograf. Ann., 6, 273–299, 1924.
Yang, S., Wen, X., and Gao, M.: Relation of Mid-High-Latitude Eurasian ISO to Ural Blocking Frequency and Their Co-Effect on Extreme Hot Events during Boreal Summer, Atmosphere, 13, 1–15, https://doi.org/10.3390/atmos13122041, 2022.
Yao, Y., Luo, D., Dai, A., and Simmonds, I.: Increased quasi stationarity and persistence of Ural blocking and Eurasian extreme cold events in response to Arctic warming. Part I: Insights from observational analyses, J. Climate, 30, 3549–3568, https://doi.org/10.1175/JCLI-D-16-0261.1, 2017.
Yoshimori, M., Watanabe, M., Abe-Ouchi, A., Shiogama, H., and Ogura, T.: Relative contribution of feedback processes to Arctic amplification of temperature change in MIROC GCM, Clim. Dynam., 42, 1613–1630, https://doi.org/10.1007/s00382-013-1875-9, 2014.
Zhuo, W., Yao, Y., Luo, D., Simmonds, I., and Huang, F.: The key atmospheric drivers linking regional Arctic amplification with East Asian cold extremes, Atmos. Res., 283, 106557, https://doi.org/10.1016/j.atmosres.2022.106557, 2023.