the Creative Commons Attribution 4.0 License.
the Creative Commons Attribution 4.0 License.
 | 18 Jan 2024
Impact of Atlantic multidecadal variability on rainfall intensity distribution and timing of the West African monsoon
Paul-Arthur Monerie
Juliette Mignot
Moussa Diakhaté
Markus Donat
Christopher David Roberts
Francisco Doblas-Reyes
Previous studies agree on an impact of the Atlantic multidecadal variability (AMV) on the total seasonal rainfall amounts over the Sahel. However, whether and how the AMV affects the distribution of rainfall or the timing of the West African monsoon is not well known. Here we seek to explore these impacts by analyzing daily rainfall outputs from climate model simulations with an idealized AMV forcing imposed in the North Atlantic, which is representative of the observed one. The setup follows a protocol largely consistent with the one proposed by the Component C of the Decadal Climate Prediction Project (DCPP-C). We start by evaluating model's performance in simulating precipitation, showing that models underestimate it over the Sahel, where the mean intensity is consistently smaller than observations. Conversely, models overestimate precipitation over the Guinea coast, where too many rainy days are simulated. In addition, most models underestimate the average length of the rainy season over the Sahel; some are due to a monsoon onset that is too late and others due to a cessation that is too early. In response to a persistent positive AMV pattern, models show an enhancement in total summer rainfall over continental West Africa, including the Sahel. Under a positive AMV phase, the number of wet days and the intensity of daily rainfall events are also enhanced over the Sahel. The former explains most of the changes in seasonal rainfall in the northern fringe, while the latter is more relevant in the southern region, where higher rainfall anomalies occur. This dominance is connected to the changes in the number of days per type of event; the frequency of both moderate and heavy events increases over the Sahel's northern fringe. Conversely, over the southern limit, it is mostly the frequency of heavy events which is enhanced, thus affecting the mean rainfall intensity there. Extreme rainfall events are also enhanced over the whole Sahel in response to a positive phase of the AMV. Over the Sahel, models with stronger negative biases in rainfall amounts compared to observations show weaker changes in response to AMV, suggesting that systematic biases could affect the simulated responses. The monsoon onset over the Sahel shows no clear response to AMV, while the demise tends to be delayed, and the overall length of the monsoon season enhanced between 2 and 5 d with the positive AMV pattern. The effect of AMV on the seasonality of the monsoon is more consistent to the west of 10∘ W, with all models showing a statistically significant earlier onset, later demise, and enhanced monsoon season with the positive phase of the AMV. Our results suggest a potential for the decadal prediction of changes in the intraseasonal characteristics of rainfall over the Sahel, including the occurrence of extreme events.
- Article
(18539 KB) - Full-text XML
- BibTeX
- EndNote


The Atlantic multidecadal variability (AMV) is a basin-scale fluctuation at multidecadal timescales observed in the Atlantic sea surface temperature (SST) with high spatial coherence (e.g., Zhang et al., 2019). Its positive phase consists of an anomalously warm SST over the North Atlantic, while the negative one presents an anomalous cooling (Fig. 1a). The swings between positive and negative phases observed during the 20th century take around 30–40 years (Kerr, 2000, Fig. 1b), though its spectrum shows a broad band of low-frequency signals (Zhang, 2017).
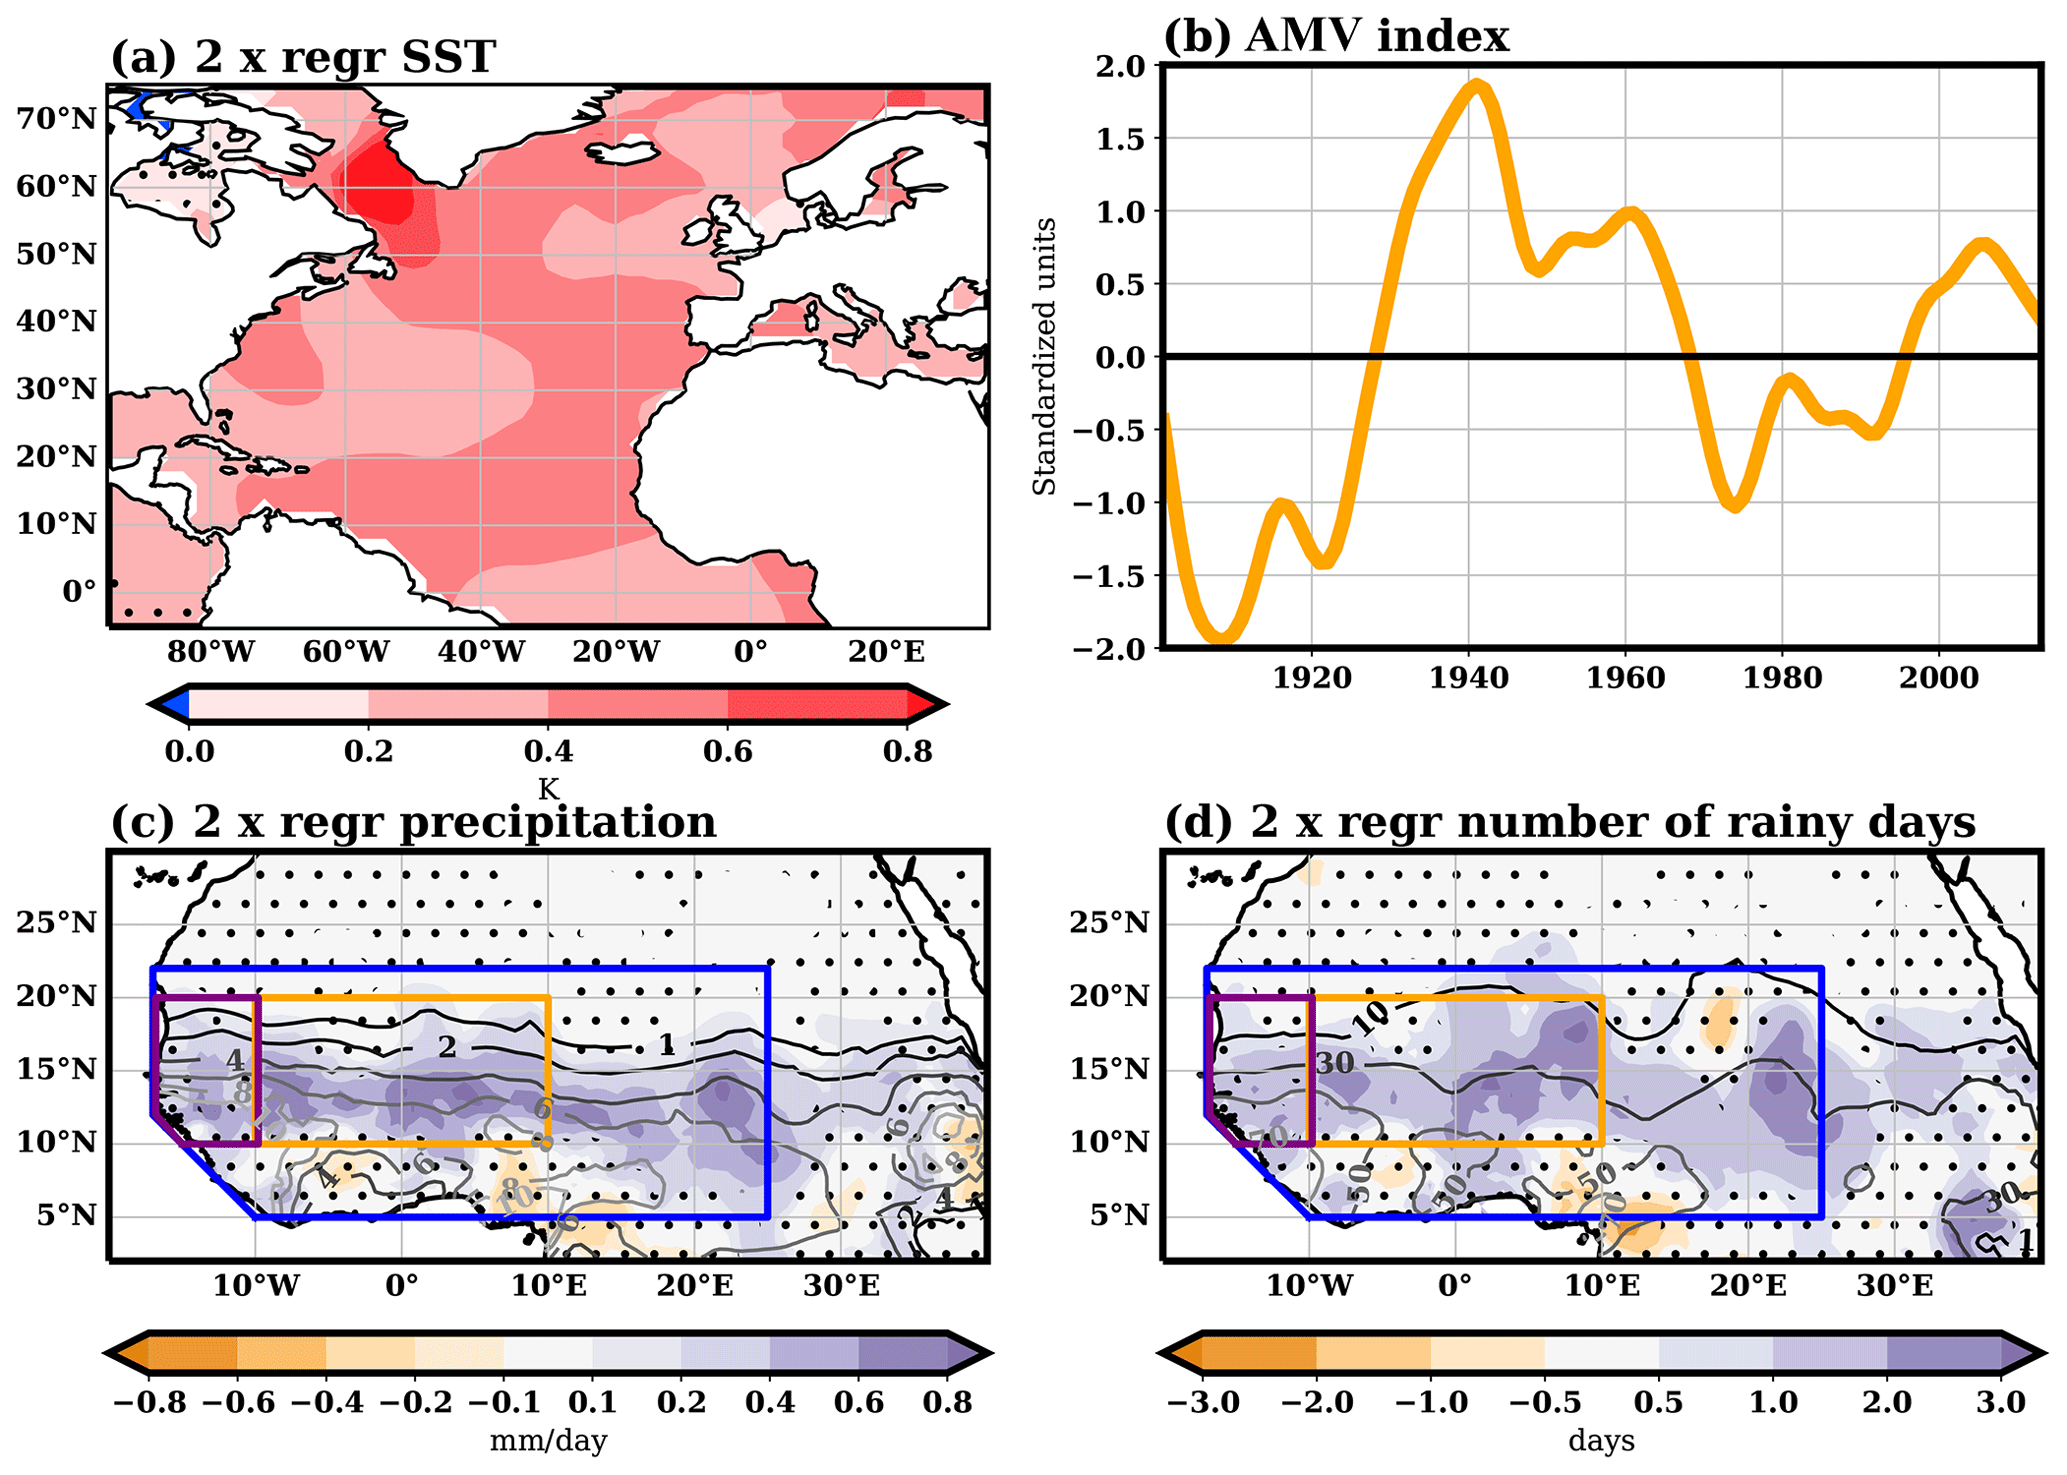
Figure 1AMV and impacts on observations in the 1901–2013 period, with twice the regression onto the standardized AMV index of the ERSSTv4 year-averaged SSTs onto the AMV index (a; shaded in K); standardized AMV index (as shown in Boer et al., 2016; b)); the mean seasonal July to September rainfall (c; shaded in mm d−1); and the total number of rainy days in the season (d; shaded in days). In panels (c) and (d), regression is only shown over regions where the correlation between the AMV index and the field is statistically significant (p<0.05). In panels (c) and (d), climatological values are shown in contours (same units as the corresponding anomalies). The orange, purple, and blue boxes in panels (c) and (d) mark the Sahel, westernmost Sahel, and West African region, as defined in this study.
There is currently a debate on the origin of the AMV. Some works suggest fluctuations in the Atlantic Meridional Overturning Circulation (AMOC) as its main cause, highlighting the relevance of variability that is internal to the climate system (Knight et al., 2005; Zhang, 2017; Kim et al., 2018; Zhang et al., 2019; Baek et al., 2022). Another possible mechanism, also internal to the climate system, is the response of the upper-ocean mixed layer to mid-latitude atmospheric stochastic forcing and subsequent thermal coupling in the tropics (Clement et al., 2015). On the other hand, other studies suggest a prominent role of changes in the aerosol atmospheric burden as an explanation for the observed AMV during the instrumental period, highlighting external forcings either from natural or anthropogenic aerosol sources (Rotstayn and Lohmann, 2002; Ottera et al., 2010; Booth et al., 2012; Terray, 2012; Watanabe and Tatebe, 2019). There are also studies suggesting that a combination of both internal variability and external forcings shapes the observed AMV (Terray, 2012; Qin et al., 2020).
Regardless of its origin, there is high consensus on the broad impacts of the AMV (interested readers are referred to Zhang et al., 2019, for a detailed review). It has been shown to modulate the location of the Atlantic Intertropical Convergence Zone (ITCZ), promoting in its positive phase a northward shift in the ITCZ and enhanced rainfall over Amazonia, decreased rainfall over northeastern Brazil, and an increased frequency of Atlantic hurricanes (e.g., Knight et al., 2006; Trenberth and Shea, 2006; Zhang and Delworth, 2006; Villamayor et al., 2018a; Hodson et al., 2022). Observed and simulated results also suggest that it is positively associated with summer surface warming and negatively associated with sea level pressure anomalies over North America and Europe (Sutton and Hodson, 2005; Knight et al., 2006; Qasmi et al., 2020). Away from the Atlantic, a positive AMV can also promote wetter-than-average conditions for the Indian monsoon, warmer-than-average conditions over northeastern Asia, and a cooling over the eastern and central tropical Pacific, modifying its interannual variability (Ruprich-Robert et al., 2017, 2021; Monerie et al., 2019, 2021; Hodson et al., 2022). The AMV has also been suggested as a possible modulator of Atlantic–Pacific interbasin connections at interannual timescales (Martín-Rey et al., 2015, 2018).
There is also a broad consensus, based on observations and modeling studies, that AMV modulates the West African monsoon, with its positive phase promoting enhanced summer seasonal rainfall over the semi-arid area of the Sahel (e.g., Folland et al., 1986; Knight et al., 2006; Zhang and Delworth, 2006; Mohino et al., 2011; Ting et al., 2011; Martin and Thorncroft, 2014; Martin et al., 2014; Villamayor et al., 2018b; Monerie et al., 2019; Hodson et al., 2022) (Fig. 1c). However relevant, these findings do not clarify whether and how AMV might affect the intraseasonal characteristics of West African summer rainfall. The intraseasonal characteristics, such as the timing of the monsoon season, the rainfall frequency and intensity, and the frequency of different types of events, are particularly important for agricultural planning, especially over the Sahel (Ingram et al., 2002; Sultan et al., 2005; Guan et al., 2015).
Studies have evidenced changes in some intraseasonal characteristics of Sahel rainfall at decadal and longer timescales. Extreme rainfall events over the Sahel have been shown to strongly increase in recent decades (e.g., Ly et al., 2013; Panthou et al., 2014, 2018; Sanogo et al., 2015; Taylor et al., 2017; Blanchet et al., 2018; Diatta et al., 2020; Chagnaud et al., 2022), while trends in extremes for previous periods were less consistent (Ly et al., 2013; De Longueville et al., 2016; Panthou et al., 2013). Results are also contrasting regarding the number of rainy days, with some works suggesting an enhancement in recent decades (Sanogo et al., 2015), while others suggest more stability in the number of rainy days (Panthou et al., 2014, 2018). However, it is not clear to what extent these changes could be related to AMV.
Based on daily gauge records in the 1918–2000 period, Badji et al. (2022) suggest that AMV could indeed be modulating some intraseasonal characteristics of rainfall, including extreme event occurrence, at least over Senegal, located in the westernmost Sahel. However, the unequivocal attribution of observed changes to AMV is hindered by the presence of other sources of long-term SST variability affecting the Sahel (Mohino et al., 2011). In addition, the recent decoupling of the east and west Sahel rainfall recovery since the drought of the 1970–1980s (Lebel and Ali, 2009), which also appears in the trends in the extreme scenarios (Blanchet et al., 2018; Panthou et al., 2018), calls for attention when extrapolating the results obtained regionally for the whole Sahel. The shortness of the observed record, with fewer than two full AMV cycles since the beginning of the 20th century, also hinders the robust estimation of AMV impacts.
Using model simulations provides an additional pathway to evaluate the influence of AMV on West African rainfall when considering other characteristics beyond the seasonal amounts. The modeling approach provides a way to clearly separate the effects of the observed AMV pattern from other sources of long-term variability and allows robust estimations by simulating a large number of ensemble members and longer time spans than the observational short record. Here we take this approach and analyze the output of experiments run with global coupled climate models in which the North Atlantic SSTs are flux-corrected to provide idealized AMV-like anomalies, as proposed in component C of the Decadal Climate Prediction Project (DCPP-C; Boer et al., 2016), which allows for a very consistent AMV forcing across model simulations. Our main aim is to evaluate the impact of the observed AMV pattern on intraseasonal characteristics of rainfall over West Africa. We particularly focus on five intraseasonal characteristics: the number of rainy days, the mean intensity of rainfall, the occurrence of moderate, heavy and extreme rainfall events, and the timing of the monsoon season. We also compare the simulations from different models run under a largely common protocol to provide an additional measure of the robustness of the results.
2.1 Observation-related products used
Three different rainfall datasets are used. To estimate model biases in the representation of rainfall and some of its intraseasonal characteristics, we use GloH2O's Multi-Source Weighted-Ensemble Precipitation version 2.8 (hereinafter MSWEP). It is a globally gridded rainfall dataset at a horizontal resolution of 0.1∘ and temporal resolution of up to 3 h, spanning from 1979 to present. It is derived by merging satellite, reanalysis, and rain gauge data (Beck et al., 2019). MSWEP has been shown to provide the most accurate estimates at a daily resolution over West Africa when compared to other 22 daily rainfall products (Satgé et al., 2020). To estimate the biases, we average the MSWEP dataset over its whole “historical” period (1979–2020) of gauge-corrected data so as to avoid merging with slightly differently processed near-real-time values.
Gridded rainfall estimates are subjected to observational uncertainties coming from different sources (Turco et al., 2020). To account for these uncertainties, we also use the Climate Hazards Group InfraRed Precipitation with Station data version 2.0 (hereinafter CHIRPS). It provides daily gridded rainfall from 1981 to the present at a resolution of 0.05∘ over land between 50∘ N and 50∘ S by blending satellite and gauge estimates (Funk et al., 2015). It shows high performance over West Africa at monthly timescales, though it is outperformed by MSWEP at daily timescales (Funk et al., 2015; Satgé et al., 2020). Here we use the period 1981–2021 to calculate CHIRPS climatological values and compare them with MSWEP ones.
Last, monthly estimates of total rainfall and number of wet days from the Climate Research Unit Time-Series (TS) v.4.06 dataset (hereinafter CRU) are used to estimate the AMV impact in observations. They are based on station observations and provided globally over land, with a resolution of 0.5∘ and span the period from 1901 to the present (Harris et al., 2020). The period used in this work is 1901 to 2013, which is the maximum possible coincident with the AMV index used to provide the boundary conditions for the sensitivity experiments (Boer et al., 2016). In addition, SSTs from the Extended Reconstructed SST dataset version 4 (hereinafter referred to ERSSTv4) are used to estimate the observed AMV pattern. It is a global reconstruction of monthly SSTs provided at a resolution of 2∘ from 1857 to the present (Huang et al., 2015). For consistency with the CRU dataset used to estimate the observed AMV impacts on West African rainfall, in this work we use data from 1901 to 2013.
2.2 Simulations
In the framework of the Coupled Model Intercomparison Project phase 6 (CMIP6 Eyring et al., 2016), the Decadal Climate Prediction Project (DCPP) has coordinated a series of experiments aimed at understanding the variability at decadal timescales (component C; Boer et al., 2016). Here we make use of the AMV experiments in DCPP-C which are 10-year-long coupled simulations run under preindustrial external forcing, in which the model's SSTs are restored in the North Atlantic basin, excluding the Mediterranean Sea, to follow a fixed and idealized pattern of SST anomalies representative of the observed AMV (Boer et al., 2016). The pattern is obtained as the regression of the SSTs onto the standardized AMV index over the 1900–2013 period (Fig. 1b), which is added (subtracted) to the model's preindustrial climatological SSTs for the AMV+ experiment (AMV−) (see technical notes 1 and 2 at https://www.wcrp-climate.org/experimental-protocol, last access: 8 January 2024, for more detailed information). To account for the uncertainty internal to the climate system, for each model, different ensemble members differing in the initial conditions were run (see Table 1 for the ensemble size). Here, we focus on the linear component and estimate the impact of AMV as the change in a given quantity between both experiments. We first calculate the mean along the 10 years of simulation and average all the ensemble members for each experiment. We note that there is no clear drift in rainfall over the Sahel in the simulations (not shown) and that taking 10-year averages allows for a more statistically robust estimation of the impact of AMV, which is already established in the first year of the runs (not shown). We then subtract the AMV− experiment from the AMV+ experiment, which corresponds to a total SST anomaly of twice the AMV regression pattern (Fig. 1a). Though we cannot rule out the idea that nonlinear effects of AMV might be present in the simulations, there is no run with an imposed pattern of no anomalies in the North Atlantic basin to estimate them.
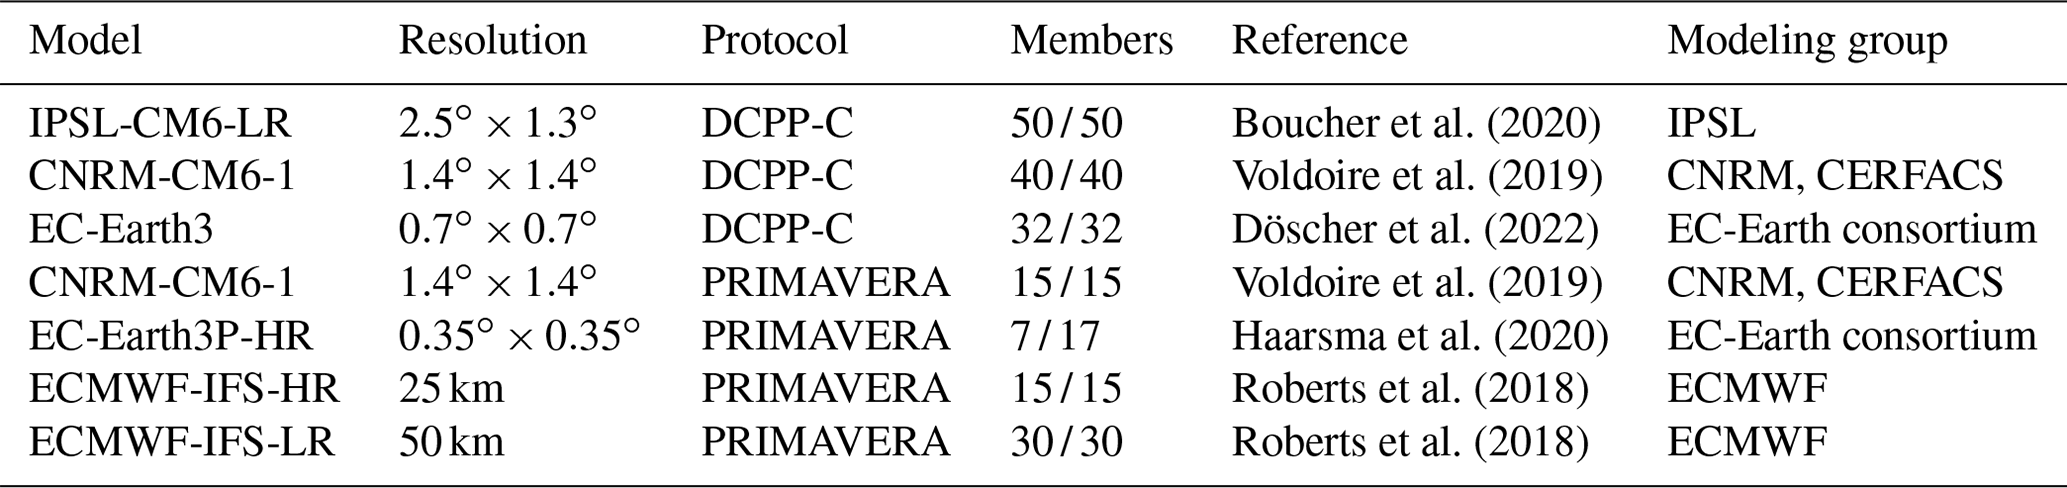
Boucher et al. (2020)Voldoire et al. (2019)Döscher et al. (2022)Voldoire et al. (2019)Haarsma et al. (2020)Roberts et al. (2018)Roberts et al. (2018)Table 1List of models analyzed, along with their atmospheric horizontal resolution (longitude × latitude), the protocol followed, the ensemble size for the positive/negative experiment, the main reference for the model documentation, and the institution involved.
In addition to the DCPP-C experiments, in the framework of EU Horizon 2020 PRIMAVERA project, a similar protocol has been applied to evaluate the dependence of the models' responses on resolution (Hodson et al., 2022). The PRIMAVERA experiments also impose a fixed and idealized anomalous SST pattern for 10-year-long simulations. However, they differ from the DCPP-C protocol in that they impose twice the anomalous AMV patterns and that the model's setup is based on the control 1950 experiment of HighResMIP (Haarsma et al., 2016), which has fixed forcings representative of the 1950s. To ease comparison with the DCPP-C set, changes associated with AMV for these runs are presented as half of the difference between the response to the 2AMV+ minus 2AMV− experiments. We refer to these experiments as the PRIMAVERA protocol. Note, however, that the direct comparison of results from the DCPP-C and PRIMAVERA protocols might be hindered by nonlinearities in both the response to a stronger anomalous pattern and the superposition of this pattern to a different climatological background. To evaluate these potential nonlinearities, we analyze the simulations done by the CNRM-CM6-1 model, which has been run under both protocols (Table 1).
As we aim at exploring the effect of AMV not only on seasonal rainfall amounts but also on its intraseasonal characteristics, here we focus on a subset of the models for which daily rainfall outputs were available (Table 1).
2.3 Metrics
A rainy or wet day is defined as one on which the total amount of rainfall is above 1 mm (Hartmann et al., 2013). This definition has been applied widely over West Africa (e.g., Sanogo et al., 2015; Diaconescu et al., 2015; De Longueville et al., 2016; Diakhate et al., 2019; Diatta et al., 2020; Badji et al., 2022) and is consistent with the World Meteorological Organization recommendations (WMO, 2009). This definition is thus used throughout the study for the simulations and MSWEP and CHIRPS datasets. Note, however, that it differs from the one used in the CRU dataset to obtain the number of wet days, for which the threshold is 0.1 mm (Harris et al., 2020). Here we count the number of wet days (n) in the July to September (JAS) summer season. This season starts just after the average monsoon onset (Sultan and Janicot, 2003) and represents the mature phase of the West African monsoon, when rainfall is well developed in the Sahel (Thorncroft et al., 2011). Conclusions are insensitive to the choice of the start of the summer season, as similar results are obtained when using the extended June to September season (not shown).
As an estimate of the mean intensity of rainfall (I), we use the ratio of the total amount of rainfall accumulated on wet days to the number of wet days in the JAS season (that is, the average rainfall amount per rainy day), which is also referred to as simple daily intensity index (e.g., WMO, 2009; Zhang et al., 2011; Herold et al., 2016).
For consistency with previous works and with the CRU monthly observations, we evaluate the total rainfall in JAS (P) by accumulating daily rainfall for the N=92 d of the season, regardless of the type of day (whether wet or not). We express it as a mean value per day (p; in mm d−1), and we relate it to the number of wet days (n) and in the mean intensity (I) by defining P0 as the total amount of rain (in mm) fallen during non-rainy days (<1 mm), as follows:
The changes in the total amount of rainfall expressed as an average value per day (Δp) between the experiments (AMV+ minus AMV−) can then be related to changes in the number of wet days (Δn) and in the intensity (ΔI) by
where ΔP0 is the difference in the amount of rain (in mm) fallen during non-rainy days (<1 mm), and and are the climatological number of days and intensity, respectively. These climatological values are estimated for each model as the mean of both types of experiment (AMV+ and AMV−). Neglecting the changes in the precipitation falling in non-rainy days and changes coming from the cross-product of anomalies (which are usually smaller than 5 % over West Africa; not shown), we can approximate the change as
where the first term on the right-hand side is the part explained by changes in the number of rainy days with no changes in mean intensity, and the second term is the part explained by changes in the mean intensity with no changes in the number of rainy days.
Rainy days in JAS have been binned in different categories according to the percentiles in the distribution. Moderate (heavy) events are defined as those rainy days for which the amount of rainfall fallen on that day is below (above) the 75th percentile, while for extreme rainfall events the 95th percentile is used. The thresholds for the percentiles are calculated independently at each grid point and take the total number of rainy days available in JAS into account. For the simulations, the threshold calculation for each model includes all days from the full 10 years of simulation, all members, and both AMV+ and AMV− experiments. Here we count the number of moderate, heavy, and extreme rainfall days per JAS season. Note that this methodology, although based on wet-day percentile thresholds, calculates frequency indices. It corresponds to the official recommendation of the World Meteorological Organization (WMO, 2009) and provides results qualitatively consistent with all-day percentiles (Schär et al., 2016).
For the onset, demise, and total length of the monsoon season, we follow Liebmann et al. (2012) and calculate them locally at each grid point, allowing for an annual regime only (we do not consider biannual regimes). This methodology has already been applied to the West African monsoon for observations and model outputs (e.g., Liebmann et al., 2012; Diaconescu et al., 2015; Dunning et al., 2016, 2017). It consists of calculating, for each calendar year, the dates for the minimum and maximum of the daily cumulative rainfall anomaly which provide the onset and cessation dates, respectively, for the season of that year. The total length of the season is given by the difference between the cessation and onset dates. For the simulations, the calculation is performed separately for each year in each ensemble member. For each day of each year (and of each ensemble member in the case of the simulations), the daily rainfall anomaly to be cumulated is obtained as the rainfall for that day minus the long-term climatological mean daily rainfall, using all available years in the observations and all years and ensemble members in both experiments, AMV+ and AMV−, in the models.
For the sake of brevity, the metrics related to the monsoon season are averaged over the Sahel box (orange box in Fig. 1c and d), which is taken in this work as the region 10–20∘ N and 10∘ W–10∘ E. To better compare with the results of Badji et al. (2022) obtained over Senegal and explore possible east–west differences, we also show these metrics for the westernmost Sahel (purple box in Fig. 1c and d, which is taken as the region 10–20∘ N, 17–10∘ W, after removal of the area west of the line connecting the points 12∘ N–17∘ W and 10∘ N–15∘ W). Some metrics are also presented over West African grid points, which are selected as those delimited by the box 5–22∘ N and 17∘ W–25∘ E, excluding the grid points to the west of the line connecting the points 12∘ N, 17∘ W and 5∘ N, 10∘ W (blue box in Fig. 1c and d).
2.4 Statistical significance
To test whether the change in a given quantity is statistically significant, we apply the parametric t test for differences in the means under independence, assuming a Gaussian distribution for the samples (Wilks, 2019). The 10-year-long simulations show a small negative drift in the energy imbalance at the top of the atmosphere, which is related to a positive drift in the outgoing longwave radiation and statistically significant for some models (not shown). For this reason, we do not treat each year of each ensemble member as an independent realization. Instead, we average the 10 years of the simulation and consider each member as an independent realization. The same procedure is followed with all the metrics shown in this paper. The total number of members taken into account for each model is shown in Table 1.
3.1 Representation of West African climatological rainfall and its intraseasonal characteristics by models
Before evaluating the impacts of AMV, we analyze model's biases in representing the timing and distribution of rainfall. Biases are estimated by first averaging the AMV+ and AMV− experiments and then subtracting the observational estimate. All models show a dipole of north-to-south mean JAS rainfall bias over West Africa (Fig. 2). For the CNRM-CM6-1, there is an east-to-west bias superimposed to this pattern. Averaged over the Sahel box, the models provide conditions that are too dry, ranging from deficits of 0.3 mm d−1 for the CNRM-CM6-1 model with the DCPP-C protocol to 1.8 mm d−1 for the EC-Earth3 in DCPP-C and ECMWF-IFS-LR in the PRIMAVERA ones, which roughly represent between 8 % and 60 % of average rainfall over the Sahel from MSWEP (Fig. 3a and b). According to Satgé et al. (2020), at monthly timescales, the CHIRPS dataset presents a smaller bias with respect to gauge-observed rainfall than MSWEP. Figure 2h shows that CHIRPS provides wetter conditions when compared to MSWEP (as do other datasets; not shown), so the above values could be underestimating rainfall dry biases over the Sahel by about 0.5 mm d−1 (Fig. 3a and b). The north-to-south rainfall biases, which are still a common feature of CMIP6 models (Fiedler et al., 2020), are consistent with the warm biases of SST simulated by all models in the southeastern tropical Atlantic, which reach values well over 2 ∘C (not shown). These warm biases are a prominent feature of the current generation of general circulation models (Richter and Tokinaga, 2020; Farneti et al., 2022), were also present in previous model generations like CMIP5 (Mohino et al., 2019; Farneti et al., 2022), and are related to a southward shift in the ITCZ over West Africa with reduced precipitation over the Sahel and enhanced precipitation over the Gulf of Guinea (Losada et al., 2010; Richter and Tokinaga, 2020). The comparison of atmosphere-only and coupled atmosphere–ocean simulations performed in Roberts et al. (2018) with the ECMWF-IFS-LR and ECMWF-IFS-HR models provides further evidence to suggest that the north-to-south rainfall biases over West Africa are related to biases in SSTs.
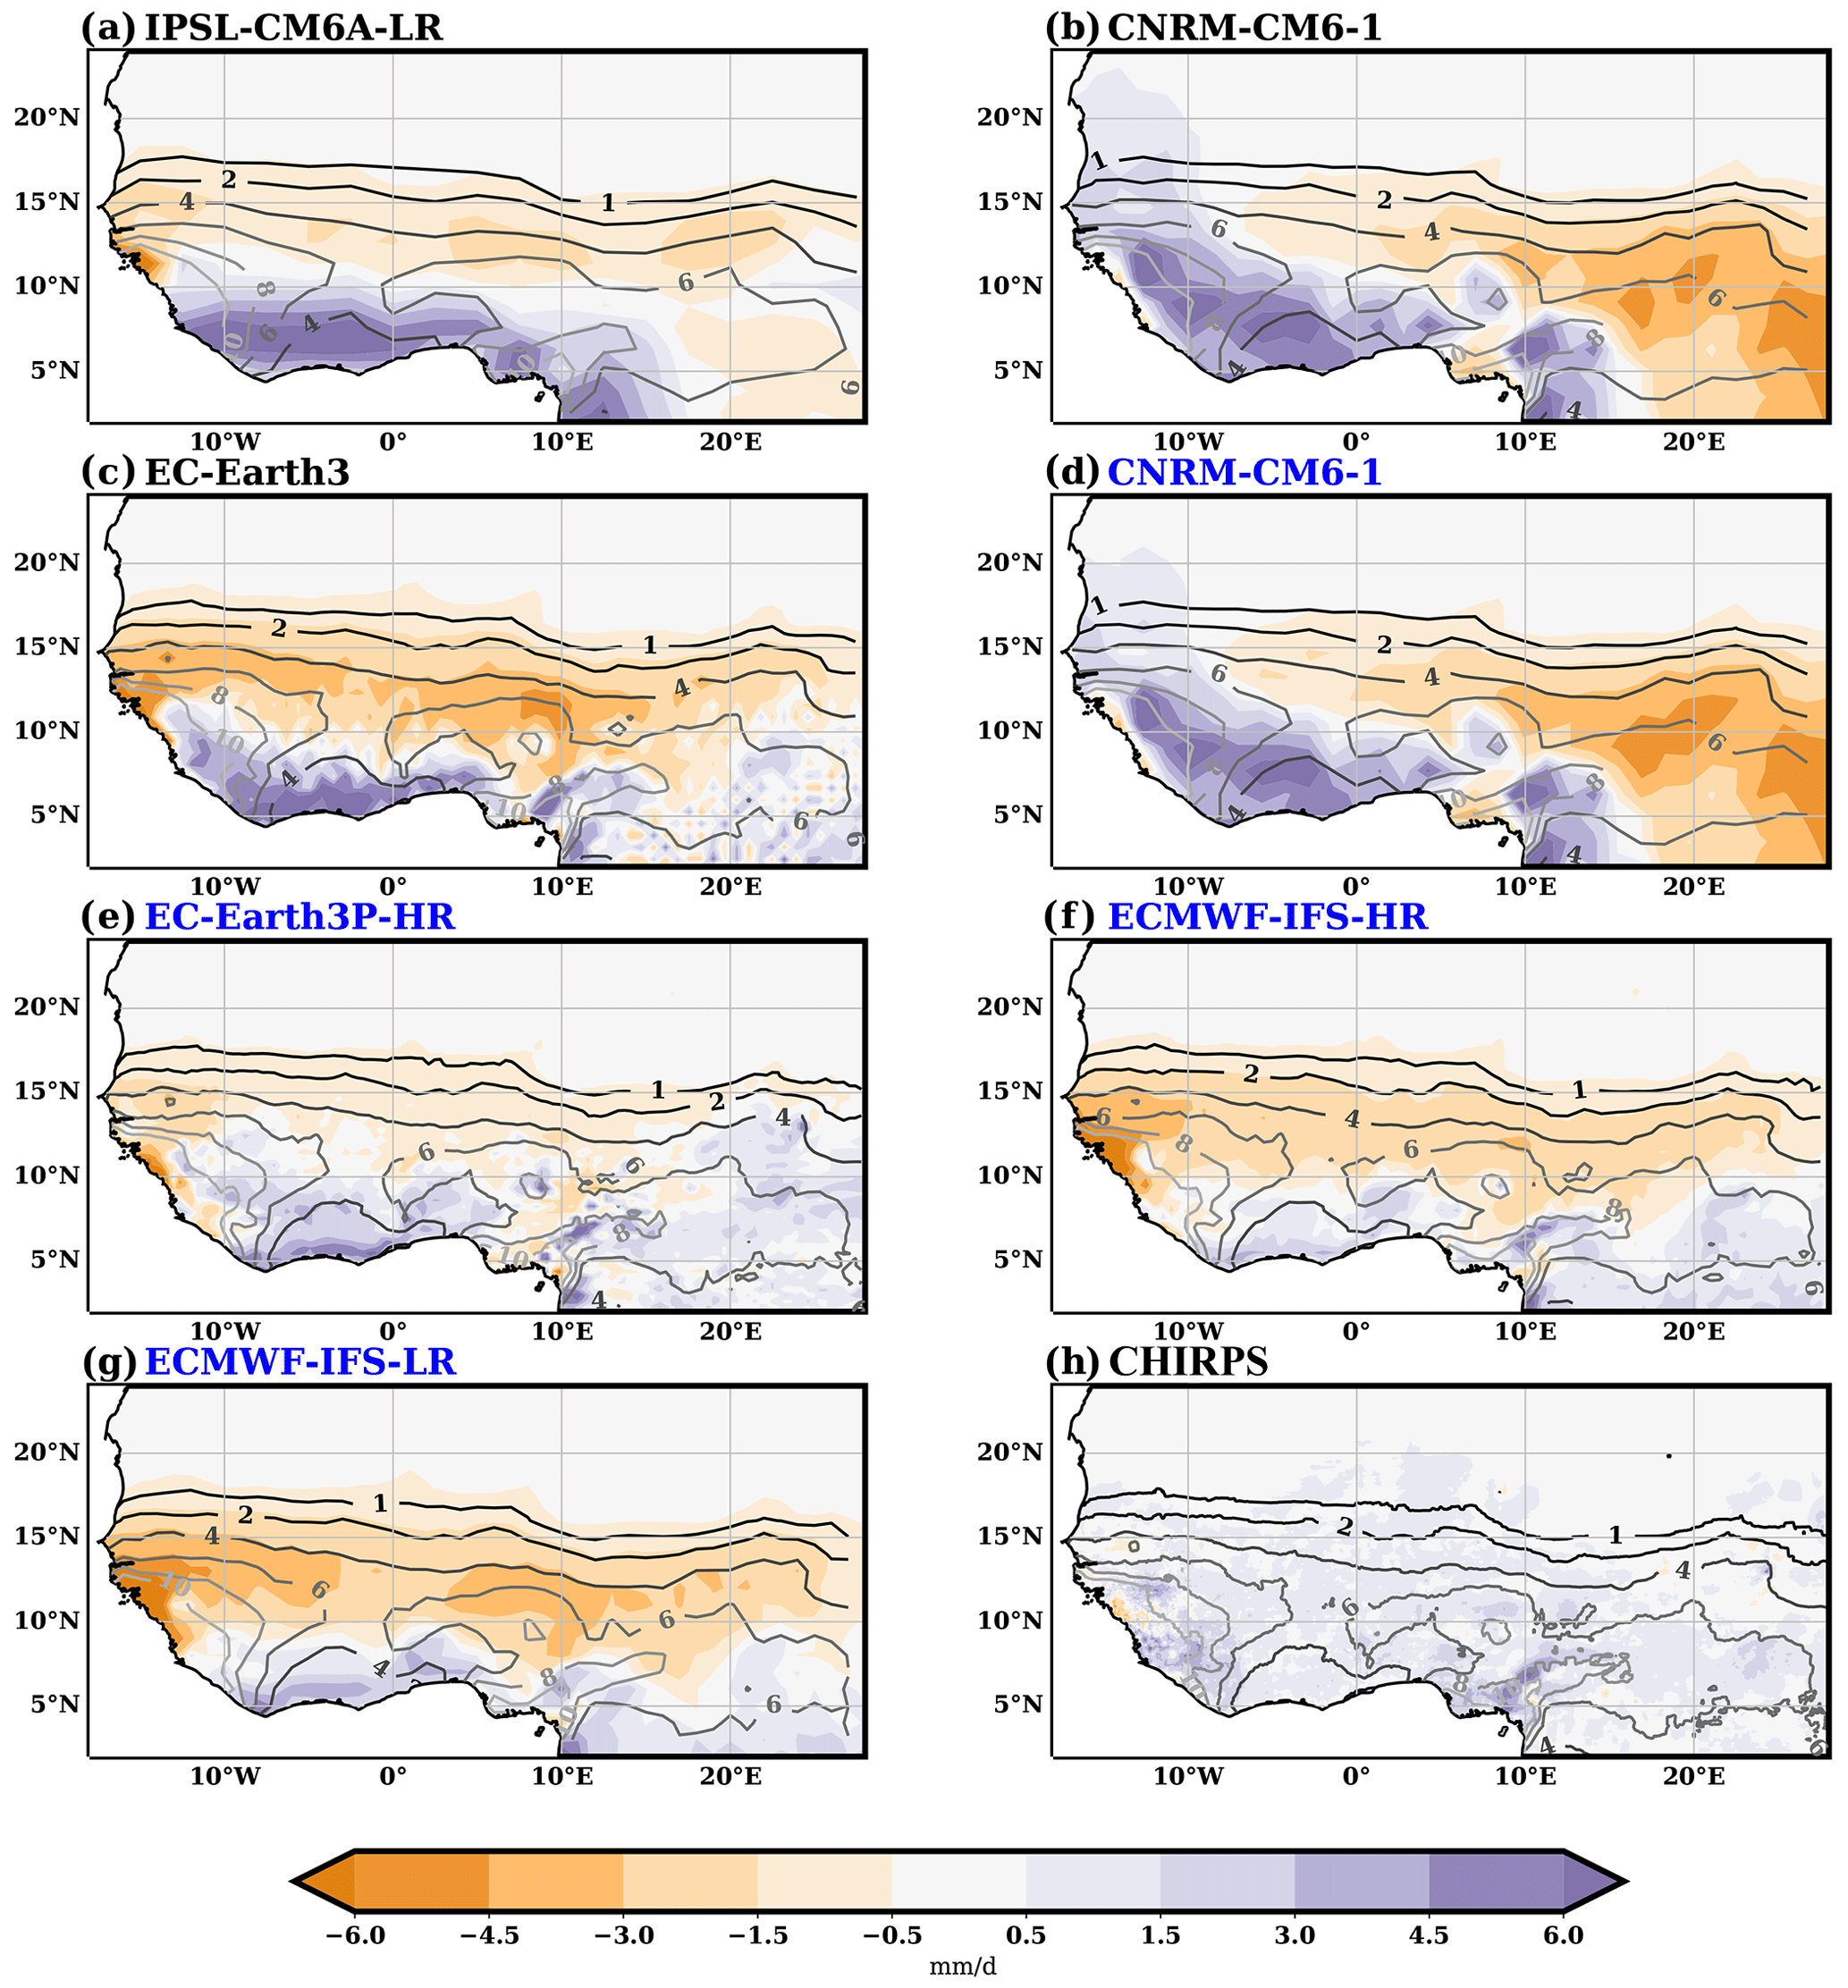
Figure 2Biases in mean seasonal July to September (JAS) rainfall simulated by the models (mm d−1; shaded) with respect to the MSWEP estimate in the period 1979–2020. As an estimate of observation uncertainty, panel (h) shows the difference between CHIRPS (1981–2021) and MSWEP seasonal rainfall. In all panels, the contours mark the MSWEP JAS seasonal rainfall (contour values of 1, 2, 4, 6, 8, and 10 mm d−1) interpolated into the model's grid (or CHIRPS). The simulations following the PRIMAVERA protocol are marked blue in the model name labels.
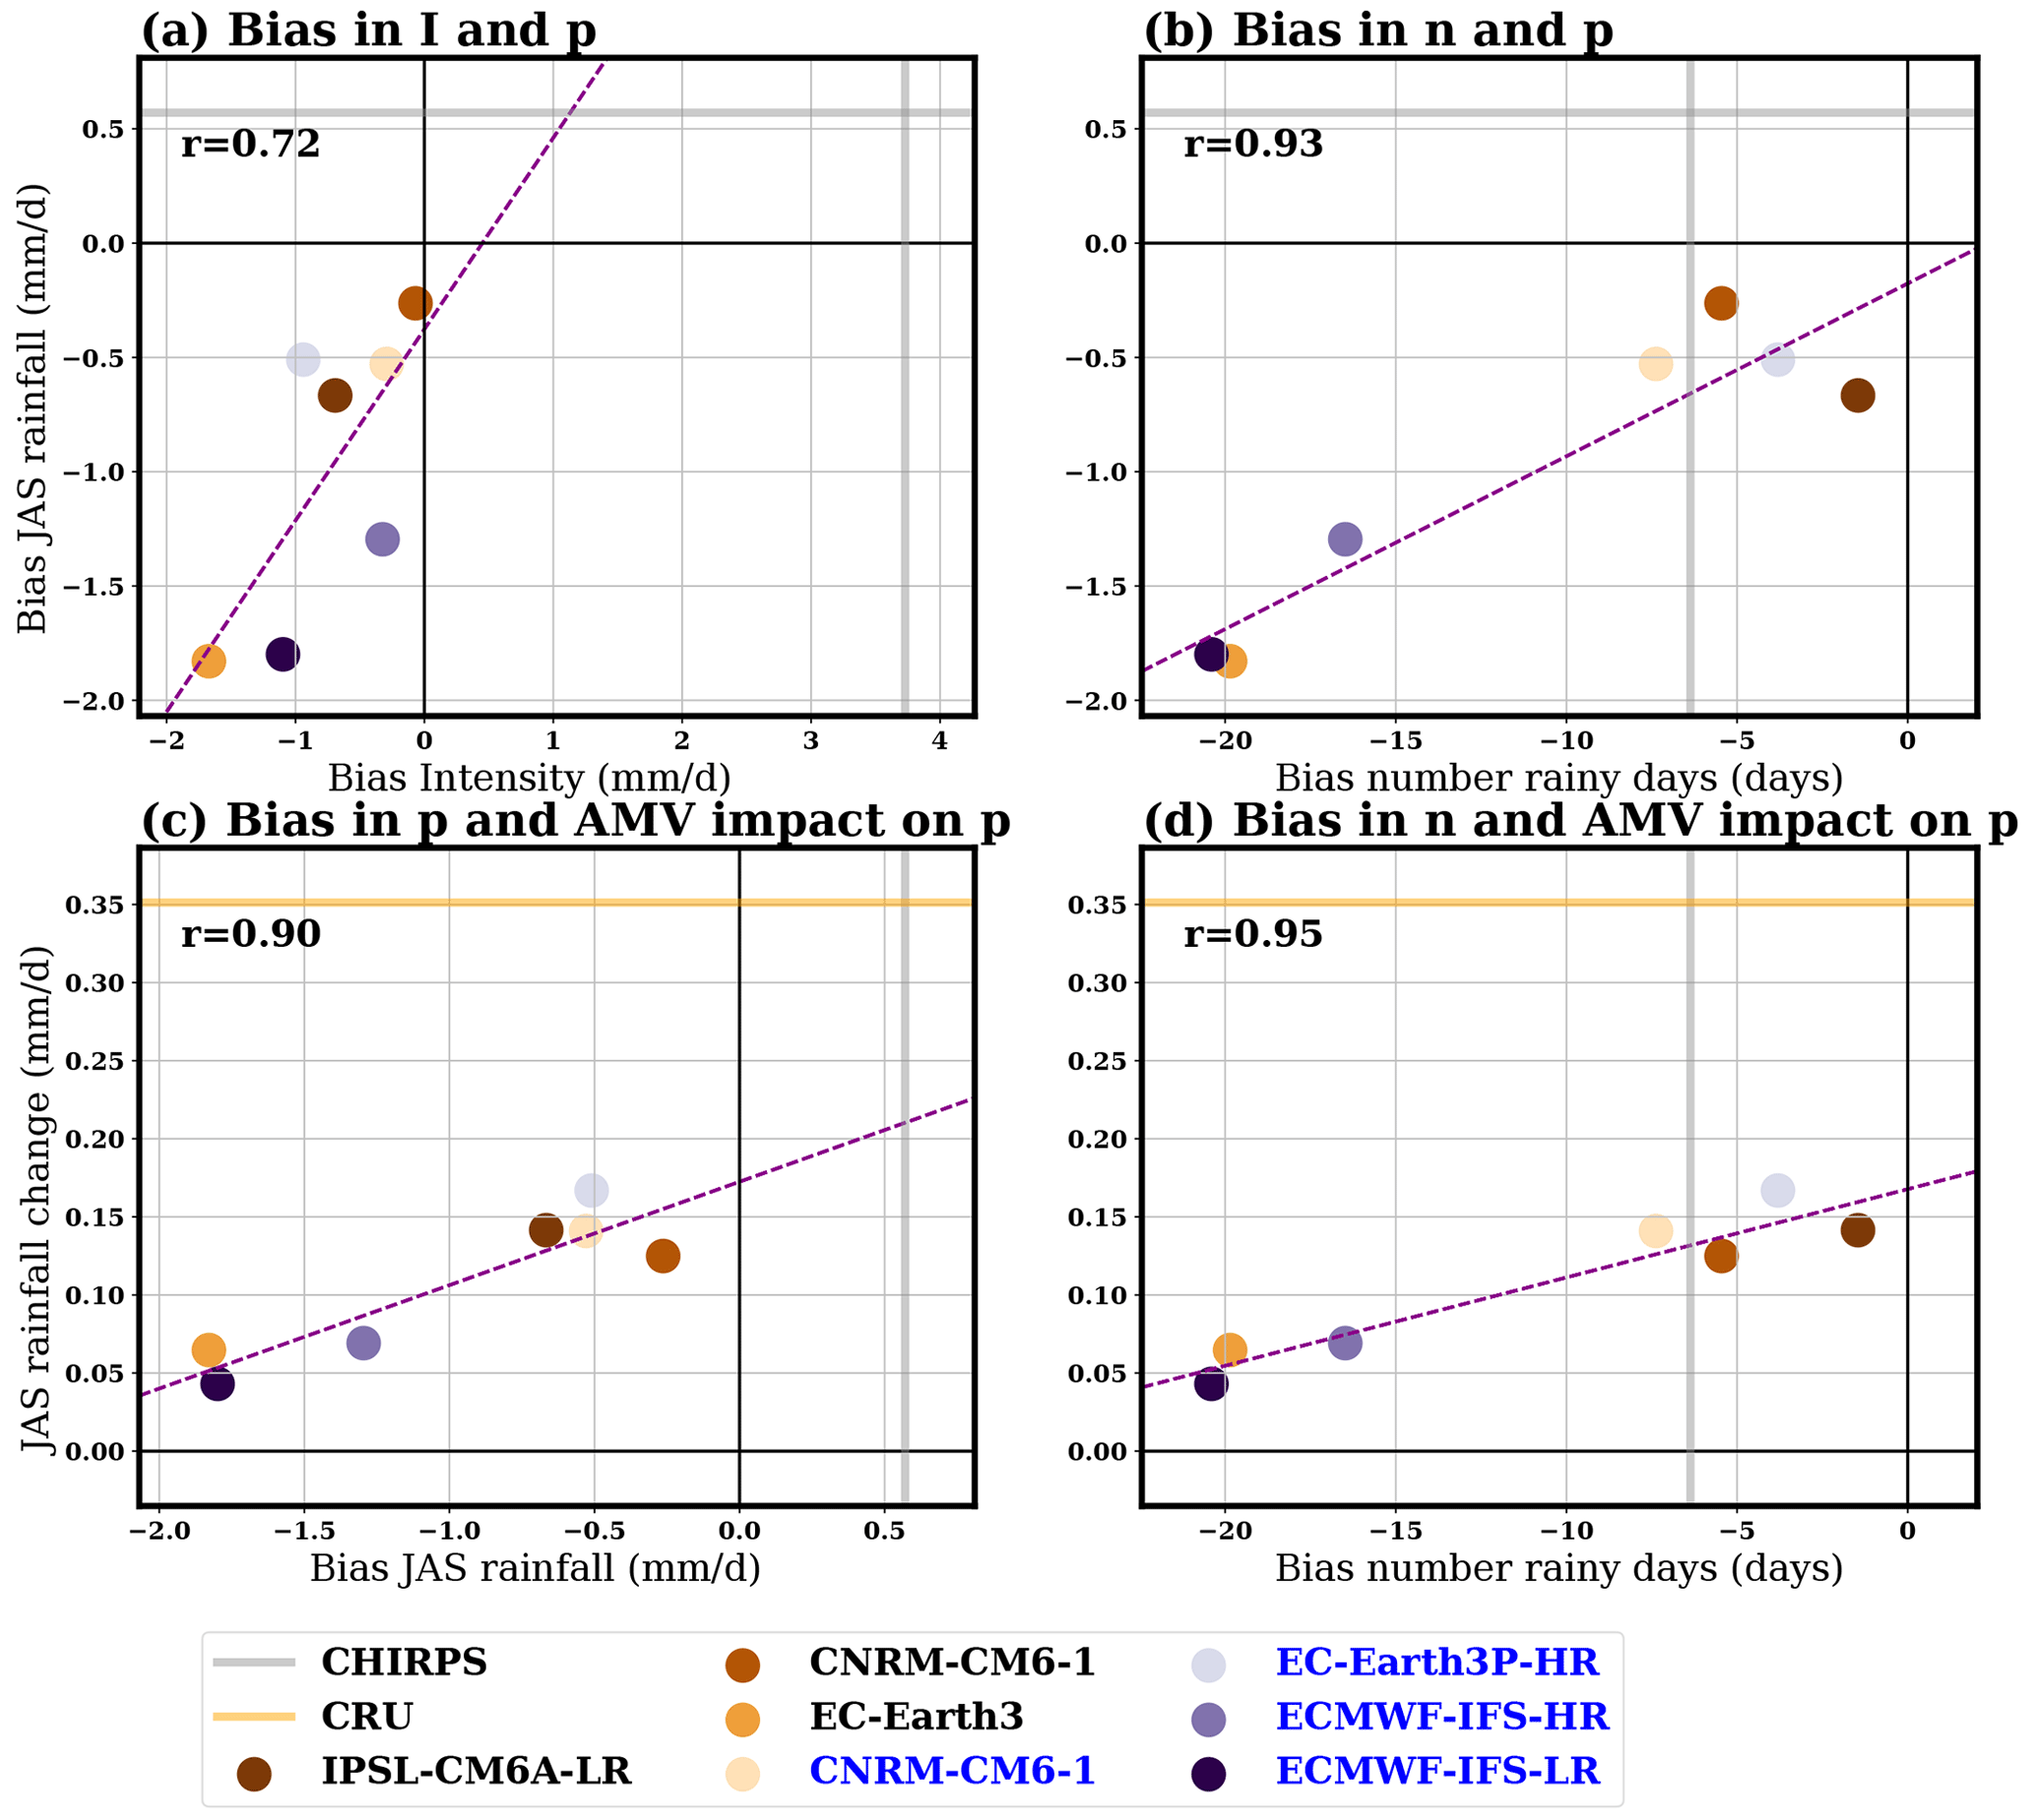
Figure 3Scatterplot of box averages over the Sahel (defined as the region between 10–20∘ N and 10∘ W–10∘ E; see orange box in Fig. 1c and d). The first line shows biases in JAS mean rainfall (mm d−1) versus biases in mean intensity on rainy days (mm d−1) (a) and the number of rainy days (d) (b). The second line shows the AMV+ minus AMV− response in JAS mean rainfall (mm d−1) versus biases in JAS mean rainfall (mm d−1) (c) and the number of rainy days (d) (d). Biases are calculated as differences to the MSWEP dataset. For reference, the average mean JAS rainfall, mean intensity of rainfall, and number of rainy days in this dataset in the 1970–2020 period are 3.0 mm d−1, 6.1 mm d−1, and 37 d, respectively. For simulations following the PRIMAVERA protocol (marked blue in the model name labels), only half the anomalous values are shown for the AMV response. The dashed line in each plot shows the least squares linear fit. The corresponding correlation coefficient is shown at the top left of each plot. Observational estimates for CHIRPS and CRU are shown in the plots with gray and orange lines, respectively.
According to MSWEP, the number of rainy days in the JAS season (92 d in total) ranges between above 90 d over the western coast of Guinea to fewer than 10 in the northern fringe of the Sahel (see contours in Fig. 4). On average over the Sahel, it provides 37 rainy days per season. Satgé et al. (2020) show that MSWEP is the dataset most consistent with gauge rainfall daily records over the Sahel, precisely concerning the detection of rainy days. The CHIRPS dataset shows consistent results over the northern Sahel (Fig. 4h). However, the number of rainy days is smaller south of 15∘ N, especially over the Gulf of Guinea region (Fig. 4h), despite the enhanced total seasonal amount of rainfall in CHIRPS with respect to MSWEP (Fig. 2h). The pattern of differences between CHIRPS and MSWEP is similar to the one obtained with two other daily rainfall datasets, the African Rainfall Climatology version 2 (ARC2; Novella and Thiaw, 2013) and the Global Precipitation Climatology Project (GPCP) Analysis Climate Data Record version 1.3 (Adler et al., 2017; not shown). On average, CHIRPS shows a reduction of 6 d in the number of rainy days over the Sahel with respect to MSWEP (Fig. 3b), which amounts to an underestimation of nearly 20 %.
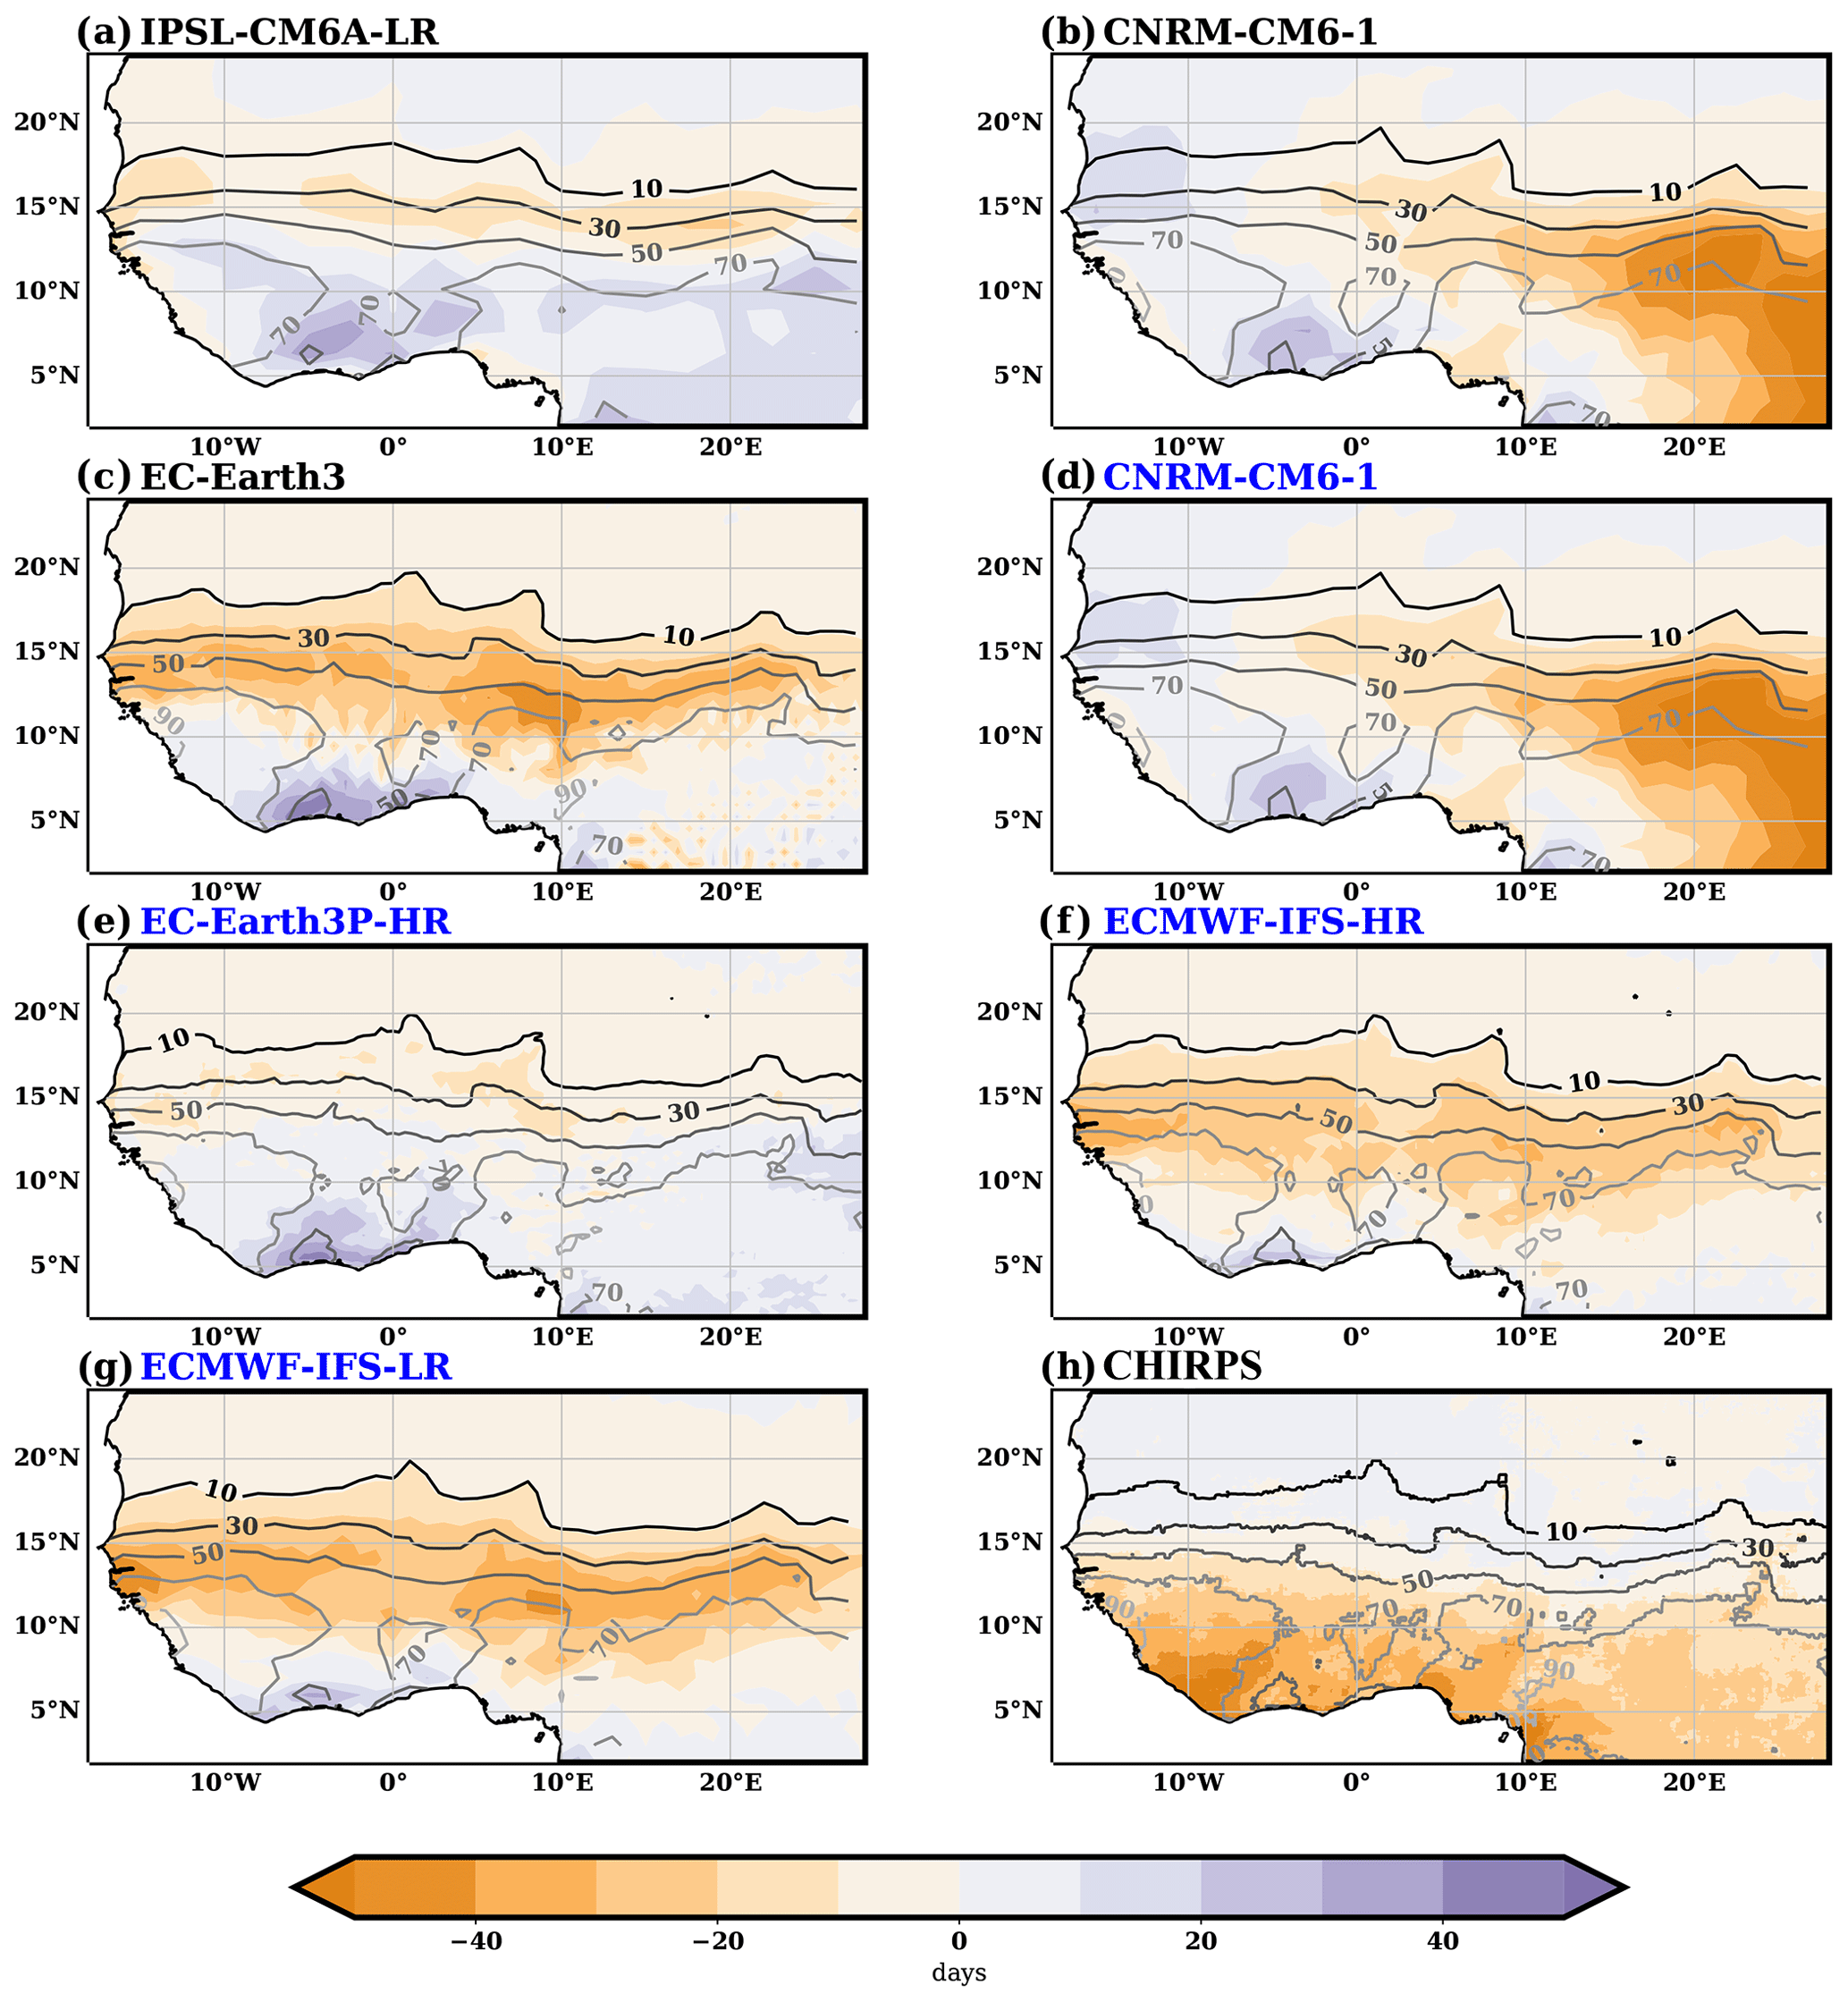
Figure 4Biases in the number of rainy days per JAS season simulated by the models (day; shaded) with respect to MSWEP estimates in the period 1979–2020. As an estimate of observational uncertainty, panel (h) shows the difference between the CHIRPS (1981–2021) and MSWEP seasonal number of rainy days. In all panels, contours mark the MSWEP JAS number of days per season (contour values every 20 d, starting from 10 d). The simulations following the PRIMAVERA protocol are marked blue in the model name labels.
The pattern of model biases in the number of rainy days is consistent with the one for the total seasonal rainfall, with an underestimation in the northern Sahel, an overestimation towards the south in both magnitudes (Figs. 2 and 4a–g), and a superposed east-to-west pattern the case of the CNRM-CM6-1 model. Taking CHIRPS differences with MSWEP as a measure of observational uncertainty, the models clearly overestimate the number of rainy days in the coastal region of Côte d'Ivoire (Fig. 4). On average, over the Sahel, models present an underestimation in the number of rainy days per season, ranging between 1 and 20 d for the IPSL-CM6–LR and ECMWF-IFS-LR models, respectively (Fig. 3b). However, only in the case of EC-Earth3, ECMWF-IFS-HR, and ECMWF-IFS-LR models is this underestimation well beyond observational uncertainty. This suggests that, over the Sahel, the underestimation in seasonal rainfall amounts cannot be only related to the models' tendency to underestimate the number of rainy days.
According to the MSWEP database, the mean intensity of rainfall falling on rainy days ranges from well above 12 mm d−1 in the western coast, close to the Fouta Djallon and Guinea highlands, to below 4 mm d−1 north of 18∘ N (see contours in Fig. 5). Rainfall mean intensity is much higher for CHIRPS over the whole West African region, especially in the Guinea coast, with differences of over 12 mm d−1, which is more than double the estimates obtained from MSWEP locally. Though both datasets show weaker differences in the mean intensity over the Sahel (nearly 4 mm d−1 on average; Fig. 3a), it still represents more than a 60 % increase in CHIRPS with respect to MSWEP estimates. According to Satgé et al. (2020) and the previous results, this difference between datasets could come from both an underestimation of rainy days in CHIRPS and an underestimation of rainfall amounts in MSWEP. In addition, the comparison of extreme rainfall from different datasets for Burkina Faso performed by Sanogo et al. (2022) suggests that MSWEP could be underestimating very extreme rainfall values, thereby affecting its estimates of mean rainfall intensity.
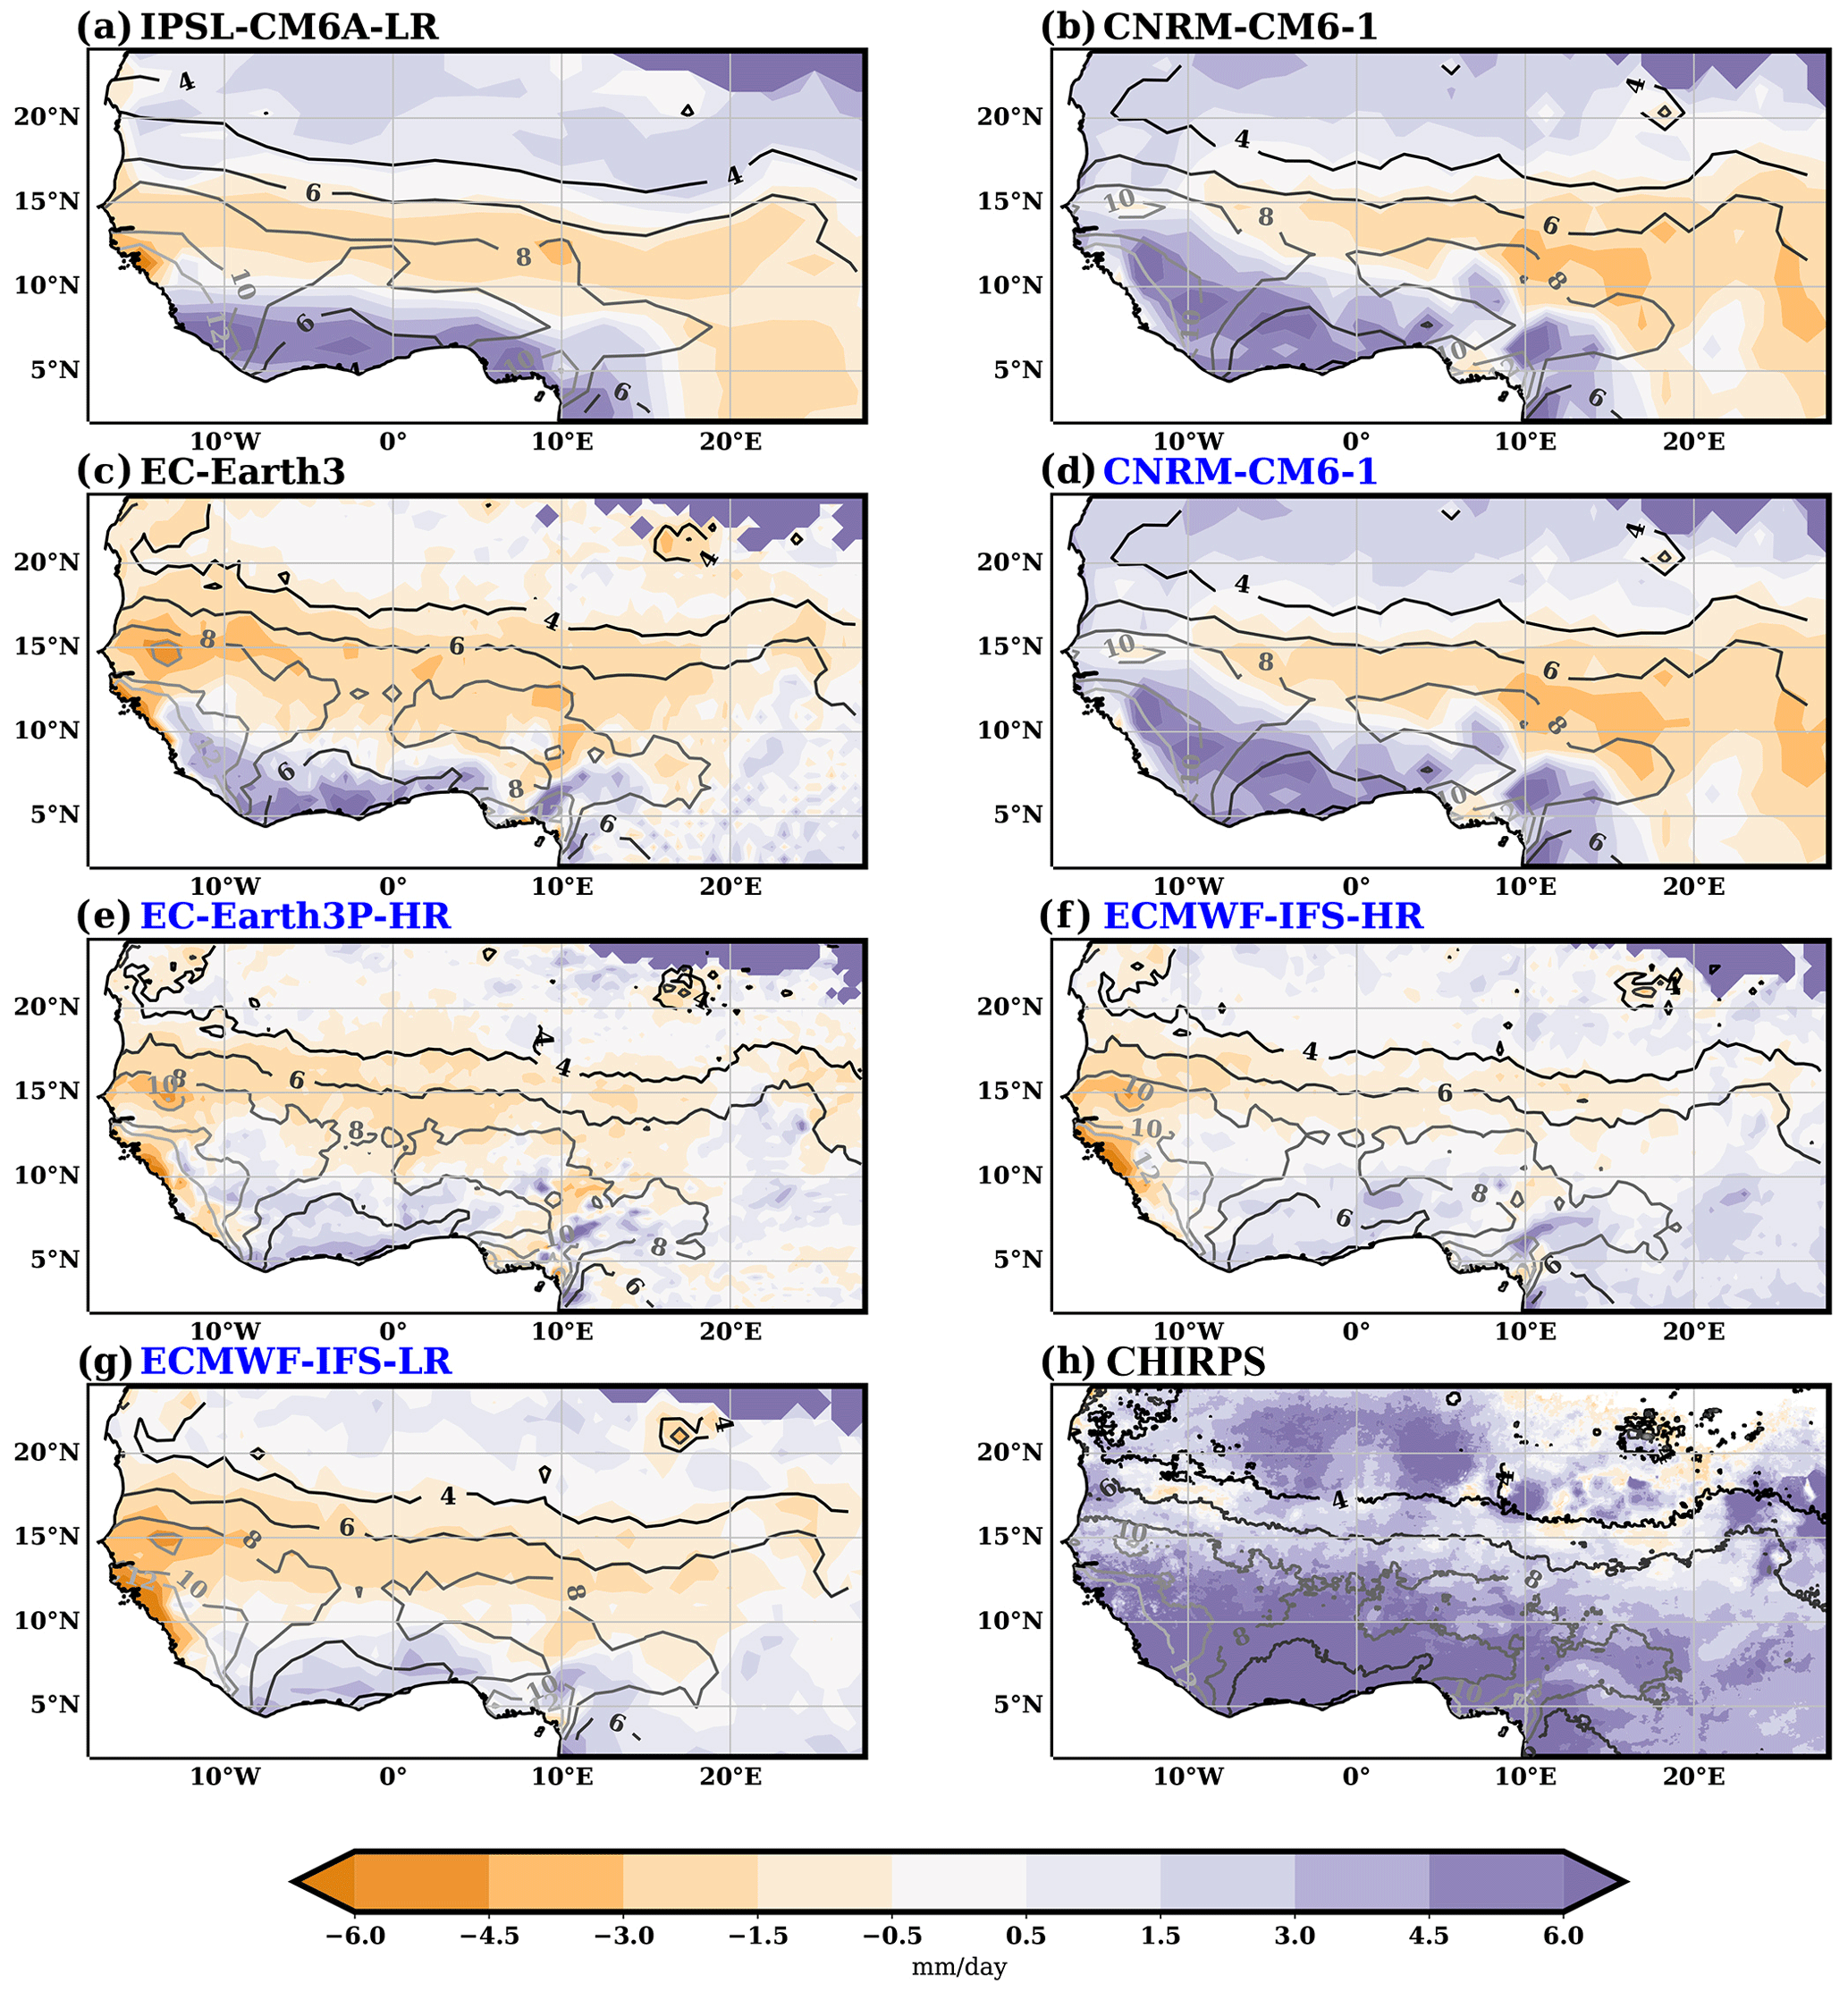
Figure 5Biases in the mean intensity of rainfall (taking only rainy days into account) in JAS as simulated by the models (mm d−1; shaded) with respect to MSWEP estimates in the period 1979–2020. As an estimate of observational uncertainty, panel (h) shows the difference between the CHIRPS (1981–2021) and MSWEP mean intensity of rainfall. In all panels, contours mark the MSWEP JAS intensity of rainfall (contour values every 2 mm d−1, starting from 4 up to 12 mm d−1). The simulations following the PRIMAVERA protocol are marked blue in the model name labels.
Once again, the bias pattern in the mean rainfall intensity in models is consistent with the one for total seasonal rainfall (compare Figs. 2 and 5), with an underestimation of intensity over the Sahel (and to the east of West Africa in the CNRM-CM6-1 model) and an overestimation over the Guinea coast. However, looking at the differences between CHIRPS and MSWEP (Fig. 5h), the latter is well within the observational uncertainty. This suggests that the overestimation of seasonal rainfall over the Gulf of Guinea could be more clearly linked to an overestimation of the number of rainy days simulated by models rather than an overestimation of the mean intensity of events. Regarding the Sahel region, most models underestimate the mean intensity well beyond the observational uncertainty (Fig. 3a). The average underestimation with respect to MSWEP in this region ranges from 0.07 mm d−1 for the CNRM-CM6-1 model in the DCPP-C protocol (slightly above 1 % of the MSWEP estimate) to 1.7 mm d−1 for the EC-Earth3 (approximately 28 % of the MSWEP estimate).
Even though the systematic negative bias in seasonal JAS rainfall shown by models over the Sahel is more consistent with a systematic underestimation of mean rainfall intensity when taking into account the observational uncertainty as discussed above, the spread in the models' simulated JAS seasonal rainfall seems to be better explained by the simulated number of rainy days (compare Fig. 3a and b); models that simulate higher amounts of total accumulated rainfall throughout the JAS season tend to be those models that simulate a higher number of rainy days, and also those that tend to simulate a higher intensity per rainy event, but the linear regression strength as measured by the correlation coefficient is higher in the first case. This could be connected to a higher disparity in the number of rainy days simulated by the models (a spread of roughly 70 %, taking into account a range of 19 d for a multimodel mean of 27 d per season) than in the intensity (a spread of roughly 30 %, as measured by a range of 1.6 mm d−1 for a multimodel mean of 5.4 mm d−1). The linear regression fit obtained across the models is more consistent with observational estimates from MSWEP than those from CHIRPS (compare the interception of the regression fit with the observational lines). Note that these results should be carefully reviewed, as the actual degrees of freedom are low due to the low number of models available with daily rainfall data and the redundancy of models with similar models under different resolutions, configurations, or protocols.
Despite the differences shown by MSWEP and CHIRPS datasets in the JAS total seasonal rainfall, number of rainy days, and, especially, the mean rainfall intensity, they both agree on the average monsoon season timing over the Sahel (Fig. 6a). The average onset date is 12 (13) June, the average cessation date is 20 (23) September, with a total monsoon season length of 100 (102) d for the MSWEP (CHIRPS) dataset. Most models show average onset dates that are consistent with the observational estimates over the Sahel, except for the CNRM-CM6-1 in both protocols and the EC-Earth3P-HR in PRIMAVERA, which delay the onset by about 21 and 17 d on average, respectively (Fig. 6a). This is due to a later monsoon onset over the whole Sahel region in these models, while the IPSL-CM6A-LR, EC-Earth3, ECMWF-IFS-HR, and ECMWF-IFS-LR models show a dipole bias with an onset that is too late to the south of the box and too early to the north, which cancels out when averaging (not shown). Regarding the average cessation date over the Sahel, the ECMWF-IFS–HR, ECMWF-IFS-LR, and especially the EC-Earth3 advance it by about 21, 28, and 39 d, respectively (Fig. 6a). For each model, the biases for the cessation date are quite consistent over the whole Sahel region, and there is no cancellation effect as for the onset in some models (not shown). This leads to very similar biases in the cessation date when averaged over the westernmost Sahel (Fig. 6b). This tendency of some models to delay the onset and of others to advance the cessation dates over the Sahel results in a majority of them underestimating the total length of the monsoon season by between 15 d (CNRM-CM6-1) and 40 d (EC-Earth3), quite consistently across the region (not shown), with the sole exception being the IPSL-CM6A-LR that has a slight overestimation of about 8 d.
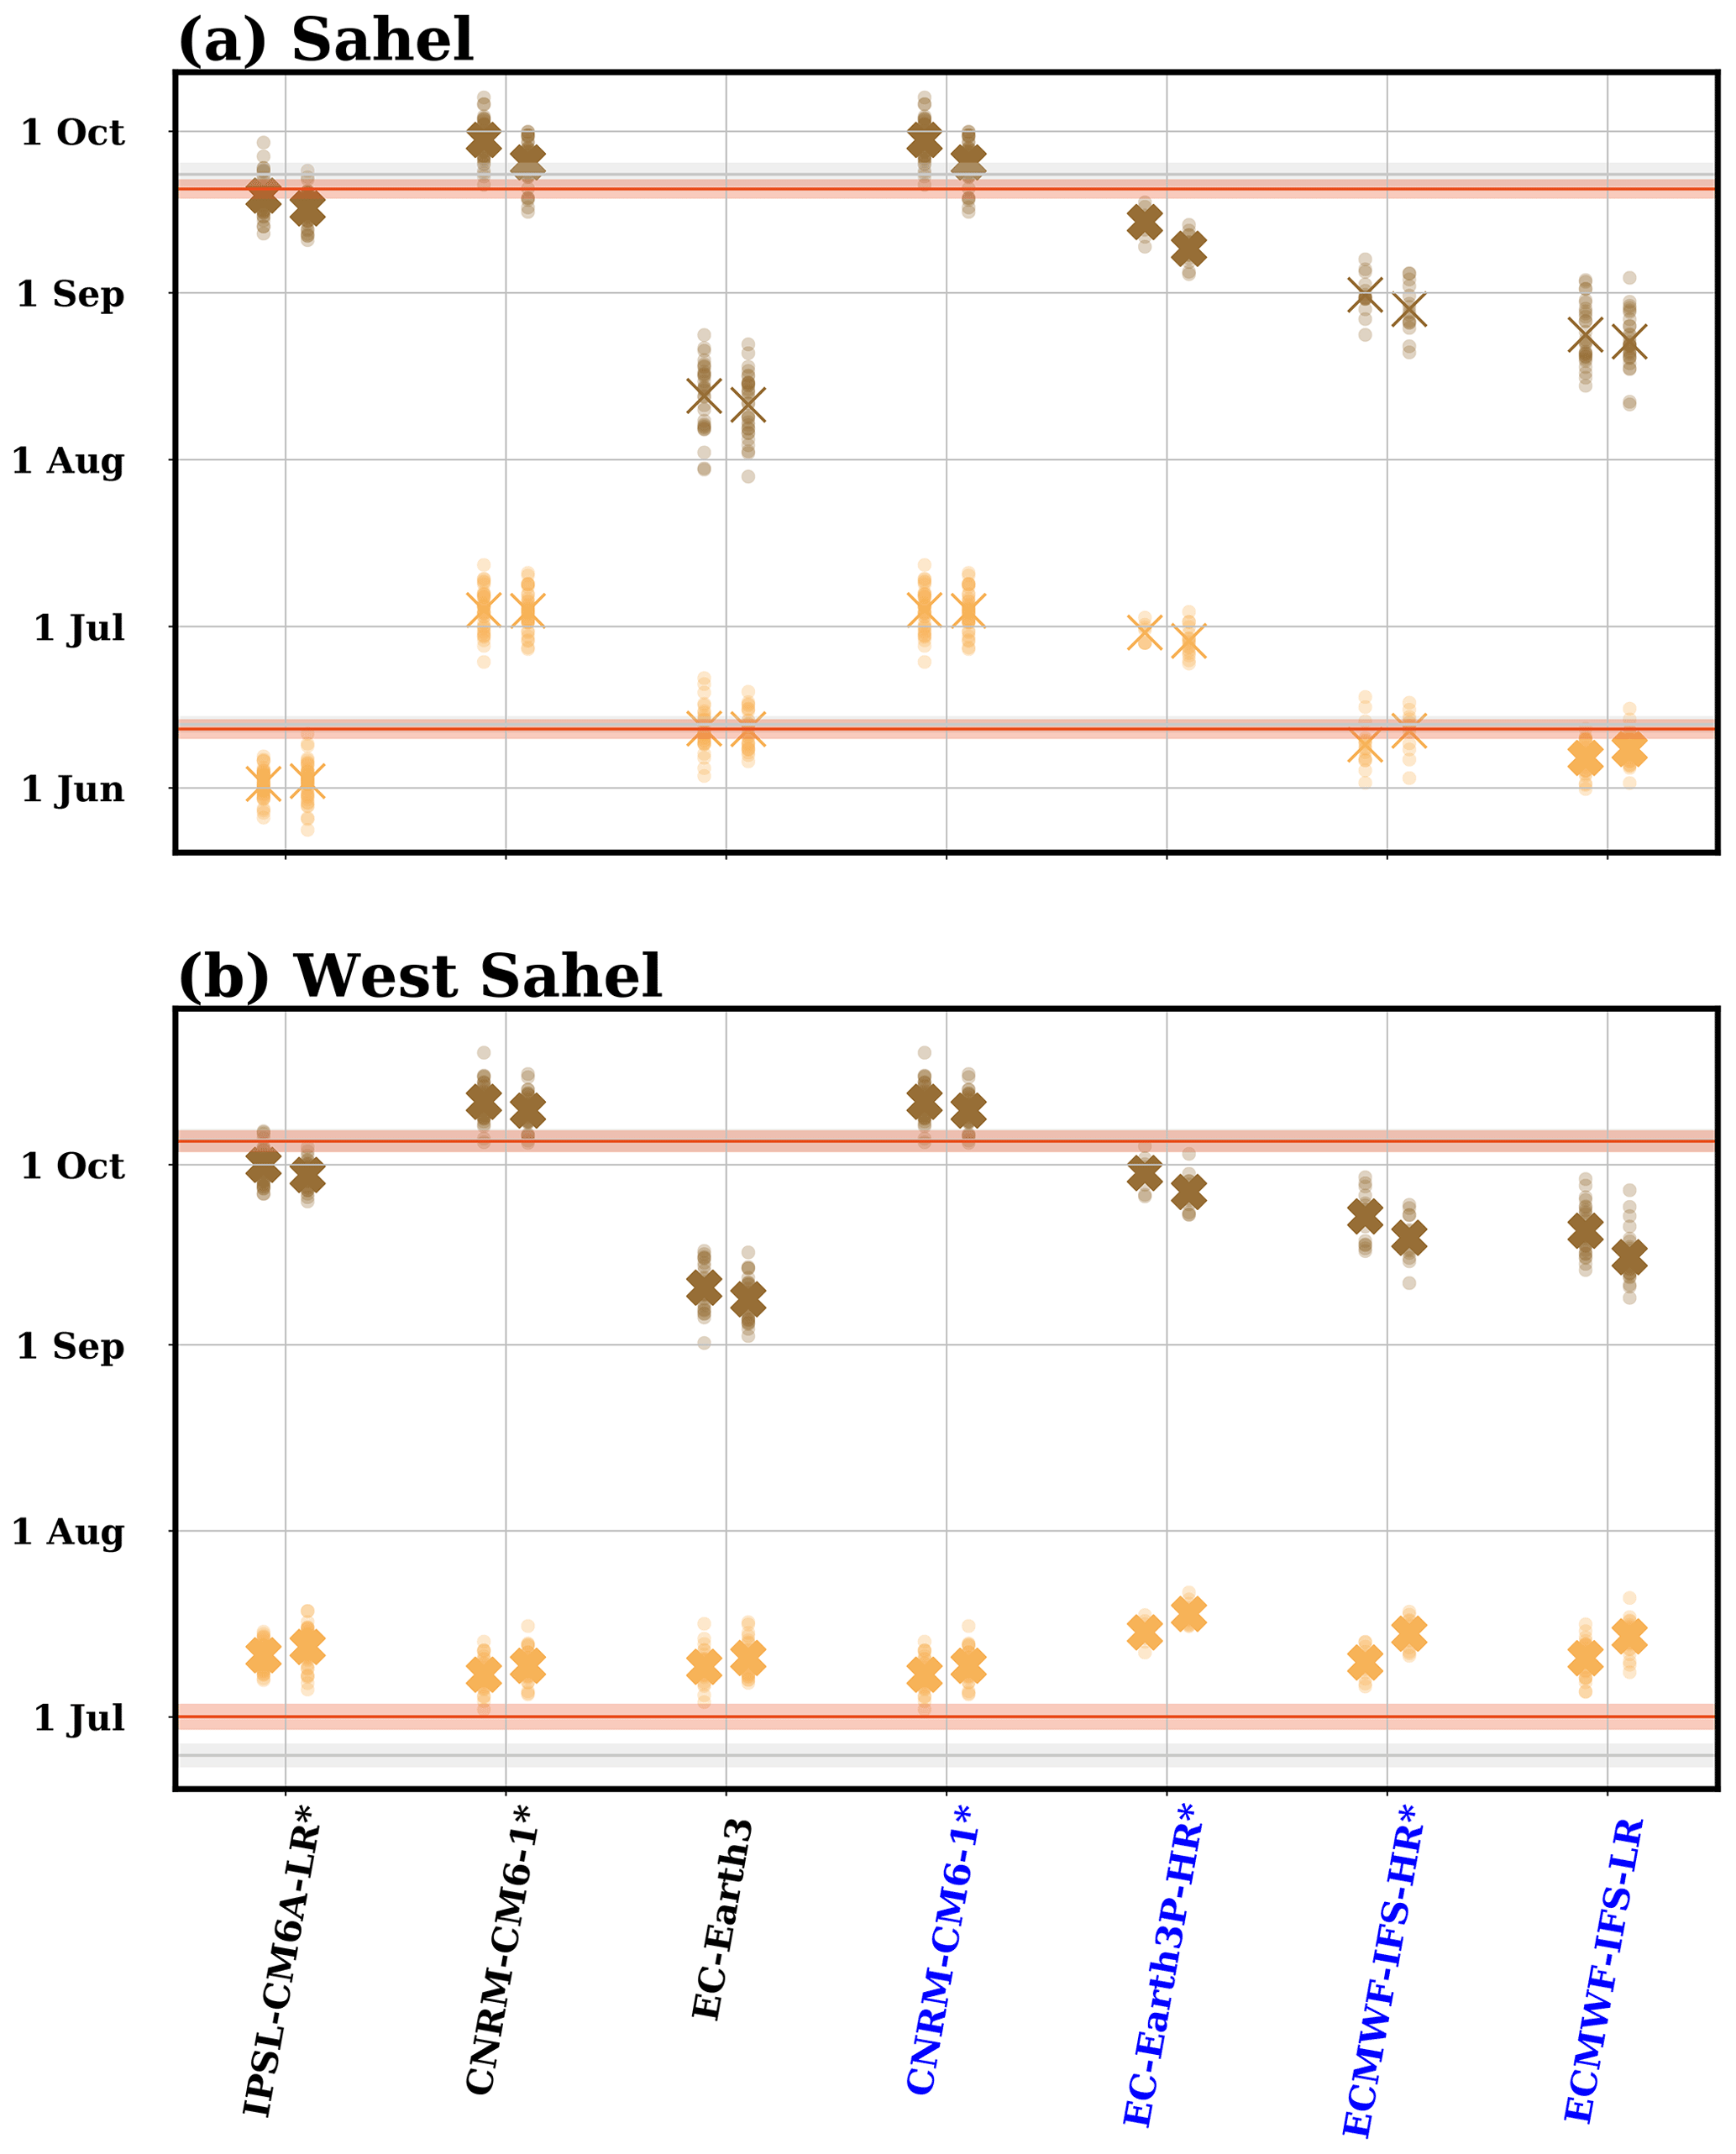
Figure 6Dates for the monsoon onset (orange) and demise (brown) in models averaged over the (a) Sahel (defined as the area 10–20∘ N and 10∘ W–10∘ E; see red box in Fig. 1c and d) and (b) westernmost Sahel (10–20∘ N, 17–10∘ W, after removal of the area west of the line connecting the points 12∘ N–17∘ W and 10∘ N–15∘ W; see purple box in Fig. 1c and d) for the simulations. PRIMAVERA simulations are marked blue in the model labels. The values for the AMV+ simulation are shown slightly to the left of the corresponding axis for each model, while the ones for the AMV− simulation are located to the right. Small circles show the averages for 10 years in each ensemble member, while big crosses show the values averaged over all ensemble members. Crosses are bold if the AMV+ minus AMV− differences are statistically significant (p<0.05). Values of monsoon onset and demise are shown for the rainfall estimates obtained from MSWEPv280 (red line; climatology 1979–2020) and CHIRPS (gray line; climatology 1981–2021). Shading indicates the standard deviation of 10-year running mean values (so that they can be compared with 10-year means for each ensemble). The asterisk in the names of the models indicates that the AMV+ minus AMV− difference in the length of the monsoon is statistically significant (p<0.05) when averaged over the Sahel box. The differences in the length of the season for the westernmost Sahel box are all statistically significant (p<0.05).
3.2 Impacts of AMV on West African seasonal rainfall
Models agree on a general enhancement of rainfall in the AMV+ simulation with respect to the AMV− one over West Africa (Fig. 7), which is consistent with previous studies using a similar set of simulations (Hodson et al., 2022). All models show the biggest enhancements over the west coast and coastal parts of southern Senegal, Guinea-Bissau, and Guinea. Inland, the pattern of change tends to overlay the climatological values, with anomalies smaller than 0.1 mm d−1 to the north of the climatological contour of 1 mm d−1 and anomalies growing stronger to the south of this contour line. Yet, when looking at the percentage of change in rainfall relative to the climatological amount, then this tendency is inverted from changes that represent approximately 10 % close to the climatological contour line of 1 mm d−1 and decreasing to the south of this line (not shown). The core of maximum positive anomalies in JAS seasonal rainfall tends to be located at around 10∘ N, close to the climatological contour values between 4 and 8 mm d−1, from where they tend to decrease towards the south. They even turn negative over the West African south coast, next to the Gulf of Guinea, in the EC-Earth3P-HR and, to some extent, the IPSL-CM6-LR models. This behavior is connected to a general response of the models to AMV by shifting northward the Atlantic ITCZ, leading to positive anomalies over West Africa and negative ones over the Gulf of Guinea, most prominent over the ocean (not shown). Models also show discrepancies, such as the response over the Guinea Highlands, with the CNRM-CM6-1 and, most notably, the EC-Earth3P-HR models showing negative changes, while the rest of the models simulate an enhancement.
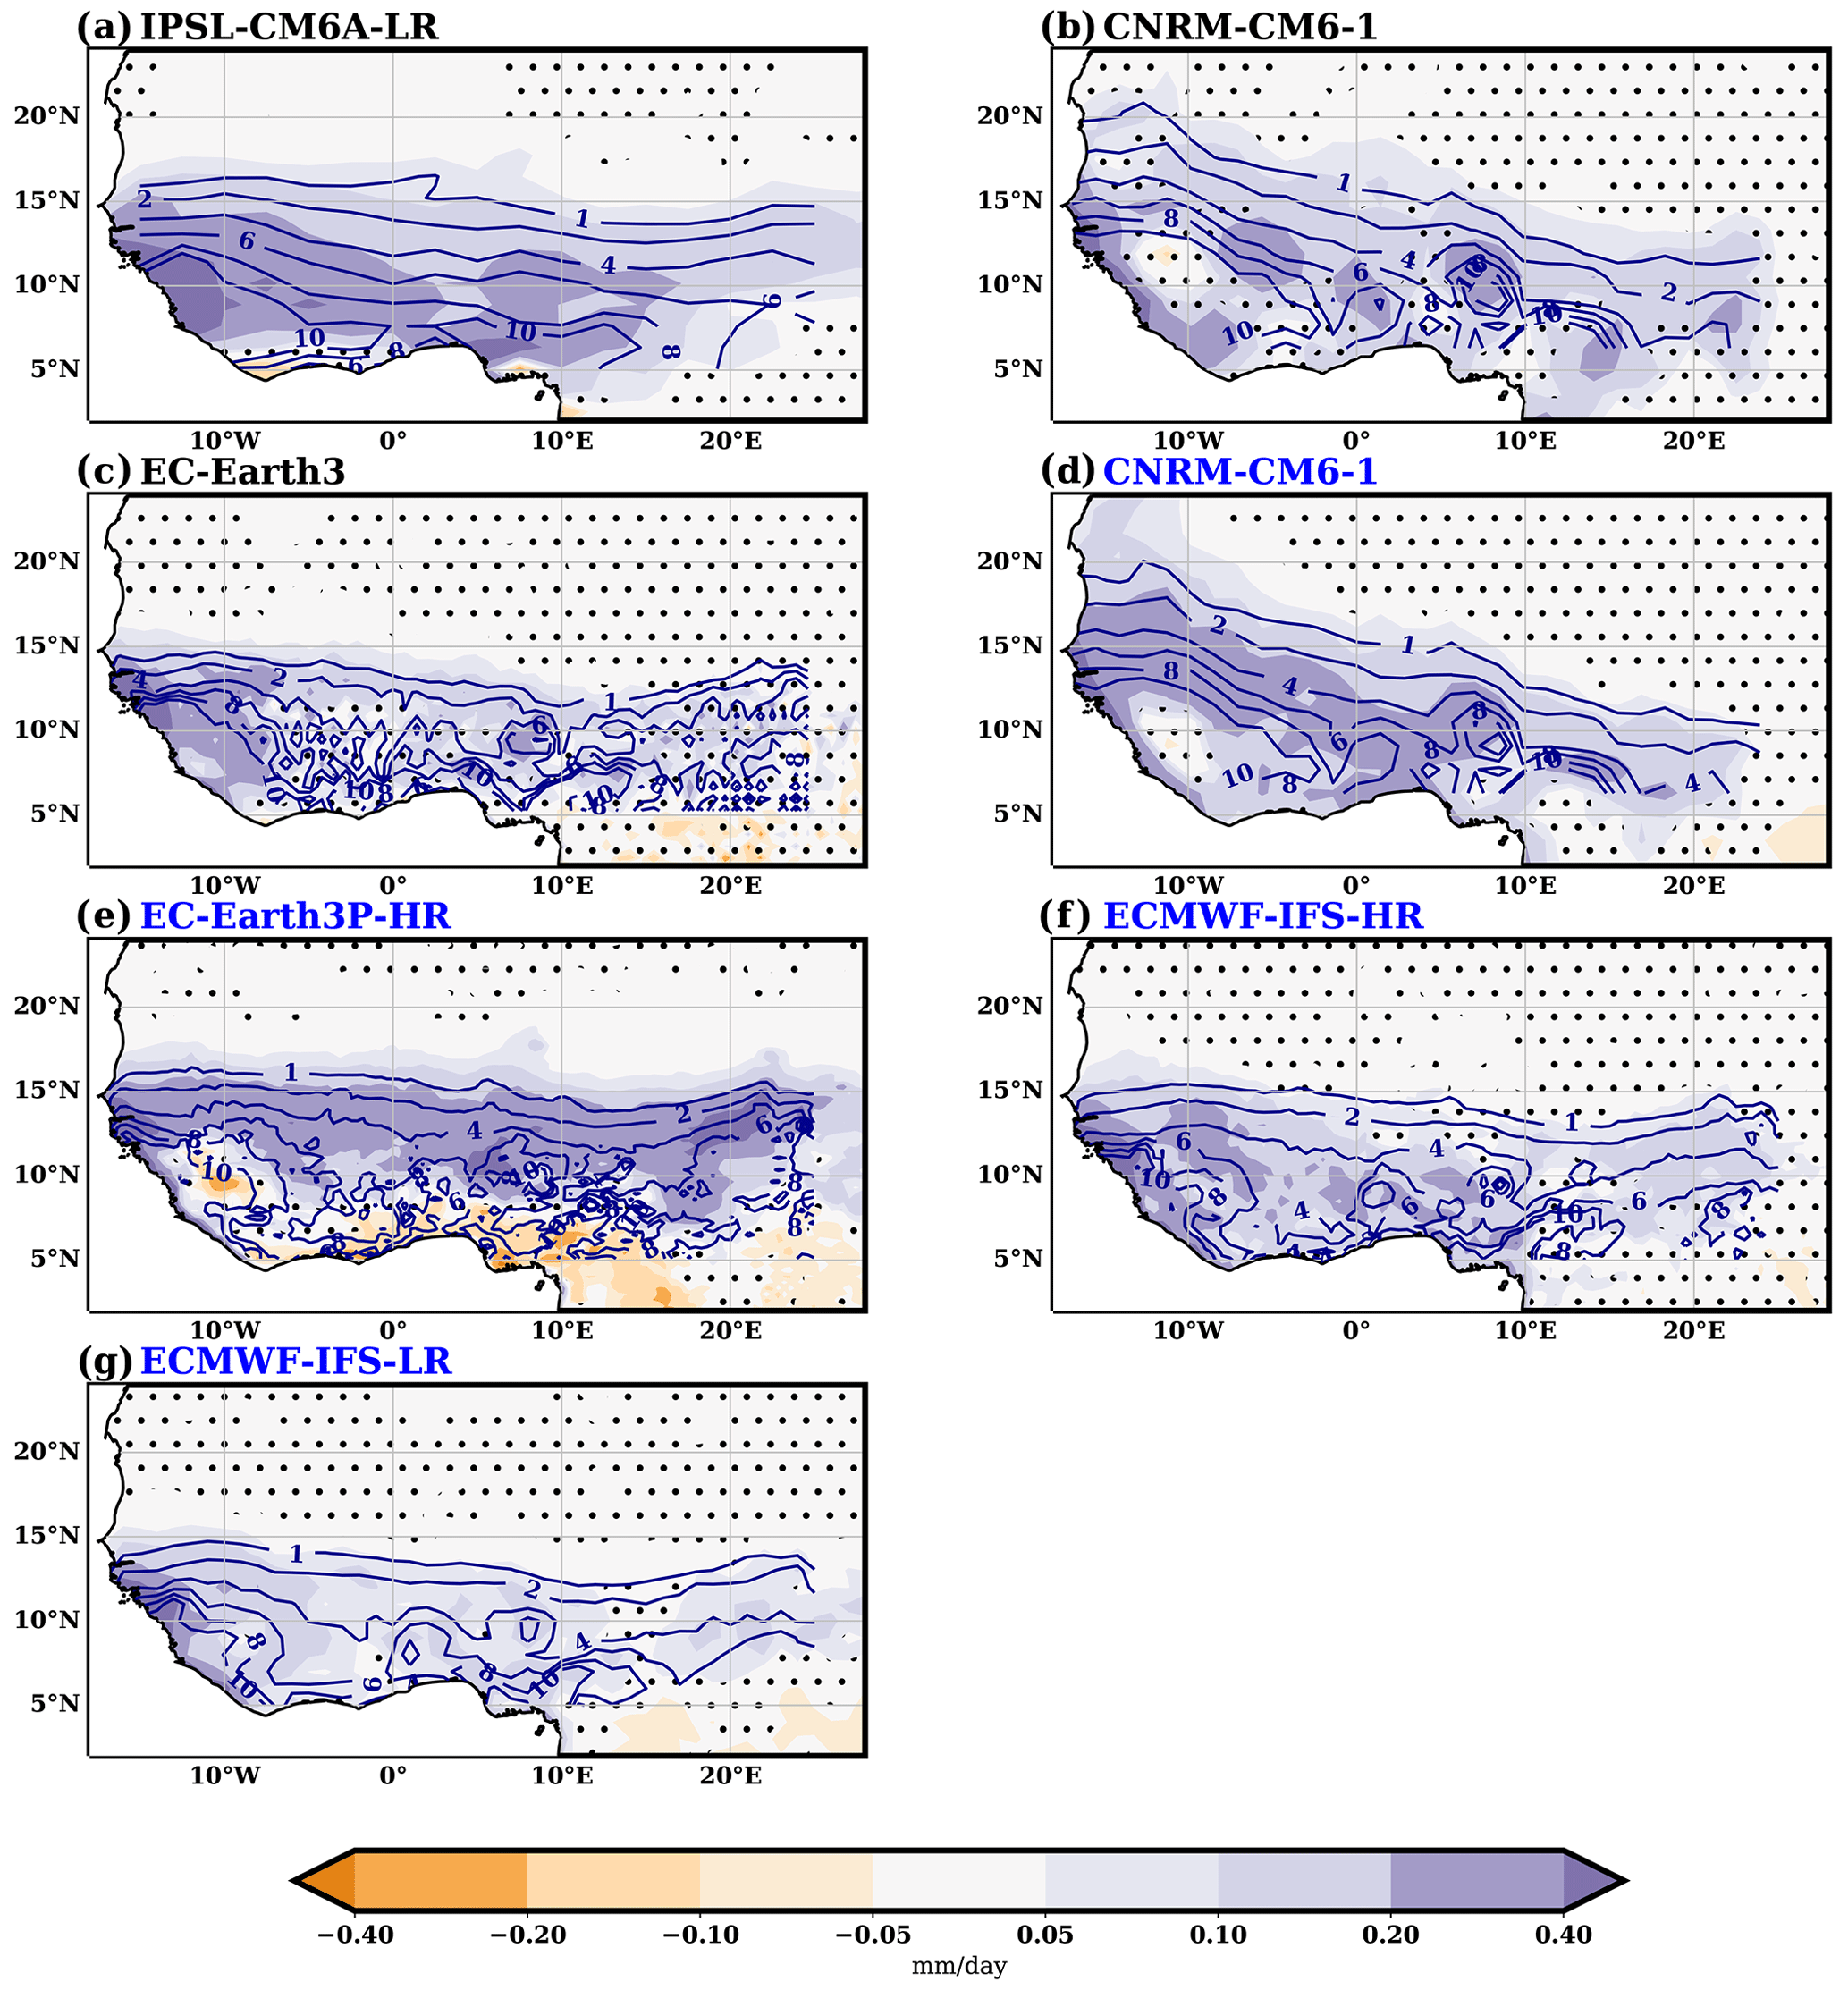
Figure 7Difference in mean JAS seasonal rainfall between AMV+ and AMV− experiments (shaded; mm d−1). For simulations under the PRIMAVERA protocol (marked blue in the model name labels), only half the anomalous values are shown. Contours mark the climatological values of mean JAS seasonal rainfall (contour values of 1, 2, 4, 6, 8, and 10 mm d−1). Regions where differences are not statistically significant (p<0.05) are dotted.
Taking into account the different model climatologies, the general pattern of rainfall anomalies associated with the AMV is consistent with the one obtained in observations (compare Figs. 7 and 1c). However, the magnitudes of changes over the Sahel tends to be underestimated in models (note that levels of the color bar in Fig. 7 are half the ones in Fig. 1c). While the average Sahel rainfall change between the AMV+ minus AMV− estimated from the observations is 0.35 mm d−1, the models range between 0.04 mm d−1 for the ECMWF-IFS-LR (only 12 % of the observation estimate) and 0.17 mm d−1 for the EC-Earth3P-HR (48 % of the observation estimate; Fig. 3c and d). The underestimation is also present when comparing changes expressed as a percentage of the climatological values (not shown).
The spread in the response in seasonal JAS rainfall of the models to the AMV pattern seems related to the spread in the simulated climatological values, as models with weak values of the latter tend to provide weak values of the former (Fig. 3c). The link is even stronger with the climatological number of rainy days (Fig. 3d), while it is very low with biases in the mean intensity (correlation coefficient of 0.40). However, when extrapolating the linear regression, even if models were able to provide the highest possible observed climatological number of rainy days or total seasonal rainfall, the expected response to AMV would still be strongly underestimating the observed estimated response (Fig. 3c and d). In addition, the AMV pattern of SST depicted in Fig. 1a also shows loads in other regions away from the North Atlantic. One such region is the Mediterranean Sea, where warm anomalies have been shown to promote enhanced rainfall over the Sahel (e.g., Rowell, 2003; Fontaine et al., 2010, 2011; Gaetani et al., 2010). This fact could further separate the observed estimated response from the simulated one.
3.3 Impacts of AMV on the intensity and number of rainy days over West Africa
All models simulate a general increase in the number of rainy days over West Africa in response to a positive AMV (Fig. 8). Over the Gulf of Guinea, changes tend to be weak or they even become negative in some models, while the increase in the number of rainy days is stronger for the northern fringe of the JAS seasonal rainfall anomalies over the Sahel. The pattern is similar to the estimate obtained from the observations (Fig. 1d), which is itself similar to the one obtained for the mean seasonal rainfall in the same observations (Fig. 1c) and consistent with Biasutti (2019). Averaged over the Sahel, model responses to AMV range from 0.5 d in the ECMWF-IFS-LR model to 1.2 d for the CNRM-CM6-1 model in the PRIMAVERA protocol, while the observational estimate is 1.5 d. Though models tend to underestimate the observations (ranging from 31 % to 85 % of the CRU observational estimate), the underestimation is smaller than for the mean rainfall. Note that a direct comparison between the models and the observation is hindered by the different definitions of rainy days used (the threshold for the former is 1 mm d−1, while for observations is 0.1 mm d−1). The patterns obtained are, however, very similar to the ones presented in Fig. 8 when using the same threshold in the simulations as in the CRU dataset to define a rainy day (0.1 mm d−1; not shown), with a range of the averaged impact over the Sahel between 0.5 d in the ECMWF-IFS-HR model and 1.5 d for the CNRM-CM6-1 model in the PRIMAVERA protocol.
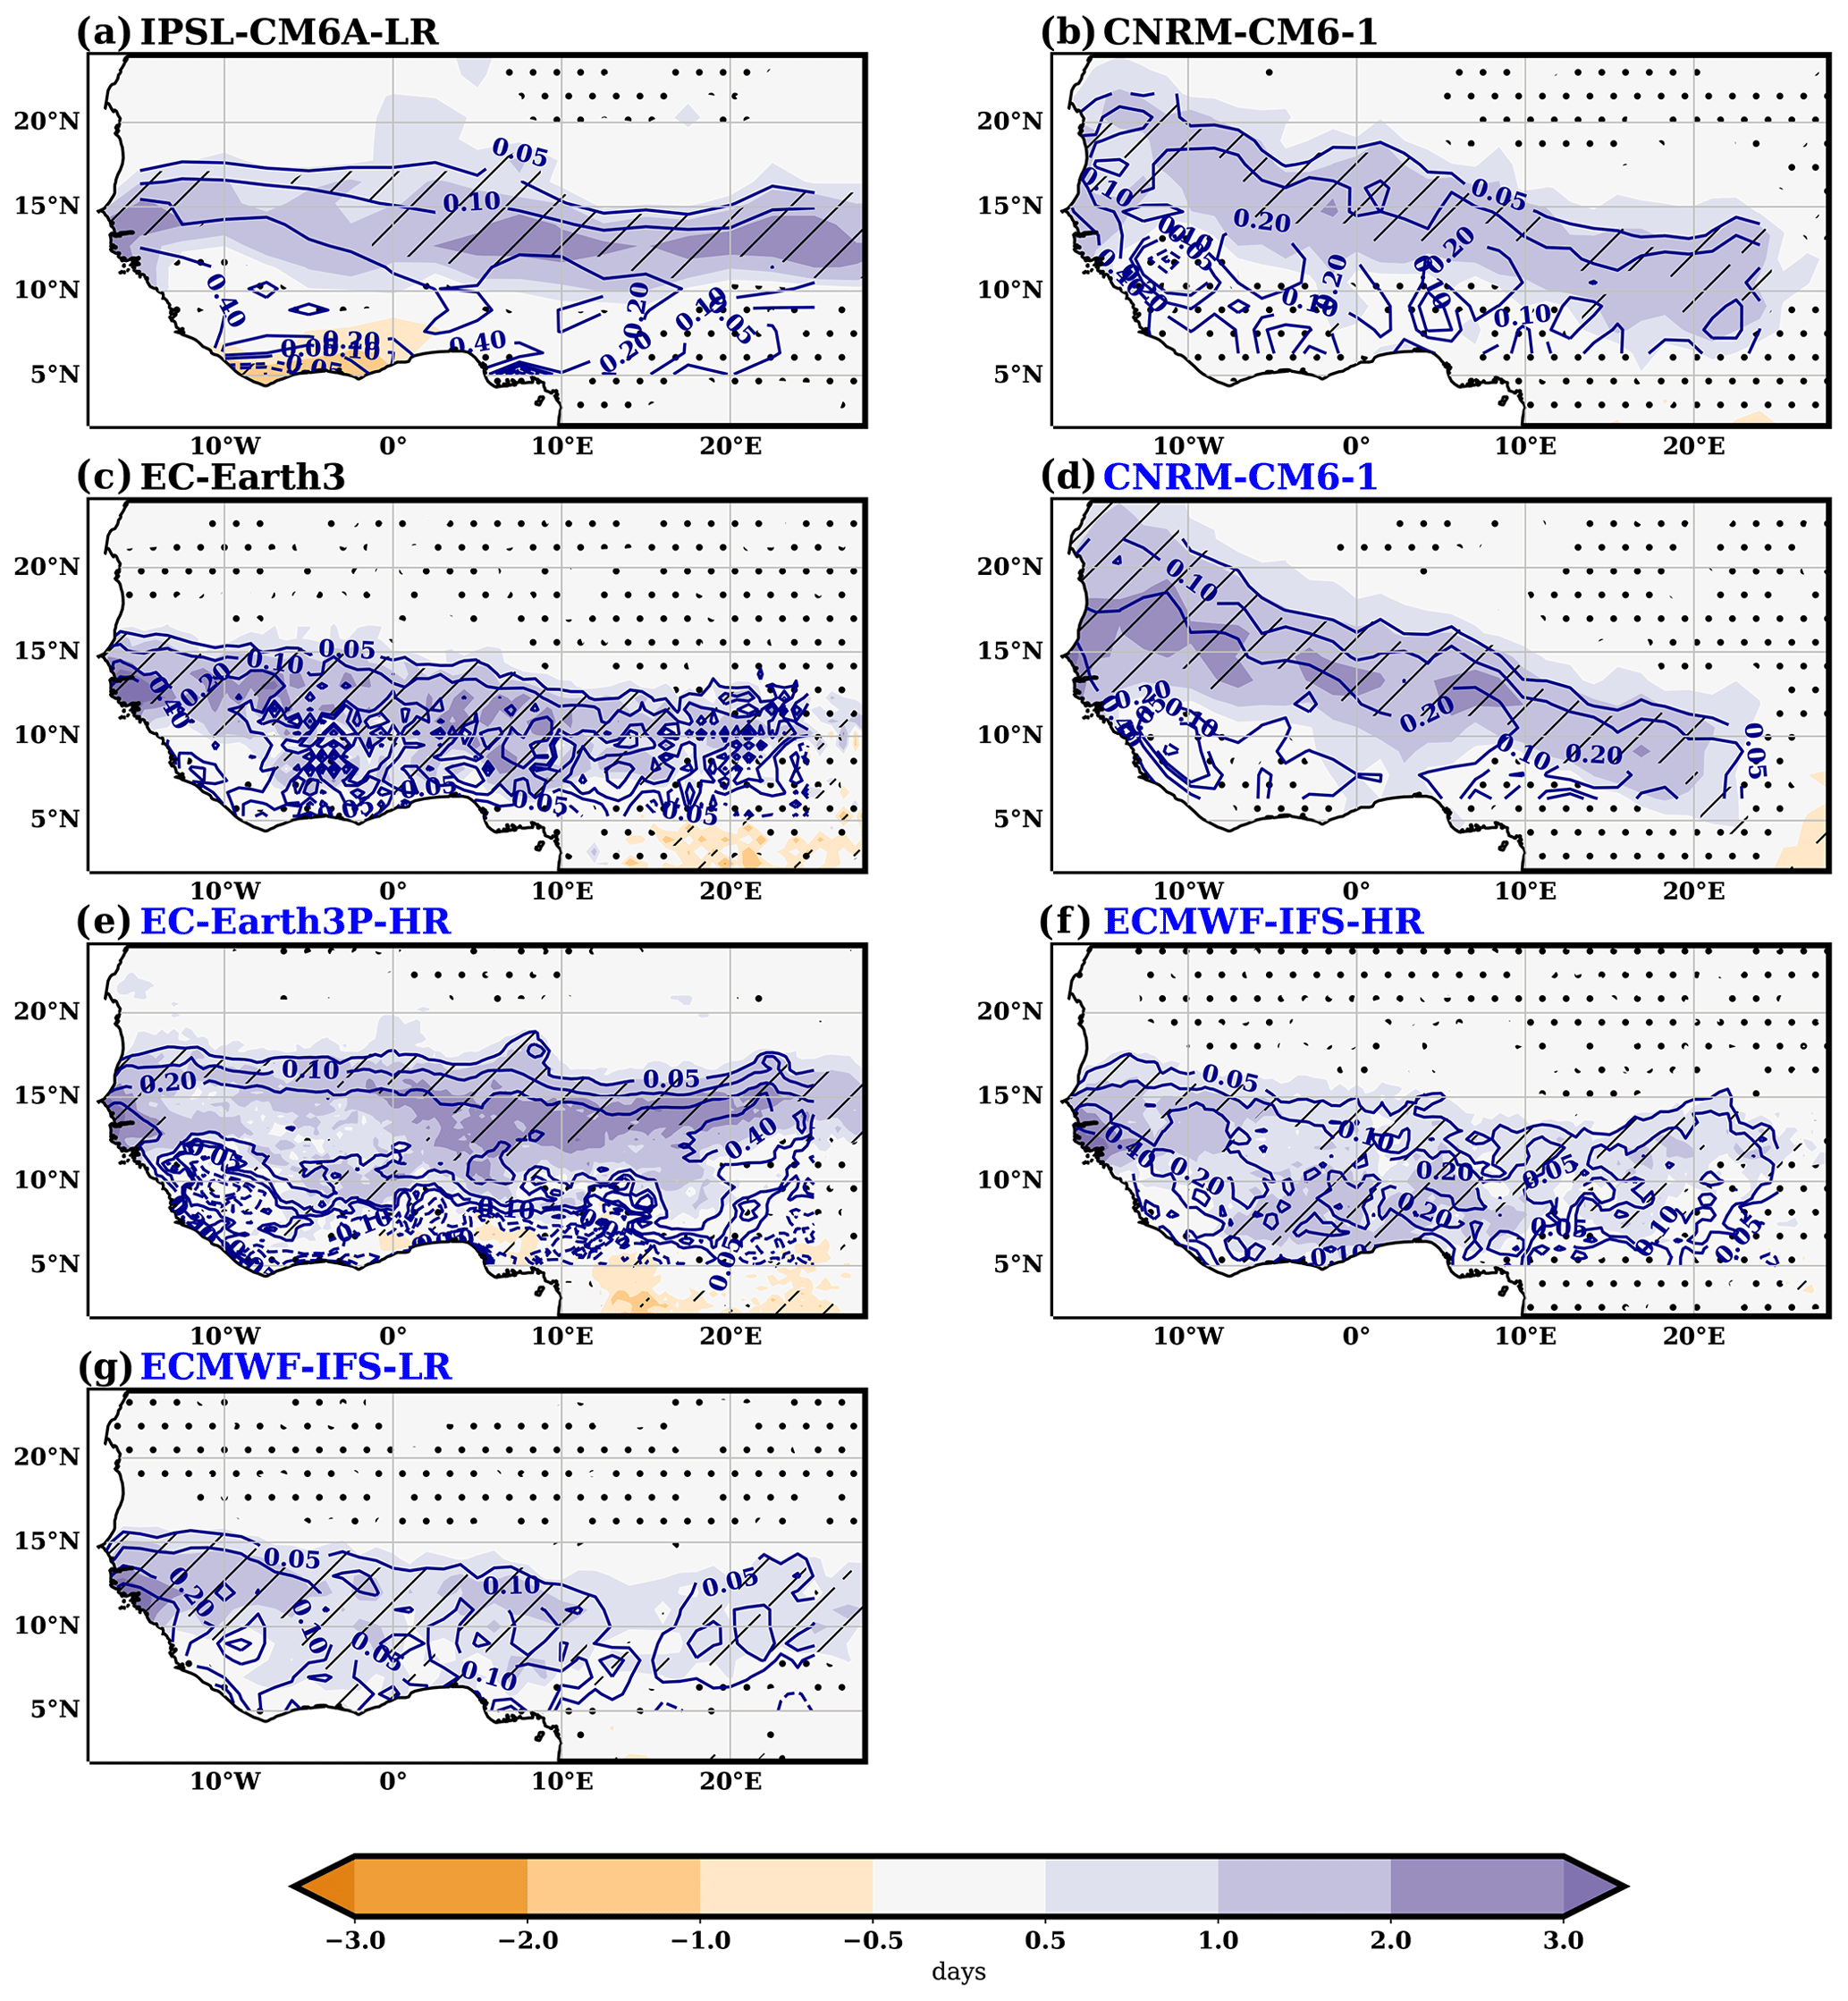
Figure 8Difference in the number of rainy days between AMV+ and AMV− experiments (shaded; days). For simulations under the PRIMAVERA protocol (marked blue in the model name labels), only half the anomalous values are shown. Contours mark the corresponding differences in mean JAS seasonal rainfall (contour values of 0.05, 0.1, 0.2, and 0.4 in mm d−1; solid for positive values and dashed for negative ones). Regions where differences in the number of rainy days are not statistically significant (p<0.05) are dotted. Hatching by straight lines marks regions where the difference in the number of rainy days explains most of the difference in the mean JAS seasonal rainfall (i.e., where the first term on the right-hand side of Eq. 3 dominates).
The models' responses to a positive AMV also include an increase in the mean intensity of rainfall over West Africa (Fig. 9). Unlike the impact on the number of rainy days, the maximum changes in the intensity tend to be simulated more to the south, where the mean JAS seasonal rainfall anomalies are strongest. Averaged over the Sahel, the change in intensity shows a strong spread, with a multimodel mean of 0.11 mm d−1 but a range from the very weak changes of 0.02 to 0.19 mm d−1 simulated by the ECMWF-IFS-LR and the CNRM-CM6-1 in the DCPP-C protocol, respectively.
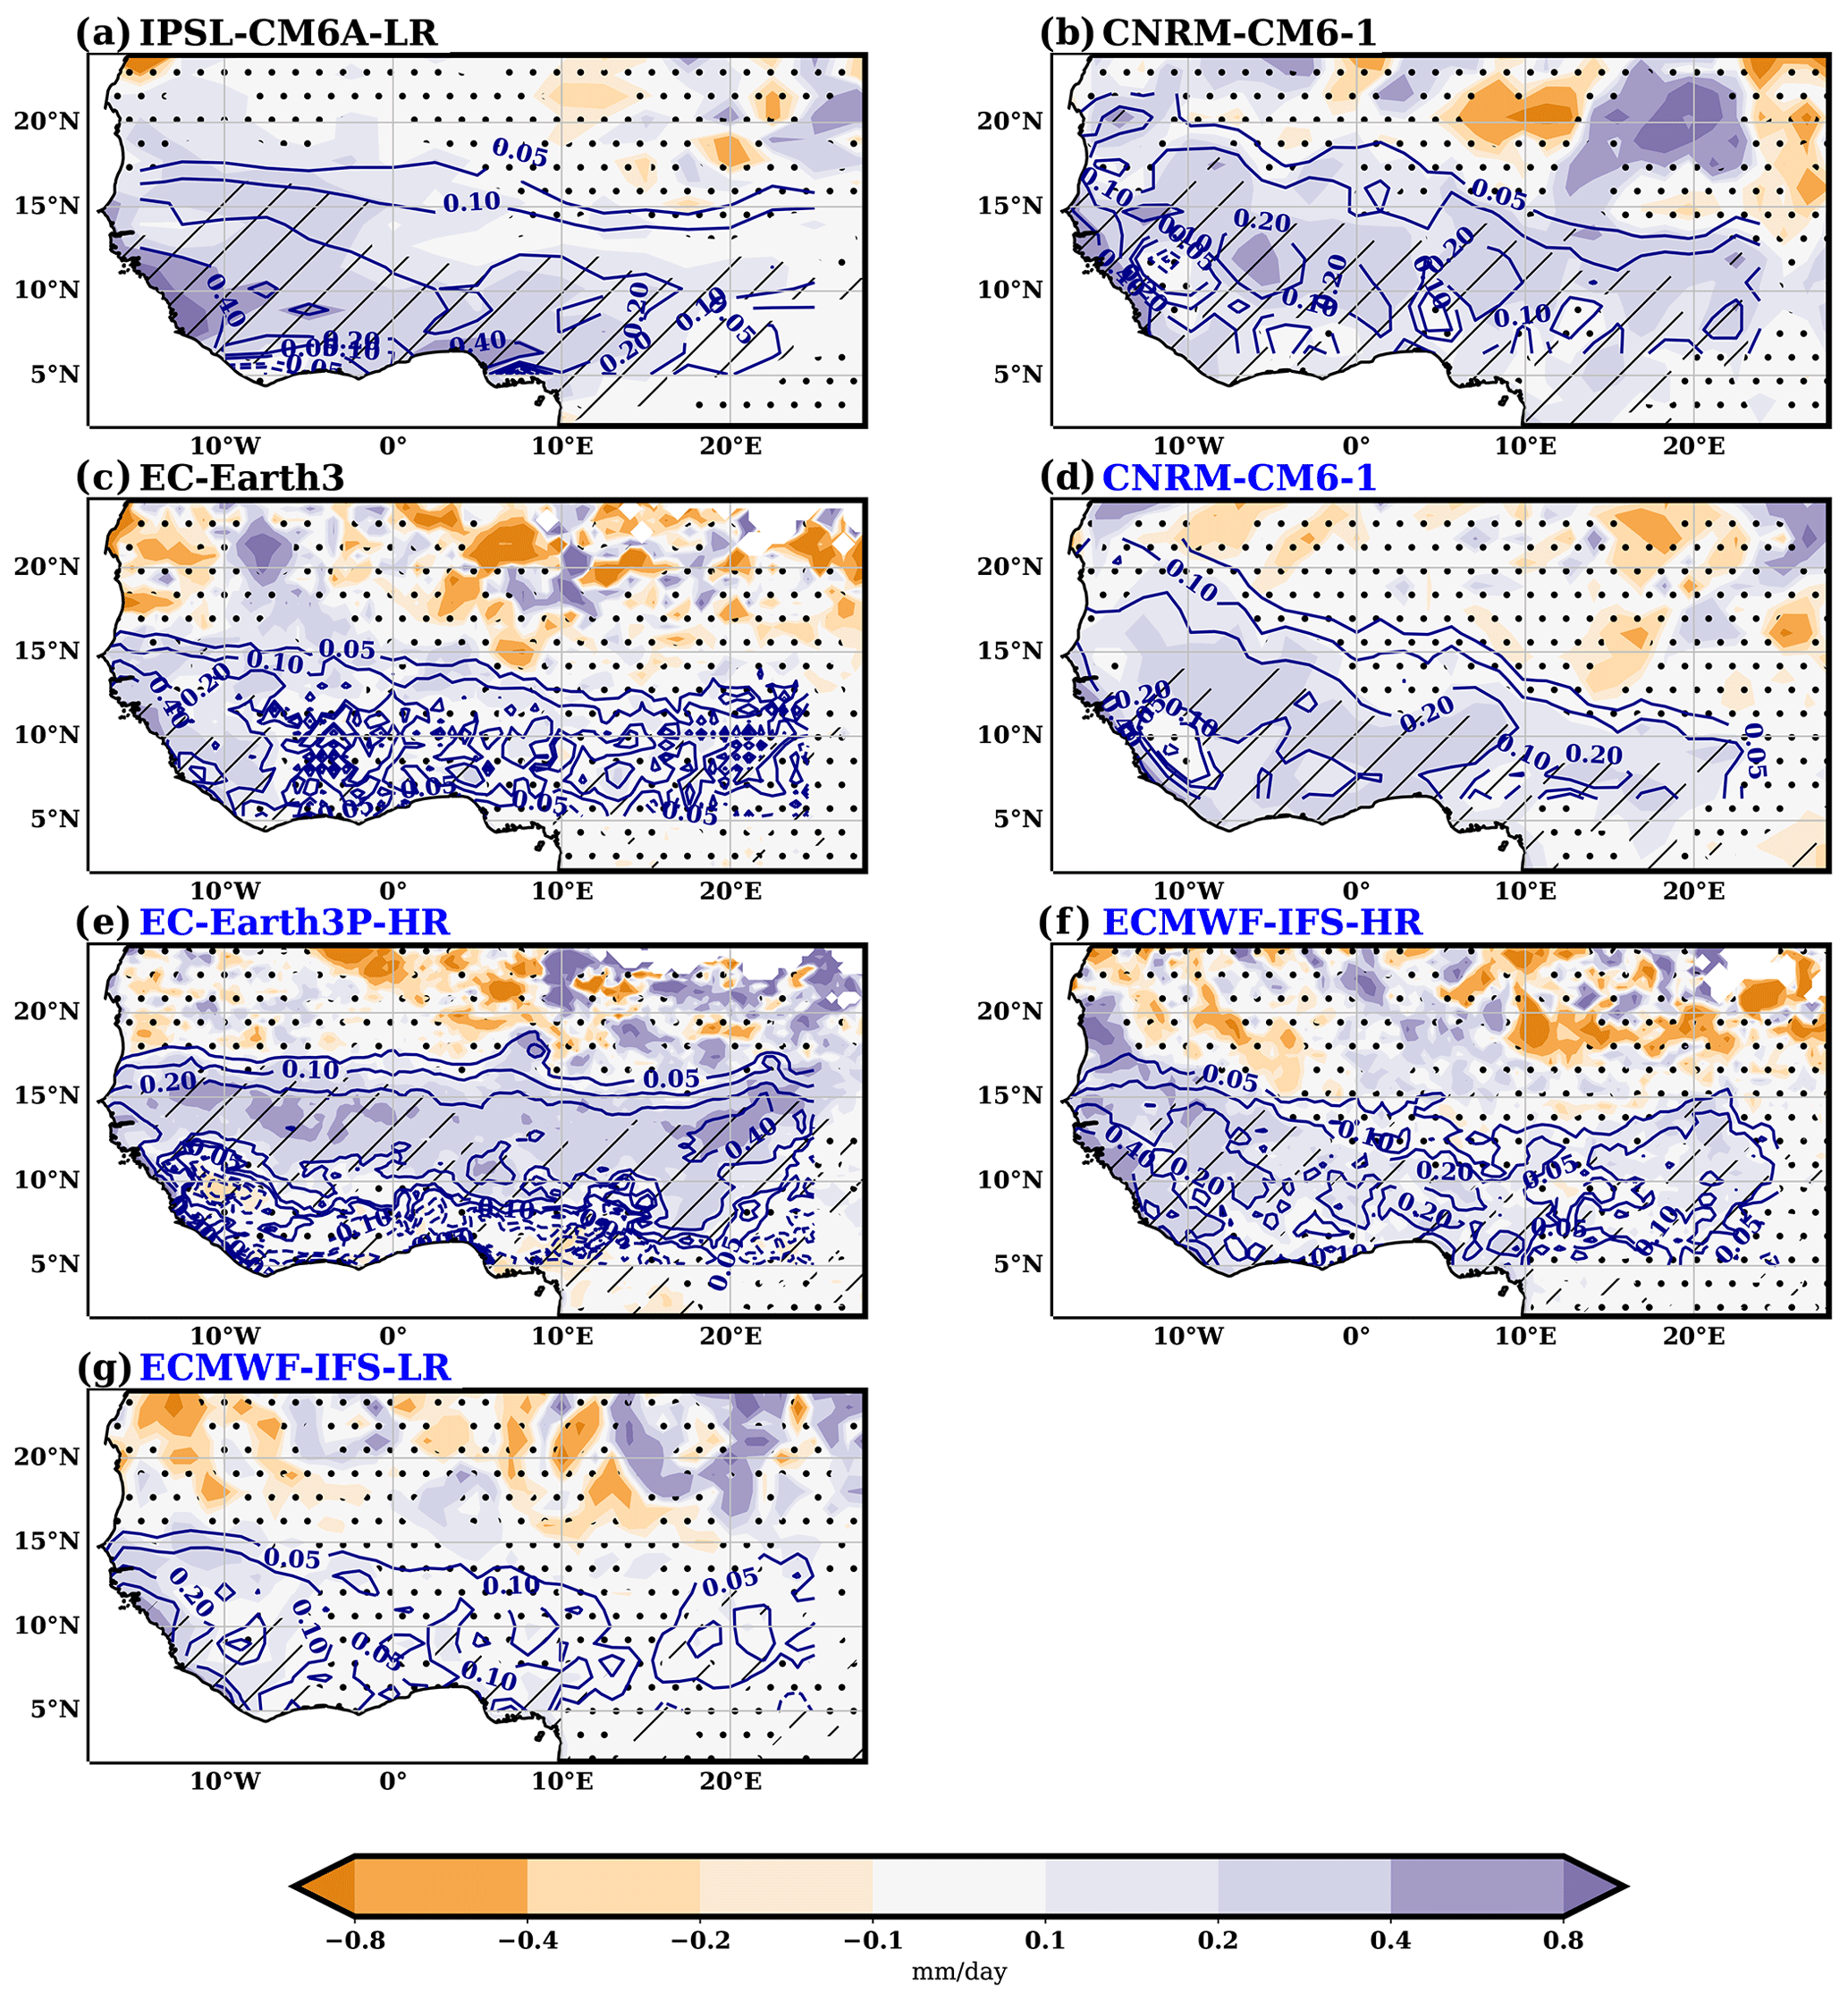
Figure 9Difference in the mean rainfall intensity between AMV+ and AMV− experiments (shaded; mm d−1). For simulations under the PRIMAVERA protocol (marked blue in the model name labels), only half the anomalous values are shown. Contours mark the corresponding differences in mean JAS seasonal rainfall (contour values of 0.05, 0.1, 0.2, and 0.4 in mm d−1; solid for positive values and dashed for negative ones). Regions where differences in the mean rainfall intensity are not statistically significant (p<0.05) are dotted. Hatching by straight lines marks regions where the difference in the mean rainfall intensity explains most of the difference in mean JAS seasonal rainfall (i.e., where the second term on the right-hand side of Eq. 3 dominates).
According to the decomposition proposed in Eq. (3), the changes in the number of rainy days tend to dominate the changes in the total seasonal rainfall over the northern fringe, where the changes in the number of rainy days tend to be stronger and those in seasonal rainfall weaker (see hatching in Fig. 8). Conversely, changes in total rainfall seasonal amounts tend to be dominated by the changes in the mean intensity of rainfall more to the south, typically south of 15∘ N or 10∘ N, depending on the model, where the maximum anomalies of total seasonal rainfall are located (see hatching in Fig. 9). In Fig. 10, we show this behavior more clearly. For each grid point in the West African region (see blue box in Fig. 1c and d), we calculate the percentage of the explained JAS seasonal rainfall anomaly by the change in the number of rainy days as the ratio of the first term on the right-hand to the left-hand side of Eq. (3). We then divide the range of JAS seasonal rainfall anomalies into six intervals and for each model, we gather together all grid points that belong to a given interval, and we plot the median of the explained percentage (Fig. 10a). The same procedure is followed for the change in the mean intensity, which is shown in Fig. 10b. There is a clear tendency in all models for the change in the number of days to dominate over regions with weak changes in the JAS seasonal rainfall (Fig. 10a) and for the change in the mean intensity to dominate in the regions of high values of JAS seasonal rainfall anomalies (Fig. 10b). To evaluate the accuracy of the decomposition, for each grid point, we calculate the total percentage of explained JAS seasonal rainfall anomalies by and as the ratio of the right-hand side to the left-hand side of Eq. (3). We divide this percentage into different intervals and show in Fig. 10c, for each model, the percentage of the area over West Africa covered by each interval where anomalies of seasonal rainfall were statistically significant (Fig. 7). This percentage of area is calculated as the ratio of grid points in which the percentage of the explained variance belongs to a given interval to the total number of grid points with statistically significant seasonal rainfall anomalies over West Africa (see blue box in Fig. 1c and d). The decomposition proposed in Eq. (3) is a good approximation for most models; over most of West Africa, the grid points where seasonal rainfall changes are statistically significant, and the right-hand side of Eq. (3) explains close to 100 % of its left-hand side. The main exceptions are the CNRM-CM6-1 model in the DCPP-C protocol and the EC-Earth3P-HR, where the approximation is over-representing and under-representing, respectively, the change in total JAS seasonal rainfall.
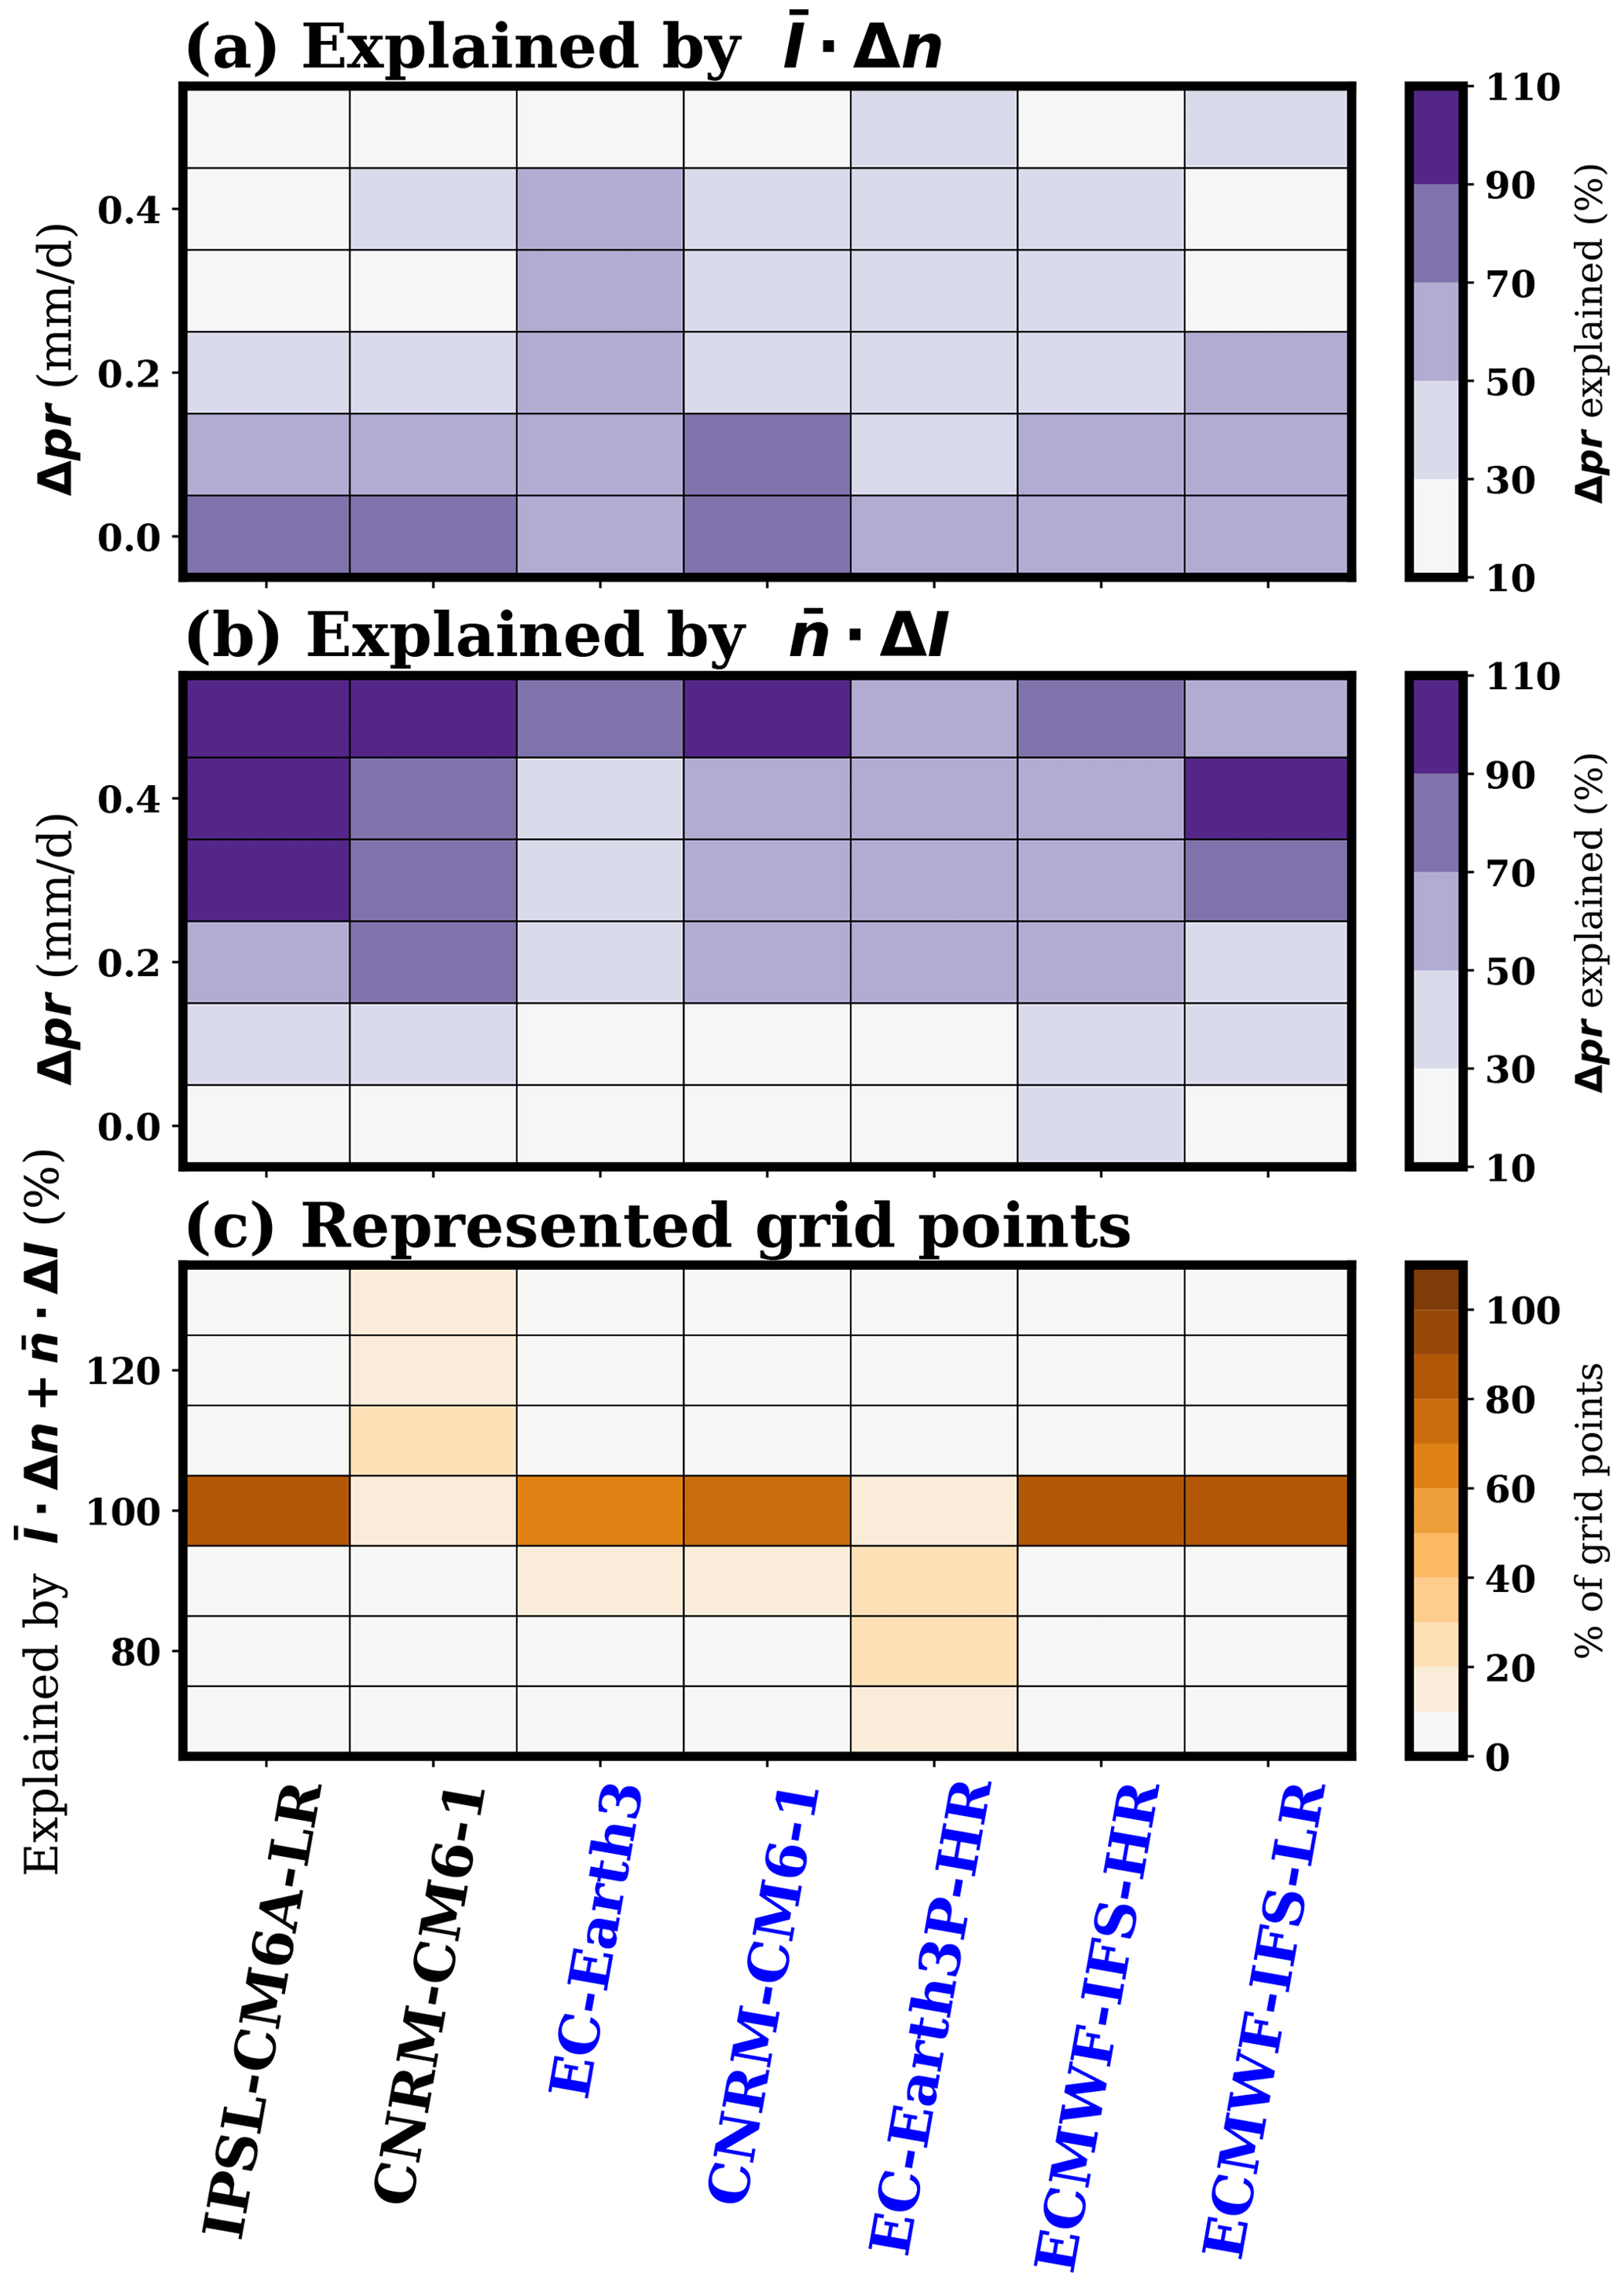
Figure 10(a) Percentage of explained difference in mean JAS seasonal rainfall between AMV+ and AMV− experiments in West Africa (see region marked in blue in Fig. 1) by changes in the number of rainy days (first term on the right-hand side of Eq. 3) as a function of the differences in rainfall for each model. For each model, all grid points that belong to the rainfall difference interval (y axis) are taken into account, and the median value is shown (color; %). (b) Same as panel (a) but explained by changes in the mean intensity (second term on the right-hand side of Eq. 3). (c) Area of West Africa where seasonal rainfall changes are statistically significant (in percent of grid points) per model covered as a function of the differences in mean JAS seasonal rainfall explained together by the changes in the number of days and in the intensity of rainfall (i.e., ratio on the right-hand side of Eq. 3 to the left-hand one). For simulations under the PRIMAVERA protocol (marked blue in the model name labels), only half the anomalous values are taken into account for the calculations.
3.4 Impacts of AMV on the frequency of moderate, heavy, and extreme precipitation events
In response to AMV, models show an enhancement in the number of moderate rainfall events (i.e., those below the 75th percentile, taking only rainy days into account) over the northern part of the Sahel, lying over regions of weak JAS seasonal rainfall anomalies, reaching values above 1 d per season at some grid points (Fig. 11). The average change in the Sahel box is, however, smaller, as models tend to simulate negative anomalies (i.e., less moderate events) to the south, with some clearly affecting the southern part of the Sahel box (such as the IPSL-CM6A-LR, CNRM-CM6-1 in both protocols, and EC-Earth3P-HR). Conversely, the number of heavy rainfall events (those above the 75th percentile) shows a general enhancement over West Africa, with the maximum values aligned over the ones of JAS seasonal rainfall (Fig. 12). On average, over the Sahel box, the increase in the number of heavy events ranges between 0.17 and 0.92 d per season for the ECMWF-IFS-LR and IPSL-CM6A-LR models, respectively.
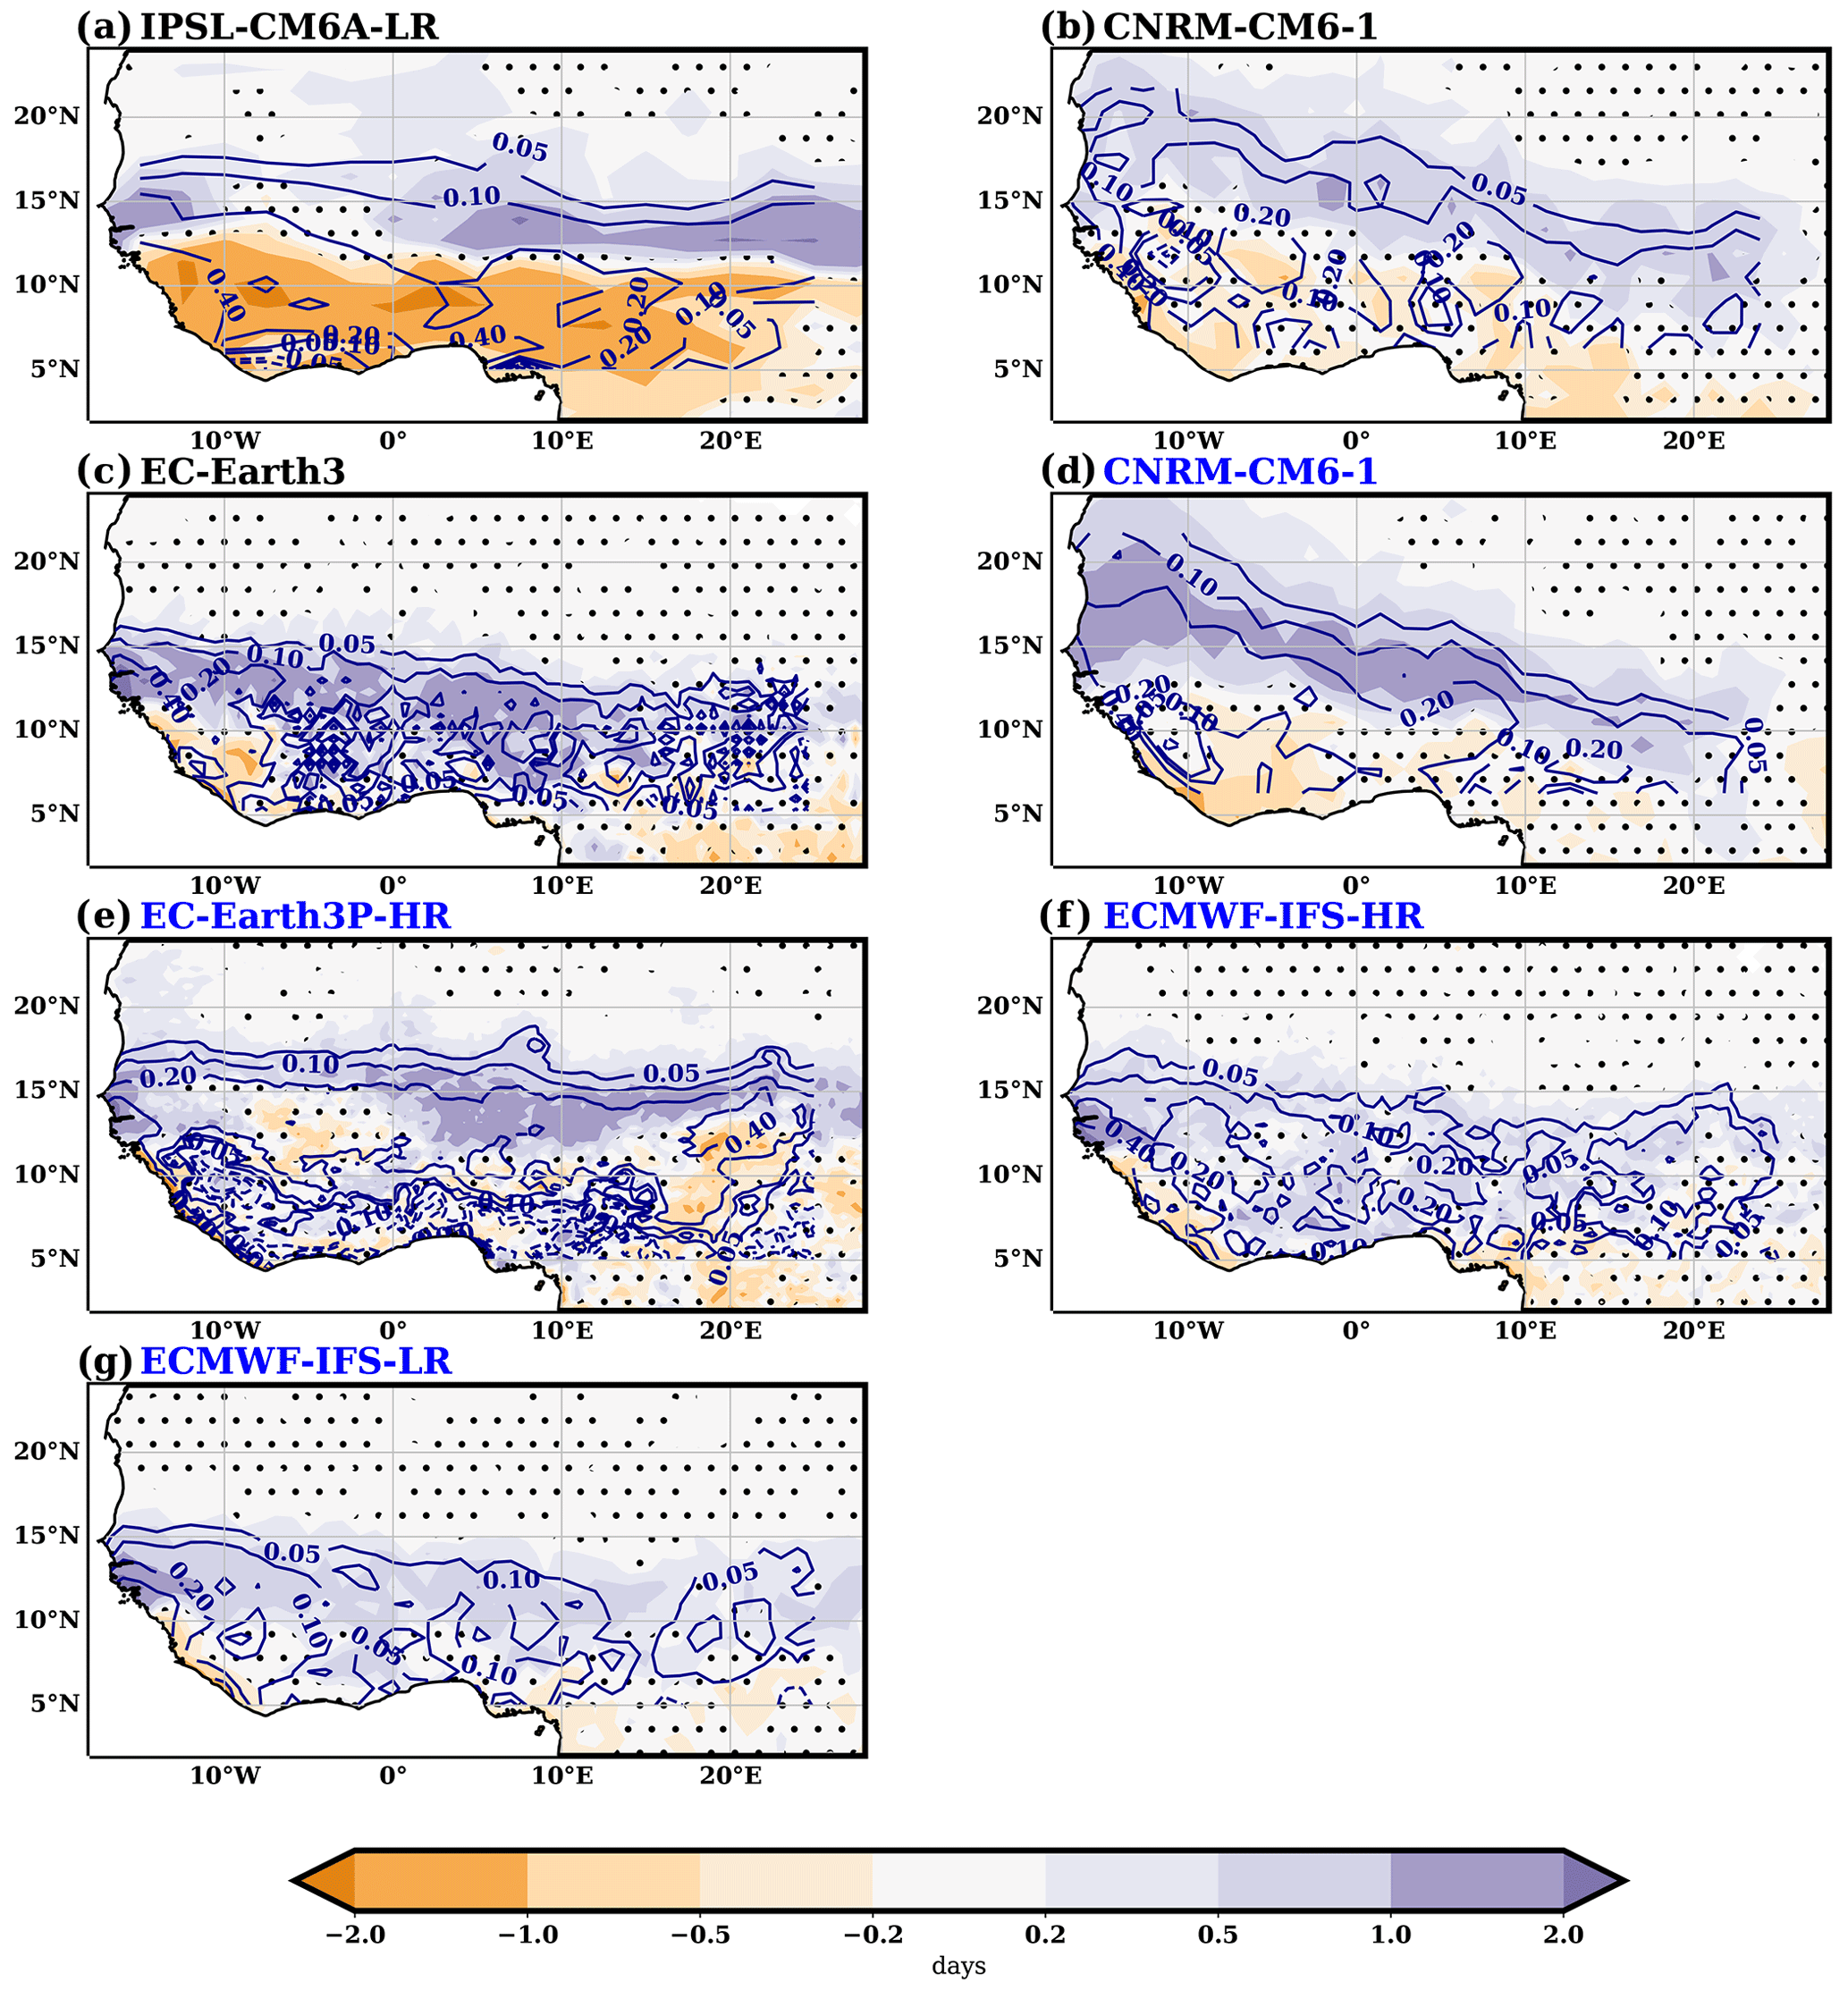
Figure 11Difference in the number of moderate rainy days (i.e., those below the 75th percentile of rainy days) between AMV+ and AMV− experiments (shaded; days). For simulations under the PRIMAVERA protocol (marked blue in the model name labels), only half the anomalous values are shown. Contours mark the corresponding differences in mean JAS seasonal rainfall (contour values of 0.05, 0.1, 0.2, and 0.4 in mm d−1; solid for positive values and dashed for negative ones). Regions where differences in the number of rainy days are not statistically significant (p<0.05) are dotted.
Note that, by definition, the changes in the number of moderate events (Fig. 11) plus those coming from changes in heavy events (Fig. 12) are equal to the changes in the total number of rainy days (Fig. 8). Towards the southern limit of the Sahel, where the main JAS seasonal rainfall changes are simulated, the enhancement in the frequency of heavy events is higher than the one for moderate events, which can even be reduced in some models south of 10∘ N (Fig. 11). The dominance of the changes in the number of heavy events in regions where seasonal rainfall changes are strong is clearly seen in Fig. 13b, where, similar to what was presented in Fig. 10, the results are shown as a function of the interval of JAS seasonal rainfall change. The last interval includes events up to 0.55 mm d−1 because most grid points over West Africa show JAS seasonal rainfall anomalies weaker than this value (Fig. 13c). The tendency of models to reduce the number of moderate events over those regions is also highlighted in Fig. 13a. The comparison of both plots suggests that over grid points where strong anomalies of seasonal rainfall are simulated (typically over the southern Sahel limit towards 10∘ N), models are providing changes in the distribution of rainfall events without strong changes in the total number of rainy days (Fig. 8). This provides an explanation as to why in those areas the changes in the mean intensity tend to dominate those coming from the change in the number of rainy days in the overall response of JAS seasonal rainfall (Figs. 9 and 10a and b). In response to a positive phase of AMV, the models tend to simulate a shift in the rainfall distribution towards higher values over the southern margins of the Sahel, thus providing higher rainfall amounts when it rains.
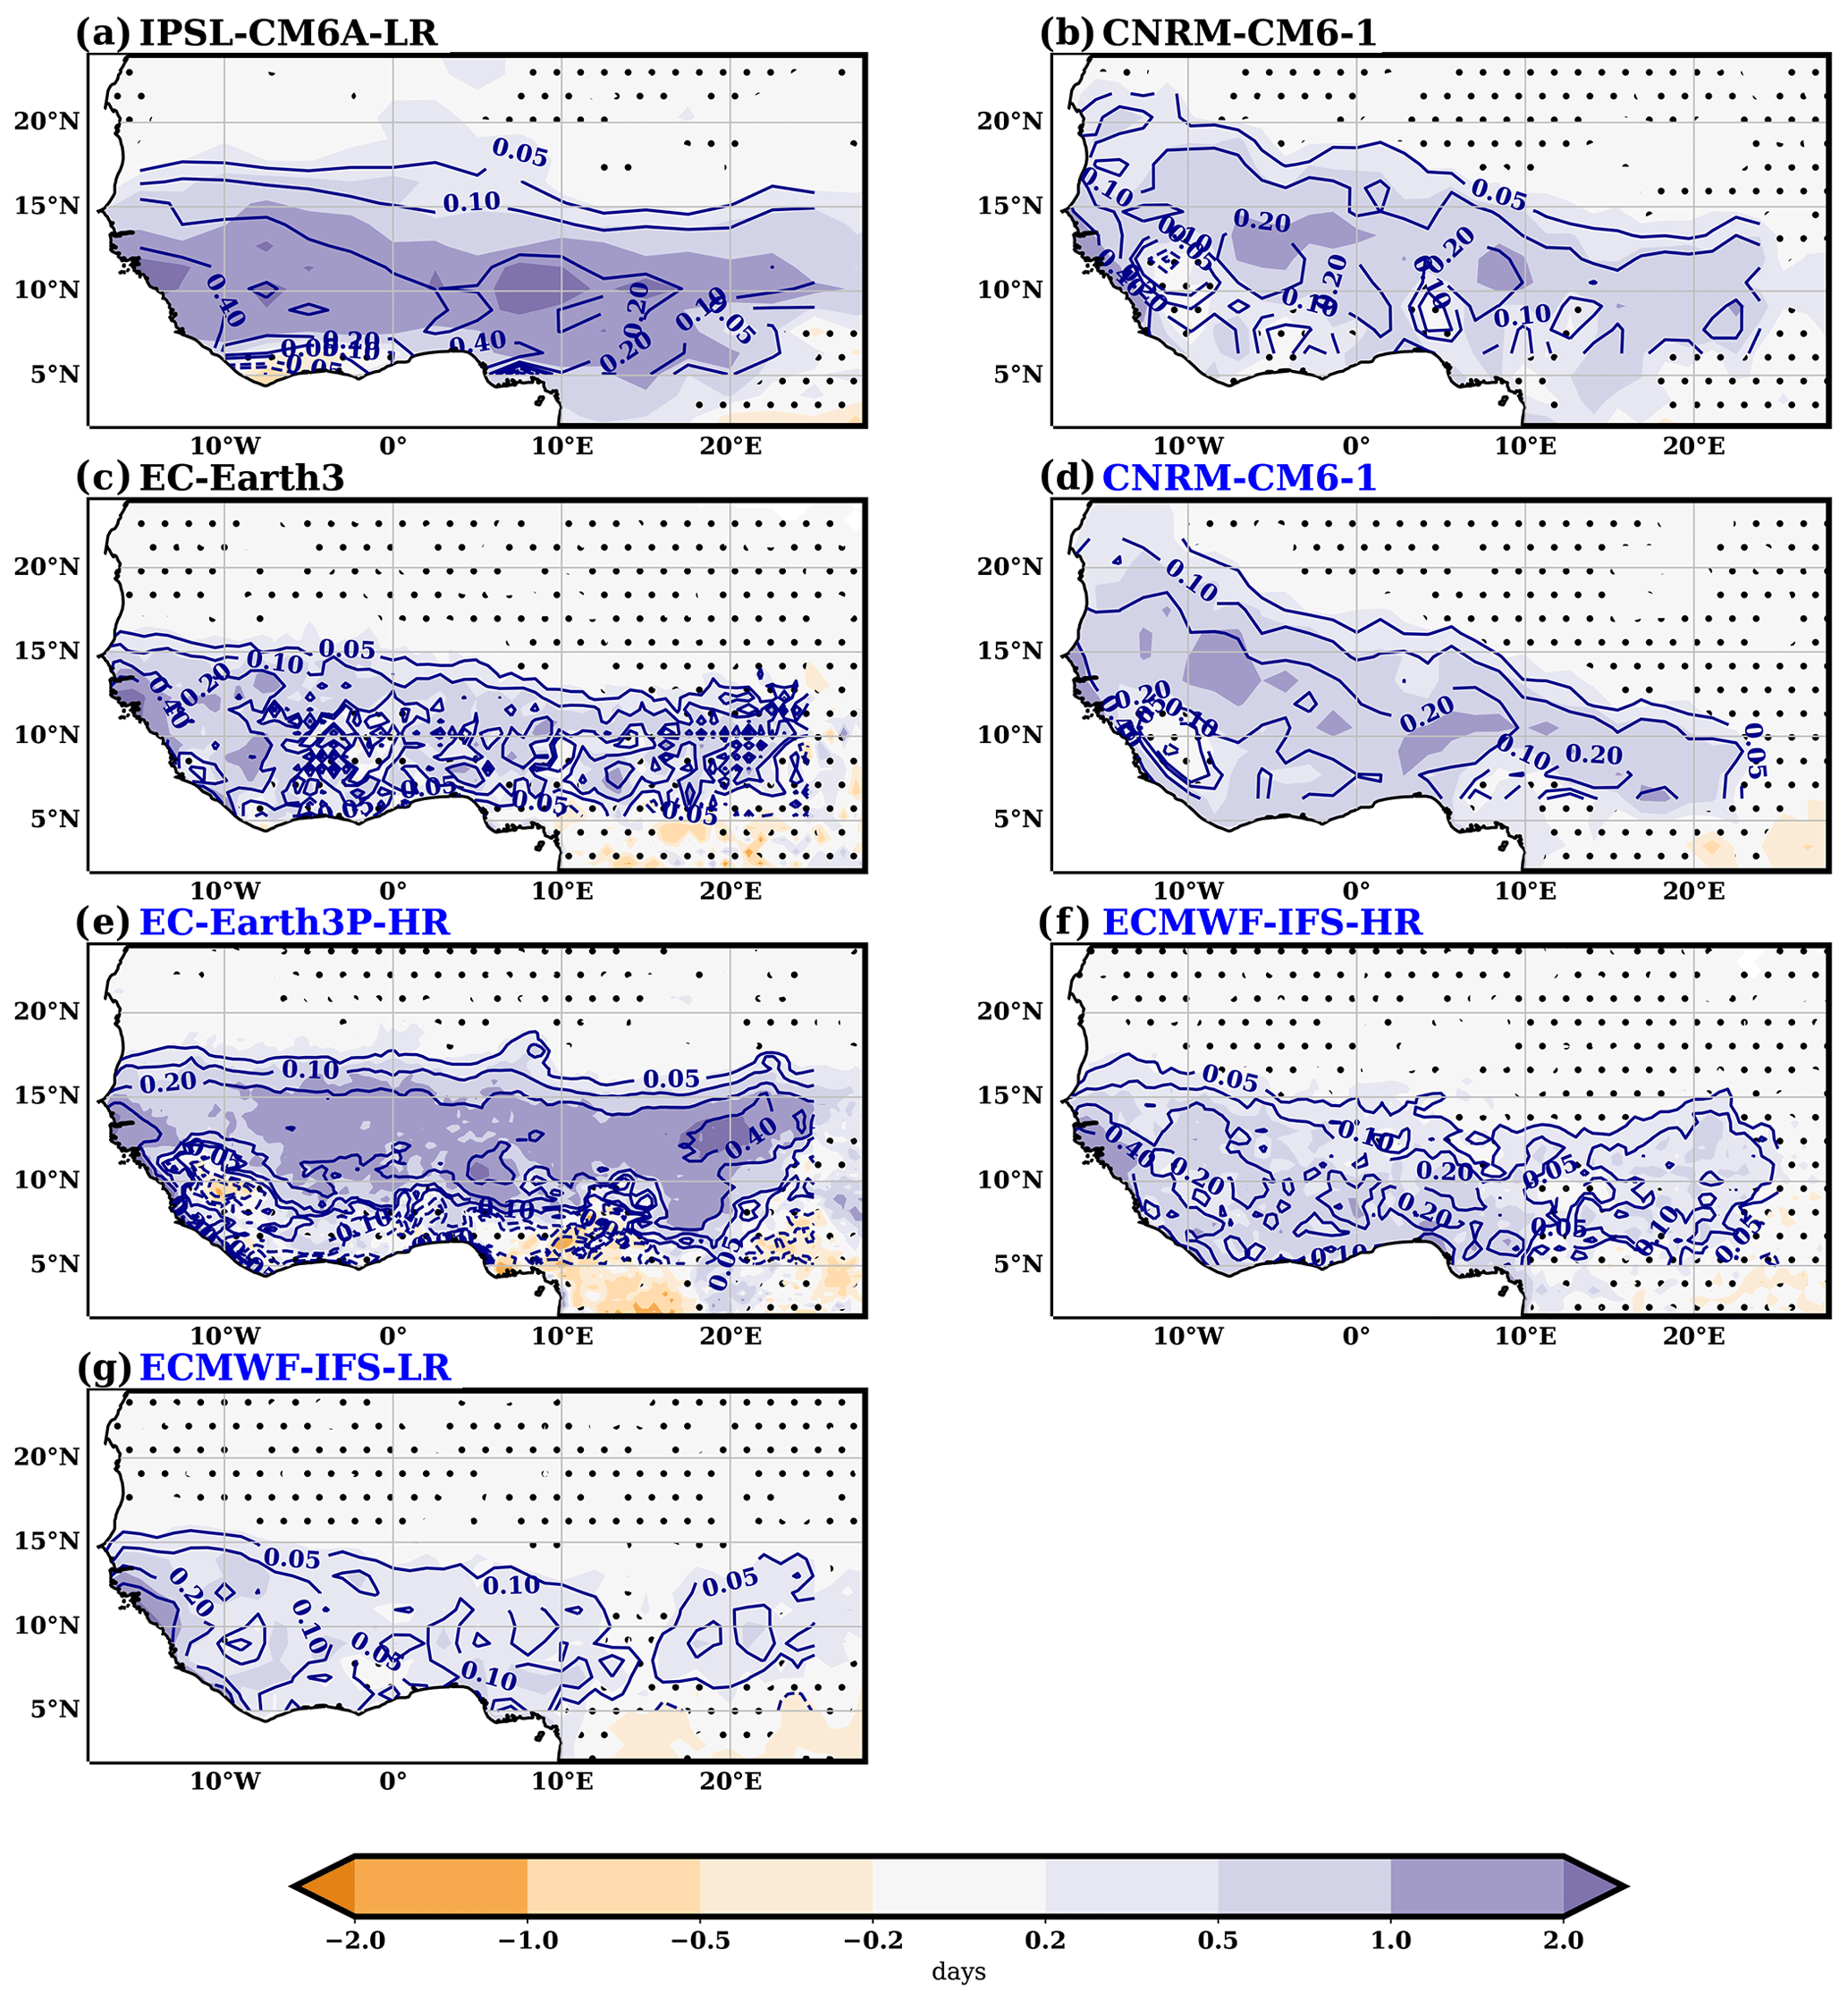
Figure 12Difference in the number of heavy rainy days (i.e., those above the 75th percentile of rainy days) between AMV+ and AMV− experiments (shaded; days). For simulations under the PRIMAVERA protocol (marked blue in the model name labels), only half the anomalous values are shown. Contours mark the corresponding differences in mean JAS seasonal rainfall (contour values of 0.05, 0.1, 0.2, and 0.4 in mm d−1; solid for positive values and dashed for negative ones). Regions where differences in the number of rainy days are not statistically significant (p<0.05) are dotted.
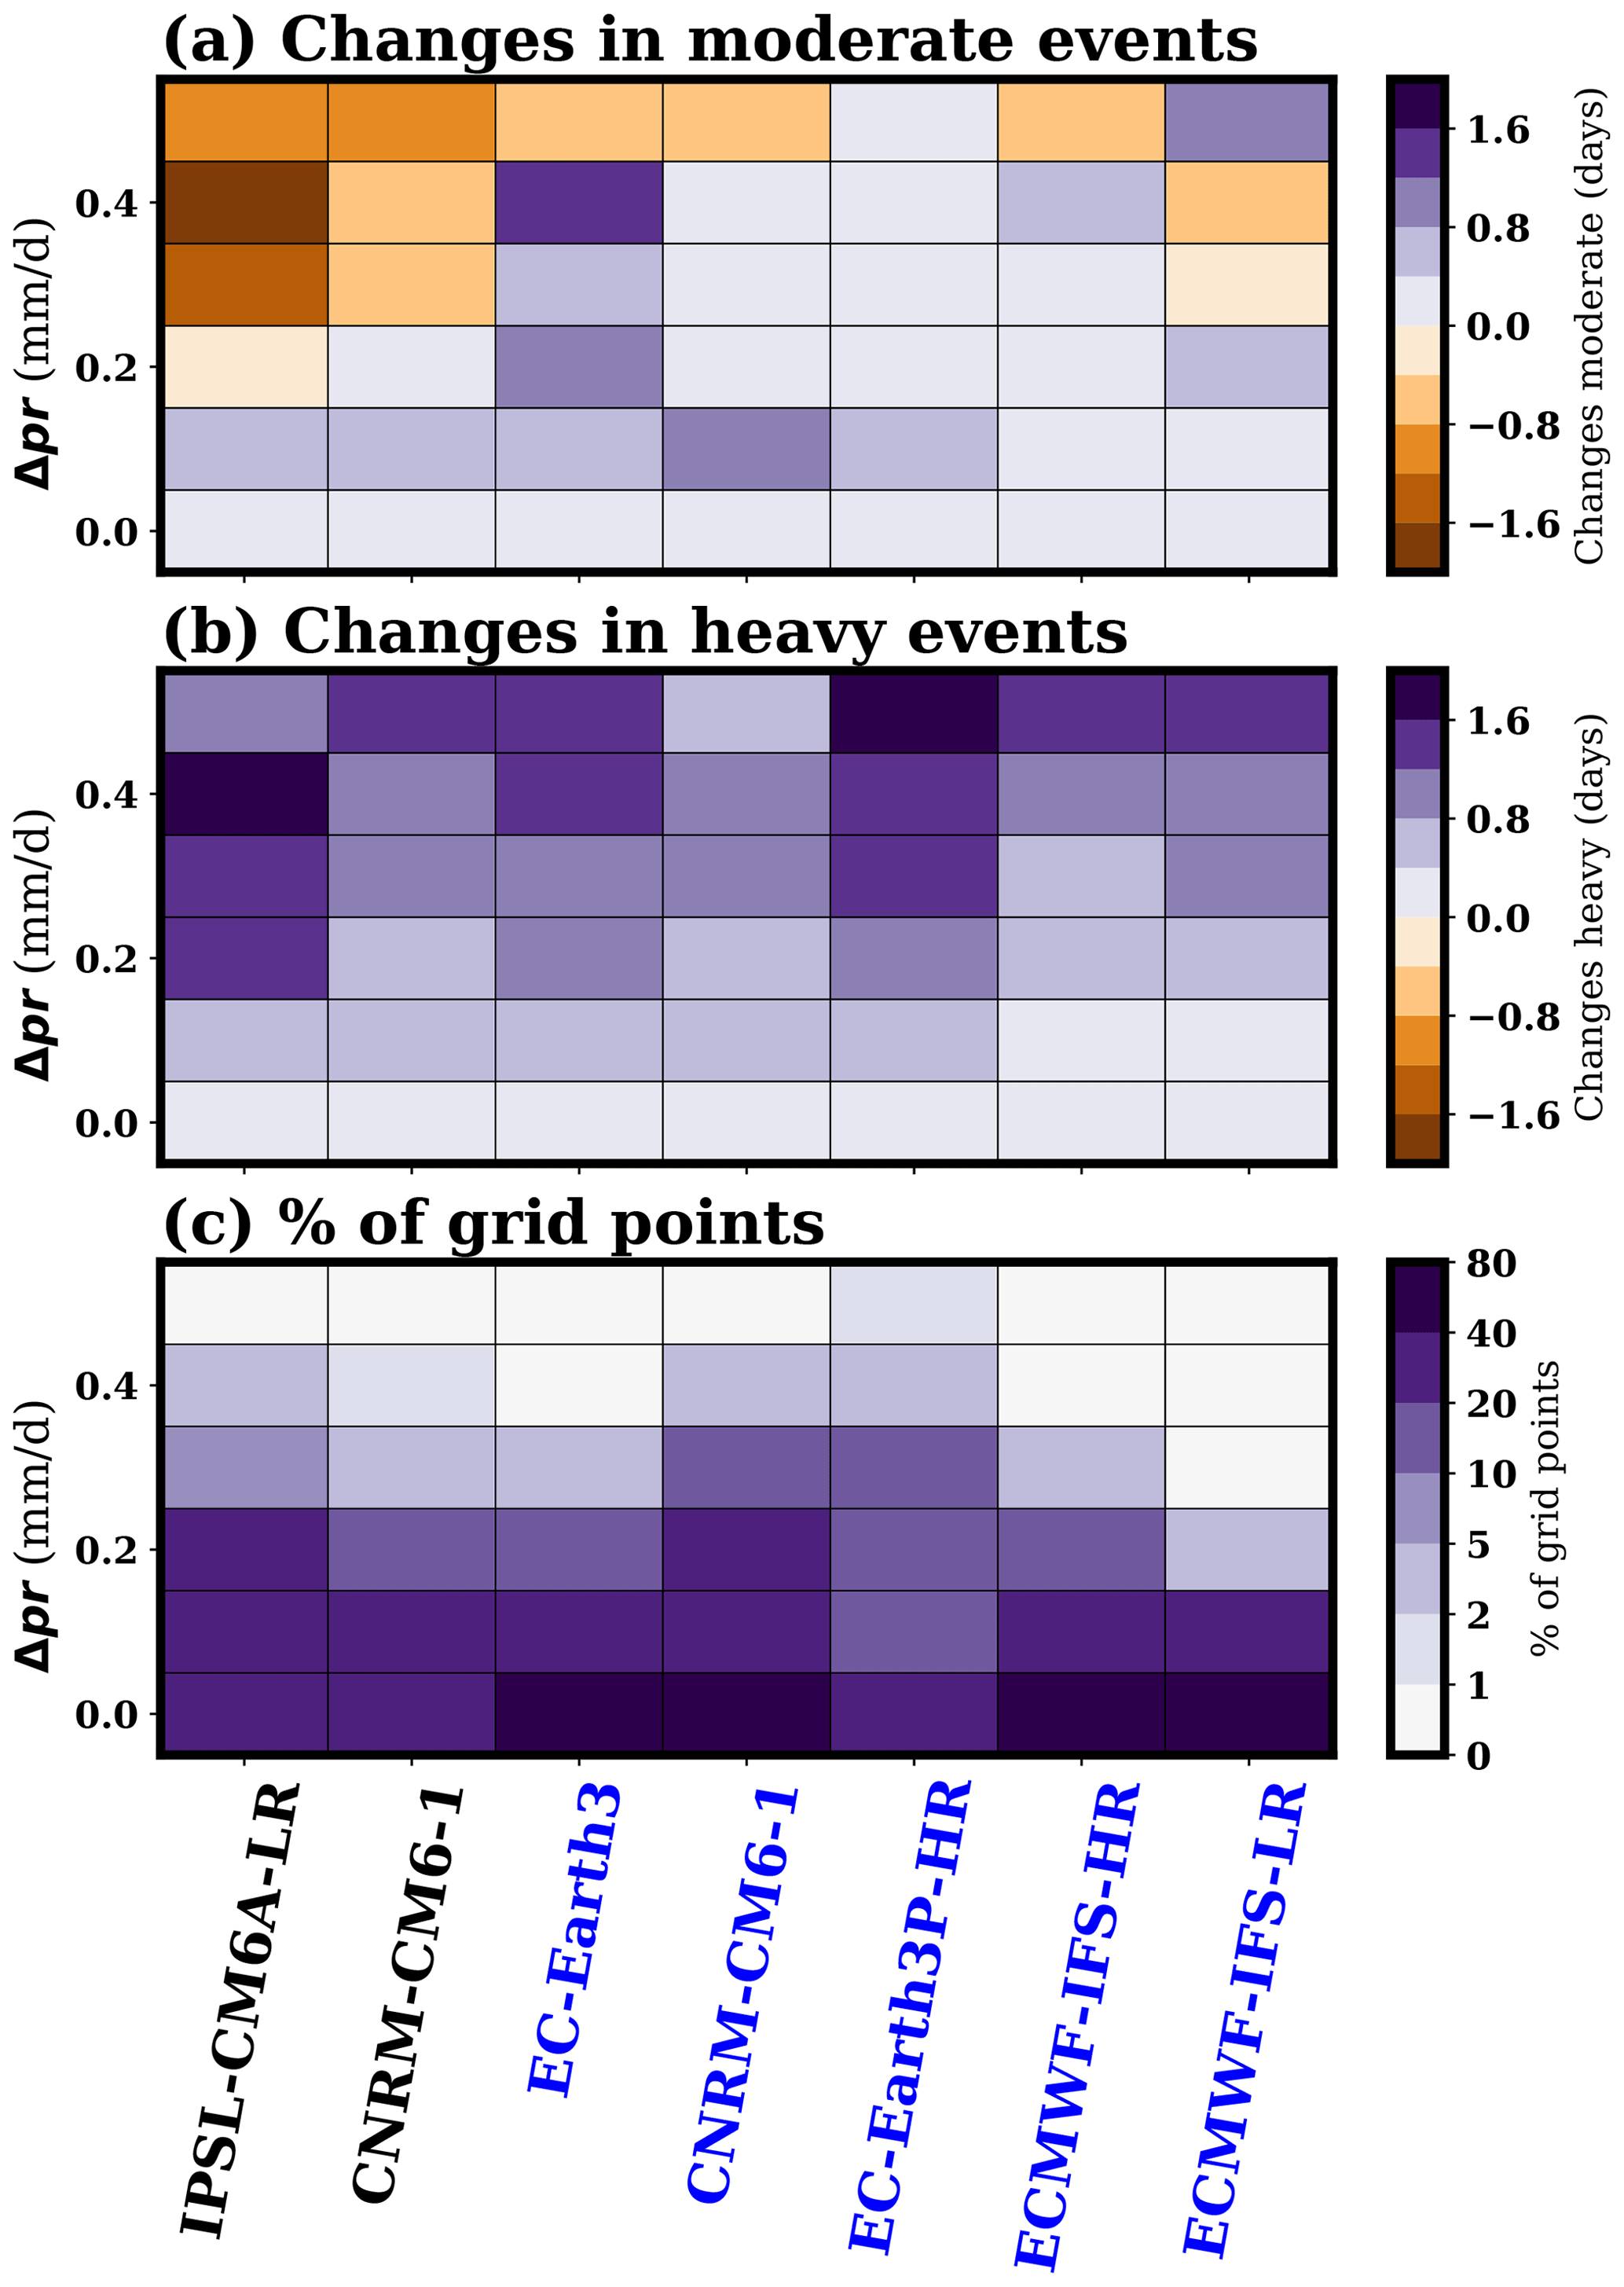
Figure 13(a) Differences in the number of moderate rainy days (i.e., those below the 75th percentile) between AMV+ and AMV− experiments in West Africa (see region marked in blue in Fig. 1) as a function of the differences in JAS seasonal rainfall for each model. For each model, all grid points that belong to the rainfall difference interval (y axis) are taken into account, and the median value is shown (color; days). (b) Same as panel (a) but for the number of heavy rainy days (i.e., those above the 75th percentile). (c) Percentage of grid points per model covered as function of the differences in mean JAS seasonal rainfall. For simulations under the PRIMAVERA protocol (marked blue in the model name labels), only half the anomalous values are taken into account for the calculations.
Conversely, over regions where the response to AMV in the JAS seasonal rainfall is small (the northern part of the Sahel), both moderate and heavy events are enhanced (Fig. 13a, b), with a slight dominance of the former (compare the values lying between contour lines of 0.05 and 0.10 mm d−1 in Figs. 11 and 12). This suggests that over those regions the increase in JAS seasonal rainfall comes from an increase in all types of rainy days, without there being strong changes in the distribution of rainfall events. Thus, in those regions, the changes in JAS seasonal rainfall are dominated by the general increase in the occurrence and frequency of rainy days (Figs. 8 and 10a).
Regarding the occurrence of extreme rainfall events (those defined using the 95th percentile threshold for all rainy days), in response to a positive phase of the AMV, models also simulate a general enhancement over West Africa, affecting the southern part of the Sahel (Fig. 14). On average over the Sahel box, changes range from 0.03 to 0.27 d per season in the ECMWF-IFS-LR and IPSL-CM6-LR models, respectively, with a multimodel mean change of 0.15 d per season.
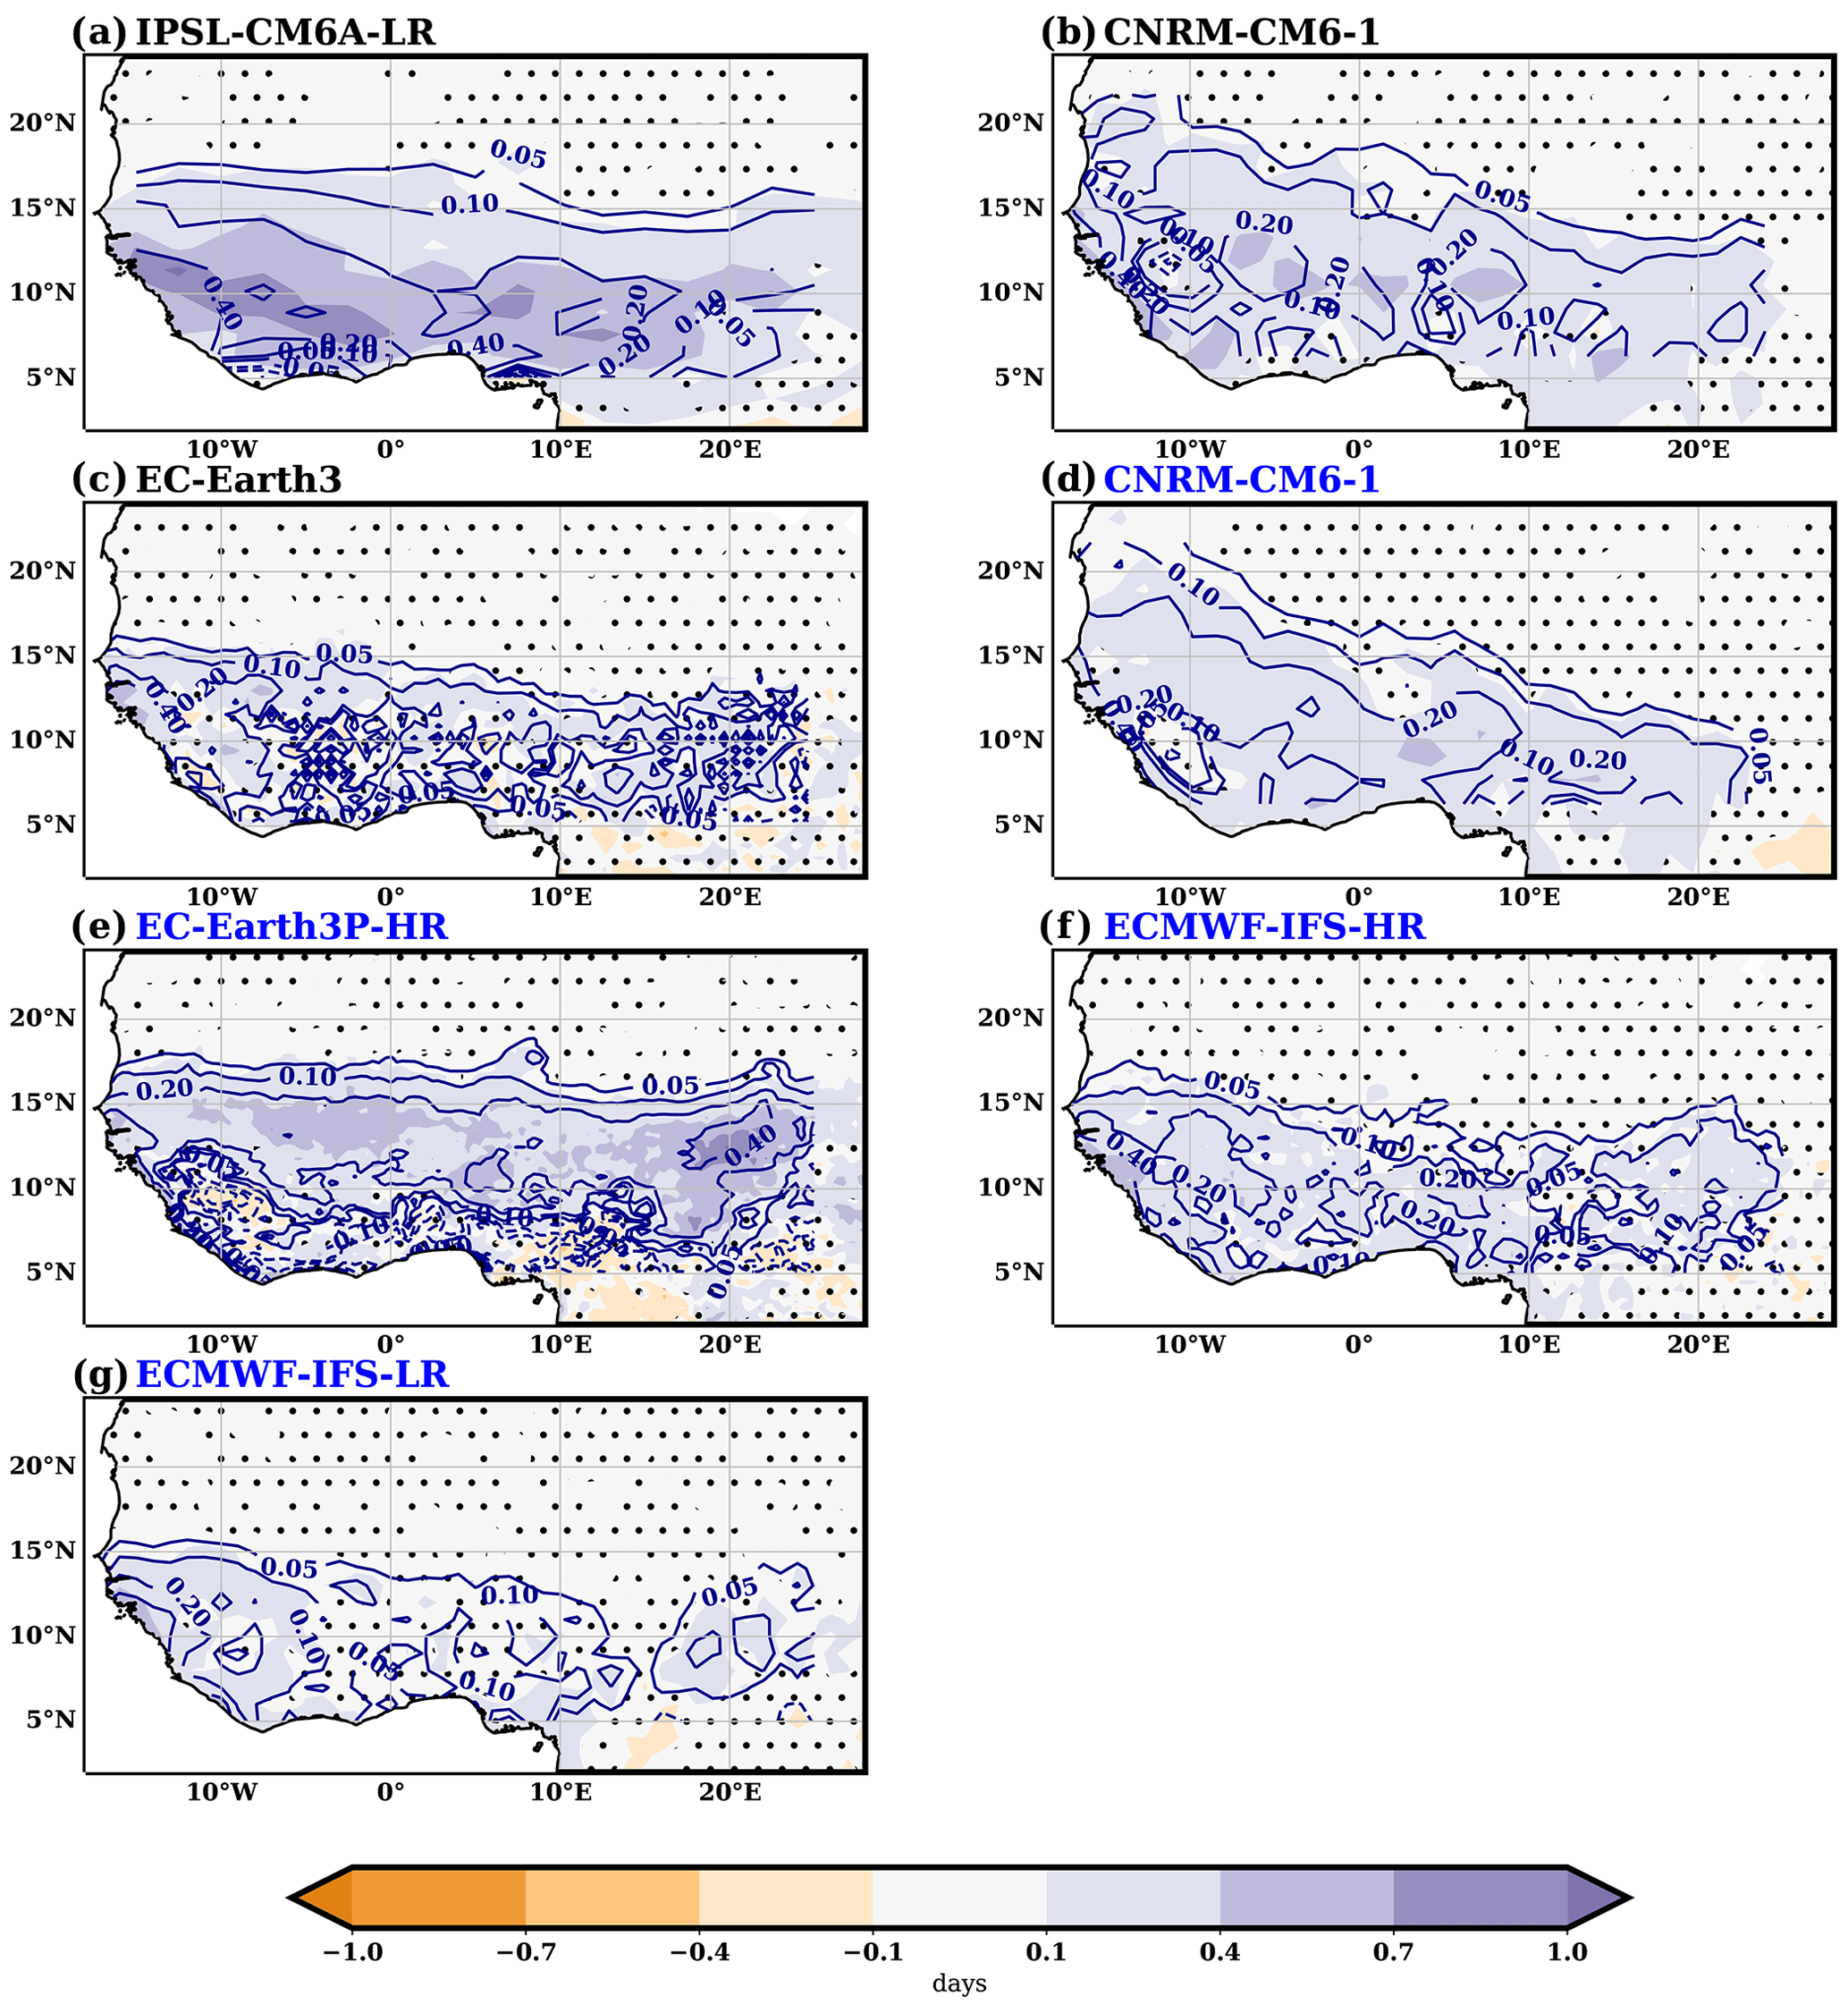
Figure 14Difference in the number of extreme rainy days (i.e., those above the 95th percentile of rainy days) between AMV+ and AMV− experiments (shaded; days). For simulations under the PRIMAVERA protocol (marked blue in the model name labels), only half the anomalous values are shown. Contours mark the corresponding differences in mean JAS seasonal rainfall (contour values of 0.05, 0.1, 0.2, and 0.4 in mm d−1; solid for positive values and dashed for negative ones). Regions where differences in the number of rainy days are not statistically significant (p<0.05) are dotted.
3.5 Impacts of AMV on the timing of the monsoon season
The models show no clear impact of AMV on the monsoon onset over the whole of West Africa, with mostly non-statistically significant signals of different signs (not shown). Over the Sahel box, only the ECMWF-IFS-LR model simulates a statistically significant earlier onset of 1.7 d (Fig. 6a). There is more consistency regarding the impact of the positive phase of AMV with respect to the negative one on the monsoon demise date over West Africa, with most models simulating a later cessation date over most of West Africa, although with different magnitudes and degrees of statistical significance (not shown). As much of the rainfall falling over the Sahel comes from local recycling (Nieto et al., 2006), this higher consistency in the demise date could be related to increased soil moisture in models that follows an enhanced rainfall season in response to a positive AMV phase (not shown). The more humid soil could, through land–atmosphere interactions, provide the source of moisture to increase precipitation at the end of the season and thus allow a later demise date over the Sahel. Over the Sahel box, all models simulate a later demise date for the AMV+ experiment compared to the AMV− one, which ranges from 1.3 to 5.0 d for the ECMWF-IFS-LR and EC-Earth3P-HR models, respectively. However, the differences are statistically significant for only half the models (Fig. 6a). There is also a consistent increase in the length of the season as a response to a positive AMV over most of West Africa (not shown). In the Sahel box, this increase in the monsoon season ranges from 1.5 to 5.3 d in the EC-Earth3 and ECMWF-IFS-HR models, respectively, and is statistically significant for most models (Fig. 6a). The impact of AMV on the seasonality of the monsoon is stronger and more consistent over the Sahel latitudes west of 10∘ W, with all models simulating a statistically significant earlier onset, later cessation, and longer monsoon season in the AMV+ experiment compared to the AMV− one (Fig. 6b).
Previous studies agree that, in response to a positive phase of AMV, total seasonal rainfall amounts over the Sahel tend to increase (e.g., Folland et al., 1986; Knight et al., 2006; Zhang and Delworth, 2006; Mohino et al., 2011; Ting et al., 2011; Martin and Thorncroft, 2014; Martin et al., 2014; Villamayor et al., 2018b; Hodson et al., 2022). Here we go beyond the total seasonal amounts and investigate the influence of AMV on the intraseasonal characteristics of rainfall by analyzing a set of model simulations under a largely common protocol. The experiments consist of 10-year-long runs with SST in the North Atlantic forced to resemble an idealized AMV pattern. We analyze the biases shown by the models and estimate the impact of AMV by comparing the 10-year-averaged AMV+ and AMV− experiments. The protocol followed allows us to focus on the impact of the AMV pattern, while other sources of long-term variability are removed. In addition, the 10-year averages are consistent with the decadal timescale of AMV, which shows decade-long periods with values above 1 standard deviation of the index (Fig. 1b).
Our main findings can be summarized as follows:
-
Models show consistent bias patterns in the JAS seasonal total rainfall amounts, number of rainy days, and mean rainfall intensity, with an underestimation over the Sahel and an overestimation to the south, especially over the Guinea coast. Over West Africa, the biases are well above the observational uncertainty in the case of the total rainfall values. However, the rainfall mean intensity clearly exceeds the observational uncertainty only over the Sahel, with a clear underestimation. For the number of rainy days, only the positive biases over the Gulf of Guinea are well above the observational range for all the models, while the underestimation over the Sahel is only clear for roughly half the models. Most models underestimate the average length of the rainy season over the Sahel, with some due to a monsoon onset that is too late and others due to a cessation that is too early.
-
Despite differences in the amplitudes of changes, the models analyzed show high agreement in the response of West African rainfall to a positive phase of the AMV. This response involves a general increase in JAS seasonal rainfall amounts that overlays the climatological values, with higher changes in the southern Sahel, typically close to 10∘ N, and weaker ones to the north. The latter are mainly related to an increase in the number of rainy days due to the enhancement of all types of rainfall events, including moderate, heavy, and extreme. The stronger changes observed in the southern part of the Sahel are better explained by an increase in the mean intensity of rainfall, as the number of heavy and extreme rainfall events grows, while those for moderate changes little or it even decreases.
-
Models show less impact of AMV on the timing of the monsoon over the Sahel box (Fig. 1a). Most of them suggest a lengthening of the monsoon season in the AMV+ experiment compared to the AMV− one, principally due to a later demise. Conversely, models show high consistency regarding the response of the westernmost Sahel to the positive phase of the AMV, with a statistically significant earlier onset, later cessation, and longer monsoon length (Fig. 1b).
Regarding the differences in the amplitude of changes over the Sahel box, two clusters of models can be described. One includes the ECMWF-IFS-HR, EC-Earth3, and, especially, the ECMWF-IFS-LR models. This cluster shows weak changes in most of the metrics analyzed, namely the total JAS seasonal anomalies, mean intensity, number of rainy days, and on the frequency of heavy and extreme rainfall events. On the other hand, the IPSL-CM6A-LR, EC-Earth3P-HR, and the CNRM-CM6-1 under both protocols tend to show larger changes in the above metrics. This second cluster is also the one that shows a longer monsoon season due to a later cessation date (Fig. 6a). These two clusters can also be distinguished in their climatological values of total JAS seasonal rainfall and total number of rainy days, with weaker values for the first group and stronger values for the second one (Fig. 3b), suggesting that biases could affect the simulated responses. However, we note that the number of models analyzed is small, so it is difficult to extract robust conclusions in this regard. In addition, the sample of models used in this work has little diversity; all models use the Nucleus for European Modelling of the Ocean (NEMO) for their ocean component, with all models sharing version 3.6 (Madec et al., 2017), except the ECMWF-IFS-HR and ECMWF-IF-LR, which use version 3.4. And, for most of them, the atmospheric component is related to the Integrated Forecasting System (IFS).
The above results and grouping also suggest that the differences in the protocols followed, DCPP-C versus PRIMAVERA, are of second-order importance compared to the impact simulated by the models. Once the amplitude of the forcing AMV pattern is accounted for, the resemblance of the AMV impact simulated by the CNRM-CM6-1 model under both protocols is higher than the one provided by any other model following the same protocol, which is in agreement with the analysis of a similar set of simulations (Ruprich-Robert et al., 2021). In addition, there is no clear relation between the horizontal resolution of the atmospheric component and the simulated impact of AMV on West African rainfall characteristics. The previous grouping does not distinguish between higher- and lower-resolution models in the range spanned by our analysis (approximately 0.25 to 2.5∘). In fact, in the first group, we find two versions of the same model run at different resolutions, and the second cluster groups together the model with the highest and lowest resolutions (the EC-Earth3P-HR and the IPSL-CM6-LR models, respectively). This result is consistent with the generally small effect of model resolution on the simulated AMV impacts shown by Hodson et al. (2022), particularly on rainfall over West Africa. However, the highest horizontal resolution in the models analyzed was still below the convection-permitting capabilities of other models for which a more realistic climatology and stronger impact on extremes have been reported (Berthou et al., 2019; Kendon et al., 2019).
Our results are consistent with previous studies regarding the enhancement of seasonal summer rainfall over the Sahel in response to AMV (e.g., Folland et al., 1986; Knight et al., 2006; Zhang and Delworth, 2006; Mohino et al., 2011; Ting et al., 2011; Martin and Thorncroft, 2014; Martin et al., 2014; Villamayor et al., 2018b; Hodson et al., 2022). There is, however, a notable exception to the general agreement between the observed and simulated pattern of impact of AMV on the West African seasonal JAS rainfall shown in this study. Over the westernmost coast, models simulate a strong enhancement of rainfall in response to AMV, while values are weak and not even statistically significant in the observations estimated from CRU (compare Figs. 7 and 1c). This could suggest a systematic bias common to all analyzed models. However, it could also be related to the statistically significant positive trend in the AMV index used for the observational estimate presented in Fig. 1c. Long-term trend variations in the Sahel rainfall have shown a decoupling between the west, which is more prone to drought, and the central and east regions, which are more prone to an enhancement both during the instrumental period and in climate projections (Lebel and Ali, 2009; Mohino et al., 2011; Monerie et al., 2020a, b). When other AMV indices that do not have a long-term trend are used, the regression patterns of observed seasonal rainfall seem more similar to the ones provided by the simulations, with the strongest loads over the westernmost coast (Mohino et al., 2011). This suggests that the disparity shown in this study would come more from the lack of an SST signal in the boundary conditions related to the long-term trend shown by the observed AMV index in Fig. 1b than from a clear failure of the models to simulate AMV impacts.
Our analysis also agrees with the observational results from Badji et al. (2022) on the positive link found between AMV and the number of rainy days, mean intensity, and occurrence of heavy and extreme rainfall events over the western Sahel. However, while all models show a statistically significant response of the monsoon timing over the western Sahel to the AMV phase (Fig. 6b), Badji et al. (2022) reported no clear response. Several factors could contribute to this disparity. First, model deficiencies could prevent them from properly reproducing the impact of AMV on the timing of the monsoon, though the high consistency among models suggests other factors might be at play. Second, there could be other sources of decadal variability, such as the Interdecadal Pacific Oscillation signaled by Badji et al. (2022), which could contribute more strongly than AMV and mask the influence of the latter. Third, there is an uncertainty coming from the definition of the onset and cessation dates, which is different in both studies. In fact, Badji et al. (2022) report slightly different results when a different definition of the monsoon timing is used.
Despite the general agreement between model results and observed estimates, models clearly underestimate the amplitudes of the changes in seasonal rainfall amounts (Fig. 3a and b). This is consistent with previous works, showing that atmosphere general circulation models tend to underestimate the response of West African rainfall to anomalous SSTs (e.g., Joly et al., 2007; Rodriguez-Fonseca et al., 2011; Vellinga et al., 2016; Villamayor and Mohino, 2015). The lack of representation of some processes and feedbacks could hinder the simulation of the correct amplitude of the impacts of SST changes on West African rainfall (Yu et al., 2016; Balkanski et al., 2021). Comparison with the results from Badji et al. (2022) suggests this underestimation also affects other indices. Part of the disparity could be inherent to the comparison of station data with grid points that represent larger areas. Our results further suggest that model biases could also be contributing to this underestimation (Fig. 3c and d). The underrepresentation of other sources of decadal timescale variability, like SST variability in different regions and the direct (i.e., not ocean-mediated) impact of concurrent radiative forcings (Mohino et al., 2011; Hirasawa et al., 2020), which vary in the observations but are fixed in the simulations, could further separate the observed changes from the simulated ones. Additionally, there is an uncertainty coming from the shortness of the observed record. Note also that we are comparing the observed transient response to AMV with the models' response to a persistent SST pattern, for which noise is further filtered out by ensemble averaging.
The experiments analyzed are not exempt from potential problems related to SST restoring techniques. O'Reilly et al. (2023) suggest that restoring SSTs in the tropical North Atlantic can lead to yearly mean exaggerated responses through an unrealistic local release of surface heat fluxes into the atmosphere following a positive AMV phase. However, this inconsistency manifests itself primarily during boreal winter, suggesting that the boreal summer response to AMV analyzed here would be more consistent with results from free (i.e., unrestored) simulations. Furthermore, as discussed above, the comparison with observations suggest that these experiments, far from exaggerating, actually underestimate the observed AMV impact and even account for model biases.
Our results suggest that the observed warming of the North Atlantic SSTs related to the AMV since the 1980s (Fig. 1) could have contributed to the positive trend in the occurrence of extreme events over the Sahel reported in different studies (i.e., Taylor et al., 2017). However, the precise extent of this contribution would need a more detailed analysis that takes other possible sources of variability into account. Additionally, the AMV pattern used in the experiments analyzed in this work shows prominent loads both in the tropical and extratropical North Atlantic. The contribution of each part to the total AMV impact on West Africa and the linearity of the addition of these contributions could be further explored under the DCPP-C protocol by analyzing the tropical and extratropical AMV experiments (Boer et al., 2016).
Last, our results might have implications for decadal prediction. The AMV has been shown to be highly predictable at multiyear to decadal timescales (Kim et al., 2012; Doblas-Reyes et al., 2013; Delgado-Torres et al., 2022). Given that some models are able to predict changes in summer seasonal rainfall totals over the Sahel at decadal timescales and that the main mechanism to explain this potential comes from the AMV (e.g., Gaetani and Mohino, 2013; Mohino et al., 2016; Sheen et al., 2017), our study suggests a potential for decadal prediction systems to also predict changes in the intraseasonal characteristics of rainfall over the Sahel, including the occurrence of extreme events.
The original data has been processed with Climate Data Operators (cdo) (Schulzweida, 2023).
All data used in this work are publicly available. The model simulations can be downloaded from the Earth System Grid Federation CMIP6 archive (https://esgf-index1.ceda.ac.uk/search/cmip6-ceda/ (last access: 8 January 2023) for DCPP-C simulations and https://esgf-index1.ceda.ac.uk/search/primavera-ceda/ (last access: 8 January 2023) for PRIMAVERA simulations). The observational-based data sources used in this study are ERSSTv4 obtained through https://www1.ncdc.noaa.gov/pub/data/cmb/ersst/v4/netcdf/ (last access: 30 November 2022), MSWEP v2.8 obtained through http://www.gloh2o.org/mswep/ (last access: 29 November 2022), CHIRPS v2.0 obtained through https://data.chc.ucsb.edu/products/CHIRPS-2.0/ (last access: 29 November 2022), and CRU TS version 4.06, which was obtained through https://crudata.uea.ac.uk/cru/data/hrg/cru_ts_4.06/ (last access: 29 November 2022).
EM, PAM, JM, MD, and FDR discussed the initial conception of the work. EM, PAM, JM, and MD participated in the methodological design. CDR provided guidance on the model runs. EM did the formal analysis and wrote the original draft. All authors reviewed and edited the paper.
The contact author has declared that none of the authors has any competing interests.
Publisher's note: Copernicus Publications remains neutral with regard to jurisdictional claims made in the text, published maps, institutional affiliations, or any other geographical representation in this paper. While Copernicus Publications makes every effort to include appropriate place names, the final responsibility lies with the authors.
We thank the anonymous reviewers for their comments, which helped improved the paper. Authors acknowledge the use of JASMIN facilities for the PRIMAVERA data as part of the IS-ENES3 project that has received funding from the European Union's Horizon 2020 research and innovation program (grant no. 824084). We acknowledge the World Climate Research Programme, which, through its Working Group on Coupled Modelling, coordinated and promoted CMIP6. We thank the climate modeling groups for producing and making available their model output, the Earth System Grid Federation (ESGF) for archiving the data and providing access, and the multiple funding agencies that support CMIP6 and ESGF.
Elsa Mohino received funding from the Spanish Ministry of Science and Innovation DISTROPIA project (grant no. PID2021-125806NB-I00) and the “Recualificación del Sistema Universitario Español para 2021–2023” call from the Universidad Complutense de Madrid, which has been financed by the Ministry of Universities with funds from the Next Generation of the European Union. Juliette Mignot received support from the JPI Climate/JPI Oceans project ROADMAP (grand no. ANR-19-JPOC-003) and the ARCHANGE project of the “Make our planet great again” program (grant no. ANR-18-MPGA-0001, France).
This paper was edited by Claudia Timmreck and reviewed by two anonymous referees.
Adler, R., Wang, J., Sapiano, M., Huffman, G., Bolvin, D., Nelkin, E., and Program, N. C.: Global Precipitation Climatology Project (GPCP) Climate Data Record (CDR), Version 1.3 (Daily), NOAA National Centers for Environmental Information, data set], https://doi.org/10.7289/V5RX998Z, 2017. a
Badji, A., Mohino, E., Diakhaté, M., Mignot, J., and Gaye, A. T.: Decadal Variability of Rainfall in Senegal: Beyond the Total Seasonal Amount, J. Climate, 35, 5339–5358, https://doi.org/10.1175/JCLI-D-21-0699.1, 2022. a, b, c, d, e, f, g, h
Baek, S. H., Kushnir, Y., Ting, M., Smerdon, J. E., and Lora, J. M.: Regional Signatures of Forced North Atlantic SST Variability: A Limited Role for Aerosols and Greenhouse Gases, Geophys. Res. Lett., 49, e2022GL097794, https://doi.org/10.1029/2022GL097794, 2022. a
Balkanski, Y., Bonnet, R., Boucher, O., Checa-Garcia, R., and Servonnat, J.: Better representation of dust can improve climate models with too weak an African monsoon, Atmos. Chem. Phys., 21, 11423–11435, https://doi.org/10.5194/acp-21-11423-2021, 2021. a
Beck, H. E., Wood, E. F., Pan, M., Fisher, C. K., Miralles, D. G., van Dijk, A. I. J. M., McVicar, T. R., and Adler, R. F.: MSWEP V2 Global 3-Hourly 0.1 degrees Precipitation: Methodology and Quantitative Assessment, B. Am. Meteorol. Soc., 100, 473–502, https://doi.org/10.1175/BAMS-D-17-0138.1, 2019. a
Berthou, S., Rowell, D. P., Kendon, E. J., Roberts, M. J., Stratton, R. A., Crook, J. A., and Wilcox, C.: Improved climatological precipitation characteristics over West Africa at convection-permitting scales, Clim. Dynam., 53, 1991–2011, https://doi.org/10.1007/s00382-019-04759-4, 2019. a
Biasutti, M.: Rainfall trends in the African Sahel: Characteristics, processes, and causes, Wires Clim. Change, 10, e591, https://doi.org/10.1002/wcc.591, 2019. a
Blanchet, J., Aly, C., Vischel, T., Panthou, G., Sane, Y., and Kane, M. D.: Trend in the Co-Occurrence of Extreme Daily Rainfall in West Africa Since 1950, J. Geophys. Res.-Atmos., 123, 1536–1551, https://doi.org/10.1002/2017JD027219, 2018. a, b
Boer, G. J., Smith, D. M., Cassou, C., Doblas-Reyes, F., Danabasoglu, G., Kirtman, B., Kushnir, Y., Kimoto, M., Meehl, G. A., Msadek, R., Mueller, W. A., Taylor, K. E., Zwiers, F., Rixen, M., Ruprich-Robert, Y., and Eade, R.: The Decadal Climate Prediction Project (DCPP) contribution to CMIP6, Geosci. Model Dev., 9, 3751–3777, https://doi.org/10.5194/gmd-9-3751-2016, 2016. a, b, c, d, e, f
Booth, B. B. B., Dunstone, N. J., Halloran, P. R., Andrews, T., and Bellouin, N.: Aerosols implicated as a prime driver of twentieth-century North Atlantic climate variability, Nature, 484, 228–232, https://doi.org/10.1038/nature10946, 2012. a
Boucher, O., Servonnat, J., Albright, A. L., Aumont, O., Balkanski, Y., Bastrikov, V., Bekki, S., Bonnet, R., Bony, S., Bopp, L., Braconnot, P., Brockmann, P., Cadule, P., Caubel, A., Cheruy, F., Codron, F., Cozic, A., Cugnet, D., D'Andrea, F., Davini, P., de Lavergne, C., Denvil, S., Deshayes, J., Devilliers, M., Ducharne, A., Dufresne, J.-L., Dupont, E., Ethe, C., Fairhead, L., Falletti, L., Flavoni, S., Foujols, M.-A., Gardoll, S., Gastineau, G., Ghattas, J., Grandpeix, J.-Y., Guenet, B., Guez, L. E., Guilyardi, E., Guimberteau, M., Hauglustaine, D., Hourdin, F., Idelkadi, A., Joussaume, S., Kageyama, M., Khodri, M., Krinner, G., Lebas, N., Levavasseur, G., Levy, C., Li, L., Lott, F., Lurton, T., Luyssaert, S., Madec, G., Madeleine, J.-B., Maignan, F., Marchand, M., Marti, O., Mellul, L., Meurdesoif, Y., Mignot, J., Musat, I., Ottle, C., Peylin, P., Planton, Y., Polcher, J., Rio, C., Rochetin, N., Rousset, C., Sepulchre, P., Sima, A., Swingedouw, D., Thieblemont, R., Traore, A. K., Vancoppenolle, M., Vial, J., Vialard, J., Viovy, N., and Vuichard, N.: Presentation and Evaluation of the IPSL-CM6A-LR Climate Model, J. Adv. Model. Earth Sy., 12, e2019MS002010, https://doi.org/10.1029/2019MS002010, 2020. a
Chagnaud, G., Panthou, G., Vischel, T., and Lebel, T.: A synthetic view of rainfall intensification in the West African Sahel, Environ. Res. Lett., 17, 044005, https://doi.org/10.1088/1748-9326/ac4a9c, 2022. a
Clement, A., Bellomo, K., Murphy, L. N., Cane, M. A., Mauritsen, T., Rädel, G., and Stevens, B.: The Atlantic Multidecadal Oscillation without a role for ocean circulation, Science, 350, 320–324, https://doi.org/10.1126/science.aab3980, 2015. a
De Longueville, F., Hountondji, Y.-C., Kindo, I., Gemenne, F., and Ozer, P.: Long-term analysis of rainfall and temperature data in Burkina Faso (1950–2013), Int. J. Climatol., 36, 4393–4405, https://doi.org/10.1002/joc.4640, 2016. a, b
Delgado-Torres, C., Donat, M. G., Gonzalez-Reviriego, N., Caron, L.-P., Athanasiadis, P. J., Bretonniere, P.-A., Dunstone, N. J., Ho, A.-C., Nicoli, D., Pankatz, K., Paxian, A., Perez-Zanon, N., Samso Cabre, M., Solaraju-Murali, B., Soret, A., and Doblas-Reyes, F. J.: Multi-Model Forecast Quality Assessment of CMIP6 Decadal Predictions, J. Climate, 35, 4363–4382, https://doi.org/10.1175/JCLI-D-21-0811.1, 2022. a
Diaconescu, E. P., Gachon, P., Scinocca, J., and Laprise, R.: Evaluation of daily precipitation statistics and monsoon onset/retreat over western Sahel in multiple data sets, Clim. Dynam., 45, 1325–1354, https://doi.org/10.1007/s00382-014-2383-2, 2015. a, b
Diakhate, M., Rodriguez-Fonseca, B., Gomara, I., Mohino, E., Dieng, A. L., and Gaye, A. T.: Oceanic Forcing on Interannual Variability of Sahel Heavy and Moderate Daily Rainfall, J. Hydrometeorol., 20, 397–410, https://doi.org/10.1175/JHM-D-18-0035.1, 2019. a
Diatta, S., Diedhiou, C. W., Dione, D. M., and Sambou, S.: Spatial Variation and Trend of Extreme Precipitation in West Africa and Teleconnections with Remote Indices, Atmosphere, 11, 999, https://doi.org/10.3390/atmos11090999, 2020. a, b
Doblas-Reyes, F. J., Andreu-Burillo, I., Chikamoto, Y., Garcia-Serrano, J., Guemas, V., Kimoto, M., Mochizuki, T., Rodrigues, L. R. L., and van Oldenborgh, G. J.: Initialized near-term regional climate change prediction, Nat. Commun., 4, 1715, https://doi.org/10.1038/ncomms2704, 2013. a
Dunning, C. M., Black, E. C. L., and Allan, R. P.: The onset and cessation of seasonal rainfall over Africa, J. Geophys. Res.-Atmos., 121, 11405–11424, https://doi.org/10.1002/2016JD025428, 2016. a
Dunning, C. M., Allan, R. P., and Black, E.: Identification of deficiencies in seasonal rainfall simulated by CMIP5 climate models, Environ. Res. Lett., 12, 114001, https://doi.org/10.1088/1748-9326/aa869e, 2017. a
Döscher, R., Acosta, M., Alessandri, A., Anthoni, P., Arsouze, T., Bergman, T., Bernardello, R., Boussetta, S., Caron, L.-P., Carver, G., Castrillo, M., Catalano, F., Cvijanovic, I., Davini, P., Dekker, E., Doblas-Reyes, F. J., Docquier, D., Echevarria, P., Fladrich, U., Fuentes-Franco, R., Gröger, M., v. Hardenberg, J., Hieronymus, J., Karami, M. P., Keskinen, J.-P., Koenigk, T., Makkonen, R., Massonnet, F., Ménégoz, M., Miller, P. A., Moreno-Chamarro, E., Nieradzik, L., van Noije, T., Nolan, P., O'Donnell, D., Ollinaho, P., van den Oord, G., Ortega, P., Prims, O. T., Ramos, A., Reerink, T., Rousset, C., Ruprich-Robert, Y., Le Sager, P., Schmith, T., Schrödner, R., Serva, F., Sicardi, V., Sloth Madsen, M., Smith, B., Tian, T., Tourigny, E., Uotila, P., Vancoppenolle, M., Wang, S., Wårlind, D., Willén, U., Wyser, K., Yang, S., Yepes-Arbós, X., and Zhang, Q.: The EC-Earth3 Earth system model for the Coupled Model Intercomparison Project 6, Geosci. Model Dev., 15, 2973–3020, https://doi.org/10.5194/gmd-15-2973-2022, 2022. a
Eyring, V., Bony, S., Meehl, G. A., Senior, C. A., Stevens, B., Stouffer, R. J., and Taylor, K. E.: Overview of the Coupled Model Intercomparison Project Phase 6 (CMIP6) experimental design and organization, Geosci. Model Dev., 9, 1937–1958, https://doi.org/10.5194/gmd-9-1937-2016, 2016. a
Farneti, R., Stiz, A., and Ssebandeke, J. B.: Improvements and persistent biases in the southeast tropical Atlantic in CMIP models, Npj Climate and Atmospheric Science, 5, 42, https://doi.org/10.1038/s41612-022-00264-4, 2022. a, b
Fiedler, S., Crueger, T., D'Agostino, R., Peters, K., Becker, T., Leutwyler, D., Paccini, L., Burdanowitz, J., Buehler, S. A., Cortes, A. U., Dauhut, T., Dommenget, D., Fraedrich, K., Jungandreas, L., Maher, N., Naumann, A. K., Rugenstein, M., Sakradzija, M., Schmidt, H., Sielmann, F., Stephan, C., Timmreck, C., Zhu, X., and Stevens, B.: Simulated Tropical Precipitation Assessed across Three Major Phases of the Coupled Model Intercomparison Project (CMIP), Mon. Weather Rev., 148, 3653–3680, https://doi.org/10.1175/MWR-D-19-0404.1, 2020. a
Folland, C., Palmer, T., and Parker, D.: Sahel Rainfall and Worldwide Sea Temperatures, 1901–85, Nature, 320, 602–607, https://doi.org/10.1038/320602a0, 1986. a, b, c
Fontaine, B., Garcia-Serrano, J., Roucou, P., Rodriguez-Fonseca, B., Losada, T., Chauvin, F., Gervois, S., Sijikumar, S., Ruti, P., and Janicot, S.: Impacts of warm and cold situations in the Mediterranean basins on the West African monsoon: observed connection patterns (1979–2006) and climate simulations, Clim. Dynam., 35, 95–114, https://doi.org/10.1007/s00382-009-0599-3, 2010. a
Fontaine, B., Gaetani, M., Ullmann, A., and Roucou, P.: Time evolution of observed July-September sea surface temperature-Sahel climate teleconnection with removed quasi-global effect (1900–2008), J. Geophys. Res.-Atmos., 116, D04105, https://doi.org/10.1029/2010JD014843, 2011. a
Funk, C., Peterson, P., Landsfeld, M., Pedreros, D., Verdin, J., Shukla, S., Husak, G., Rowland, J., Harrison, L., Hoell, A., and Michaelsen, J.: The climate hazards infrared precipitation with stations-a new environmental record for monitoring extremes, Scientific Data, 2, 150066, https://doi.org/10.1038/sdata.2015.66, 2015. a, b
Gaetani, M. and Mohino, E.: Decadal Prediction of the Sahelian Precipitation in CMIP5 Simulations, J. Climate, 26, 7708–7719, https://doi.org/10.1175/JCLI-D-12-00635.1, 2013. a
Gaetani, M., Fontaine, B., Roucou, P., and Baldi, M.: Influence of the Mediterranean Sea on the West African monsoon: Intraseasonal variability in numerical simulations, J. Geophys. Res.-Atmos., 115, D24115, https://doi.org/10.1029/2010JD014436, 2010. a
Guan, K., Sultan, B., Biasutti, M., Baron, C., and Lobell, D. B.: What aspects of future rainfall changes matter for crop yields in West Africa?, Geophys. Res. Lett., 42, 8001–8010, https://doi.org/10.1002/2015GL063877, 2015. a
Haarsma, R., Acosta, M., Bakhshi, R., Bretonnière, P.-A., Caron, L.-P., Castrillo, M., Corti, S., Davini, P., Exarchou, E., Fabiano, F., Fladrich, U., Fuentes Franco, R., García-Serrano, J., von Hardenberg, J., Koenigk, T., Levine, X., Meccia, V. L., van Noije, T., van den Oord, G., Palmeiro, F. M., Rodrigo, M., Ruprich-Robert, Y., Le Sager, P., Tourigny, E., Wang, S., van Weele, M., and Wyser, K.: HighResMIP versions of EC-Earth: EC-Earth3P and EC-Earth3P-HR – description, model computational performance and basic validation, Geosci. Model Dev., 13, 3507–3527, https://doi.org/10.5194/gmd-13-3507-2020, 2020. a
Haarsma, R. J., Roberts, M. J., Vidale, P. L., Senior, C. A., Bellucci, A., Bao, Q., Chang, P., Corti, S., Fučkar, N. S., Guemas, V., von Hardenberg, J., Hazeleger, W., Kodama, C., Koenigk, T., Leung, L. R., Lu, J., Luo, J.-J., Mao, J., Mizielinski, M. S., Mizuta, R., Nobre, P., Satoh, M., Scoccimarro, E., Semmler, T., Small, J., and von Storch, J.-S.: High Resolution Model Intercomparison Project (HighResMIP v1.0) for CMIP6, Geosci. Model Dev., 9, 4185–4208, https://doi.org/10.5194/gmd-9-4185-2016, 2016. a
Harris, I., Osborn, T. J., Jones, P., and Lister, D.: Version 4 of the CRU TS monthly high-resolution gridded multivariate climate dataset, Scientific Data, 7, 109, https://doi.org/10.1038/s41597-020-0453-3, 2020. a, b
Hartmann, D. L., Klein Tank, A. M., Rusticucci, M., Alexander, L. V., Brönnimann, S., Charabi, Y. A. R., Dentener, F. J., Dlugokencky, E. J., Easterling, D. R., Kaplan, A., Soden, B. J., Thorne, P. W., Wild, M., and Zhai, P.: Observations: Atmosphere and surface, in: Climate Change 2013 the Physical Science Basis, Stocker, T. F., Qin, D., Plattner, G.-K., Tignor, M., Allen, S. K., Boschung, J., Nauels, A., Xia, Y., Bex, V., and Midgley, P. M., Cambridge University Press, https://doi.org/10.1017/CBO9781107415324.008, 159–254, 2013. a
Herold, N., Alexander, L. V., Donat, M. G., Contractor, S., and Becker, A.: How much does it rain over land?, Geophys. Res. Lett., 43, 341–348, https://doi.org/10.1002/2015GL066615, 2016. a
Hirasawa, H., Kushner, P. J., Sigmond, M., Fyfe, J., and Deser, C.: Anthropogenic Aerosols Dominate Forced Multidecadal Sahel Precipitation Change through Distinct Atmospheric and Oceanic Drivers, J. Climate, 33, 10187–10204, https://doi.org/10.1175/JCLI-D-19-0829.1, 2020. a
Hodson, D. L. R., Bretonniere, P.-A., Cassou, C., Davini, P., Klingaman, N. P., Lohmann, K., Lopez-Parages, J., Martin-Rey, M., Moine, M.-P., Monerie, P.-A., Putrasahan, D. A., Roberts, C. D., Robson, J., Ruprich-Robert, Y., Sanchez-Gomez, E., Seddon, J., and Senan, R.: Coupled climate response to Atlantic Multidecadal Variability in a multi-model multi-resolution ensemble, Clim. Dynam., 59, 805–836, https://doi.org/10.1007/s00382-022-06157-9, 2022. a, b, c, d, e, f, g, h
Huang, B., Banzon, V. F., Freeman, E., Lawrimore, J., Liu, W., Peterson, T. C., Smith, T. M., Thorne, P. W., Woodruff, S. D., and Zhang, H.-M.: Extended Reconstructed Sea Surface Temperature Version 4 (ERSST.v4). Part I: Upgrades and Intercomparisons, J. Climate, 28, 911–930, https://doi.org/10.1175/JCLI-D-14-00006.1, 2015. a
Ingram, K. T., Roncoli, M. C., and Kirshen, P. H.: Opportunities and constraints for farmers of west Africa to use seasonal precipitation forecasts with Burkina Faso as a case study, Agr. Syst., 74, 331–349, https://doi.org/10.1016/S0308-521X(02)00044-6, 2002. a
Joly, M., Voldoire, A., Douville, H., Terray, P., and Royer, J.-F.: African monsoon teleconnections with tropical SSTs: validation and evolution in a set of IPCC4 simulations, Clim. Dynam., 29, 1–20, https://doi.org/10.1007/s00382-006-0215-8, 2007. a
Kendon, E. J., Stratton, R. A., Tucker, S., Marsham, J. H., Berthou, S., Rowell, D. P., and Senior, C. A.: Enhanced future changes in wet and dry extremes over Africa at convection-permitting scale, Nat. Commun., 10, 1794, https://doi.org/10.1038/s41467-019-09776-9, 2019. a
Kerr, R. A.: A North Atlantic climate pacemaker for the centuries, Science, 288, 1984–1986, https://doi.org/10.1126/science.288.5473.1984, 2000. a
Kim, H.-M., Webster, P. J., and Curry, J. A.: Evaluation of short-term climate change prediction in multi-model CMIP5 decadal hindcasts, Geophys. Res. Lett., 39, L10701, https://doi.org/10.1029/2012GL051644, 2012. a
Kim, W. M., Yeager, S. G., and Danabasoglu, G.: Key Role of Internal Ocean Dynamics in Atlantic Multidecadal Variability During the Last Half Century, Geophys. Res. Lett., 45, 13449–13457, https://doi.org/10.1029/2018GL080474, 2018. a
Knight, J. R., Allan, R. J., Folland, C. K., Vellinga, M., and Mann, M. E.: A signature of persistent natural thermohaline circulation cycles in observed climate, Geophys. Res. Lett., 32, L20708, https://doi.org/10.1029/2005GL024233, 2005. a
Knight, J. R., Folland, C. K., and Scaife, A. A.: Climate impacts of the Atlantic Multidecadal Oscillation, Geophys. Res. Lett., 33, L17706, https://doi.org/10.1029/2006GL026242, 2006. a, b, c, d, e
Lebel, T. and Ali, A.: Recent trends in the Central and Western Sahel rainfall regime (1990–2007), J. Hydrol., 375, 52–64, https://doi.org/10.1016/j.jhydrol.2008.11.030, 2009. a, b
Liebmann, B., Blade, I., Kiladis, G. N., Carvalho, L. M. V., Senay, G. B., Allured, D., Leroux, S., and Funk, C.: Seasonality of African Precipitation from 1996 to 2009, J. Climate, 25, 4304–4322, https://doi.org/10.1175/JCLI-D-11-00157.1, 2012. a, b
Losada, T., Rodriguez-Fonseca, B., Janicot, S., Gervois, S., Chauvin, F., and Ruti, P.: A multi-model approach to the Atlantic Equatorial mode: impact on the West African monsoon, Clim. Dynam., 35, 29–43, https://doi.org/10.1007/s00382-009-0625-5, 2010. a
Ly, M., Traore, S. B., Alhassane, A., and Sarr, B.: Evolution of some observed climate extremes in the West African Sahel, Weather and Climate Extremes, 1, 19–25, https://doi.org/10.1016/j.wace.2013.07.005, 2013. a, b
Madec, G., Bourdallé-Badie, R., and the NEMO team: NEMO ocean engine, https://doi.org/10.5281/ZENODO.1472492, 2017. a
Martin, E. R. and Thorncroft, C. D.: The impact of the AMO on the West African monsoon annual cycle, Q. J. Roy. Meteor. Soc., 140, 31–46, https://doi.org/10.1002/qj.2107, 2014. a, b, c
Martin, E. R., Thorncroft, C., and Booth, B. B. B.: The Multidecadal Atlantic SST-Sahel Rainfall Teleconnection in CMIP5 Simulations, J. Climate, 27, 784–806, https://doi.org/10.1175/JCLI-D-13-00242.1, 2014. a, b, c
Martín-Rey, M., Rodríguez-Fonseca, B., and Polo, I.: Atlantic opportunities for ENSO prediction, Geophys. Res. Lett., 42, 6802–6810, https://doi.org/10.1002/2015GL065062, 2015. a
Martín-Rey, M., Polo, I., Rodríguez-Fonseca, B., Losada, T., and Lazar, A.: Is There Evidence of Changes in Tropical Atlantic Variability Modes under AMO Phases in the Observational Record?, J. Climate, 31, 515–536, https://doi.org/10.1175/JCLI-D-16-0459.1, 2018. a
Mohino, E., Janicot, S., and Bader, J.: Sahel rainfall and decadal to multi-decadal sea surface temperature variability, Clim. Dynam., 37, 419–440, https://doi.org/10.1007/s00382-010-0867-2, 2011. a, b, c, d, e, f, g
Mohino, E., Keenlyside, N., and Pohlmann, H.: Decadal prediction of Sahel rainfall: where does the skill (or lack thereof) come from?, Clim. Dynam., 47, 3593–3612, https://doi.org/10.1007/s00382-016-3416-9, 2016. a
Mohino, E., Rodriguez-fonseca, B., Mechoso, C. R., Losada, T., and Polo, I.: Relationships among Intermodel Spread and Biases in Tropical Atlantic Sea Surface Temperatures, J. Climate, 32, 3615–3635, https://doi.org/10.1175/JCLI-D-18-0846.1, 2019. a
Monerie, P.-A., Robson, J., Dong, B., Hodson, D. L. R., and Klingaman, N. P.: Effect of the Atlantic Multidecadal Variability on the Global Monsoon, Geophys. Res. Lett., 46, 1765–1775, https://doi.org/10.1029/2018GL080903, 2019. a, b
Monerie, P.-A., Sanchez-Gomez, E., Gaetani, M., Mohino, E., and Dong, B.: Future evolution of the Sahel precipitation zonal contrast in CESM1, Clim. Dynam., 55, 2801–2821, https://doi.org/10.1007/s00382-020-05417-w, 2020a. a
Monerie, P.-A., Wainwright, C. M., Sidibe, M., and Akinsanola, A. A.: Model uncertainties in climate change impacts on Sahel precipitation in ensembles of CMIP5 and CMIP6 simulations, Clim. Dynam., 55, 1385–1401, https://doi.org/10.1007/s00382-020-05332-0, 2020b. a
Monerie, P.-A., Robson, J., Dong, B., and Hodson, D.: Role of the Atlantic multidecadal variability in modulating East Asian climate, Clim. Dynam., 56, 381–398, https://doi.org/10.1007/s00382-020-05477-y, 2021. a
Nieto, R., Gimeno, L., and Trigo, R. M.: A Lagrangian identification of major sources of Sahel moisture, Geophys. Res. Lett., 33, L18707, https://doi.org/10.1029/2006GL027232, 2006. a
Novella, N. S. and Thiaw, W. M.: African Rainfall Climatology Version 2 for Famine Early Warning Systems, J. Appl. Meteorol. Clim., 52, 588–606, https://doi.org/10.1175/JAMC-D-11-0238.1, 2013. a
O'Reilly, C. H. H., Patterson, M., Robson, J., Monerie, P. A., Hodson, D., and Ruprich-Robert, Y.: Challenges with interpreting the impact of Atlantic Multidecadal Variability using SST-restoring experiments, Npj Climate and Atmospheric Science, 6, 14, https://doi.org/10.1038/s41612-023-00335-0, 2023. a
Ottera, O. H., Bentsen, M., Drange, H., and Suo, L.: External forcing as a metronome for Atlantic multidecadal variability, Nat. Geosci., 3, 688–694, https://doi.org/10.1038/NGEO955, 2010. a
Panthou, G., Vischel, T., Lebel, T., Quantin, G., Pugin, A.-C. F., Blanchet, J., and Ali, A.: From pointwise testing to a regional vision: An integrated statistical approach to detect nonstationarity in extreme daily rainfall. Application to the Sahelian region, J. Geophys. Res.-Atmos., 118, 8222–8237, https://doi.org/10.1002/jgrd.50340, 2013. a
Panthou, G., Vischel, T., and Lebel, T.: Recent trends in the regime of extreme rainfall in the Central Sahel, Int. J. Climatol., 34, 3998–4006, https://doi.org/10.1002/joc.3984, 2014. a, b
Panthou, G., Lebel, T., Vischel, T., Quantin, G., Sane, Y., Ba, A., Ndiaye, O., Diongue-Niang, A., and Diopkane, M.: Rainfall intensification in tropical semi-arid regions: the Sahelian case, Environ. Res. Lett., 13, 064013, https://doi.org/10.1088/1748-9326/aac334, 2018. a, b, c
Qasmi, S., Cassou, C., and Boe, J.: Teleconnection Processes Linking the Intensity of the Atlantic Multidecadal Variability to the Climate Impacts over Europe in Boreal Winter, J. Climate, 33, 2681–2700, https://doi.org/10.1175/JCLI-D-19-0428.1, 2020. a
Qin, M., Dai, A., and Hua, W.: Quantifying Contributions of Internal Variability and External Forcing to Atlantic Multidecadal Variability Since 1870, Geophys. Res. Lett., 47, e2020GL089504, https://doi.org/10.1029/2020GL089504, 2020. a
Richter, I. and Tokinaga, H.: An overview of the performance of CMIP6 models in the tropical Atlantic: mean state, variability, and remote impacts, Clim. Dynam., 55, 2579–2601, https://doi.org/10.1007/s00382-020-05409-w, 2020. a, b
Roberts, C. D., Senan, R., Molteni, F., Boussetta, S., Mayer, M., and Keeley, S. P. E.: Climate model configurations of the ECMWF Integrated Forecasting System (ECMWF-IFS cycle 43r1) for HighResMIP, Geosci. Model Dev., 11, 3681–3712, https://doi.org/10.5194/gmd-11-3681-2018, 2018. a, b, c
Rodriguez-Fonseca, B., Janicot, S., Mohino, E., Losada, T., Bader, J., Caminade, C., Chauvin, F., Fontaine, B., Garcia-Serrano, J., Gervois, S., Joly, M., Polo, I., Ruti, P., Roucou, P., and Voldoire, A.: Interannual and decadal SST-forced responses of the West African monsoon, Atmos. Sci. Lett., 12, 67–74, https://doi.org/10.1002/asl.308, 2011. a
Rotstayn, L. D. and Lohmann, U.: Tropical rainfall trends and the indirect aerosol effect, J. Climate, 15, 2103–2116, https://doi.org/10.1175/1520-0442(2002)015<2103:TRTATI>2.0.CO;2, 2002. a
Rowell, D. P.: The impact of Mediterranean SSTs on the Sahelian rainfall season, J. Climate, 16, 849–862, https://doi.org/10.1175/1520-0442(2003)016<0849:TIOMSO>2.0.CO;2, 2003. a
Ruprich-Robert, Y., Msadek, R., Castruccio, F., Yeager, S., Delworth, T., and Danabasoglu, G.: Assessing the Climate Impacts of the Observed Atlantic Multidecadal Variability Using the GFDL CM2.1 and NCAR CESM1 Global Coupled Models, J. Climate, 30, 2785–2810, https://doi.org/10.1175/JCLI-D-16-0127.1, 2017. a
Ruprich-Robert, Y., Moreno-Chamarro, E., Levine, X., Bellucci, A., Cassou, C., Castruccio, F., Davini, P., Eade, R., Gastineau, G., Hermanson, L., Hodson, D., Lohmann, K., Lopez-Parages, J., Monerie, P.-A., Nicoli, D., Qasmi, S., Roberts, C. D., Sanchez-Gomez, E., Danabasoglu, G., Dunstone, N., Martin-Rey, M., Msadek, R., Robson, J., Smith, D., and Tourigny, E.: Impacts of Atlantic multidecadal variability on the tropical Pacific: a multi-model study, Npj Climate and Atmospheric Science, 4, 33, https://doi.org/10.1038/s41612-021-00188-5, 2021. a, b
Sanogo, S., Fink, A. H., Omotosho, J. A., Ba, A., Redl, R., and Ermert, V.: Spatio-temporal characteristics of the recent rainfall recovery in West Africa, Int. J. Climatol., 35, 4589–4605, https://doi.org/10.1002/joc.4309, 2015. a, b, c
Sanogo, S., Peyrille, P., Roehrig, R., Guichard, F., and Ouedraogo, O.: Extreme Precipitating Events in Satellite and Rain Gauge Products over the Sahel, J. Climate, 35, 1915–1938, https://doi.org/10.1175/JCLI-D-21-0390.1, 2022. a
Satgé, F., Defrance, D., Sultan, B., Bonnet, M.-P., Seyler, F., Rouche, N., Pierron, F., and Paturel, J.-E.: Evaluation of 23 gridded precipitation datasets across West Africa, J. Hydrol., 581, 124412, https://doi.org/10.1016/j.jhydrol.2019.124412, 2020. a, b, c, d, e
Schär, C., Ban, N., Fischer, E. M., Rajczak, J., Schmidli, J., Frei, C., Giorgi, F., Karl, T. R., Kendon, E. J., Tank, A. M. G. K., O'Gorman, P. A., Sillmann, J., Zhang, X., and Zwiers, F. W.: Percentile indices for assessing changes in heavy precipitation events, Climatic Change, 137, 201–216, https://doi.org/10.1007/s10584-016-1669-2, 2016. a
Schulzweida, U.: CDO User Guide (2.3.0), Zenodo [code], https://doi.org/10.5281/zenodo.10020800, 2023. a
Sheen, K. L., Smith, D. M., Dunstone, N. J., Eade, R., Rowell, D. P., and Vellinga, M.: Skilful prediction of Sahel summer rainfall on inter-annual and multi-year timescales, Nat. Commun., 8, 14966, https://doi.org/10.1038/ncomms14966, 2017. a
Sultan, B. and Janicot, S.: The West African Monsoon Dynamics. Part II: The “Preonset” and “Onset” of the Summer Monsoon, J. Climate, 16, 3407–3427, https://doi.org/10.1175/1520-0442(2003)016<3407:TWAMDP>2.0.CO;2, 2003. a
Sultan, B., Baron, C., Dingkuhn, M., Sarr, B., and Janicot, S.: Agricultural impacts of large-scale variability of the West African monsoon, Agr. Forest Meteorol., 128, 93–110, https://doi.org/10.1016/j.agrformet.2004.08.005, 2005. a
Sutton, R. T. and Hodson, D. L. R.: Atlantic Ocean forcing of North American and European summer climate, Science, 309, 115–118, https://doi.org/10.1126/science.1109496, 2005. a
Taylor, C. M., Belusic, D., Guichard, F., Arker, D. J. P., Vischel, T., Bock, O., Harris, P. P., Janicot, S., Klein, C., and Panthou, G.: Frequency of extreme Sahelian storms tripled since 1982 in satellite observations, Nature, 544, 475–478, https://doi.org/10.1038/nature22069, 2017. a, b
Terray, L.: Evidence for multiple drivers of North Atlantic multi-decadal climate variability, Geophys. Res. Lett., 39, L19712, https://doi.org/10.1029/2012GL053046, 2012. a, b
Thorncroft, C. D., Nguyen, H., Zhang, C., and Peyrille, P.: Annual cycle of the West African monsoon: regional circulations and associated water vapour transport, Q. J. Roy. Meteor. Soc., 137, 129–147, https://doi.org/10.1002/qj.728, 2011. a
Ting, M., Kushnir, Y., Seager, R., and Li, C.: Robust features of Atlantic multi-decadal variability and its climate impacts, Geophys. Res. Lett., 38, L17705, https://doi.org/10.1029/2011GL048712, 2011. a, b, c
Trenberth, K. E. and Shea, D. J.: Atlantic hurricanes and natural variability in 2005, Geophys. Res. Lett., 33, L12704, https://doi.org/10.1029/2006GL026894, 2006. a
Turco, M., Jerez, S., Donat, M. G., Toreti, A., Vicente-Serrano, S. M., and Doblas-Reyes, F. J.: A Global Probabilistic Dataset for Monitoring Meteorological Droughts, B. Am. Meteorol. Soc., 101, E1628–E1644, https://doi.org/10.1175/BAMS-D-19-0192.1, 2020. a
Vellinga, M., Roberts, M., Vidale, P. L., Mizielinski, M. S., Demory, M.-E., Schiemann, R., Strachan, J., and Bain, C.: Sahel decadal rainfall variability and the role of model horizontal resolution, Geophys. Res. Lett., 43, 326–333, https://doi.org/10.1002/2015GL066690, 2016. a
Villamayor, J. and Mohino, E.: Robust Sahel drought due to the Interdecadal Pacific Oscillation in CMIP5 simulations, Geophys. Res. Lett., 42, 1214–1222, https://doi.org/10.1002/2014GL062473, 2015. a
Villamayor, J., Ambrizzi, T., and Mohino, E.: Influence of decadal sea surface temperature variability on northern Brazil rainfall in CMIP5 simulations, Clim. Dynam., 51, 563–579, https://doi.org/10.1007/s00382-017-3941-1, 2018a. a
Villamayor, J., Mohino, E., Khodri, M., Mignot, J., and Janicot, S.: Atlantic Control of the Late Nineteenth-Century Sahel Humid Period, J. Climate, 31, 8225–8240, https://doi.org/10.1175/JCLI-D-18-0148.1, 2018b. a, b, c
Voldoire, A., Saint-Martin, D., Senesi, S., Decharme, B., Alias, A., Chevallier, M., Colin, J., Gueremy, J.-F., Michou, M., Moine, M.-P., Nabat, P., Roehrig, R., Salas y Melia, D., Seferian, R., Valcke, S., Beau, I., Belamari, S., Berthet, S., Cassou, C., Cattiaux, J., Deshayes, J., Douville, H., Ethe, C., Franchisteguy, L., Geoffroy, O., Levy, C., Madec, G., Meurdesoif, Y., Msadek, R., Ribes, A., Sanchez-Gomez, E., Terray, L., and Waldman, R.: Evaluation of CMIP6 DECK Experiments With CNRM-CM6-1, J. Adv. Model. Earth Sy., 11, 2177–2213, https://doi.org/10.1029/2019MS001683, 2019. a, b
Watanabe, M. and Tatebe, H.: Reconciling roles of sulphate aerosol forcing and internal variability in Atlantic multidecadal climate changes, Clim. Dynam., 53, 4651–4665, https://doi.org/10.1007/s00382-019-04811-3, 2019. a
Wilks, D. S.: Statistical Methods in the Atmospheric Sciences, 4th edn., Elsevier, Amsterdam, https://doi.org/10.1016/C2017-0-03921-6, 2019. a
WMO: Guidelines on analysis of extremes in a changing climate in support of informed decisions for adaptation, edited by: Klein Tank, A. M. G., Zwiers, F. W., and Zhang, X., WCDMP no. 72, WMO-TD no. 1500, https://www.ecad.eu/documents/WCDMP_72_TD_1500_en_1.pdf (last access: 8 January 2024), 2009. a, b, c
Yu, M., Wang, G., and Pal, J. S.: Effects of vegetation feedback on future climate change over West Africa, Clim. Dynam., 46, 3669–3688, https://doi.org/10.1007/s00382-015-2795-7, 2016. a
Zhang, R.: On the persistence and coherence of subpolar sea surface temperature and salinity anomalies associated with the Atlantic multidecadal variability, Geophys. Res. Lett., 44, 7865–7875, https://doi.org/10.1002/2017GL074342, 2017. a, b
Zhang, R. and Delworth, T. L.: Impact of Atlantic multidecadal oscillations on India/Sahel rainfall and Atlantic hurricanes, Geophys. Res. Lett., 33, L17712, https://doi.org/10.1029/2006GL026267, 2006. a, b, c, d
Zhang, R., Sutton, R., Danabasoglu, G., Kwon, Y.-O., Marsh, R., Yeager, S. G., Amrhein, D. E., and Little, C. M.: A Review of the Role of the Atlantic Meridional Overturning Circulation in Atlantic Multidecadal Variability and Associated Climate Impacts, Rev. Geophys., 57, 316–375, https://doi.org/10.1029/2019RG000644, 2019. a, b, c
Zhang, X., Alexander, L., Hegerl, G. C., Jones, P., Tank, A. K., Peterson, T. C., Trewin, B., and Zwiers, F. W.: Indices for monitoring changes in extremes based on daily temperature and precipitation data, Wires Clim. Change, 2, 851–870, https://doi.org/10.1002/wcc.147, 2011. a