the Creative Commons Attribution 4.0 License.
the Creative Commons Attribution 4.0 License.
 | 12 Sep 2024
Climatology and trends of concurrent temperature extremes in the global extratropics
Gabriele Messori
Antonio Segalini
Alexandre M. Ramos
Simultaneous occurrences of multiple heatwaves or cold spells in remote geographical regions have drawn considerable attention in the literature due to their potentially far-reaching impacts. We introduce a flexible toolbox to study such concurrent temperature extremes with adjustable parameters that different users can tailor to their specific needs. We then use the toolbox to present a climatological analysis of spatially compounding heatwaves and cold spells in the global midlatitudes. Specific geographical areas, such as western Russia, central Europe, southwestern Eurasia and western North America, emerge as hotspots for concurrent temperature extremes. Concurrent heatwaves are becoming more frequent, longer-lasting and more extended in the Northern Hemisphere, while the opposite holds for concurrent cold spells. Concurrent heatwaves in the Southern Hemisphere are comparatively rare but have been increasing in both number and extent. Notably, several of these trends in concurrent temperature extremes are significantly stronger than the corresponding trends in all temperature extremes.
- Article
(13227 KB) - Full-text XML
- BibTeX
- EndNote


Extreme climate events often do not occur in isolation but are triggered by complex processes leading to multiple extremes. An example are events occurring roughly simultaneously at remote locations. These are typically due to specific large-scale atmospheric or oceanic features and are referred to as concurrent, or spatially compounding, extremes (Zscheischler et al., 2020). Temperature extremes often play a prominent role in concurrent events, either in isolation or in conjunction with other extreme event categories. Specific examples in the Northern Hemisphere (NH) include drought–cold–wet and windy extremes during winter 2013/14 (Davies, 2015), heatwave–heavy precipitation during summer 2010 (Lau and Kim, 2012; di Capua et al., 2021), and concurrent heatwaves and heatwave–heavy precipitation during summer 2018 (Kornhuber et al., 2019). Building upon these episodic events, the literature has considered recurrent spatially compounding extremes, such as wintertime cold, wet and windy extremes in North America and Europe (Messori et al., 2016; Leeding et al., 2023; Riboldi et al., 2023; Messori and Faranda, 2023) and opposite temperature extremes in eastern Asia and North America (Sung et al., 2021). A parallel line of work has analysed large-scale atmospheric patterns favouring concurrent extremes, highlighting the role of large-amplitude or recurrent atmospheric waves (Coumou et al., 2014; Röthlisberger et al., 2019; Kornhuber et al., 2020; Bui et al., 2022; White et al., 2022; Kornhuber and Messori, 2023). These waves are particularly effective in engendering temperature extremes in both the warm and cold seasons (e.g. Screen and Simmonds, 2014), whose synchronised occurrence triggers detrimental socio-economic and environmental impacts such as widespread crop failures (Tigchelaar et al., 2018; Kornhuber et al., 2020; Gaupp et al., 2020), increased mortality, wildfires and power supply disruptions (Vogel et al., 2019).
Previous work on concurrent temperature extremes has often focussed on specific regions or seasons (e.g. Röthlisberger et al., 2019; Kornhuber et al., 2019). More recent work has provided an overview of long-term trends and geographical hotspots of concurrent extremes (Rogers et al., 2022) but with a focus on NH heatwaves and for a fixed definition of what is “extreme”. Broader studies looking at compound extremes or multi-risks have not tailored their analyses and methods specifically to temperature extremes, providing limited flexibility for defining both the extremes themselves and their spatial relation (e.g. Claassen et al., 2023). In this study, we pursue a dual aim. We first introduce a flexible toolbox to compute statistics on concurrent temperature extremes with adjustable parameters that different users can tailor to their specific needs. We then use the toolbox to present a climatological and trend analysis of concurrent hot and cold extremes in both hemispheres. While the toolbox was developed specifically for temperature extremes, it can in principle take any single-level variable as input. We provide a proof of concept by applying it to 10 m wind extremes in Appendix B.
Input and parameters. Our toolbox takes as input gridded temperature (or temperature anomaly) data on a regular latitude–longitude grid. The users first need to (i) define a latitudinal domain, (ii) pick a season in the form of a set of months, (iii) choose whether to limit the analysis to land grid points or not, and (iv) select a percentile to define the temperature extremes. After this, the toolbox computes the percentile threshold at each grid box and identifies grid points above (for heatwaves) or below (for cold spells) said threshold (Fig. 1a). Next, the users can impose a minimum duration requirement, such that only grid points exceeding the threshold over a set number of consecutive days are retained (Fig. 1b).
Clustering and minimum extent. In the following step, the users can flexibly define how to cluster different connected areas of extremely hot or cold grid points. Often, one finds a large connected area of extremely hot or cold temperatures, with smaller surrounding areas separated by a few grid points from the main area. These are likely caused by the same physical driver(s) as the main connected area. For example, there is no a priori reason to believe that two regions of temperature extremes with a gap the size of a single grid point between them should be associated with independent large-scale drivers. The users can decide not to cluster different connected areas, to cluster them based on the distance between the locations of each connected area's centroid or to cluster them based on the distance between the closest grid boxes of each pair of connected areas. The output of the clustering is a set of well-separated temperature extreme regions (Fig. 1c). We are aware of existing clustering algorithms, which have been used in the context of compound climate extremes (e.g. Tilloy et al., 2022). We do not claim that our algorithm outperforms these, but we instead assert that it provides a more intuitive parameter input set in terms of distance in kilometres (centroids or closest points) as opposed to quantities such as minimum density of points in a given neighbourhood. Finally, the user can impose a minimum areal extent for each clustered temperature extreme region (Fig. 1c). Given that our toolbox does not consider set regions but instead updates the boundaries of the temperature extremes at every time step, we do not consider time lags in the compounding but instead output the statistics at every time step of our data (see also Rogers et al., 2022, for a similar argument).
We recognise that our toolbox comes with a number of conceptual simplifications. For example, it ignores the shape of the connected extreme temperature areas when performing the clustering (beyond implicitly taking it into account if computing centroids) and imposes persistence as continuous exceedance of a threshold instead of allowing for discontinuous exceedances clustered in time. These were decided upon to strike a balance between the flexibility and the interpretability and usability of the toolbox.
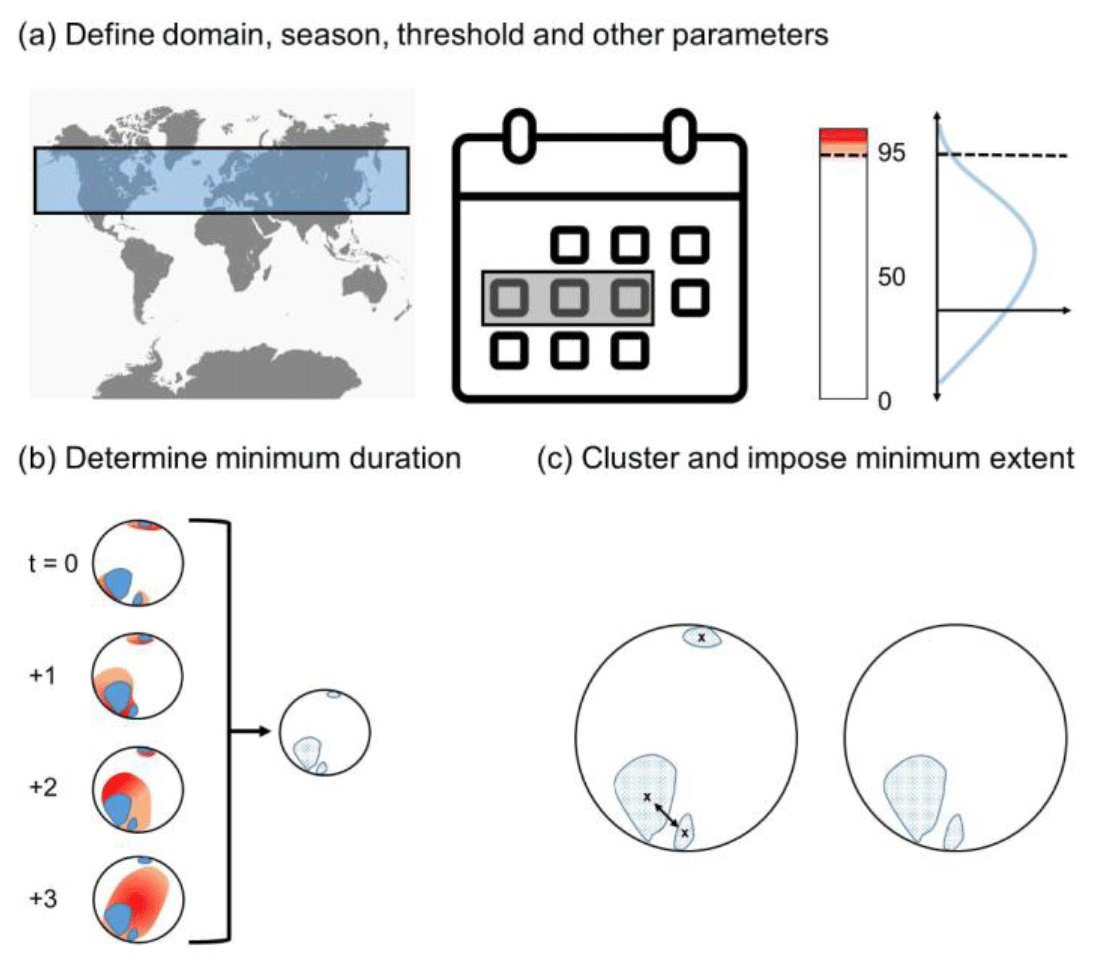
Figure 1Schematic of the concurrent temperature extremes toolbox. (a) Given a latitudinal domain, a season and a temperature percentile (the 95th percentile in the example used here), the algorithm identifies temperature extremes. (b) A minimum duration in days is then imposed at every location (4 d in the example used here). The red areas represent percentile exceedances. The blue shading shows regions where the exceedances satisfy the minimum duration. (c) Connected extreme temperature areas are identified (stippled regions) and clustered (using centroid distances in this example, with centroids of each connected area marked by “x”). The two centroids that are clustered are connected by a double-headed arrow. After clustering, a minimum area threshold is applied. The map in (a) is reproduced from FreeVectorFlags under an attribution-only licence. The calendar icon in (a) is reproduced from DinosoftLabs under an attribution-only licence.
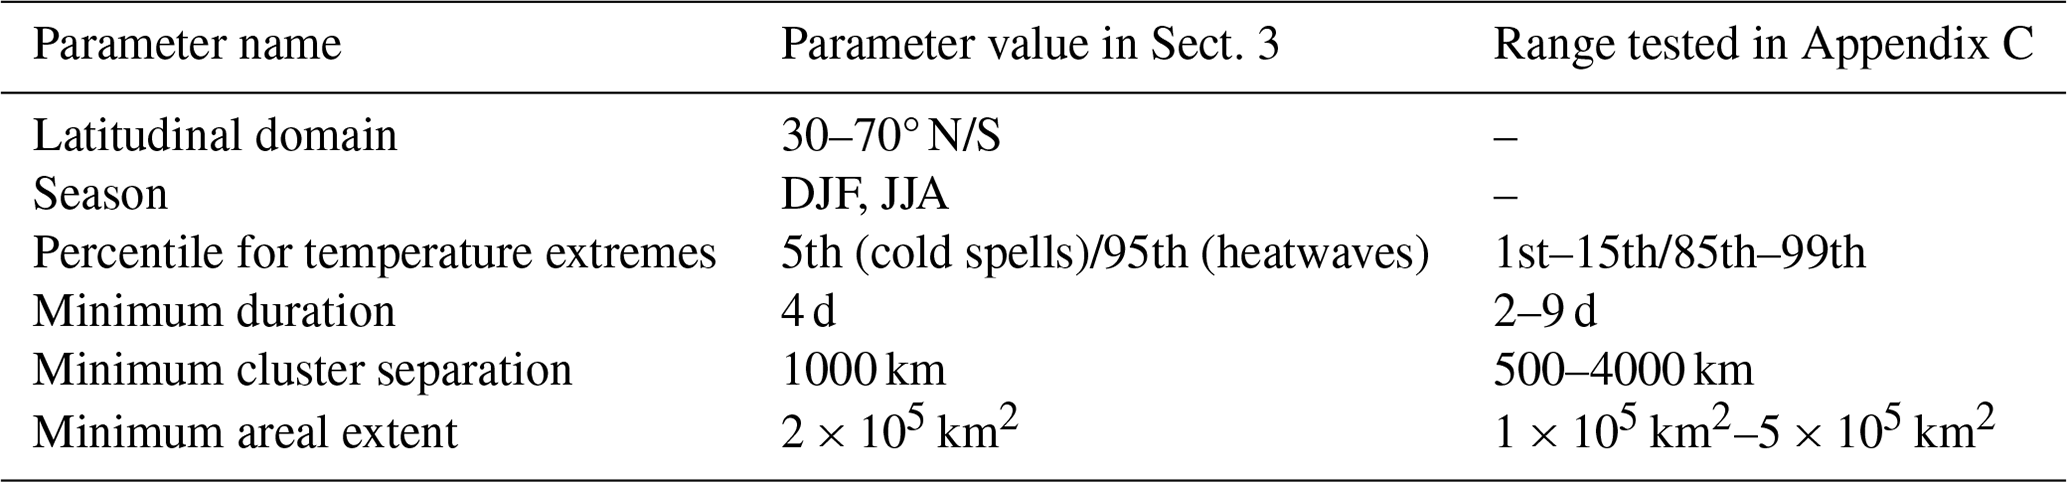
In the analysis we present in this study, we use daily mean ERA5 (Hersbach et al., 2020) 2 m temperature data over 30–70° N/S in the period January 1940–August 2023 with a horizontal resolution of 0.5° latitude and longitude. However, the toolbox is easily applicable to other gridded climate datasets with different resolutions. We consider non-detrended temperature anomaly data, with anomalies computed relative to a daily climatology smoothed with a 15 d running mean. However, the toolbox provides the option to perform a detrending step. We identify hot extremes during summer (boreal: June, July and August – JJA; austral: December, January and February – DJF) and cold extremes during winter (boreal: DJF; austral: JJA). In Sect. 3, we consider percentile thresholds of 95 (5) for hot (cold) extremes (similar to, e.g. Harnik et al., 2016, and Guirguis et al., 2018). We also display results for percentile thresholds of 90 (10) in Appendix A, as these have also often been adopted in the literature (e.g. Peings et al., 2013; Lin et al., 2022; Holmberg et al., 2023). The percentiles are applied to the temperature anomalies at each grid box. We impose a minimum duration threshold of 4 d, which is again in line with previous work that often adopts thresholds of 3–5 d (e.g. Xu et al., 2016; Brown, 2020; Lin et al., 2022), and here we show the results for clustering based on centroid distances below 1000 km. We further enforce a minimum areal extent of clustered temperature extremes of 2×10⁵ km2. This is an intermediate value compared to previous literature, which has considered thresholds on the order of 105 to 106 km2 (cf. Lyon et al., 2019; Rogers et al., 2022). The parameters used in Sect. 3, chosen to enable a comparison of our results to previous literature on temperature extremes, are summarised in Table 1. The table also summarises the parameter sweep of the toolbox shown in Appendix C.
Table 1Toolbox parameters used for the analysis conducted in Sect. 3 and ranges tested in the parameter sweep shown in Appendix C.
Two clear hotspots for the occurrence of concurrent heatwaves emerge in western Russia and western North America (Fig. 2a) with relative frequencies around or exceeding 0.4. In other words, roughly 40 % of single-grid-box heatwaves at those locations are part of a set of multiple concurrent, large-scale heatwaves in the NH. Heatwaves in central Asia and central North America instead typically occur in isolation. Concurrent cold spells display a different geographical distribution, with northwestern North America, central Europe and southwestern Eurasia showing the highest relative occurrences (Fig. 2b). At some of these locations, roughly half of the single-grid-box cold spells are part of a set of multiple concurrent, large-scale events. Concurrent temperature extremes are rare in relative terms in the Southern Hemisphere (SH), presumably because of the much smaller landmass extent.
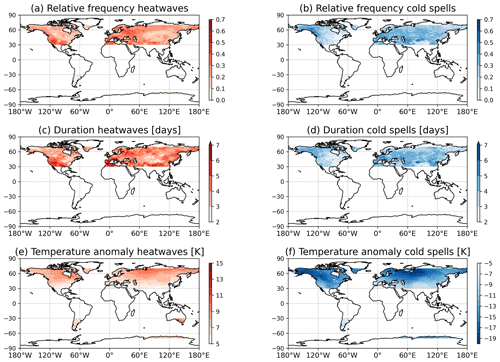
Figure 2Relative frequency, duration and severity of concurrent temperature extremes. Relative frequency of concurrent (a) heatwaves and (b) cold spells, normalised relative to the percentile used to define the extremes. For example, a value of 0.5 means that half of the temperature extremes at a given location concur with another remote temperature extreme of the same sign. Mean duration (in days) of concurrent (c) heatwaves and (d) cold spells. Mean temperature anomalies of concurrent (e) heatwaves and (f) cold spells. Panels (e) and (f) have differing colour range amplitudes.
The duration of both concurrent heatwaves and cold spells ranges in most regions between 3 and 6 d. The above-mentioned regional hotspots for occurrence frequency also display slightly above-average duration values. The rare concurrent temperature extremes in the SH show a much shorter duration than their NH counterparts. Note that while we impose a minimum duration threshold for single-grid box extremes, the duration of a compound temperature extreme can be shorter than this. Indeed, for compound extremes we only count the duration while there are two or more concurrent extremes – even if this temporal overlap period is shorter than the minimum duration threshold for single-grid-box extremes. The pattern of temperature anomalies during the extremes roughly matches that of the temperature variance (Fig. A1), meaning it is largest in the northern high latitudes and the central parts of the continents and larger for wintertime cold spells than summertime heatwaves. The corresponding results for a less stringent percentile definition of temperature extremes are shown in Fig. A2 and commented on in Appendix A.
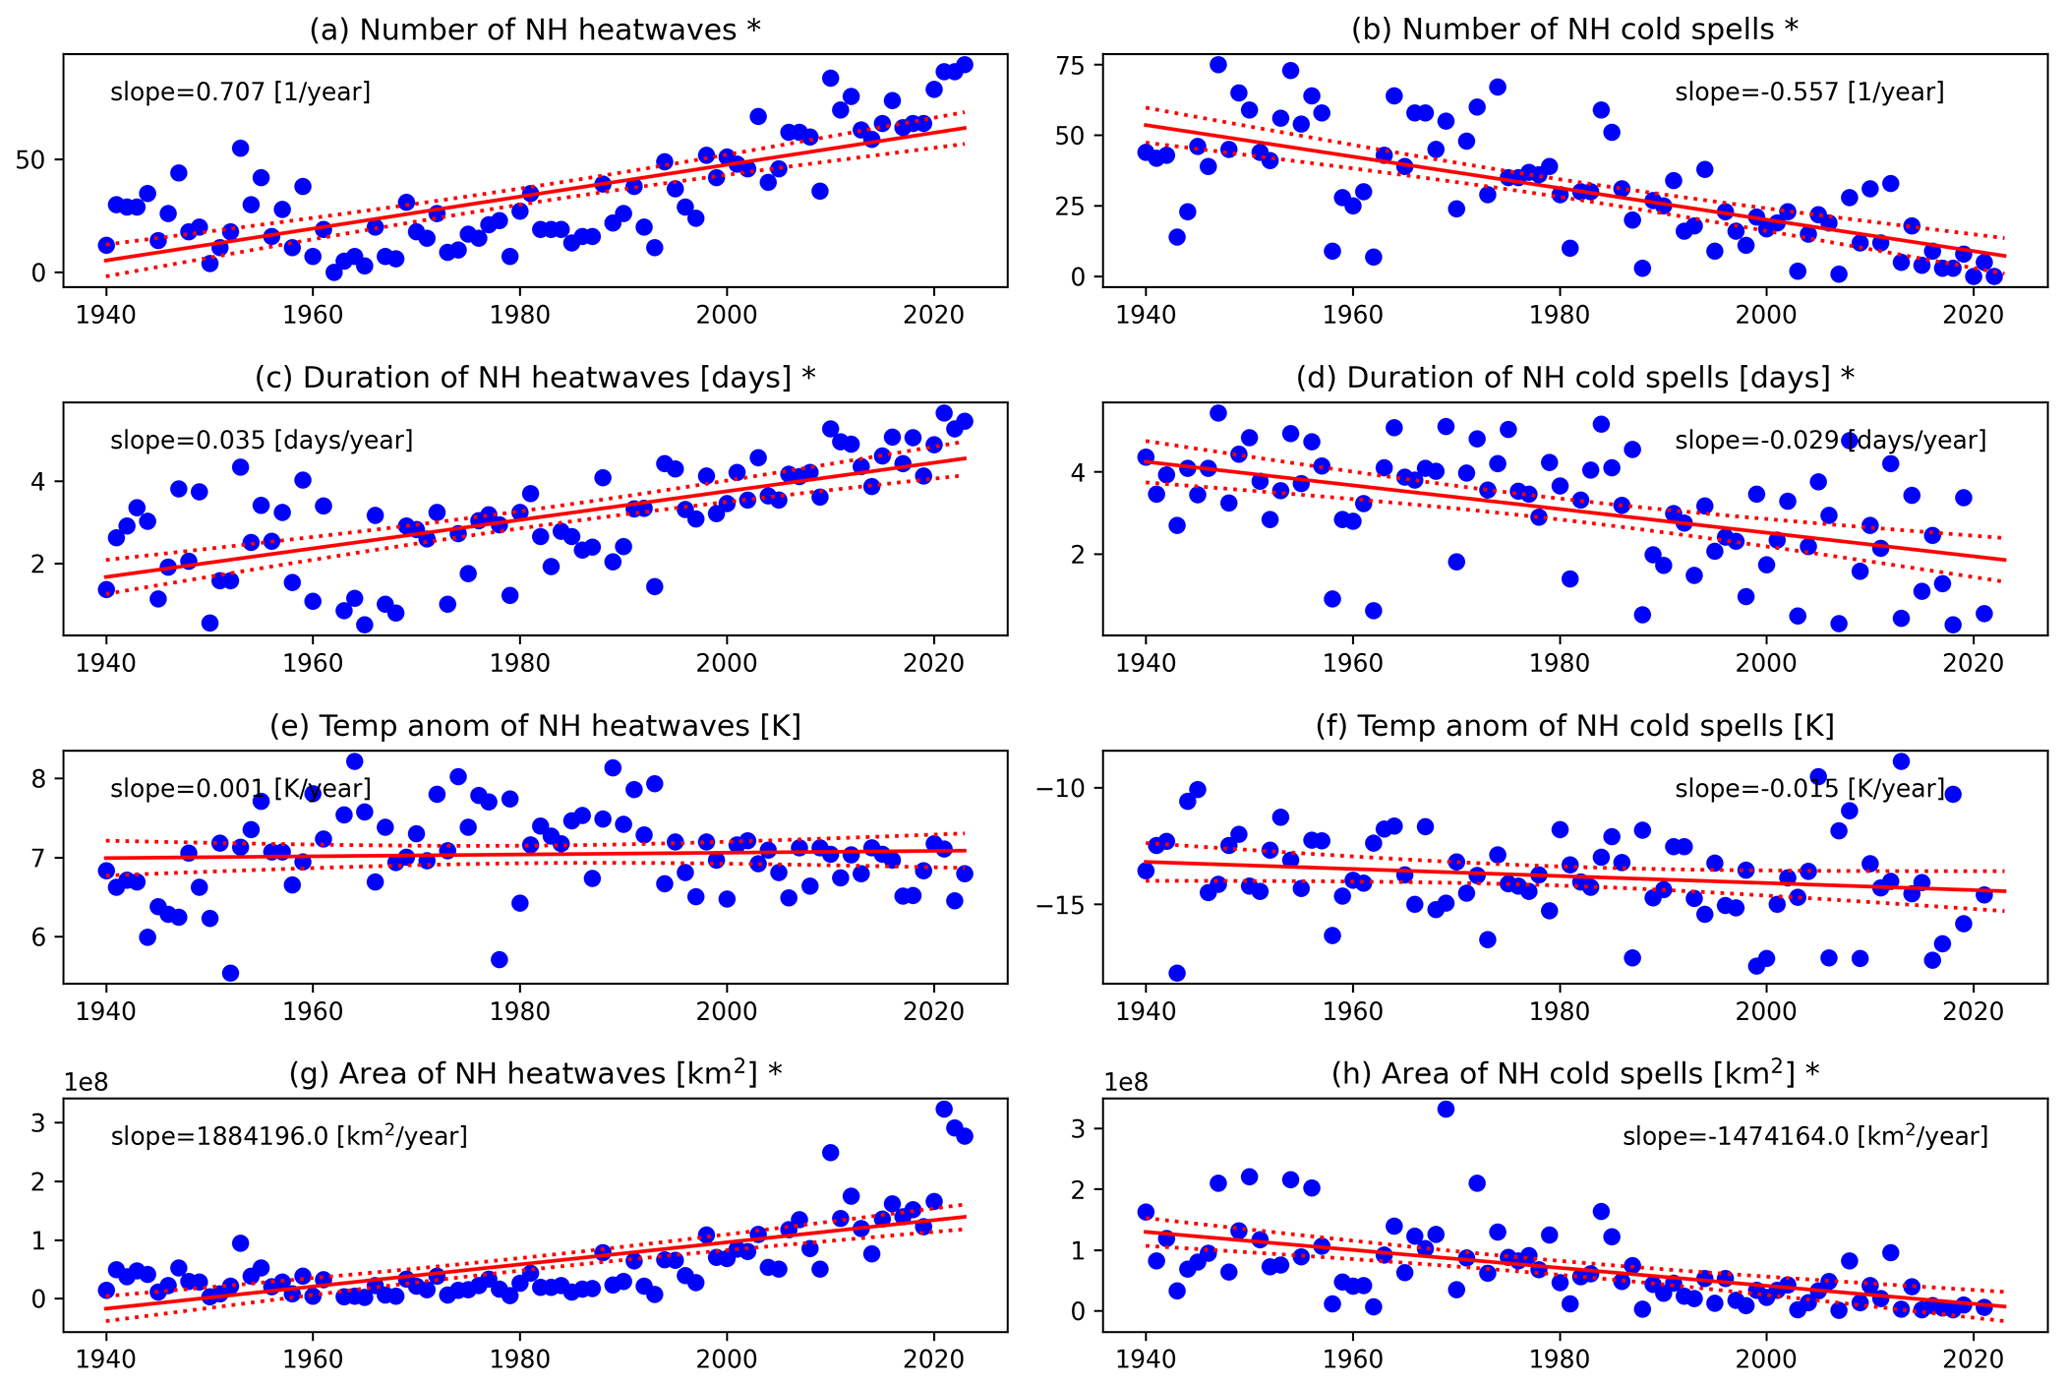
Figure 3NH aggregated yearly data and trends in the occurrence, duration, severity and extent of concurrent temperature extremes. Number of concurrent (a) heatwaves and (b) cold spells. Mean duration (in days) of concurrent (c) heatwaves and (d) cold spells. Mean temperature anomalies (K) of concurrent (e) heatwaves and (f) cold spells. Cumulative area (km2) of concurrent (g) heatwaves and (h) cold spells. The continuous lines show linear fits, and the dashed lines show 95 % confidence bounds. The numbers in each panel show the linear fit slope. Asterisks in the panel titles indicate that the slope is different from 0 at the 5 % level according to the p value of the t statistic. Seasons without any events are not accounted for when computing the linear fits for duration, severity and extent.
This climatology can be compared to that of all temperature extremes, regardless of whether they concur with others or not but defined using the same percentile, duration and extent thresholds (Fig. A3). The spatial distributions are remarkably similar, with the main difference being that SH temperature extremes emerge more clearly. Moreover, the extremes display a longer duration because this now also includes days when they occur in isolation.
We next consider trends in the concurrent temperature extremes, aggregated at hemispheric level (Fig. 3). Concurrent NH heatwaves have significantly increased in number, duration and area over the last 8 decades (Fig. 3a, c, g). As expected given our percentile-based definition, the temperature anomalies associated with the heatwaves have stayed roughly constant (Fig. 3e). Concurrent cold spells mostly mirror these trends, with significant decreases in number, duration and area (Fig. 3b, d, h) and no significant trend in temperature. However, as shown below there are regions where both sets of temperature extremes show similar trends, for example in parts of central Asia and Siberia, central North America, and Scandinavia. The corresponding figures for the SH and for a less stringent percentile definition of temperature extremes are shown in Figs. A4–A6 and commented on in Appendix A.
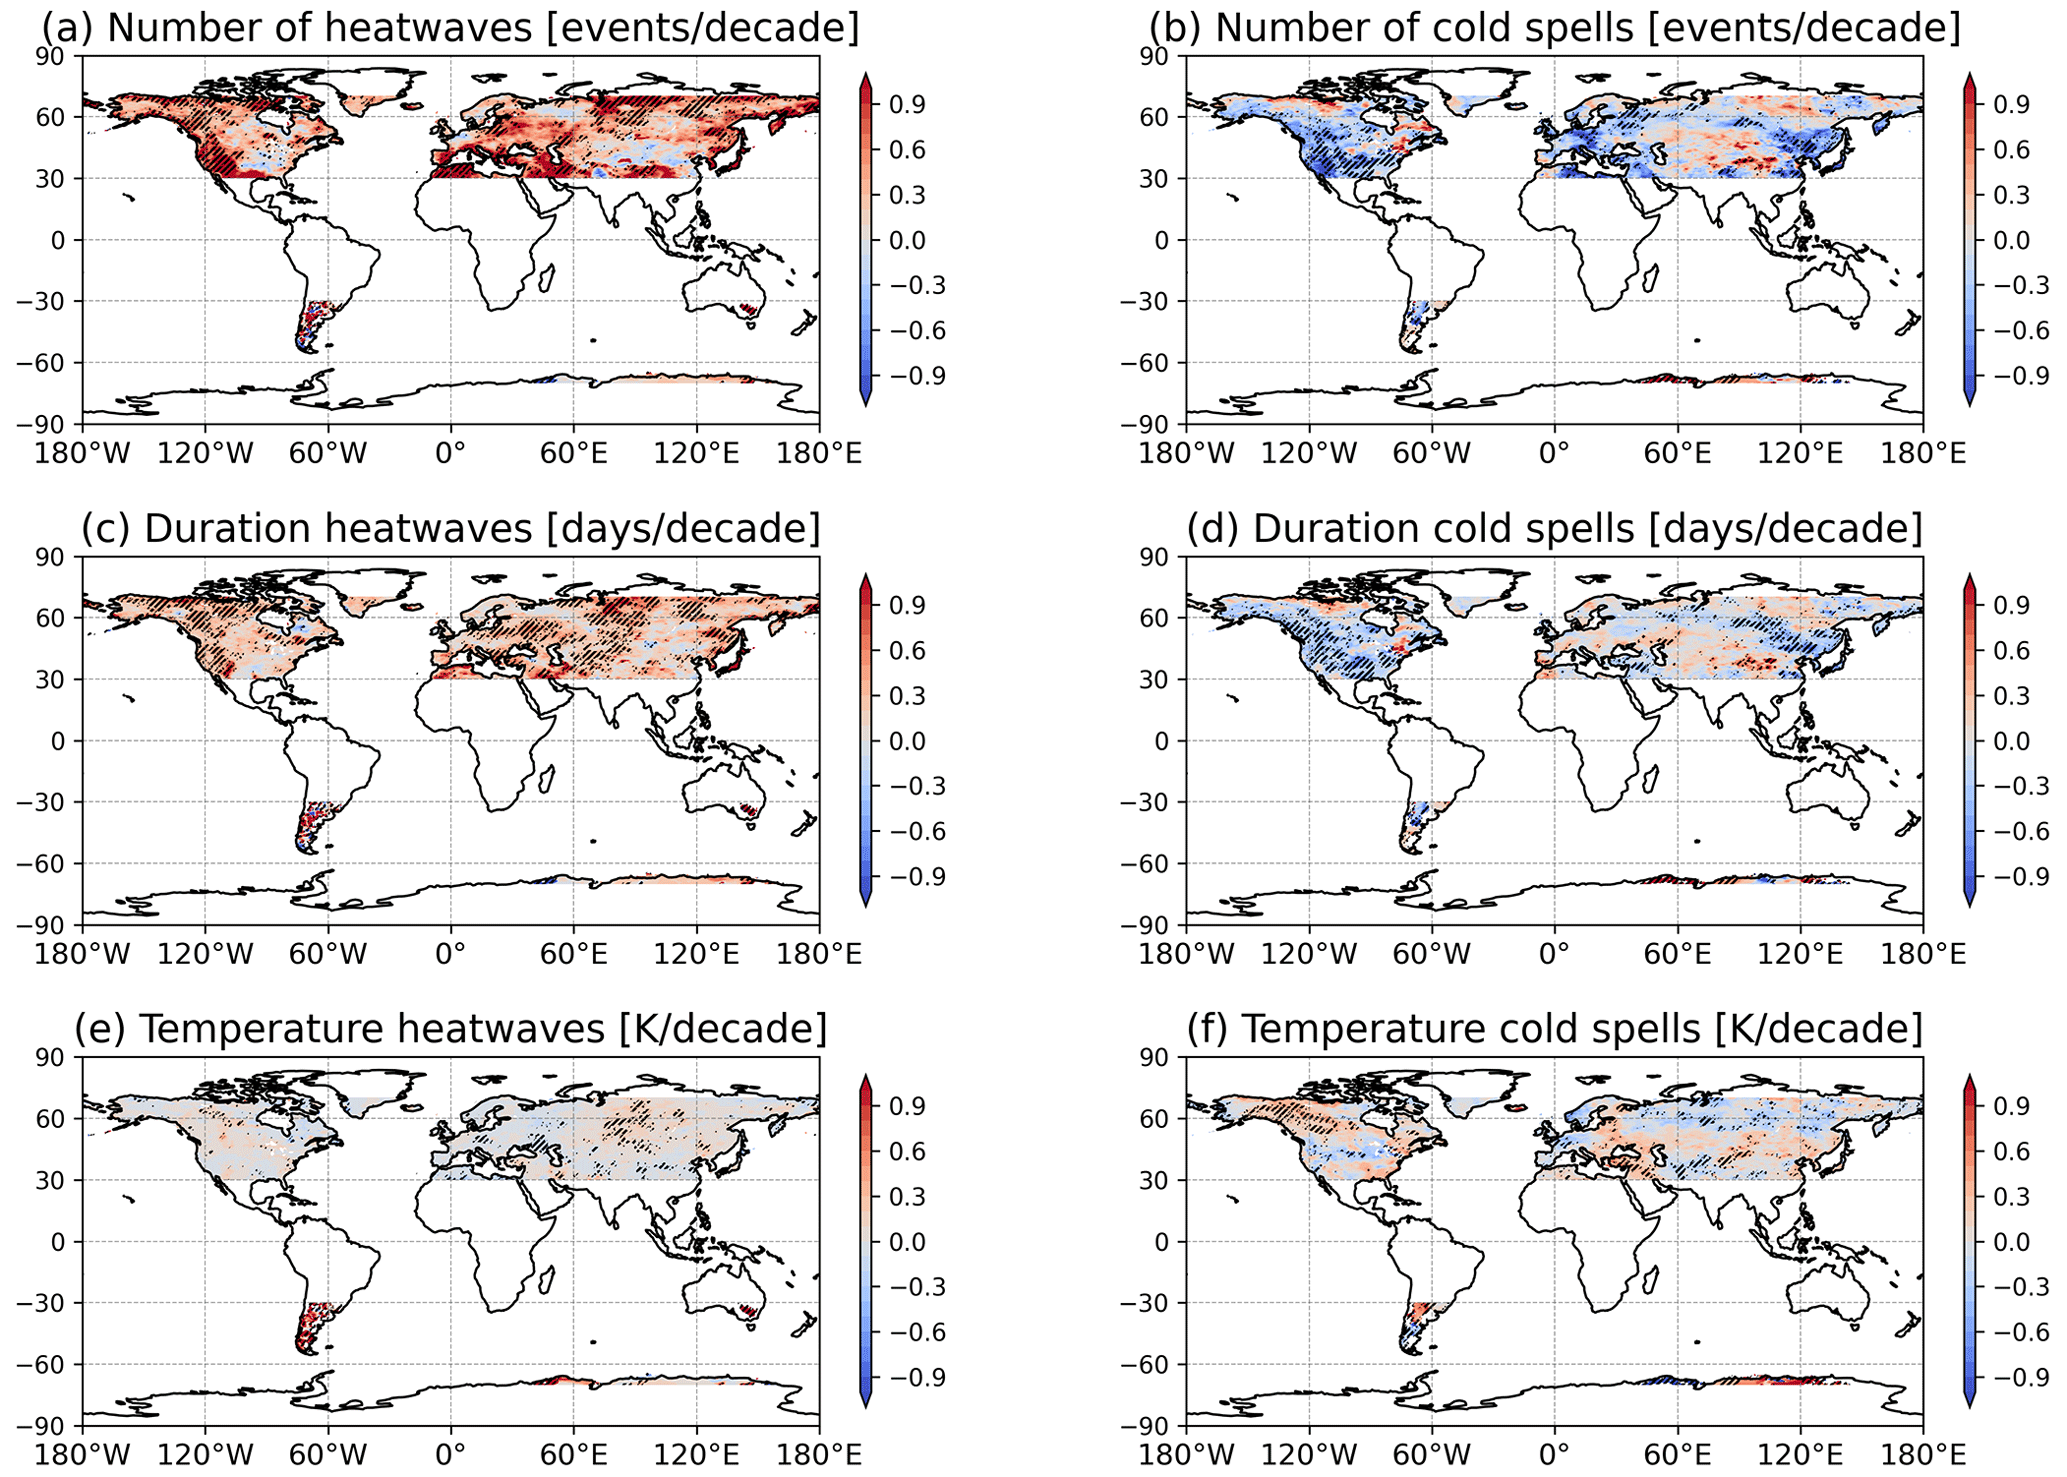
Figure 4Linear trends in the occurrence, duration and severity of concurrent temperature extremes. Trends in the number of concurrent (a) heatwaves and (b) cold spells, in the duration of concurrent (c) heatwaves and (d) cold spells, and in the temperature anomalies during concurrent (e) heatwaves and (f) cold spells are shown. Stippling shows regions where the trends are different from 0 at the 5 % level according to the p value of the t statistic. A Gaussian filter with filter size 1 has been applied to all panels to improve legibility.
The above trends at hemispheric level can be compared to the corresponding trends for temperature extremes with no requirements for concurrence (Figs. A7, A8). The trends are qualitatively similar, with a marked increase in heatwaves and decrease in cold spells. We additionally see a significant decrease (increase) in NH (SH) cold spell temperature anomalies.
We conclude our analysis by considering trends on a geographical basis (Fig. 4). The frequency of concurrent heatwaves (cold spells) shows a widespread increase (decrease) across the global midlatitudes (Fig. 4a, b). The hotspot region of western North America, already highlighted in Fig. 2, emerges as having a particularly strong and geographically widespread increasing heatwave trend. A strong decreasing trend is found for cold spells over the same region. Central Asia and central North America are exceptions, showing little or even weak negative (positive) changes in the number of concurrent heatwaves (cold spells). The duration trends of concurrent temperature extremes roughly match the occurrence trends, albeit with some regional differences (Fig. 4c, d). For example, western Russia emerges as having a significant positive duration trend in concurrent heatwaves but no significant occurrence trend. Finally, only a weak signal is seen in the temperature anomaly trends, with the most notable features being positive trends in South America for concurrent heatwaves and positive trends in northwestern North America for concurrent cold spells. The corresponding figures for a less stringent percentile definition of temperature extremes and for all extremes are shown in Figs. A9 and A10 and commented on in Appendix A.
We have presented a flexible toolbox for the study of concurrent temperature extremes and have applied it to cold and hot extremes in the global extratropics. The toolbox supports both climatological and trend analyses and enables users to tailor the definition of concurrent temperature extremes to their specific needs. Indeed, different users may be interested in concurrent temperature extremes on a variety of different spatial and temporal scales – think, for example, of studies looking at heatwave impacts on the global food supply versus studies looking at regional- or continental-scale health impacts of temperature extremes. While the toolbox was developed specifically for temperature extremes, it can in principle take any single-level variable as input. It is, however, not tailored to the detection of the dynamical drivers of the extremes.
Concurrent temperature extremes affect all land areas, although clear hotspots emerge, for example, in western Russia and western North America for heatwaves and in northwestern North America, central Europe and southwestern Eurasia for cold spells.
Consistent with previous work, we find clear upward trends in concurrent heatwave extent and number (Rogers et al., 2022), while decreasing trends are found for concurrent cold spells. For the concurrent NH heatwaves, the upward trend in occurrence corresponds to more than a quadrupling of events over 8 decades, while concurrent NH cold spells have become rarer by roughly two-thirds. Concurrent temperature extremes have historically mainly occurred in the NH extratropics due to the much smaller land surface area in the SH. However, the sharp increase in concurrent heatwaves means that these are becoming an emerging hazard in the SH. We further find an increase in the duration of concurrent heatwaves and a decrease for concurrent cold spells. In the first decades of the analysis period, concurrent cold spells lasted on average longer than concurrent heatwaves, while the opposite becomes true in the latter part of the analysis period. This is consistent with Lhotka and Kyselý (2015), who found a longer average duration for individual historical cold spells than heatwaves over Europe, and with Allen and Sheridan (2016), who found that in recent decades hot temperatures have on average become longer-lasting events than cold temperatures in major US cities. These multi-decadal trends are superimposed on interannual to interdecadal variability, consistent with the known link of several large-scale modes of climate variability with temperature extremes (e.g. Della Marta et al., 2017; Arblaster and Alexander, 2012; Loikith and Broccoli, 2014; Grotjahn et al., 2016, and references therein). On a geographical basis, we find regionally contrasting trends in the number, duration and temperature anomalies of concurrent cold spells in North America and Eurasia. These may be related to the warm Arctic–cold continents pattern (Chen et al., 2018), which also modulates the occurrence of cold extremes (Ye and Messori, 2020). We further find that weaker cold spells show a more uniform decrease than more extreme cold spells (Fig. A9), suggesting that these regional patterns may be sensitive to the definition of extreme events.
Nonetheless, caution should be exercised in relating our results on concurrent extremes to those in the literature for extremes without any requirement for concurrence, as the trends can differ markedly. Indeed, the number, duration and extent of NH concurrent heatwaves have all increased significantly more in proportion to the corresponding quantities for all NH heatwaves, and a similar trend is observable for the decreases in cold spells (Fig. A11).
Given the flexibility of the algorithm presented here, it is our hope that it may be applied to a wide range of datasets, including climate projections, to better quantify the recent and future trends in concurrent temperature extremes and identify specific risk areas. It would be of particular interest to investigate whether the accelerated trends in concurrent temperature extremes relative to all temperature extremes may be associated with dynamical trends associated with climate change. Indeed, a number of studies have found a connection between changes in the atmospheric circulation and regional heatwaves, concurrent heatwaves and long-term temperature trends (Cahynová and Huth, 2016; Rogers et al., 2022; Faranda et al., 2023; Vautard et al., 2023).
Concurrent heatwaves have thus become an increasingly frequent and widespread global hazard. Their increase is faster than that of all heatwaves. Concurrent cold spells show a rapidly decreasing trend but still occur in the present-day climate.
Here we provide figures corresponding to those shown in the main paper but for a different threshold definition of temperature extremes (Figs. A2, A5, A6, A9), temperature extremes with no requirements for concurrence (Figs. A3, A7, A8, A10) and for the SH (Figs. A4, A6, A8). We further present a map of temperature variance in both the winter and summer seasons in each hemisphere (Fig. A1) and a figure comparing trends in concurrent and all temperature extremes (Fig. A11).
The qualitative features of Fig. 2 as discussed in the main text are reproduced in Fig. A2, although the concurrent temperature extremes display higher relative frequencies, are longer-lasting events, and display weaker temperature anomalies. These are intuitive results of including more and weaker events in our analysis.
Due to the small sample size, the only significant trends for the SH concurrent extremes (Fig. A4) are the increases in the number and area of concurrent heatwaves. The results for a less stringent percentile (Figs. A5, A6) reflect those shown in Figs. 3 and A4, albeit with higher numbers and areas of concurrent temperature extremes and weaker average temperature anomalies. Moreover, likely thanks to the larger sample size, we find significant negative trends in the number, duration and extent of SH cold spells.
The key qualitative features of Fig. 4 as discussed in the main text are reproduced in Fig. A9, although in the latter figure the occurrence trends are generally stronger. Moreover, the negative trends in number and duration of cold spells are more geographically uniform. The trends for extremes without any requirement for concurrence (Fig. A10) are generally weaker than those for the concurrent extremes (notably for occurrence and duration).
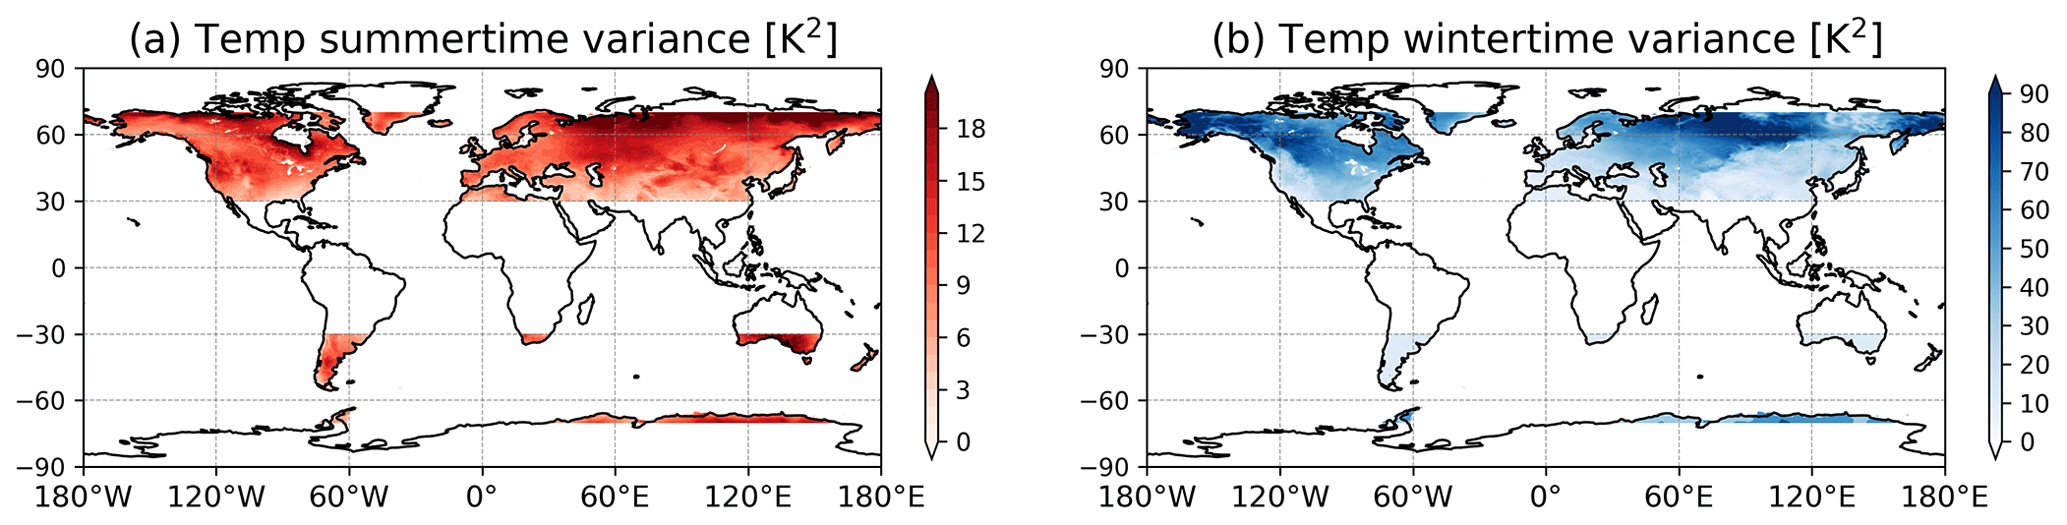
Figure A1Temperature anomaly variance for (a) summer and (b) winter in each hemisphere. The two panels have differing colour range amplitudes.
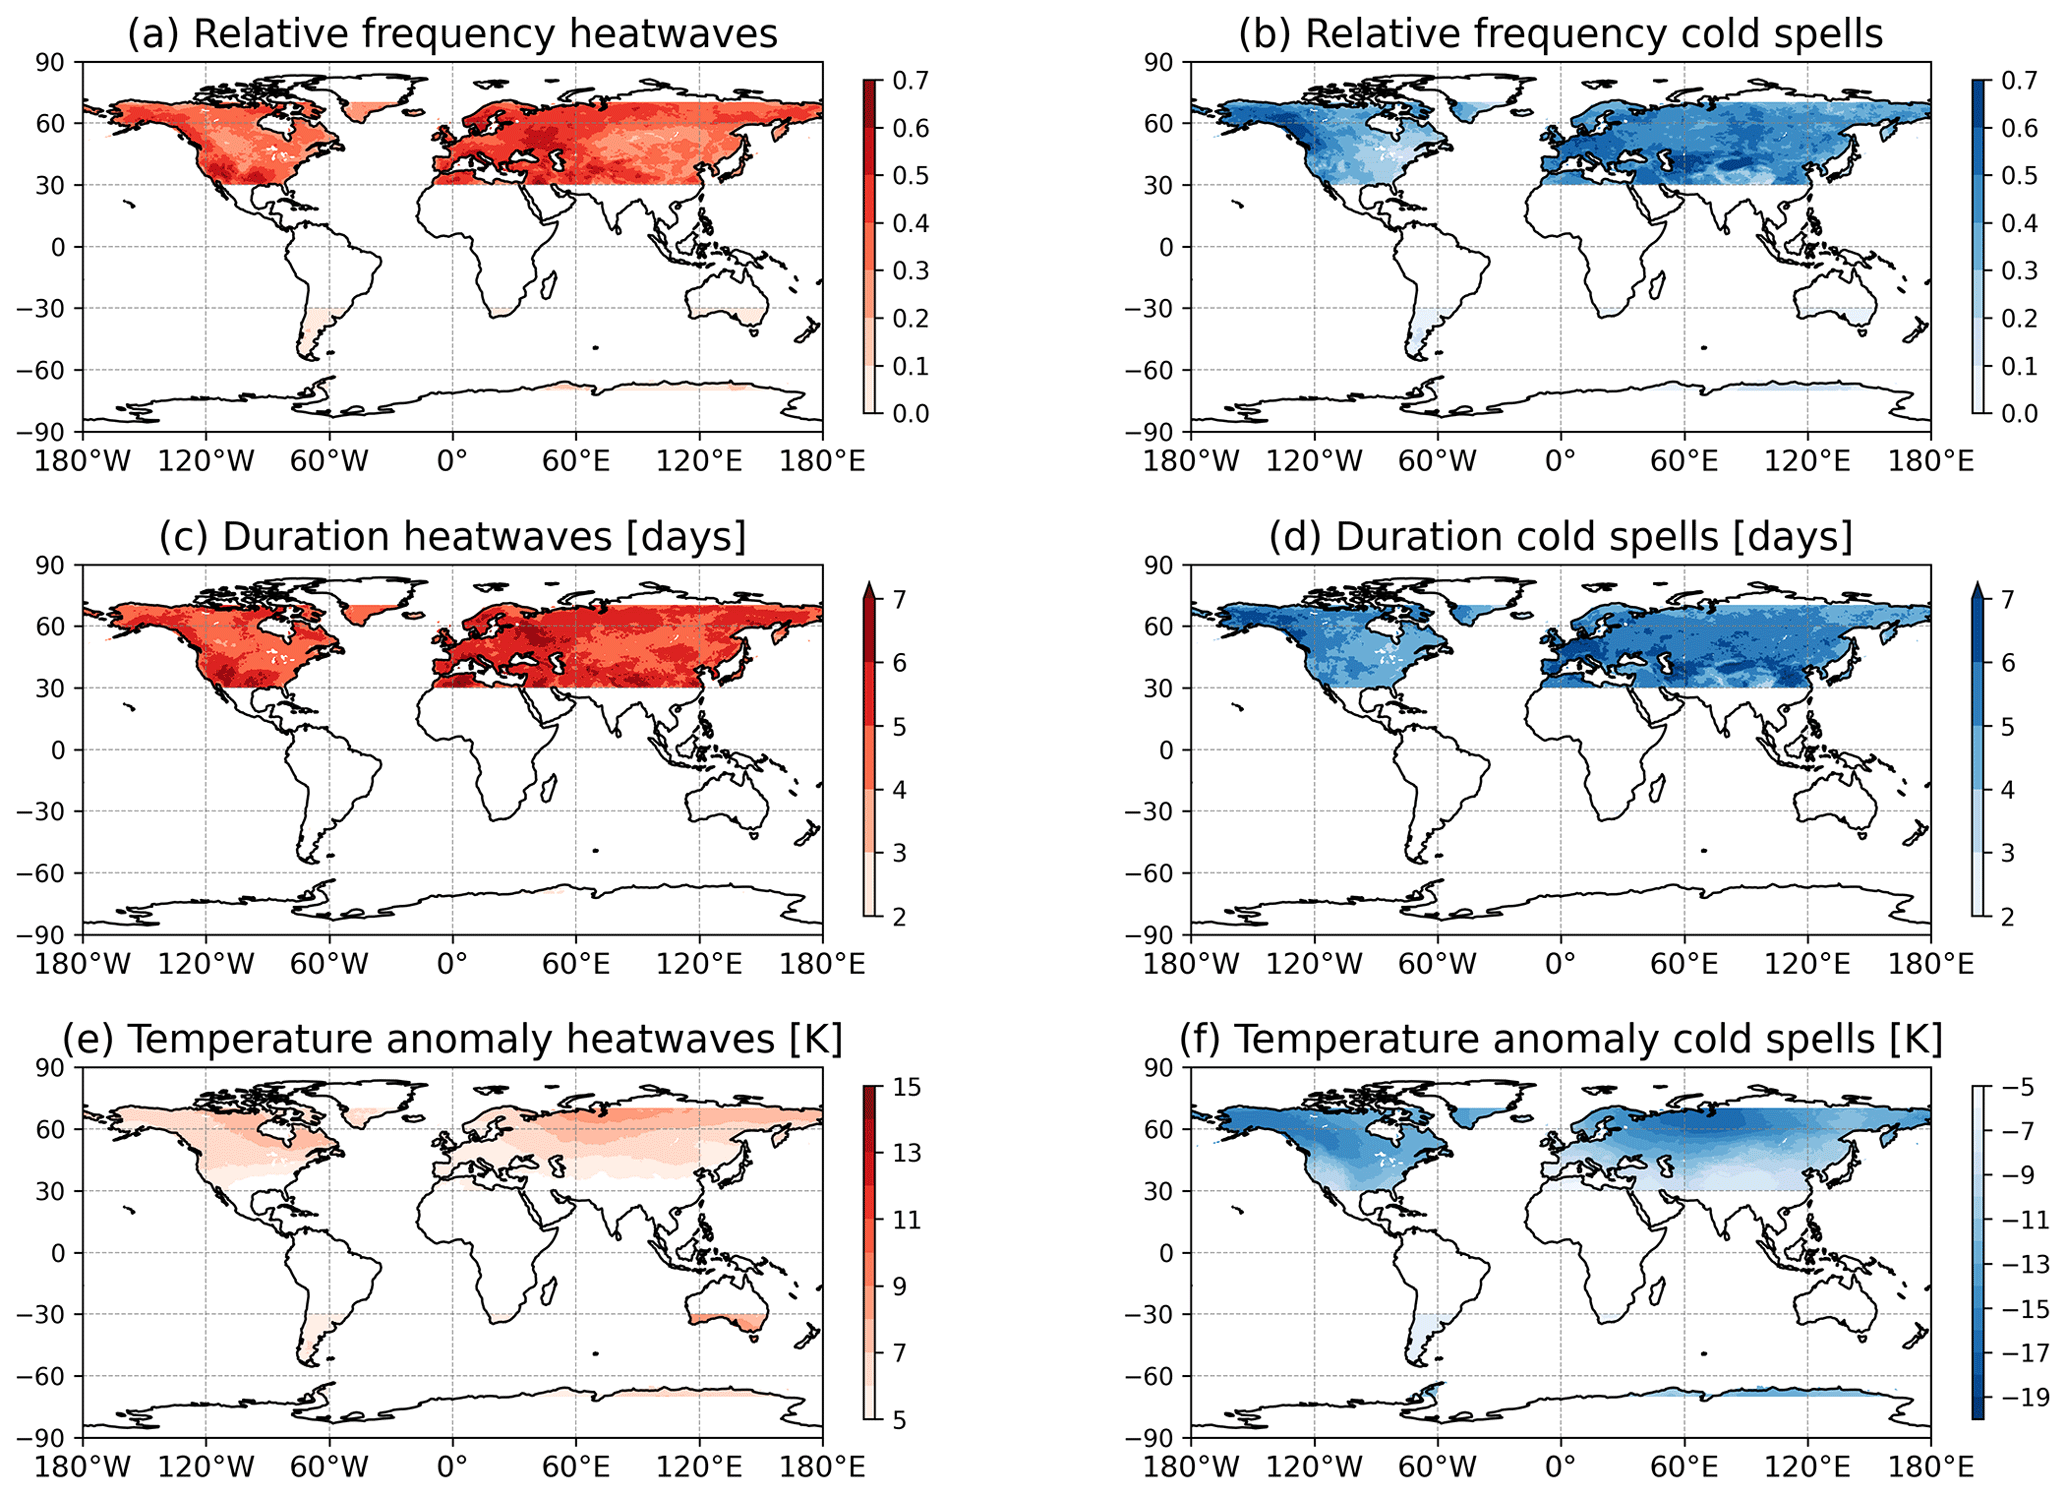
Figure A2The same as Fig. 2 but for percentile thresholds of 90 (heatwaves) and 10 (cold spells).
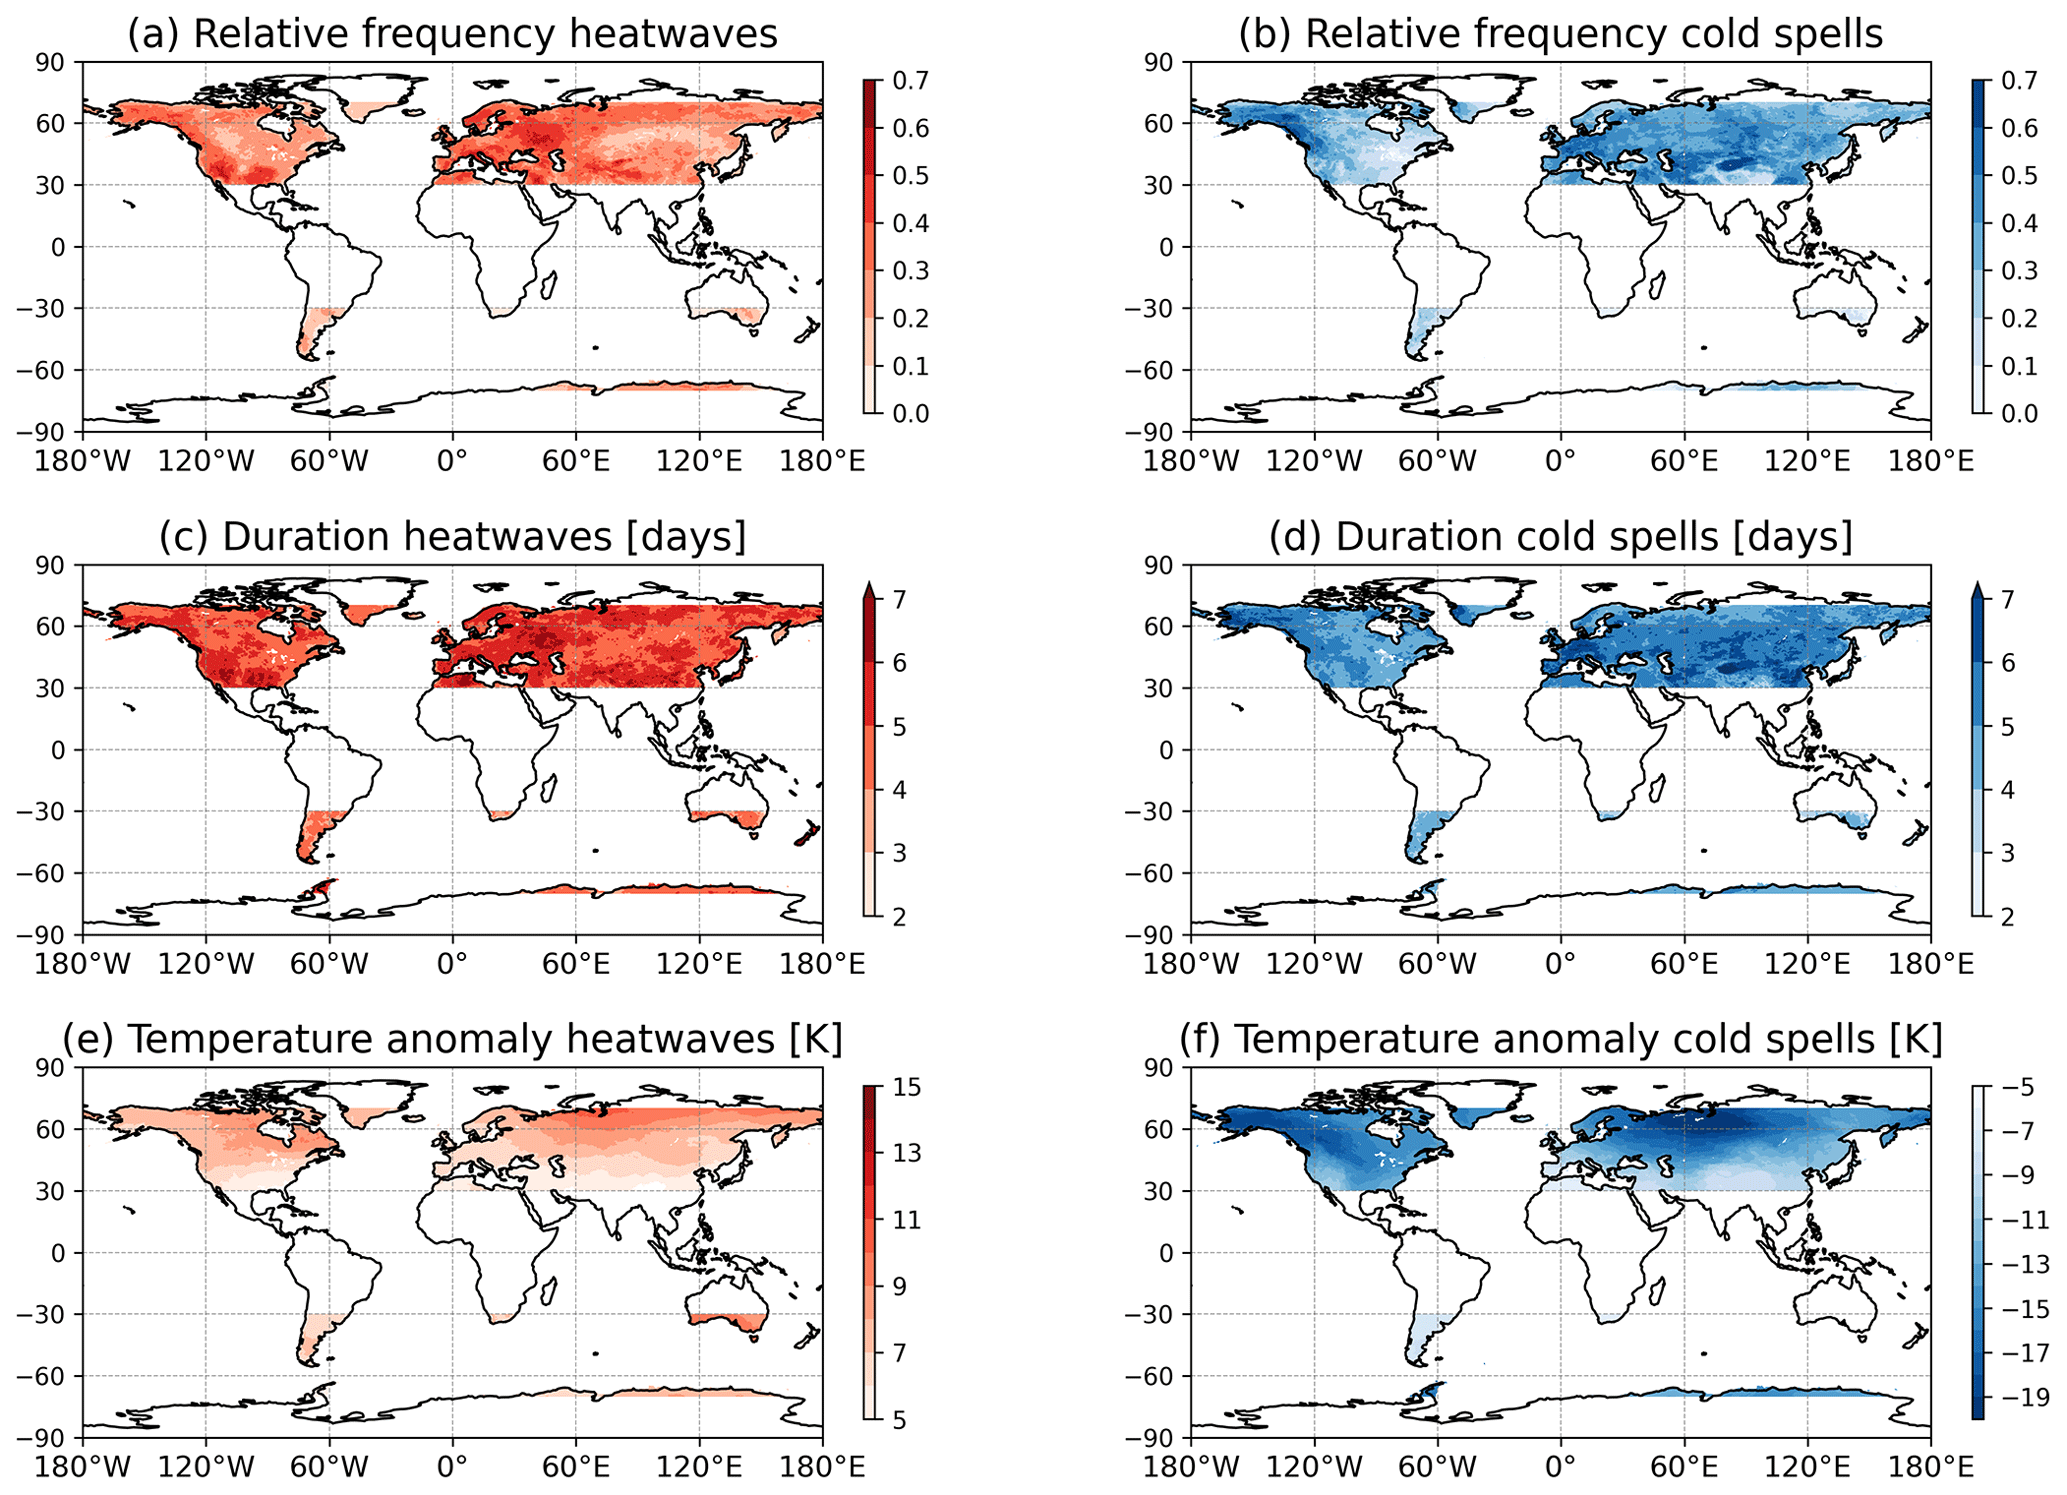
Figure A3The same as Fig. 2 but for temperature extremes with no requirements for concurrence.
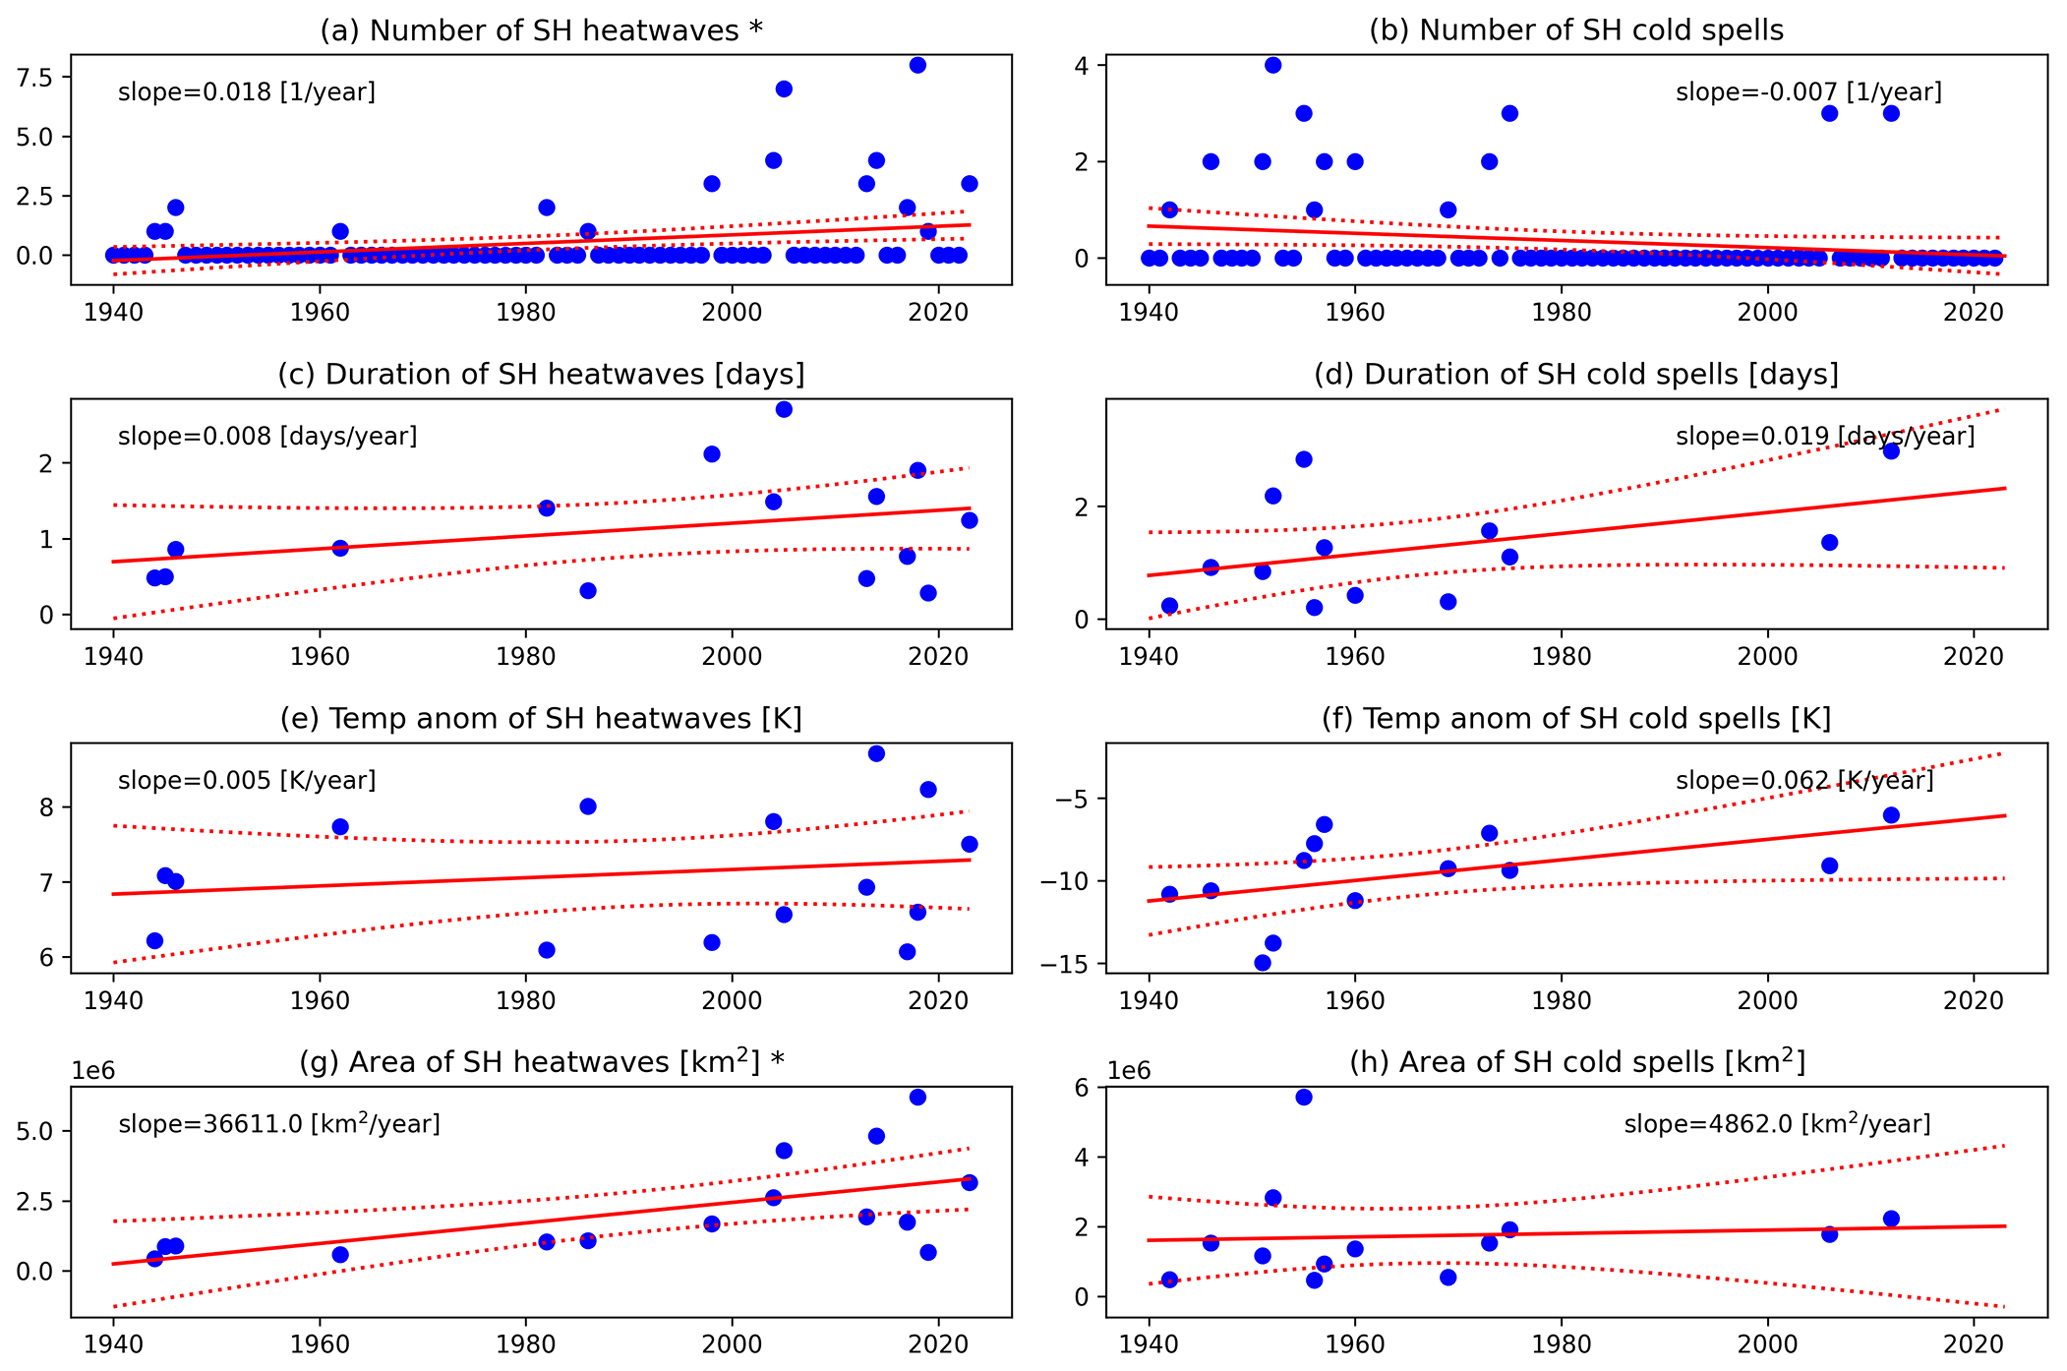
Figure A4The same as Fig. 3 but for the SH. Seasons without any events are not accounted for when computing the linear fits for duration, severity and extent.
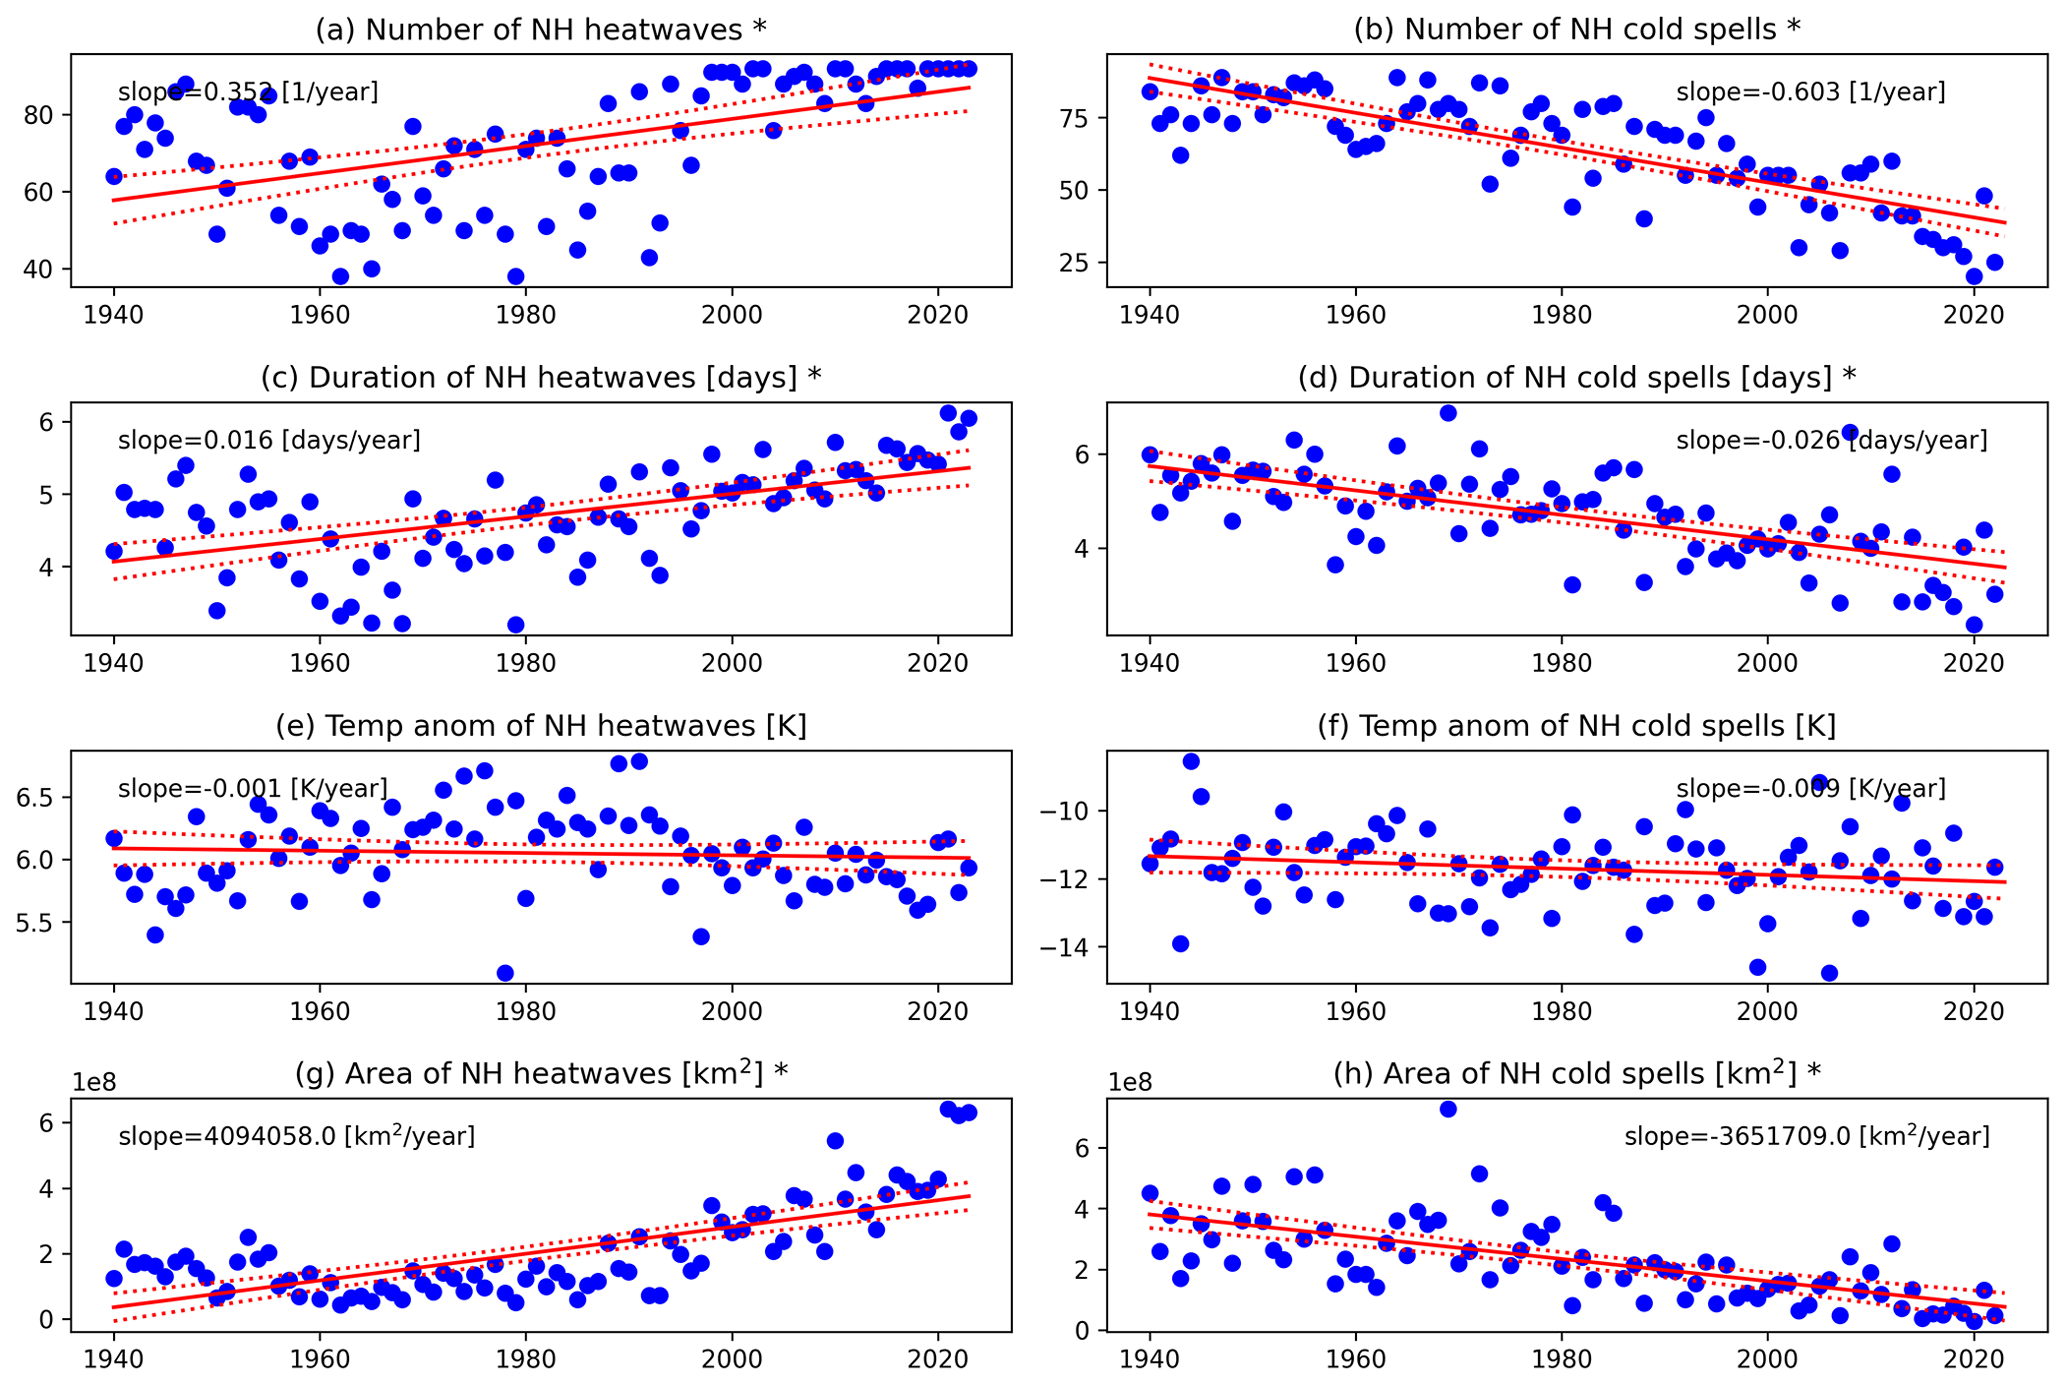
Figure A5The same as Fig. 3 but for percentile thresholds of 90 (heatwaves) and 10 (cold spells).
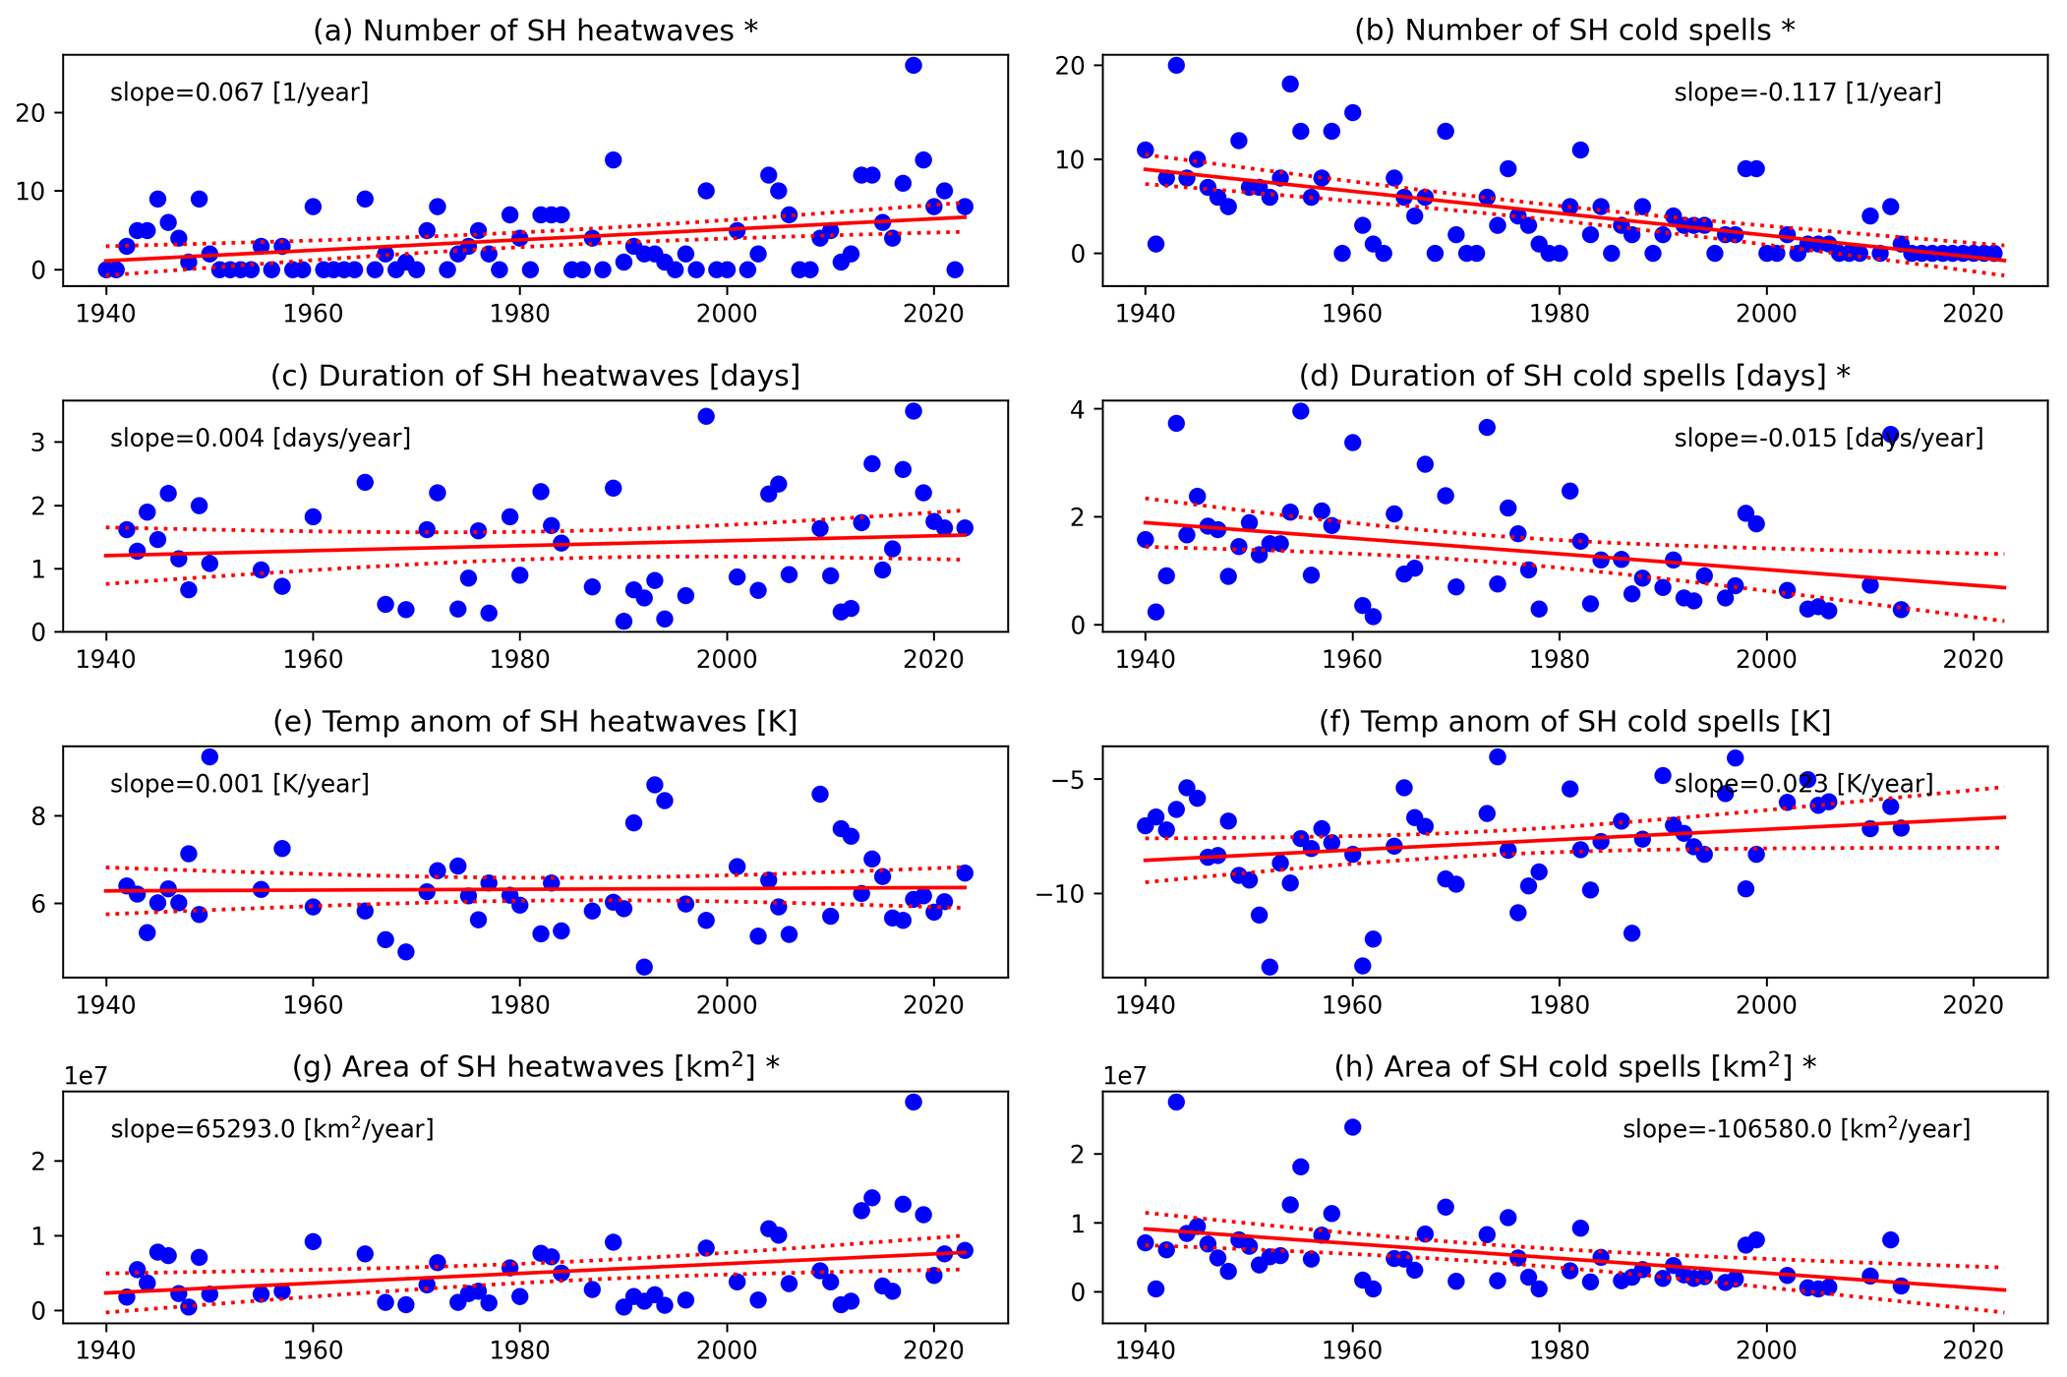
Figure A6The same as Fig. A4 but for percentile thresholds of 90 (heatwaves) and 10 (cold spells). Seasons without any events are not accounted for when computing the linear fits for duration, severity and extent.
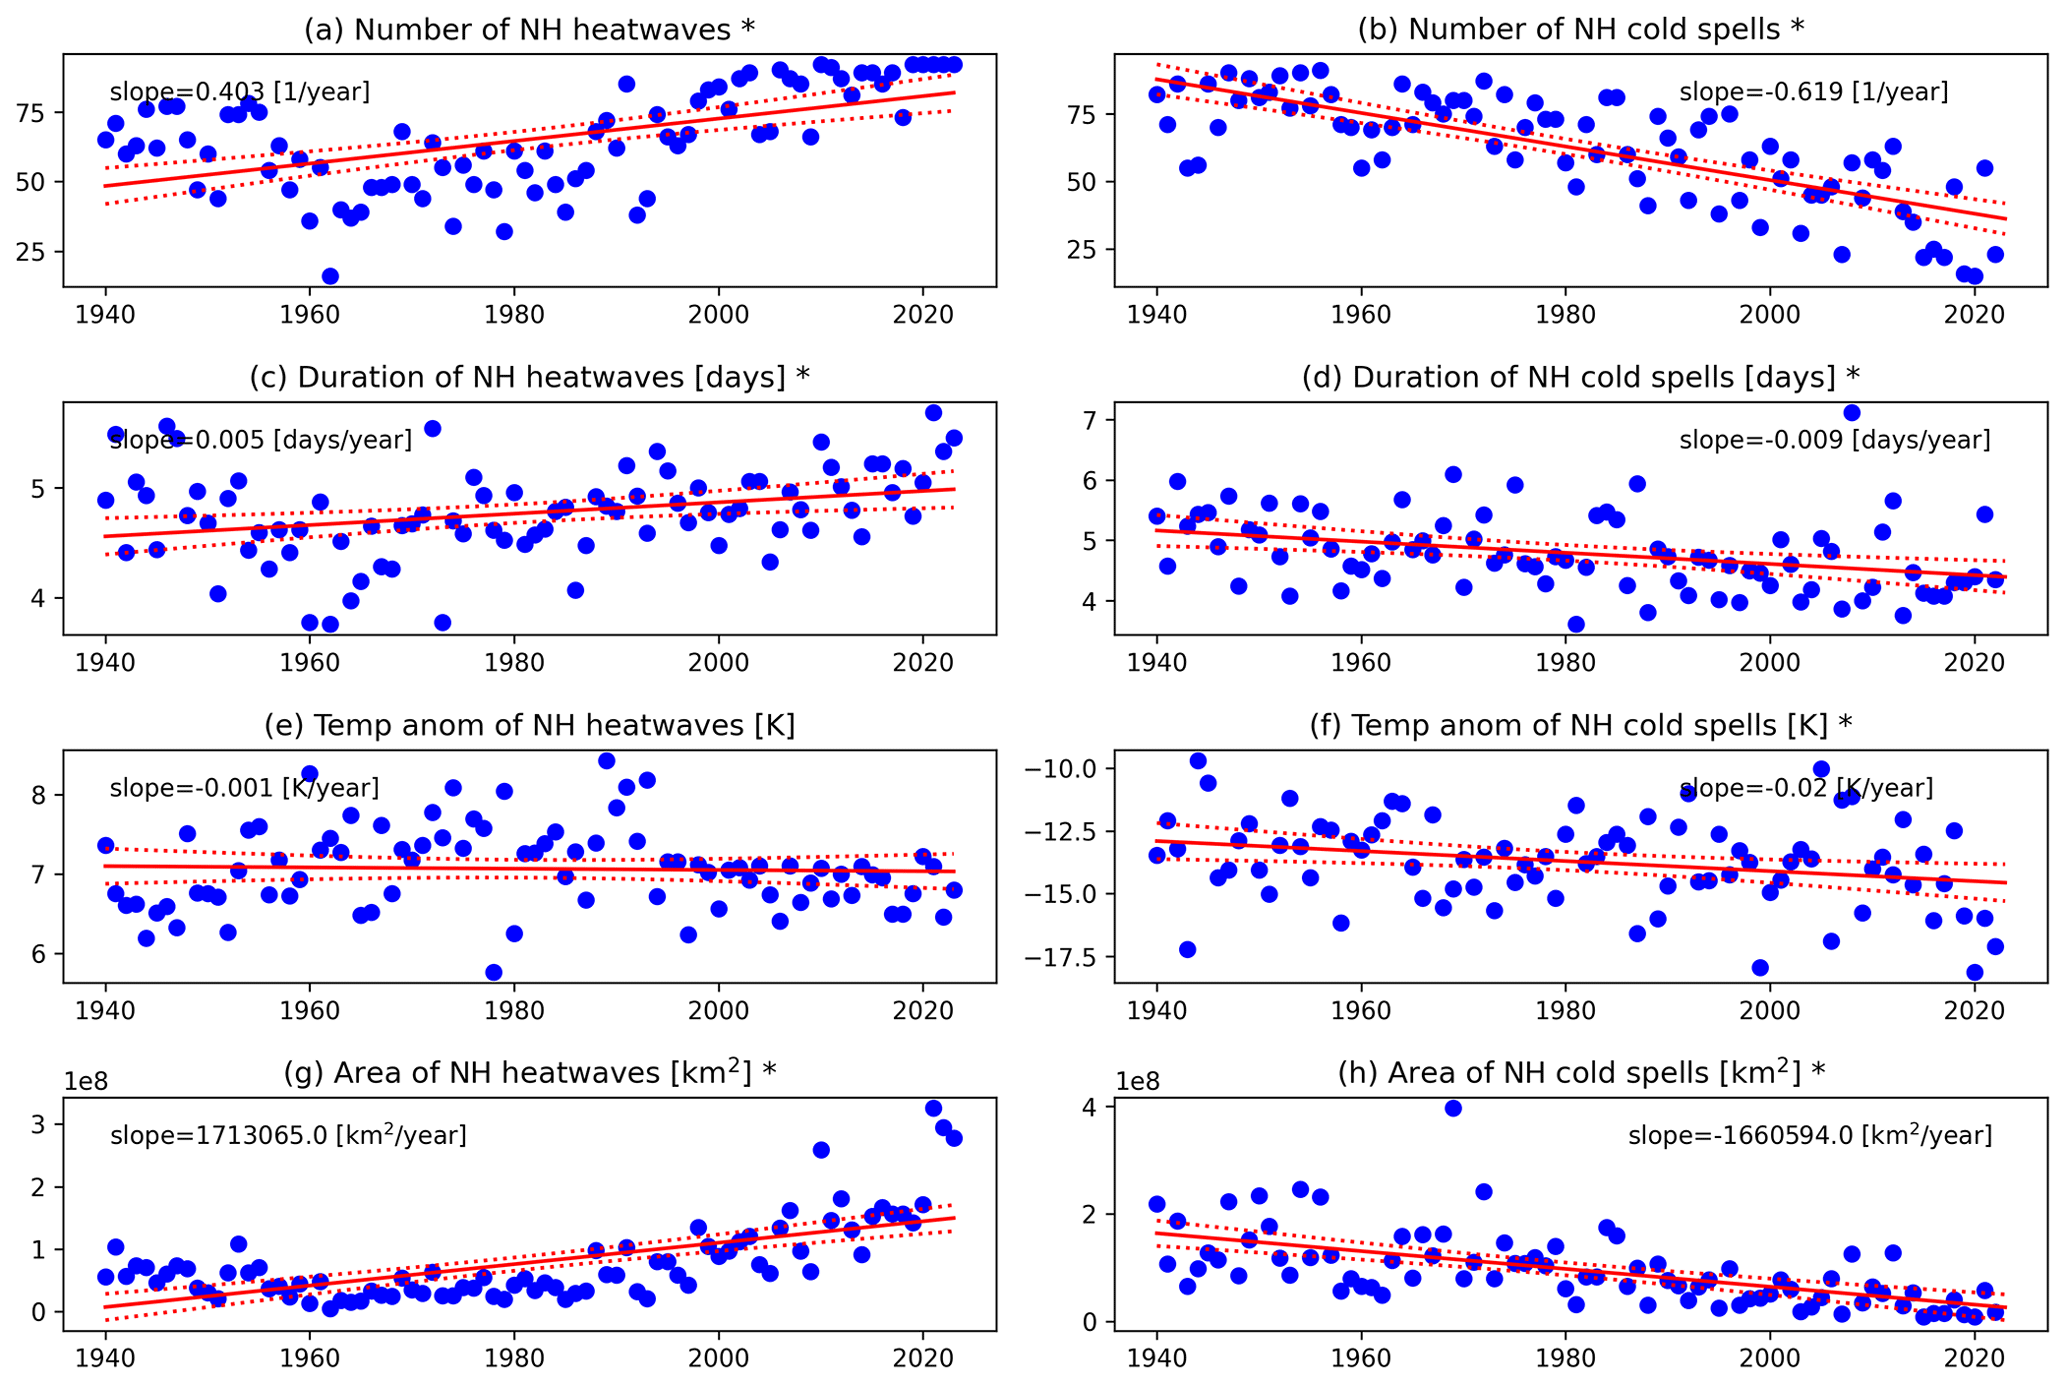
Figure A7The same as Fig. 3 but for temperature extremes with no requirements for concurrence.
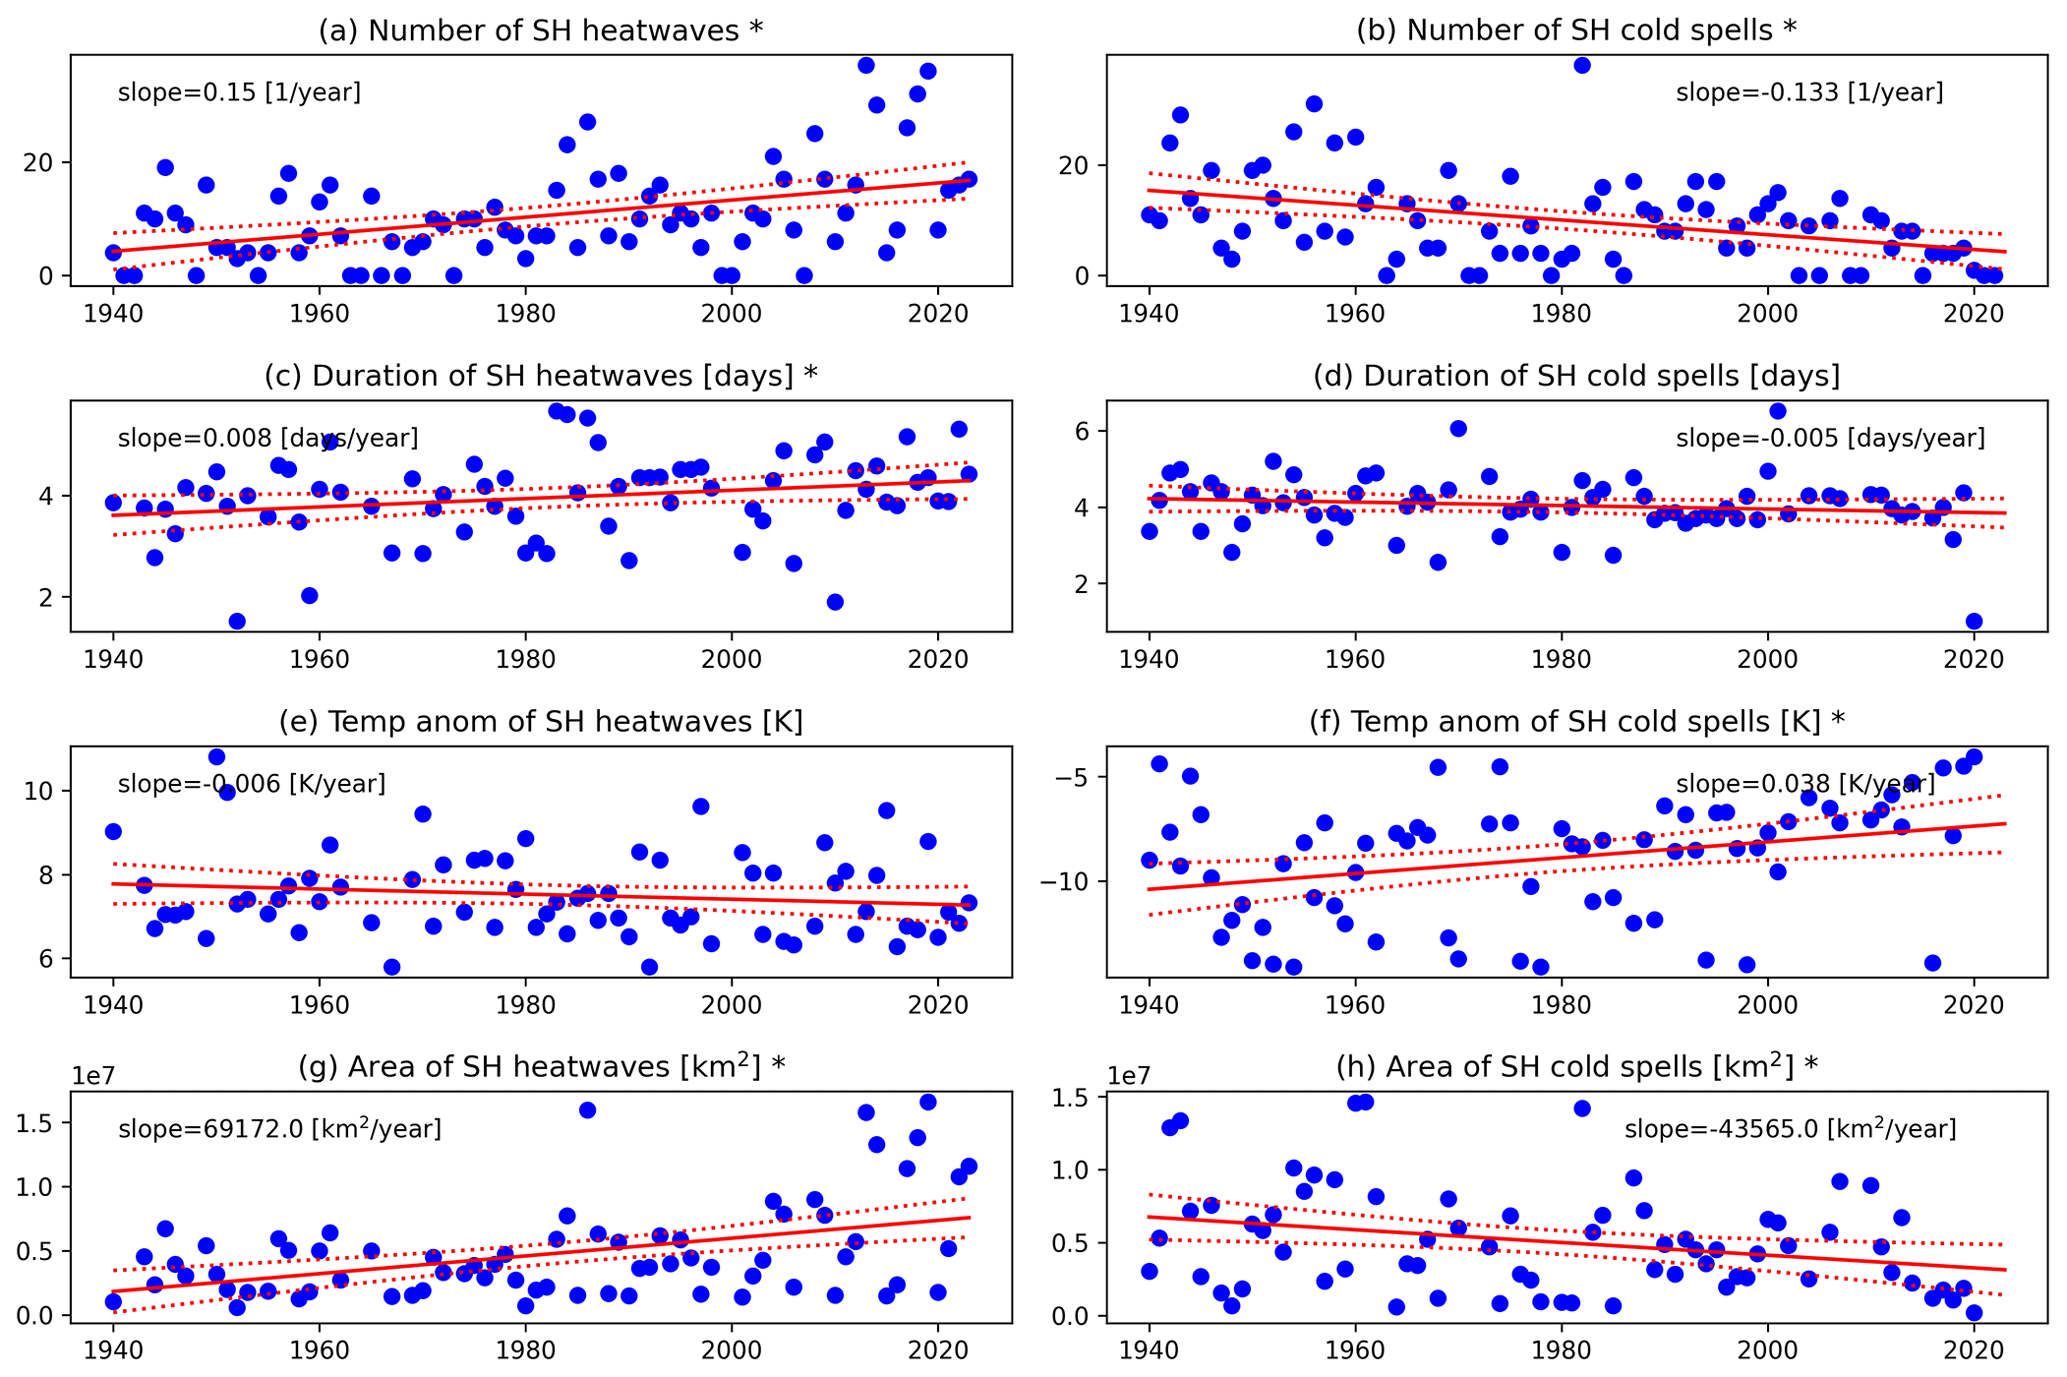
Figure A8The same as Fig. A4 but for temperature extremes with no requirements for concurrence. Seasons without any events are not accounted for when computing the linear fits for duration, severity and extent.
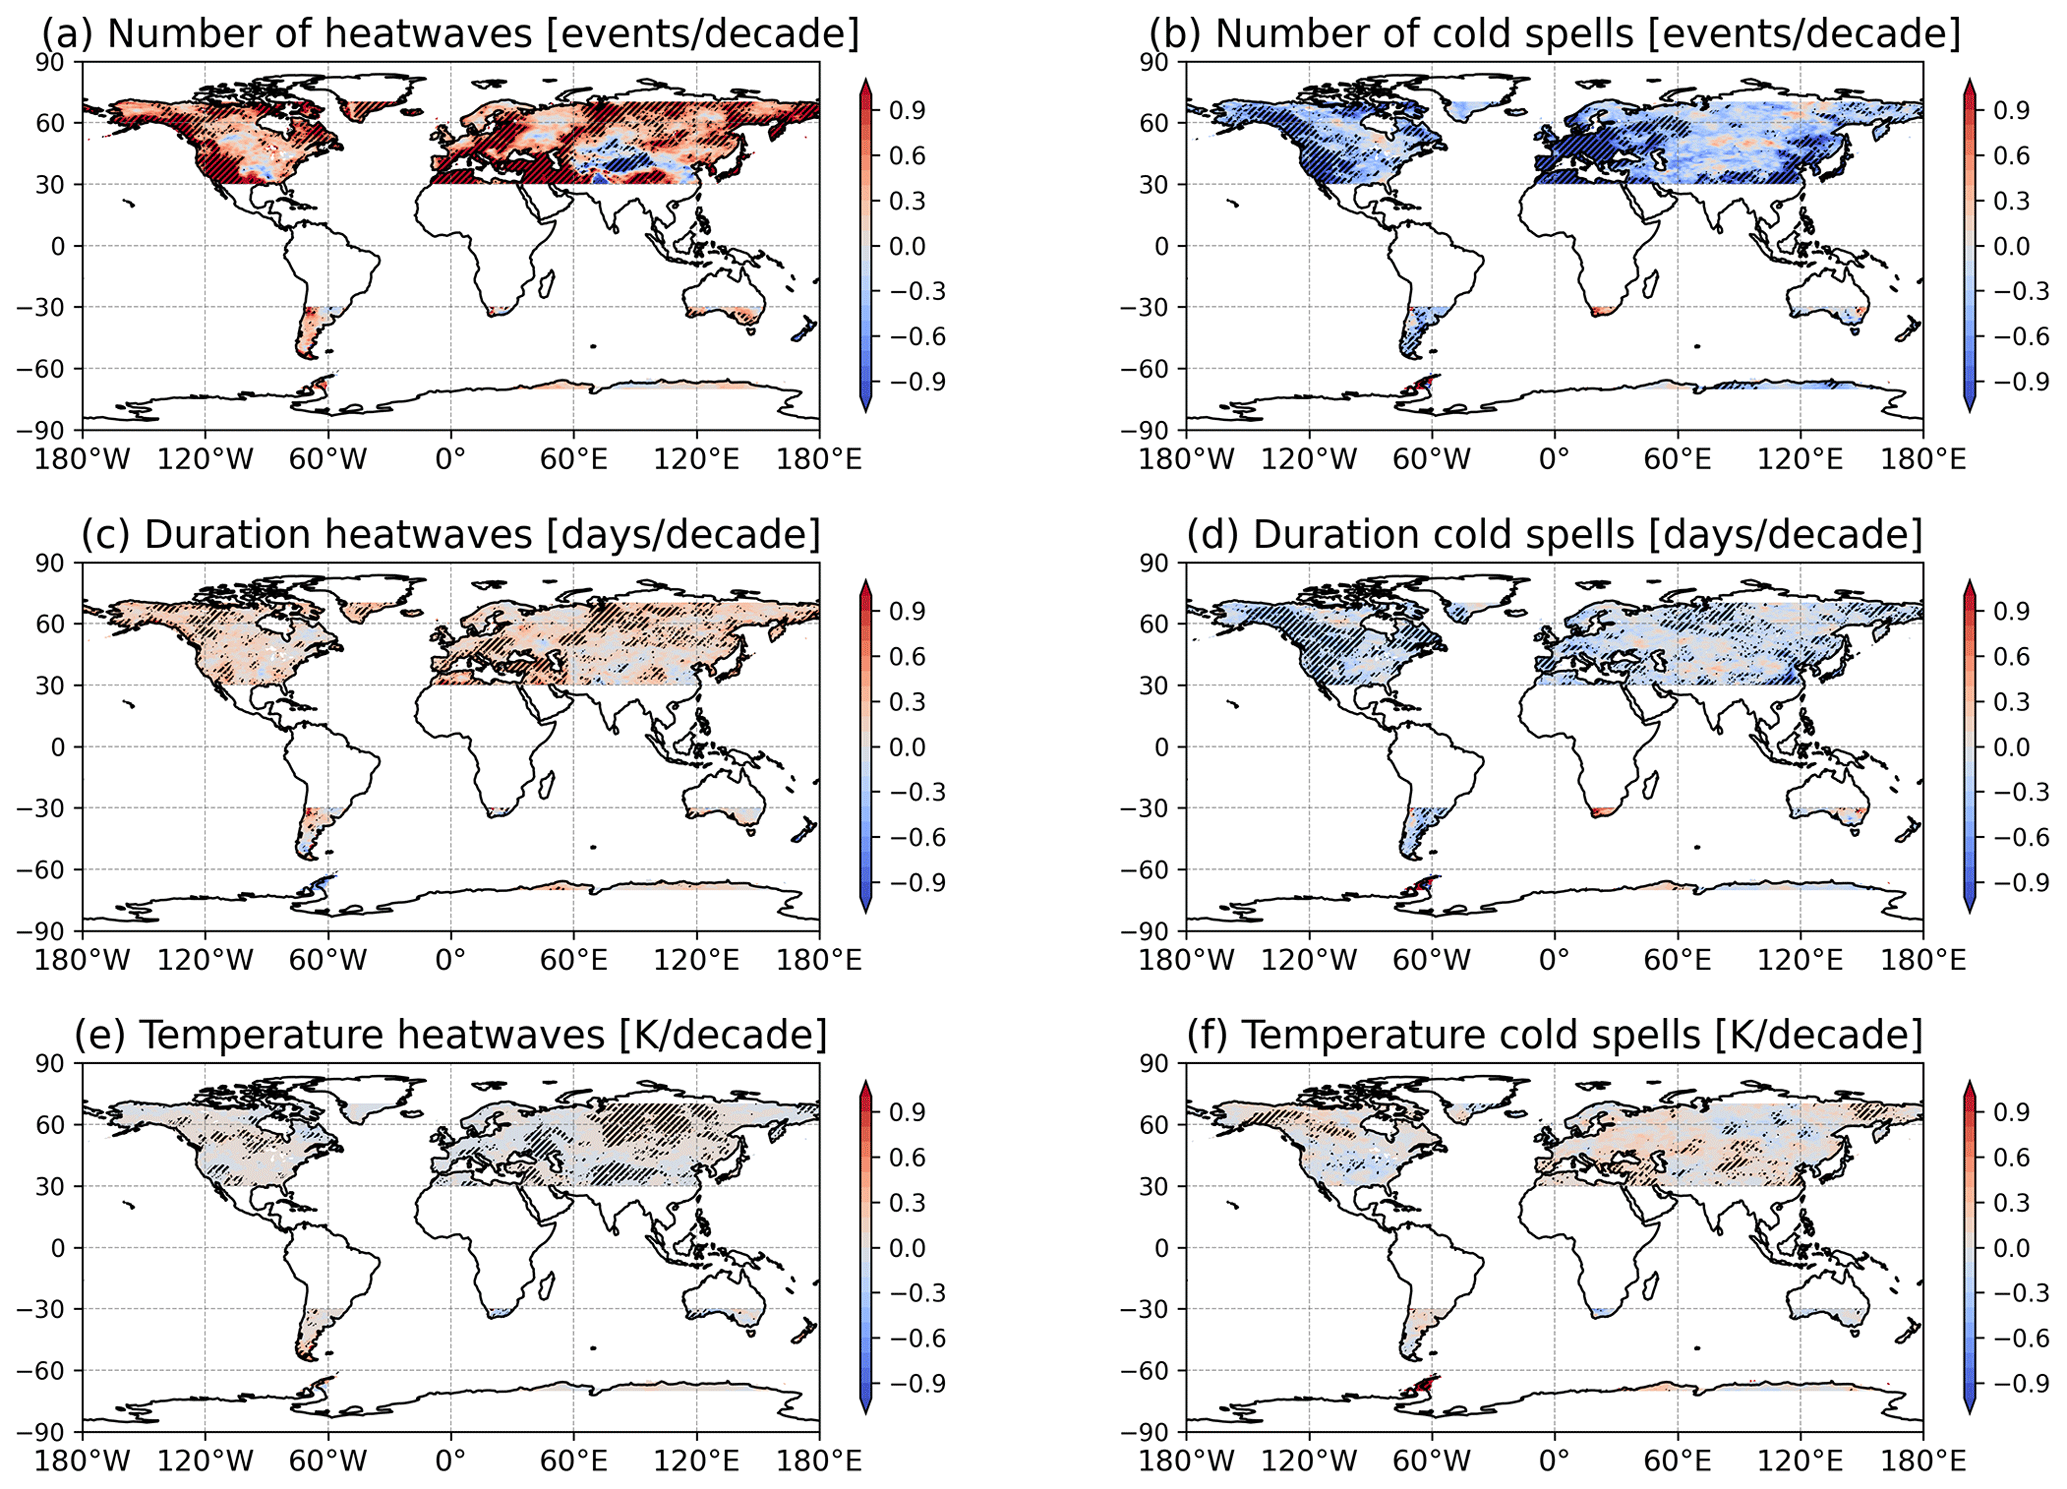
Figure A9The same as Fig. 4 but for percentile thresholds of 90 (heatwaves) and 10 (cold spells).
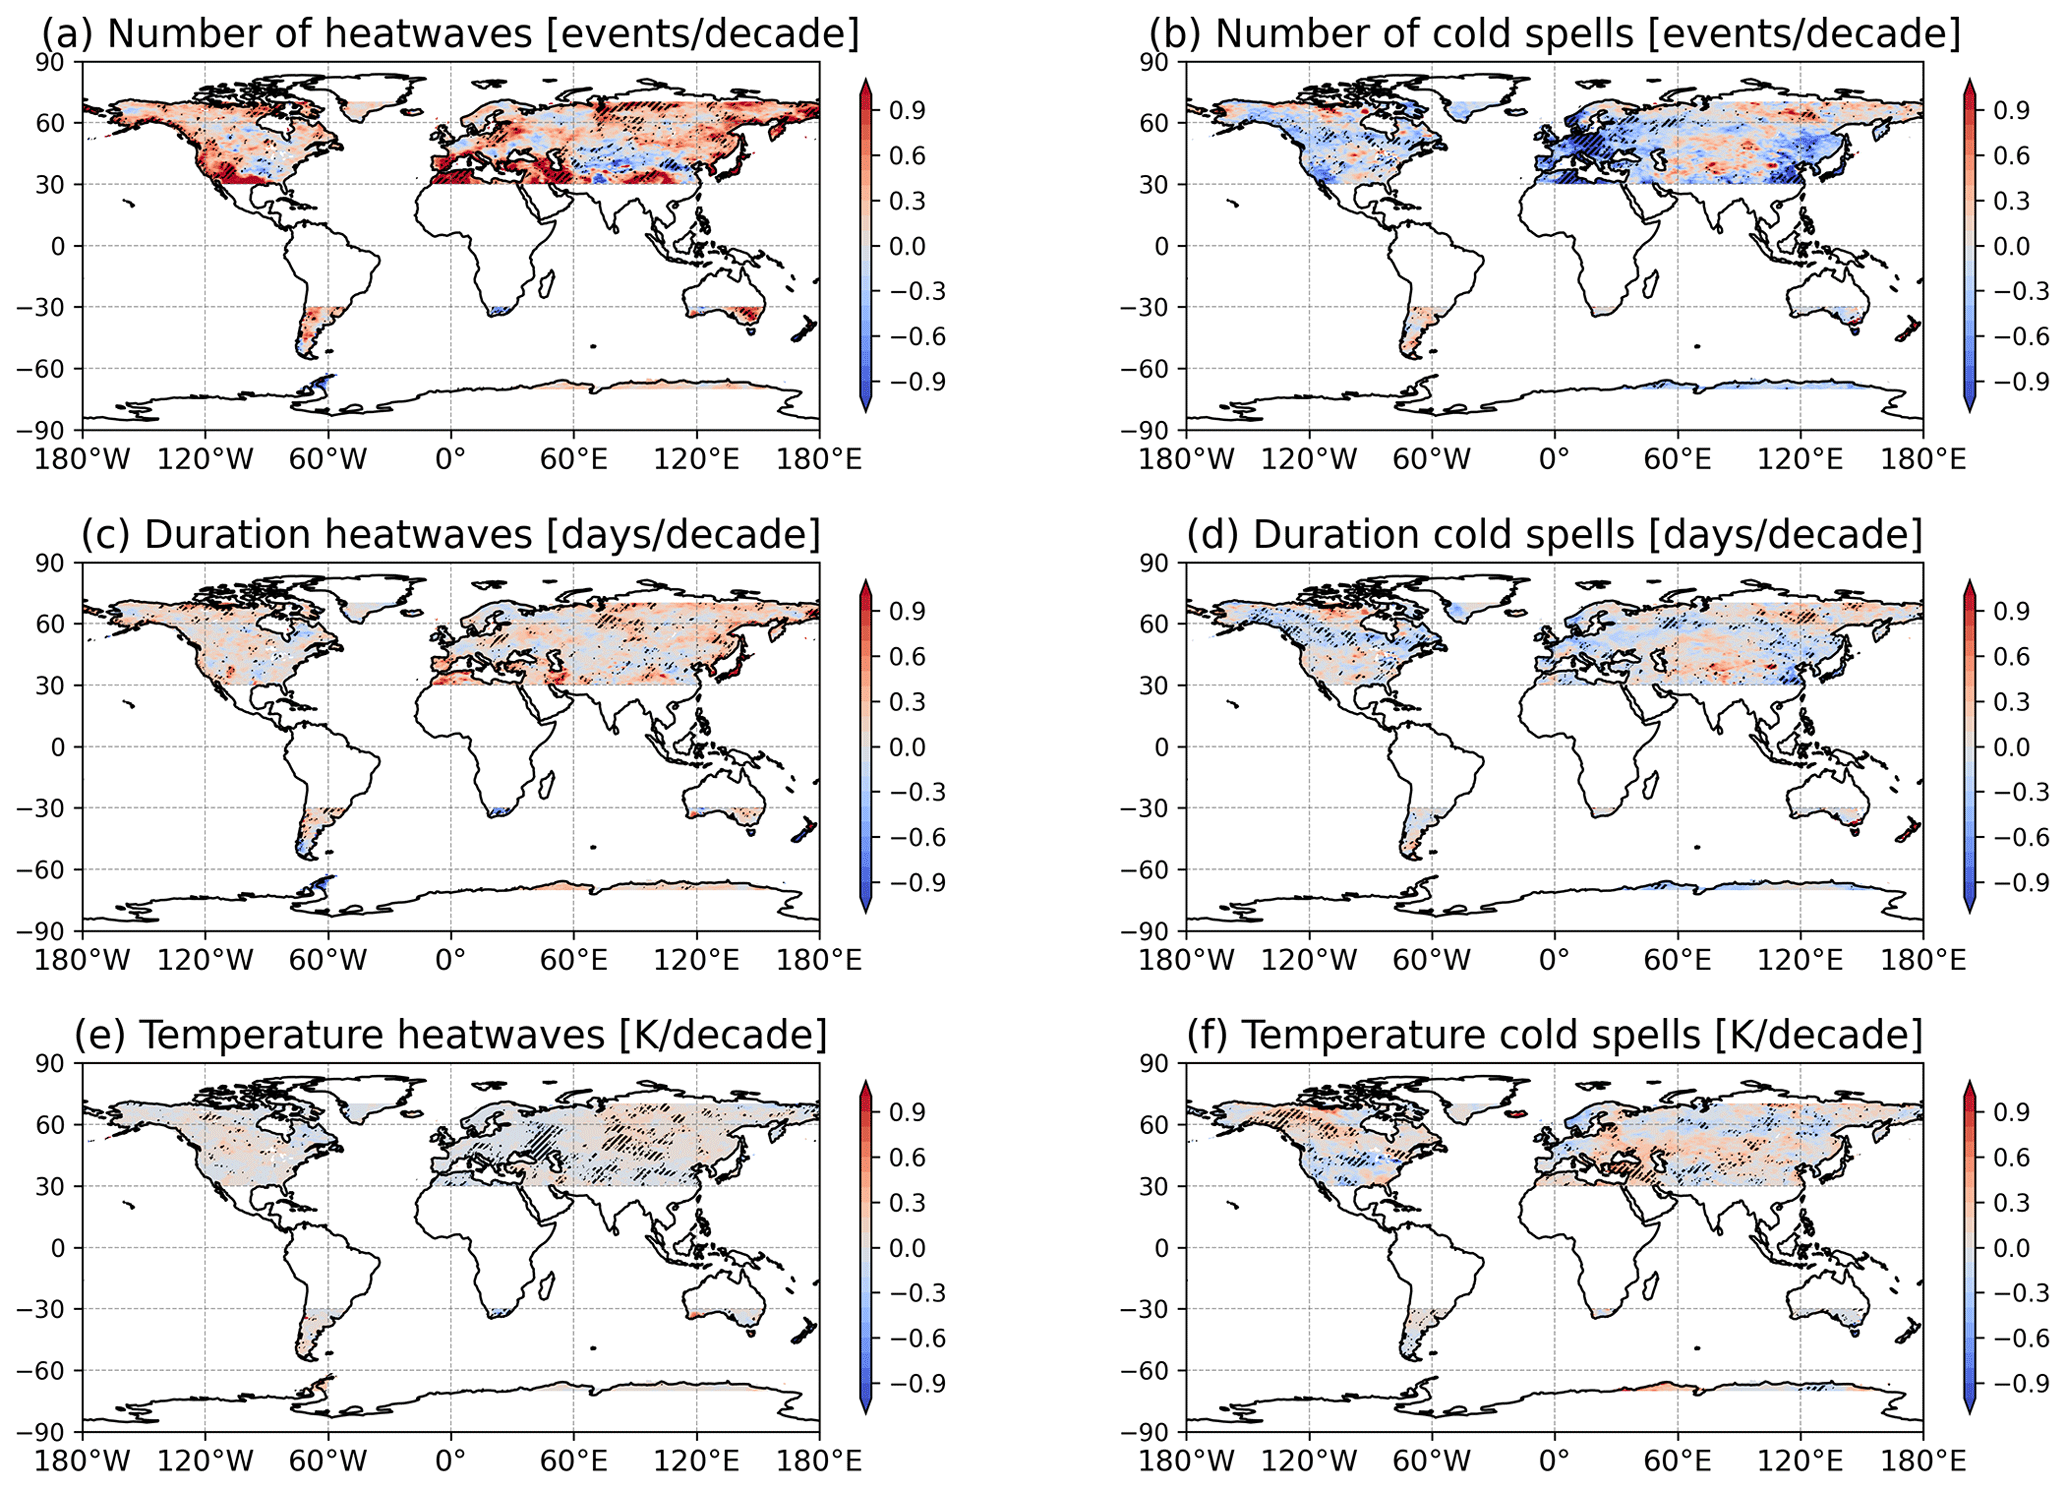
Figure A10The same as Fig. 4 but for temperature extremes with no requirements for concurrence.
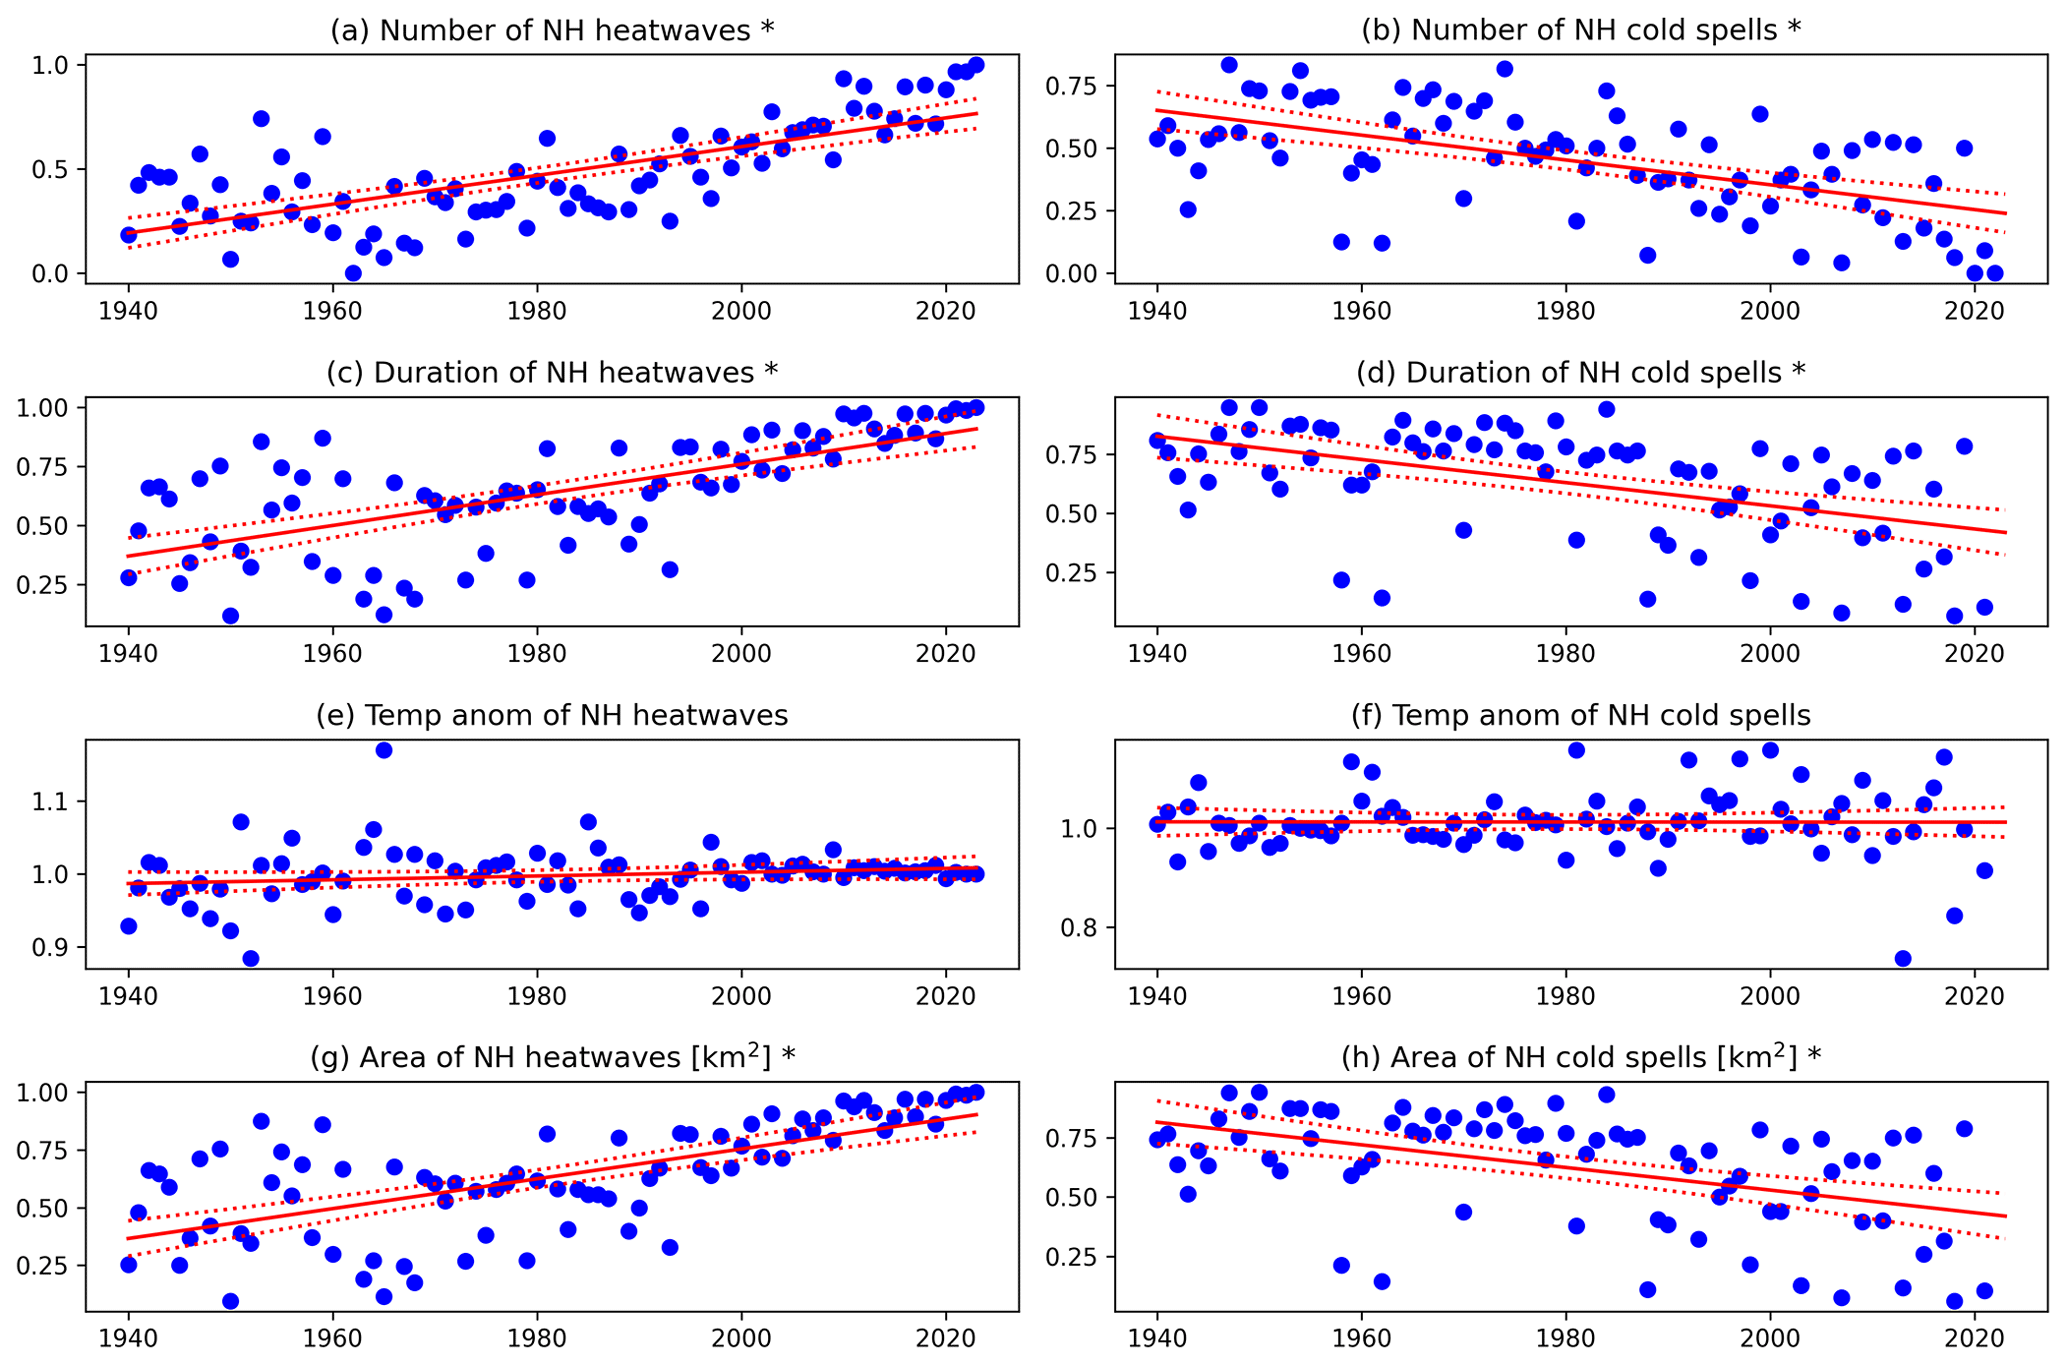
Figure A11The same as Fig. 3 but for the ratio between concurrent temperature extremes and all temperature extremes.
We provide a proof of concept for applying our toolbox to variables other than temperature by presenting NH trend results for 10 m daily mean wind extremes in Figs. B1 and B2. These correspond to Figs. 2 and 3 in the main text, albeit with different values for the toolbox parameters. Compared to compound temperature extremes, the relative frequency of compound wind extremes is over an order of magnitude lower. Nonetheless, we obtain a relatively large sample size and find both spatial variations (Fig. B1) and long-term trends (Fig. B2) in the characteristics of the compound wind extremes.
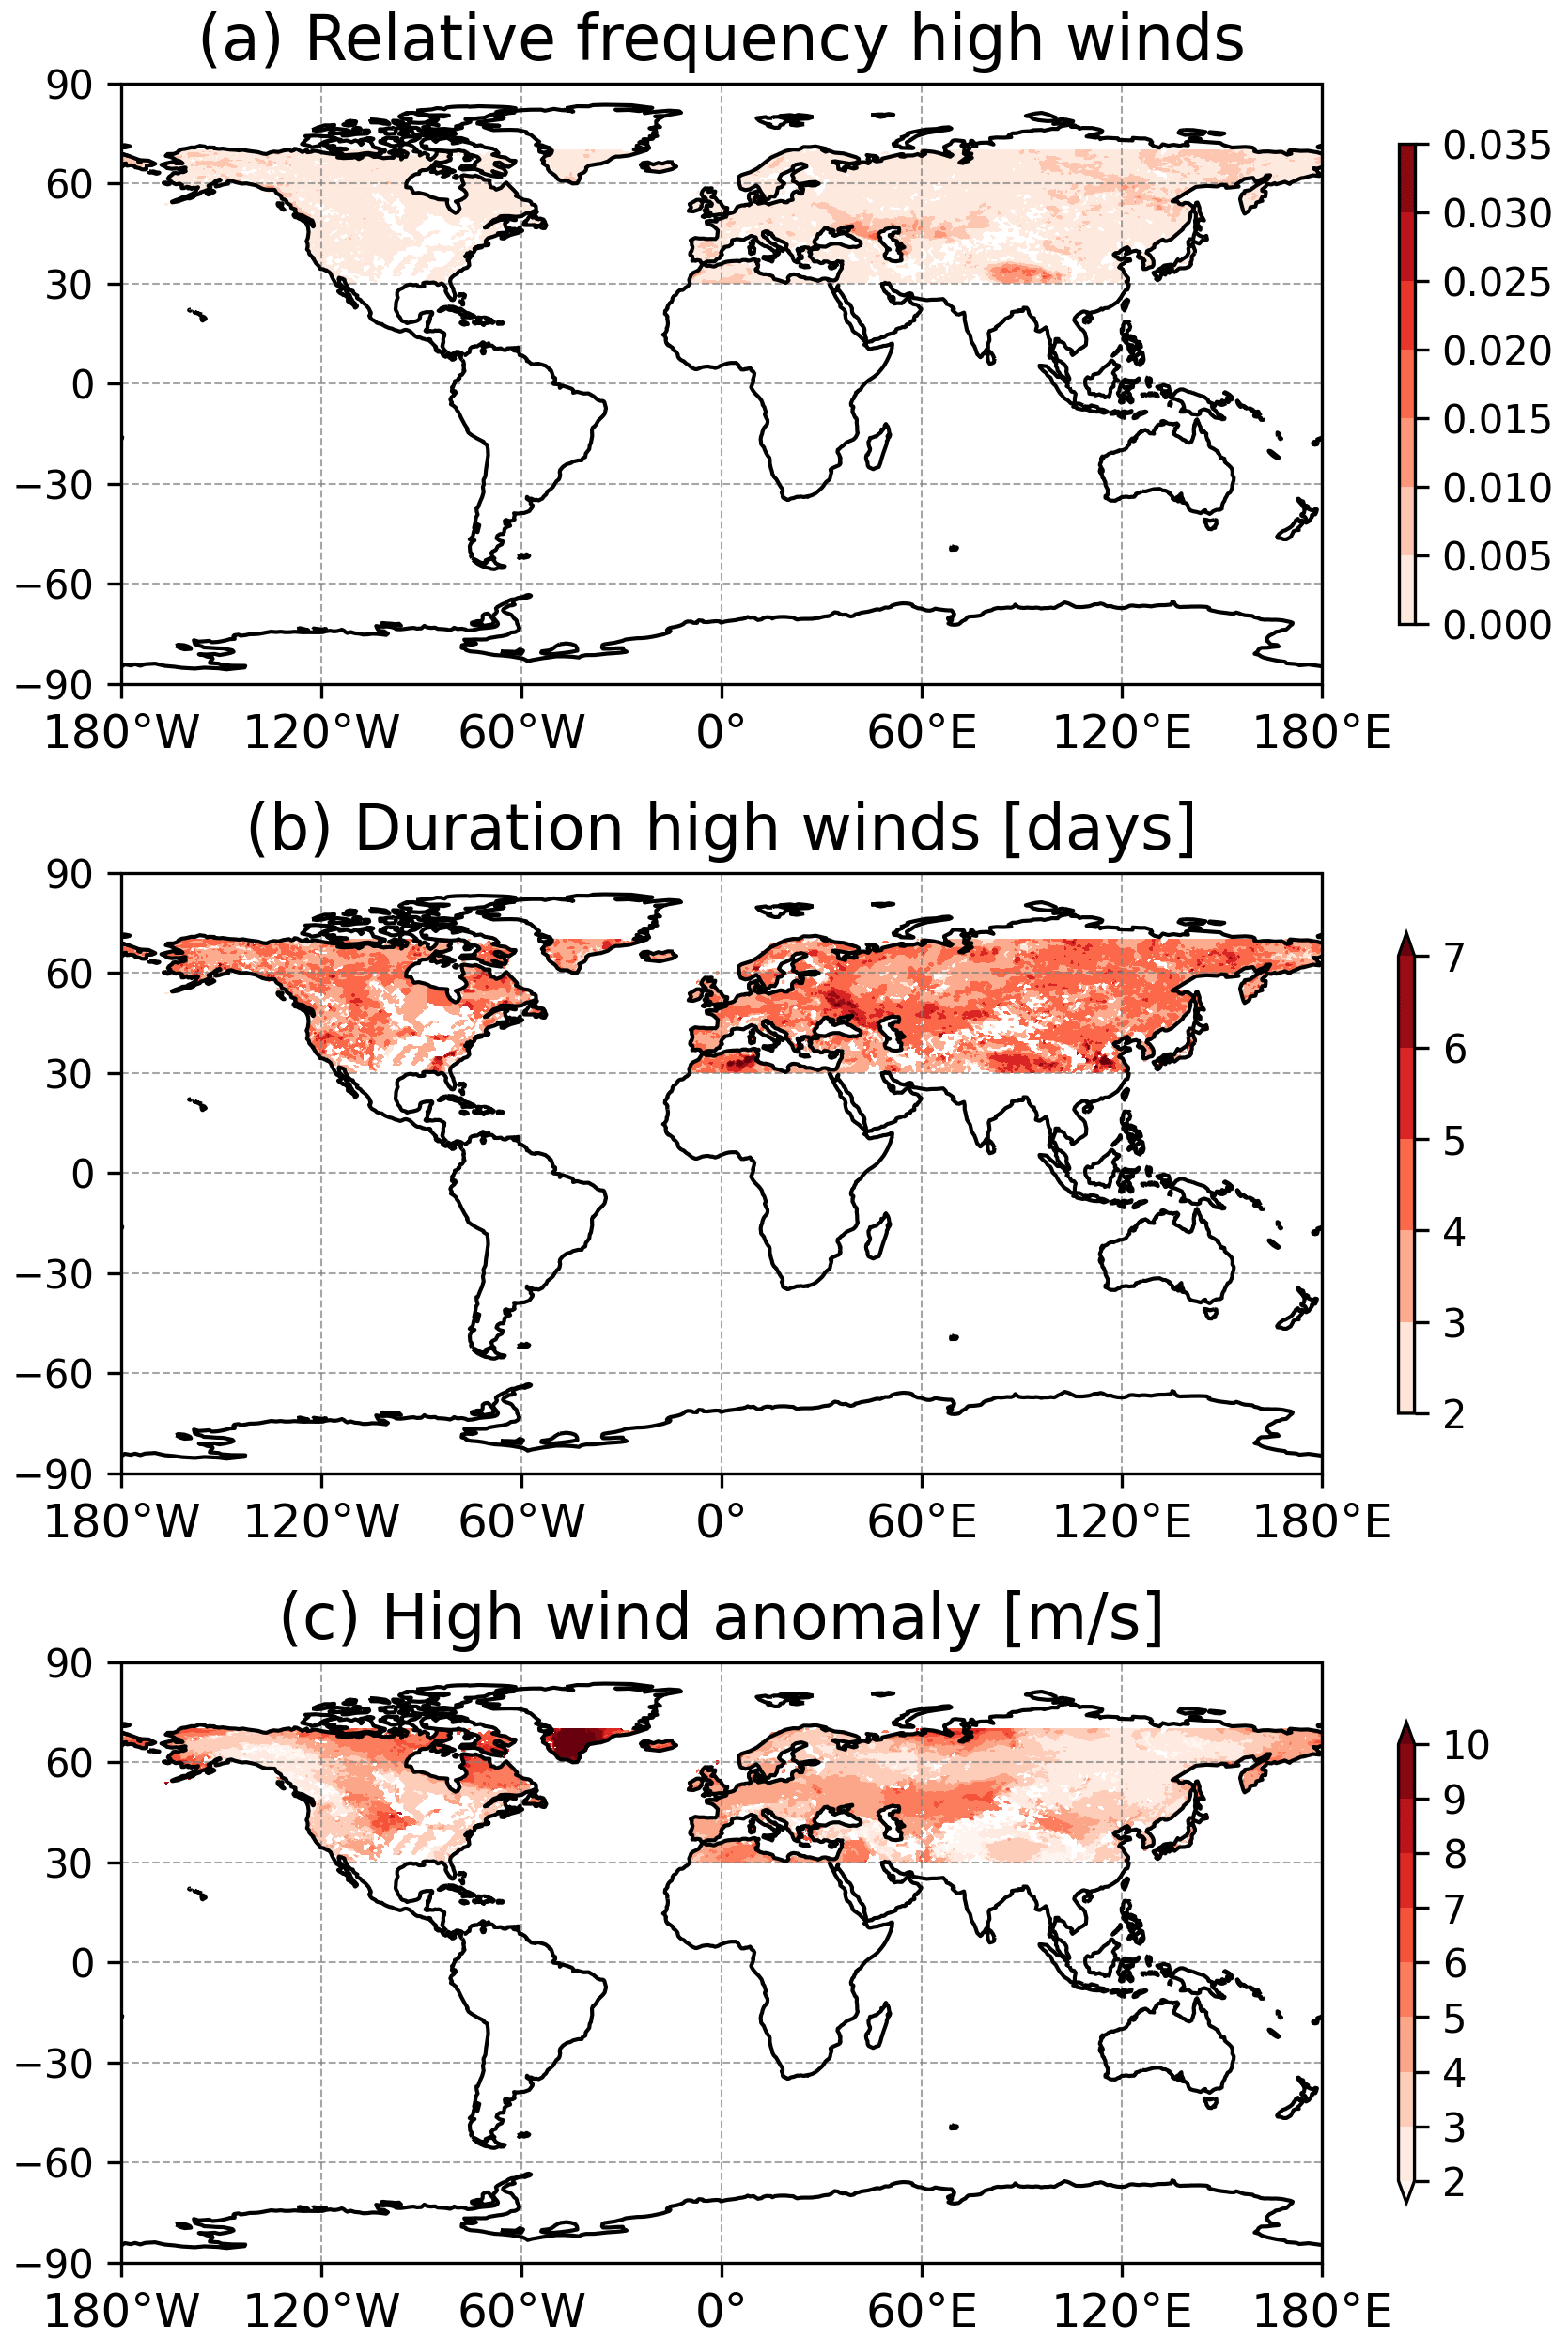
Figure B1The same as Fig. 2 but for 10 m wind. This figure uses the same parameters as Fig. 2 for temperature but uses a cluster separation of 250 km and a minimum areal extent of 12 500 km2.
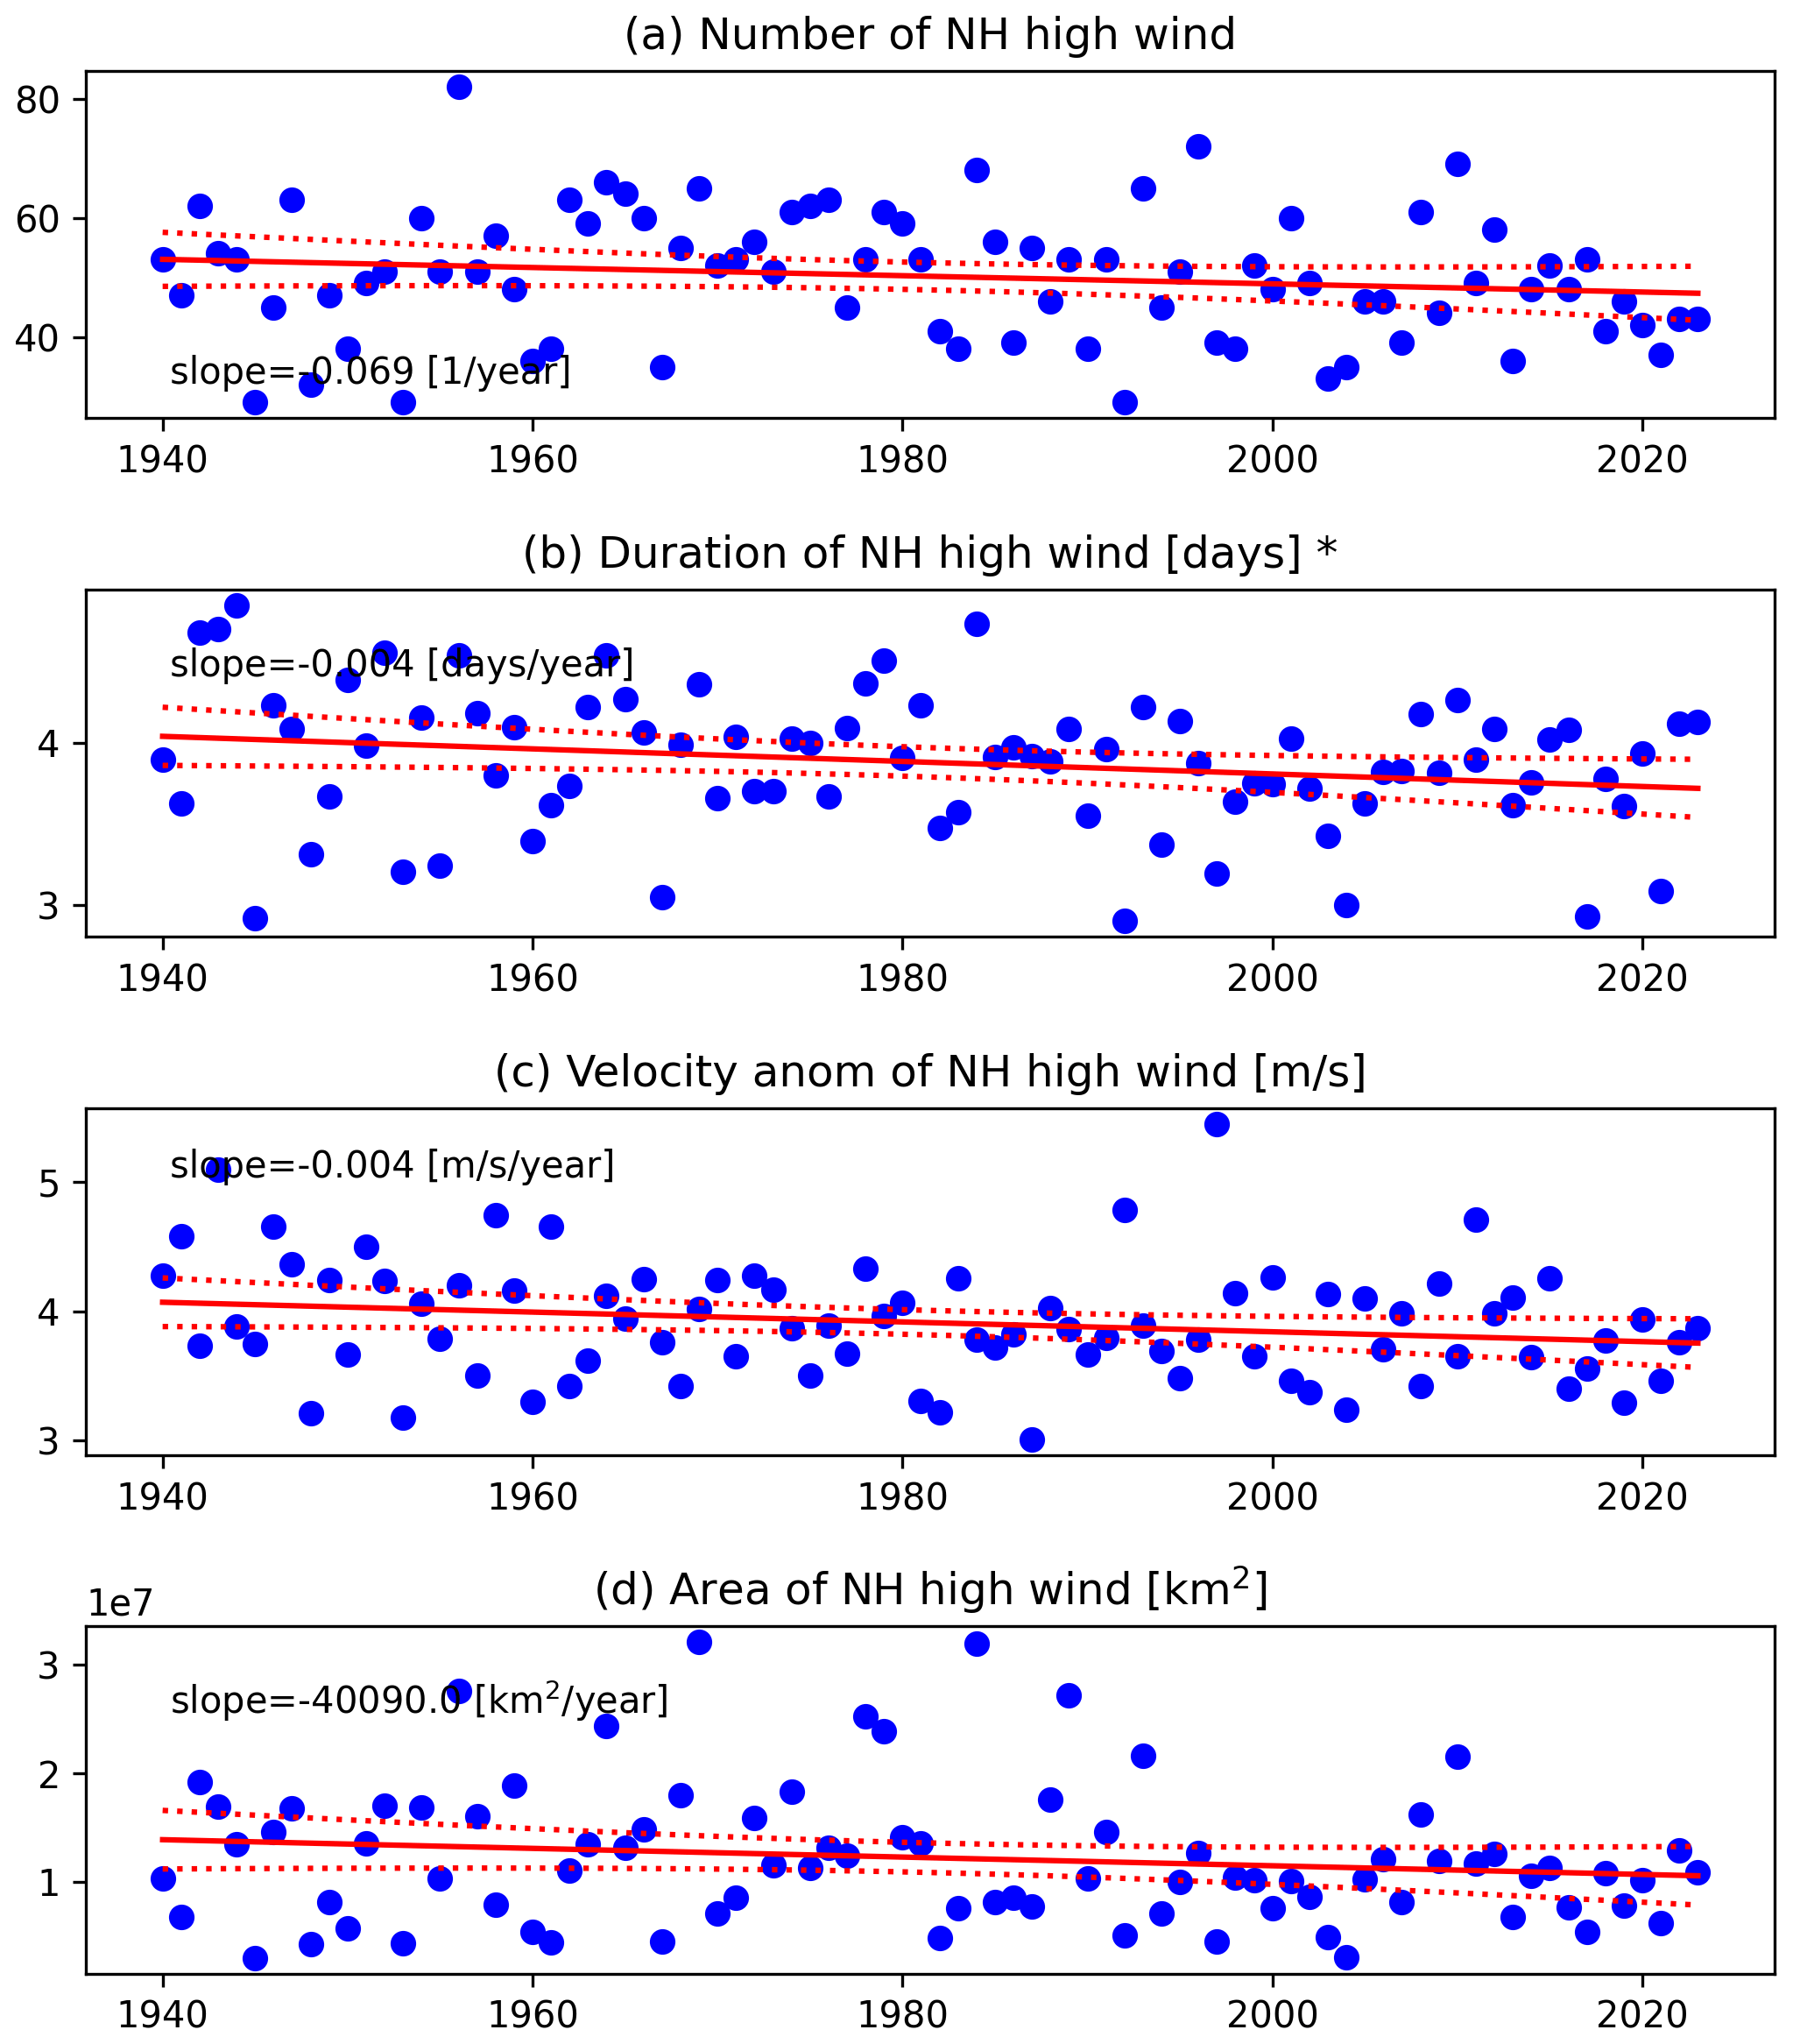
Figure B2The same as Fig. 3 but for 10 m wind. This figure uses the same parameters as Fig. 3 for temperature but uses a cluster separation of 250 km and a minimum areal extent of 12 500 km2.
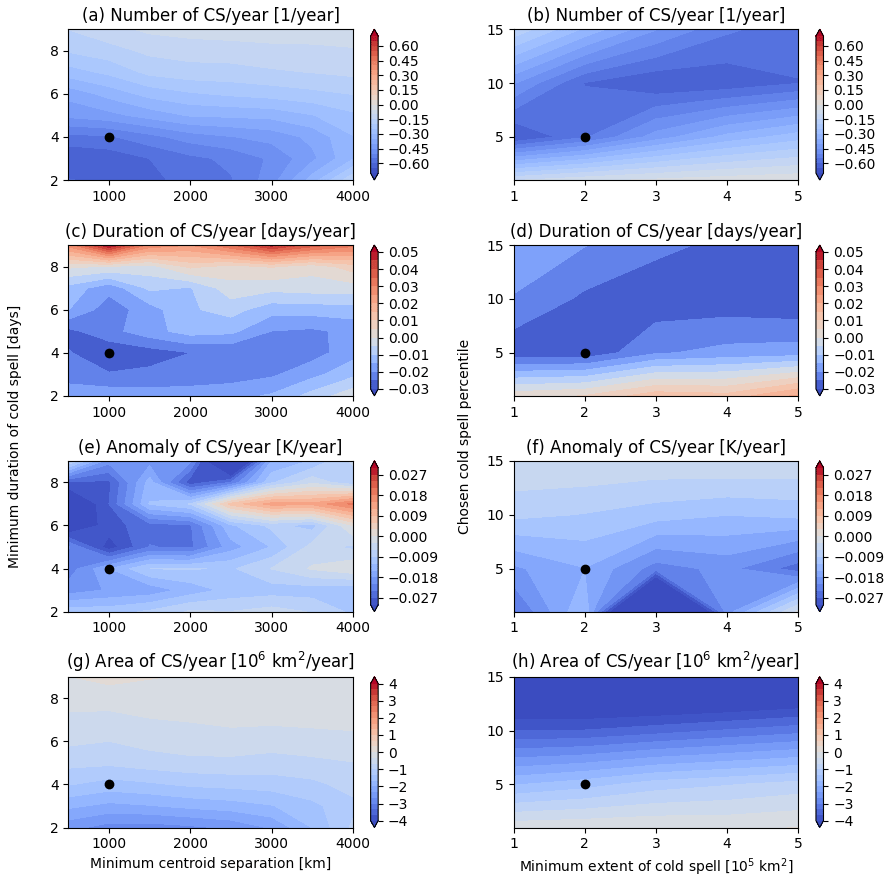
We provide a parameter sweep of the toolbox (for the parameter pairs minimum cluster separation–minimum duration and minimum areal extent–percentile for temperature extremes). The ranges included in the sweep are summarised in Table 1. Figures C1 and C2 show linear trends for NH heatwaves and cold spells, respectively, for the different parameter combinations. The dots correspond to the results shown in Fig. 3 in the main text for the reference parameter set (Table 1). The identified trends for heatwaves are generally positive and coherent across the parameter space (Fig. C1). An exception are the frequency and duration trends for a combination of very large centroid separations and very short minimum durations. In the latter case, we hypothesise that as the global mean temperature increases, it happens more and more often that all heatwaves on a given day are clustered into a single event, and we also hypothesise that there are thus fewer and shorter-lasting concurrent heatwaves. We also see negative slopes in heatwave temperature anomaly for combinations of very high percentiles and very large minimum extent values. We hypothesise that this is due to the fact that, with global warming, such very extreme (both large and intense) heatwaves are increasingly common, and thus their average temperature anomaly decreases.
Cold spells display predominantly negative trends (Fig. C2). A notable exception are positive trends in duration for both very persistent and very intense events and positive trends in temperature anomaly for large centroid separations. For temperature anomalies, a negative trend implies more intense cold spells, while a positive trend corresponds to a weakening of the cold spells. Imposing large centroid separations presumably eliminates from the sample of concurrent cold spells potentially very intense cold spells limited to a specific sector of the hemisphere and only retains potentially weaker but truly circum-hemispheric episodes. The positive trend in duration for exceptionally persistent or intense cold spells can be linked to the findings of La Sorte et al. (2021). The authors studied trends in maximum duration of temperature extremes since 1950 and found no systematic decrease for cold spells with global warming but instead found regionally dependent trends.
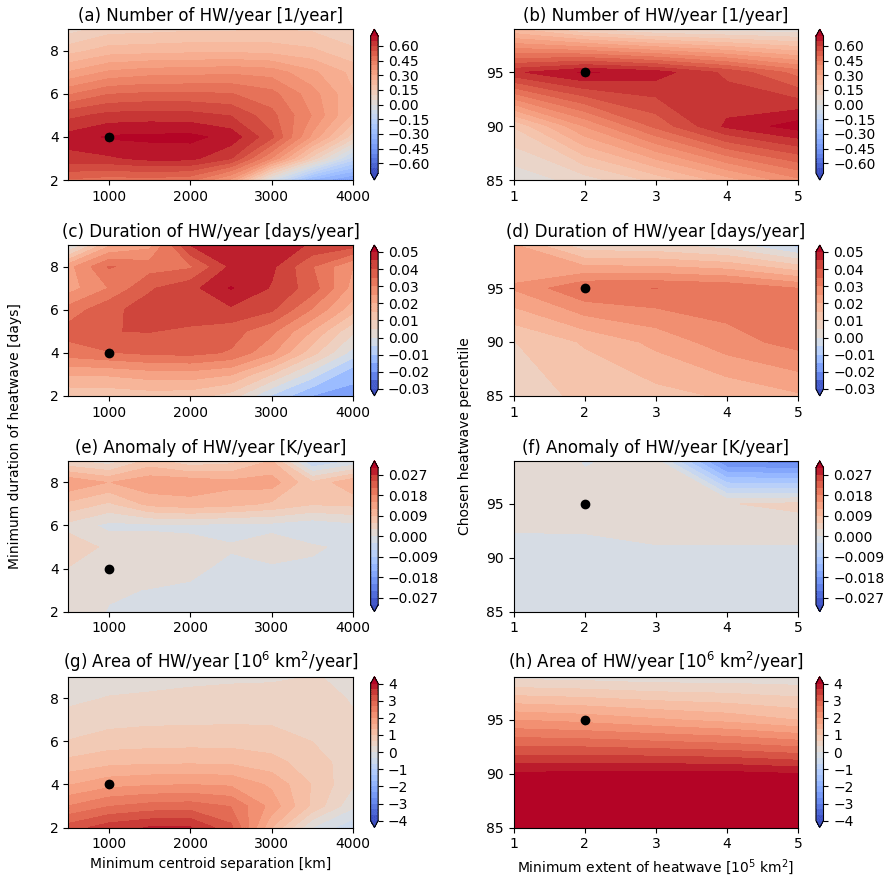
Figure C1Parameter sweep of the toolbox for the parameter pairs (a, c, e, g) minimum cluster separation–minimum duration and (b, d, f, h) minimum areal extent–percentile for temperature extremes for concurrent heatwaves. The colours show the linear trends of the following quantities: (a, b) number of heatwaves per year, (c, d) duration of heatwaves (in days), (e, f) temperature anomaly of heatwaves (K) and (g, h) heatwave area (1×10⁵ km2). The black dots show the parameter combinations used in the paper. If the data for a given parameter combination span less than 40 years, the trend value is greyed out in the figure.
The toolbox code is freely available through GitHub: https://github.com/AntSegalini/Global-extreme-events-tool and Zenodo: https://doi.org/10.5281/zenodo.12746817 (Segalini and Messori, 2024).
The ERA5 data used in this study are freely available from the Copernicus Climate Change Services Climate Data Store: https://doi.org/10.24381/cds.adbb2d47 (Hersbach et al., 2023). A sample data file for use with the toolbox is available through GitHub: https://github.com/AntSegalini/Global-extreme-events-tool.
GM: conceptualisation, methodology, formal analysis, visualisation, funding acquisition, writing – original draft, writing – review and editing. AS: software, formal analysis, writing – review and editing. AMR: conceptualisation, writing – review and editing. All authors contributed to the discussion of the results.
At least one of the (co-)authors is a member of the editorial board of Earth System Dynamics. The peer-review process was guided by an independent editor, and the authors have no other competing interests to declare.
Publisher’s note: Copernicus Publications remains neutral with regard to jurisdictional claims made in the text, published maps, institutional affiliations, or any other geographical representation in this paper. While Copernicus Publications makes every effort to include appropriate place names, the final responsibility lies with the authors.
All authors thank the editors, Ondrej Lhotka and one anonymous reviewer for their helpful input. Alexandre M. Ramos acknowledges the Helmholtz “Changing Earth” program.
This research has been supported by the European Union's H2020 and HORIZON EUROPE research and innovation programmes under European Research Council grant nos. 948309 and 101112727.
The publication of this article was funded by the Swedish Research Council, Forte, Formas and Vinnova.
This paper was edited by Ira Didenkulova and Somnath Baidya Roy and reviewed by Ondrej Lhotka and one anonymous referee.
Allen, M. J. and Sheridan, S. C.: Spatio-temporal changes in heat waves and cold spells: an analysis of 55 US cities, Phys. Geogr., 37, 189–209, 2016.
Arblaster, J. M. and Alexander, L. V.: The impact of the El Niño-Southern Oscillation on maximum temperature extremes, Geophys. Res. Lett., 39, L20702, https://doi.org/10.1029/2012GL053409, 2012.
Brown, S. J.: Future changes in heatwave severity, duration and frequency due to climate change for the most populous cities, Weather and Climate Extremes, 30, 100278, https://doi.org/10.1016/j.wace.2020.100278, 2020.
Bui, H. X., Timmermann, A., Lee, J. Y., Maloney, E. D., Li, Y. X., Kim, J. E., Shuman, J., Lee, S. S., and Wieder, W. R.: Summer midlatitude stationary wave patterns synchronize Northern Hemisphere wildfire occurrence, Geophys. Res. Lett., 49, e2022GL099017, https://doi.org/10.1029/2022GL099017, 2022.
Cahynová, M. and Huth, R.: Atmospheric circulation influence on climatic trends in Europe: an analysis of circulation type classifications from the COST733 catalogue, Int. J. Climatol., 36, 2743–2760, https://doi.org/10.1002/joc.4003, 2016.
Chen, L., Francis, J., and Hanna, E.: The “Warm-Arctic/Cold-continents” pattern during 1901–2010, Int. J. Climatol., 38, 5245–5254, 2018.
Claassen, J. N., Ward, P. J., Daniell, J., Koks, E. E., Tiggeloven, T., and de Ruiter, M. C.: A new method to compile global multi-hazard event sets, Sci. Rep.-UK, 13, 13808, https://doi.org/10.1038/s41598-023-40400-5, 2023.
Coumou, D., Petoukhov, V., Rahmstorf, S., Petri, S., and Schellnhuber, H. J.: Quasi-resonant circulation regimes and hemispheric synchronization of extreme weather in boreal summer, P. Natl. Acad. Sci. USA, 111, 12331–12336, 2014.
Davies, H. C.: Weather chains during the 2013/2014 winter and their significance for seasonal prediction, Nat. Geosci., 8, 833–837, 2015.
Della-Marta, P. M., Luterbacher, J., von Weissenfluh, H., Xoplaki, E., Brunet, M., and Wanner, H.: Summer heat waves over western Europe 1880–2003, their relationship to large-scale forcings and predictability, Clim. Dynam., 29, 251–275, 2007.
Di Capua, G., Sparrow, S., Kornhuber, K., Rousi, E., Osprey, S., Wallom, D., van den Hurk, B., and Coumou, D.: Drivers behind the summer 2010 wave train leading to Russian heatwave and Pakistan flooding, npj Climate and Atmospheric Science, 4, 55, https://doi.org/10.1038/s41612-021-00211-9, 2021.
Faranda, D., Messori, G., Jezequel, A., Vrac, M., and Yiou, P.: Atmospheric circulation compounds anthropogenic warming and impacts of climate extremes in Europe, P. Natl. Acad. Sci. USA, 120, e2214525120, https://doi.org/10.1073/pnas.2214525120, 2023.
Gaupp, F., Hall, J., Hochrainer-Stigler, S., and Dadson, S.: Changing risks of simultaneous global breadbasket failure, Nat. Clim. Change, 10, 54–57, 2020.
Grotjahn, R., Black, R., Leung, R., Wehner, M. F., Barlow, M., Bosilovich, M., Gershunov, A., Gutowski Jr., W. J., Gyakum, J. R., Katz, R. W., Lee, Y.-Y., Lim, Y.-K., and Prabhat: North American extreme temperature events and related large scale meteorological patterns: a review of statistical methods, dynamics, modeling, and trends, Clim. Dynam., 46, 1151–1184, 2016.
Guirguis, K., Gershunov, A., Cayan, D. R., and Pierce, D. W.: Heat wave probability in the changing climate of the Southwest US, Clim. Dynam., 50, 3853–3864, 2018.
Harnik, N., Messori, G., Caballero, R., and Feldstein, S. B.: The circumglobal North American wave pattern and its relation to cold events in eastern North America, Geophys. Res. Lett., 43, 11015–11023, https://doi.org/10.1002/2016GL070760, 2016.
Hersbach, H., Bell, B., Berrisford, P., Hirahara, S., Horányi, A., Muñoz-Sabater, J., Nicolas, J., Peubey, C., Radu, R., Schepers, D., Simmons, A., Cornel Soci, Abdalla, S., Abellan, X., Balsamo, G., Bechtold, P., Biavati, G., Bidlot, J., Bonavita, M., De Chiara, G., Dahlgren, P., Dee, D., Diamantakis, M., Dragani, R., Flemming, J., Forbes, R., Fuentes, M., Geer, A., Haimberger, L., Healy, S., Hogan, R. J., Hólm, E., Janisková, M., Keeley, S., Laloyaux, P., Lopez,P., Lupu, C., Radnoti, G., de Rosnay, P., Rozum, I., Vamborg, F., Villaume,S., and Thépaut, J.-N.: The ERA5 global reanalysis, Q. J. Roy. Meteor. Soc., 146, 1999–2049, 2020.
Hersbach, H., Bell, B., Berrisford, P., Biavati, G., Horányi, A., Muñoz Sabater, J., Nicolas, J., Peubey, C., Radu, R., Rozum, I., Schepers, D., Simmons, A., Soci, C., Dee, D., and Thépaut, J.-N.: ERA5 hourly data on single levels from 1940 to present, Copernicus Climate Change Service (C3S) Climate Data Store (CDS) [data set], https://doi.org/10.24381/cds.adbb2d47, 2023.
Holmberg, E., Messori, G., Caballero, R., and Faranda, D.: The link between European warm-temperature extremes and atmospheric persistence, Earth Syst. Dynam., 14, 737–765, https://doi.org/10.5194/esd-14-737-2023, 2023.
Kornhuber, K. and Messori, G.: Recent increase in a recurrent pan-Atlantic wave pattern driving concurrent wintertime extremes, B. Am. Meteor. Soc., 104, E1694–E1708, 2023.
Kornhuber, K., Osprey, S., Coumou, D., Petri, S., Petoukhov, V., Rahmstorf, S., and Gray, L.: Extreme weather events in early summer 2018 connected by a recurrent hemispheric wave-7 pattern, Environ. Res. Lett., 14, 054002, https://doi.org/10.1088/1748-9326/ab13bf, 2019.
Kornhuber, K., Coumou, D., Vogel, E., Lesk, C., Donges, J. F., Lehmann, J., and Horton, R. M.: Amplified Rossby waves enhance risk of concurrent heatwaves in major breadbasket regions, Nat. Clim. Change, 10, 48–53, 2020.
La Sorte, F. A., Johnston, A., and Ault, T. R.: Global trends in the frequency and duration of temperature extremes, Clim. Change, 166, 1, https://doi.org/10.1007/s10584-021-03094-0, 2021.
Lau, W. K. and Kim, K. M.: The 2010 Pakistan flood and Russian heat wave: Teleconnection of hydrometeorological extremes, J. Hydrometeorol., 13, 392–403, 2012.
Leeding, R., Riboldi, J., and Messori, G.: On Pan-Atlantic cold, wet and windy compound extremes, Weather and Climate Extremes, 39, 100524, https://doi.org/10.1016/j.wace.2022.100524, 2023.
Lhotka, O. and Kyselý, J.: Characterizing joint effects of spatial extent, temperature magnitude and duration of heat waves and cold spells over Central Europe, Int. J. Climatol., 35, 1232–1244, 2015.
Lin, C., Kjellström, E., Wilcke, R. A. I., and Chen, D.: Present and future European heat wave magnitudes: climatologies, trends, and their associated uncertainties in GCM-RCM model chains, Earth Syst. Dynam., 13, 1197–1214, https://doi.org/10.5194/esd-13-1197-2022, 2022.
Loikith, P. C. and Broccoli, A. J.: The influence of recurrent modes of climate variability on the occurrence of winter and summer extreme temperatures over North America, J. Climate, 27, 1600–1618, 2014.
Lyon, B., Barnston, A. G., Coffel, E., and Horton, R. M.: Projected increase in the spatial extent of contiguous US summer heat waves and associated attributes, Environ. Res. Lett., 14, 114029, https://doi.org/10.1088/1748-9326/ab4b41, 2019.
Messori, G. and Faranda, D.: On the systematic occurrence of compound cold spells in North America and wet or windy extremes in Europe, Geophys. Res. Lett., 50, e2022GL101008, https://doi.org/10.1029/2022GL101008, 2023.
Messori, G., Caballero, R., and Gaetani, M.: On cold spells in North America and storminess in western Europe, Geophys. Res. Lett., 43, 6620–6628, 2016.
Peings, Y., Cattiaux, J., and Douville, H.: Evaluation and response of winter cold spells over Western Europe in CMIP5 models, Clim. Dynam., 41, 3025–3037, 2013.
Riboldi, J., Leeding, R., Segalini, A., and Messori, G.: Multiple Large-Scale Dynamical Pathways for Pan–Atlantic Compound Cold and Windy Extremes. Geophys. Res. Lett., 50, e2022GL102528, https://doi.org/10.1029/2022GL102528, 2023.
Rogers, C. D., Kornhuber, K., Perkins-Kirkpatrick, S. E., Loikith, P. C., and Singh, D.: Sixfold increase in historical northern hemisphere concurrent large heatwaves driven by warming and changing atmospheric circulations, J. Climate, 35, 1063–1078, 2022.
Röthlisberger, M., Frossard, L., Bosart, L. F., Keyser, D., and Martius, O.: Recurrent synoptic-scale Rossby wave patterns and their effect on the persistence of cold and hot spells, J. Climate, 32, 3207–3226, https://doi.org/10.1175/JCLI-D-18-0664.1, 2019.
Screen, J. A. and Simmonds, I.: Amplified mid-latitude planetary waves favour particular regional weather extremes, Nat. Clim. Change, 4, 704–709, 2014.
Segalini, A. and Messori, G.: Global extreme events tool, Zenodo [code, data set], https://doi.org/10.5281/zenodo.12746817, 2024.
Sung, M. K., Son, S. W., Yoo, C., Hwang, J., and An, S. I.: Seesawing of winter temperature extremes between East Asia and North America, J. Climate, 34, 4423-4434, 2021.
Tigchelaar, M., Battisti, D. S., Naylor, R. L., and Ray, D. K.: Future warming increases probability of globally synchronized maize production shocks, P. Natl. Acad. Sci. USA, 115, 6644–6649, https://doi.org/10.1073/pnas.1718031115, 2018.
Tilloy, A., Malamud, B. D., and Joly-Laugel, A.: A methodology for the spatiotemporal identification of compound hazards: wind and precipitation extremes in Great Britain (1979–2019), Earth Syst. Dynam., 13, 993–1020, https://doi.org/10.5194/esd-13-993-2022, 2022.
Vautard, R., Cattiaux, J., Happé, T., Singh, J., Bonnet, R., Cassou, C., Coumou, D., D’Andrea, F., Faranda, D., Fischer, E., Ribes, A., Sippel, S., and Yiou, P.: Heat extremes in Western Europe increasing faster than simulated due to atmospheric circulation trends, Nat. Commun., 14, 6803, https://doi.org/10.1038/s41467-023-42143-3, 2023.
Vogel, M. M., Zscheischler, J., Wartenburger, R., Dee, D., and Seneviratne, S. I.: Concurrent 2018 hot extremes across Northern Hemisphere due to human-induced climate change, Earth's Future, 7, 692–703, https://doi.org/10.1029/2019EF001189, 2019.
White, R. H., Kornhuber, K., Martius, O., and Wirth, V.: From atmospheric waves to heatwaves: A waveguide perspective for understanding and predicting concurrent, persistent, and extreme extratropical weather, B. Am. Meteor. Soc., 103, E923–E935, 2022.
Xu, Z., FitzGerald, G., Guo, Y., Jalaludin, B., and Tong, S.: Impact of heatwave on mortality under different heatwave definitions: a systematic review and meta-analysis, Environ. Int., 89, 193–203, 2016.
Ye, K. and Messori, G.: Two leading modes of wintertime atmospheric circulation drive the recent warm Arctic–cold Eurasia temperature pattern, J. Climate, 33, 5565–5587, 2020.
Zscheischler, J., Martius, O., Westra, S., Bevacqua, E., Raymond, C., Horton, R. M., van den Hurk, B., AghaKouchak, A., Jézéquel, A., Mahecha, M. D., Maraun, D., Ramos, A. M., Ridder, N. N., Thiery, W., and Vignotto, E.: A typology of compound weather and climate events, Nat. Rev. Earth Environ., 1, 333–347, 2020.
- Abstract
- Introduction
- A flexible toolbox for the analysis of concurrent temperature extremes
- A global climatology of concurrent temperature extremes
- Concluding remarks
- Appendix A
- Appendix B
- Appendix C
- Code availability
- Data availability
- Author contributions
- Competing interests
- Disclaimer
- Acknowledgements
- Financial support
- Review statement
- References