the Creative Commons Attribution 4.0 License.
the Creative Commons Attribution 4.0 License.
 | 22 Aug 2024
Consistent increase in East Asian Summer Monsoon rainfall and its variability under climate change over China in CMIP6
Anja Katzenberger
Anders Levermann
The East Asian Monsoon (EAM) dominates the climate over the densely populated region of eastern China and adjacent regions and therefore influences a fifth of the world's population. Thus, it is highly relevant to assess the changes in the central characteristics of the East Asian Summer Monsoon (EASM) under future warming in the latest generation of coupled climate models of the Coupled Model Intercomparison Project Phase 6 (CMIP6). We apply a set of selection criteria to 34 CMIP6 models to identify the six best performing (TOP6) models that best capture the EASM in the reference period 1995–2014. All of these models project an increase in June–August rainfall independent of the underlying emission scenario. The multi-model mean increase is 16.5 % under SSP5-8.5, 11.8 % under SSP3-7.0, 12.7 % under SSP2-4.5 and 9.3 % under SSP1-2.6 in the period 2081–2100 compared to 1995–2014. For China, the projected monsoon increase is slightly higher (12.6 % under SSP1-2.6 and 18.1 % under SSP5-8.5). The EASM rainfall will particularly intensify in southeastern China, Taiwan and North Korea. The multi-model mean indicates a linear relationship of the EASM rainfall depending on the global mean temperature that is relatively independent of the underlying scenario: per degree of global warming, the rainfall is projected to increase by 0.17 mm d−1, which refers to 3.1 % of rainfall in the reference period. It is thus predominately showing a “wet regions get wetter” pattern. The changes in the wind fields in the region are relatively small indicating the minor importance of dynamic factors, while pointing towards thermodynamic factors as responsible for the rainfall increase. The interannual variability is also robustly projected to increase between 17.6 % under SSP1-2.6 and 23.8 % under SSP5-8.5 in the multi-model mean between 2051–2100 and 1965–2014. Comparing the same periods, extremely wet seasons are projected to occur 7 times more often under SSP5-8.5.
- Article
(11802 KB) - Full-text XML
- BibTeX
- EndNote


The climate over East Asia is dominated by the monsoon seasons that are defined as reversing seasonal winds between the Pacific Ocean and the East Asian continent associated with different rainfall regimes. Rainfall during the East Asian Summer Monsoon (EASM) accounts for 40 %–50 % of the annual precipitation in southern China and 60 %–70 % of the annual precipitation in northern China (Lei et al., 2011), making it a central factor for the socioeconomic livelihood of the region.
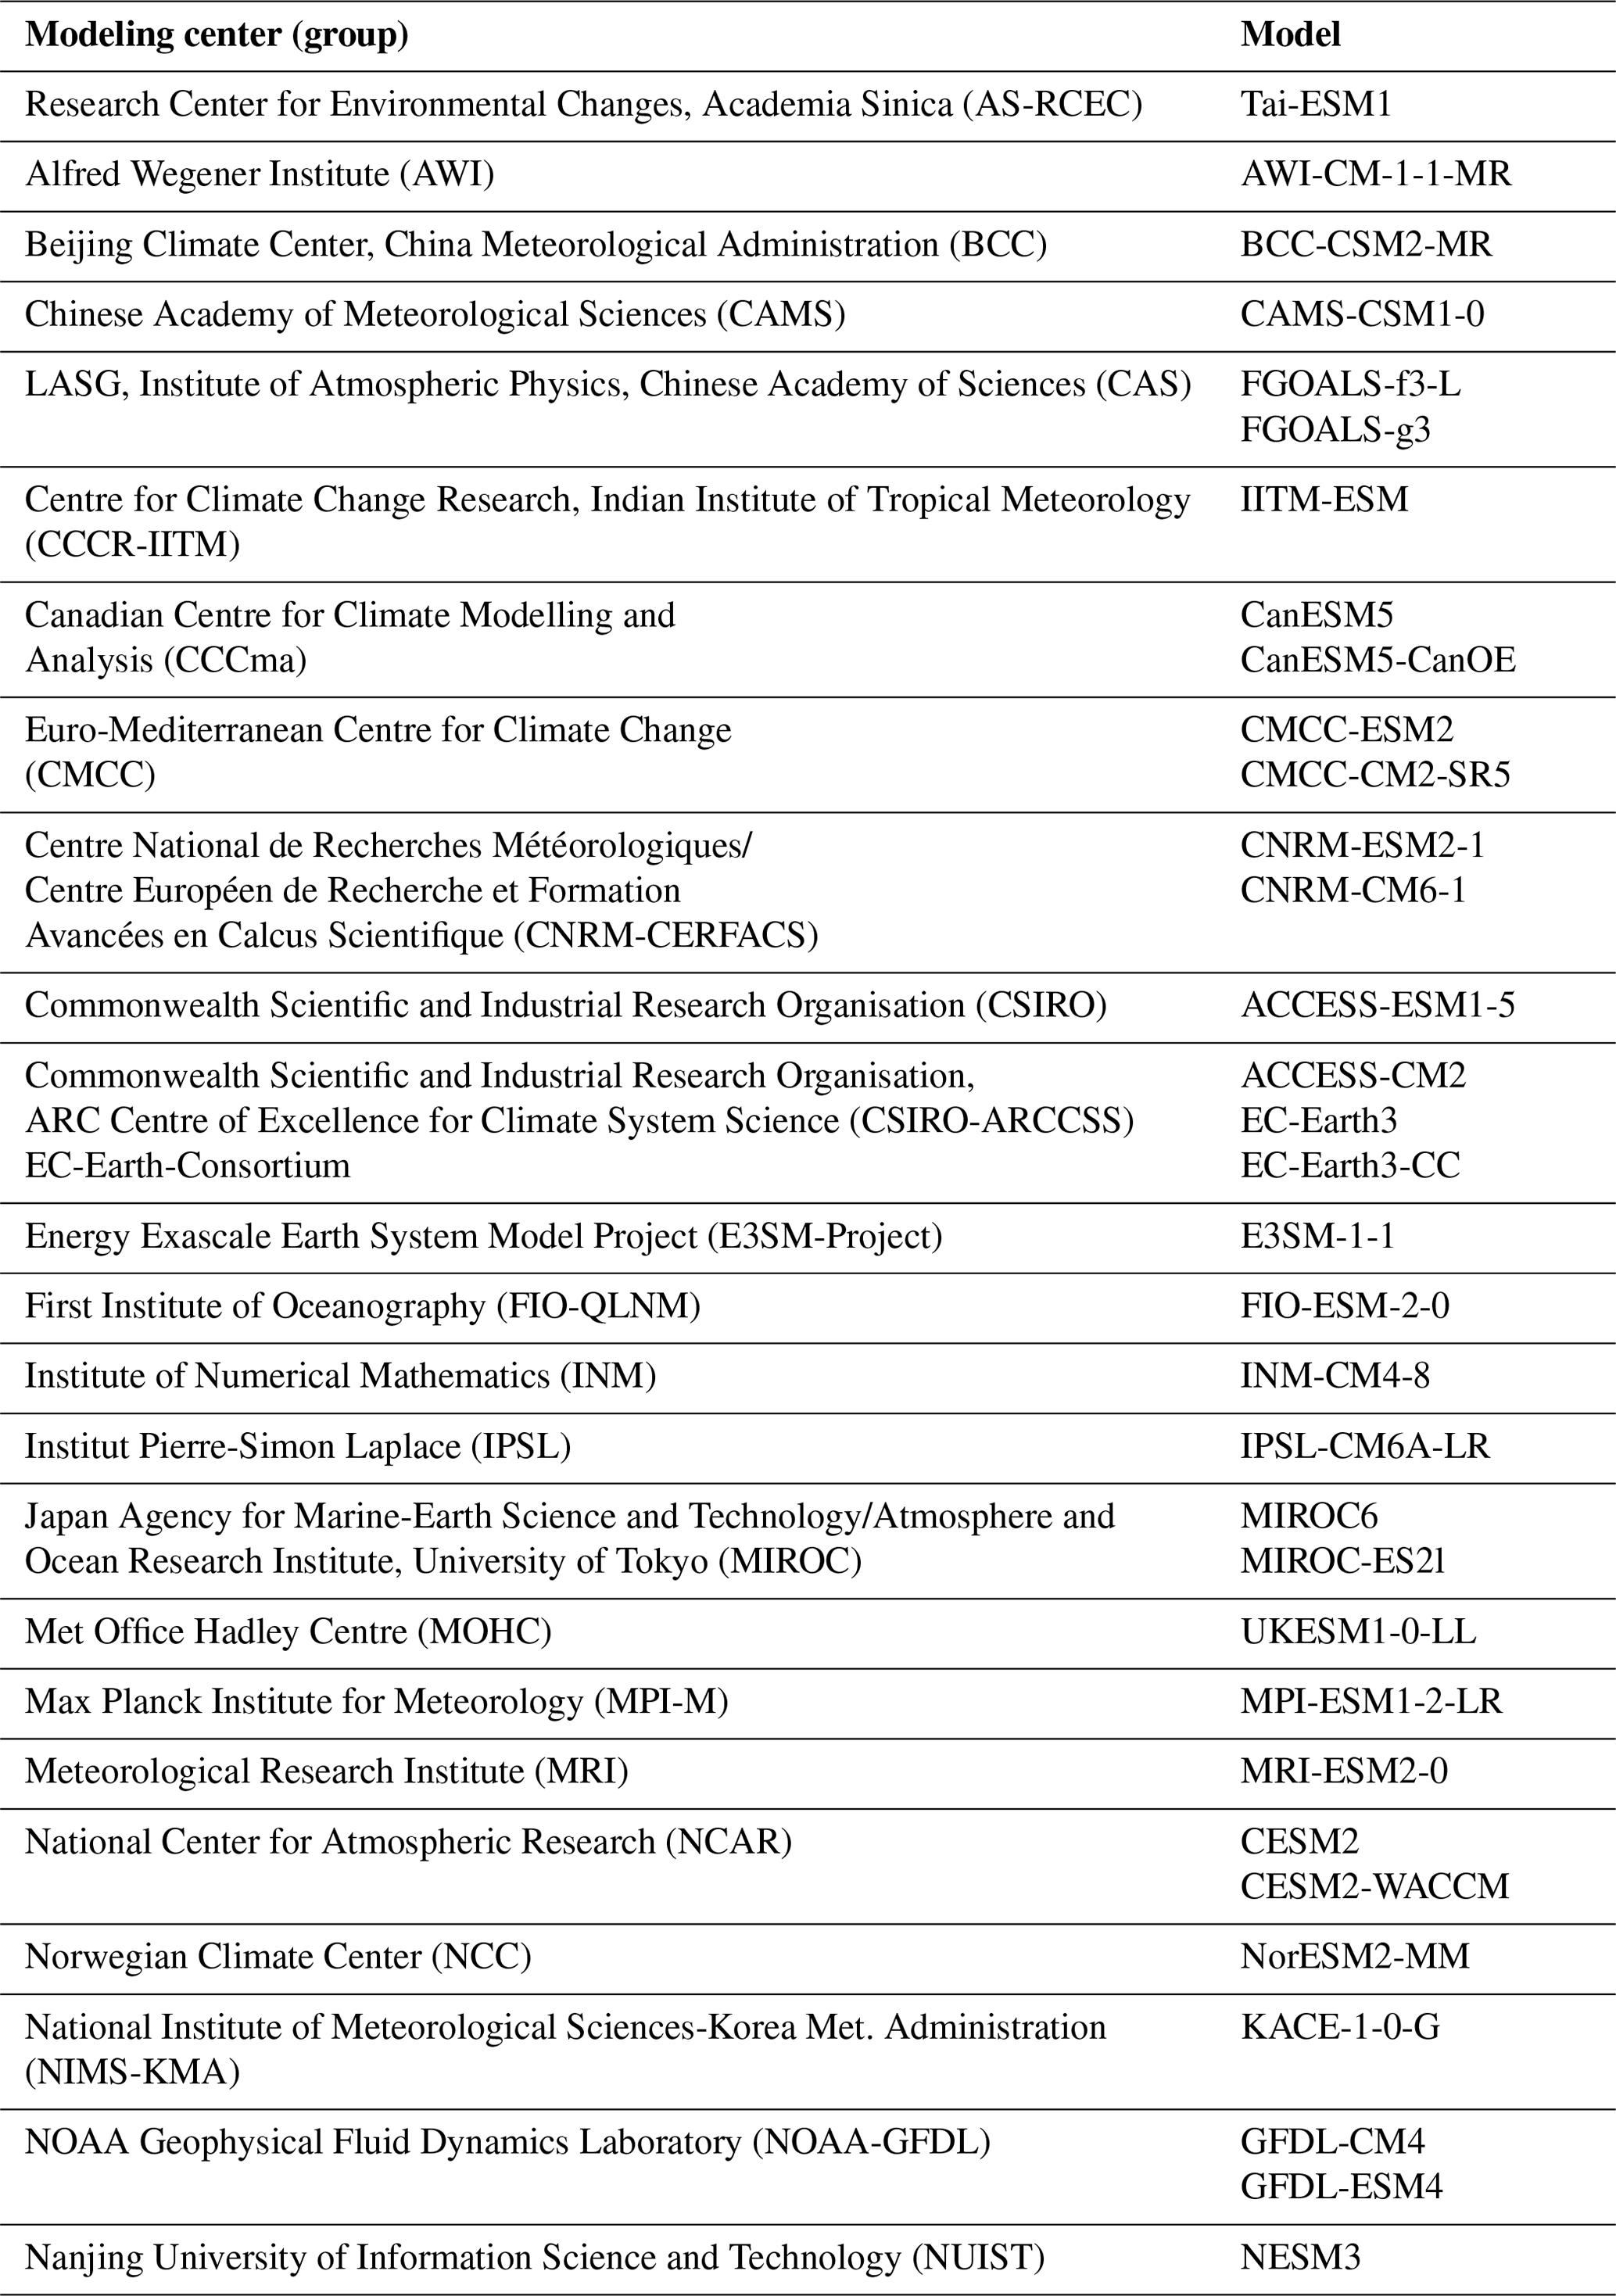
Table 1Overview of modeling centers (groups) and CMIP6 models. Only those models for which data for the historical period and the SSP5-8.5 scenario were available at the time of the study were selected.
During mid May, rainfall surges over the South China Sea, establishing a planetary-scale monsoon rainband extending from the South Asian marginal seas to subtropical western North Pacific. The monsoon then gradually progresses inland, resulting in the synchronized onset of the Indian monsoon season and the monsoon season in China and Japan in early June (Wang et al., 2002). During the summer months, low-level southerly winds transport moisture to East China, Korea and Japan, where it converges within the rain belt that is called the Meiyu in China, the Baiu in Japan and the Changma in Korea. The wind direction follows the pressure gradient resulting from a zonal land–sea thermal contrast varying throughout the course of a year (Ha et al., 2012; Wang et al., 2002). The rainfall reaches its maximum in late June over the Meiyu (Baiu) and in late July over northern China. Following this, the rainy season retreats progressively poleward in East Asia during July and August and southward in the Indian summer monsoon (Wang et al., 2002).
Since the East Asian Monsoon is located in the subtropics – unlike other monsoon systems – it is additionally influenced by midlatitude disturbances and convective activity (Ha et al., 2012). In addition, the East Asian Monsoon (EAM) interacts with various climatological patterns on various timescales, including the El Niño–Southern Oscillation (ENSO), the Arctic Oscillation (AO), the Indian summer monsoon, spring Eurasian snow cover and the thermal forcing of the Tibetan Plateau (Ha et al., 2012).
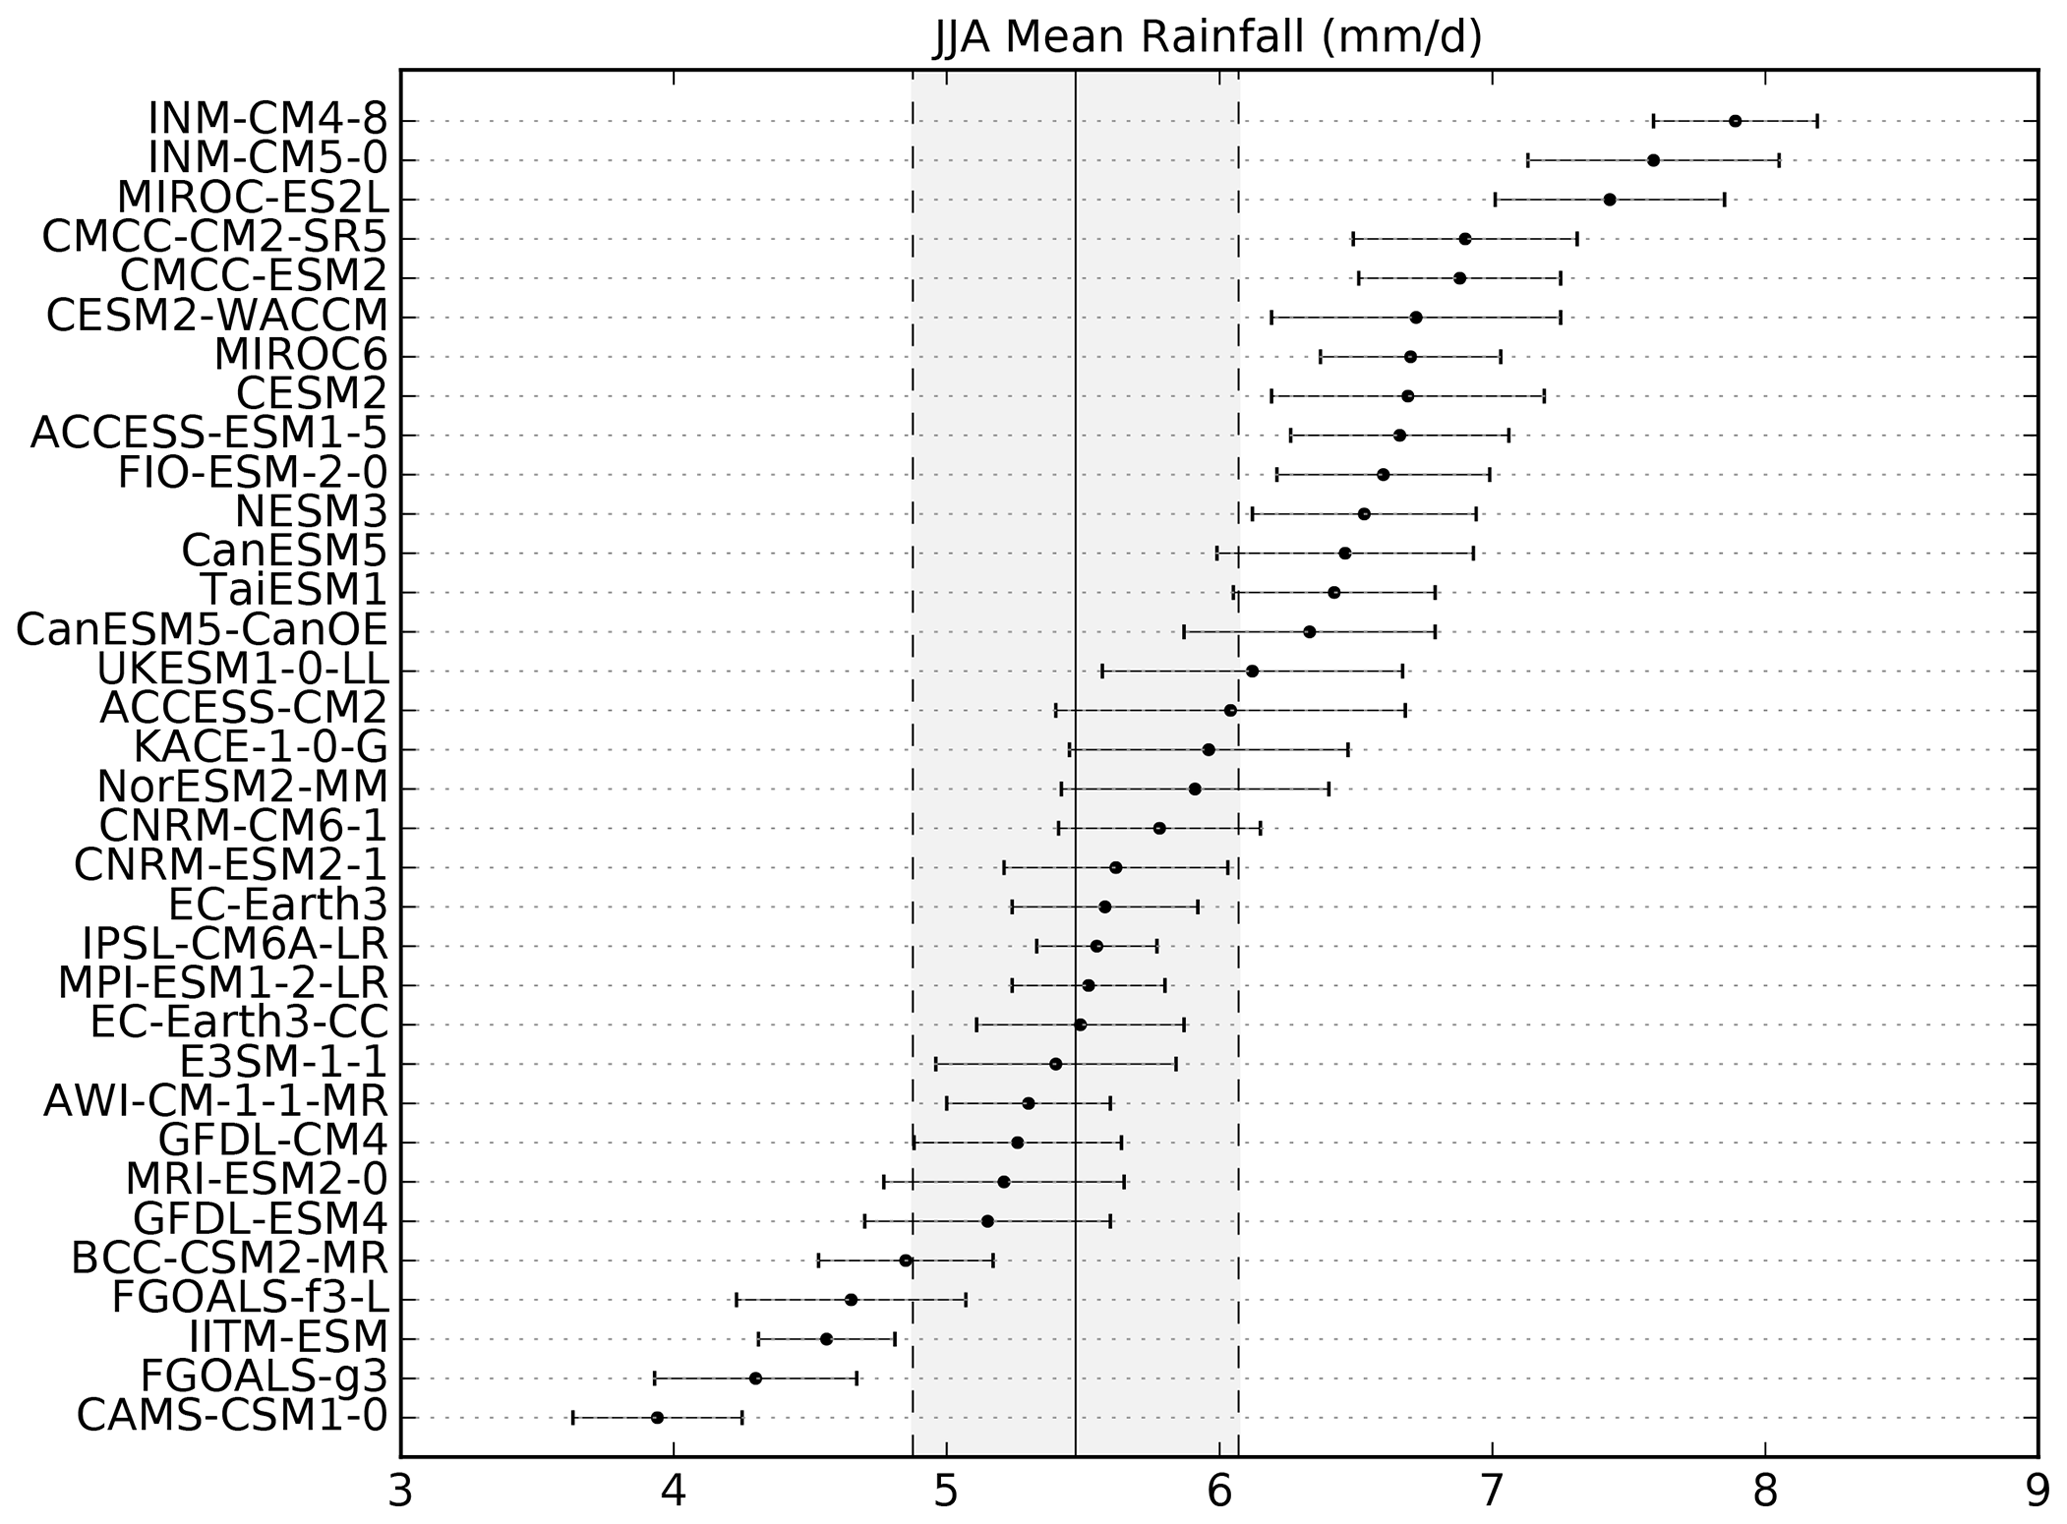
Figure 1Mean rainfall of the East Asian Summer Monsoon from June–September (mm d−1) over the region displayed in Fig. A1 from 34 CMIP6 models. The vertical lines mark the mean monsoon rainfall from GPCC data (continuous line) plus or minus 2 standard deviations (dashed line). Circles with error bars represent the mean plus or minus 1 standard deviation for each individual climate model during the same period.
The progression and retreat of the Meiyu belt is associated with a large variability in precipitation over East Asia and accompanied by floods and droughts with potentially devastating impacts on socioeconomic livelihood (Yihui et al., 2020). In June and July 2020 large parts of East Asia and South Asia were flooded as a result of excessive monsoon rainfall affecting approx. 35 million individuals (Volonté et al., 2021). Therefore, assessing the climate model projections of the East Asian summer monsoon under climate change is of critical importance for national and regional management strategies.
The central approach to assess changes in the East Asian monsoon throughout the 21st century is the use of global climate models. The general circulation models (GCMs) participating in the Coupled Model Intercomparison Project (CMIP) have provided some insight regarding future changes in the EAM. The models from the previous generation (CMIP5) project an increase in the East Asian Monsoon of 10 %–15 % throughout the 21st century under RCP6.0 that is most pronounced over the Baiu region and over the north and northeast of the Korean Peninsula (Seo et al., 2013). The strengthening of monsoon rainfall is attributed to an increase in evaporation and moist flux convergence induced by the (north)westward shift of the North Pacific subtropical high (Lee and Wang, 2014; Seo et al., 2013). In addition, the CO2-induced strengthening of the land–sea thermal contrast plays a central role in the Asian monsoon (Endo et al., 2018). Chen and Sun (2013) find that the frequency and intensity of intense precipitation events are also projected to significantly increase over East Asia under RCP4.5.
The continuous development of the GCMs in CMIP has also led to the improvement of the models' performance regarding the East Asian Monsoon. While most CMIP3 models show a limited capacity in simulating the precipitation over East Asian monsoon areas (Kai et al., 2009; Chen and Sun, 2013), the previous-generation models of CMIP5 provided improvements regarding observed spatial and temporal precipitation patterns (Seo et al., 2013). Nevertheless, CMIP5 models struggle to reproduce rainfall bands around 30° N and the northward shift in the western North Pacific subtropical high (Huang et al., 2013).
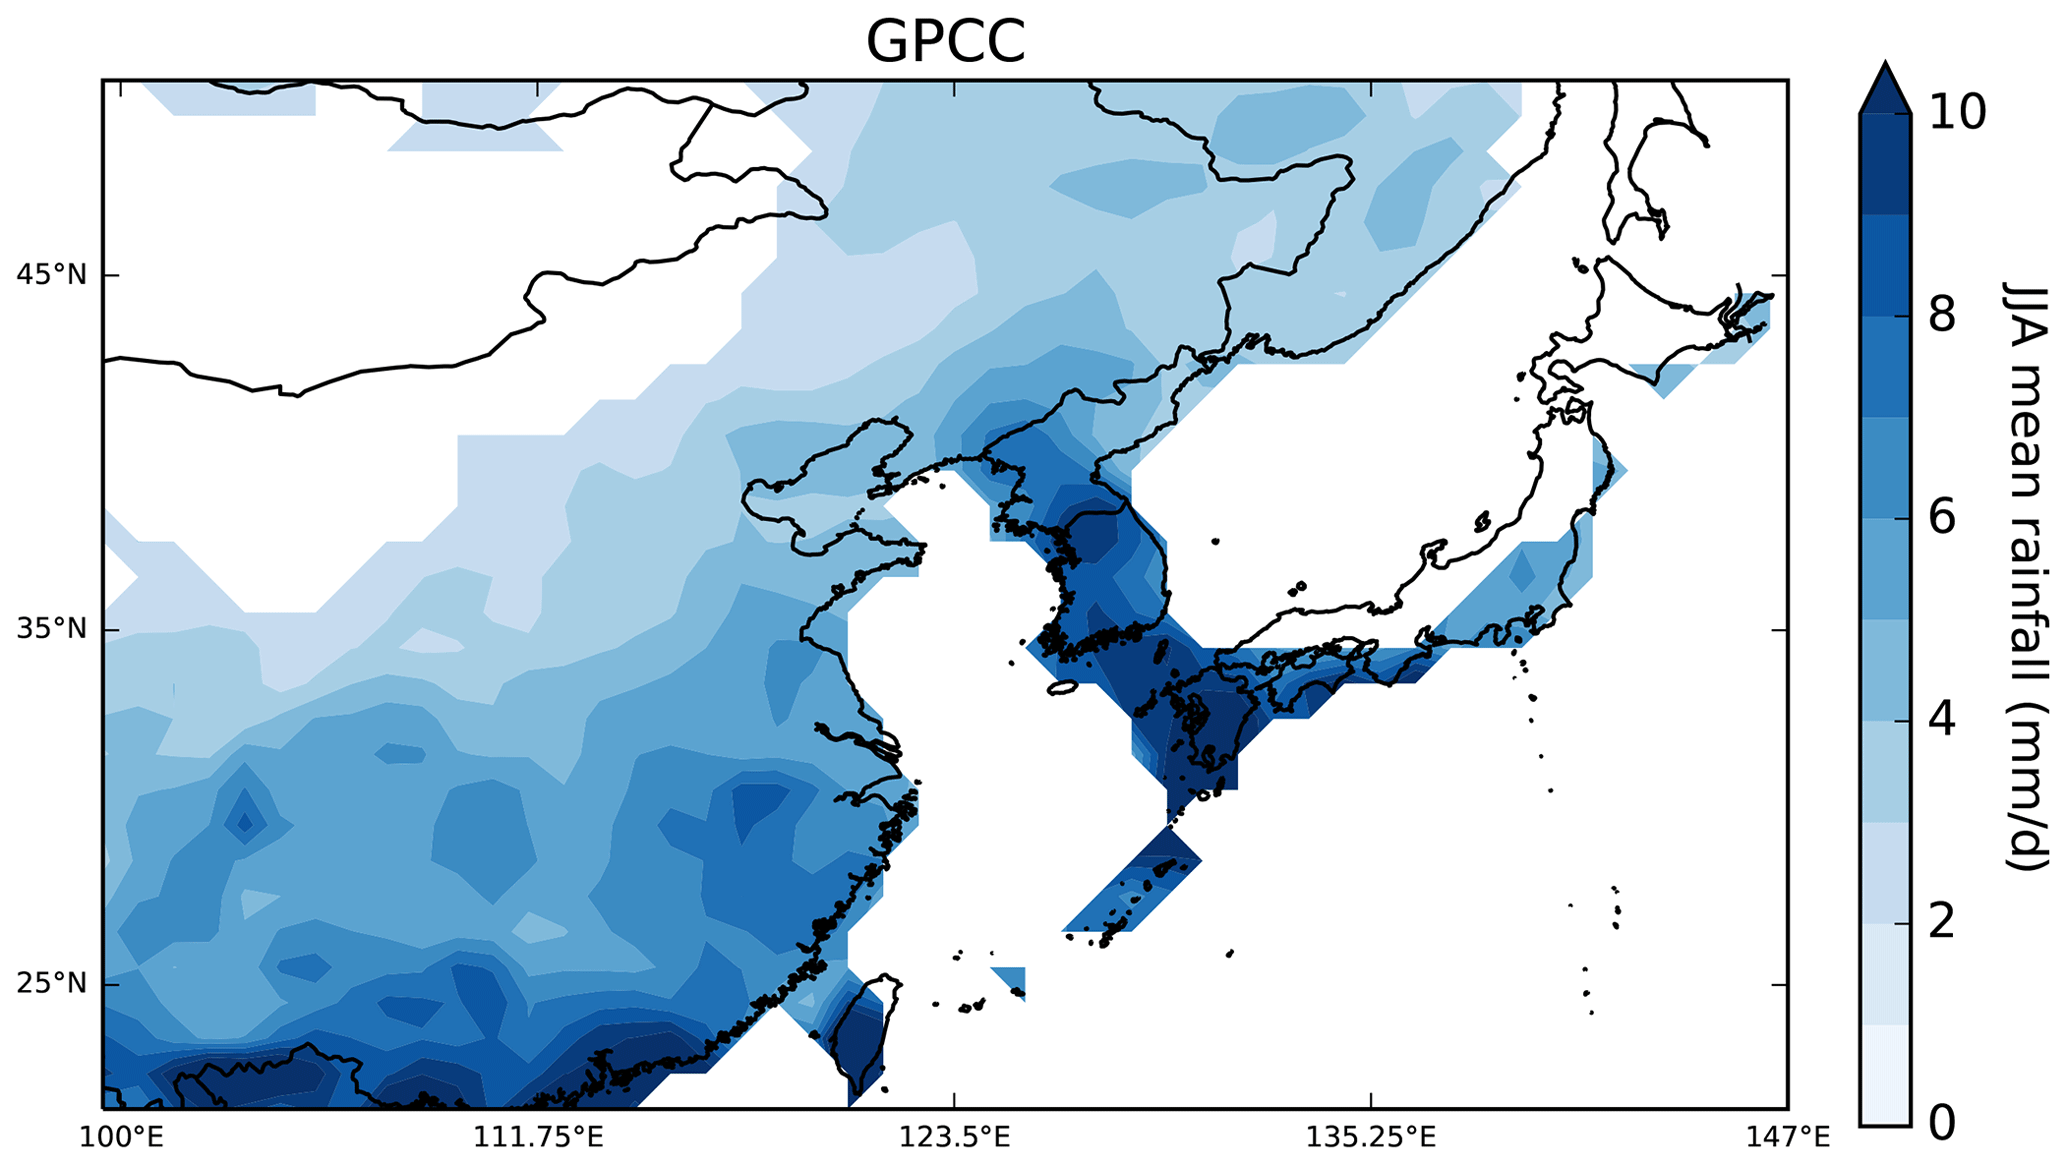
Figure 2Spatial distribution of EASM averaged over the period 1995–2014 (GPCC data).
Further progress has been made by CMIP6 models that outperform their predecessors regarding the EAM in past periods (Jiang et al., 2020; Xin et al., 2020; Yu et al., 2023). These improvements are related to the reduced biases in the sea surface temperature (SST) over the northwestern Pacific Ocean and better spatial resolution (Xin et al., 2020). In general, the CMIP6 models are reliable when capturing the main characteristics of the East Asian monsoon, including the spatial distribution of temperature and precipitation over China and the interannual variation (Xin et al., 2020; Masson-Delmotte et al., 2021). However, GCMs simulate 16 %–80 % more national rainfall compared to observations during 1979–2005 (Jiang et al., 2020).
Previous studies have compared CMIP5 and CMIP6 models for past periods (Jiang et al., 2020; Xin et al., 2020; Yu et al., 2023), evaluated the changes in EASM in observations and CMIP6 models for 1979–2010 (Park et al., 2020), or analyzed the inter-model spread for 1979–2014 (Huang et al., 2022). Other studies have analyzed the CMIP6 projections for the EAM but only in the context of the global monsoon (Moon and Ha, 2020; Chen et al., 2020; Wang et al., 2020) and Asian monsoon (Ha et al., 2020), neglecting, for example, regional model performance. To the best of the authors' knowledge, no study has put the focus on the EAM, providing detailed insight into projections for the EASM seasonal mean, its interannual variability and the occurrence of extremely wet seasons for different time periods in the future under different emission scenarios. In addition, expected changes in wind patterns due to global warming are poorly investigated in this region (Bayhaqi et al., 2024). We also provide the central projections for China specifically, as it is highly relevant to policy makers. Here, we use the latest generation of climate models in order to update the projected changes in the EAM rainfall under different socioeconomic scenarios throughout the 21st century. For this purpose, we compare the available models and choose the ones with the best performance for further analysis. Section 2 provides a brief overview of the underlying climate model data and the methods. In Sect. 3.1, we identify the best performing models regarding the EASM among the available models. Section 3.2 presents the results of the mean summer monsoon precipitation, Sect. 3.3 focuses on the long-term trend of interannual variability and Sect. 3.4 provides further insights regarding the frequency of extremely wet seasons. The results are discussed and concluded in Sect. 4.
Table 2Overview of model evaluation results: JJA mean (mean), standard deviation (SD) and centered root-mean-square error (CRMSE). TOP6 models are marked in bold. GPCC data are given as a reference.
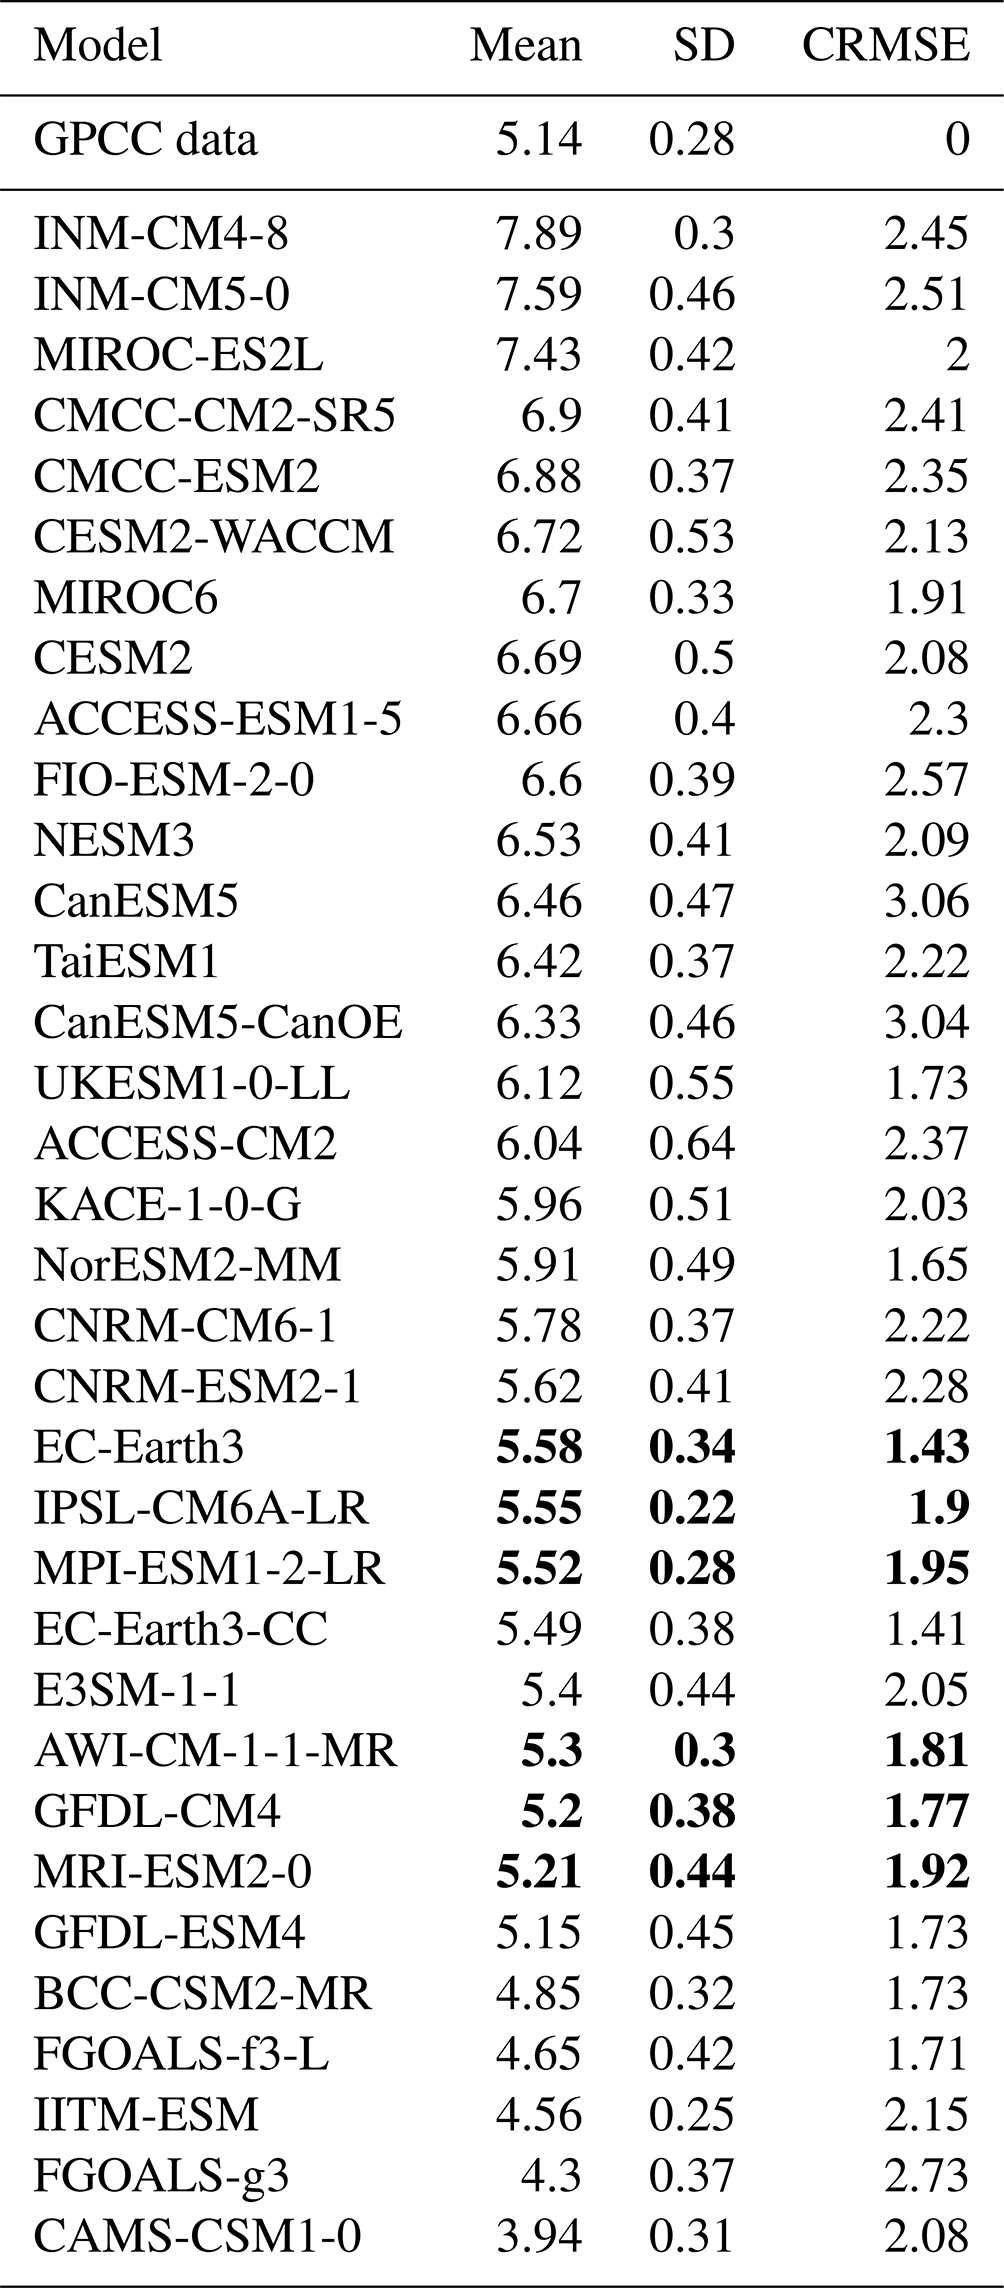
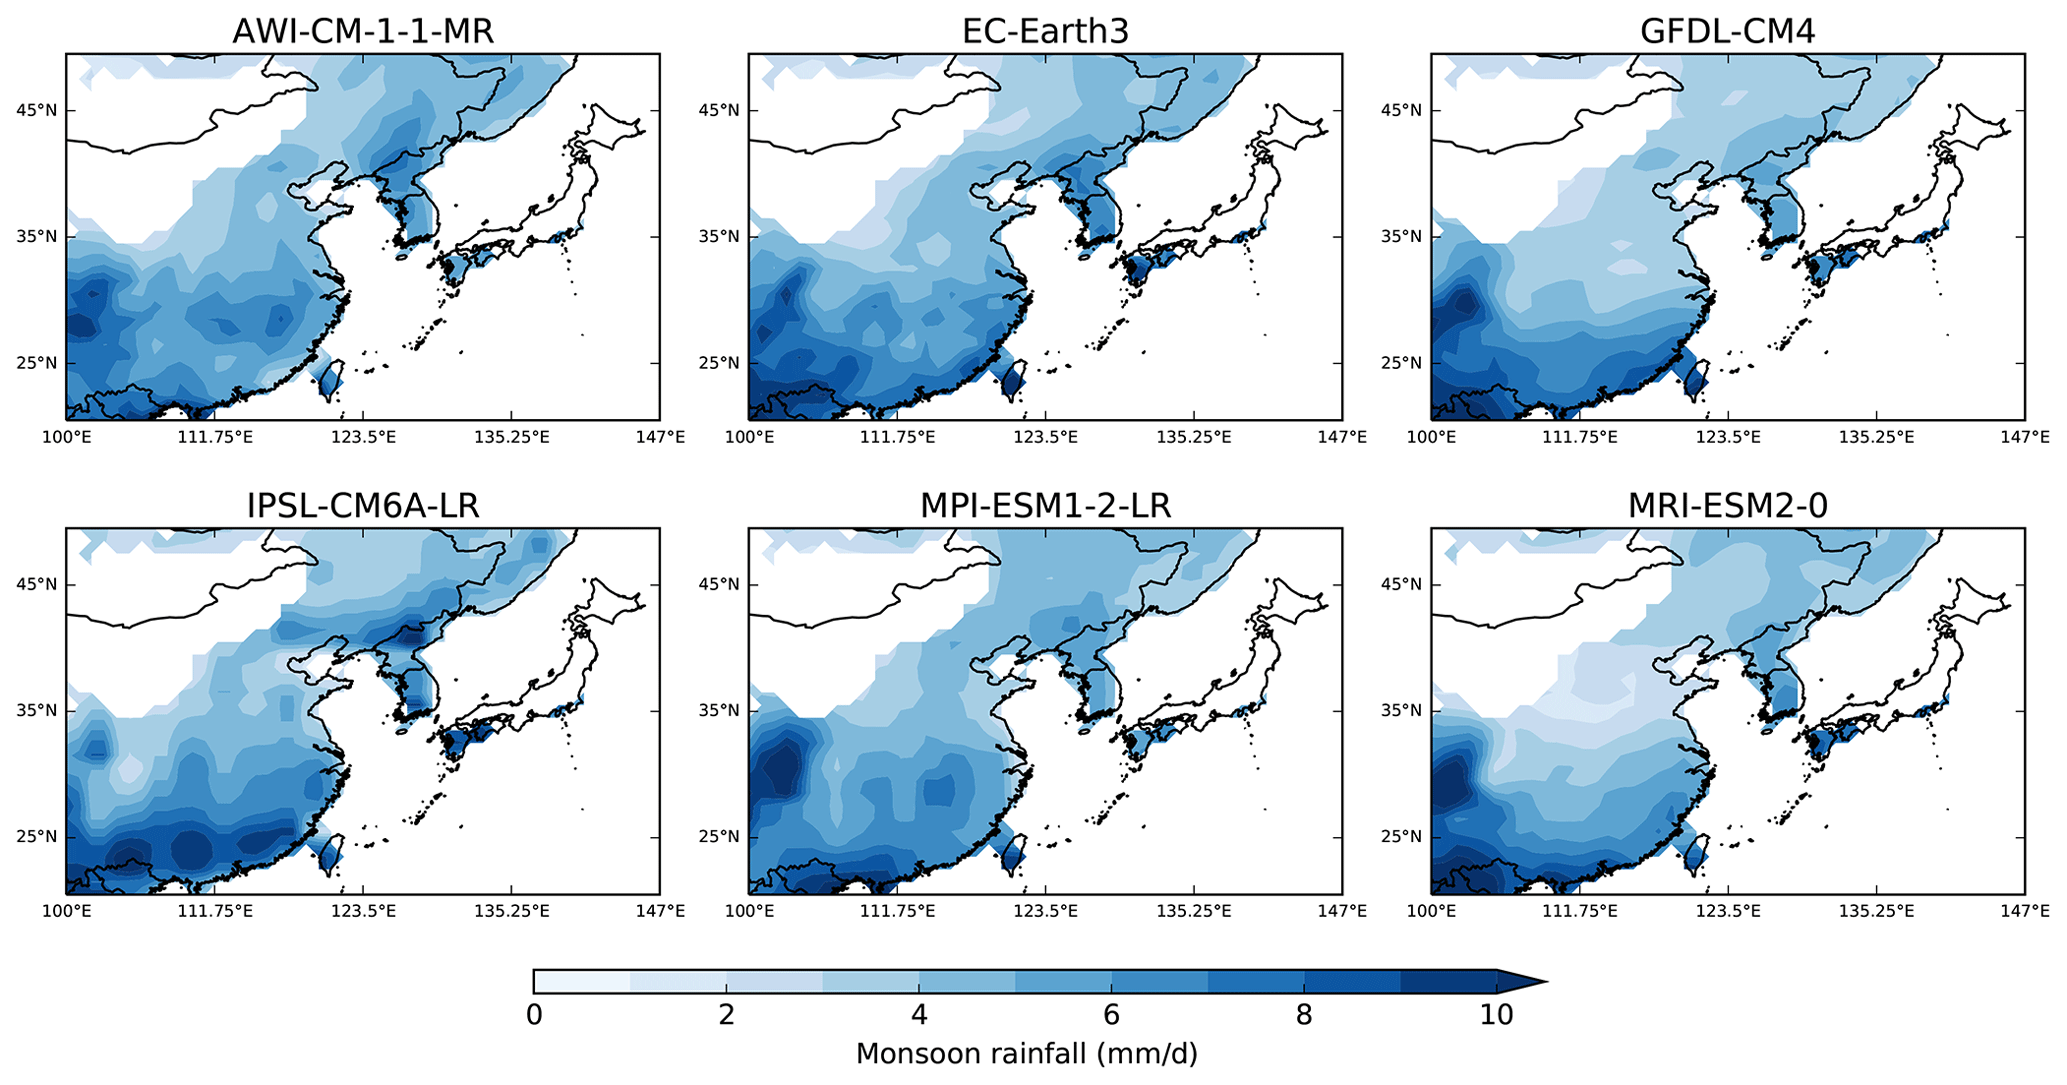
Figure 3Spatial distribution of EASM averaged over the period 1995–2014 from the TOP6 CMIP6 models.
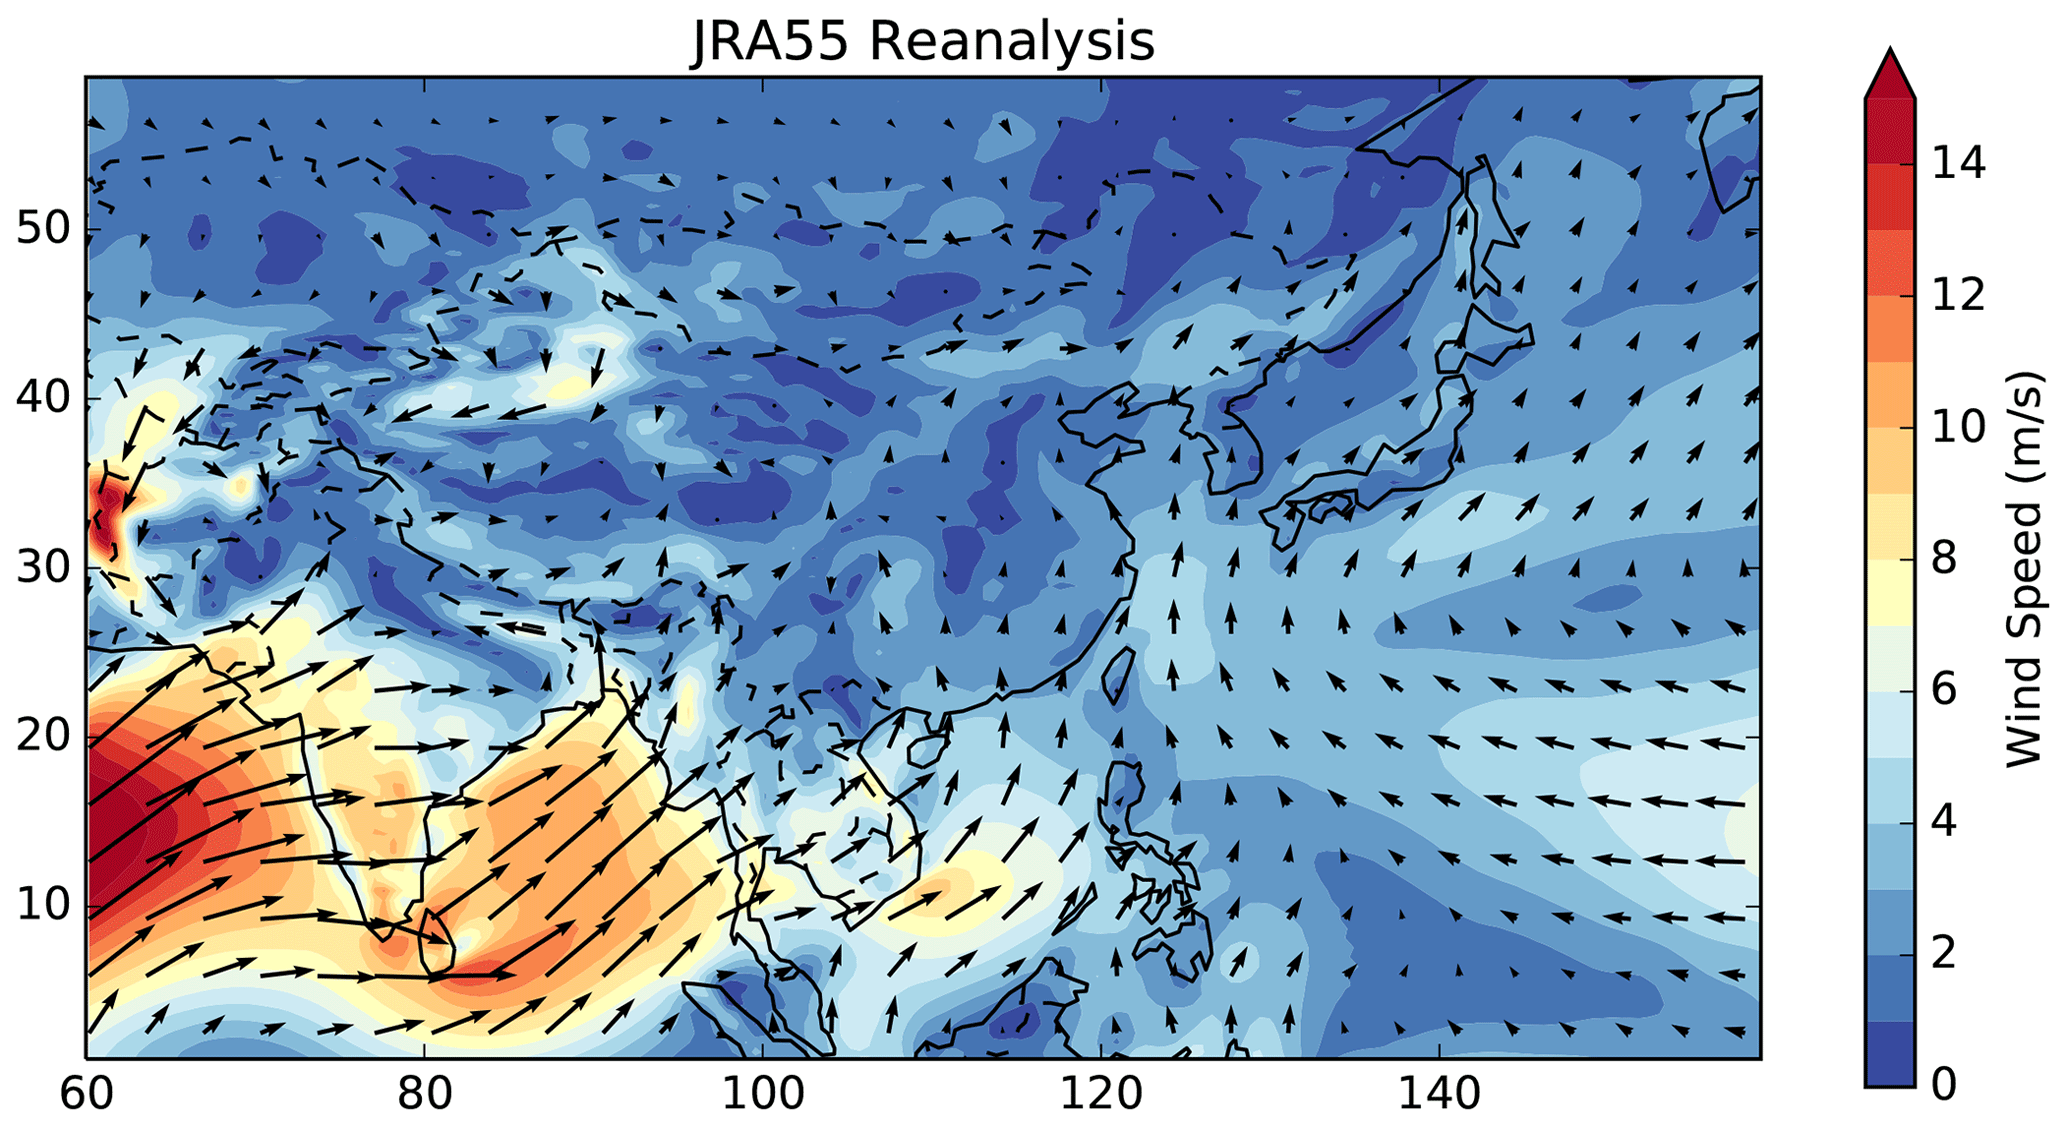
Figure 4Wind vectors at 850 hPa and wind speed (m s−1) for 1995–2014 (JRA-55).
In this study, we use 34 CMIP6 models that were available for the historic period (1850–2014) and for the future period (2015–2100) under SSP5-8.5 in ScenarioMIP (O'Neill et al., 2016; Tebaldi et al., 2020). Table 1 provides an overview of the models and their modeling centers. We use four scenarios (SSP1-2.6, SSP2-4.5, SSP3-7.0, SSP5-8.5) that are based on different socioeconomic pathways with their associated greenhouse gas emissions and aerosol pollution levels. These pathways are then translated into the resulting forcing levels (Van Vuuren et al., 2014; O'Neill et al., 2017). The resolution of the native grids in which the simulations were run are presented in Table A1, ranging from 2.5 to 500 km. For the analysis, we regrid the model grids to uniform 1° longitude ×1° latitude grids using first-order conservative remapping. We use one ensemble member per model (r1i1p1f1 if it is available). In addition, we focus on the monsoon area over land from 20–50° N and 100–150° E. Monsoon area is defined as grid cells with summer (June–August) and winter (December–February) rainfall differing by a specific threshold, e.g., as applied in the IPCC AR6 (Masson-Delmotte et al., 2021). We use 2 mm d−1 as a threshold to obtain a continuous area (See Fig. A1). For the analysis, we average the monthly rainfall data during the summer monsoon season from June to August.
For the model evaluation, we use monthly precipitation data from the Global Precipitation Climatology Centre (GPCC) with a native grid of 1° longitude ×1° latitude grid for 1995–2014 as reference (Ziese et al., 2020). This dataset is based on approx. 85 0000 stations worldwide. For evaluating the model performance regarding the monsoon circulation, we use 850 hPa wind data from the Japanese 55-year Reanalysis project (JRA-55) (Japan Meteorological Agency, 2013). In order to classify CMIP6 models with better performance regarding the EASM, we apply the following selection criteria.
-
The mean JJA rainfall is within 2 standard deviations of the observed mean in the GPCC dataset (1995–2014).
-
The model's standard deviation is within plus or minus 50 % of the observed GPCC standard deviation (1965–2014).
-
The centered root-mean-square error (CRMSE) is smaller than 2 mm d−1 (1995–2014).
-
The main features of the EASM circulation (southwesterly winds originating from the Bay of Bengal and the western flank of the tropical western Pacific high) are captured according to the JRA-55 dynamics (1995–2014).
For the analysis of the projection, we use the future period from 2081–2100 and compare it to the reference period 1995–2014 in accordance with the IPCC guidelines (Masson-Delmotte et al., 2021). For the analysis of the interannual variability and the occurrence of extremely wet seasons, we compare 2051–2100 to 1965–2014 in order to have longer time periods and more robust results.
3.1 Model evaluation
To evaluate the models' capacity for capturing the seasonal rainfall of the EASM in the past, we compare the mean seasonal rainfall to GPCC data in the period 1995–2014. The historical rainfall in the GPCC data is 5.38±0.30 mm d−1. Only 14 out of 34 models are able to capture the historical mean within plus or minus 2 standard deviations, while a majority of models have a tendency to overestimate the mean (Fig. 1). The mean of the models ranges from 3.94 mm d−1 (CAMS-CSM1-0) to 7.89 mm d−1 (INM-CM4-8). The model EC-Earth3-CC captures the mean rainfall best. In addition, the CMIP6 models have a tendency to overestimate the interannual variability. The standard deviations of the model range from 0.22 mm d−1 (IPSL-CM6A-LR) to 0.64 mm d−1 (ACCESS-CM2). The results for all models are given in Table 2.
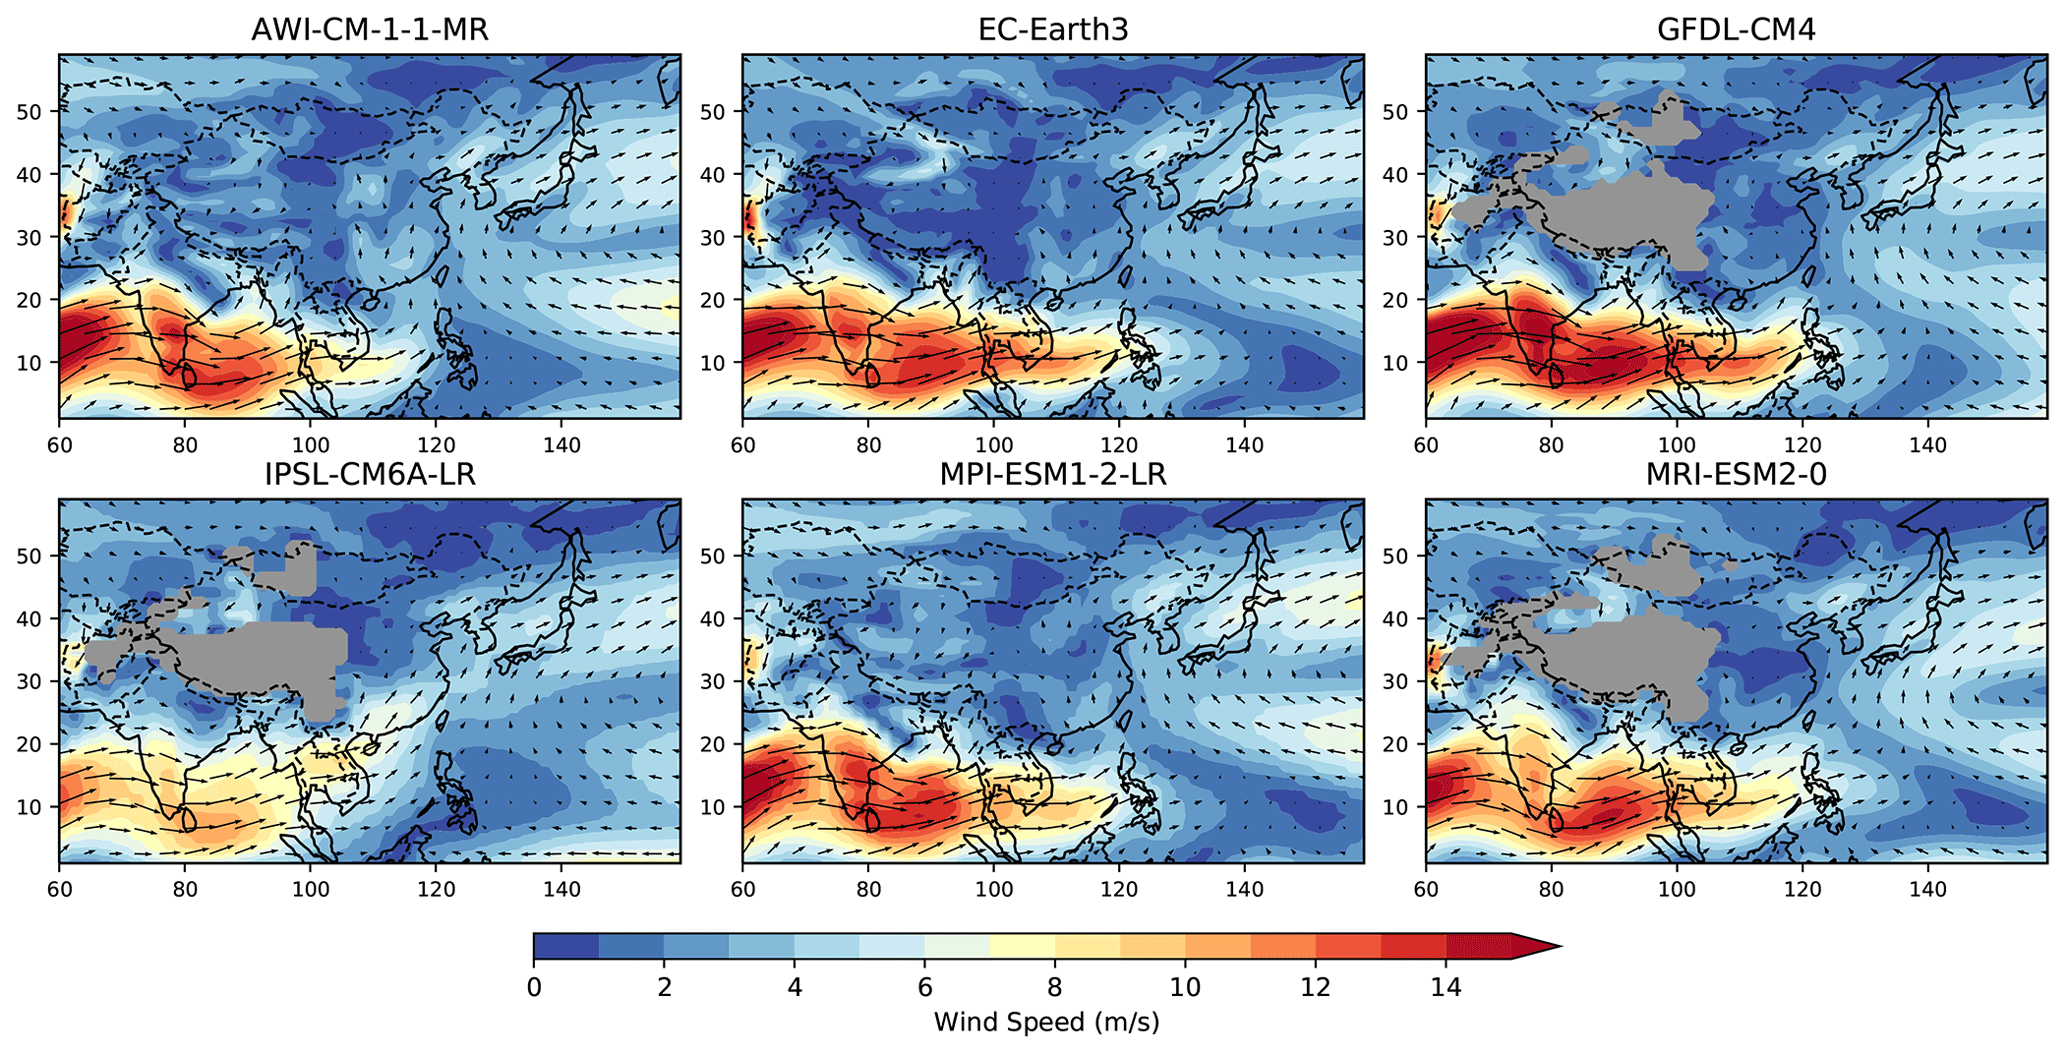
Figure 5Wind vectors at 850 hPa and wind speed (m s−1) for 1995–2014 for the CMIP6 models with the best performance regarding EASM (TOP6).
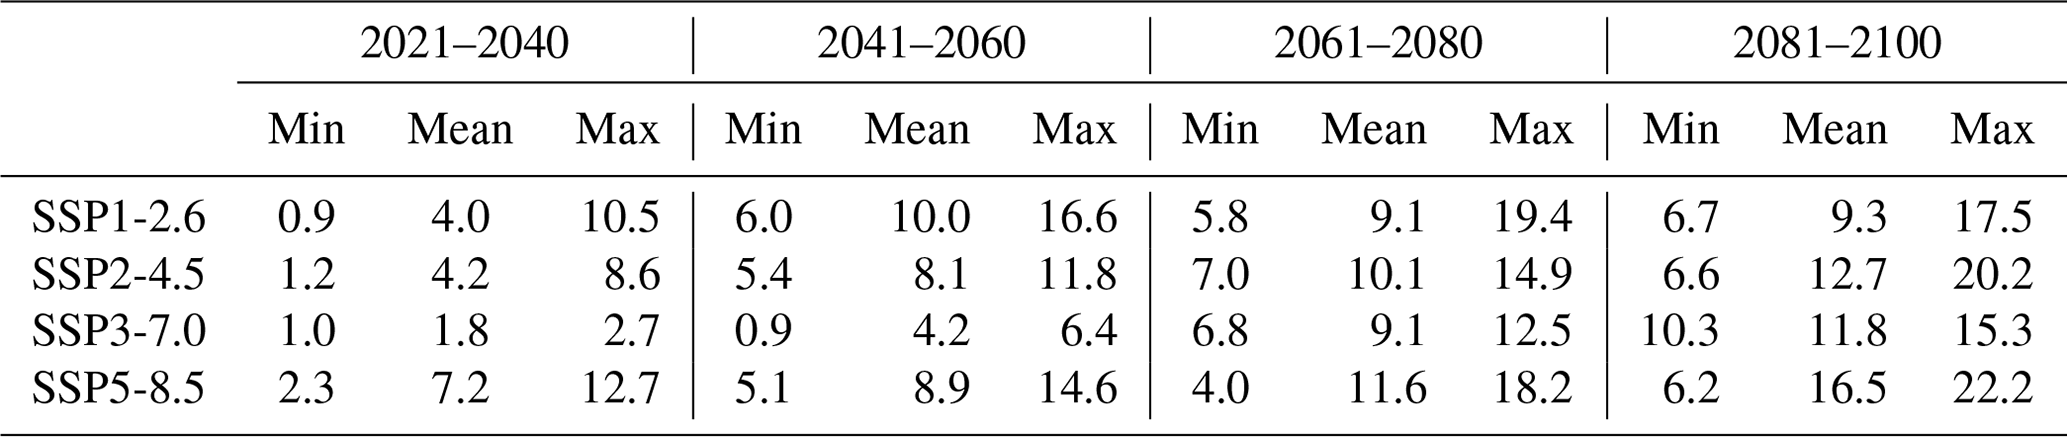
Table 3Projected changes (%) for JJA mean rainfall of TOP6 models under four emission scenarios for 2021–2040, 2041–2060, 2061–2080 and 2081–2100 compared to 1995–2014 (GPCC data).
The rainfall during the EASM is strongest along coastal regions, particularly in South and East China, the Korean Peninsula, and Japan and Taiwan (see Fig. 2). The multi-model average of CRMSE is 1.97 mm d−1, with individual model results ranging from 1.24 (AWI-CM-1-1-MR) mm d−1 to 2.93 mm d−1 (TaiESM1). The results of the individual models are shown in Table 2. Seven models fulfill the MEAN, SD and CRMSE selection criteria, including two models of the EC-Earth Consortium. In order to avoid bias towards this model's center configuration, we only use EC-Earth3. For the remaining six models, the spatial rainfall distribution for 1995–2014 is given in Fig. 3. These models reproduce major spatial rainfall patterns, including the rainfall in South China. Regarding the Korean Peninsula, Taiwan and Japan, the models have a tendency to underestimate the local rainfall.
Figure 4 shows the circulation during the EASM at 850 hPa with strong southwesterly winds originating from the Bay of Bengal and the western flank of the tropical western Pacific high. These main features are reproduced well from the models that fulfill the MEAN, SD and CRMSE criteria (Fig. 5). Therefore, we choose these six models as the CMIP6 models for the further analysis and refer to them as TOP6 models.
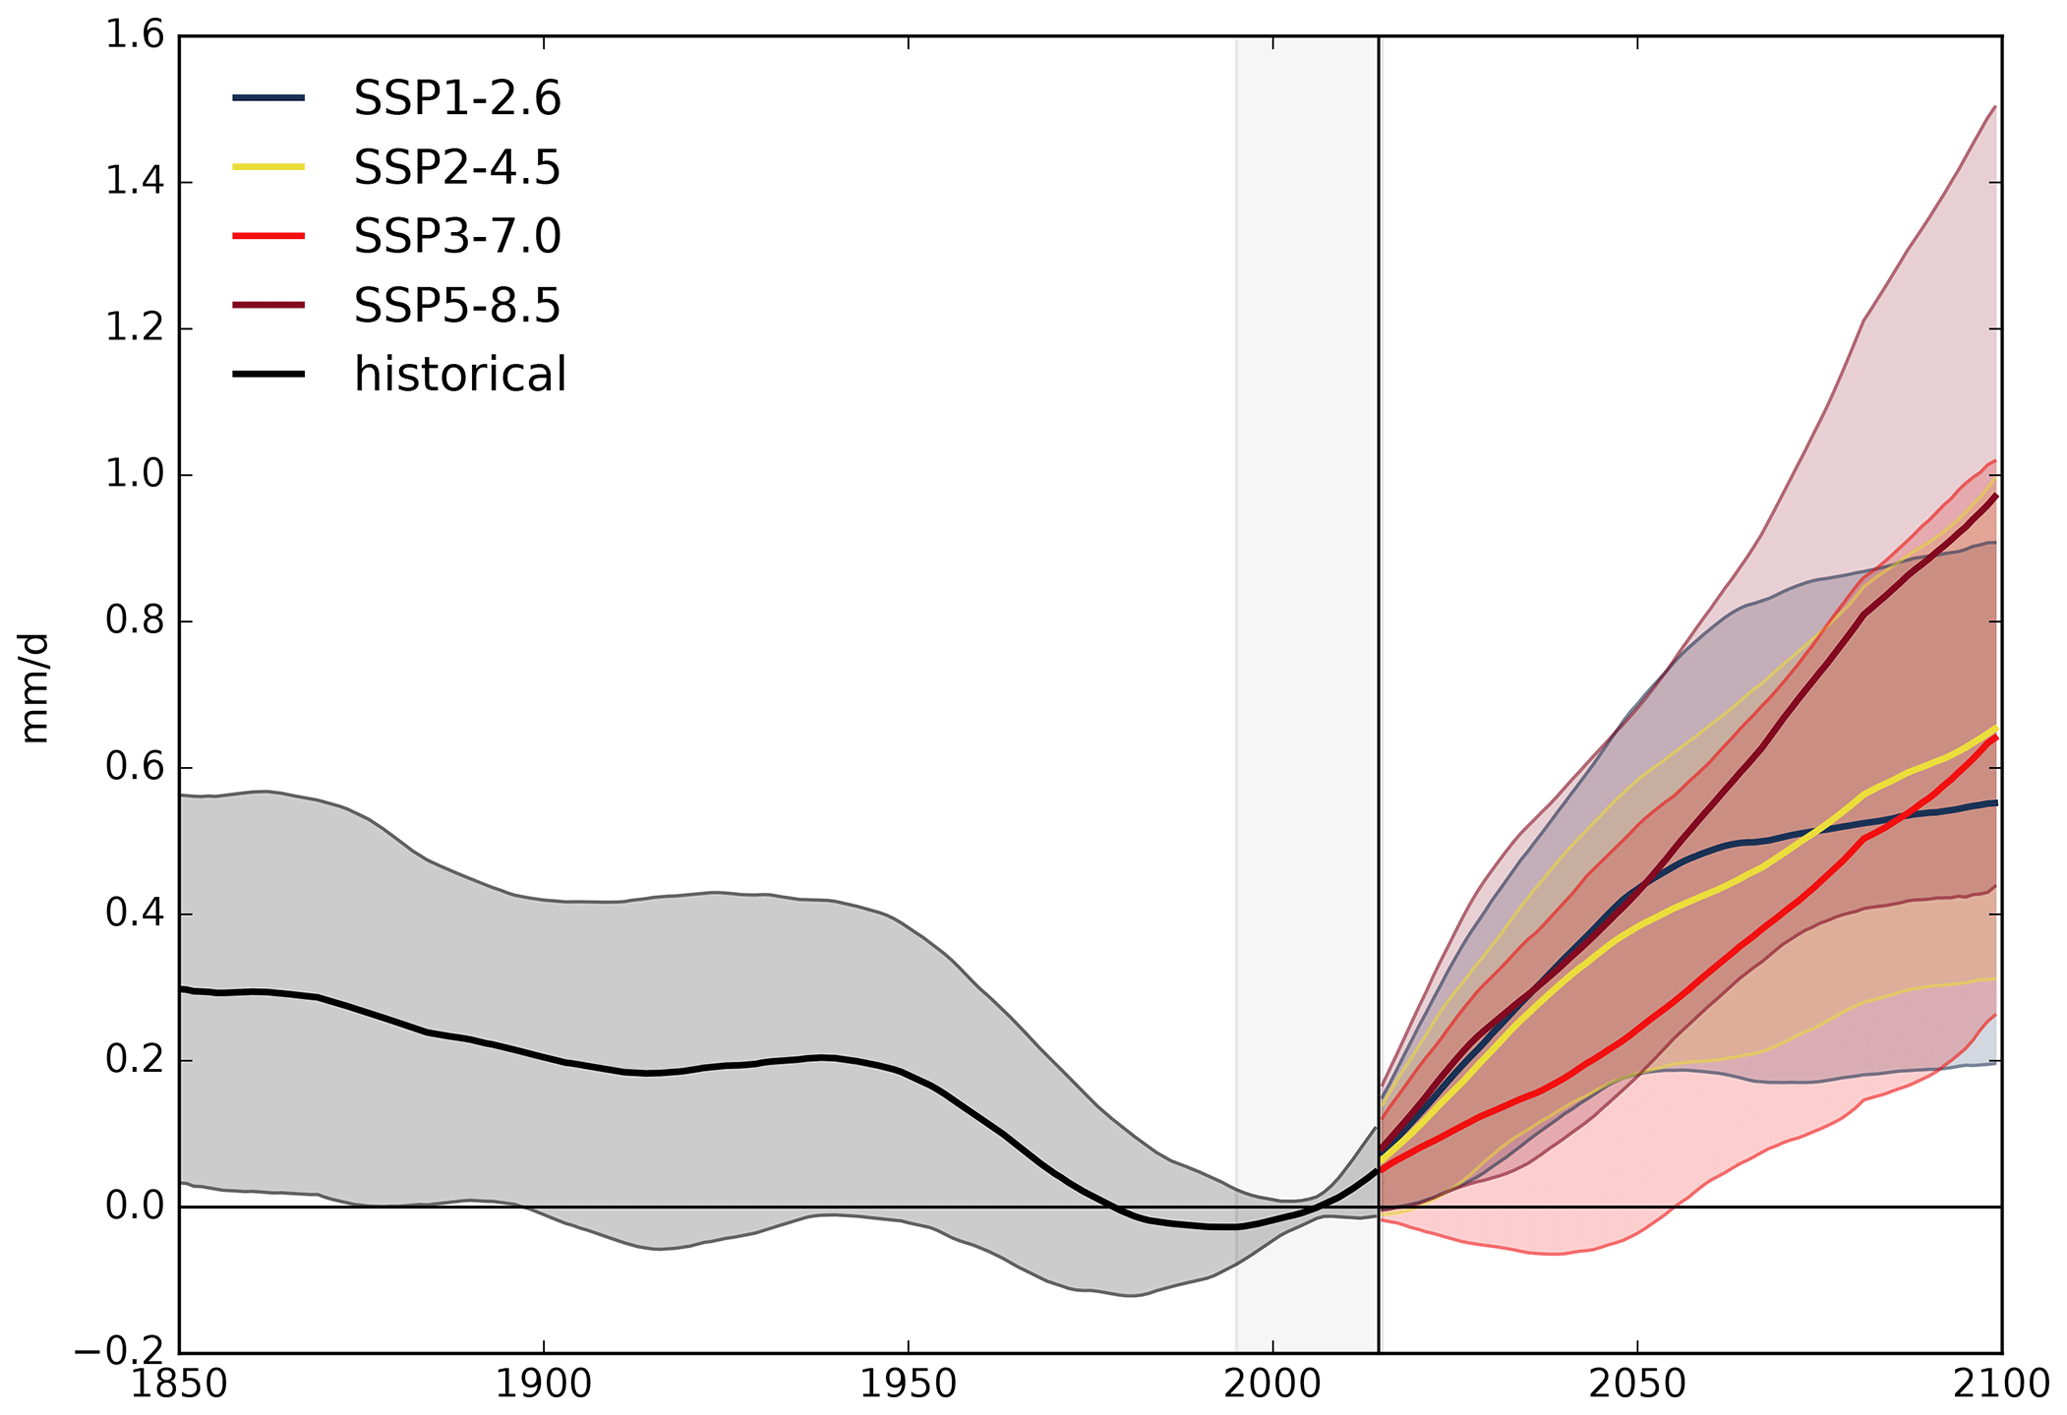
Figure 6Time series of EASM (mm d−1) for the period 1850–2100 based on the multi-model mean of all 34 CMIP6 models relative to the period 1995–2014. The time series for individual models is smoothed using a singular spectrum analysis with a window size of 20 years before calculating the multi-model mean. For the method, see Golyandina and Zhigljavsky (2013). The shading marks the range of plus or minus 1 standard deviation.
3.2 Seasonal mean rainfall
In order to analyze the long-term trend of the EASM under climate change, we provide the time series between 1850–2100 for all models under four emission scenarios for all models (Fig. 6) and TOP6 models only (Fig. A2). The multi-model mean time series captures the decrease in rainfall in the second half of the 20th century resulting from increasing aerosol pollution. This is followed by an increasing rainfall trend in the 21st century in all scenarios. The positive slopes in the scenarios vary, potentially depending on the forcings resulting from the underlying socioeconomic pathway, particularly aerosols (reducing effect on monsoon rainfall) and greenhouse gas emissions (enhancing effect on monsoon rainfall). High levels of development and the focus on health and environmental concerns in SSP1, SSP2 and SSP5 result in reduced air pollution emissions in the medium and long term, whereas SSP3 is characterized by weak aerosol control and slow development of air pollution policies. This could explain why rainfall increases more slowly in SSP3 in the first half of the 21st century compared to other emission scenarios.
The time series for individual TOP6 models under SSP1-2.6 and SSP5-8.5 are shown in Fig. 7. All TOP6 models reproduce the reducing effect of the EASM monsoon rainfall in the 20th century. However, in EC-Earth3 it is projected to occur in the first half of the second century, while the other models capture the decline after the 1950s. All models projected an increase in monsoon rainfall throughout the 21st century.
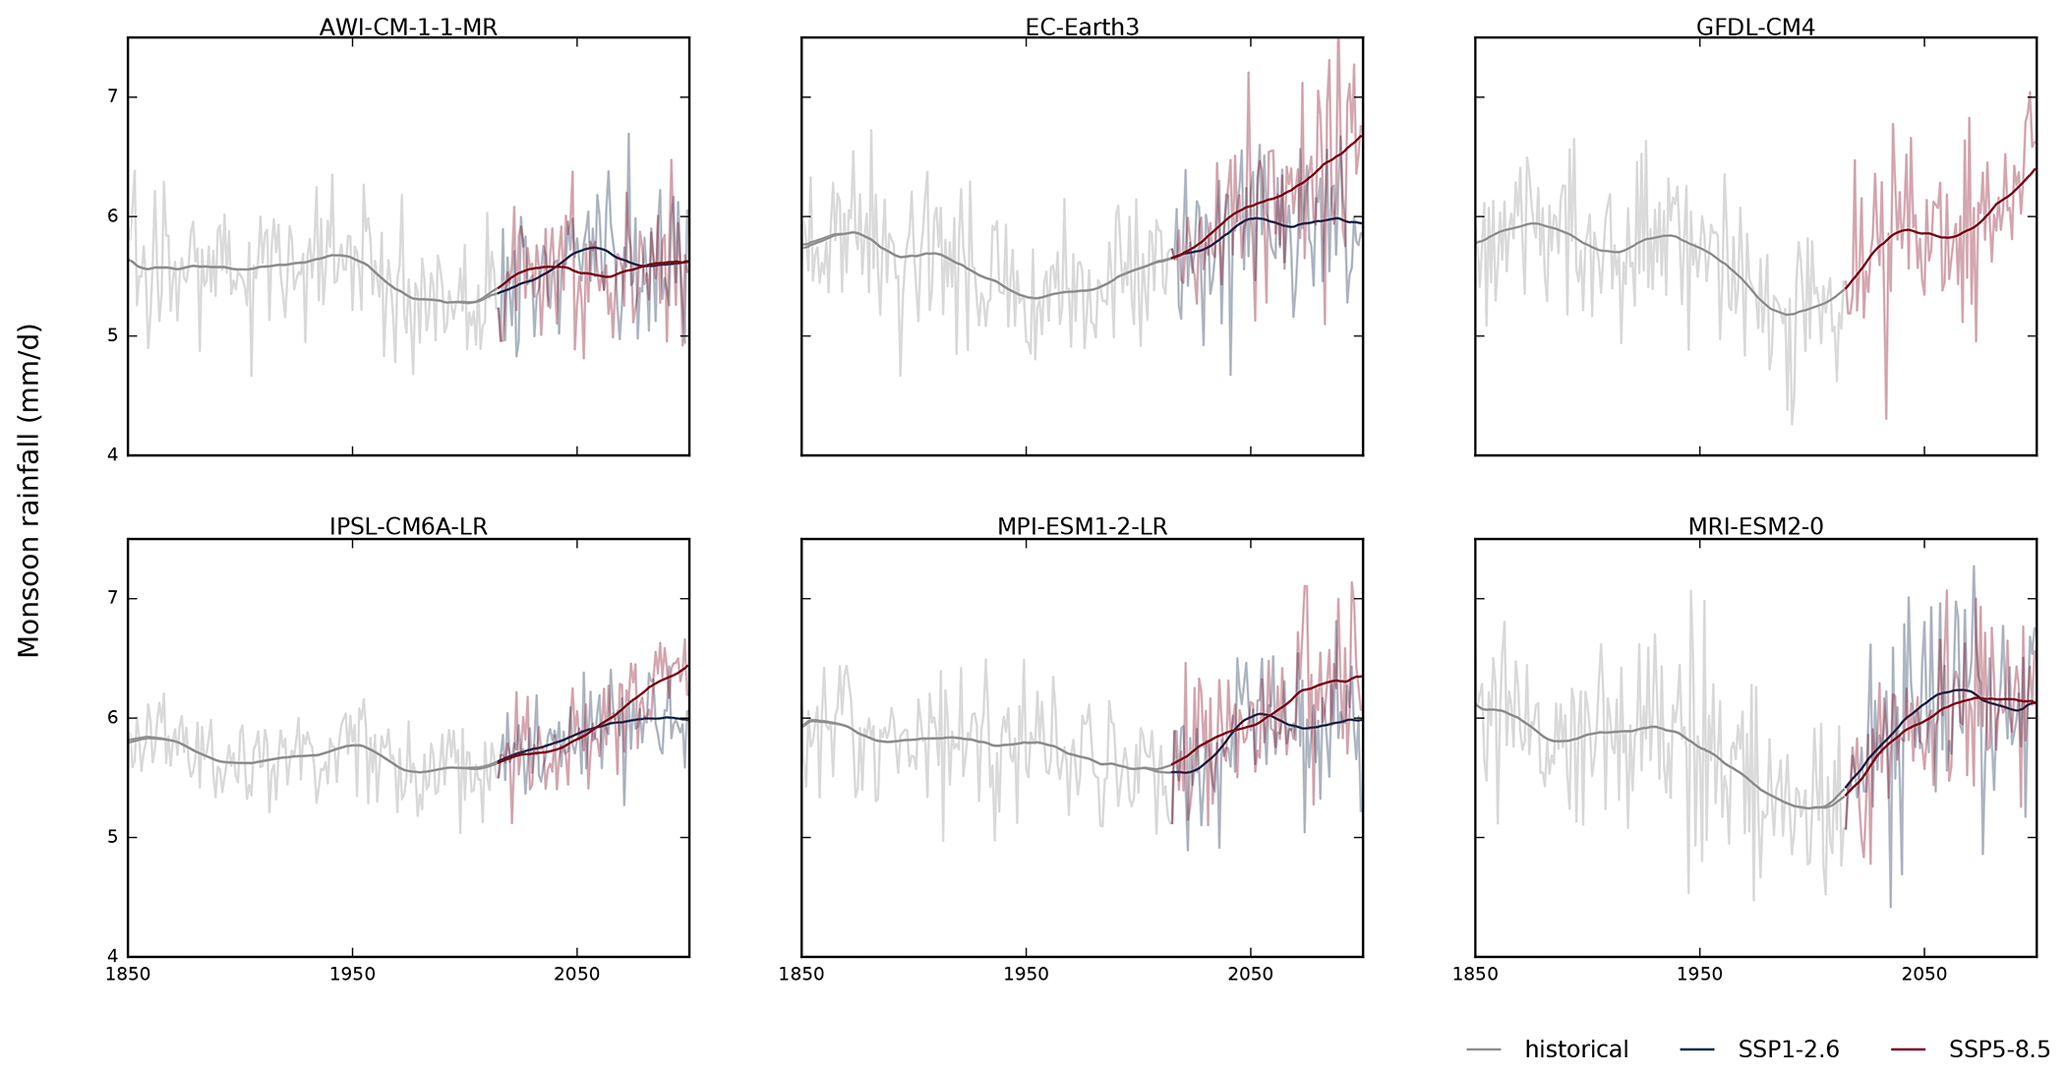
Figure 7Time series of EASM (mm d−1) for the period 1850–2100 from the TOP6 models. Transparent lines represent the annual values, while bold lines mark the trend obtained from a singular spectrum analysis with a window size of 20 years. For the method, see Golyandina and Zhigljavsky (2013).
Under SSP5-8.5, SSP3-7.0, SSP2-4.5 and SSP1-2.6 all TOP6 models project an increase until 2081–2100 compared to 1995–2014 (Fig. 8). The increase differs between the underlying emission scenarios: under SSP5-8.5, the increase is 16.5 % for the multi-model mean of TOP6 models (min: 6.2 %; max: 22.2 %). Under SSP3-7.0, the TOP6 models project an average increase of 11.8 % (min: 10.3 %; max: 15.3 %); under SSP2-4.5, the increase projected is 12.7 % (min: 6.6 %; max: 20.2 %); and under SSP1-2.6, it is 9.3 % (min: 6.7 %; max: 17.5 %). These projected increasing tendencies are robust for all scenarios (the signal is classified as robust, where ≧66 % of models show change greater than the variability threshold and ≧80 % of all models agree on sign of change.) Further details regarding other periods (2021–2040, 2041–2060, 2061–2080) can be found in Table 3. Regarding the monsoon change only over China, the increase projected by TOP6 models is even stronger: under SSP1-2.6 the monsoon rainfall intensifies by 12.6 %, under SSP2-4.5 by 14.3 %, under SSP3-7.0 by 17.8 % and under SSP5-8.5 by 18.1 % in multi-model average.
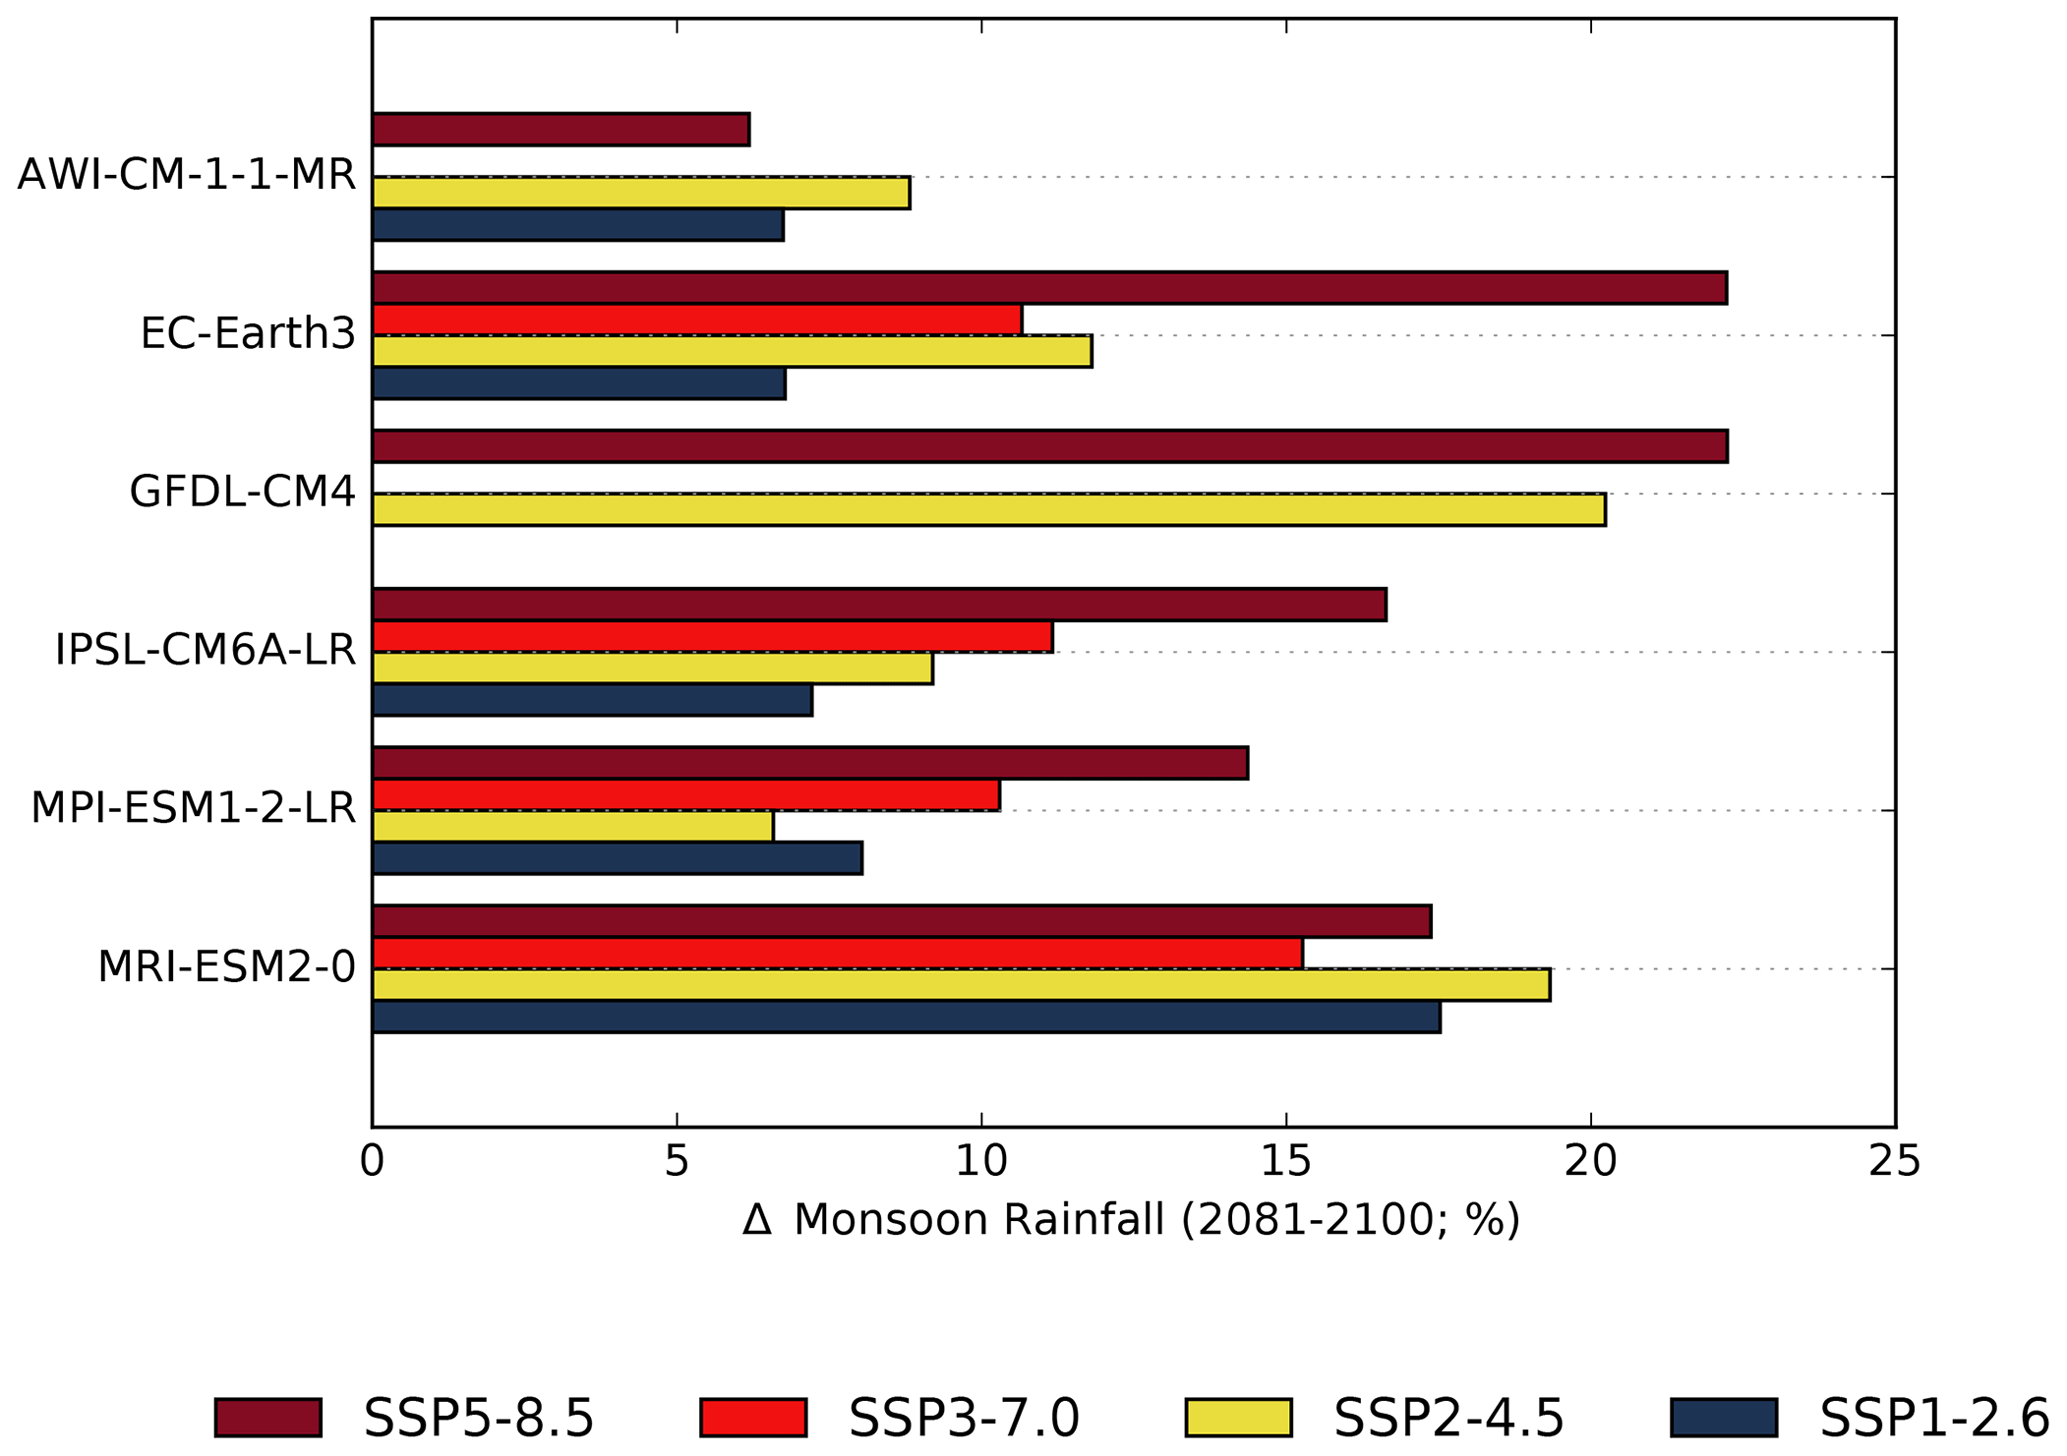
Figure 8Projected increase (%) in monsoon rainfall until 2081–2100 compared to 1995–2014 (GPCC) for the TOP6 models as available for the four emission scenarios.
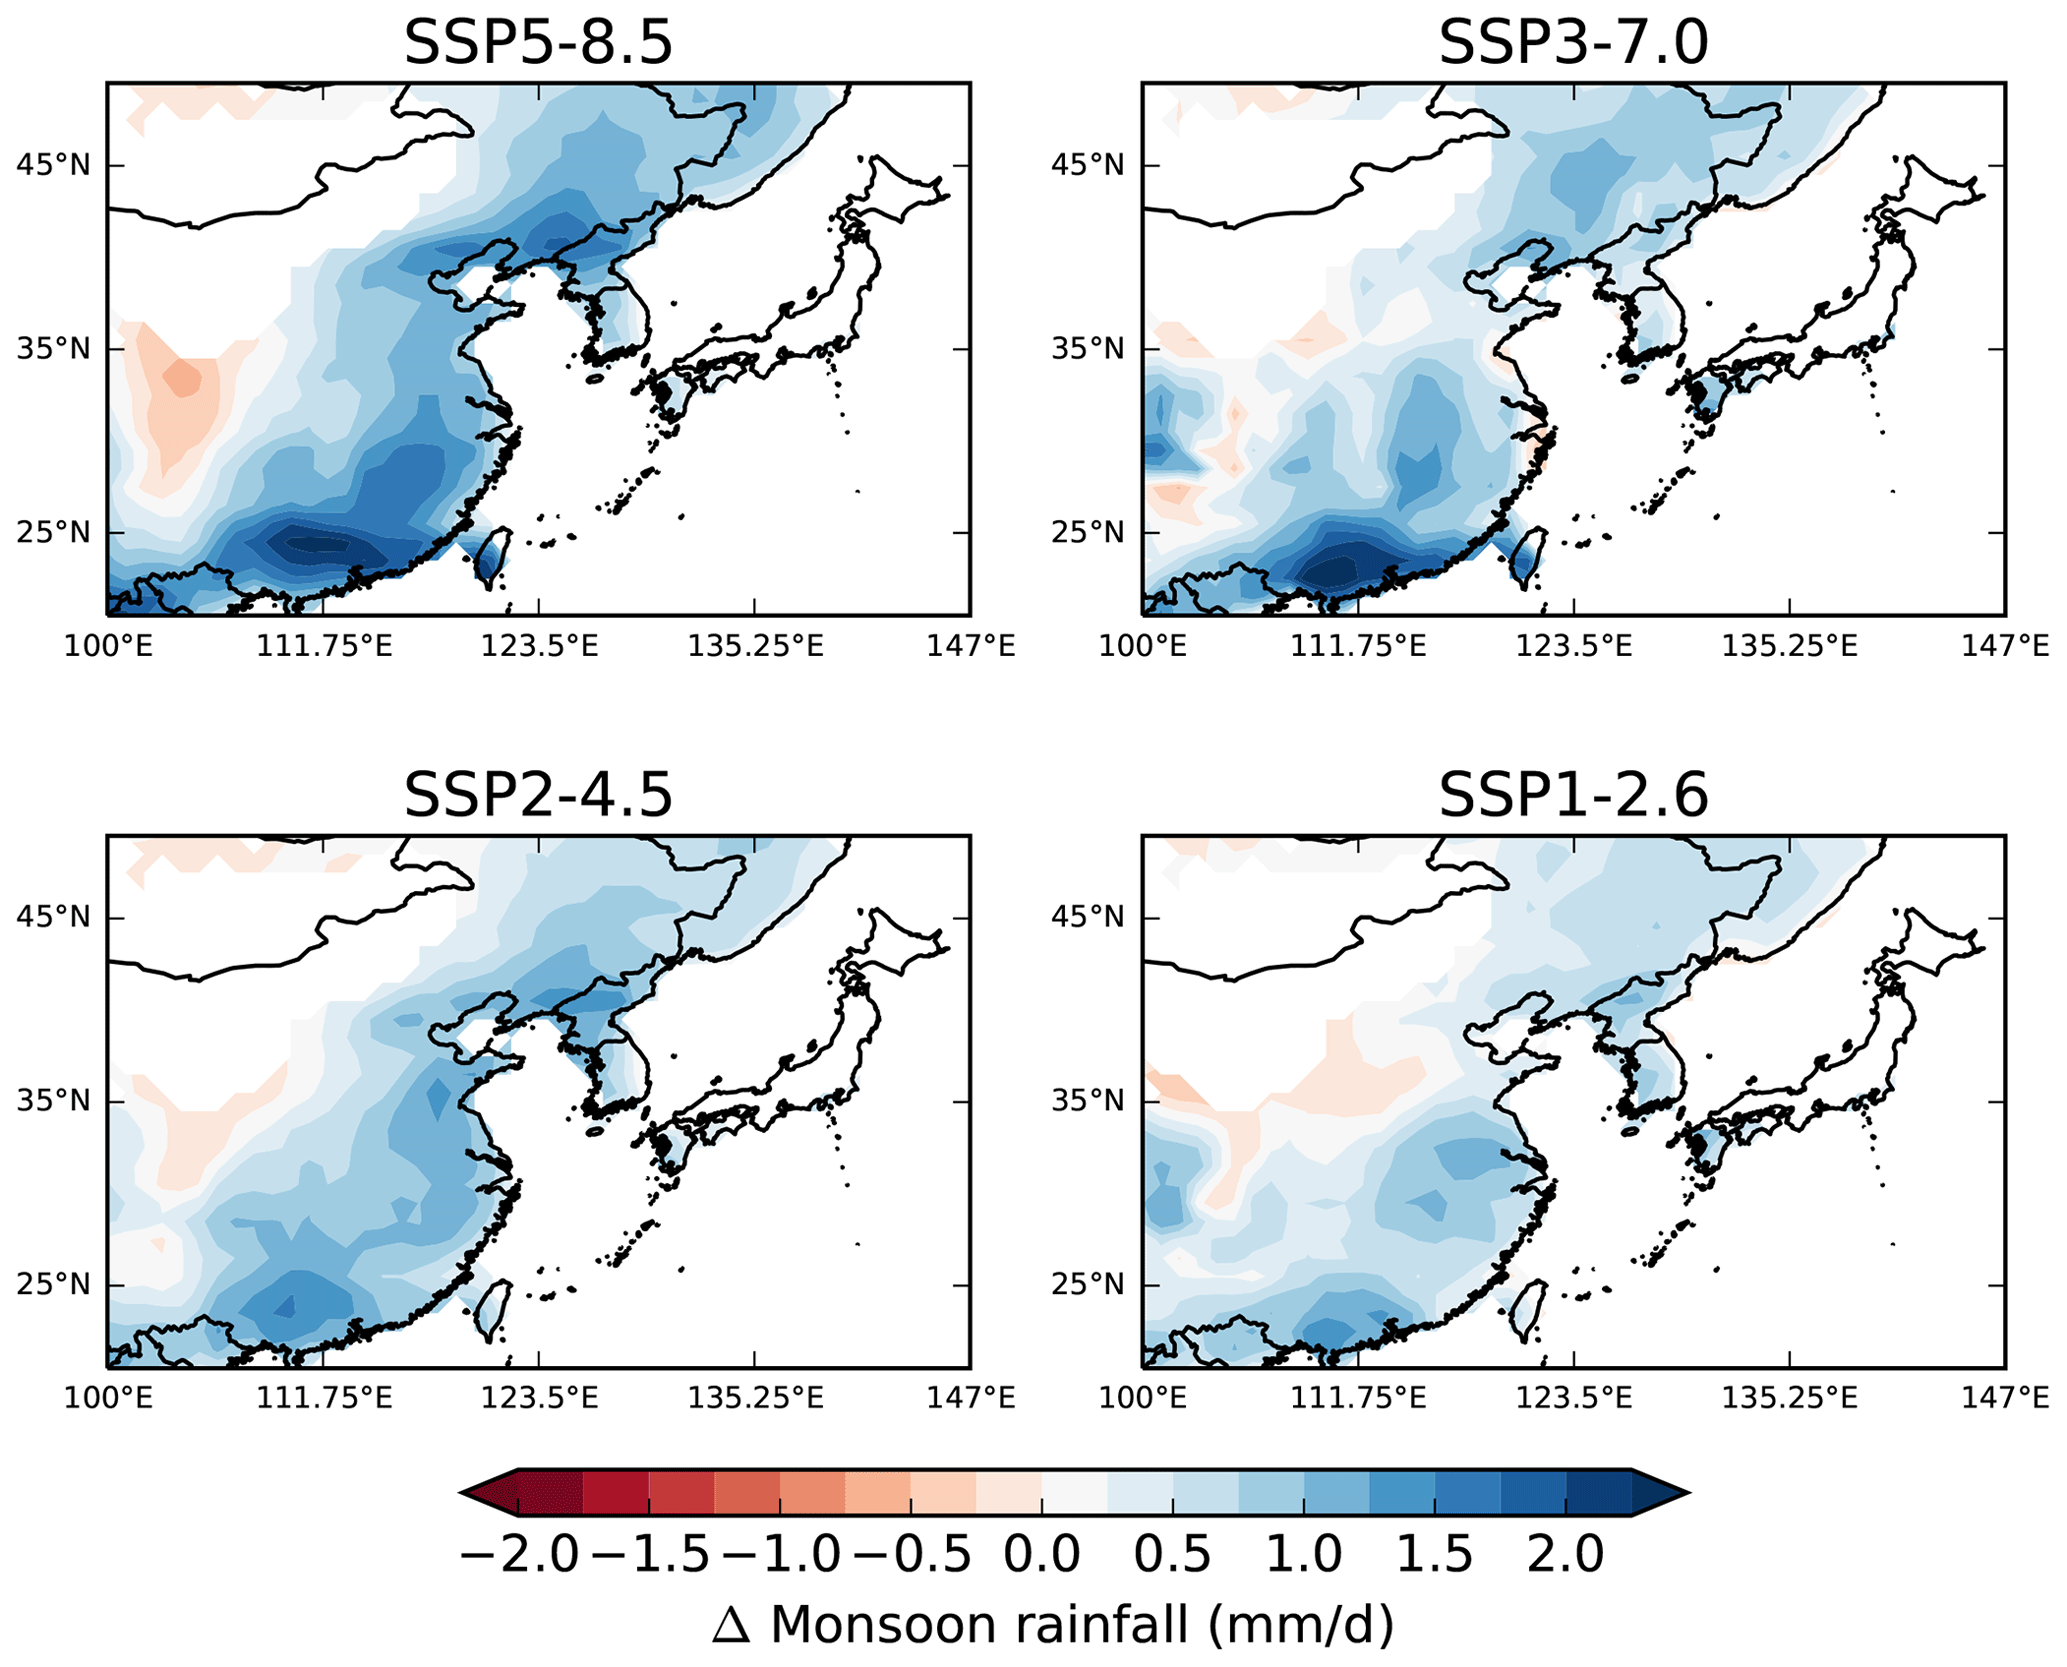
Figure 9Spatial changes in JJA rainfall between 2081–2100 and 1995–2014 for the multi-model mean of the TOP6 models. The individual model results are shown in Fig. A3.
The spatial change in EASM rainfall between 2081–2100 and 1995–2014 based on the TOP6 multi-model mean is shown in Fig. 9. The majority of TOP6 models coincide in the larger-scale rainfall change pattern. In most of the EASM region the rainfall is projected to increase in multi-model mean, particularly in Taiwan, southeastern China, and North Korea and adjacent regions. The increase in coastal regions is projected consistently by all TOP6 models (Fig. A3). However, the specific increases in different regions differ in intensity. A decrease in rainfall is projected in parts of Guizhou and Chongqing. This decrease is present in all TOP6 models (Fig. A3), albeit with differing intensities. A weak decrease in rainfall over South Korea and southern Japan is projected by three models.
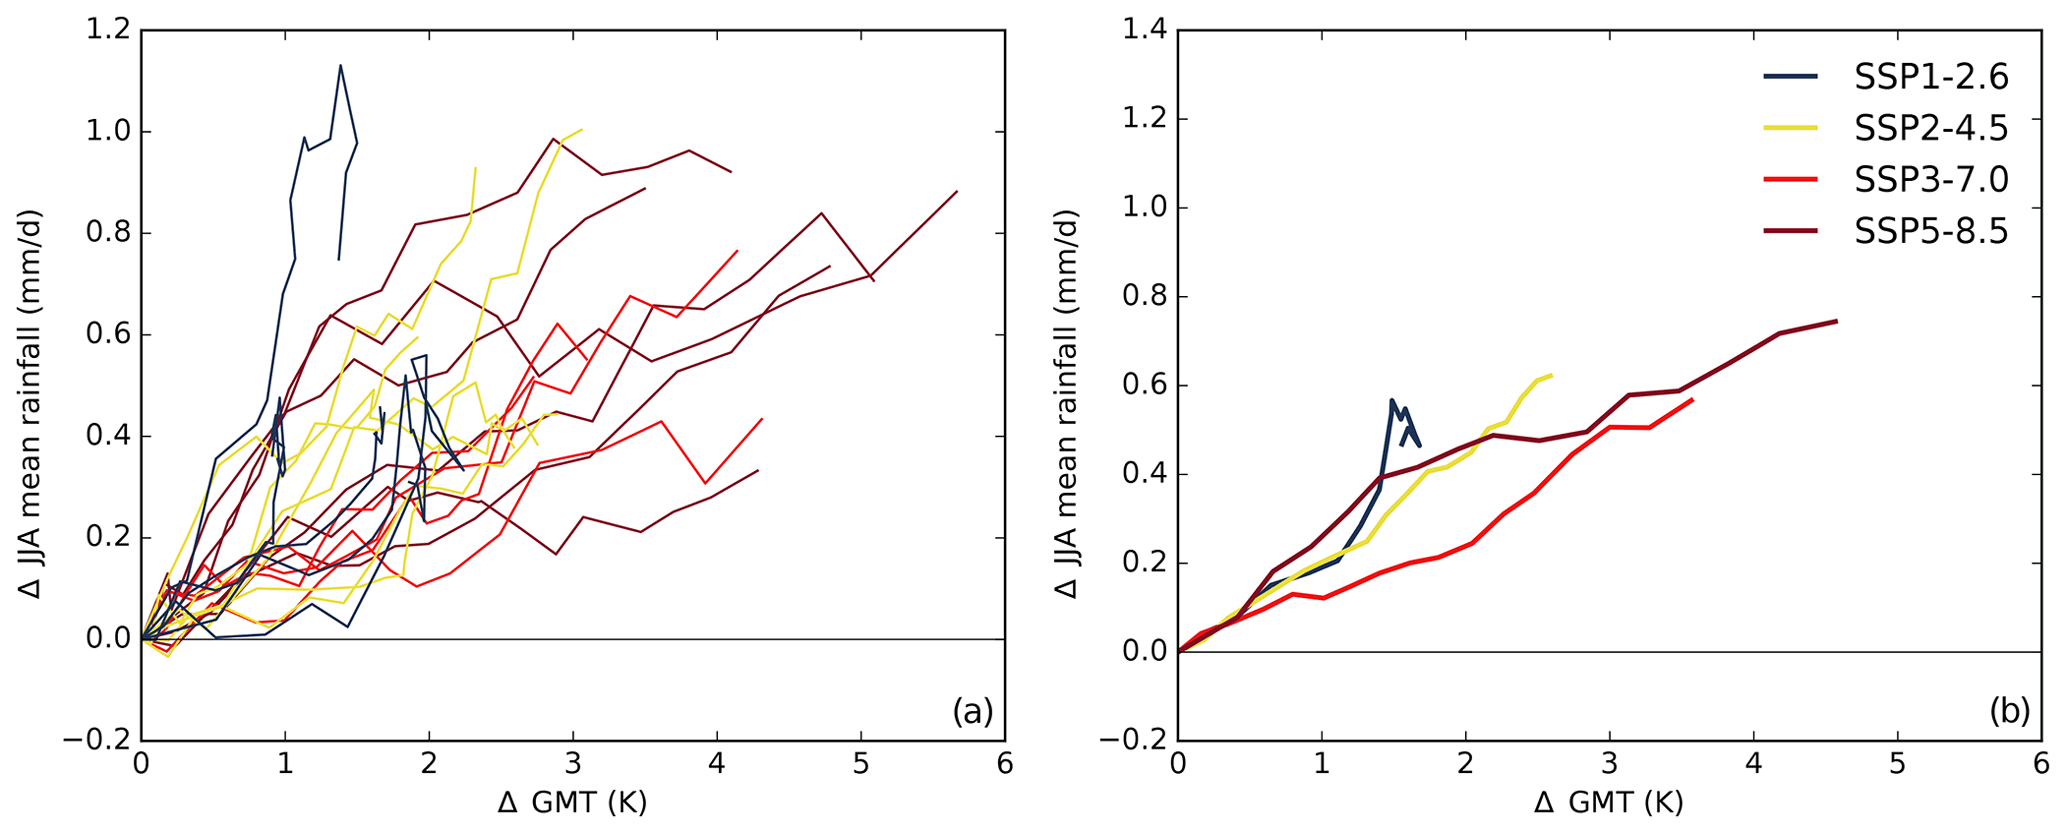
Figure 10Change in EASM rainfall (mm d−1) depending on change in global mean temperature (K) during the 21st century for all TOP6 models (a) and their multi-model average (b). The change is shown based on 20-year periods (1995–2014, 2000–2019, 2005–2024, etc.). Dashed gray lines indicate the slope. The reference period is 1995–2014.
In addition, we analyze the dependence of EASM rainfall on global mean temperature (GMT). The multi-model mean indicates a linear relationship that is relatively independent of the underlying emission scenario (Fig. 10). The projected average increase in daily rainfall during the monsoon season is 0.17 mm per degree of global warming. This refers to an increase in EASM rainfall of 3.1 % per degree GMT increase. The increase ranges from 0.08 to 0.25 mm d−1 depending on the TOP6 model.
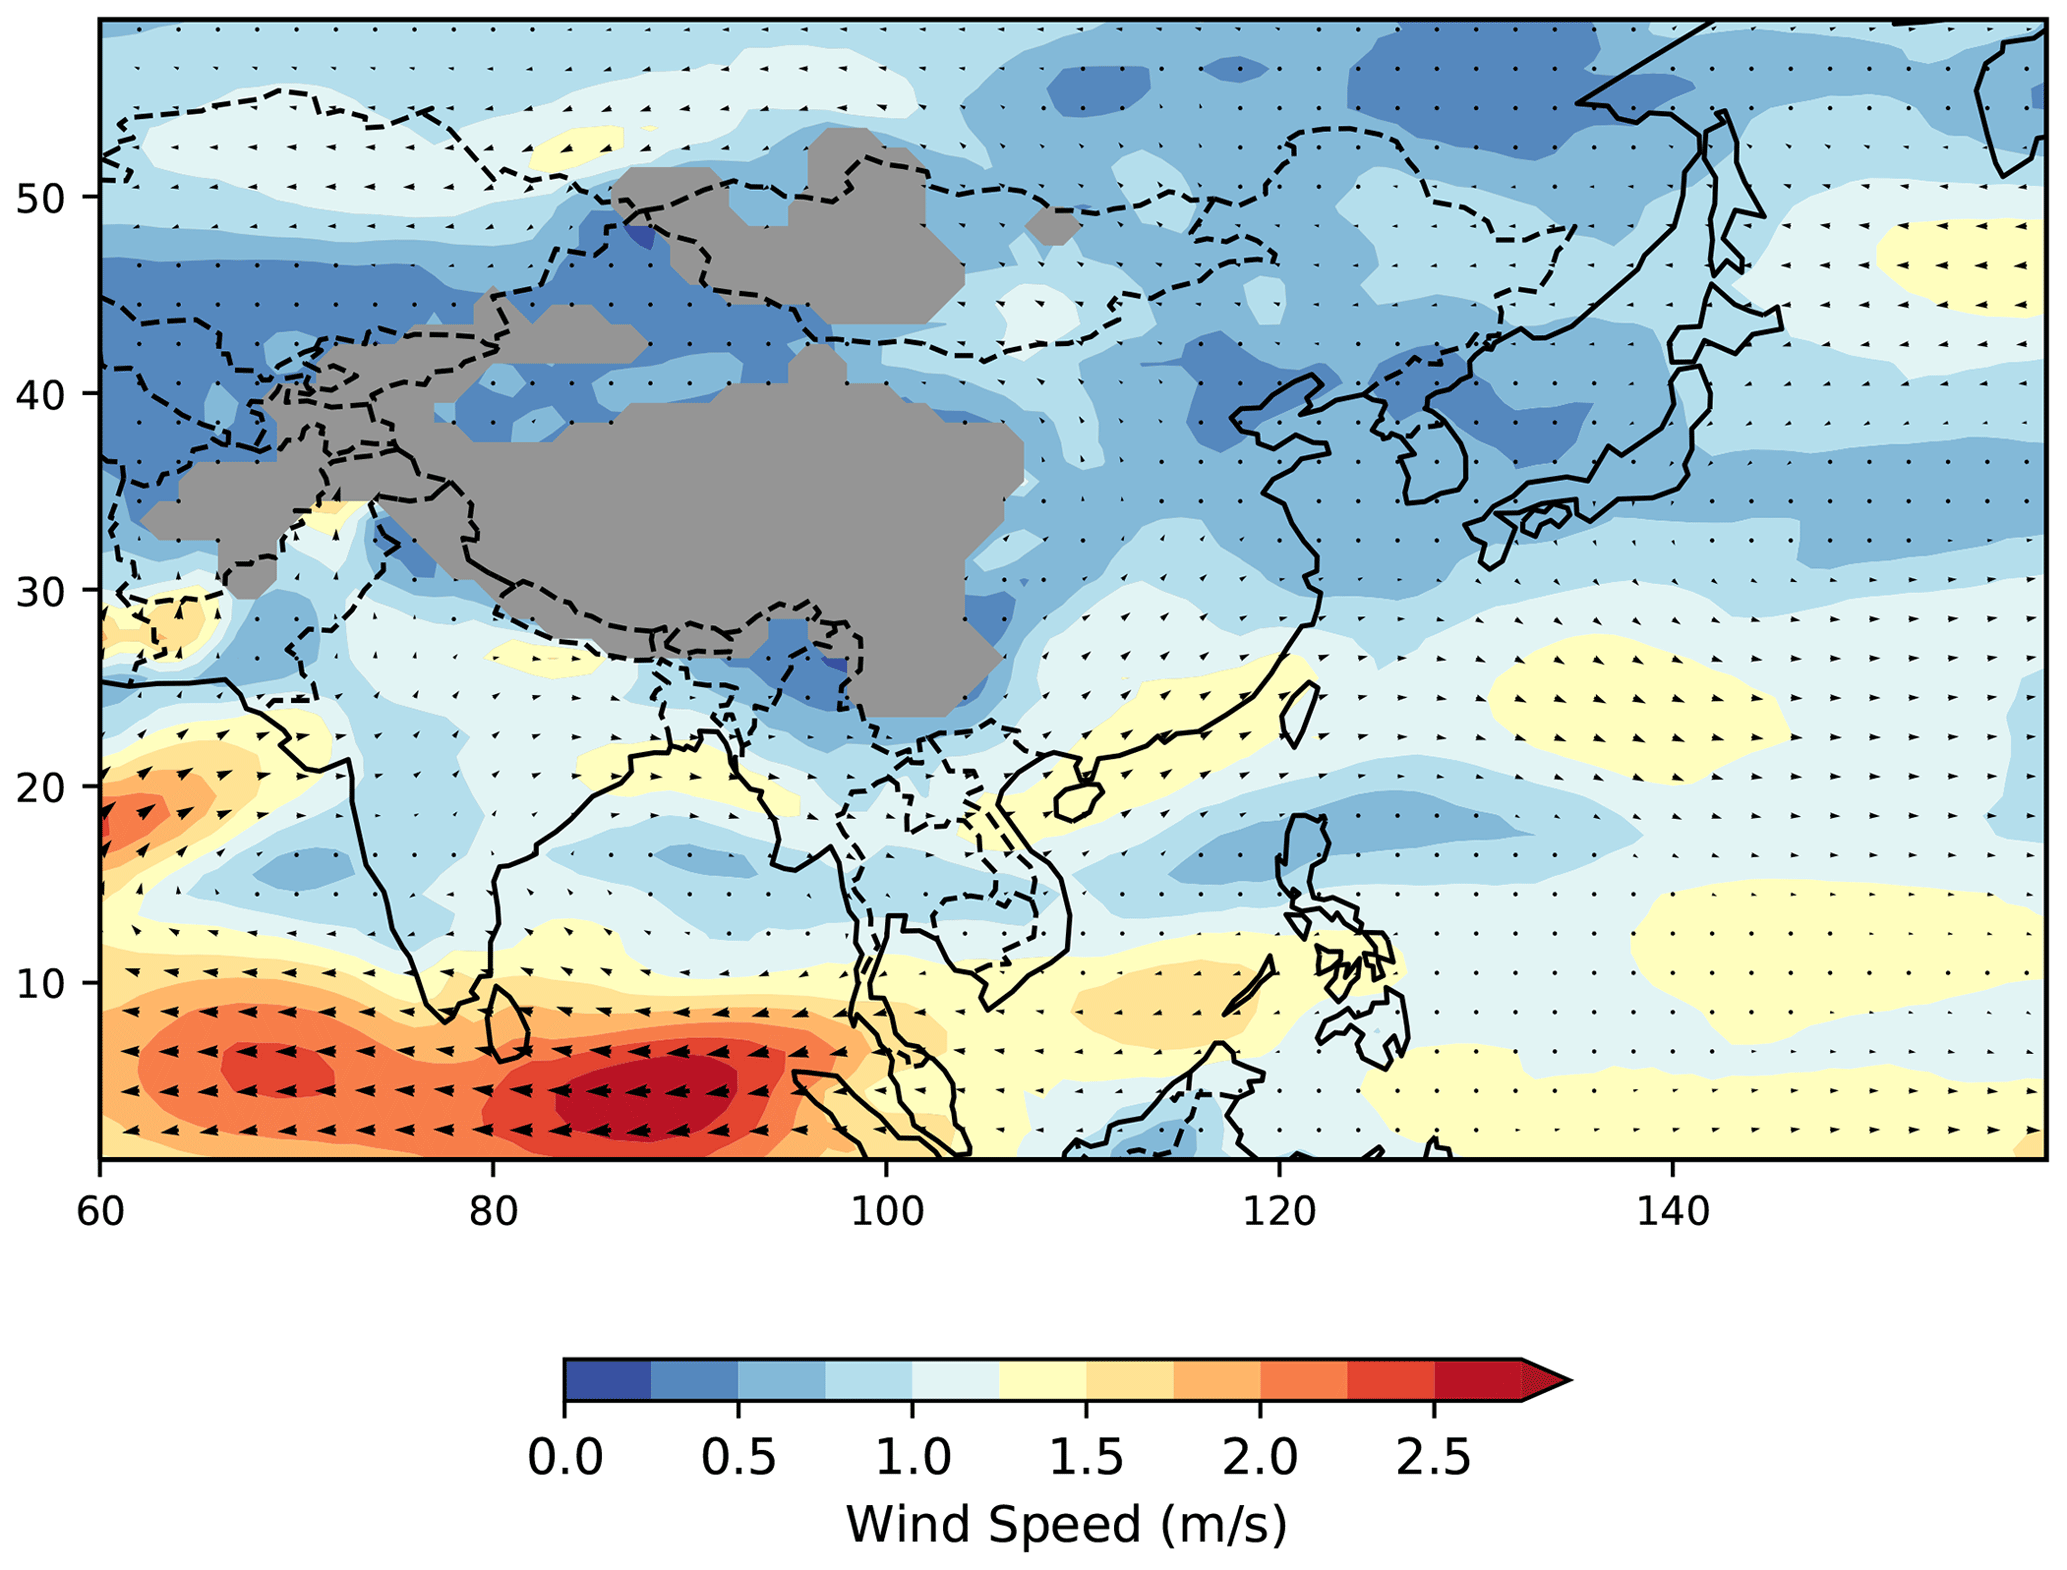
Figure 11Change in wind vectors (850 hPa) and wind speed (m s−1) in 2081–2100 (SSP5-8.5) compared to the reference period. The multi-model mean of the TOP6 models is shown. Individual model results are presented in Fig. A4.
3.3 Changes in monsoon circulation
The TOP6 multi-model mean in the region of the EASM shows only minor changes in the local circulation under SSP5-8.5 (Fig. 11). This indicates relatively weak dynamic changes and points towards dominating changes in thermodynamic factors. The individual models confirm this pattern: AWI-CM-1-1-MR, IPSL-CM6A-LR, MRI-ESM2-0 and GFDL-CM4 mostly project changes in wind speed below 1.5 m s−1. Only EC-Earth3 and MPI-ESM1-2-LR project slightly higher changes, but these mostly do not exceed 2.5 mm d−1. The most prominent feature in the wind change pattern is the northeasterly winds over the Bay of Bengal in 0–10° N that weaken by up to 3 m s−1 in the multi-model mean. This change is present in all TOP6 models under SSP5-8.5 with the most pronounced changes in IPSL-CM6A-LR and EC-Earth3.
3.4 Interannual variability
Furthermore, we analyze the interannual variability in the EASM rainfall. For this purpose, we remove the nonlinear trend obtained by the singular spectrum analysis (see Fig. 7) and use the percentage changes in standard deviation between 2051–2100 and 1965–2014. Under SSP5-8.5, all TOP6 models project an increase in interannual variability with a multi-model mean of 23.8 % (robust) ranging from 2.9 % to 76.47 % (Fig. 12). Under SSP3-7.0, two out of four TOP6 models project an increase (not robust). The multi-model mean is 9.0 % (min: −22.8 %; max: 48.1 %). Under SSP2-4.5, five out of six project increasing variability with an average of 6.5 % (min: −9.1 %; max: 19.1 %), and under SSP1-2.6 an increase is projected by six out of six TOP6 models with a multi-model average of 17.6 % (min: 8.5 %; max: 22.6 %).
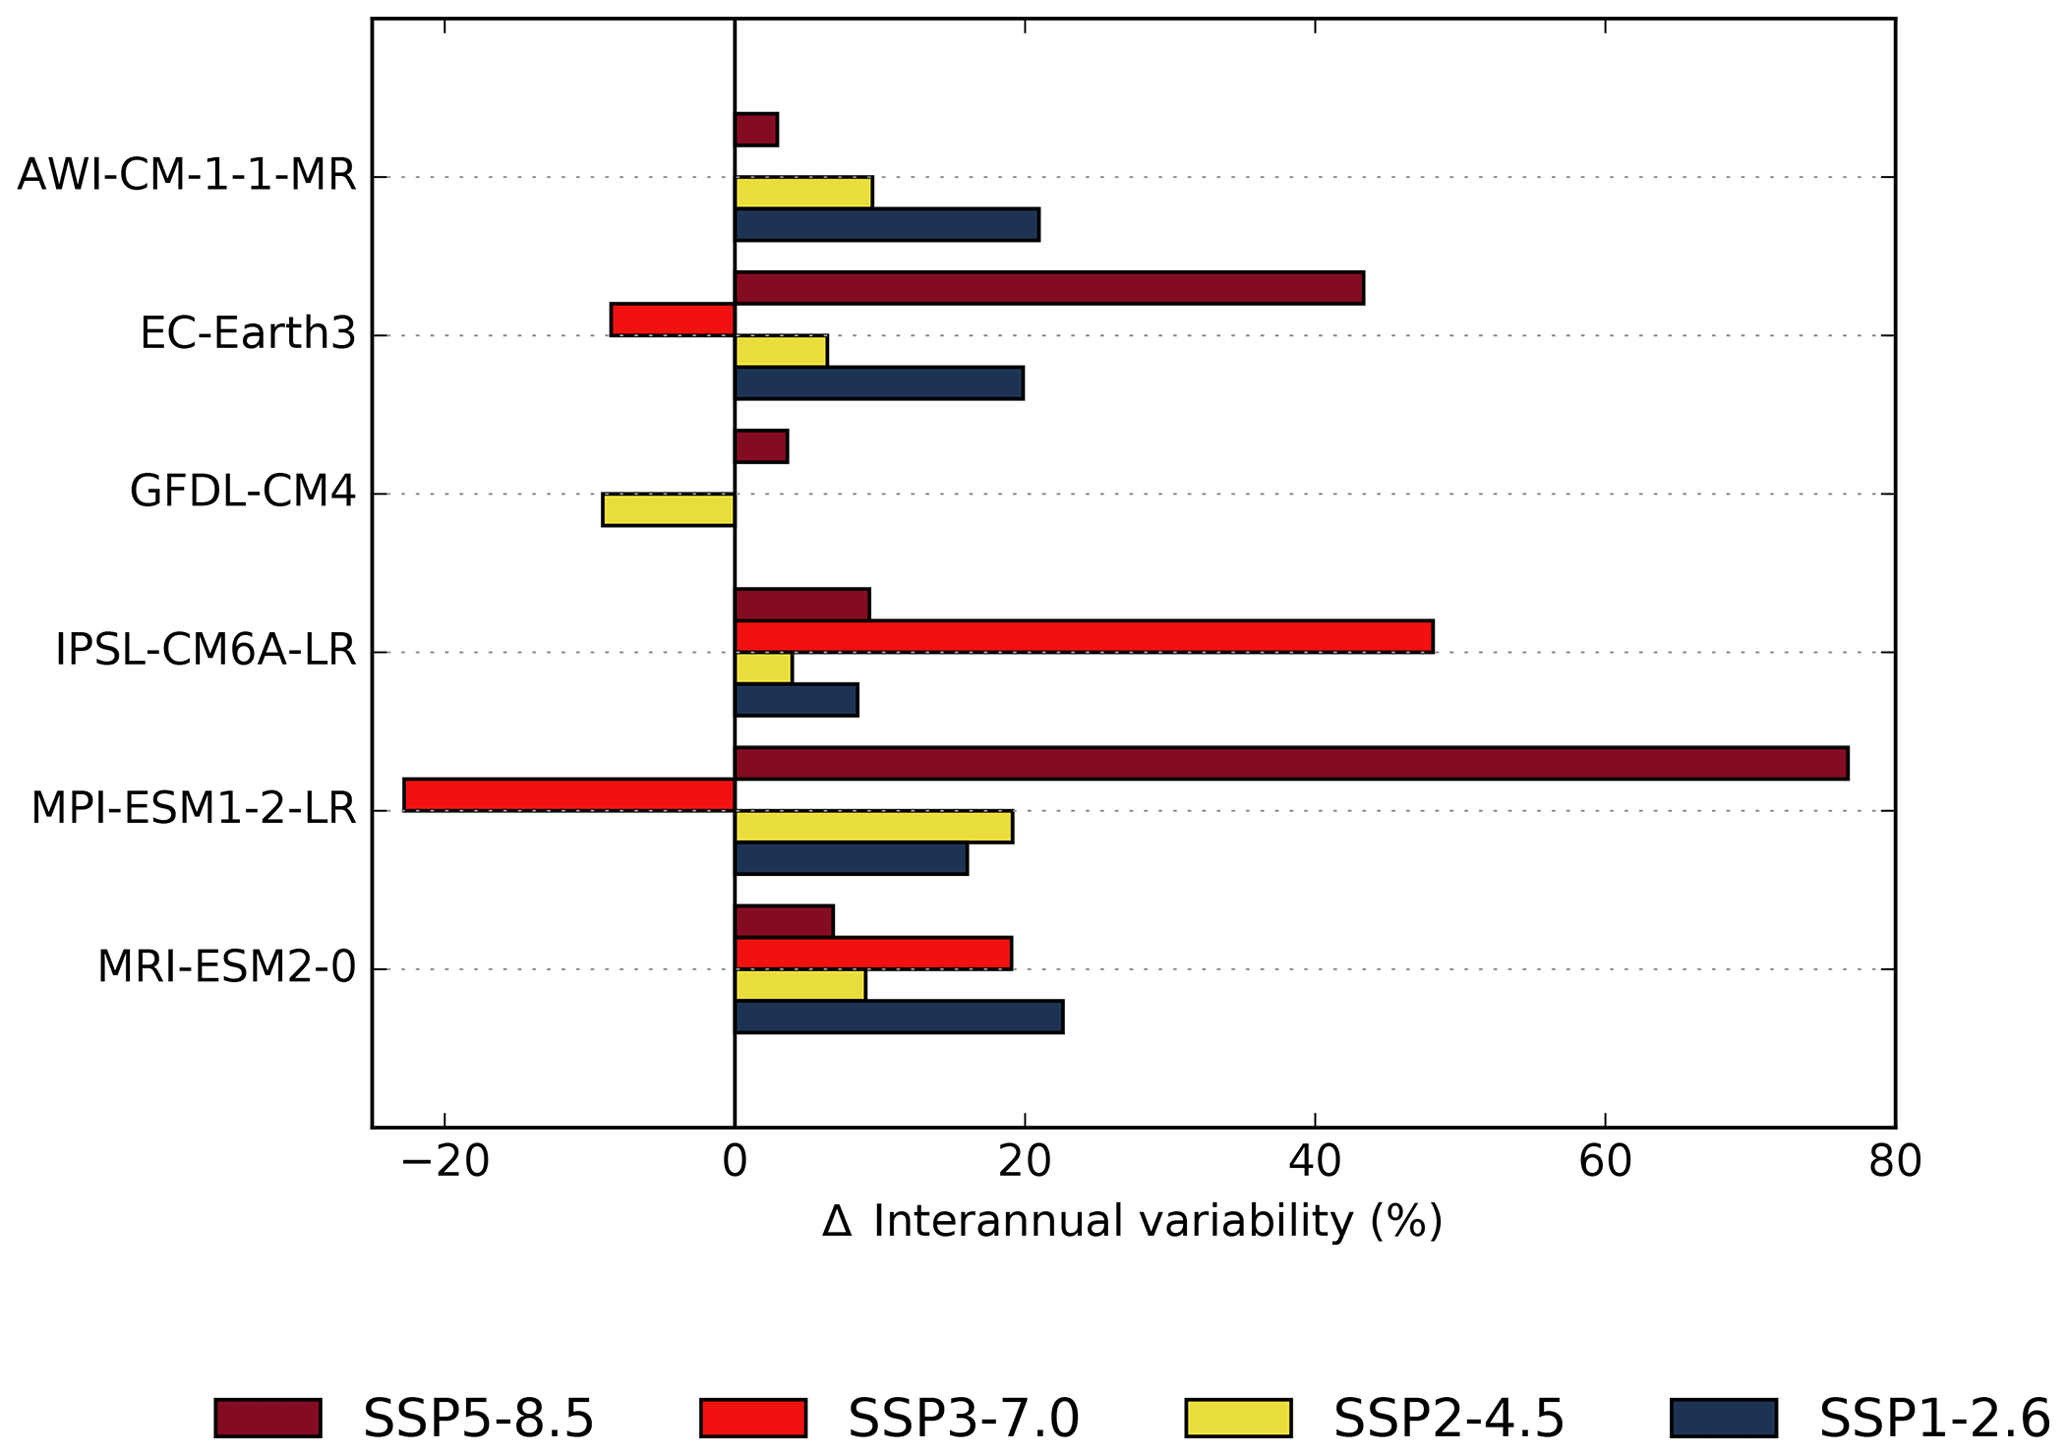
Figure 12Change (%) in interannual variability between 2051–2100 and 1965–2014 for the EASM seasonal rainfall under four emission scenarios for the TOP6 models.
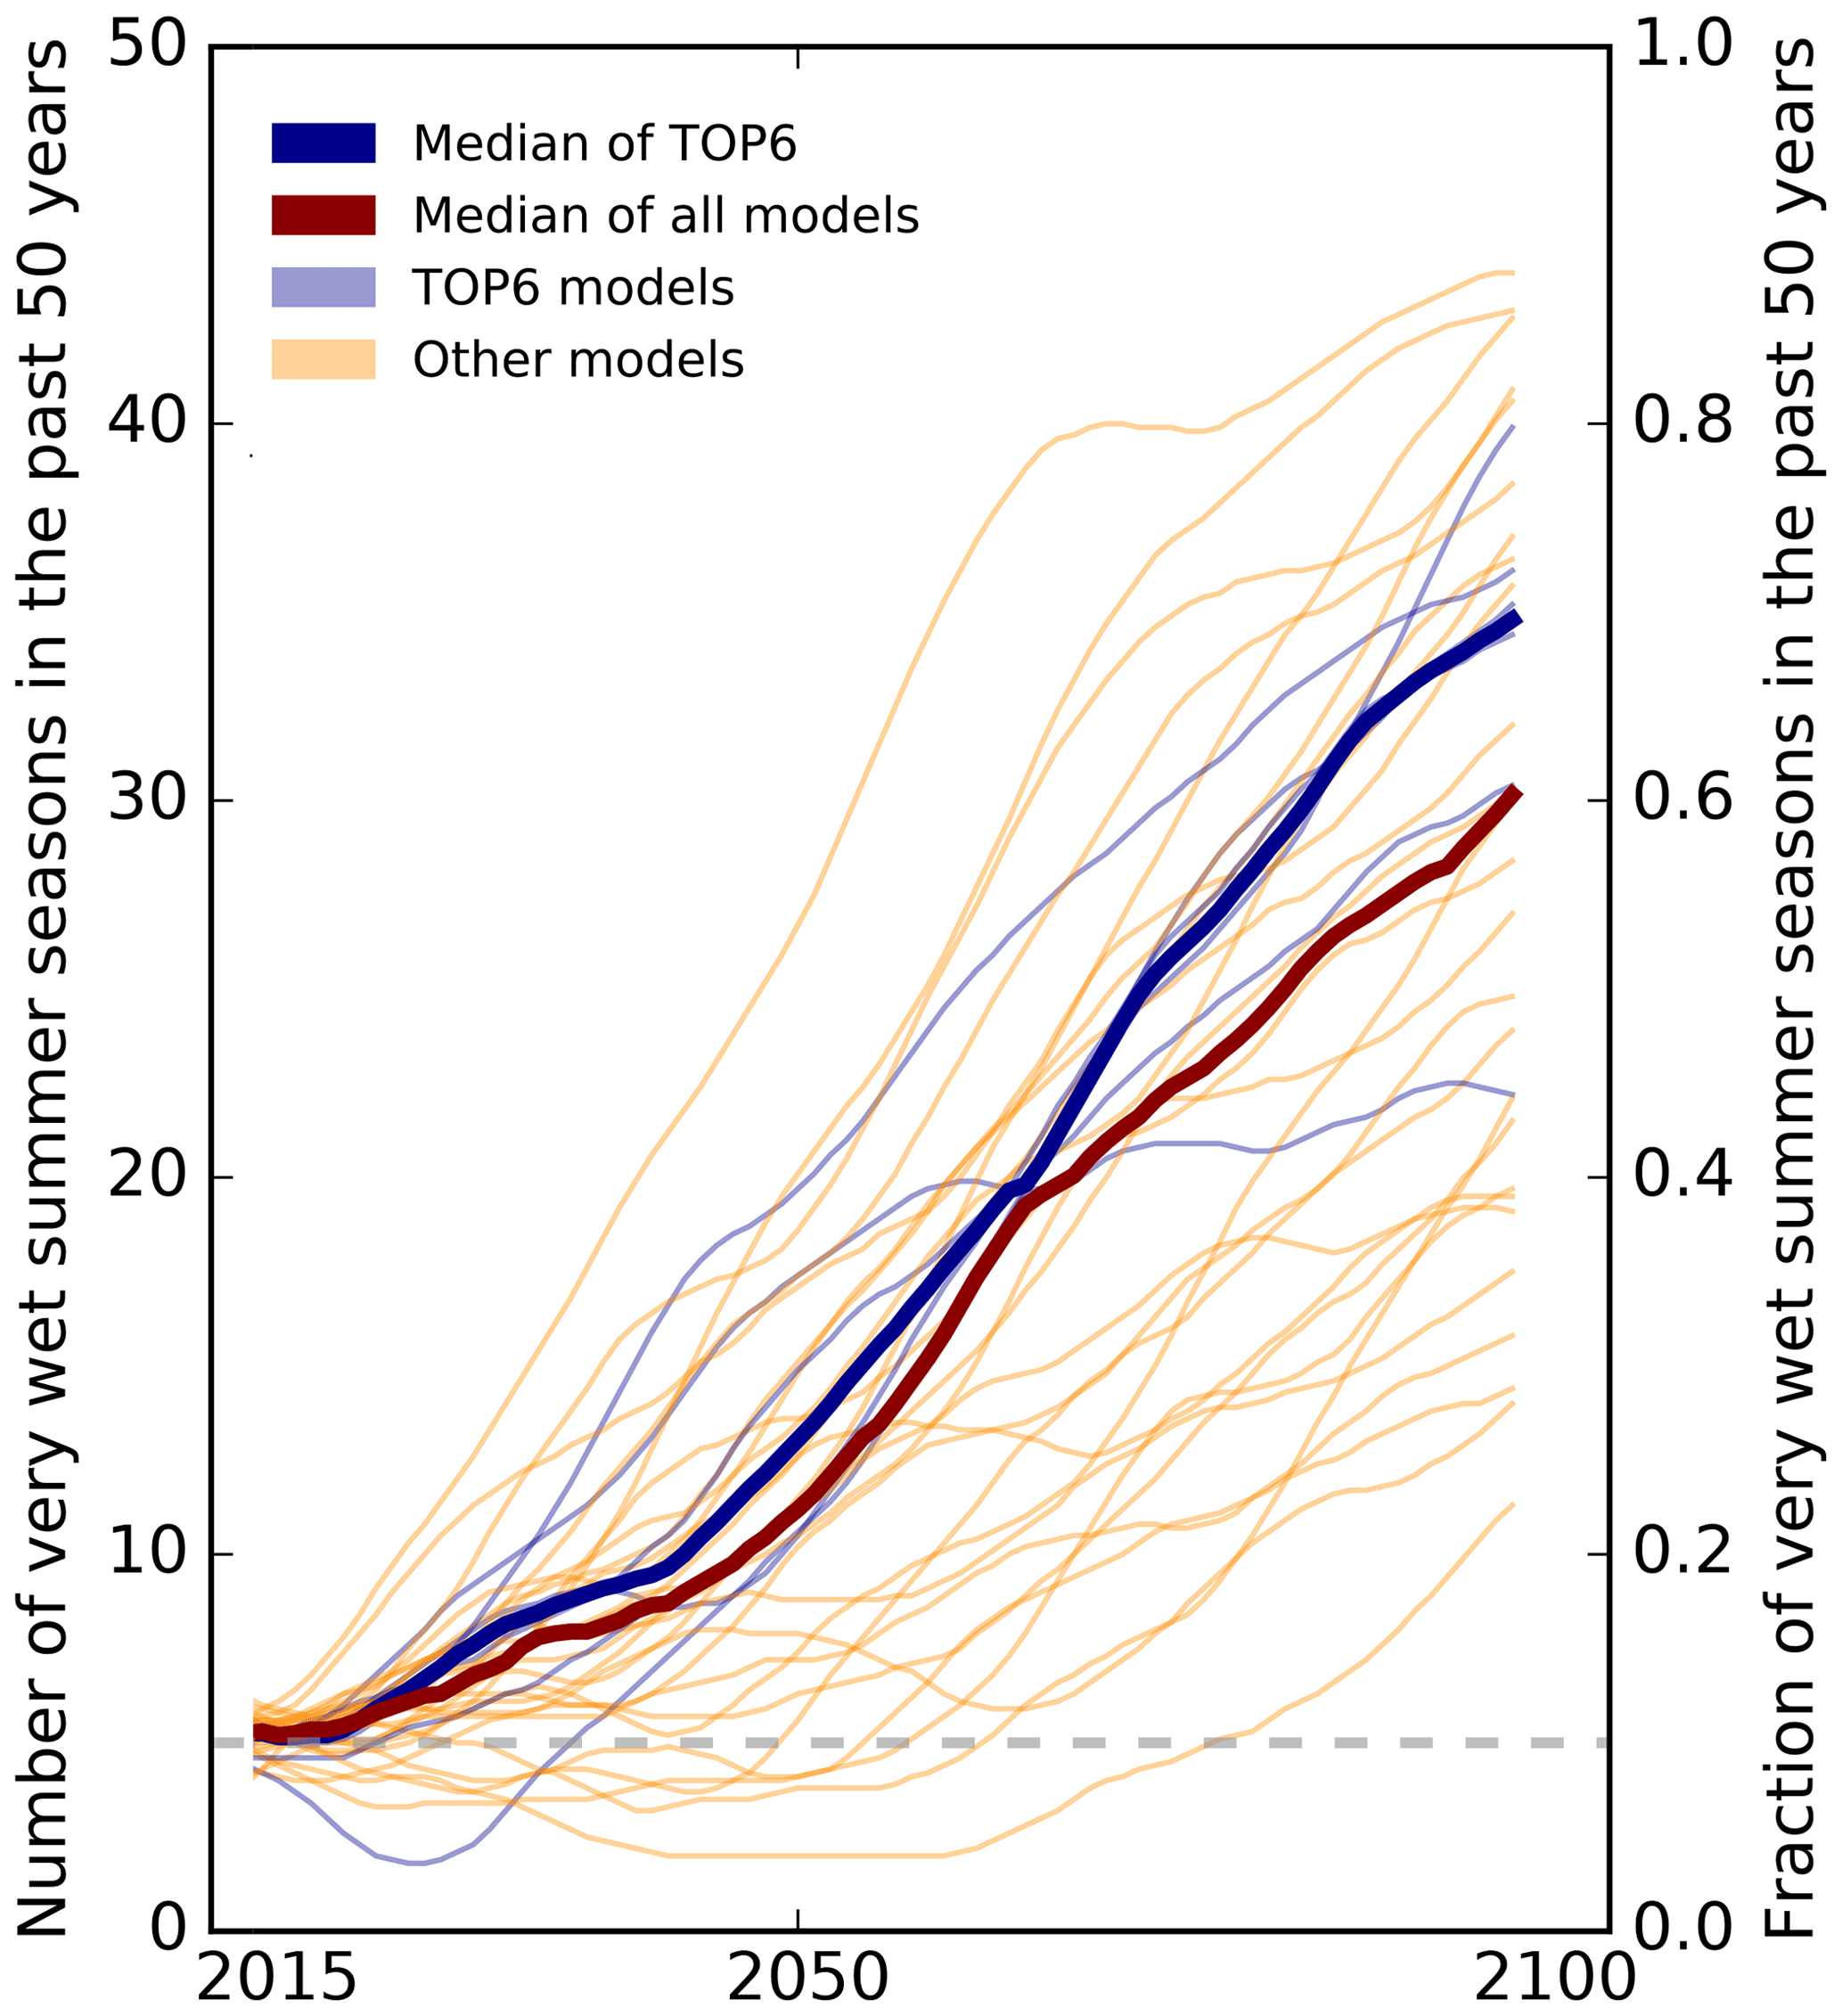
Figure 13Increase in extremely wet monsoon seasons under unabated climate change (SSP5-8.5). The TOP6 models are shown in blue, while other CMIP6 models are shown in orange. The reference period is 1965–2014, where (per definition) 5 out of 50 years were extremely wet.
3.5 Extremely wet seasons
We use the 90th percentile for the period 1965–2014 in order to define extremely wet monsoon seasons. Thus, per definition, 5 out of 50 years were extremely wet during the 50-year period from 1965–2014. Under SSP5-8.5, the number of extremely wet monsoon seasons will increase by a factor of 7.0 until 2051–2100 according to the multi-model mean of TOP6 models. A total of 35.2 years are expected to be extremely wet in 2051–2100, with individual TOP6 model projections ranging from 22 to 42 out of 50 seasons. Under SSP3-7.0, the multi-model mean projection is 29.0, ranging from 22 to 39 extremely wet seasons. Under SSP2-4.5, 31.3 seasons in the future period are projected to be extremely wet, ranging from 25 to 40 seasons. Under SSP1-2.6 the multi-model mean projection is 28.6, ranging from 22 to 36 seasons. The increase over time is shown in Fig. 13.
In this study, we use 34 CMIP6 models in order to analyze their future projections under climate change regarding the East Asian Summer Monsoon. We identify models that capture the EASM characteristics in the reference period best as TOP6 models and use them for our main analysis. The CMIP6 models have a tendency to overestimate the EASM rainfall, which is in line with previous studies (Jiang et al., 2020). This is different from other Asian monsoon regions. For example, in the Indian monsoon region models tend to underestimate the seasonal rainfall (Katzenberger et al., 2021, 2022). All TOP6 models robustly project an increase in rainfall under all four emission scenarios. The projected multi-model mean increase until 2081–2100 is 16.5 % under SSP5-8.5, 11.8 % under SSP3-7.0, 12.7 % under SSP2-4.5 and 9.3 % under SSP1-2.6. The rainfall-intensifying tendency is also confirming the results presented by the IPCC AR6, which classifies the increasing trend as “highly certain” (Masson-Delmotte et al., 2021). The projected increase is also in line with CMIP5 projections, though even stronger increases are projected in CMIP6 (Qu et al., 2014; Chen and Sun, 2013; Kitoh et al., 2013). However, it has to be noted that there are differences in the methods between the studies preventing direct comparison of the results. The projections for the near term depend on the implementation and efficiency of future air pollution control that is difficult to predict (Wilcox et al., 2020), adding further uncertainty. The increase in rainfall will particularly contribute to rainfall in southeastern China, Taiwan and North Korea, which are regions that are already experiencing a relatively strong monsoon. Thus, the “wet regions get wetter” dynamics are predominantly confirmed for the EASM in line with CMIP5 results (Seo et al., 2013). Over China, the monsoon is projected to increase by 12.6 % under SSP1-2.6, by 14.3 % under SSP2-4.5, by 14.1 % under SSP3-7.0 and by 19.1 % under SSP5-8.5. The monsoon is projected to increase by 0.17 mm d−1 per degree of global warming, which refers to 3.1 % of the rainfall in the reference period. The multi-model mean in the wind pattern reveals relatively minor changes in the circulation in the region. This indicates that there are only small changes in the dynamic component within East Asia, pointing to the dominant contribution from the thermodynamic component. Indeed, this is in line with the CMIP6 study of Li et al. (2021), who quantified the role of the different components contributing to the EASM increase throughout the 21st century. In East China (Japan and Korean Peninsula region) over the long term, they quantify the change in moisture advection to be +9.6 % (+9.2 %), evaporation to be +19.9 % (+16.1 %) and moisture convergence to be +70.6 % (+74.4 %). Additionally, they split the moisture convergence term into a term that relates to circulation changes (dynamic changes), one that refers to moisture content changes (thermodynamic changes) and a residual term that can be assumed to be small. In East China (Japan and Korean Peninsula region) over the long term, the thermodynamic term clearly dominates with +98.1 % (+153.0 %) over the dynamic term of +3.0 % (−34.9 %). The authors find that the dynamic term might even be canceled out due to the large intermodel spread (Li et al., 2021). This intermodel spread might also at least partly explain the fact that the dynamic component has been found to contribute both positively and negatively to the budget (Wang et al., 2014; Li et al., 2015; Lee et al., 2017; Li et al., 2021). However, most studies coincide with the dominant thermodynamic role in the region (Li et al., 2015; Lee et al., 2017; Li et al., 2021), but there is also one study that finds that the dynamic component might be dominating in the region with 67 % over the 33 % of the thermodynamic component (Xue et al., 2023). However, as pointed out by the authors of this study, the projections are based on a single model (CESM2) that in our study was also not among the best performing regarding the EASM characteristics. The relevance of evaporation and moisture convergence has already been reported in the context of CMIP5 (Seo et al., 2013; Qu et al., 2014). Seo et al. (2013) found that these changes are induced by the (north)westward shift in the North Pacific subtropical high. Along the northern and northwestern flank of the strengthened high, intensified southerly or southwesterly winds led to an increase in moisture convergence, intensifying precipitation particularly over the Baiu region to the east of Japan and the continental region to the north of the Korean Peninsula. Qu et al. (2014) also add the increased vertical transport of moisture in the EASM region and the capacity of warmer air to hold more moisture following Clausius–Clapeyron as relevant contributing factors. In other studies, the role of the strengthening of the land–sea thermal contrast under global warming is discussed (Endo et al., 2018).
In addition, we analyzed the interannual variability that is particularly important for societal and economic adaptation strategies, defining the necessary interannual flexibility for agricultural irrigation, flood management, etc. The interannual variability is projected to increase by 17.6 % under SSP1-2.6, 6.5 % under SSP2-4.5, 9.0 % under SSP3-7.0 and 23.8 % under SSP5-8.5 from 1965–2014 to 2051–2100. Comparing the CMIP6 multi-model mean results under SSP5-8.5 of 31.4 % to CMIP3 results under the respective A2 scenario, the projected increase in CMIP3 of 19 % is considerably weaker (Lu and Fu, 2010). Additionally, extremely wet monsoon seasons are projected to occur 7 times more often under SSP5-8.5 compared to the reference period. The increase in interannual variability of the seasonal rainfall is accompanied by increasing interannual variability of the western North Pacific subtropical high and East Asian upper-tropospheric jet (Lu and Fu, 2010). The projected changes in the characteristics of the EASM are of high socioeconomic relevance and should be taken into account in the management decisions for the 21st century.
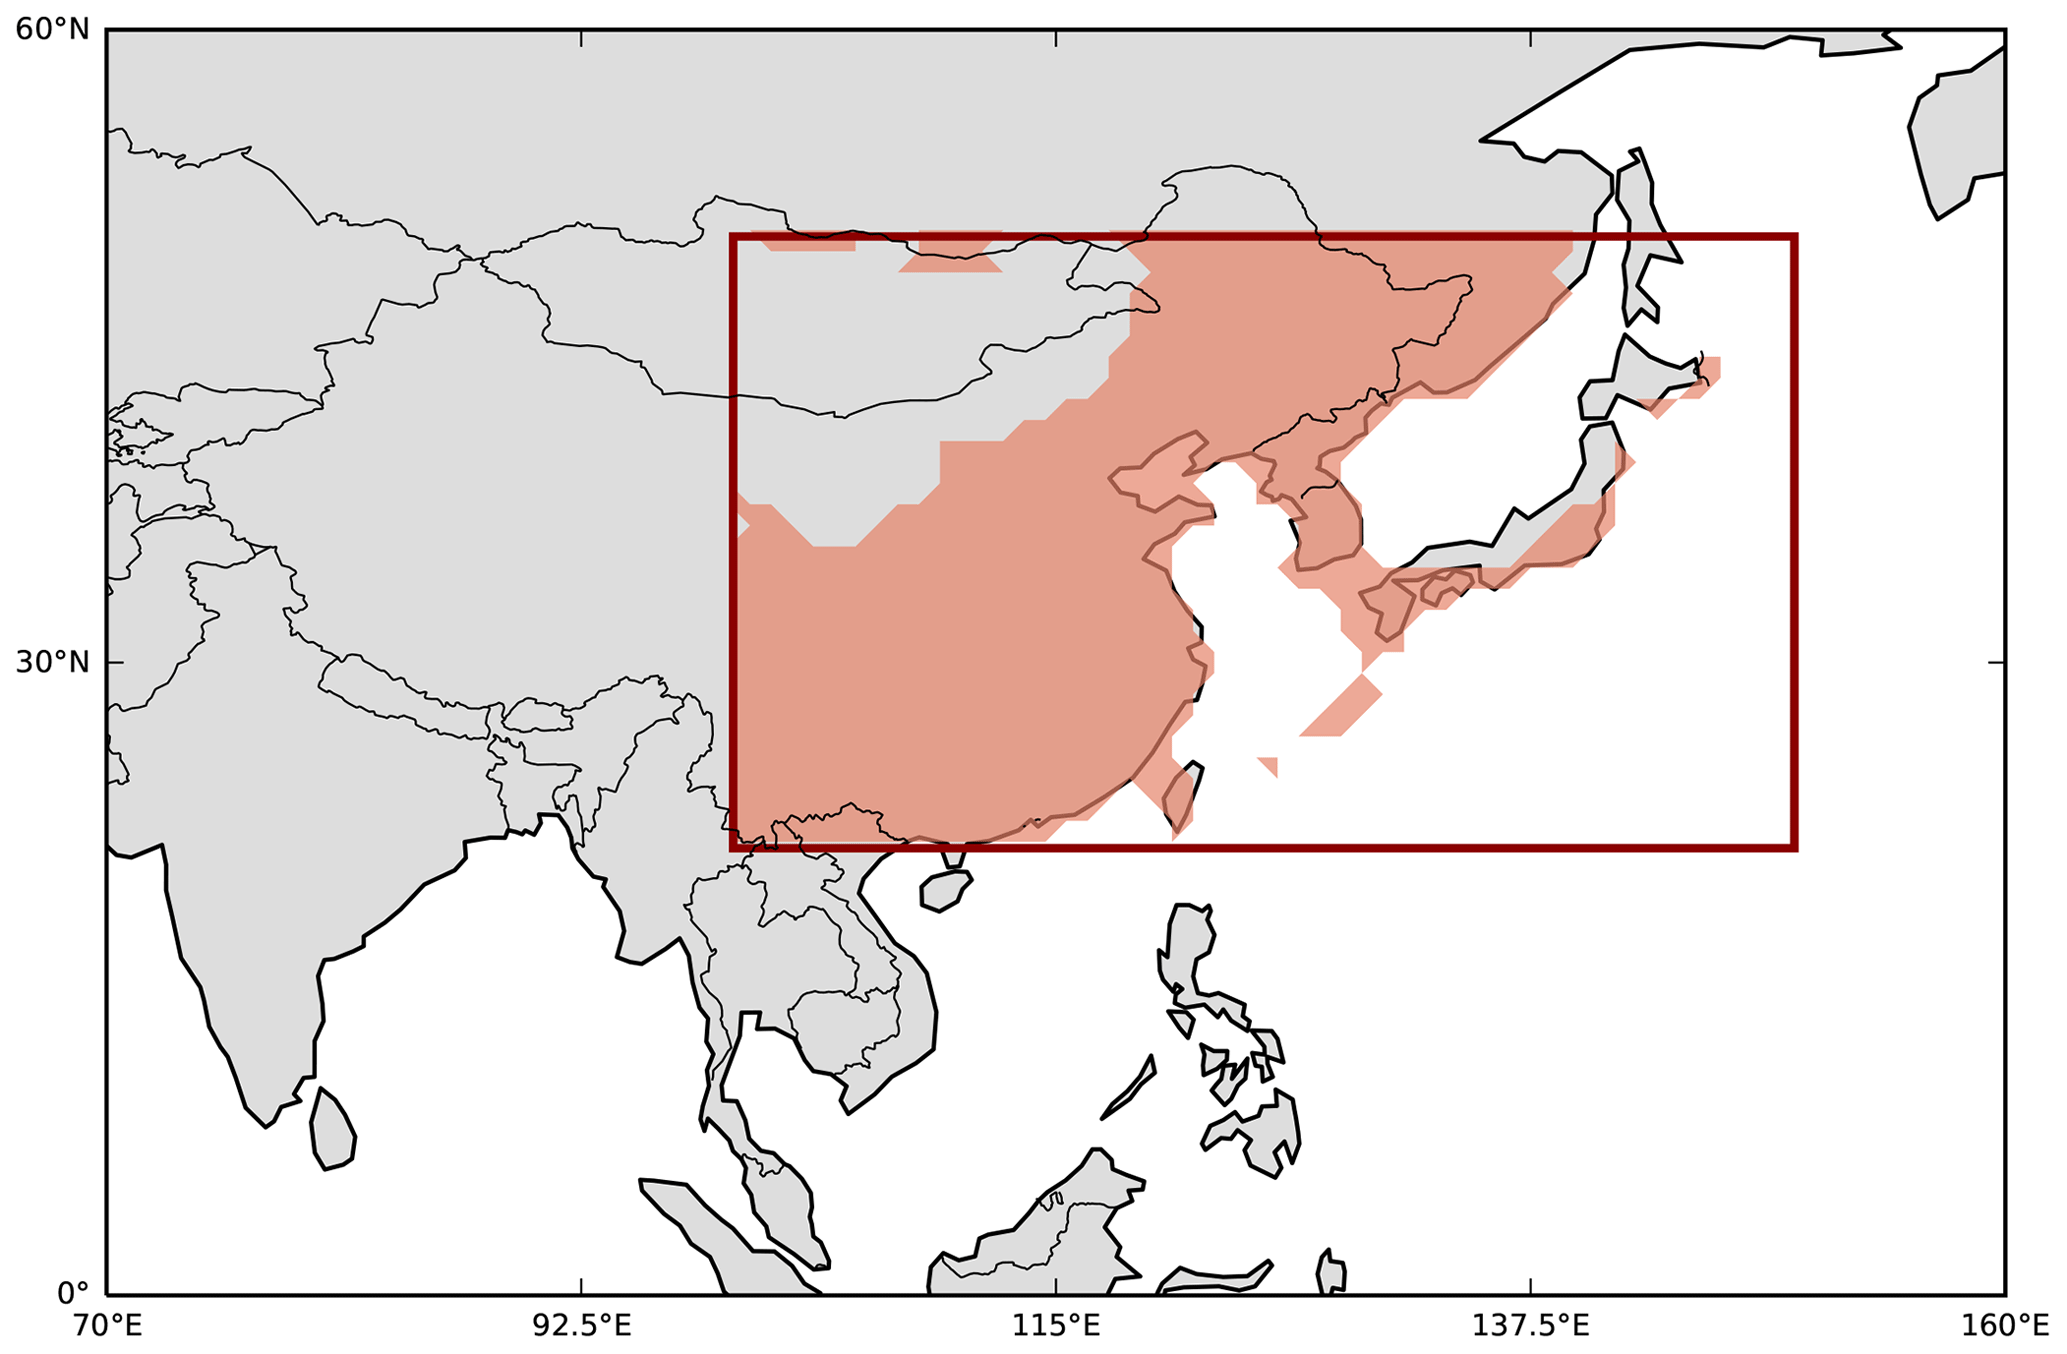
Figure A1East Asian summer monsoon area within 20–50° N and 100–150° E as covered in this study.
Table A1Overview of the model resolutions of the native model grids in which the 34 CMIP models were run. For the analysis in this study, the models have been remapped to a 1° horizontal grid.
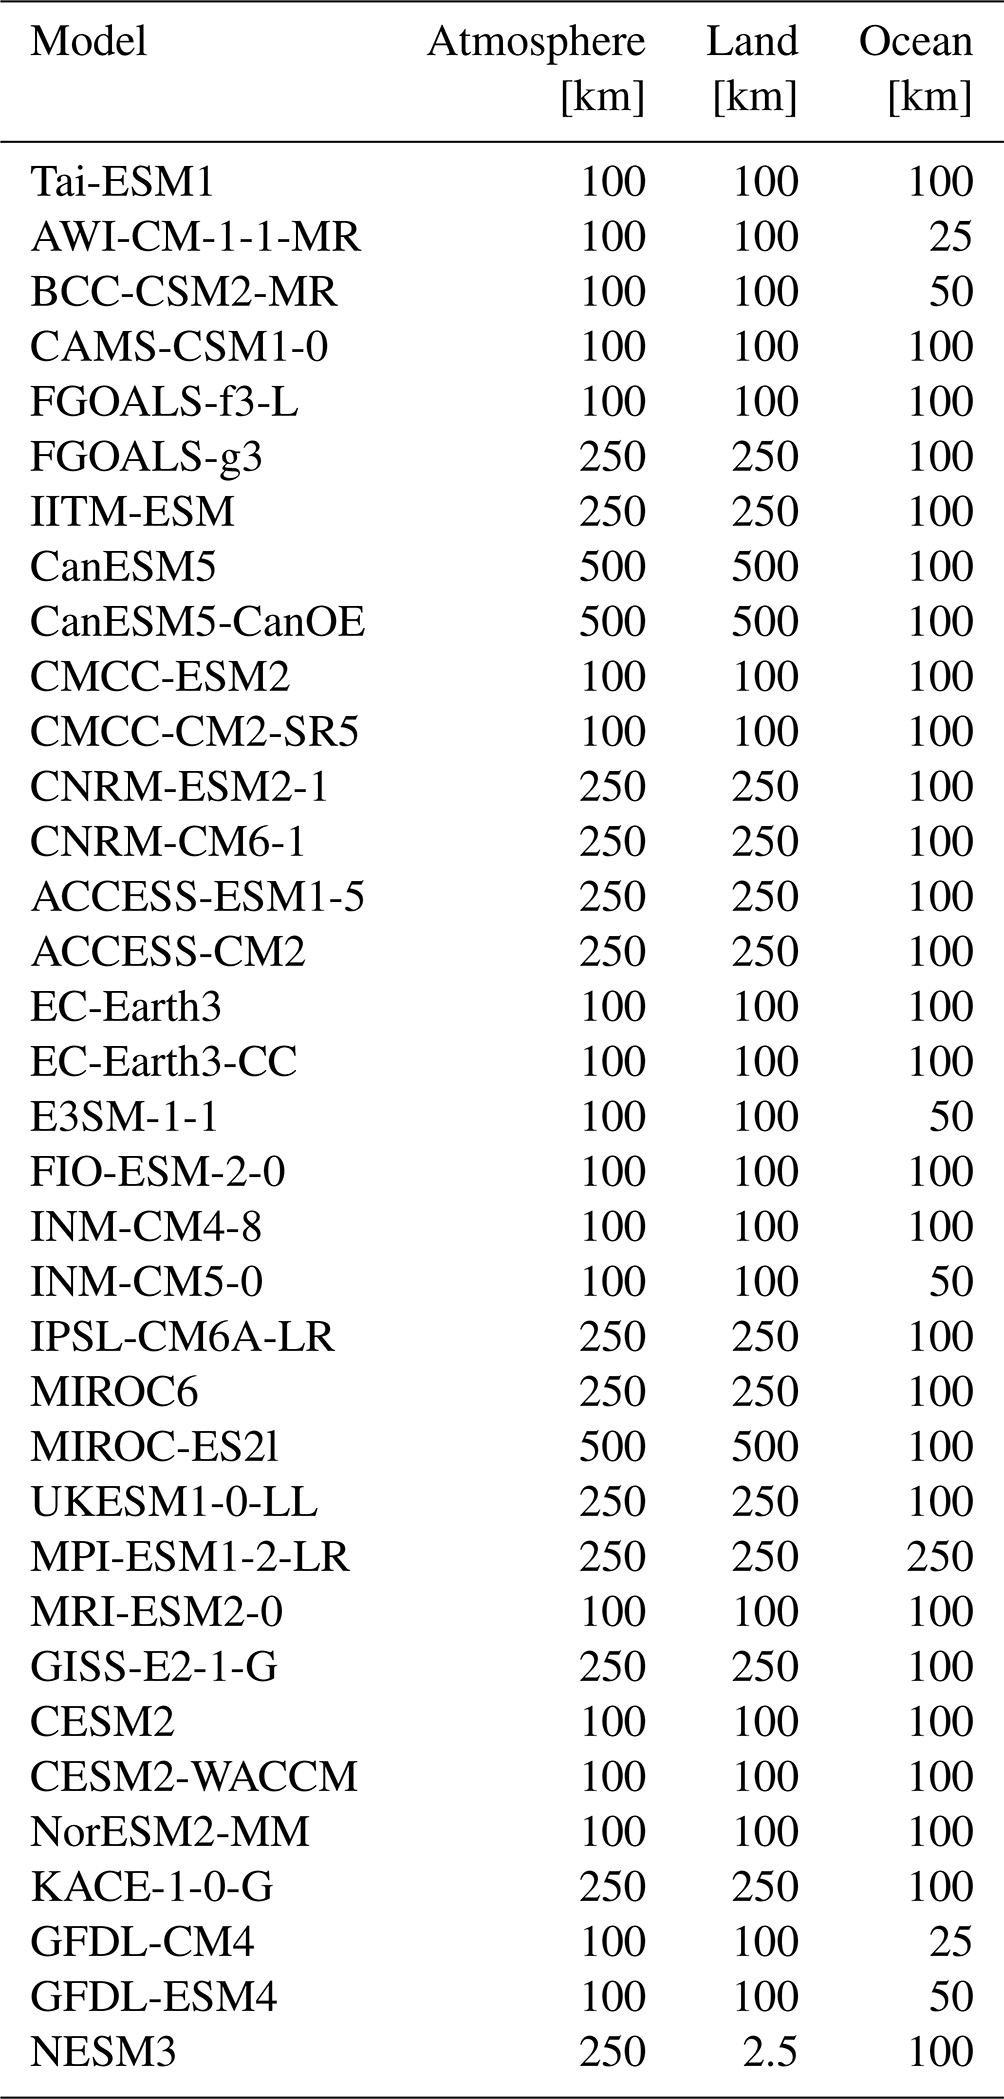
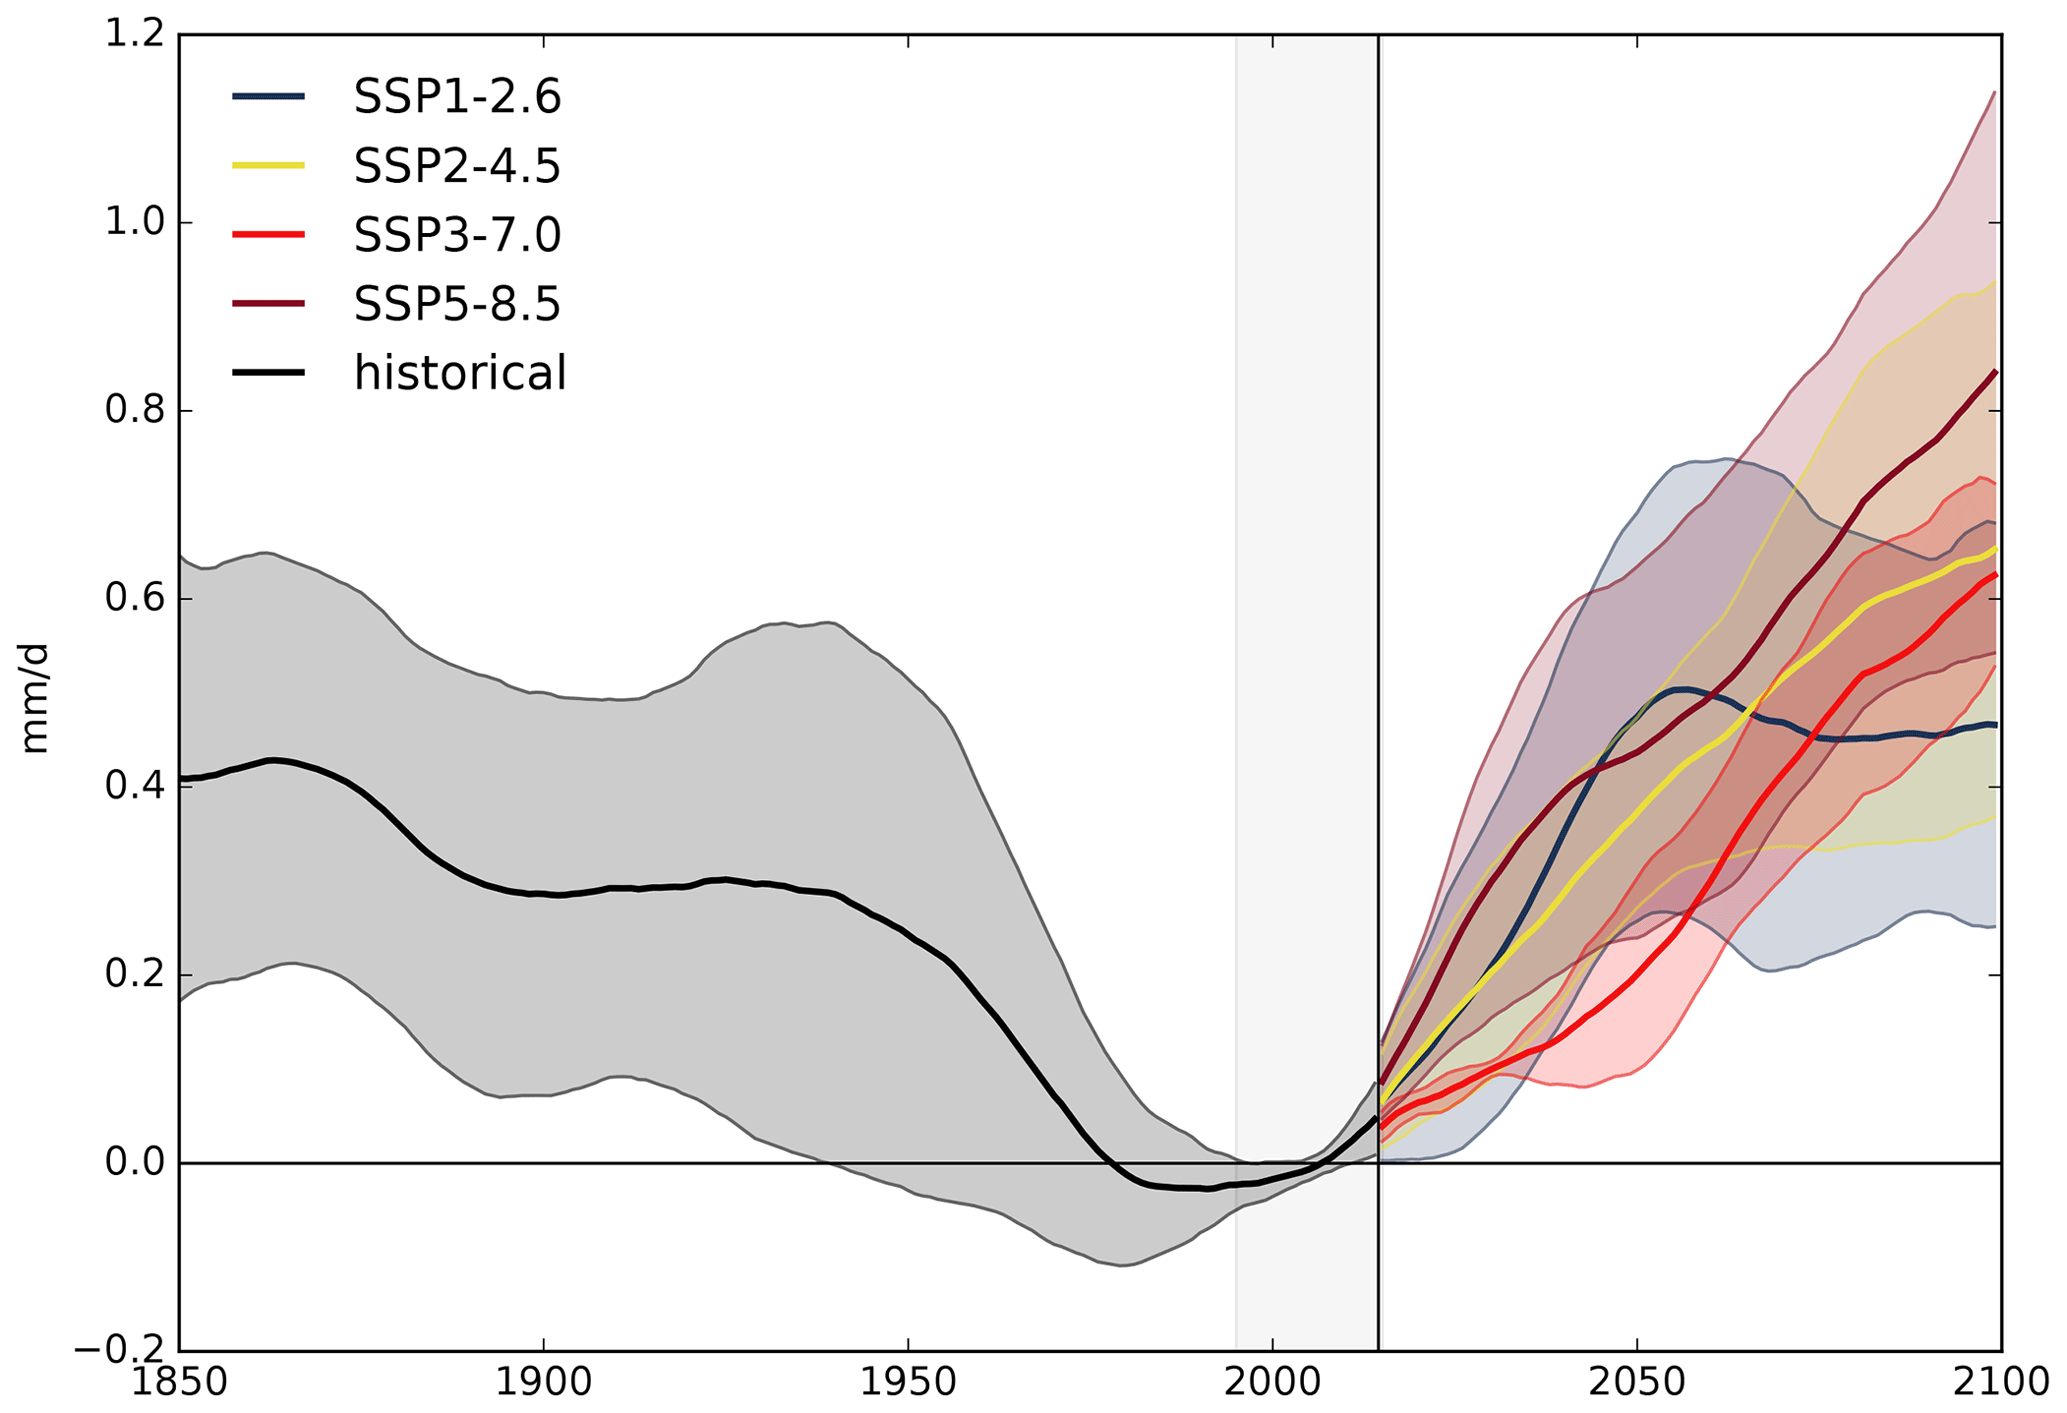
Figure A2Time series of EASM (mm d−1) for the period 1850–2100 based on the multi-model mean of the TOP6 models relative to the period 1995–2014. The time series for individual models is smoothed using a singular spectrum analysis with a window size of 20 years before calculating the multi-model mean. For the method, see Golyandina and Zhigljavsky (2013). The shading marks the range of plus or minus 1 standard deviation.
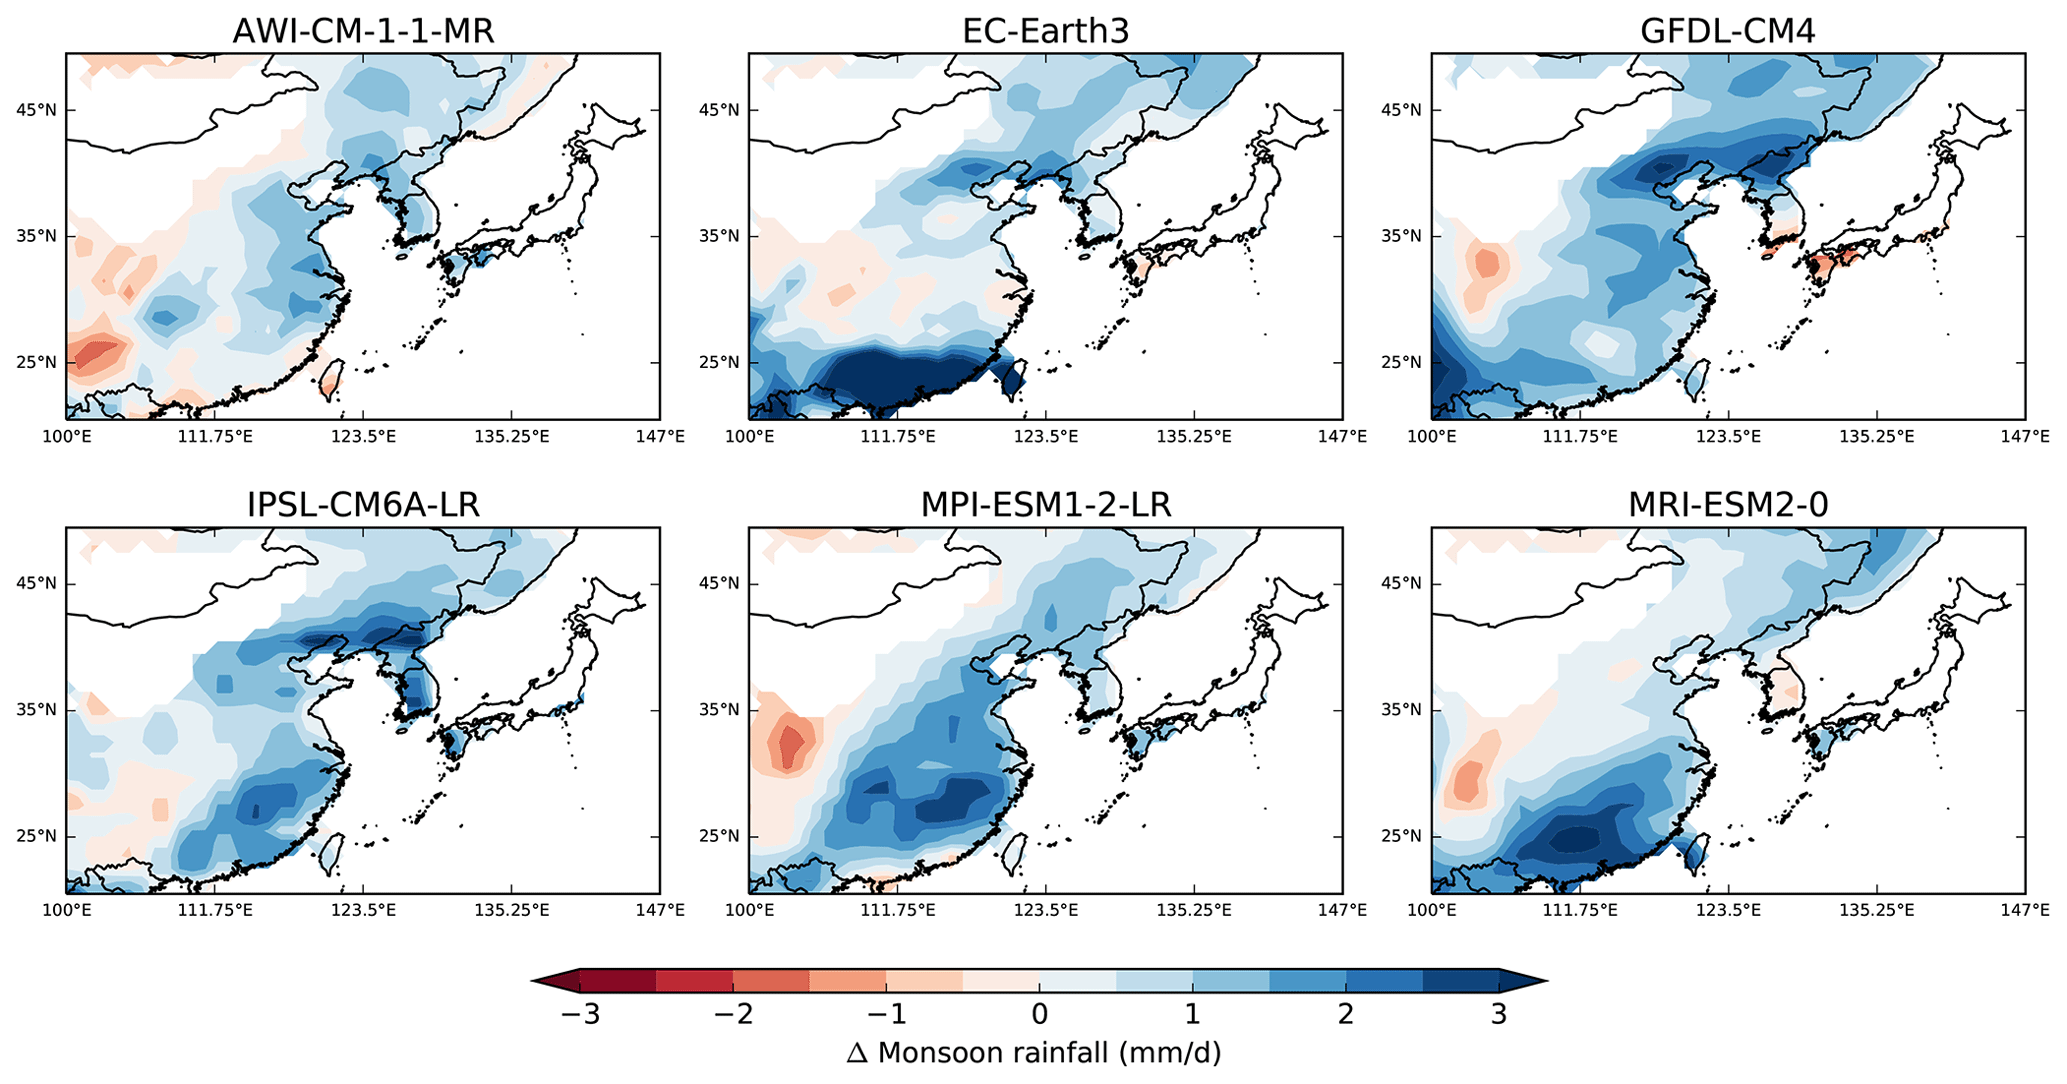
Figure A3Spatial changes in JJA rainfall between 2081–2100 and 1995–2014 under SSP5-8.5 for TOP6 models. The multi-model mean is shown in Fig. 9.
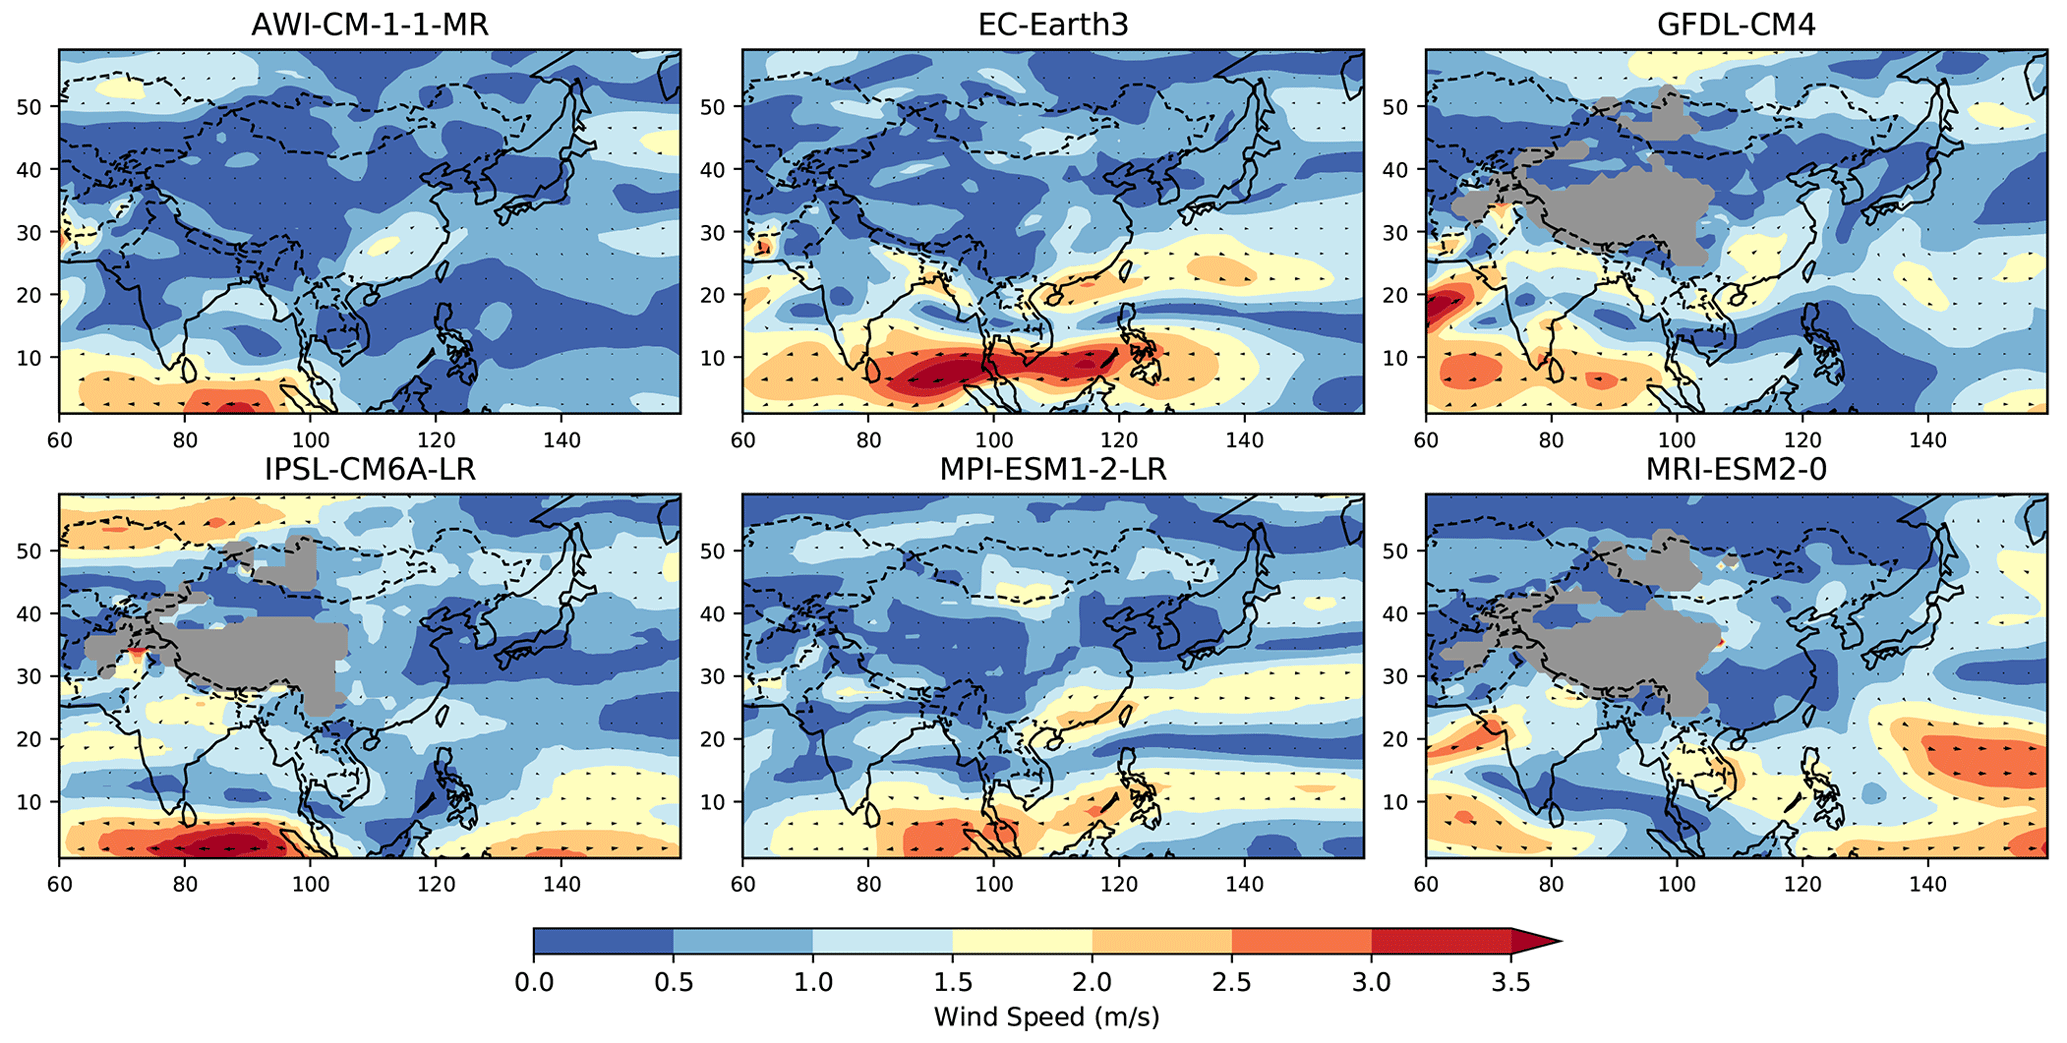
Figure A4Change in wind vectors (850 hPa) and wind speed (m s−1) in 2081–2100 (SSP5-8.5) compared to the reference period.
The datasets from CMIP6 simulations are available via the CMIP6 search interface: https://esgf-node.llnl.gov/search/cmip6/ (WCRP, 2024). The wind JRA-55 dataset is publicly available here: https://doi.org/10.5065/D60G3H5B (Japan Meteorological Agency, 2013). The code used to perform this analysis is available via the release of the respective GitHub repository on Zenodo: https://doi.org/10.5281/zenodo.13234609 (Katzenberger, 2024).
AL proposed the idea of this study. AK performed the analysis and wrote the paper. AK and AL discussed the results.
At least one of the (co-)authors is a member of the editorial board of Earth System Dynamics. The peer-review process was guided by an independent editor, and the authors have also no other competing interests to declare.
Publisher’s note: Copernicus Publications remains neutral with regard to jurisdictional claims made in the text, published maps, institutional affiliations, or any other geographical representation in this paper. While Copernicus Publications makes every effort to include appropriate place names, the final responsibility lies with the authors.
We acknowledge the World Climate Research Programme's Working Group on Coupled Modelling, which is responsible for CMIP, and we thank the climate modeling groups for producing their model output and making it available. In addition, we thank the Copernicus Climate Change Service for providing the WFDE5 reanalysis dataset.
This research has been supported by the Heinrich Boell Foundation who did not have any influence on the study design, the data analysis or the interpretation of the results (nor any other influence).
The article processing charges for this open-access publication were covered by the Potsdam Institute for Climate Impact Research (PIK).
This paper was edited by Roberta D'Agostino and reviewed by two anonymous referees.
Bayhaqi, A., Yoo, J., Jang, C. J., Kwon, M., and Kang, H.-W.: Near-Future Projection of Sea Surface Winds in Northwest Pacific Ocean Based on a CMIP6 Multi-Model Ensemble, Atmosphere, 15, 386, https://doi.org/10.3390/atmos15030386, 2024. a
Chen, H. and Sun, J.: Projected change in East Asian summer monsoon precipitation under RCP scenario, Meteorol. Atmos. Phys., 121, 55–77, https://doi.org/10.1007/s00703-013-0257-5, 2013. a, b, c
Chen, Z., Zhou, T., Zhang, L., Chen, X., Zhang, W., and Jiang, J.: Global land monsoon precipitation changes in CMIP6 projections, Geophys. Res. Lett., 47, e2019GL086902, https://doi.org/10.1029/2019GL086902, 2020. a
Endo, H., Kitoh, A., and Ueda, H.: A unique feature of the Asian summer monsoon response to global warming: The role of different land–sea thermal contrast change between the lower and upper troposphere, Sola, 14, 57–63, https://doi.org/10.2151/sola.2018-010, 2018. a, b
Golyandina, N. and Zhigljavsky, A.: Singular Spectrum Analysis for time series, Springer Science & Business Media, https://doi.org/10.1007/978-3-642-34913-3, 2013. a, b, c
Ha, K.-J., Heo, K.-Y., Lee, S.-S., Yun, K.-S., and Jhun, J.-G.: Variability in the East Asian monsoon: A review, Meteorol. Appl., 19, 200–215, https://doi.org/10.1002/met.1320, 2012. a, b, c
Ha, K.-J., Moon, S., Timmermann, A., and Kim, D.: Future changes of summer monsoon characteristics and evaporative demand over Asia in CMIP6 simulations, Geophys. Res. Lett., 47, e2020GL087492, https://doi.org/10.1029/2020GL087492, 2020. a
Huang, D., Liu, A., Zheng, Y., and Zhu, J.: Inter-Model Spread of the Simulated East Asian Summer Monsoon Rainfall and the Associated Atmospheric Circulations From the CMIP6 Models, J. Geophys. Res.-Atmos., 127, e2022JD037371, https://doi.org/10.1029/2022JD037371, 2022. a
Huang, D.-Q., Zhu, J., Zhang, Y.-C., and Huang, A.-N.: Uncertainties on the simulated summer precipitation over Eastern China from the CMIP5 models, J. Geophys. Res.-Atmos., 118, 9035–9047, https://doi.org/10.1002/jgrd.50695, 2013. a
Japan Meteorological Agency: JRA-55: Japanese 55-year Reanalysis, Monthly Means and Variances, NCAR Research Data Archive [data set], https://doi.org/10.5065/D60G3H5B, 2013. a, b
Jiang, D., Hu, D., Tian, Z., and Lang, X.: Differences between CMIP6 and CMIP5 models in simulating climate over China and the East Asian monsoon, Adv. Atmos. Sci., 37, 1102–1118, https://doi.org/10.1007/s00376-020-2034-y, 2020. a, b, c, d
Kai, T., Zhong-Wei, Y., Xue-Bin, Z., and Wen-Jie, D.: Simulation of precipitation in monsoon regions of China by CMIP3 models, Atmos. Ocean. Sc. Lett., 2, 194–200, https://doi.org/10.1080/16742834.2009.11446803, 2009. a
Katzenberger, A.: Code for Consistent increase of East Asian Summer Monsoon rainfall and its variability under climate change over China in CMIP6, Zenodo [code], https://doi.org/10.5281/zenodo.13234609, 2024. a
Katzenberger, A., Schewe, J., Pongratz, J., and Levermann, A.: Robust increase of Indian monsoon rainfall and its variability under future warming in CMIP6 models, Earth Syst. Dynam., 12, 367–386, https://doi.org/10.5194/esd-12-367-2021, 2021. a
Katzenberger, A., Levermann, A., Schewe, J., and Pongratz, J.: Intensification of very wet monsoon seasons in India under global warming, Geophys. Res. Lett., 49, e2022GL098856, https://doi.org/10.1029/2022GL098856, 2022. a
Kitoh, A., Endo, H., Krishna Kumar, K., Cavalcanti, I. F., Goswami, P., and Zhou, T.: Monsoons in a changing world: A regional perspective in a global context, J. Geophys. Res.-Atmos., 118, 3053–3065, https://doi.org/10.1002/jgrd.50258, 2013. a
Lee, D., Min, S.-K., Jin, J., Lee, J.-W., Cha, D.-H., Suh, M.-S., Ahn, J.-B., Hong, S.-Y., Kang, H.-S., and Joh, M.: Thermodynamic and dynamic contributions to future changes in summer precipitation over Northeast Asia and Korea: a multi-RCM study, Clim. Dynam., 49, 4121–4139, https://doi.org/10.1007/s00382-017-3566-4, 2017. a, b
Lee, J.-Y. and Wang, B.: Future change of global monsoon in the CMIP5, Clim. Dynam., 42, 101–119, https://doi.org/10.1007/s00382-012-1564-0, 2014. a
Lei, Y., Hoskins, B., and Slingo, J.: Exploring the interplay between natural decadal variability and anthropogenic climate change in summer rainfall over China. Part I: Observational evidence, J. Climate, 24, 4584–4599, https://doi.org/10.1175/2010JCLI3794.1, 2011. a
Li, J., Zhao, Y., Chen, D., Kang, Y., and Wang, H.: Future precipitation changes in three key sub-regions of East Asia: the roles of thermodynamics and dynamics, Clim. Dynam., 59, 1377–1398, https://doi.org/10.1007/s00382-021-06043-w, 2021. a, b, c, d
Li, X., Ting, M., Li, C., and Henderson, N.: Mechanisms of Asian Summer Monsoon Changes in Response to Anthropogenic Forcing in CMIP5 Models, J. Climate, 28, 4107–4125, https://doi.org/10.1175/jcli-d-14-00559.1, 2015. a, b
Lu, R. and Fu, Y.: Intensification of East Asian summer rainfall interannual variability in the twenty-first century simulated by 12 CMIP3 coupled models, J. Climate, 23, 3316–3331, https://doi.org/10.1175/2009JCLI3130.1, 2010. a, b
Masson-Delmotte, V., P., Zhai, A., Pirani, S. L., Connors, C., Péan, S., Berger, N., Caud, Y., Chen, L., Goldfarb, M. I., Gomis, M., Huang, K., Leitzell, E., Lonnoy, J. B. R., Matthews, T. K., Maycock, T., Waterfield, O., Yelekçi, R. Y., and Zhou, B.: IPCC: Climate Change 2021: The Physical Science Basis. Contribution of Working Group I to the Sixth Assessment Report of the Intergovernmental Panel on Climate Change, Cambridge University Press, https://doi.org/10.1017/9781009157896, 2021. a, b, c, d
Moon, S. and Ha, K.-J.: Future changes in monsoon duration and precipitation using CMIP6, npj Climate and Atmospheric Science, 3, 1–7, https://doi.org/10.1038/s41612-020-00151-w, 2020. a
O'Neill, B. C., Tebaldi, C., van Vuuren, D. P., Eyring, V., Friedlingstein, P., Hurtt, G., Knutti, R., Kriegler, E., Lamarque, J.-F., Lowe, J., Meehl, G. A., Moss, R., Riahi, K., and Sanderson, B. M.: The Scenario Model Intercomparison Project (ScenarioMIP) for CMIP6, Geosci. Model Dev., 9, 3461–3482, https://doi.org/10.5194/gmd-9-3461-2016, 2016. a
O'Neill, B. C., Kriegler, E., Ebi, K. L., Kemp-Benedict, E., Riahi, K., Rothman, D. S., van Ruijven, B. J., Van Vuuren, D. P., Birkmann, J., Kok, K., Levy, M., and Solecki, W.: The roads ahead: Narratives for shared socioeconomic pathways describing world futures in the 21st century, Global Environ. Change, 42, 169–180, https://doi.org/10.1016/j.gloenvcha.2015.01.004, 2017. a
Park, J., Kim, H., Wang, S.-Y. S., Jeong, J.-H., Lim, K.-S., LaPlante, M., and Yoon, J.-H.: Intensification of the East Asian summer monsoon lifecycle based on observation and CMIP6, Environ. Res. Lett., 15, 0940b9, https://doi.org/10.1088/1748-9326/ab9b3f, 2020. a
Qu, X., Huang, G., and Zhou, W.: Consistent responses of East Asian summer mean rainfall to global warming in CMIP5 simulations, Theor. Appl. Climatol., 117, 123–131, https://doi.org/10.1007/s00704-013-0995-9, 2014. a, b, c
Seo, K.-H., Ok, J., Son, J.-H., and Cha, D.-H.: Assessing future changes in the East Asian summer monsoon using CMIP5 coupled models, J. Climate, 26, 7662–7675, https://doi.org/10.1175/JCLI-D-12-00694.1, 2013. a, b, c, d, e, f
Tebaldi, C., Debeire, K., Eyring, V., Fischer, E., Fyfe, J., Friedlingstein, P., Knutti, R., Lowe, J., O'Neill, B., Sanderson, B., van Vuuren, D., Riahi, K., Meinshausen, M., Nicholls, Z., Tokarska, K. B., Hurtt, G., Kriegler, E., Lamarque, J.-F., Meehl, G., Moss, R., Bauer, S. E., Boucher, O., Brovkin, V., Byun, Y.-H., Dix, M., Gualdi, S., Guo, H., John, J. G., Kharin, S., Kim, Y., Koshiro, T., Ma, L., Olivié, D., Panickal, S., Qiao, F., Rong, X., Rosenbloom, N., Schupfner, M., Séférian, R., Sellar, A., Semmler, T., Shi, X., Song, Z., Steger, C., Stouffer, R., Swart, N., Tachiiri, K., Tang, Q., Tatebe, H., Voldoire, A., Volodin, E., Wyser, K., Xin, X., Yang, S., Yu, Y., and Ziehn, T.: Climate model projections from the Scenario Model Intercomparison Project (ScenarioMIP) of CMIP6, Earth Syst. Dynam., 12, 253–293, https://doi.org/10.5194/esd-12-253-2021, 2021. a
Van Vuuren, D. P., Kriegler, E., O'Neill, B. C., Ebi, K. L., Riahi, K., Carter, T. R., Edmonds, J., Hallegatte, S., Kram, T., Mathur, R., and Winkler, H.: A new scenario framework for climate change research: scenario matrix architecture, Clim. Change, 122, 373–386, https://doi.org/10.1007/s10584-013-0906-1, 2014. a
Volonté, A., Muetzelfeldt, M., Schiemann, R., Turner, A. G., and Klingaman, N.: Magnitude, scale, and dynamics of the 2020 mei-yu rains and floods over China, Adv. Atmos. Sci., 38, 2082–2096, https://doi.org/10.1007/s00376-021-1085-z, 2021. a
Wang, B., Yim, S.-Y., Lee, J.-Y., Liu, J., and Ha, K.-J.: Future change of Asian-Australian monsoon under RCP 4.5 anthropogenic warming scenario, Clim. Dynam., 42, 83–100, https://doi.org/10.1007/s00382-013-1769-x, 2014. a
Wang, B., Jin, C., and Liu, J.: Understanding future change of global monsoons projected by CMIP6 models, J. Climate, 33, 6471–6489, https://doi.org/10.1175/JCLI-D-19-0993.1, 2020. a
Wang, B. and Ho, L.: Rainy season of the Asian–Pacific summer monsoon, J. Climate, 15, 386–398, https://doi.org/10.1175/1520-0442(2002)015<0386:RSOTAP>2.0.CO;2, 2002. a, b, c
WCRP: CMIP6 data, https://esgf-node.llnl.gov/search/cmip6/, last access: 31 March 2024. a
Wilcox, L. J., Liu, Z., Samset, B. H., Hawkins, E., Lund, M. T., Nordling, K., Undorf, S., Bollasina, M., Ekman, A. M. L., Krishnan, S., Merikanto, J., and Turner, A. G.: Accelerated increases in global and Asian summer monsoon precipitation from future aerosol reductions, Atmos. Chem. Phys., 20, 11955–11977, https://doi.org/10.5194/acp-20-11955-2020, 2020. a
Xin, X., Wu, T., Zhang, J., Yao, J., and Fang, Y.: Comparison of CMIP6 and CMIP5 simulations of precipitation in China and the East Asian summer monsoon, Int. J. Climatol., 40, 6423–6440, https://doi.org/10.1002/joc.6590, 2020. a, b, c, d
Xue, D., Lu, J., Leung, L. R., Teng, H., Song, F., Zhou, T., and Zhang, Y.: Robust projection of East Asian summer monsoon rainfall based on dynamical modes of variability, Nat. Commun., 14, 3856, https://doi.org/10.1038/s41467-023-39460-y, 2023. a
Yihui, D., Yanju, L., and Yafang, S.: East Asian summer monsoon moisture transport belt and its impact on heavy rainfalls and floods in China, Adv. Water Sci., 31, 629–643, https://doi.org/10.14042/j.cnki.32.1309.2020.05.001, 2020. a
Yu, T., Chen, W., Gong, H., Feng, J., and Chen, S.: Comparisons between CMIP5 and CMIP6 models in simulations of the climatology and interannual variability of the east asian summer Monsoon, Clim. Dynam., 60, 2183–2198, https://doi.org/10.1007/s00382-022-06408-9, 2023. a, b
Ziese, M., Rauthe-Schöch, A., Becker, A., Finger, P., Rustemeier, E., and Schneider, U.: GPCC Full Data Daily Version 2020 at 1.0°: Daily Land-Surface Precipitation from Rain-Gauges built on GTS-based and Historic Data, GPCC at Deutscher Wetterdienst (DWD), https://doi.org/10.5676/DWD_GPCC/FD_D_V2020_100, 2020. a