the Creative Commons Attribution 4.0 License.
the Creative Commons Attribution 4.0 License.
 | 30 Jan 2024
Scaling artificial heat islands to enhance precipitation in the United Arab Emirates
Oliver Branch
Lisa Jach
Thomas Schwitalla
Kirsten Warrach-Sagi
Volker Wulfmeyer
Potential for regional climate engineering is gaining interest as a means of solving regional environmental problems like water scarcity and high temperatures. In the hyper-arid United Arab Emirates (UAE), water scarcity is reaching a crisis point due to high consumption and over-extraction and is being exacerbated by climate change. To counteract this problem, the UAE has conducted cloud-seeding operations and intensive desalination for many years but is now considering other means of increasing water resources. Very large “artificial black surfaces” (ABSs), made of black mesh, black-painted, or solar photovoltaic (PV) panels have been proposed as a means of enhancing convective precipitation via surface heating and amplification of vertical motion. Under the influence of the daily UAE sea breeze, this can lead to convection initiation under the right conditions. Currently it is not known how strong this rainfall enhancement would be or what scale of black surface would need to be employed. This study simulates the impacts at different ABS scales using the WRF-Noah-MP model chain and investigates impacts on precipitation quantities and underlying convective processes. Simulations of five square ABSs of 10, 20, 30, 40, and 50 km sizes were made on four 1 d cases, each for a period of 24 h. These were compared with a Control model run, with no land use change, to quantify impacts. The ABSs themselves were simulated by altering land cover static data and prescribing a unique set of land surface parameters like albedo and roughness length.
On all 4 d, rainfall is enhanced by low-albedo surfaces of 20 km or larger, primarily through a reduction of convection inhibition and production of convergence lines and buoyant updrafts. The 10 km square ABS had very little impact. From 20 km upwards there is a strong scale dependency, with ABS size influencing the strength of convective processes and volume of rainfall. In terms of rainfall increases, 20 km produces a mean rainfall increase over the Control simulation of 571 616 m3 d−1, with the other sizes as follows: 30 km (∼ 1 million m3 d−1), 40 km (∼ 1.5 million m3 d−1), and 50 km (∼ 2.3 million m3 d−1). If we assume that such rainfall events happen only on 10 d in a year, this would equate to respective annual water supplies for > 31 000, > 50 000, > 79 000, and > 125 000 extra people yr−1 at UAE per capita consumption rates. Thus, artificial heat islands made from black panels or solar PV offer a means of enhancing rainfall in arid regions like the UAE and should be made a high priority for further research.
- Article
(13277 KB) - Full-text XML
- BibTeX
- EndNote


Regional crises like high temperatures, drought, wildfires, flooding, and water scarcity are becoming more severe, and the potential for regional climate engineering is gaining interest. Examples are marine cloud seeding to reduce coral bleaching (Latham et al., 2013, 2014; Tollefson, 2021), deliberate albedo management through agricultural landscape planning, and breeding of higher-albedo crops (Doughty et al., 2011; Kala et al., 2022; Ridgwell et al., 2009). The general aim of these studies was to investigate the potential for regional cooling of temperatures. The deliberate increase in albedo falls under the geoengineering category of terrestrial solar radiation management (SRM). Geoengineering impacts are generally intended to be global in scale, but regional geoengineering actions may also trigger regional impacts (Quaas et al., 2016; Seneviratne et al., 2018) such as reduction of temperatures (Kala and Hirsch, 2020), whilst at the same time contributing to reduced global forcing (Carrer et al., 2018; Sieber et al., 2022).
Modified albedo could also influence precipitation in arid regions. In the Middle Eastern gulf region, water scarcity under a changing climate is reaching a crisis point, and diverse methods for obtaining water are now considered, including cloud seeding (e.g., Al Hosari et al., 2021) and importation of water or even icebergs (Condron, 2023; Abdulrahman, 2020).
Other avenues of increasing freshwater may also be possible. Several of our previous studies show that desert xerophyte plantations can enhance rainfall via canopy heating (Becker et al., 2013; Branch et al., 2014; Branch and Wulfmeyer, 2019; Wulfmeyer et al., 2014), facilitated by the advection of coastal marine moisture. Branch et al. (2014) measured albedos of 0.17 and 0.12 for jatropha and jojoba plants, as well as the surrounding desert ∼ 0.3, leading to temperatures up to 4 ∘C higher than the surrounding desert (see also Saaroni et al., 2004). A subsequent model simulation of jojoba plantations reproduced similar differential heating and an associated increase in cloud development and convection initiation (CI) (Branch and Wulfmeyer, 2019). A related method was proposed by Black and Tarmy (1963), who claimed a similar effect from asphalt patches, and defined relations between vertical updraft penetration and patch length. Asphalt is not likely to be desirable in rural areas, but presumably solid or mesh black panels would also work and be more easily de-installed. Panels could be coated with black paint with an albedo of ∼ 0.05 (typical for black paint) or even with specialist coatings of < 0.01 albedo (Theocharous et al., 2014). Other surfaces which may modify weather are solar photovoltaic (PV) panels (Li et al., 2018; Lu et al., 2021; Mostamandi et al., 2022). These are typically of monocrystalline or polycrystalline type, with low albedos of between ∼ 0.04 (Nemet, 2009) and ∼ 0.1 (Protogeropolous and Zachariou, 2010). The latter study found that albedo values can increase with high zenith angles due to glare effects though. With solar PV, one must also account for the amount of shortwave radiation converted to electrical power, which may lead to modified skin temperatures, longwave fluxes, and net radiation. If a reduction in net radiation occurs, there would be less energy available for sensible heating. The net total “loss” of shortwave radiation can be expressed as an effective albedo: , where δ and ε are reflectivity (albedo) and conversion efficiency, respectively (Taha, 2013). PV efficiency is typically only ∼ 10 %–20 %, with much of the radiation transformed into heat (Taha, 2013), thereby offering potential for rainfall enhancement if implemented on a large spatial scale. Assuming the lowest albedo of 0.04 and panel efficiency of 0.1–0.15, this would yield effective albedo (Aeff) values of 0.14 and 0.19, i.e., similar to jojoba and jatropha. Although solar PV panels may be a suitable subject for future research into rainfall enhancement, this study focuses on the simulation of generic black-painted panels with a set of prescribed parameters to describe the likely land surface properties of such a surface. In this study we use the term “artificial black surfaces” (ABSs) for these panels.
When comparing the potential for ABSs and plantations to modify weather it is important to consider differences in surface characteristics. ABSs are likely to have lower albedo than plants, zero leaf transpiration, and different roughness characteristics (depending on panel material and geometry), as well as dissimilar under-panel shading and longwave and ground heat fluxes. Taken together, these may produce unique land–atmosphere interactions that must be investigated, potentially with model simulations. An ensemble of simulations could provide insights into impacts on convective processes and the influence of ABS scale.
In terms of convective processes, there may be some similarities with the urban heat island (UHI) effect, and there is a range of UHI process studies using analytical methods (e.g., Fan et al., 2016; Han and Baik, 2008; Hidalgo et al., 2010; Lee and Olfe, 1974; Lee et al., 2012), laboratory experiments (e.g., Cenedese and Monti, 2003; Jie Lu et al., 1997), and modeling and/or observational studies (Stewart et al., 2021; Zhang et al., 2004). Some studies include the interactions between UHIs and sea breezes (e.g., Cenedese and Monti, 2003; Freitas et al., 2007; Zhang and Wang, 2021) and found interactions between them, particularly for convection. For instance, Freitas et al. (2007) found that an urban heat island (UHI) formed convergence zones in a city, accelerating the sea-breeze front toward the city center. The relevance of this interaction will become apparent later in this study on artificial heat islands. However, there are some dissimilarities between urban areas and ABSs too. Urban heating often develops later in the day due to urban heat storage (Soltani and Sharifi 2017), whereas plantation heating occurs and dissipates earlier (Branch et al., 2014). The heterogeneous horizontal and vertical structure of cities would also differ from flat, homogeneous ABS panels at heights of ∼ 1–2 m. Additionally, cities often contain green areas or water bodies, which may produce more spatially heterogeneous atmospheric exchanges (Chrysoulakis et al., 2018; Offerle et al., 2005; Voogt and Oke, 2003). Urban areas are often simulated with complex urban models (see, e.g., Salamanca et al., 2018; Vogel and Afshari, 2020), but given the more homogeneous structure of ABSs, a more simplified approach may be taken.
We employ a mesoscale model case-study approach to investigate scale-dependent ABS impacts on precipitation and convective processes. The structure of the work is as follows: the simulation strategy, weather conditions, and case selection are presented in the “Materials and methods” section. In the “Results and discussion” section, we present impacts on precipitation and convective processes, as well as how we applied a thermodynamic feedback index to investigate predictive potential (similarly to Branch and Wulfmeyer, 2019). Finally, in the “Summary and outlook” section we put results in context and discuss wider implications.
2.1 Model configuration
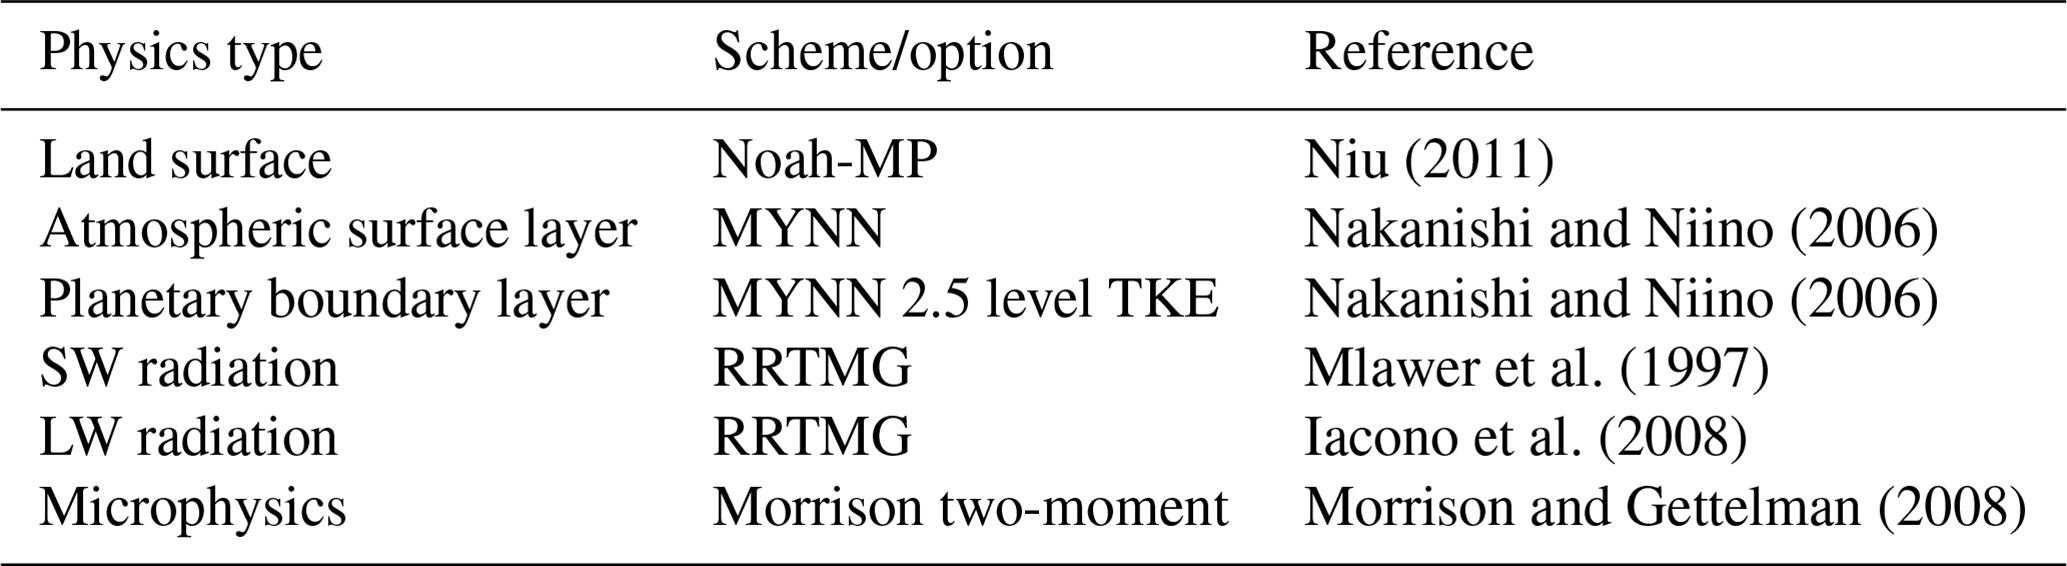
Simulations were carried out with the Weather Research and Forecasting (WRF) model (V4.2.1, Powers et al., 2017; Skamarock et al., 2019). WRF has been used in the Middle East region for numerous studies on model evaluation and processes (Branch et al., 2021; Fonseca et al., 2020, 2022; Valappil et al., 2020; Wehbe et al., 2019; Nelli et al., 2020; Temimi et al., 2020; Schwitalla et al., 2020), as well as rainfall modification (Mostamandi et al., 2022; Wulfmeyer et al., 2014; Branch and Wulfmeyer, 2019). Here, we use the same domain, resolution, and configuration as Branch et al. (2021), who evaluated the reproduction of 2 m temperature and humidity by WRF (V3.8.1) when compared to 48 surface weather stations. The results over four seasons were satisfactory, providing a good basis for using this model at the same scale. Here we used an updated version of WRF (V4.2.1) and make the assumption that the model performance has not deteriorated with the model updates. Indeed, Fonseca et al. (2022) assessed the ability of WRF V4 to reproduce cloud and convective cell spatial distributions for the purpose of cloud-seeding operations, with satisfactory results. This adds some confidence in the reproduction of convective processes in the UAE by WRF V4, as used within this study. The updated version of WRF was used to take advantage of updates to the Mellor–Yamada–Nakanishi–Niino (MYNN) planetary boundary layer (PBL), surface layer (MYNN), dynamics, and land surface schemes, as well as water vapor mixing ratio (Q−2 m) diagnostics. The model is being run at a 2.7 km grid increment; this lies in the so-called “convection-permitting” (CP) scale range (generally < 4 km), which allows convection to be simulated explicitly and not parameterized. Table 1 shows the selected physics schemes.
Table 1Selected physics schemes used on WRF for the simulations.
2.2 Domain and grid configuration
Figure 1a shows the model domain (dotted line) covering the whole of the UAE on the northeastern coast of the Arabian Peninsula, plotted on terrain height. The grid increment is based on a latitude–longitude geographic coordinate system, spanning 43.275 to 65.725∘ E and 14.775 to 32.225∘ N with a spacing of 0.025∘ (Δx 2.779 km). This grid spacing provides a good representation of convective processes and landscape structure, whilst optimizing computational demands for running numerous model realizations. The model grid has horizontal dimensions of 899 (east–west) × 699 (north–south) cells and 100 vertical levels. The model levels were configured such that typical boundary layer depths contains at least 25 levels, and the center of the lowest model level is ∼ 15 m above ground level (a.g.l.). A large domain was used to capture the prevailing northerly winds and sea breeze. Large-scale forcing data were retrieved from the European Centre for Medium-Range Weather Forecasts (ECMWF) Integrated Forecasting System (IFS) in the form of 6-hourly operational analysis model-level data on the 41r1 cycle (Δx 0.125∘) grid. Soil moisture and temperatures are provided by the model, which then assimilates satellite data (Albergel et al., 2012) into the land surface model HTESSEL (Balsamo et al., 2009). The ECMWF forcing data are only used to provide the lateral boundary and initial conditions for WRF-Noah-MP, which then itself computes the evolving conditions within the model domain. The only exception to this is the ingestion of OSTIA sea surface temperature (SST) data (Δx ∘, Donlon et al., 2012), which are re-updated within the domain every 12 h (00:00 and 12:00 UTC). This is likely to be very beneficial for simulating the sea breeze.
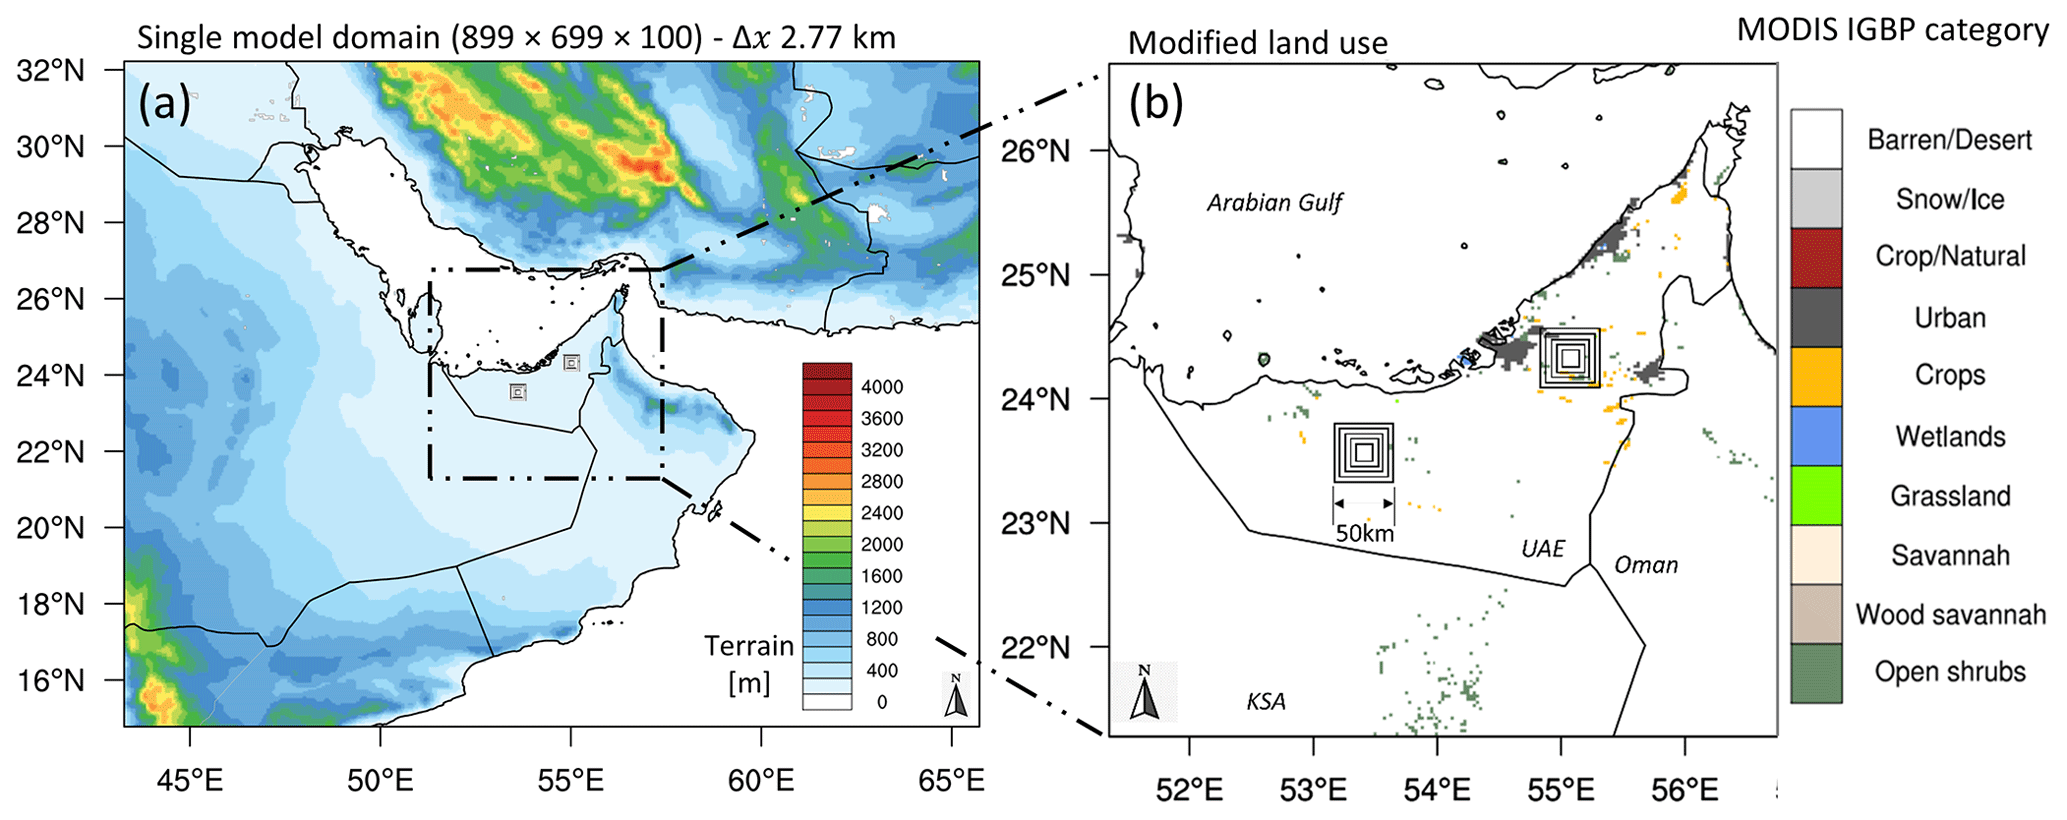
Figure 1WRF model domain for all simulations and the different scenarios used. Panel (a) shows the terrain over the northern Arabian Peninsula and the inset model domain (2498 × 1942 km) centered on the United Arab Emirates (UAE) (dashed rectangle). Panel (b) is the full extent of the model domain (Δx 2779 m) showing MODIS IGBP land cover data. Also shown here are the five artificial surface scenarios used in the form of pairs of different-sized squares (50 × 50, 40 × 40, 30 × 30, 20 × 20, and 10 × 10 km).
2.3 Modeling strategy and ABS simulation
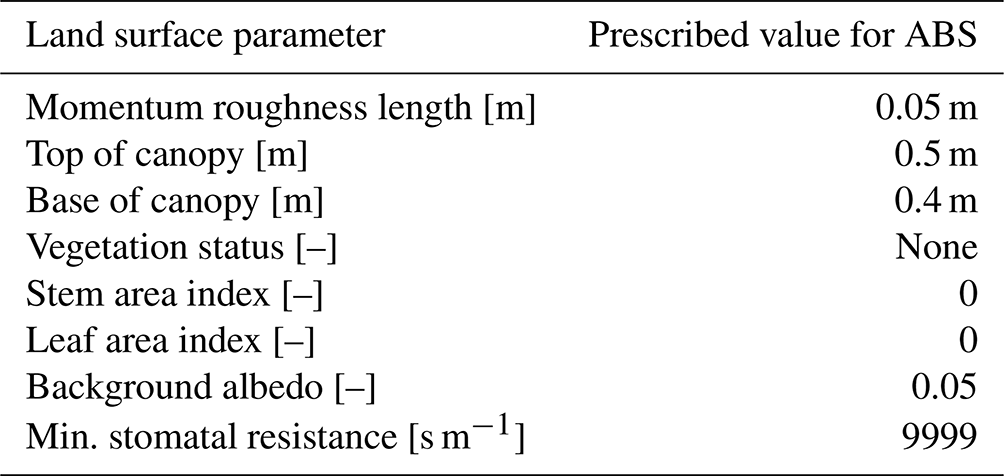
The ABS simulations are based on an idealized panel of low roughness length and a low albedo (0.05), which aligns more or less with acrylic black paint (see Table 2 for all parameters).
We simulated five separate ABS scenarios with sizes 10 × 10, 20 × 20, 30 × 30, 40 × 40, and 50 × 50 km, with two ABSs in each scenario to assess impacts in two locations (east and west). The ABD zones were input into WRF as modifications of the land cover static data (Fig. 1b). The ABS centers were collocated to maximize comparability, spaced some distance apart (> 60 km) to minimize the influence between them, and placed > 50 km from the coast to investigate initial impacts away from the sharp coastal temperature–humidity gradients. All scenarios were compared with a Control simulation, i.e., no land use change, to quantify ABS impacts and also to characterize the weather conditions. Each of the four case studies was run for a 24 h period (00:00 to 00:00 UTC).
Table 2Land surface parameters chosen to represent a flat black surface (10 cm thick) 50 cm off the ground.
2.4 Case selection
The UAE summer (June, July, and August – JJA) climate is characterized by high temperatures and low precipitation, influenced by subtropical subsidence and inversions. Occasionally though, southerly monsoon flows can transport moisture to the eastern UAE (Böer, 1997; Schwitalla et al., 2020), causing sporadic convection (Branch et al., 2020). The prevailing JJA winds are northerly, so the Arabian Gulf has a strong influence on the weather. The coastal Arabian Gulf is relatively shallow (maximum depth ∼ 90 m) and heats rapidly, with SSTs often > 30 ∘C (Al Azhar et al., 2016). Warm sea breezes reach the coast around midday (local time – LT; Eager et al., 2008) and reach the ABS areas typically around 14:00 LT. Nevertheless, deep convection only occurs regularly in the eastern Al Hajar Mountains. The more westerly desert plains are in general extremely arid, dominated by regional subsidence and capping inversions (see Branch et al., 2020, for regional convection initiation statistics). These inversions must be overcome by any deliberate albedo modification.
Our aim was to observe strong impacts, so we selected a season in which impacts are most likely (summer) and days with unstable convective conditions during this season. It was assumed that the selected year should be representative of the general climate in order to extrapolate from our results, but for the individual case studies, we selected those with partially unstable weather conditions to increase the likelihood of impacts. We elected to do the simulations in JJA 2015 to coincide with Branch et al. (2021), who found this season to be representative in terms of the long-term climate. Summertime was selected because strong impacts were observed during this season (e.g., Branch and Wulfmeyer, 2019).
In this study we selected four 1 d case studies. For each of these days, we have simulated five ABS scenarios (10, 20, 30, 40, 50 km squares) and a Control simulation for a total period of 24 h (00:00–00:00 UTC). We illustrate the respective weather conditions for our four selected cases in Figs. 2 and 3 (from Control) to highlight the likelihood of impacts. Figure 2 shows skew-T diagrams at two time steps – 06:00 and 10:00 UTC (LT = UTC + 4). Typical convection initiation (CI) onset times in the UAE are ∼ 07:30–09:30 UTC (Branch et al., 2020). The first three rows (18, 24, 25 July) are soundings over the west ABS, and the last row (27 July) is the east ABS (the reason relates to observed impacts – explained later in “Results and discussion”). Figure 3 shows a horizontal perspective of convective available potential energy (CAPE), convective inhibition (CIN), and 10 m winds (10:00 UTC). The sea breeze is evident in both figures, arriving at the ABS at ∼ 09:00–10:00 UTC. In Fig. 2, surface winds at 06:00 UTC are strong and north-northeasterly on 18, 24, and 25 July (panels a, c, and e). By 10:00 UTC, these winds swing northwards and also toward greater height (850 hPa) as the breeze strengthens. On 27 July winds are south to westerly over the east ABS and remain so at 10:00.
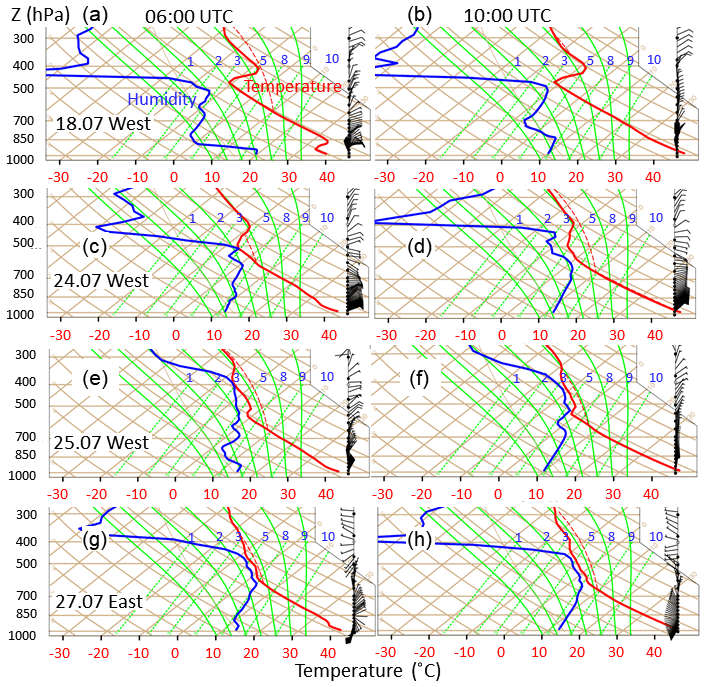
Figure 2Skew-T plots showing thermodynamic profiles for four cases to show pre-convective conditions. Left-hand blue curves represent vapor mixing ratio (reference to isohumes) and dew point (isotherms). Isohumes are dotted green lines rising left to right (values marked in blue, g kg−1). Red curves show temperature (red text on x axis, ∘C). CAPE is the area bounded by the dotted red line and the vertical temperature profile. Horizontal isobars are constant pressure (hPa). Dry adiabats are brown isolines rising right to left. Moist adiabats are solid green lines rising right to left. Soundings are from a single grid cell in each WRF Control run, corresponding to the center of the east (27 July) or west ABS (18, 24, 25 July). The choice of location is discussed later. On the right are wind barbs. The east sounding is located at 24.341∘ N, 55.061∘ E and the west sounding is at 23.584∘ N, 53.388∘ E.
In Fig. 3, the northerly sea breeze is evident, particularly to the west. In the east, conditions vary more with influence from the Gulf of Oman, with wind confluence from these two gulfs occurring (e.g., 27 July, Fig. 3d); sometimes the winds from one direction dominate the other, or at other times more southerly winds prevail.
In Fig. 2, 06:00 shows stable temperature layers at 900–850 hPa, which can inhibit convection. On 18 and 27 July these are more like inversions, whereas on 24 and 25 July it is more unstable. By 10:00 the stable layers and inversions disappear due to increased mixing. In all cases, the 10:00 temperature profiles exceed a conditionally unstable state (∼ dry adiabatic lapse rate). In Fig. 3, the sea breeze brings high CAPE (> ∼ 700 J kg−1, lower panels) and lower CIN (< ∼ 50 J kg−1) (lower panels). On 18, 24, and 25 July, this influx is more apparent to the west. On 27 July, it occurs all along the coast. In Fig. 2 (06:00), surface temperatures are already high (≥ 40 ∘C) and increase further by 10:00. Moisture is more variable, with some 06:00 stratification particularly on 18 July, which has a dry layer above 900 hPa. None of the days are overly humid, and values reach only 9–10 g kg−1. As expected, moisture is also well-mixed by 10:00, with the exception of 18 July which remains dry above 900 hPa. We may expect this case to have only weak impacts.
In summary, all cases are moderately unstable and exhibit a wave of reduced CIN passing over the ABS. CIN may be a defining constraint, and even when CAPE is only moderate (e.g., 27 July), a low CIN may still permit CI.
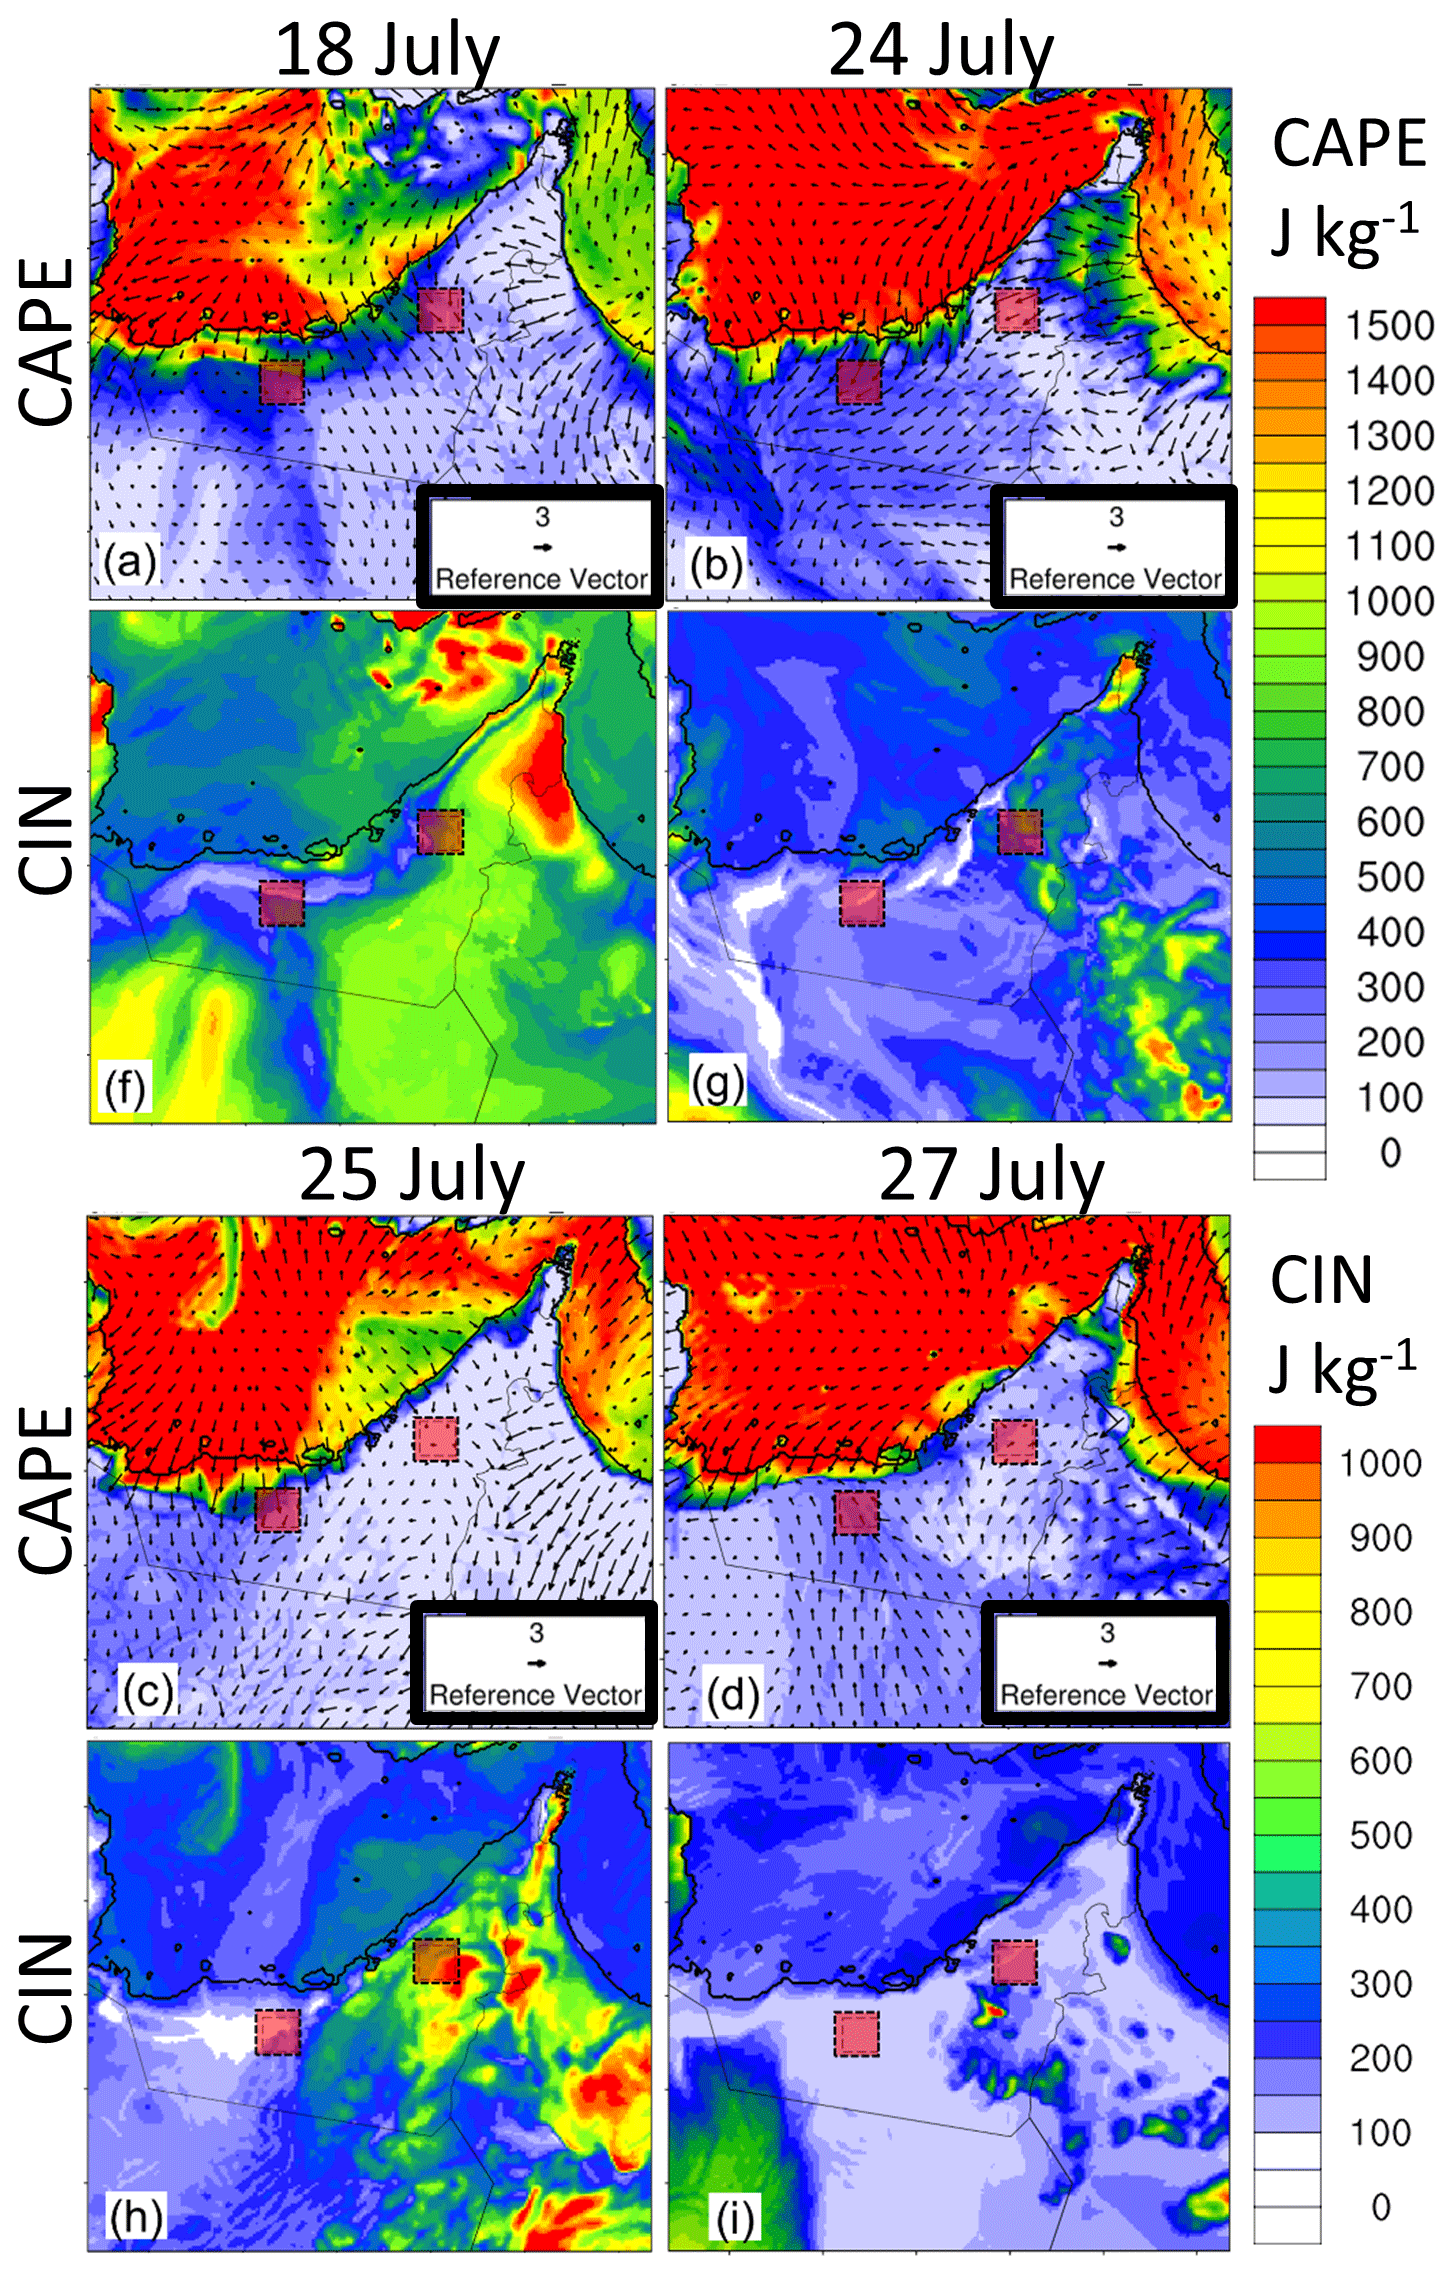
Figure 3Control thermodynamic conditions at 10:00 (UTC) during the four case studies, with red boxes to show the relative position of the ABS. The top row shows convective available potential energy (CAPE, J kg−1), 10 m wind vectors, and a box showing the vector reference length for 3 m s−1 (a). The bottom row shows convective inhibition (CIN, J kg−1). These conditions were used to investigate the daily sea-breeze timing and select our case studies.
3.1 Precipitation
We first examine precipitation impacts (in mm d−1 or in m3 for volumes). During analysis, we imposed two constraints. Firstly, we apply a commonly used filter of 1 mm d−1 to remove model drizzle (Frei et al., 2003). Secondly, we disregarded all rainfall beyond a certain distance from the ABS to ensure that differences are caused by physical processes and not numerical errors as discussed by Ancell et al. (2018), which can travel at speeds > 3600 km h−1 and bias the results of impact studies. We selected a radius of 90 km from the ABS center as a reasonable distance with respect to typical advection velocity and excluded precipitation from outside these circles. This radius is somewhat arbitrary and it is possible that some precipitation impacts extend beyond the perimeter, but it is equivalent for all scenarios.
Precipitation impacts are quantified in Figs. 4 and 5. Figure 4 shows 24 h accumulated precipitation for four scenarios (Control, 10, 30, and 50 km). There is an increase in rainfall coverage and maximum rain rates (blue to red) in all four cases when moving from Control > 10 > 30 > 50 km (strongest impacts are marked with red circles). In the first three cases (18–25 July) significant impacts occur around the west ABS, but on 27 July, impacts occur near the east ABS – this is the reason for our choice of sounding locations in Fig. 2. The impact is weakest on 18 July, which is not surprising given the inversion and dry layer. We also discuss later how this relates to the convection onset time. What is clear is that much of the increase in rainfall occurs outside the square ABS perimeters, mainly on the lee side with respect to wind direction.
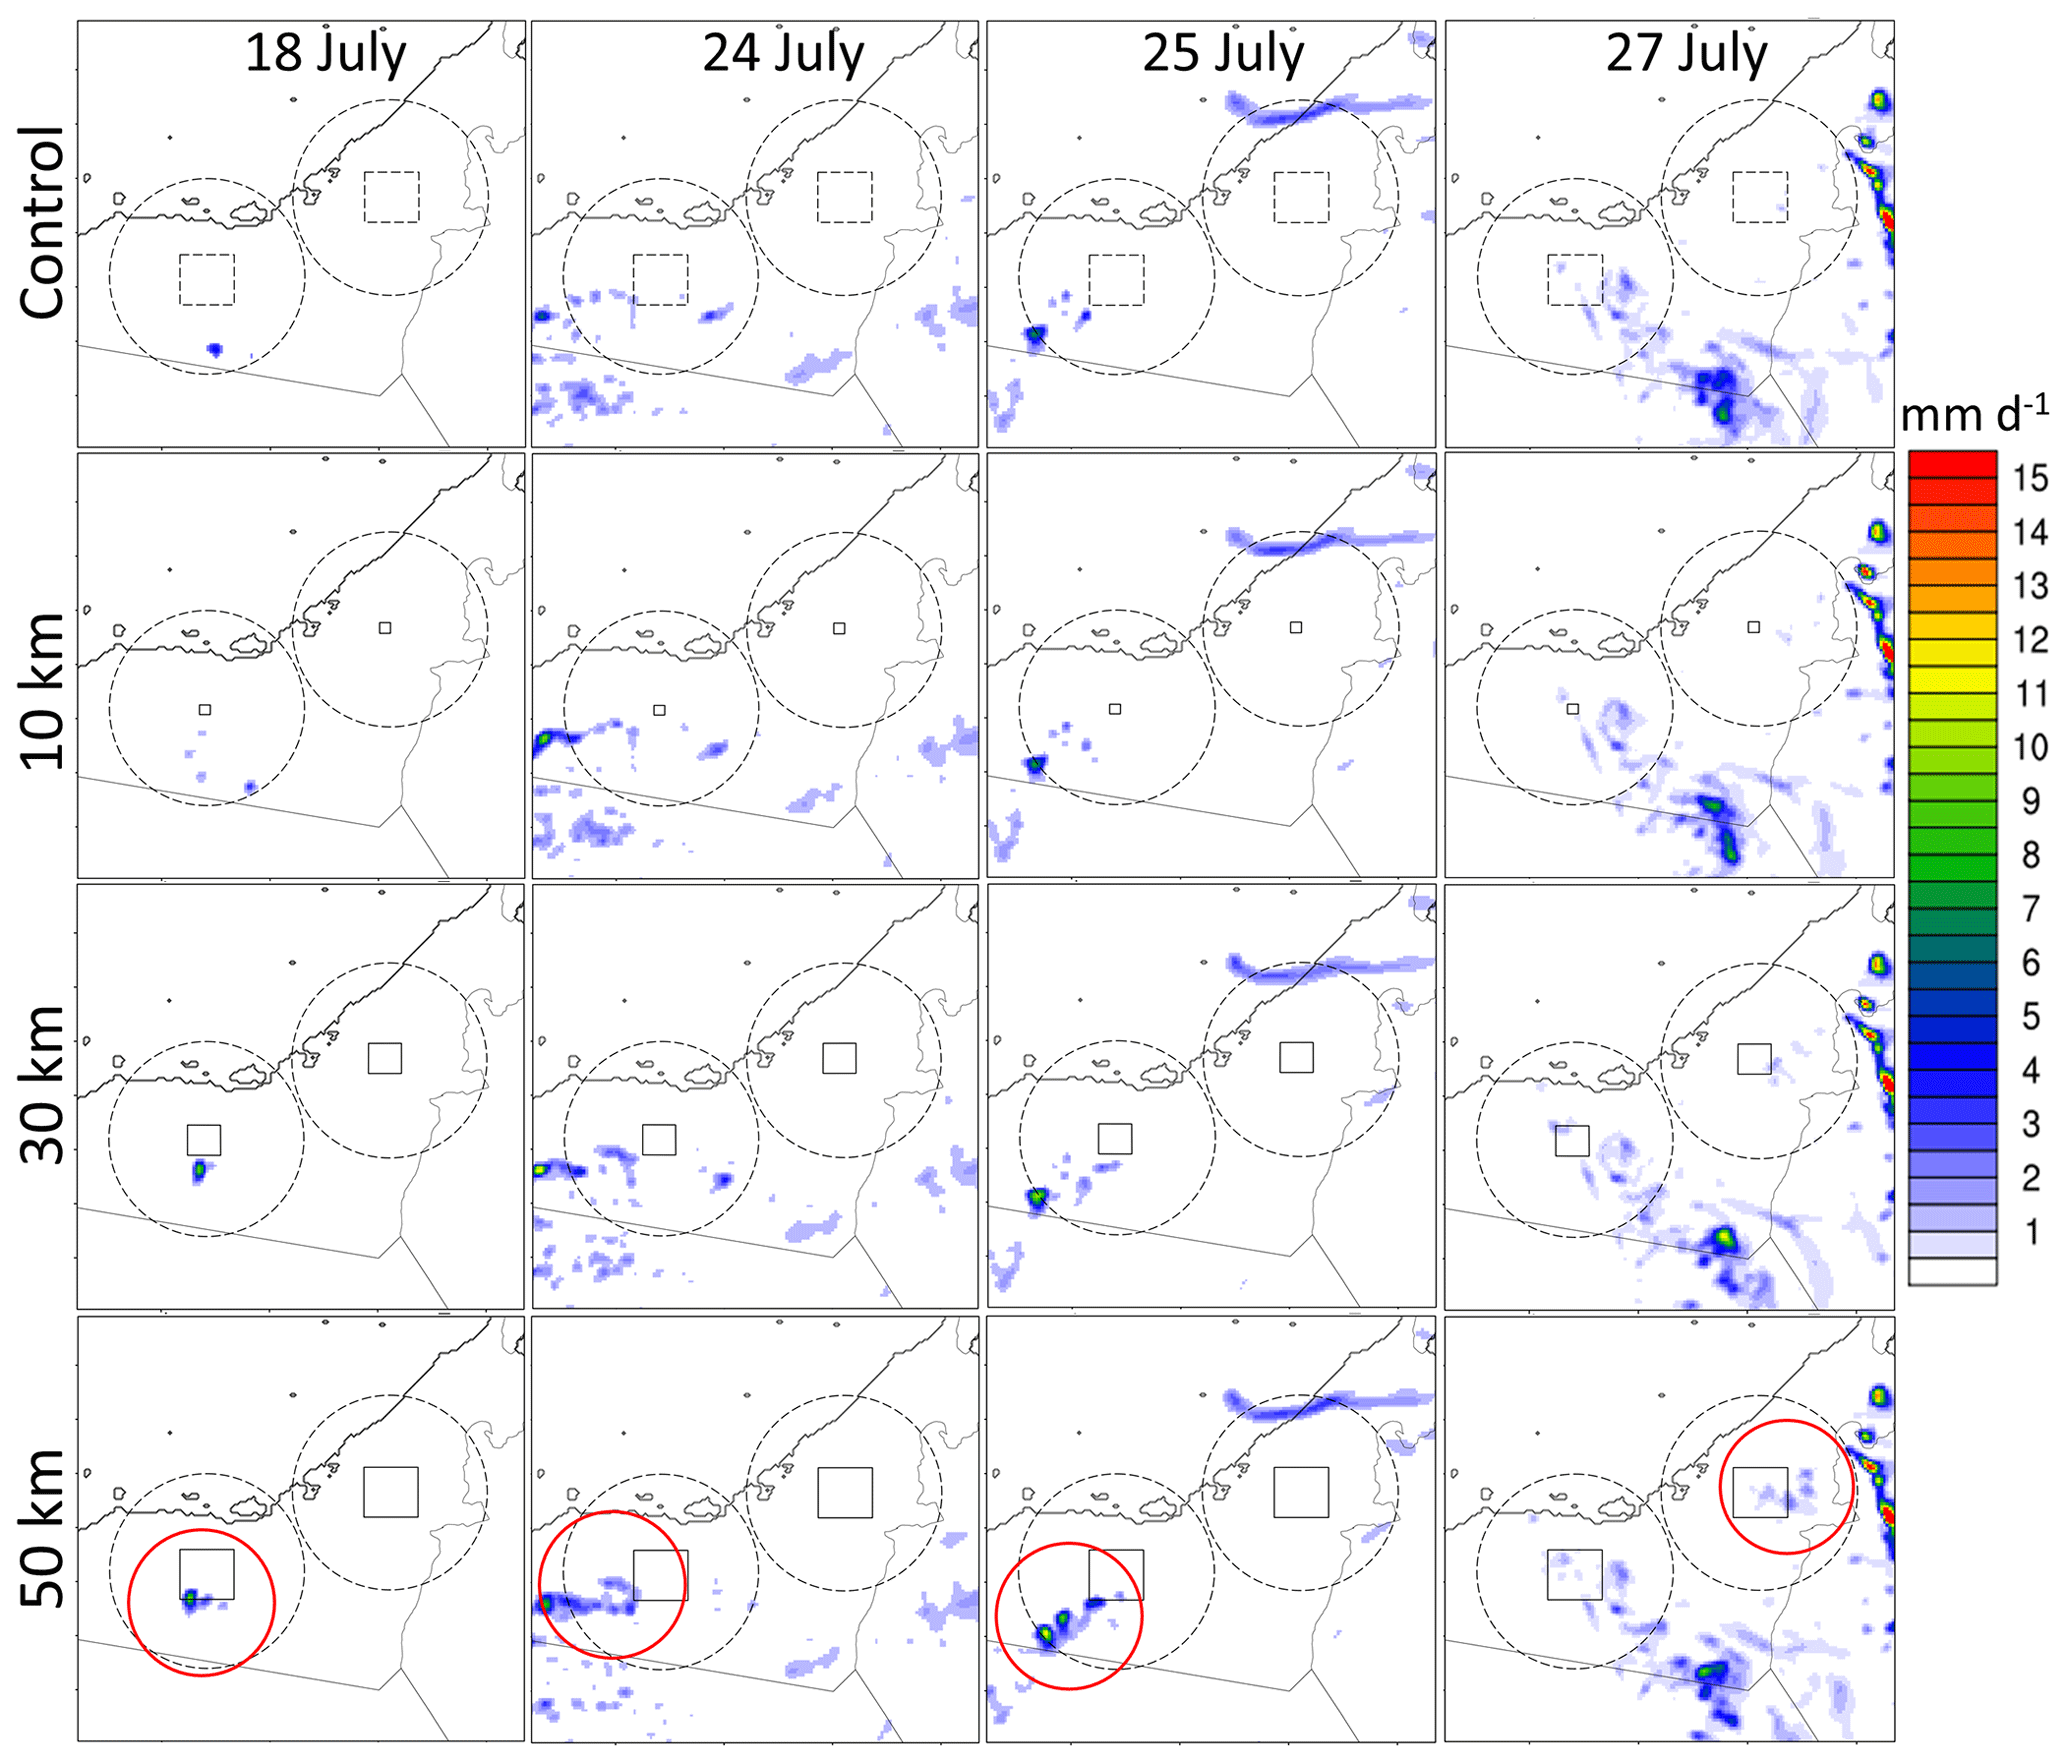
Figure 4Total precipitation (mm) over 24 h for each case study (00:00–23:30 UTC). The four rows show the Control and 10, 30, and 50 km scenarios, respectively – 20 and 40 km not shown here). The solid black squares indicate the ABS zones. The dotted squares in Control show hypothetical surfaces, just for visual reference. The dotted black circles are 180 km diameter circles within which the rainfall volume was calculated (m3). This limitation was imposed to discard propagated numerical differences related to initial conditions. Red circles show areas of high interest, i.e., where the most visible impacts occurred.
Figure 5 shows accumulated water volume (sum of east and west circles). The onset time for precipitation for 24, 25, and 27 July is ∼ 09:00 and for 18 July ∼ 09:30, which aligns with the sea-breeze arrival times. There is some precipitation in Control, but the amounts are enhanced by all ABSs from the 20 km scale upwards. The 10 km ABS impact is almost negligible, except for 24 July which enhances the amount by ∼ 0.4 million m3 (Fig. 5b). On 25 July, the 10 km amount is even lower than Control.
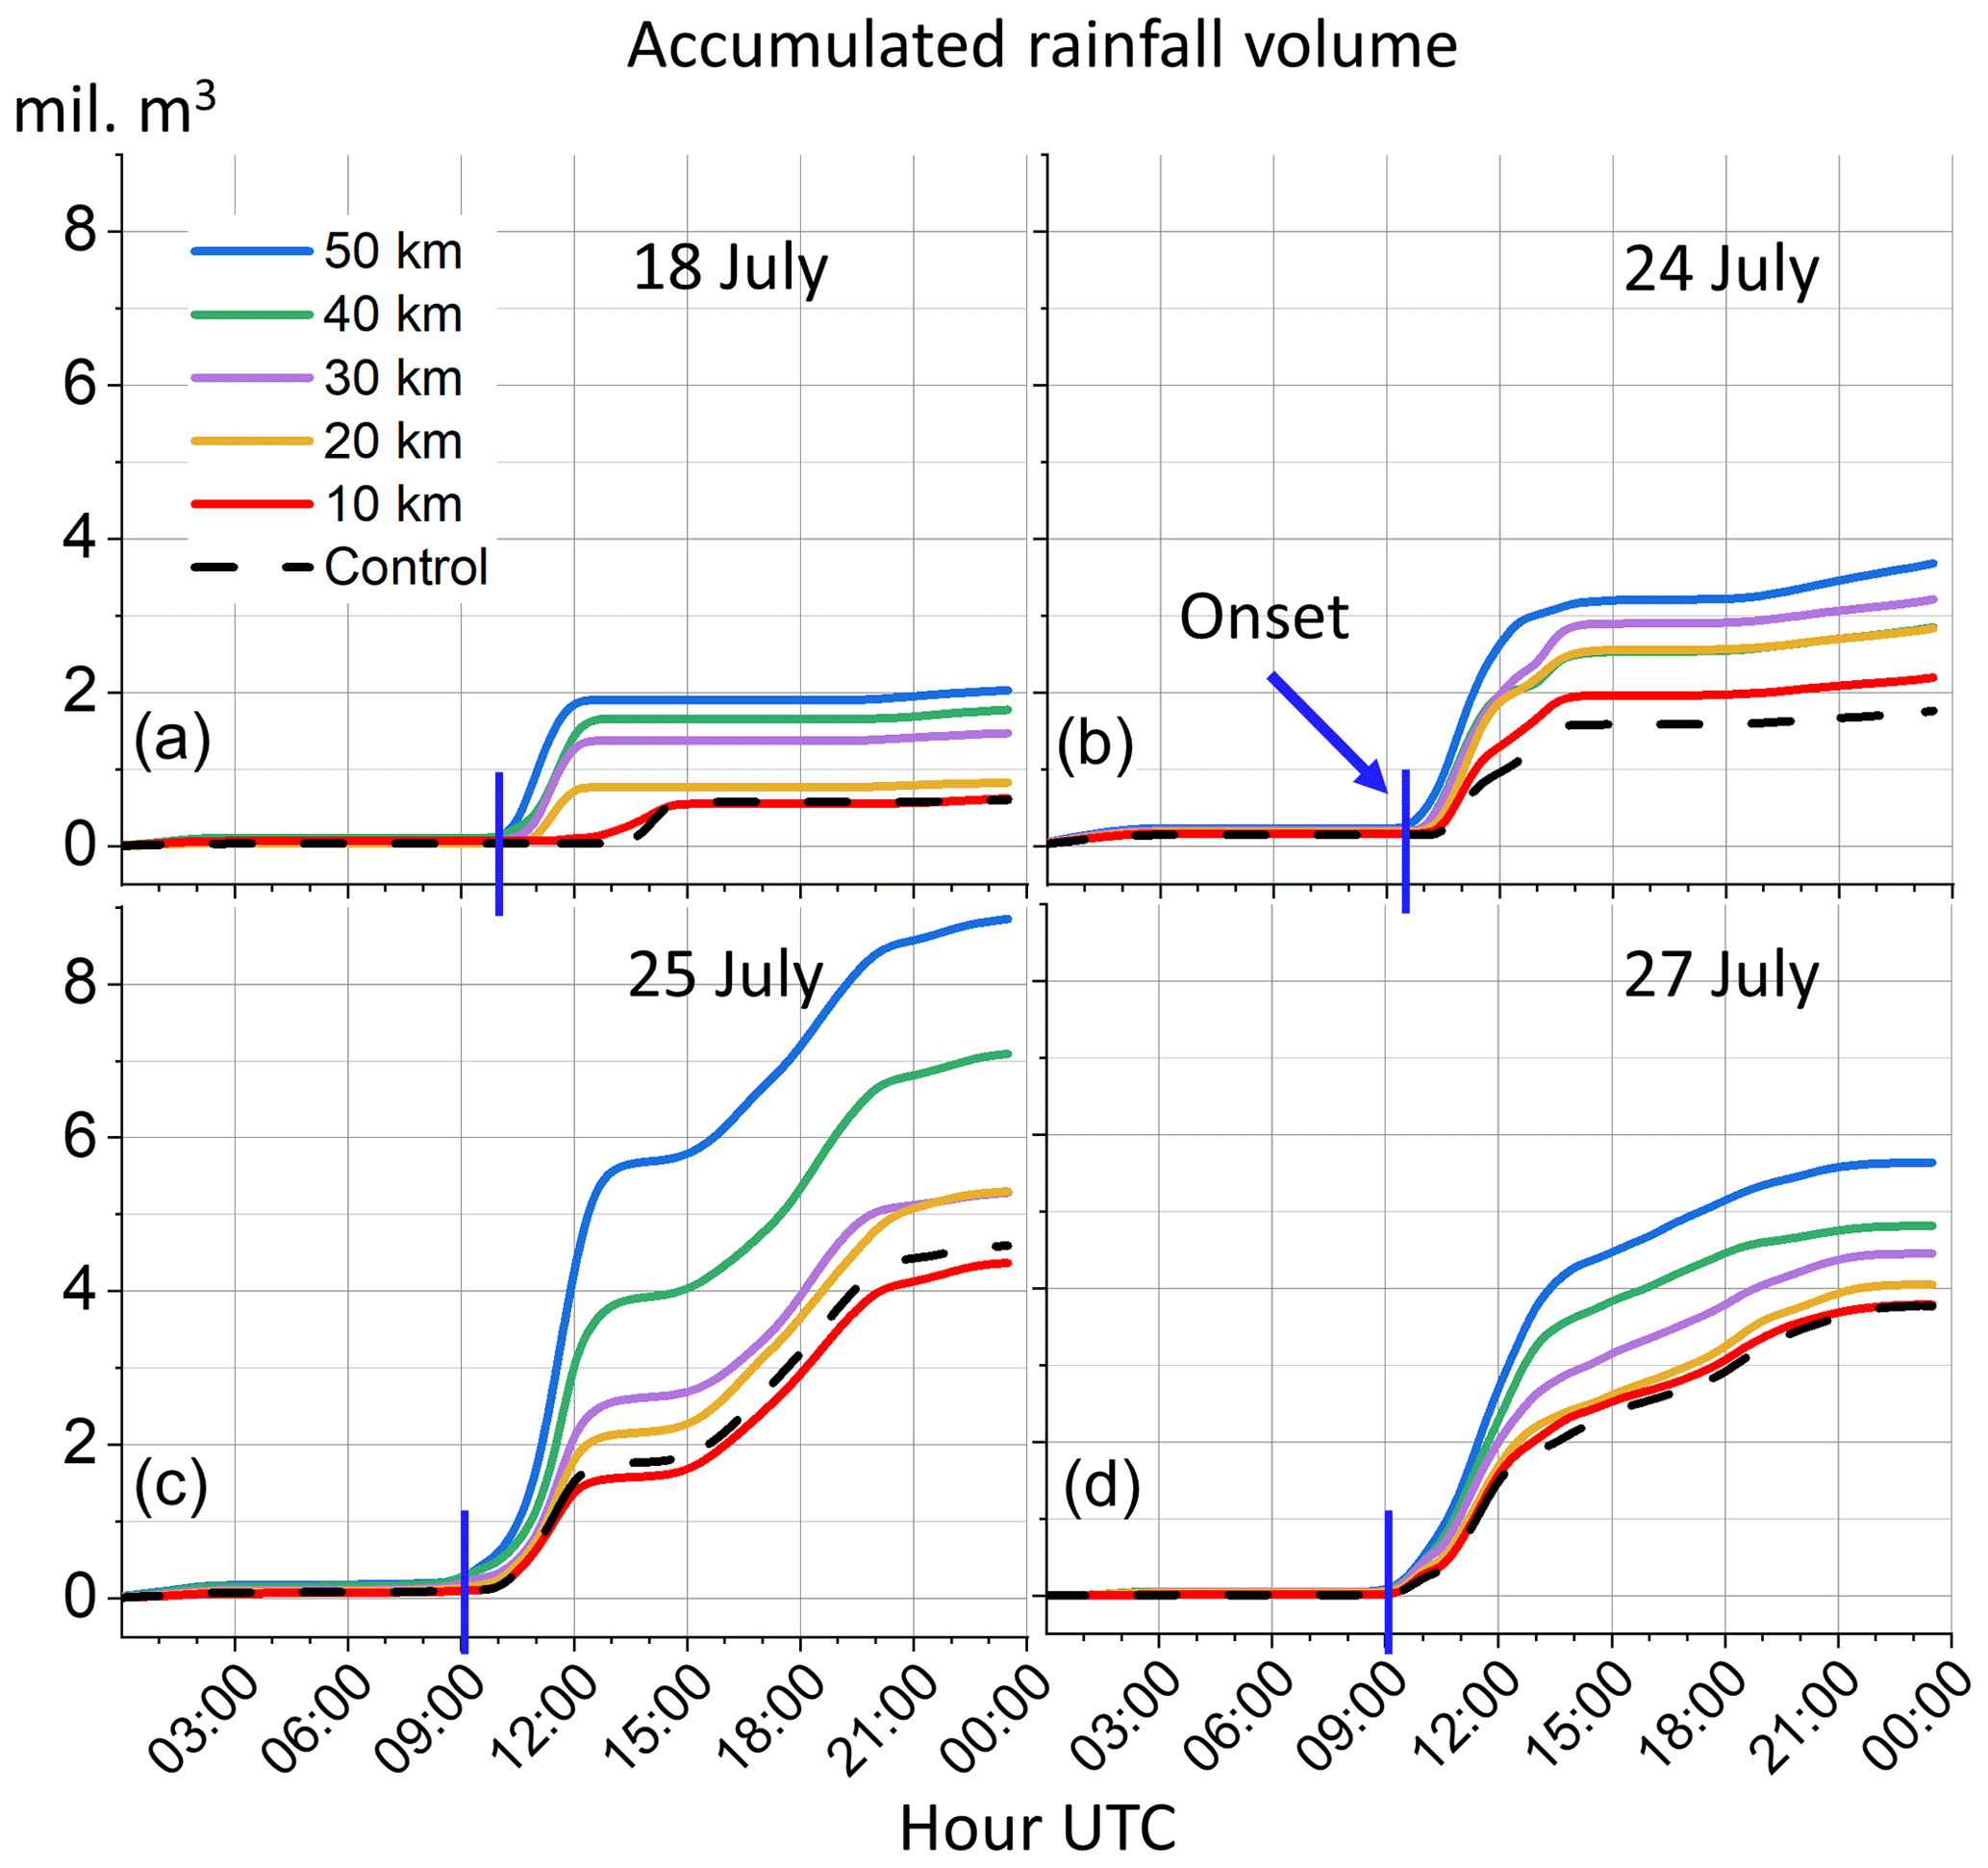
Figure 5Spatially integrated precipitation volume within the 180 km diameter circles shown in Fig. 4 (sum of east and west circles. The amounts are in millions of m3. Panels (a)–(d) show the six scenarios for each of the four cases.
We can also express the water increase in domestic consumption units. We first show the separate cases and scenarios in Fig. 6. Panel (a) shows the total daily water volumes. Panel (b) shows the difference between the ABS and Control expressed in volume (left axis, million m3) and UAE per capita supply based on 500 L capita−1 d−1 (right axis, people yr−1), which is one of the highest national consumption rates in the world (Albannay et al., 2021; Yagoub et al., 2019). In panel (a), there are steady increases with scale for the most part, with an approximate doubling of the Control rainfall in the 50 km scenario. We can see the case differences, but the impacts appear to increase with ABS scale, although this relationship does not always hold (e.g., on 24 July, the 40 km ABS has less impact than the 30 km ABS). Again, we can see that the 10 km scale has no consistent impact, with even a slight decrease on 25 July. There is a small increase over Control on 24 July though. From panel (b), we ranked the cases in terms of volume increase between the 50 km scenario and Control. By doing so, we may later investigate if there are process-based reasons for the differences. The cases were ranked as (1) 25 July (4.25 million m3), (2) 24 July (1.92 million m3), (3) 27 July (1.87 million m3), and (4) 18 July (1.42 million m3). Clearly 25 July produced by far the largest increase in water volume, followed by 24 and 27 July (which are almost the same) and finally by 18 July, which had a smaller increase.
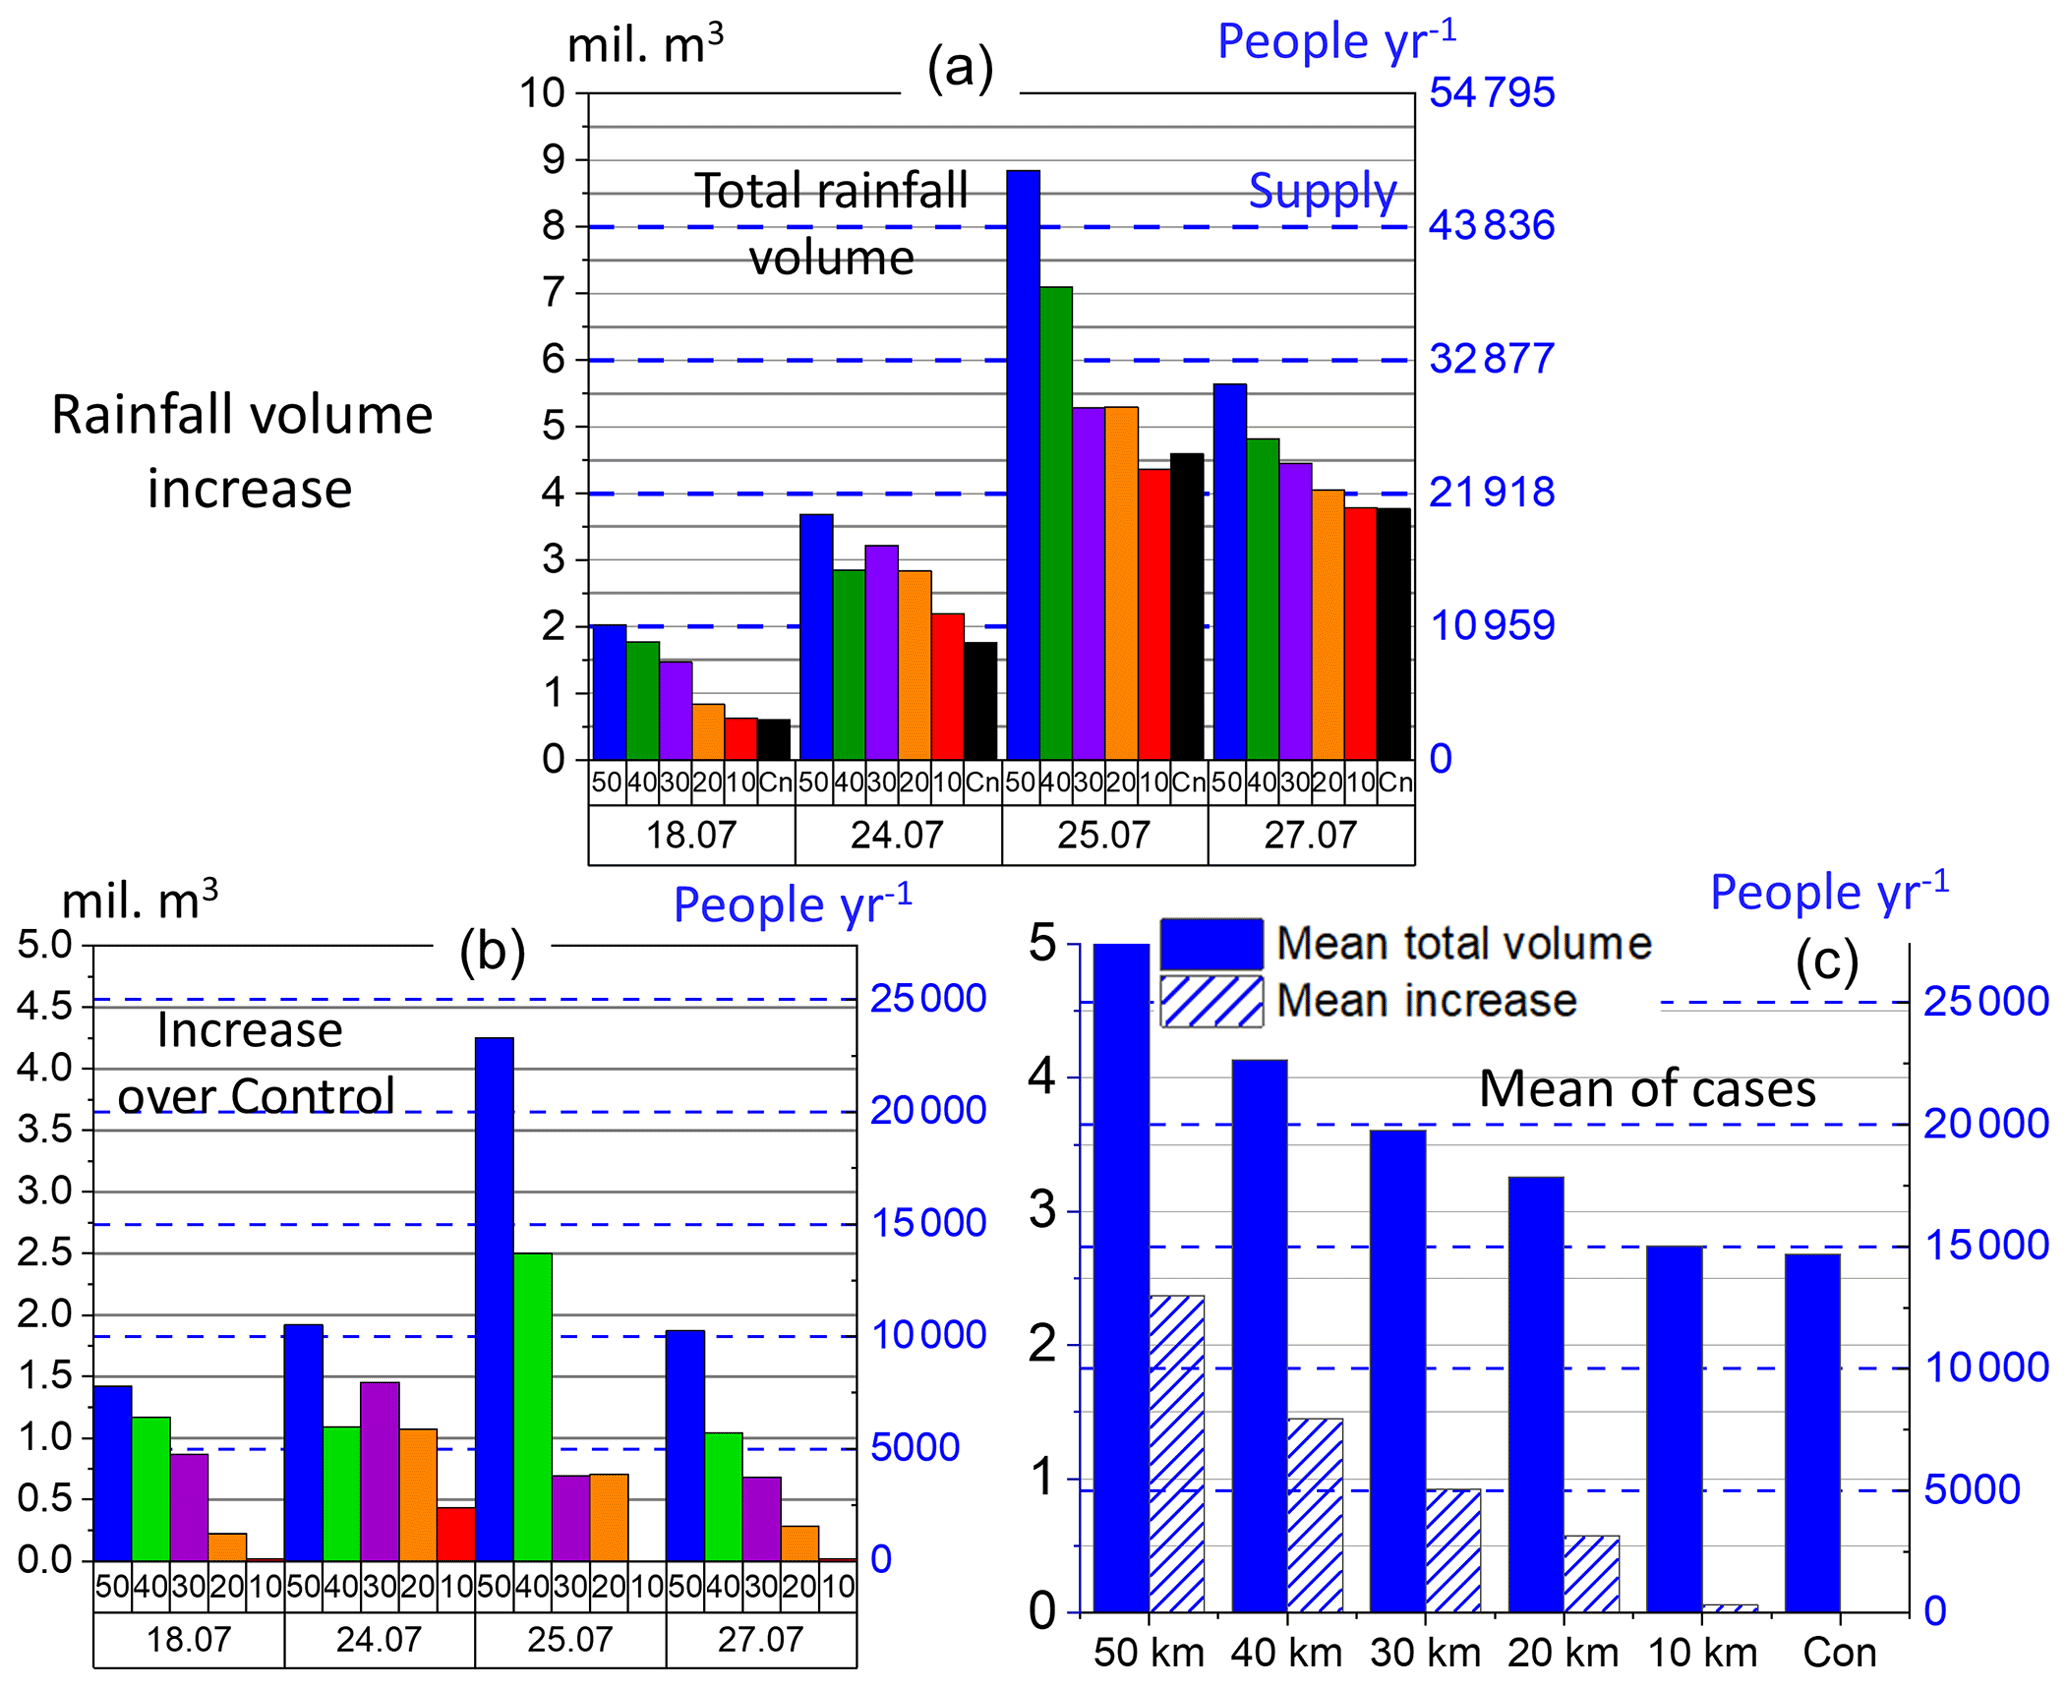
Figure 6Total daily water volumes and increases. Panel (a) shows the total water volume that fell within the 180 km diameter circles. This is expressed as a volumetric amount (left axis, million m3) and as an equivalent annual supply per capita in the UAE (right axis, people yr−1) based on 500 L d−1 per capita consumption. Panel (b) shows the difference in volume between the case and the Control. Panel (c) shows the averages for the cases. The solid bars show the mean volume over all cases, and the striped bars are the mean increase over Control.
As well as quantifying the increases for individual cases, we also computed the mean increases for all cases to infer the “typical” impact of a rainfall event (Fig. 6). Panel (c) shows the mean total water volume (solid bars) and then the mean increases over Control (striped bars). After averaging the amounts over the four cases, the precipitation amounts (and increases over Control) suggest a nonlinear relationship between precipitation and ABS side length; i.e., the differences between bars increase with a successive increase in scale. Intuitively, this might be expected, given the exponential areal increase in our ABS scenarios, but other factors could also be influential in addition to the surface area, e.g., the ABS path length with respect to prevailing wind direction. We can also see that 20 km appears to be a lower boundary for impacts, producing a mean increase of 571,616 m3 per rainfall event (i.e., 3132 people yr−1). At this scale, if such an event occurred just 10 times in one summer, this would produce > 5 million m3 extra water and supply > 31 000 extra people yr−1. A 30 km ABS could produce > 10 million m3 extra water and supply > 50 000 extra people yr−1. A 50 km ABS could produce > 20 million m3 extra water and supply > 125 000 extra people yr−1. These are significant amounts, which may be exceeded if events occur more often, perhaps in spring and autumn.
Of course, not all rainwater is likely to be recoverable for domestic consumption, so these amounts are somewhat illustrative. On the other hand, designs for water recovery have been considered (European Patent-EP3909659). In reality, most of the rainfall that reaches the ground will either evaporate, form runoff, be taken up or intercepted by plants, or percolate into the soil. Water that percolates deeper into the soil can help to recharge groundwater or even aquifers, which are already depleted due to groundwater extraction or degraded by seawater intrusion (Sefelnasr et al., 2022; Sherif et al., 2011, 2023; Sherif and Kacimov, 2007). Desalinated groundwater is routinely used for agriculture, industrial, or domestic purposes in the UAE, so an increase in groundwater would be beneficial. Additionally, increased rainfall could offset irrigation requirements by directly feeding local vegetation. This may facilitate the use of desert vegetation within composite ABS systems, containing a mixture of black panels, PV, and vegetation. It is also important to consider the impacts on temperatures outside as well as inside the ABS zones because large temperature changes could affect local citizens and vegetation. Figure 7 shows the difference (case average) in daily maximum and mean temperatures between the 50 km ABS scenario and the Control. For maximum daytime temperatures (panel a), there is a maximum temperature increase of up to ∼ 1 K inside the 50 km ABS zones when compared to Control. In the surrounding areas, there is a temperature increase, particularly around the eastern zone, but the differences are relatively limited in both spatial extent and the temperature increase (∼ 0.2–0.3 K). Curiously, there are some minor cooling effects to the south of the ABS. For daily mean temperatures (see panel b), there is an increase of up to ∼ 0.8 K inside the ABS zones. Outside the ABS, the largest increases are ∼ 0.2–0.3 K, but these areas are quite close to the ABS zones. These simulated values indicate that there is a slight temperature impact on the near surroundings, but even at the largest ABS 50 km scale, this is low to moderate.
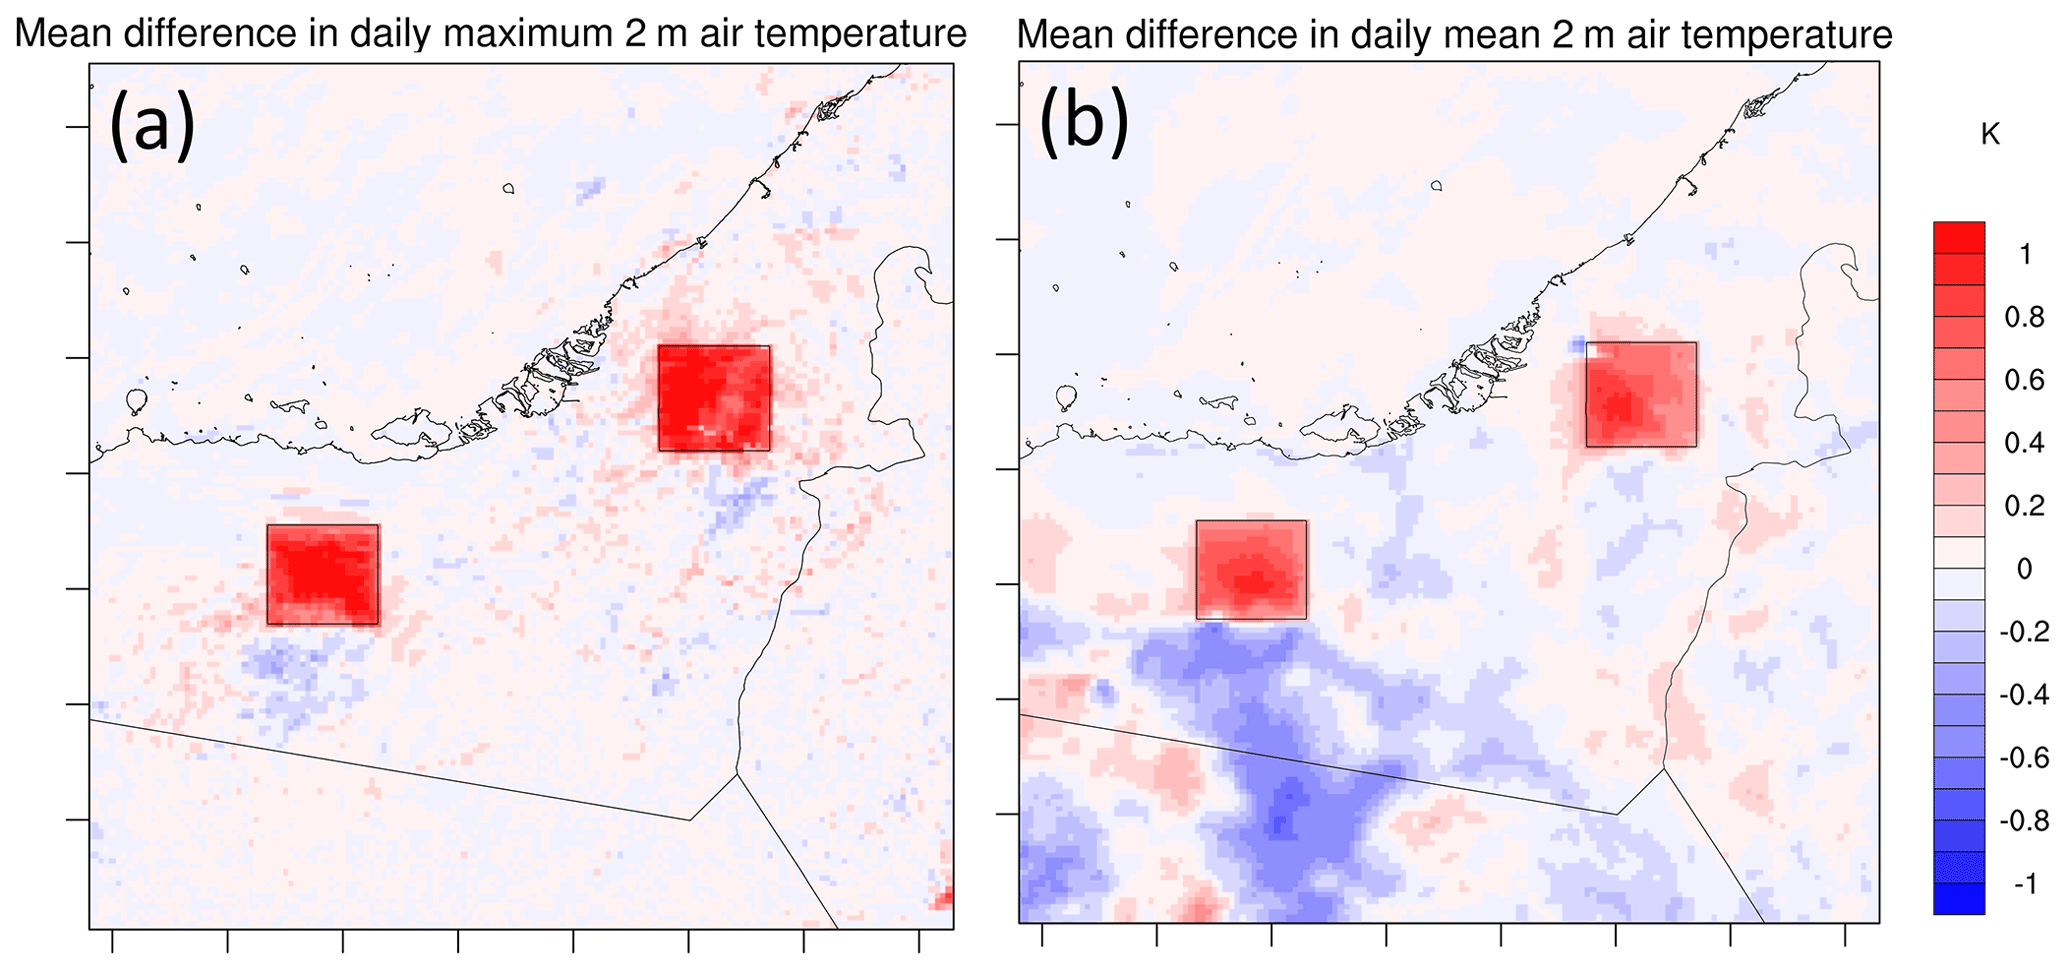
Figure 7The case average impact on daily mean and daily maximum 2 m air temperatures from the 50 km ABS respectively computed as ) and ), where n is the number of cases. Panel (a) is the daily maximum 2 m temperature impact, and panel (b) is the 24 h daily mean impact.
3.2 Processes
To increase our process understanding of impacts we examined important convective processes – vertical motion and convergence – to assess the characteristics of these phenomena at different ABS scales. We present the analysis for 27 July, which had a moderate to strong rainfall impact. As surface fluxes are dependent on land–atmosphere feedbacks, we also investigate how these feedbacks change using an extension of the heated condensation framework index (Tawfik et al., 2015a, b). A further goal is to assess whether impacts can be predicted in terms of necessary surface heating and the hypothetical time it would take to produce this heating over ABSs.
Over each ABS, the albedo was prescribed in the WRF model static data as 0.05. This contrasts with the albedo of surrounding desert soils, which is around 0.3. As a result, an increase in net shortwave radiation occurs (∼ 25 %), as does an increase in the net radiation, which is partitioned into sensible, latent, and ground heat fluxes. As there is virtually no available soil moisture or vegetation in the UAE lowland deserts, the latent heat fluxes are negligible, and the energy is partitioned almost entirely into sensible heating and ground heat flux. Figure 8 (left axis) shows the mean and standard deviation of sensible heating (areal mean) over a common 50 km footprint (left panel) as well as the individual ABS footprints (right). Firstly, the 50 km footprint average allows for a consistent comparison, but it means that some desert is included in averaging for the smaller ABS. It gives a sense of how the different scales impact atmospheric heating over a large area in comparison to Control. Secondly, averaging over the individual footprints provides insight into how the different scales change the feedbacks determining the sensible heat flux, e.g., due to influence from the environment surrounding the ABS, such as from advection or entrainment of heat, moisture, or other quantities.
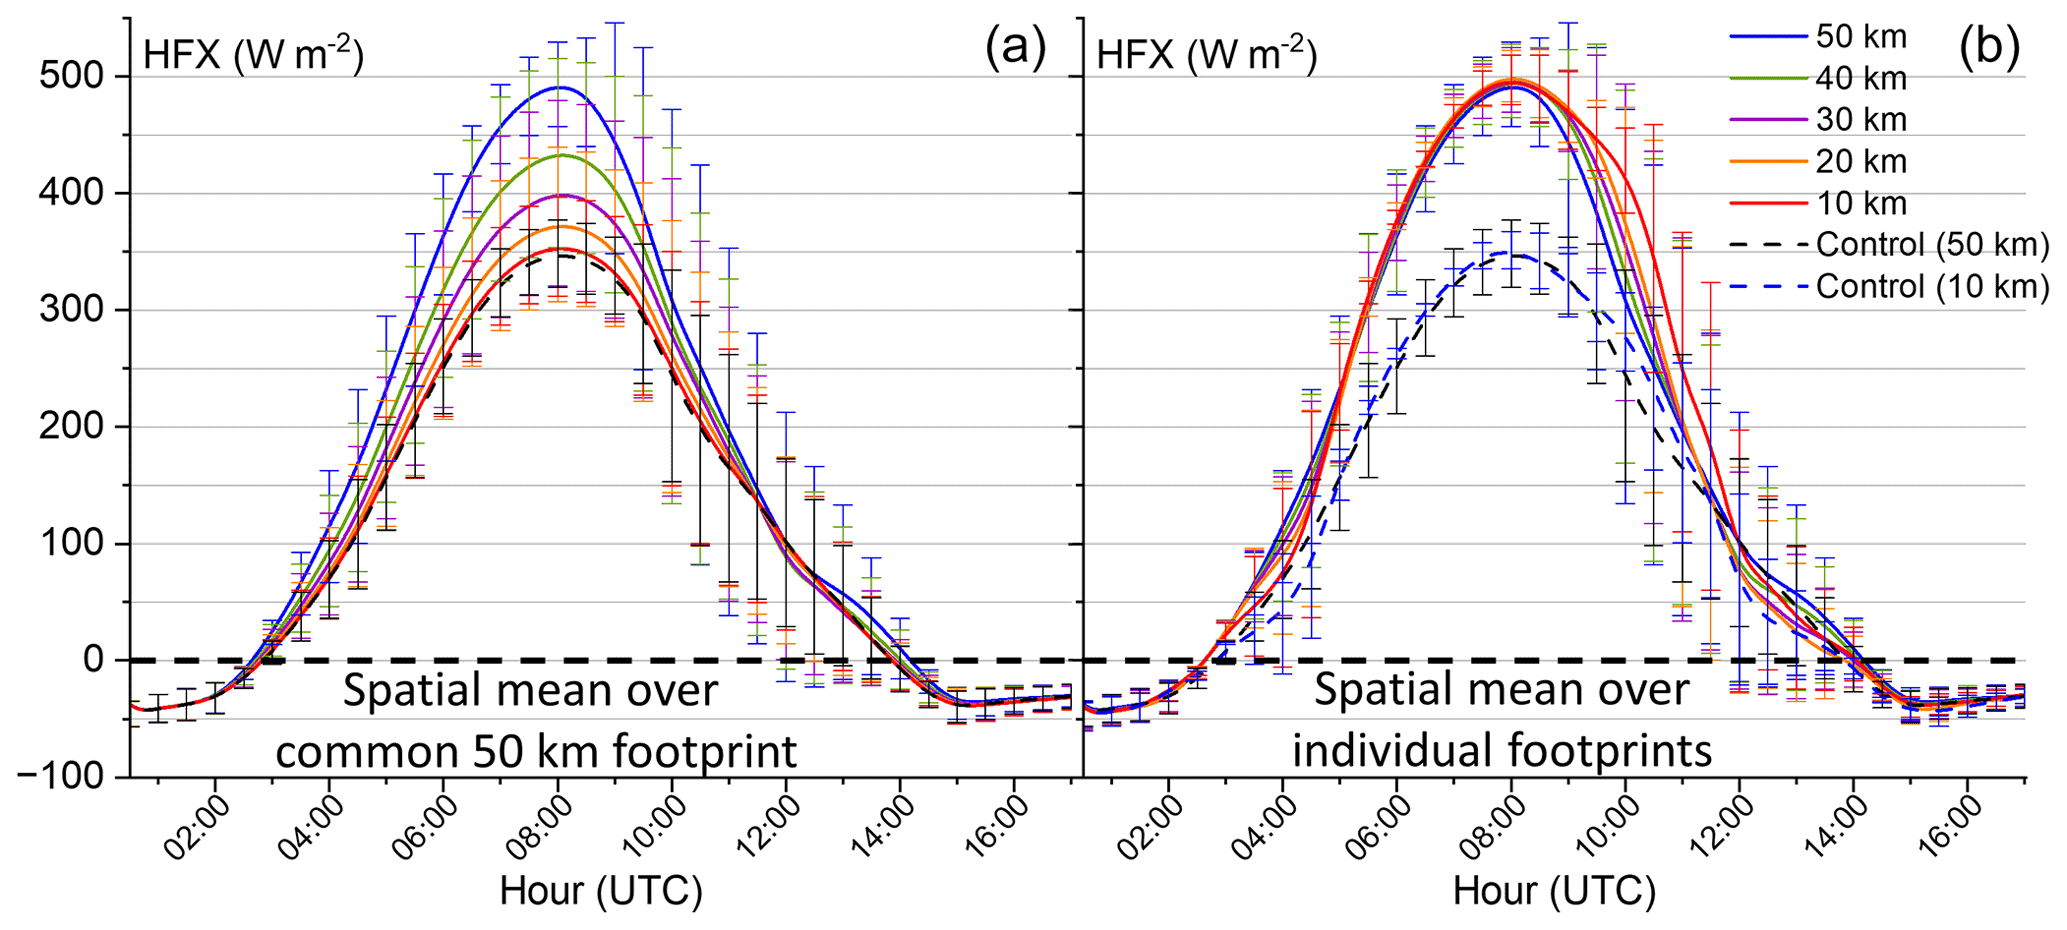
Figure 8Mean sensible heat flux and standard deviation on 27 July. Panel (a) shows the spatial mean within a common footprint (the 50 km ABS area) for all scenarios. Panel (b) shows the spatial mean of each individual ABS footprint. Here, two spatial means are shown for Control – the 10 and 50 km footprints – so they can be compared.
In both panels, there was a nighttime downward flux of sensible heat, when nocturnal air temperatures were still high and the ground was cool. At around 07:00 local time, upward sensible heating flux increased rapidly until 12:00 local time. In the left panel, there is ∼ 150 W m−2 difference between the Control and 50 km ABS, with the difference between the respective peaks decreasing nonlinearly with scale. The 10 km ABS curve differs little from Control, which is not surprising given that most land cover in the 50 km zone is desert. In the right panel, differences are subtle but perhaps informative. In the late morning and at midday, the average heat fluxes are similar when averaged over the ABS areas, but between 03:00 and 05:00 UTC (07:00 and 09:00 local time), the average heat fluxes diverge. This indicates either (a) advection effects with respect to ABS scale and downwind fetch effects, (b) scale dependency of PBL development and free-troposphere entrainment, or simply (c) spatially varying atmospheric conditions. Regarding the influence from the surroundings, either at the surface or above, one may expect the 10 km ABS to be most affected, given its smaller size. The average heat flux is ∼ 40 W lower than over the 50 km scale during this time (right panel), which indicates that this may be the case. However, mean diurnal values do not necessarily tell us why this is the case. The variability is also positively scale-dependent at this time, as evident from the error bars. However, it is not completely clear if this is simply due to greater HFX values in the larger scales or whether this is due to land coverage and the number of grid cells in each scenario.
Figure 9 shows the spatial distribution of heat flux and CIN at the pre-convective time of 07:30 UTC. In the top row (panels a–f), we can see higher values of HFX on the southern windward side of the 50 km ABS (panel b) than for the lower scales (c–f). However, the patterns of the HFX gradients are quite similar across all scenarios compared with the Control (a), indicating that the 50 km ABS has higher HFX values simply because it extends further south into an area where atmospheric conditions produce higher HFX values. This idea is evidenced further by the similar spatial pattern of HFX in Control. The HFX magnitudes are different but the spatial distribution is similar. Differences in land surface characteristics, such as soil texture or moisture, were considered as possible reasons for these patterns but disregarded. The surface soil moisture is virtually zero and the soil texture is very homogenous over the whole area. Hence, the reasons are likely due to atmospheric conditions. However, as well as the surface flux, we investigated impacts higher in the atmosphere. The bottom row shows convective inhibition (CIN, as also seen in Fig. 3) at 07:30. CIN is the energy required for a hypothetical surface parcel to reach the LCL and the LFC, and it is computed as the area bounded by a parcel trajectory from the virtual temperature profile (e.g., in a skew-T plot). Thus, it characterizes differences in integrated temperature profiles. Panels (g)–(l) show that, although the HFX spatial patterns look similar, there are clear differences downwind in the way that the HFX breaks down CIN through surface heating. This is likely due to the time needed for surface winds to advect across the ABS. There is simply more time for heat to be transferred upward with the most heat accumulating downwind. In the 10 km ABS (panel l) the CIN only breaks down to 80–100 W m−2; 20 km reaches 50–60 W m−2 (k), and at the extreme 50 km ABS (g) CIN is lowered to 0–10 W m−2. Of course, CIN represents the thermodynamic environment only, and dynamic effects, such as sea-breeze fronts, can play a large role in CI, e.g., through lifting.
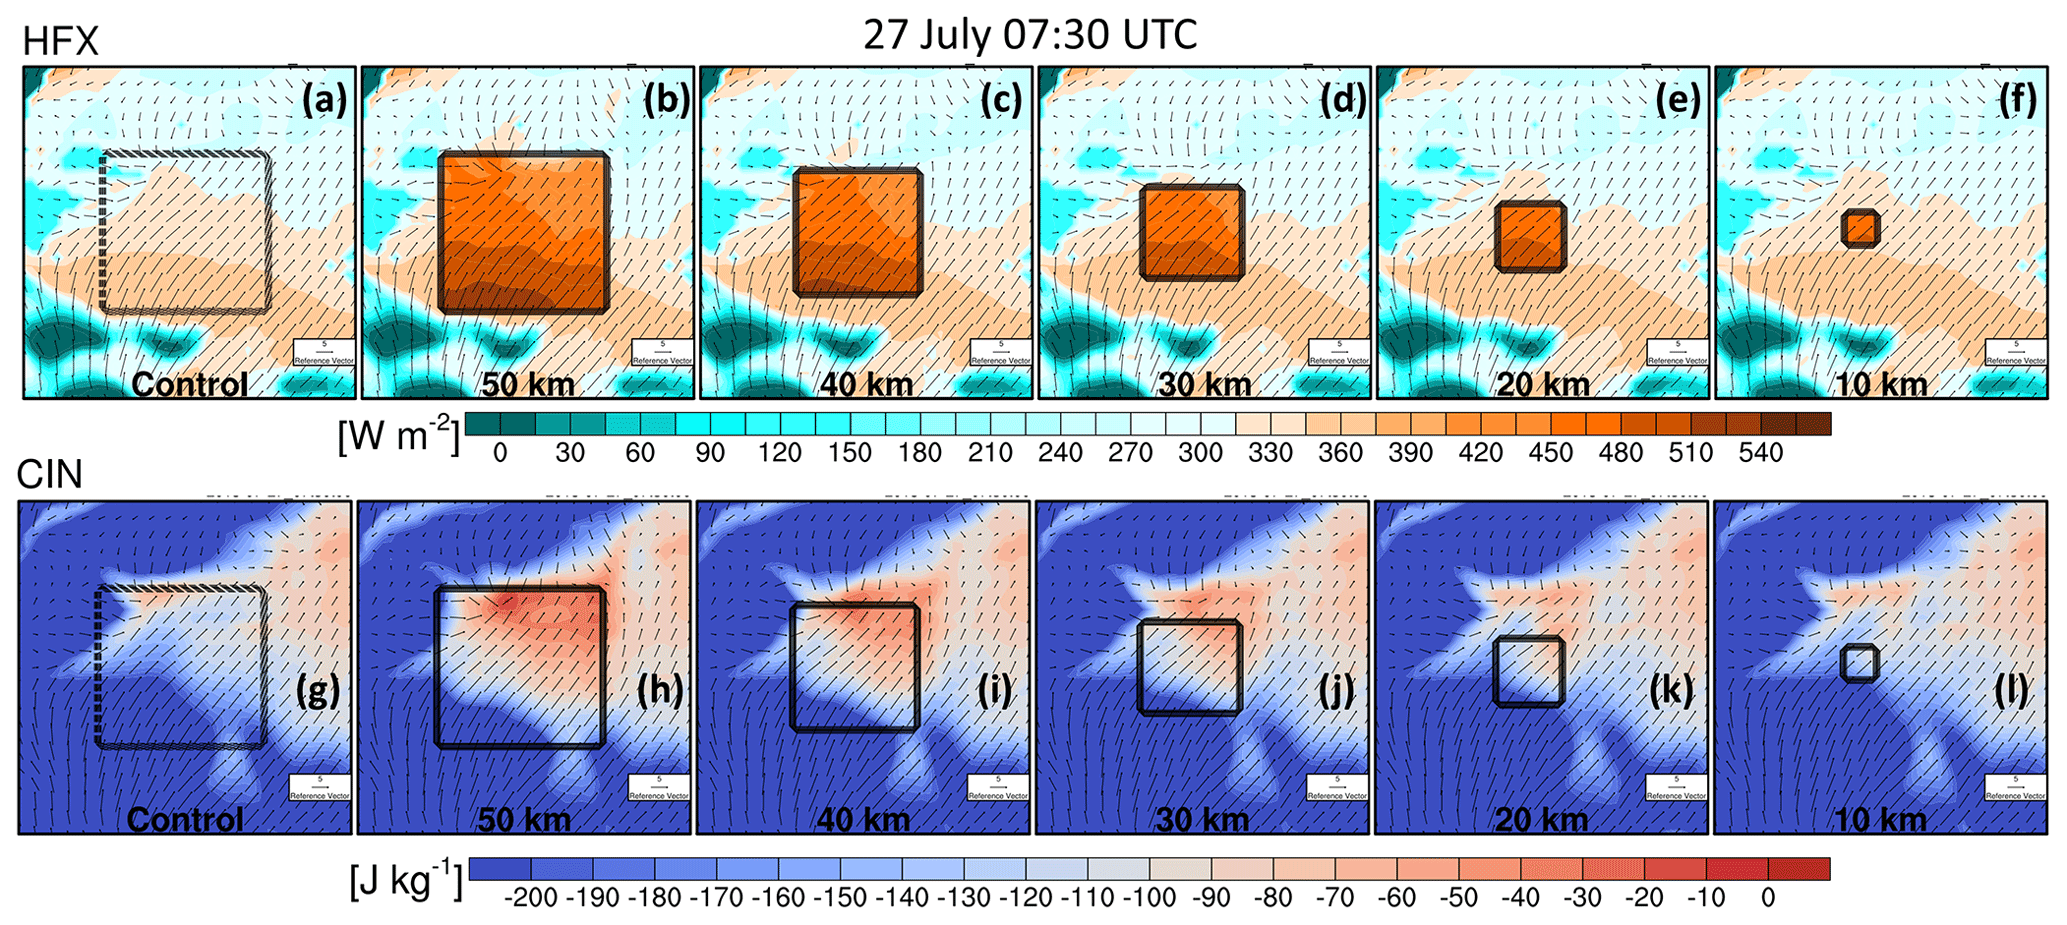
Figure 9Sensible heat flux (top row, W m−2) and convective inhibition (CIN) (bottom row, J kg−1) at 07:30 UTC on 27 July.
The increased heating and buoyancy seen in Fig. 9 are likely to produce stronger vertical motions and convergence lines – the latter especially when landscape discontinuities lead to differential heating. Figure 10 shows surface convergence (vertical mean 0–500 m a.g.l.), 10 m wind vectors, and 2 m temperature (on 27 July). The printed values are mean convergence values within the 50 km zones. To the west in the Control (panel a), there are convergence lines below the (hypothetical) ABS stretching diagonally from left to right (panel a), and the location of these corresponds to the light Control rainfall on this day (Fig. 4). The convergences approximately align with the 10 m wind direction, and the wind vectors either side are deflected toward them. If we compare with the 50 km scenario (b), we can see that the temperatures are increased (wind vectors are redder in color), and the convergence lines are intensified. As we go down in scale this intensification decreases, and this is reflected in decreasing mean values.
Impacts on the eastern side are even more interesting (where the rainfall impact was larger), as there is a stronger difference in convergence impacts. Here, the Control has only weak convergence (caused by southwesterly winds meeting the light sea breeze), but these are strongly intensified with the ABS, which produce new convergence lines. The dependence on scale is clear with strong upward motion evident in the 50 and 40 km ABS (b and c), which gets progressively weaker at lower scales. At 10 km (f) there is little difference when compared with the Control (a). Hence pre-existing convergence lines (Control) may be amplified by an added ABS.
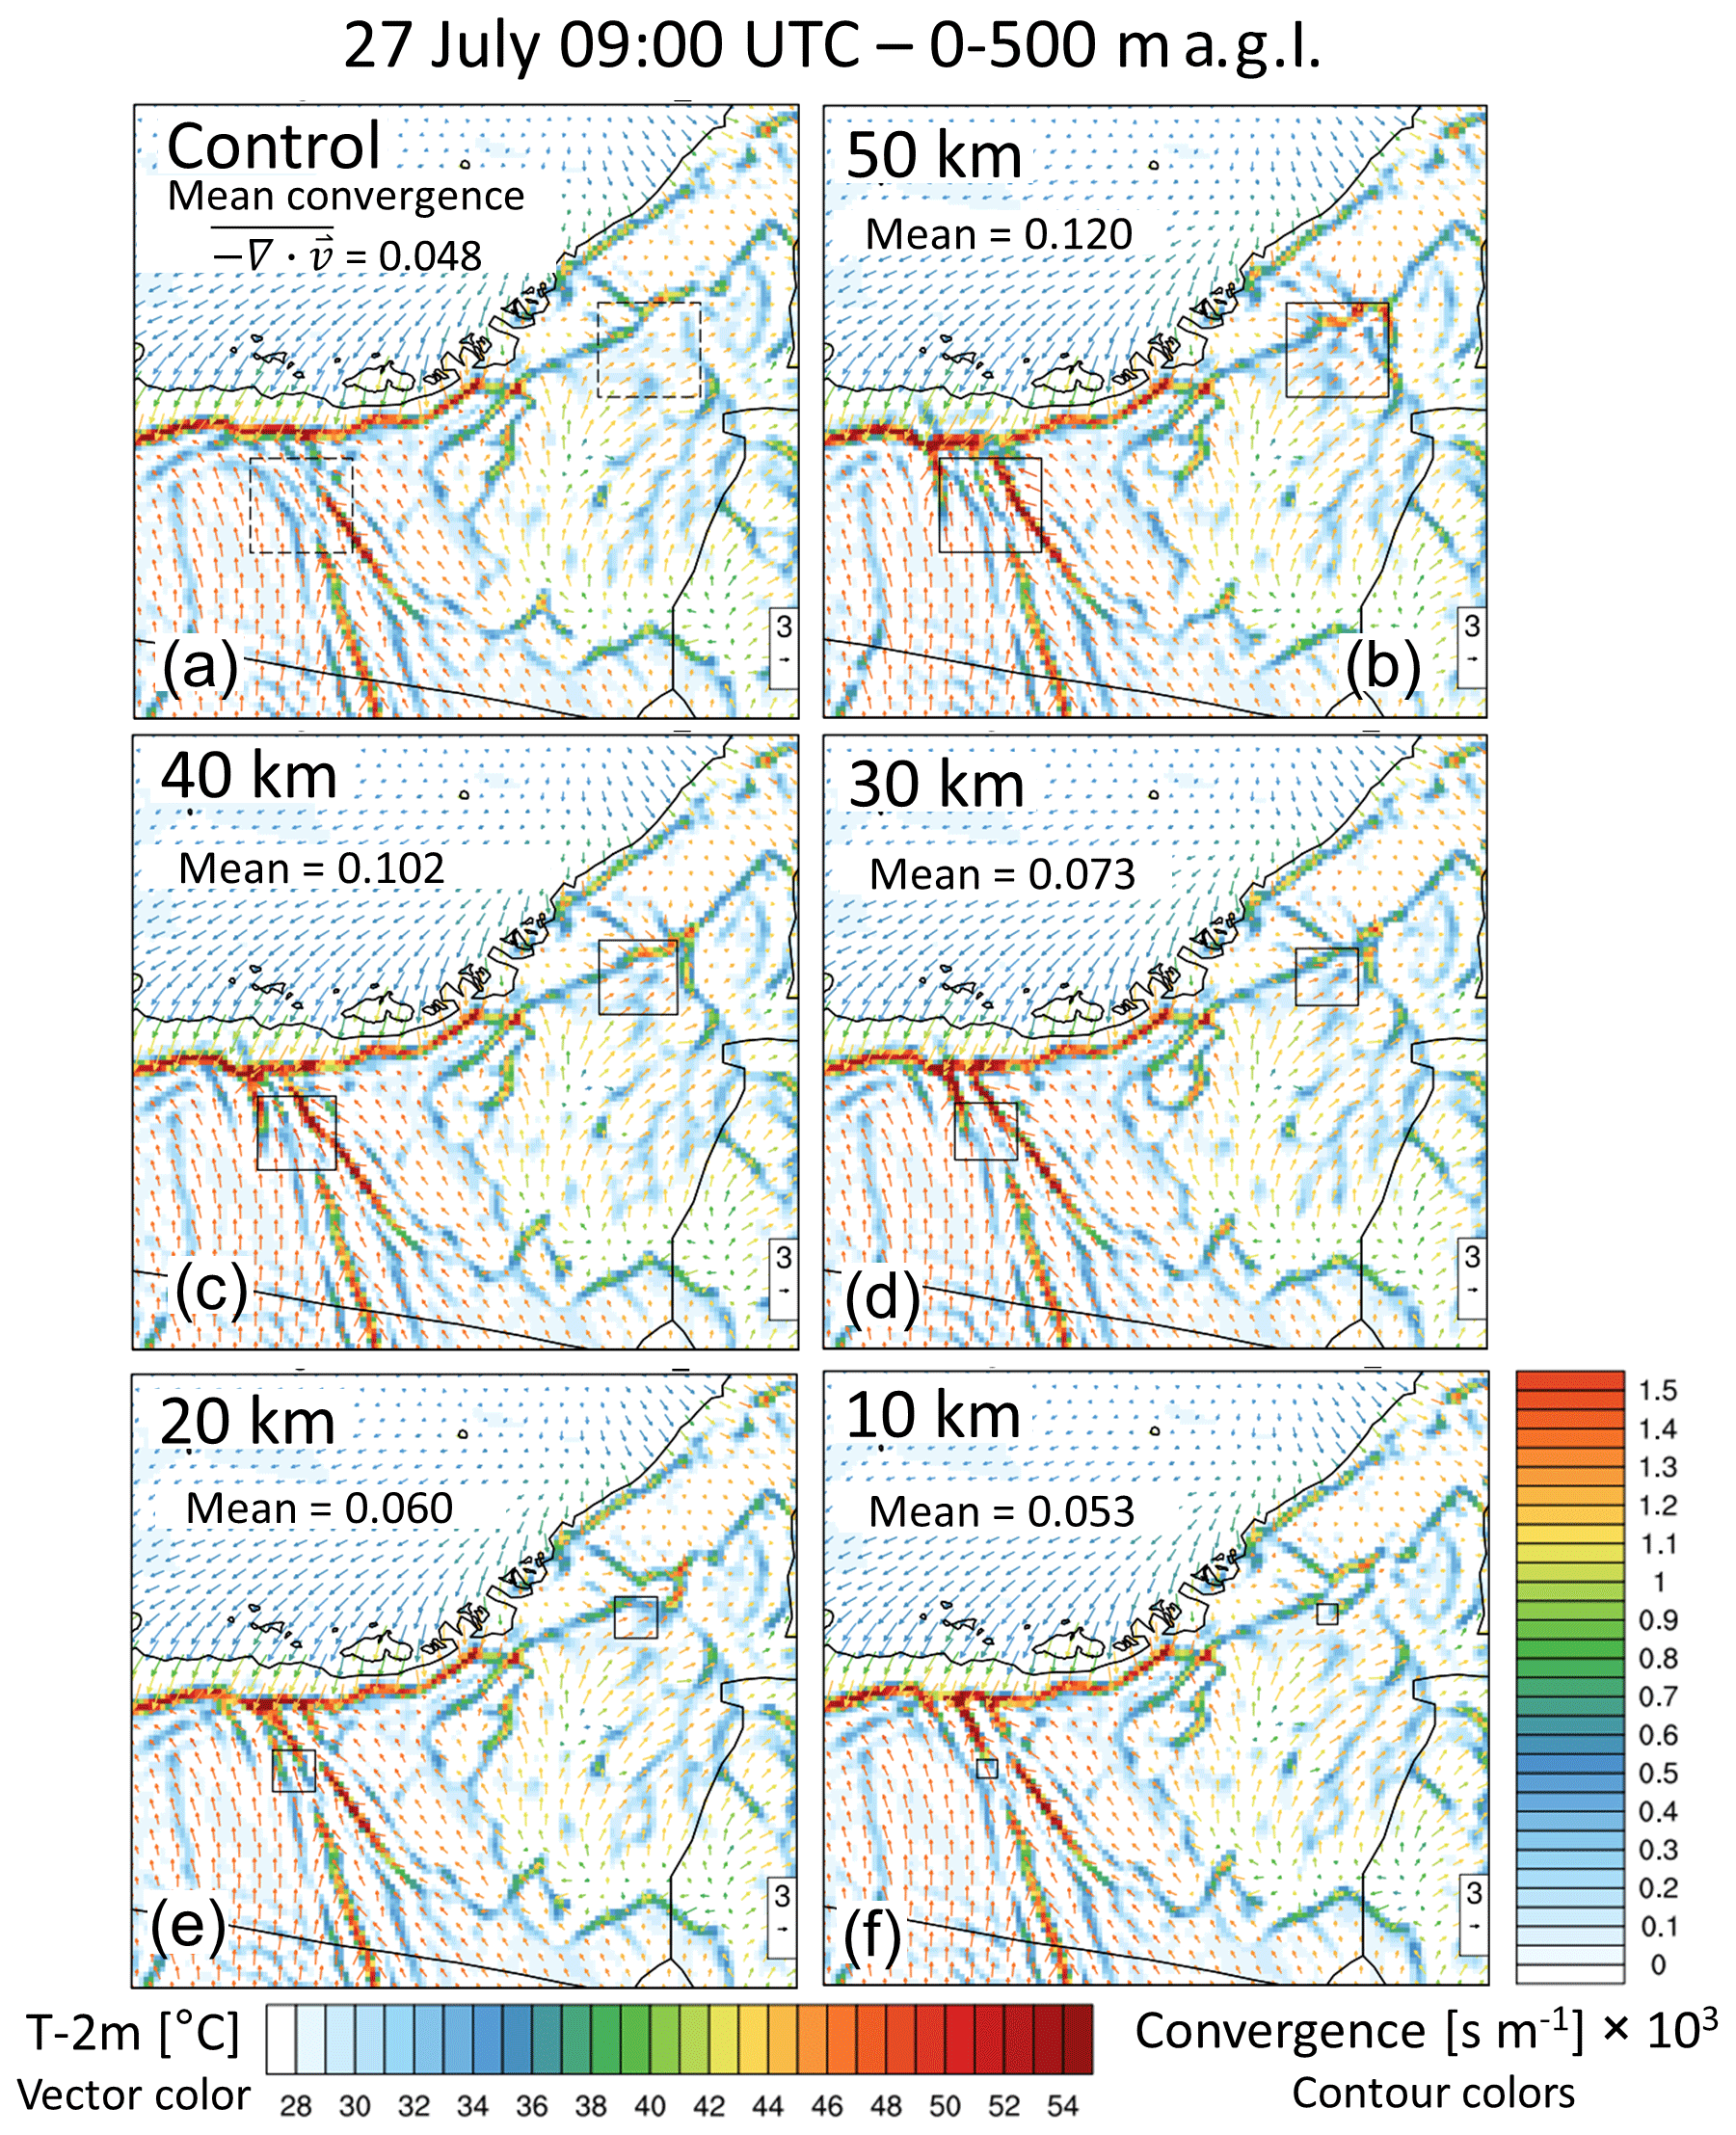
Figure 102D images of pre-convective convergence (mean over 0–500 m a.g.l.), 10 m wind vectors, and 2 m temperatures (vector colors) at 09:00 UTC on 27 July. The text values are mean convergence over the 50 km footprint.
Figure 11 shows time–height diurnal plots to see how the convergence field develops over the day up to 6 km in altitude, potential temperature (contour lines), the average height of the PBL (Zi, thick solid line), and the height of the level of free convection (LFC, dotted line). Three ABS sizes are shown (Control and 50, 30, 10 km). In all scenarios (panels a–d), there is a low-level mean convergence and a corresponding divergence above ∼ 2 km height (at approximately the time of convection, 09:00 to 09:30). However, differences are visible between the scales. In the 50 km ABS (c), both convergence and divergence are strongly increased. Furthermore, the LFC is lowered and Zi is increased, almost meeting the LFC (in fact the LFC is breached in various grid cells). There is also greater de-stratification of potential temperature due to more vigorous mixing, as indicated by the isolines in the lower center of panel (c). Again, these effects tend to decrease with descending scale (b and d), and indeed the 10 km scenario appears indistinguishable from Control. Interestingly in the 50 km scenario, low-level convergence and PBL development are impacted earlier in the day, indicating that the varying diurnal onset of strong convergence between the scales may also be important for triggering CI.
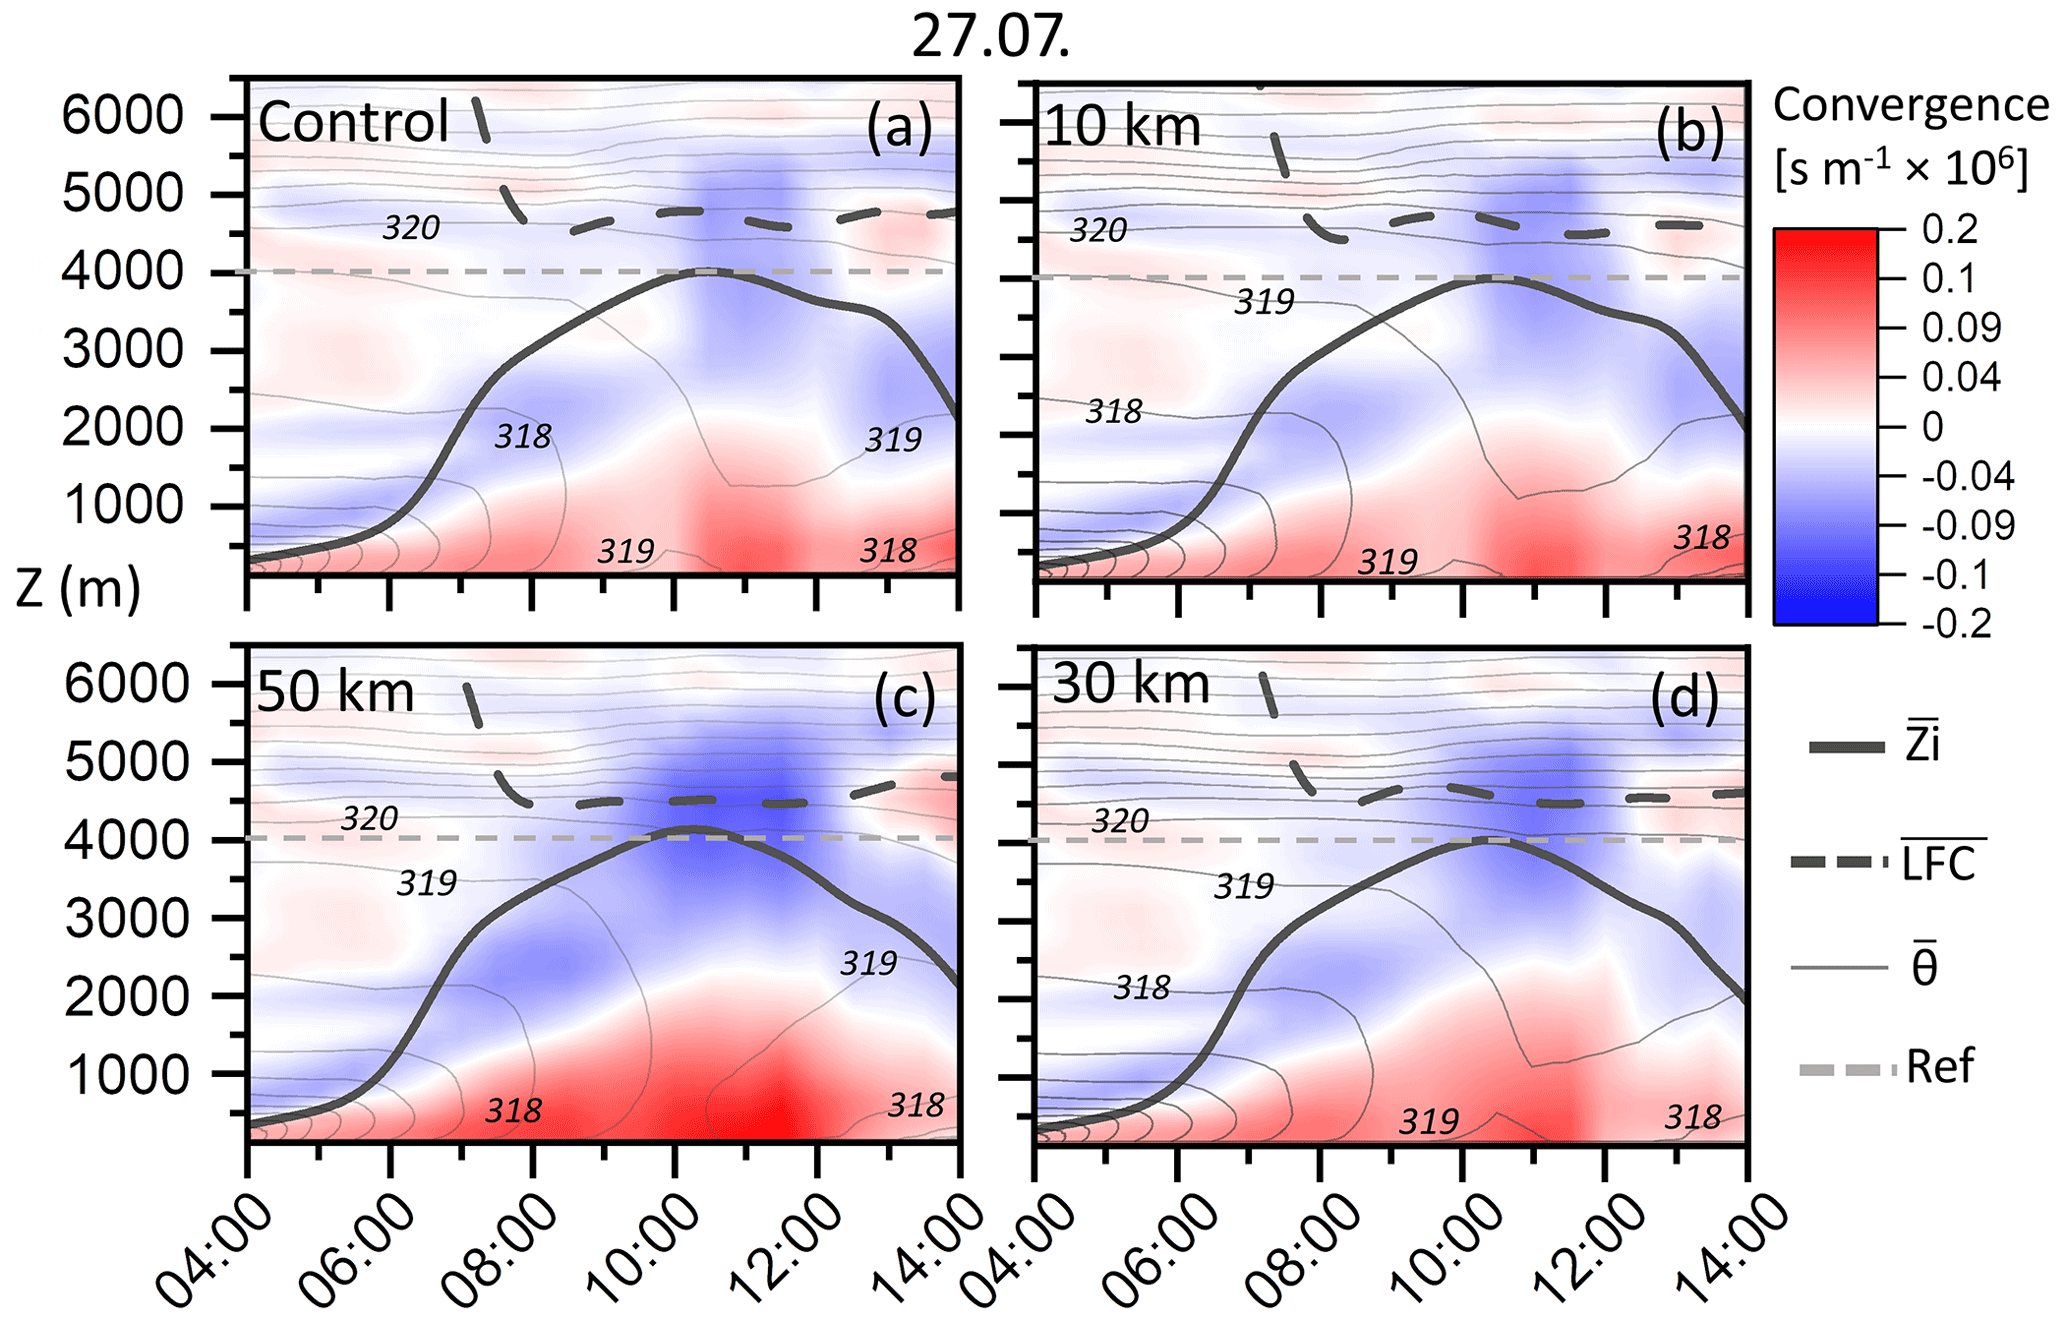
Figure 11Time–height vertical plots of the mean convergence over the 50 km footprint (blue–red contours) on 27 July. For clarity, only four of the scenarios are shown. Also shown are mean boundary layer heights (Zi) and mean level of free convection (LFC). Zi is calculated using the gradient Richardson number with a critical value of 0.25 (Lee and De Wekker, 2016; Seidel et al., 2012). The grey contour lines show the mean potential temperature (Θ, K), and the grey line is a 4000 m reference.
Convergence goes hand in hand with mean vertical velocity (w). In Fig. 12, updrafts (from inside a common 50 km perimeter) were plotted against height at 08:00 UTC (27 July), along with a line of best fit. From this figure, we can compare four important aspects: (a) maximum velocities, (b) the height at which w maxima occur (right-hand peak), (c) the maximum height at which any updrafts occur, and finally (d) the total number of updrafts (bar chart).
For aspect (a), the peaks indicate a positive but nonlinear relationship between scale and maxima reached, with maximum values increasing in a somewhat exponential manner. For aspect (b), we see that with increasing scale the height of the peak where the strongest updrafts occur also increases (right-hand peak of each set of dots). At 10 km, the peak does not rise above 1200 m. At 20 km it occurs at > 1500 m and at 50 km > 2000 m. From the best-fit lines, we can see that the slope angle changes from negative to positive as we step up from 10 to the 20 km scale, indicating a transition in the way vertical updrafts are constrained by scale. Regarding aspect (c), the height at which updrafts occur (in this case up to 4500 m) is also influenced by scale. At 20 km, updrafts exist up to 4000 m high, and from the 30 km scale upward they reach > 4250 m. This is important because the mean LFC at this time (08:00) is ∼ 4300 m height (from Fig. 11, dotted black line). At the 10 km scale, there are no updrafts at all above 3500 m, which also provides a subtle transition as this is well below the average LFC height. Regarding aspect (d), we see a positive relationship between scale and the number of updrafts. This appears to be a fairly linear relationship from 50 down to 20 km. Below that, the number of updrafts drops quickly, which also points to a transition between 10 and 20 km.
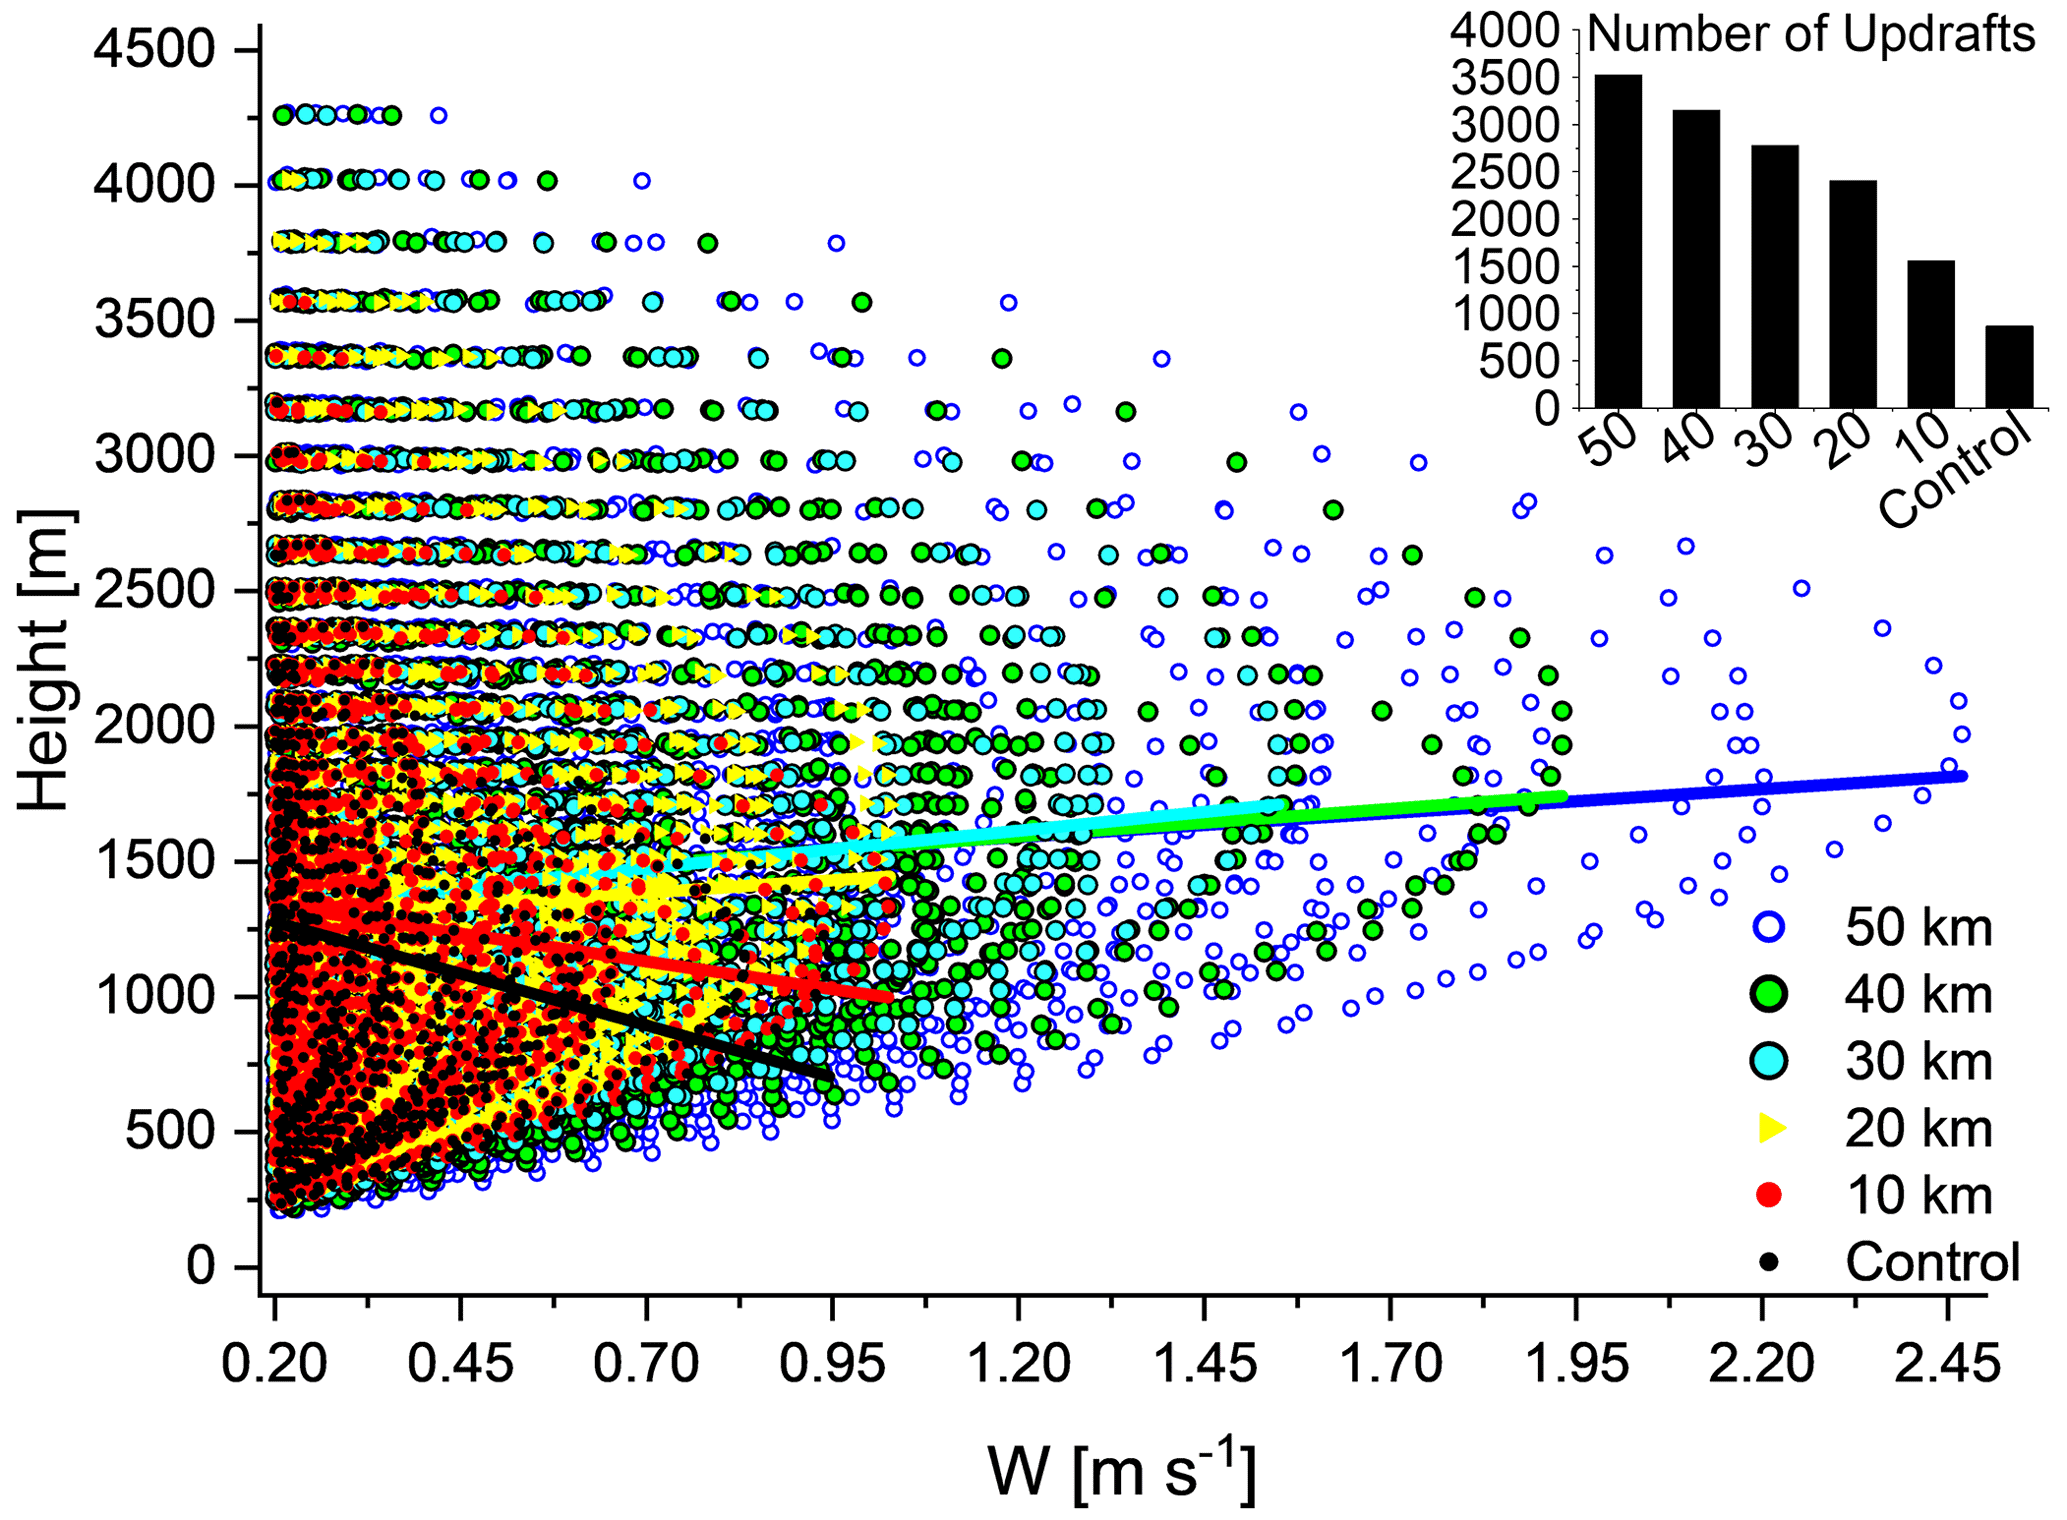
Figure 12All vertical velocity values (0–4.5 km) and their heights on 27 July at 08:00 UTC within the 50 km footprint. A line of best fit for each scenario is also plotted to show the relationship of velocities with height. The bar chart shows the total number of updrafts for each scenario (within the 50 km zone) at 08:00 UTC.
3.3 Required heating rates for convection
Our goal is to gain insights into how scale influences convective impacts, and it is known that CI is influenced not only by large-scale conditions, but also by land–atmosphere (LA) interactions, or feedbacks (e.g., Jach et al., 2020; Gerken et al., 2019). The relative impacts of LA feedbacks increase in weakly forced large-scale conditions. LA feedbacks can be defined as co-variabilities between land and atmospheric states, with the timescales spanning from minutes (surface heating–surface fluxes) to years (soil moisture–precipitation). LA feedbacks are often quantified using process or statistically based LA feedback indices (see Santanello et al., 2019).
Surface heating is the dominant process behind artificial heat island impacts (Branch and Wulfmeyer, 2019), and our goal is to investigate what spatial scale and level of heating are likely to produce convective impacts in the UAE summertime. If the surface heating rate required for convection can be quantified, we can estimate how long it would take to reach CI for a given heating rate – a “convective timescale”. To do this, we applied the heated condensation framework (HCF) index (Tawfik et al., 2015a, b), which takes an iterative surface-heating perturbation approach, following a four-step computation.
-
Increase the near-surface potential temperature (θ 2 m) by a small increment, Δθ.
-
Find the height where the near-surface parcel (θ 2 m +Δθ) is neutrally buoyant.
-
Mix the specific humidity profile from the surface to the level of neutral buoyancy, therefore returning a mixed layer with constant humidity.
-
Check if saturation occurs at the top of the potential mixed level by comparing humidity and saturation specific humidity.
-
Repeat until saturation occurs (see Tawfik et al., 2015a, for more details).
The index provides, amongst other quantities, a buoyant convective level height, or BCLH (that the PBL must reach to initiate convection), and a sensible heat deficit (SHDEF) required for CI to occur based on the atmospheric state. One advantage over indices like CAPE, according to Tawfik at al., is that it avoids pitfalls associated with parcel theory because it is not only dependent on the properties of a hypothetical surface air parcel, but is also a property of the air column as a whole. The time evolution of sensible heat flux deficit (SHDEF, GJ m−2) for 27 July is shown in Fig. 13 – averaged over the eastern ABS zone. The largest differences in SHDEF occur in the 2 h between 05:30 and 07:30. As one might expect, the deficit is lowest in the 50 km ABS, and the deficit increases as the scale decreases. In the different scenarios, equal values of SHDEF are often reached, but at different times. For example, at 50 km the deficit falls to 6 GJ m−2 before 06:00, whereas Control only reaches this deficit later between 06:30 and 07:00. Large-scale conditions can change over the course of 1 d, e.g., the developing heat low over the Arabian Peninsula, so the timing of surface heating may be just as important a factor for CI as heating strength.
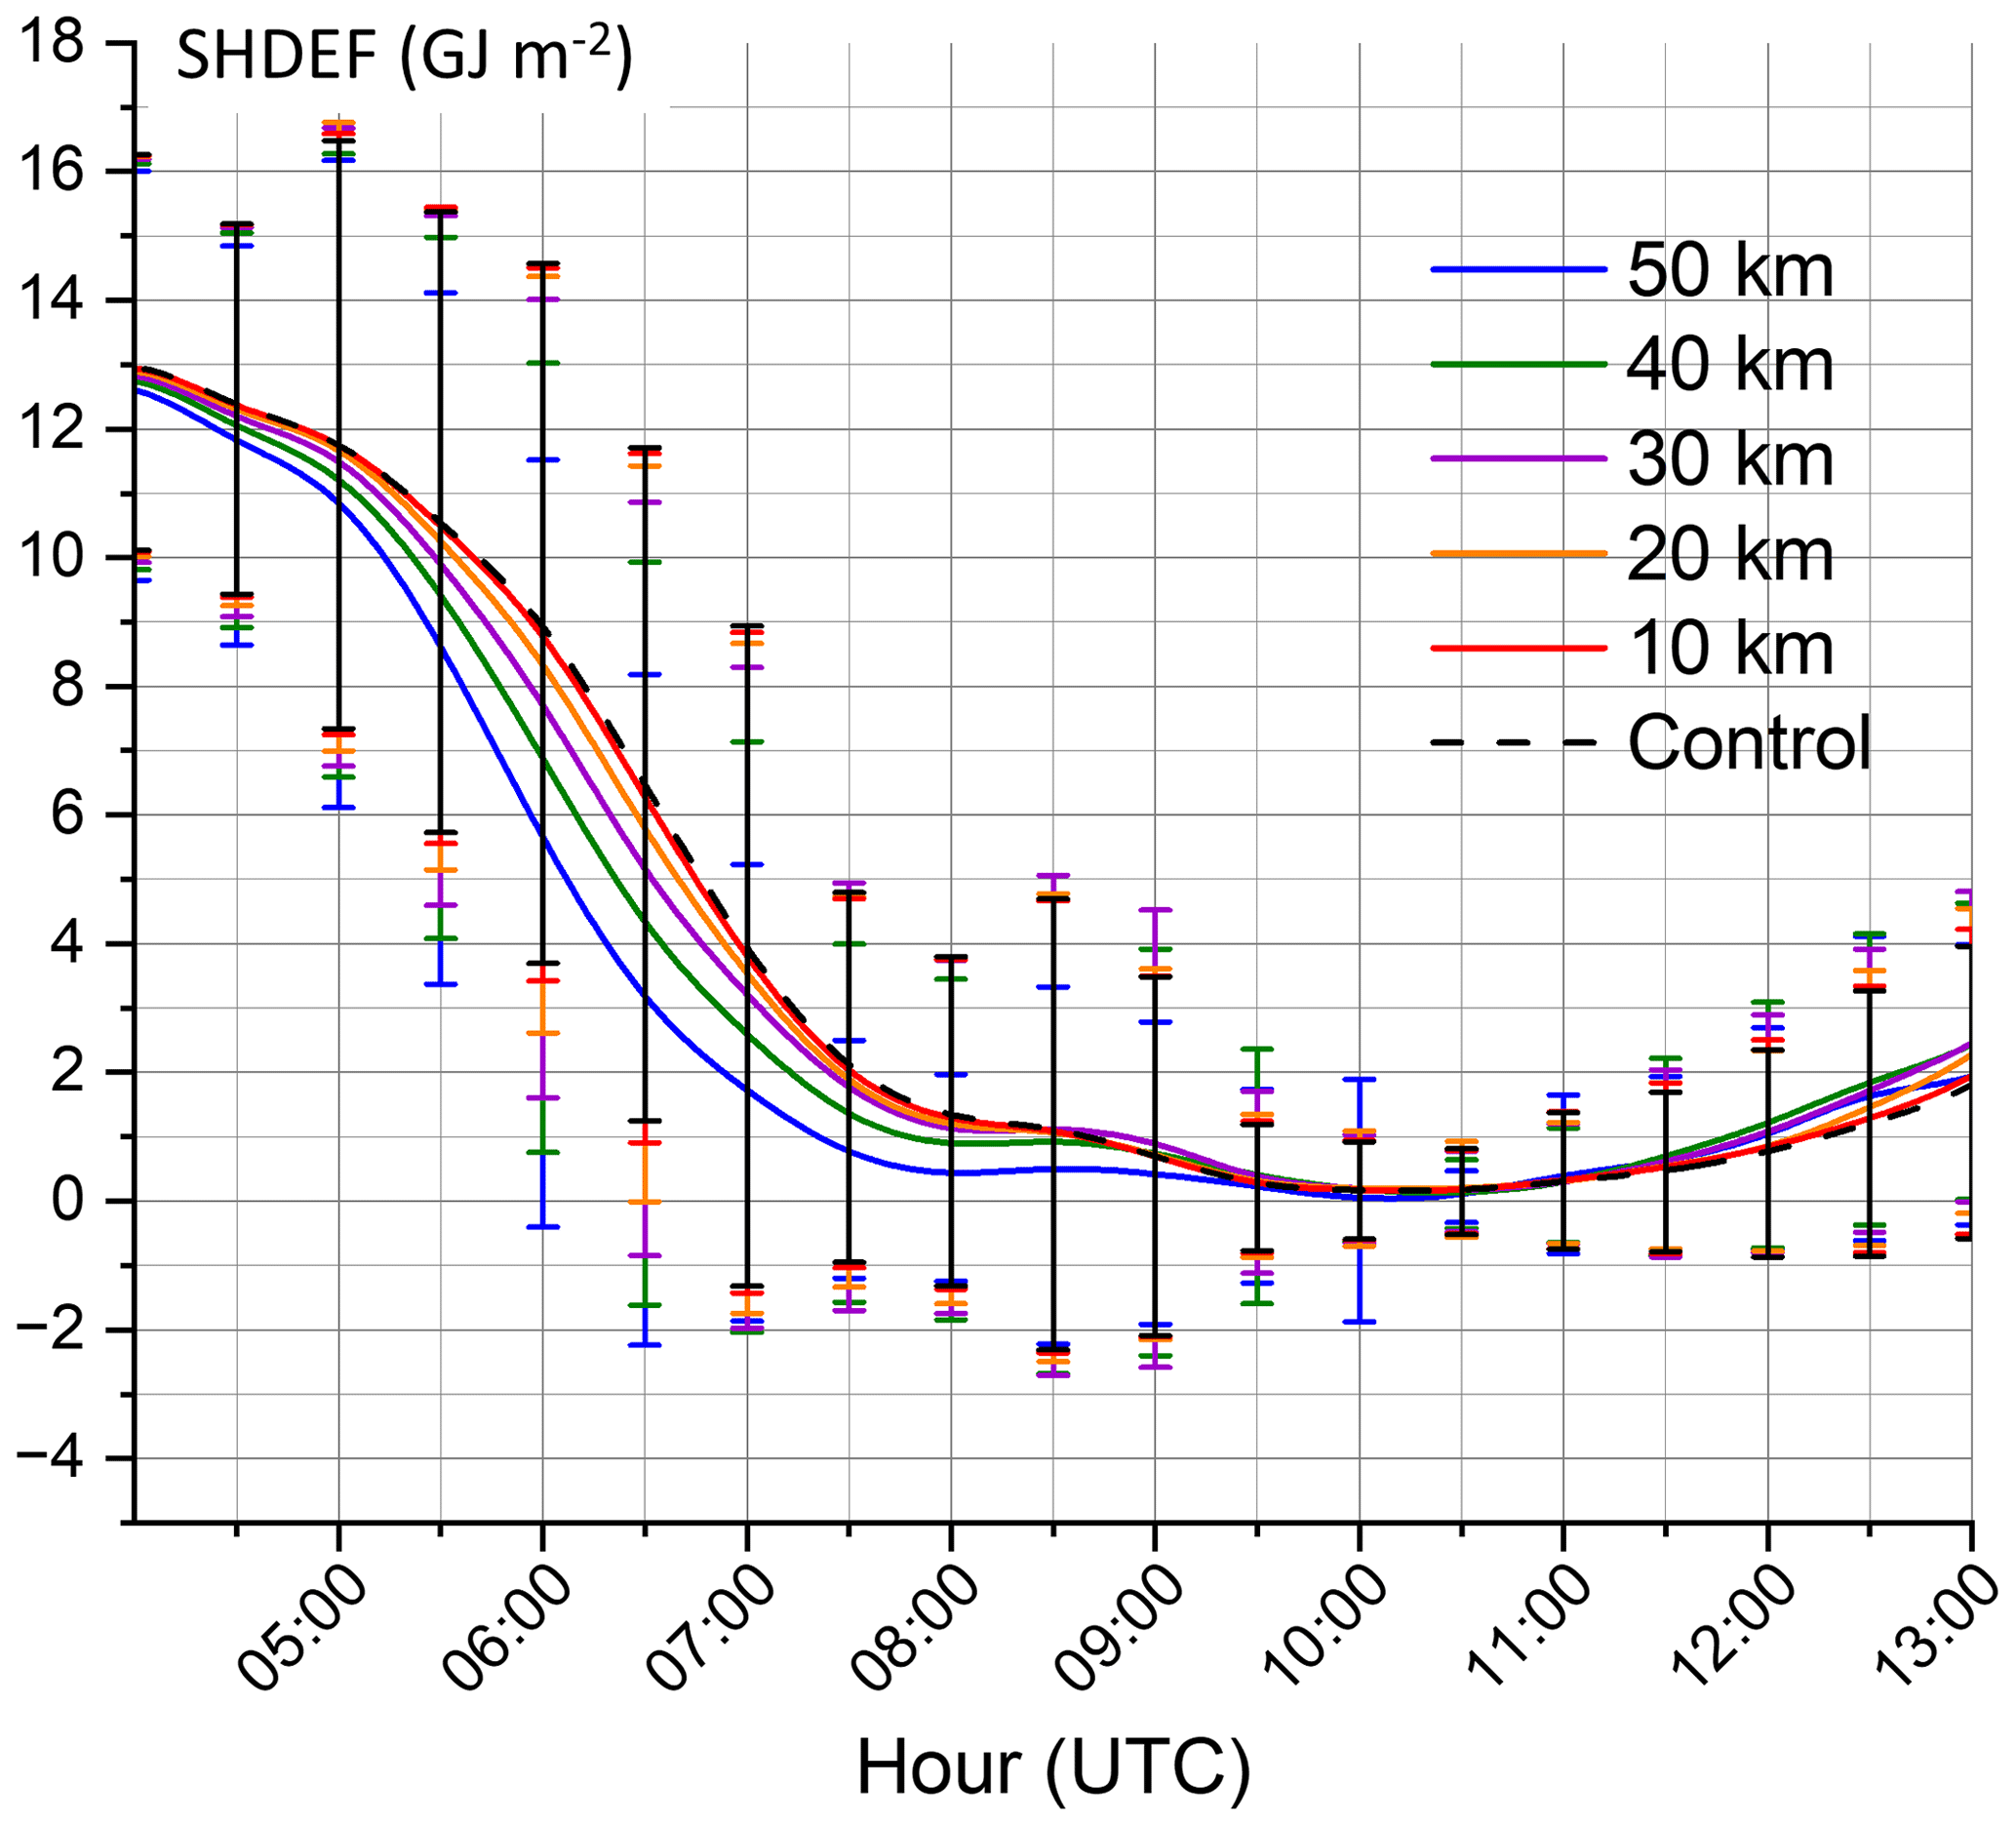
Figure 13Mean sensible heat deficit (SHDEF) on 27 July over the eastern 50 km ABS. Also shown is the spatial standard deviation.
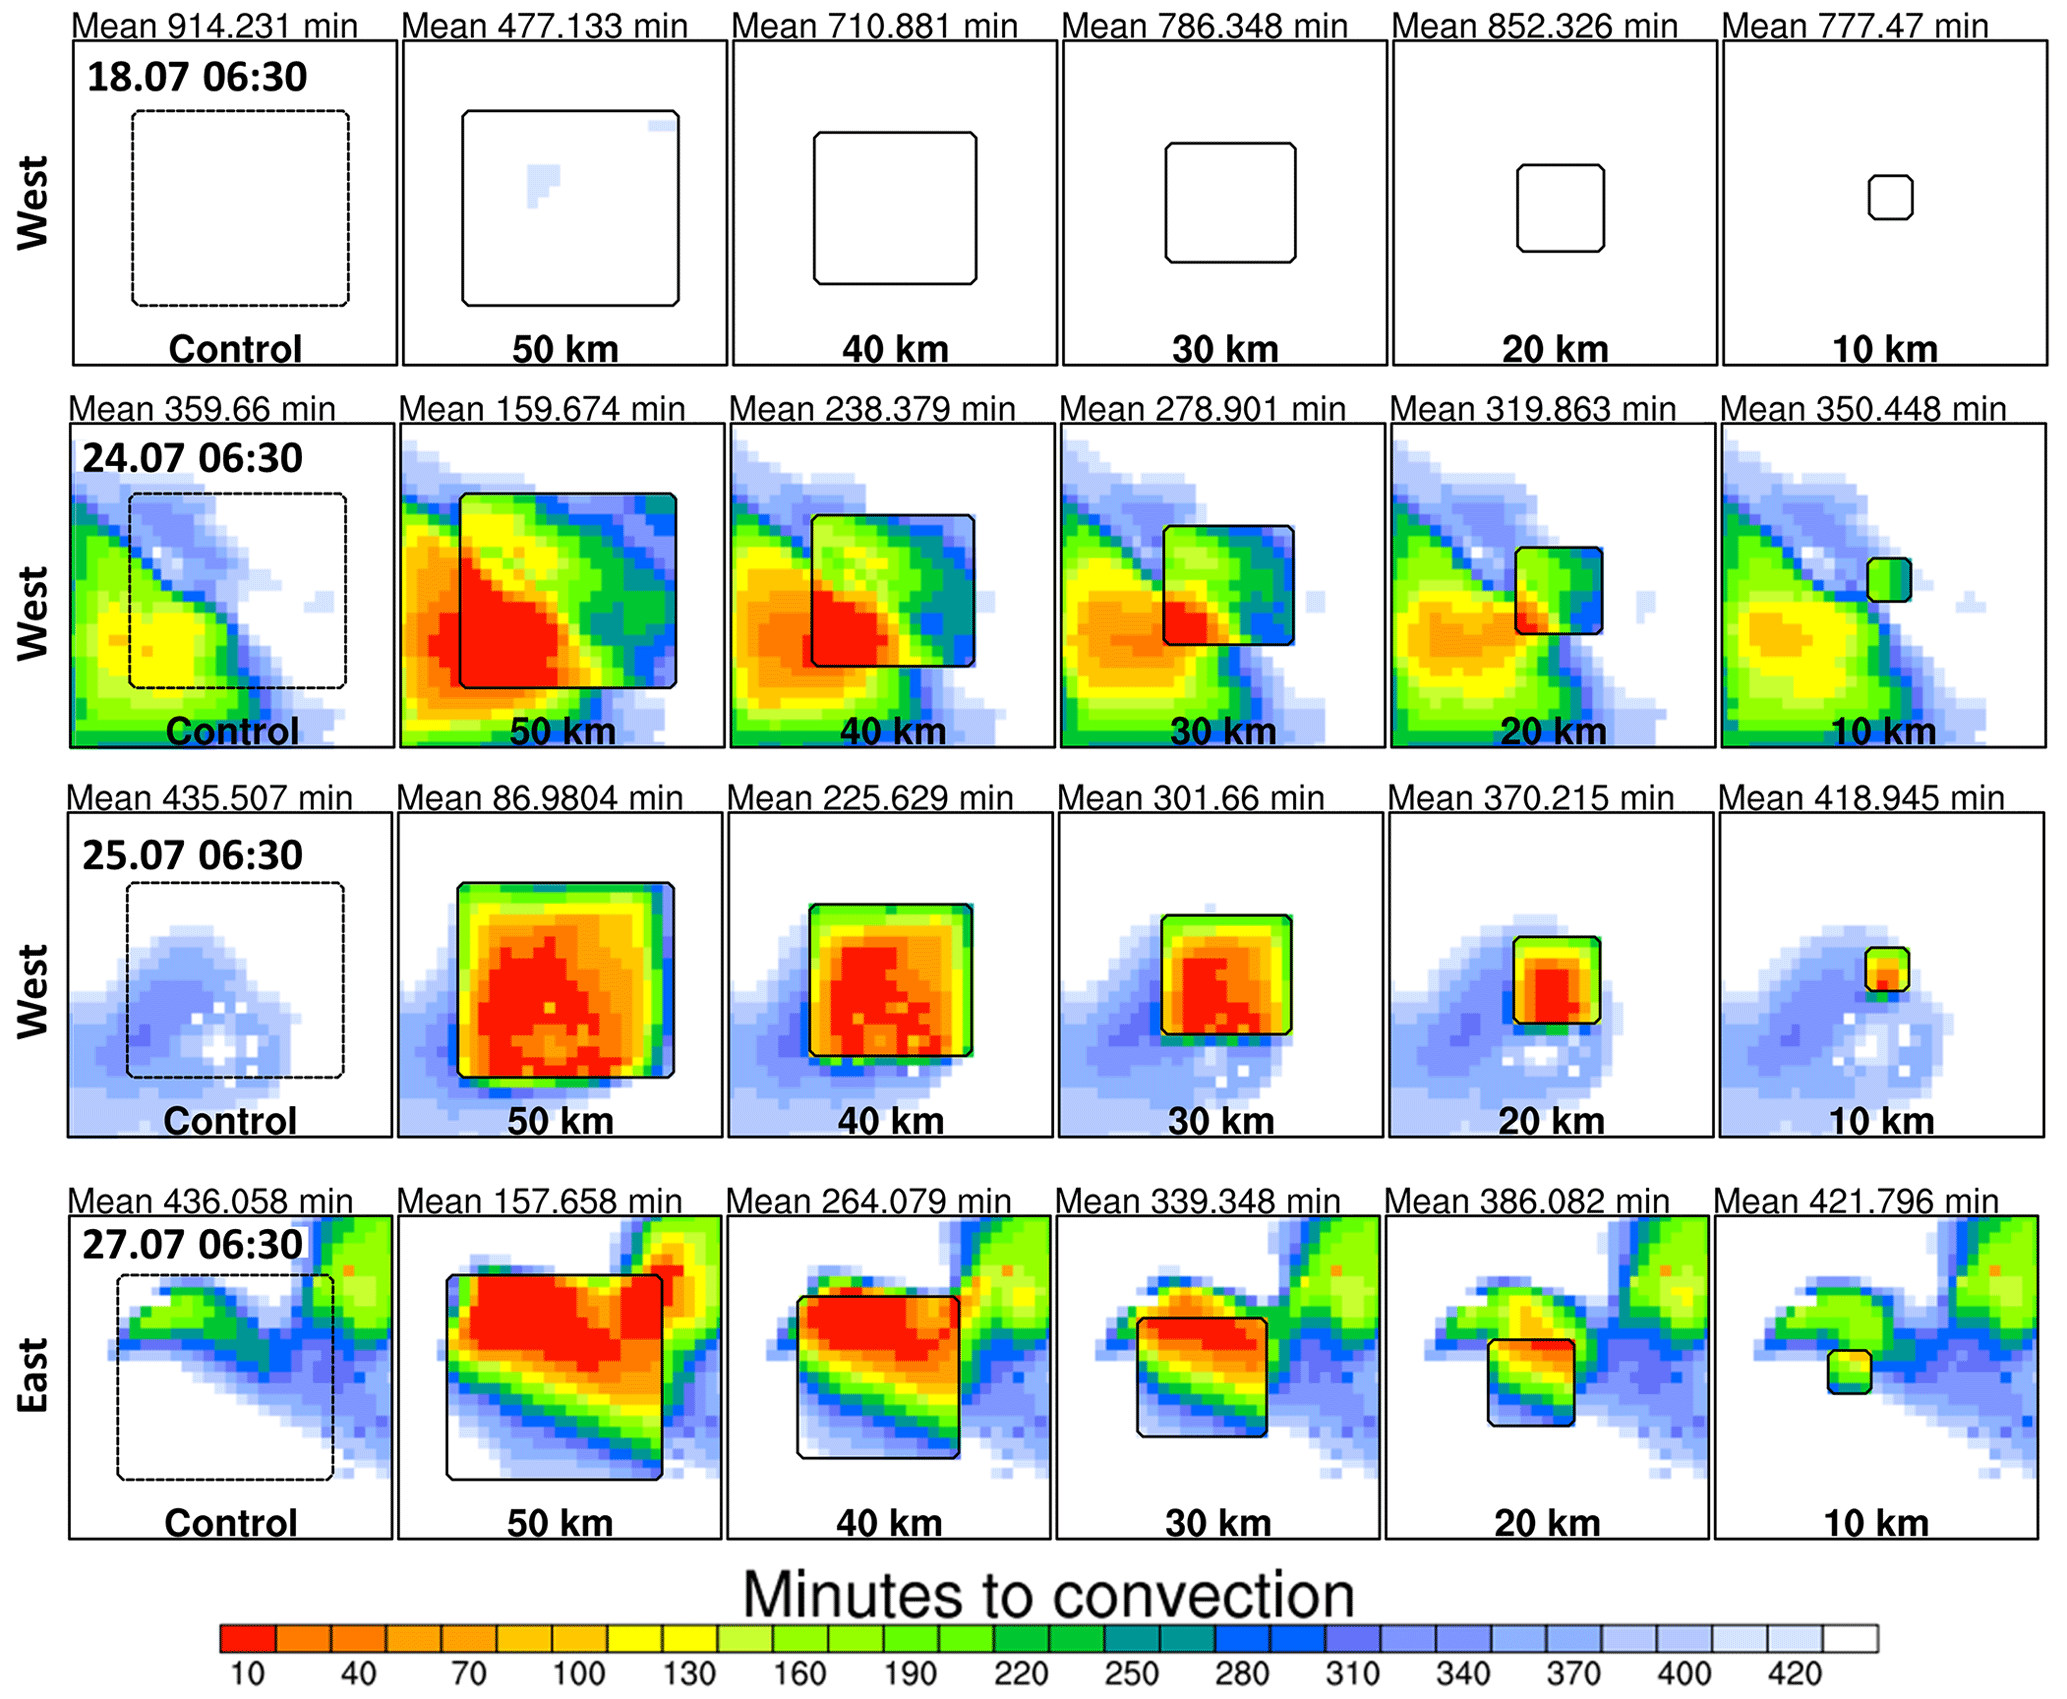
Figure 14Time until convection initiation for each grid cell based on the heated condensation framework (Tawfik et al., 2015a) at 06:30 UTC.
We then applied the heating deficit (SHDEF) to calculate convective timescale (TCI), or the time required to reach CI (minutes), based on the actual sensible heating rate (HFX, W m−2). This was calculated in Eq. (1) simply as
The convective timescales are plotted in Figs. 14 and 15, this time for all cases. Figure 14 shows TCI at 06:30, roughly 2.5 to 3 h before the onset of rainfall (09:00–09:30, Fig. 5), and Fig. 15 is the exact equivalent, half an hour later. From Fig. 14 we can see that 18 July has almost no TCI values below 420 min at this time, and this may be the reason why the rainfall impact is weaker and starts later than the other cases. In the skew-T there is a dry layer above the surface (Fig. 2a), in which we would expect dry-air entrainment to reduce buoyancy substantially. This dry layer would be reflected in the HCF computation which mixes column humidity before checking for saturation. In all cases, the Control scenario drops no lower than ∼ 100 min, which may be too long for surface parcels in a dry environment to reach the LFC – which is ∼ 4000–4500 m at this time of day (Fig. 11a). At the 10 km scale, the mean timescale (values above panels) required for CI is hardly reduced when compared to the Control (15–30 min), apart from on 18 July when there is a 100 min reduction. At 20 km, there is generally a more sudden decrease in the time required. There are grid cells in the 10 km scale where short timescales are reached but the spatial extent of these areas is small and this may inhibit the possibility of CI.
If we compare the same index 1 h later (Fig. 15), we can see that all ABS scales are now at or below a 10 min convective time, indicating higher potential for impacts. Even at this later time the Control still does not reach short convective times (over the 50 km ABS area), but there are some areas around this area with shorter times, indicating instability, and this is reflected by the rainfall patterns (Fig. 4). Impacts are very likely constrained by two factors – the horizontal extent of the ABS and the later “onset” time for shorter convective times, e.g., < 10 min. As before, we may deduce that the time when TCI approaches zero is likely a big factor. The 2 d with the most rainfall, 25 and 27 July, exhibit short timescales earlier and over a larger area of the ABS than the other cases (Fig. 15, bottom two rows).
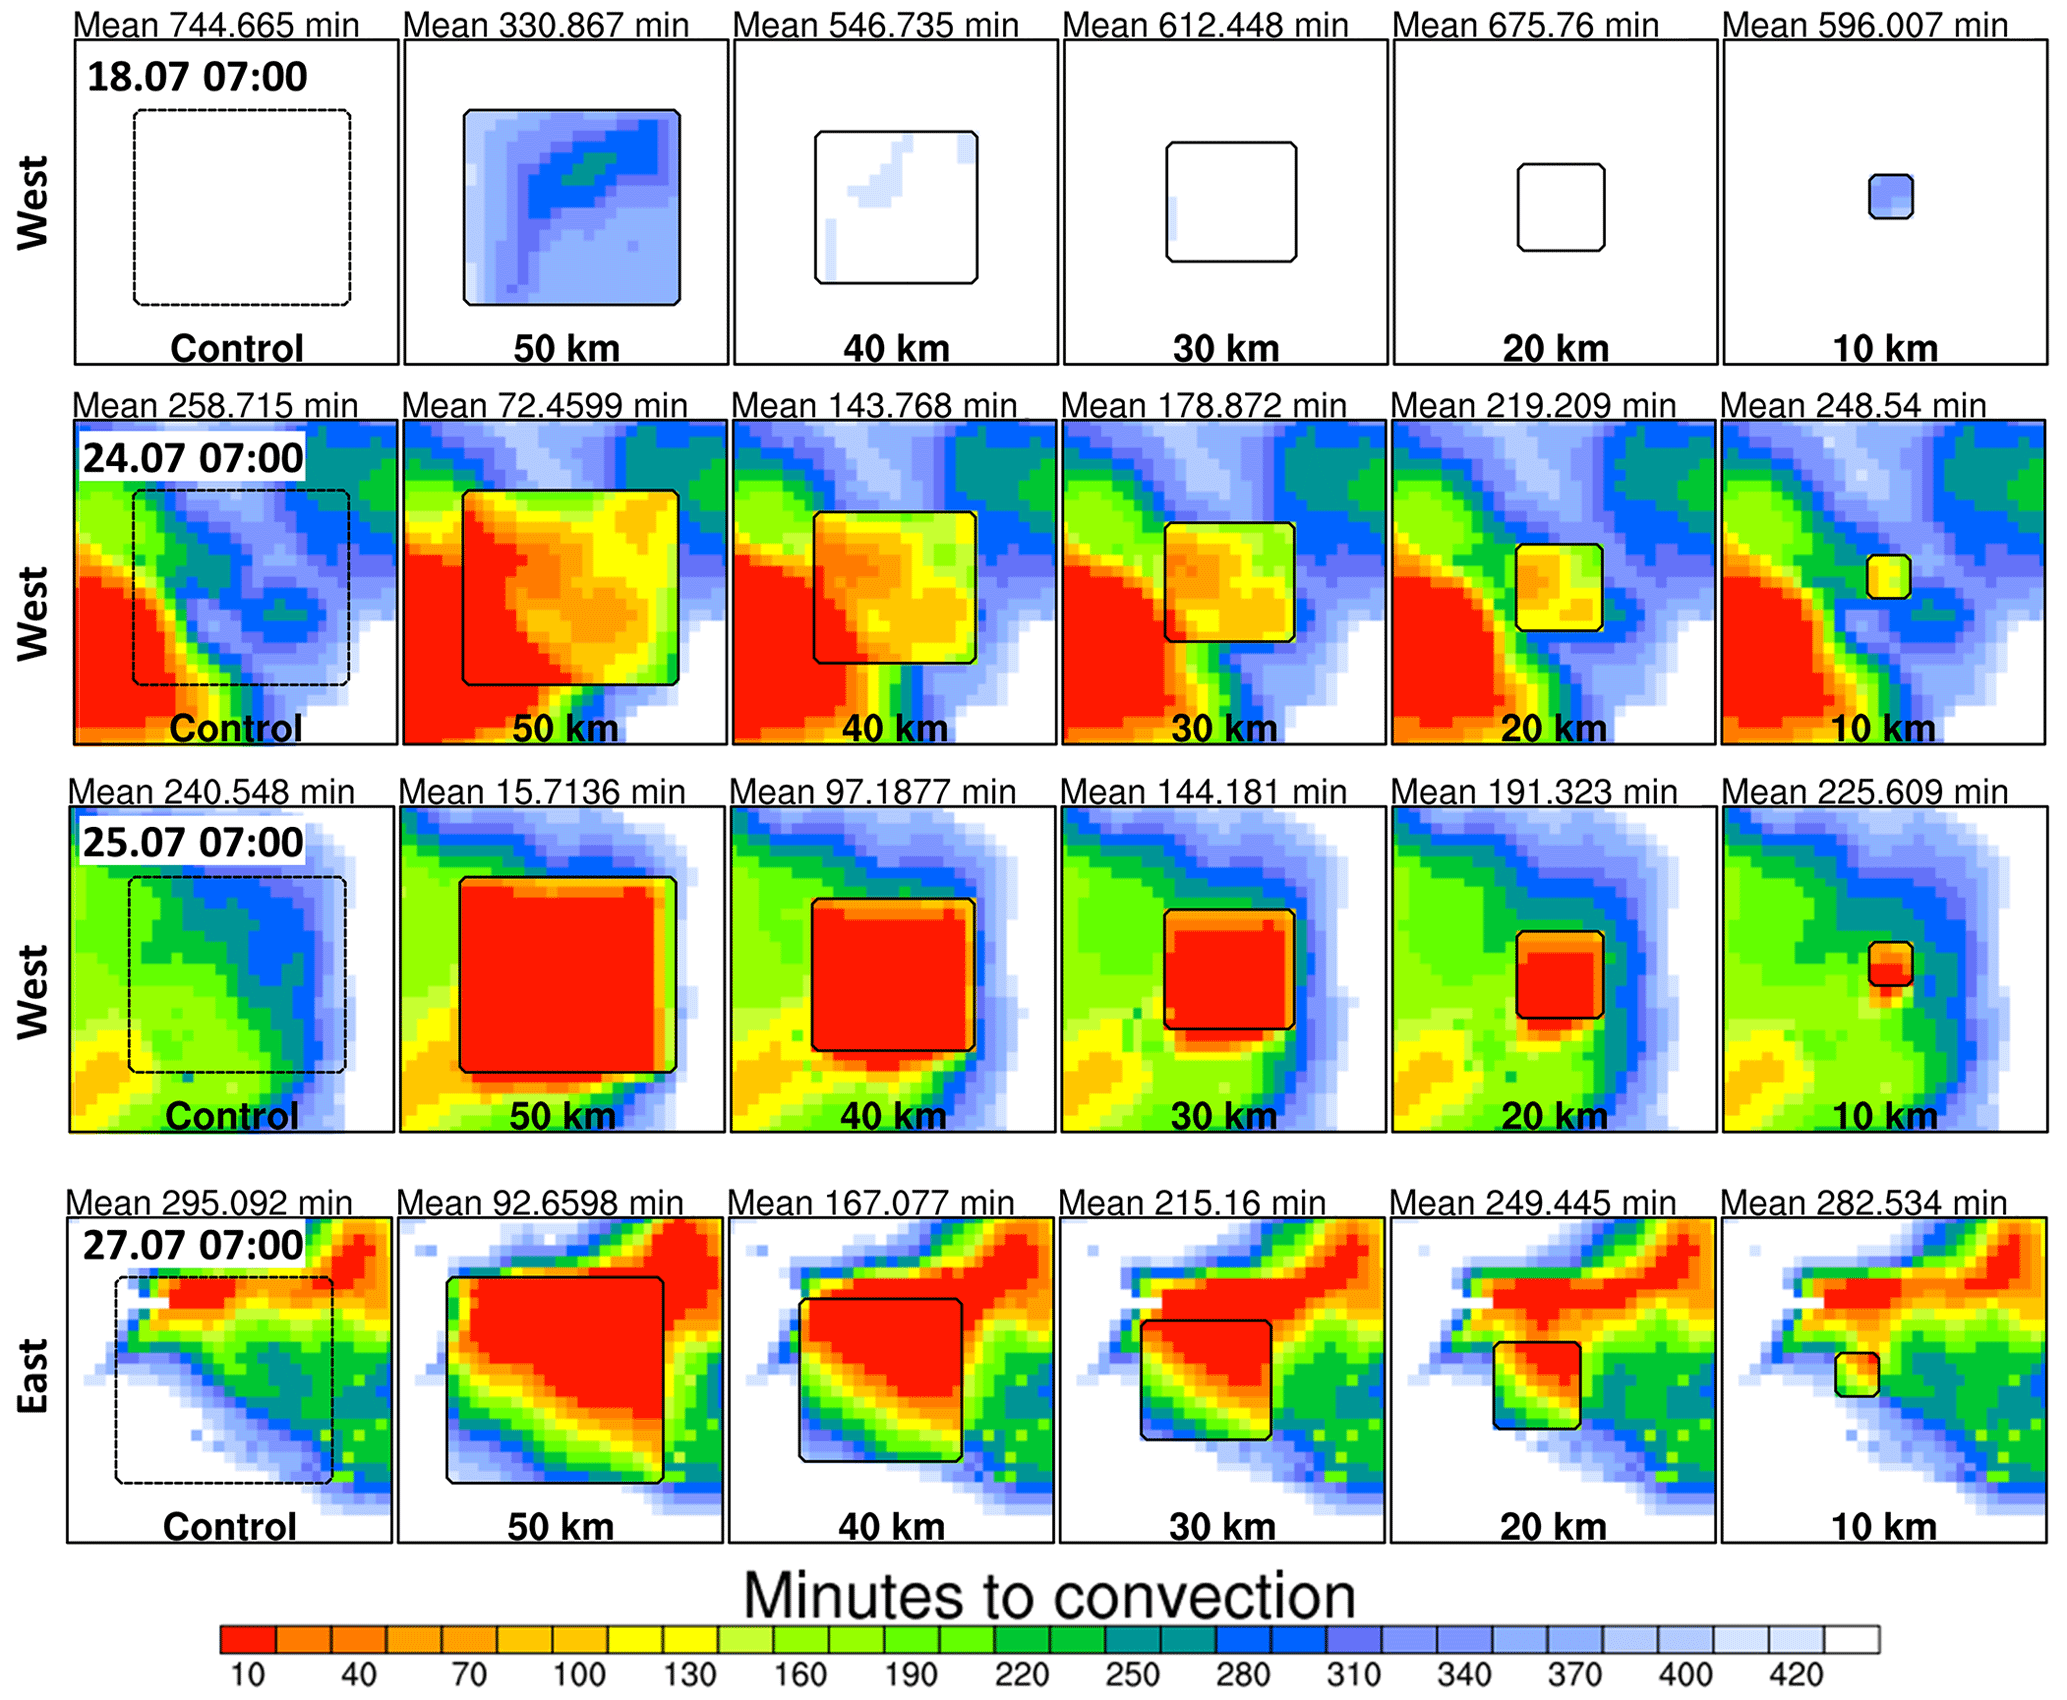
Figure 15 shows areally averaged TCI within the respective east or west 50 km perimeters. Between cases, there are differences in the appearance of the curves in the 40 and 50 km scenarios in slope, time, and magnitude. In general, onset times are earlier in the 24 and 25 July cases (panel b and c) and the timescales both drop to 0 min. On 18 July (a), mean TCI does not fall much below 45 min (except for the 50 km scale), reflecting lower impacts in general, and the onset times (when TCI values drop rapidly) are later than in the other cases. 27 July (d) has lower TCI values and earlier onset times than 18 July, but later than 24 and 25 July. In general, for all cases, the spacing between the lines increases with scale. What is also interesting is that there are differences in the slope from high to low TCI. The strongest cases (24 and 25 July) tend to have steeper slopes which occur early. 25 July, when the strongest impacts occurred, has the steepest slopes from all of the cases, which hints that the rate of change in HFX is also an important factor.
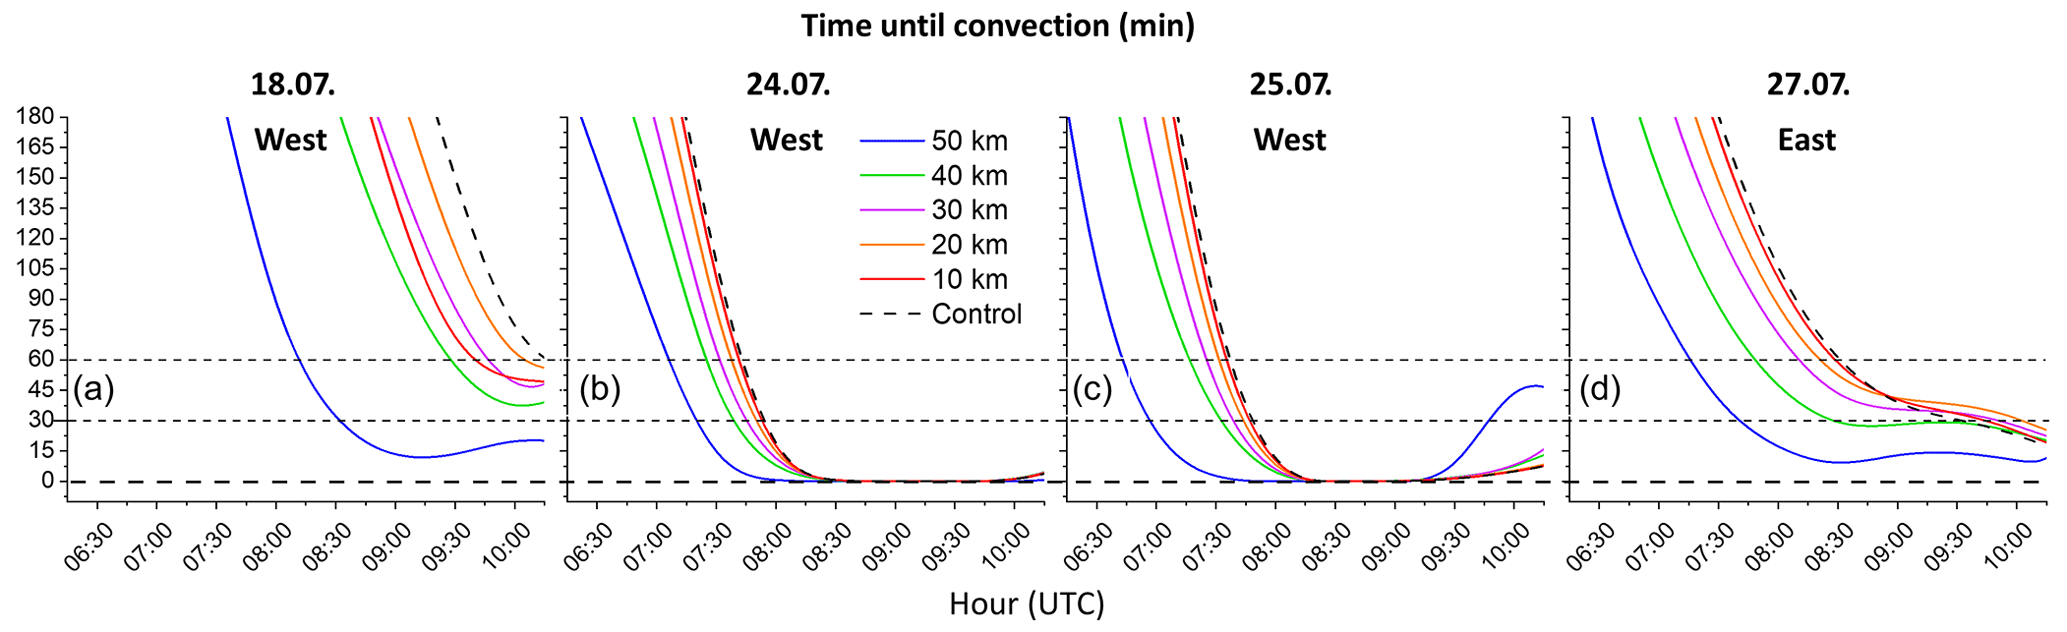
Figure 16Time until convection based on the HCF index (Tconv, mins) – areal mean over a 50 km footprint; cases are split into east or west areas based on the strongest rainfall impacts.
In this study, we investigated whether artificial black surfaces can enhance rainfall in the UAE, taking a validated model approach. Our objectives are to examine the scale dependency of ABS impacts with respect to rainfall enhancement and convective processes and to explore the predictability of impacts by applying the LA feedback metric (the HCF index).
Simulations of four moderately unstable cases demonstrate that rainfall is enhanced in the UAE summertime by low-albedo surfaces, primarily through intense surface heating. At this time of the year, there is a daily sea breeze which brings humidity, convergence lines, and reduced CIN along the front, but this is not always sufficient to trigger CI. The addition of large ABSs acts to amplify these factors by pre-conditioning the atmosphere, further reducing CIN, and intensifying or creating convergence lines. It is still uncertain though if impacts on circulation or the sea breezes are modified or even teleconnected to other regions. This is a subject requiring further investigation, most likely using longer simulations to provide suitable statistics.
We have demonstrated that ABS scale is important and that impacts appear to increase proportionally with area with respect to rainfall and convective processes like convergence and vertical accelerations. Specifically, there are scale dependencies on production of surface convergence lines (0–500 m), mean convergence (0–2 km), maximum vertical velocities, the frequency and height of updrafts, and modification of PBL and LFC height. Additionally, aspects of the convective timescale curve (Fig. 15) appear to be related to impact strength – specifically the daily timing (onset) and the downward rate of change. If the convective time dip starts earlier in the day for instance, the impacts are likely to be stronger because more pre-conditioning occurs before the sea-breeze front arrives – which usually arrives at a similar time of day. Additionally, a steeper slope seems to be associated with stronger impacts. The steepness could be increased by influxes of humidity, a more unstable atmospheric profile, greater solar radiation intensity, or other factors, all of which would reduce the sensible heat deficit, as derived from the HCF. Both the convective time onset and slope are likely to vary from day to day with weather conditions, as well as with ABS scale.
As well as identifying relationships between impact and scale, we have also gained insights into lower scale boundaries in the 2015 summer. At ABS scales of 10 km, sensible heating rates (per unit area) are relatively similar to 20 and 30 km scales (Figs. 8 and 9), but there is little effect on convective processes and rainfall, whereas from 20 km upwards, impacts occurred in all cases. The lack of impact at 10 km is due primarily to insufficient heating over a wide enough area. The smaller footprint means that an advected air mass does not accumulate enough heat to reduce lee-side CIN (Fig. 8), and thus the near surface remains stable. Furthermore, compared to larger scales, the 10 km ABS does not produce strong updrafts, especially not at heights which approach the LFC (Fig. 12). In fact, the velocity–height trend line demarcates the 10–20 km transition quite well and may provide a useful metric for further prediction analyses. Furthermore, the convective timescale has provided useful insights into impacts of scale and onset timing and could be used with regional climate simulations to predict ABS impacts within a given climate envelope.
In terms of rainfall enhancement, we are assuming that the water quantities produced by the model microphysics are plausible. If they are representative, then the implications for these amounts would be considerable. Extrapolating from the amounts, if the UAE implemented just one pair of ABS surfaces of 20 or 50 km scales, then 10 rainfall enhancement “events” per year would supply enough water for 3000 or 15 000 people. These amounts would increase if more events occurred or if more than two such ABSs were implemented.
Confidence in rainfall enhancement and rainfall quantification should be tested in further studies which assess simulation sensitivity, regional climate variability, and statistical analyses. Ensemble UAE simulations with varying model physics including microphysics (e.g., Schwitalla et al., 2020; Fonseca et al., 2020, Taraphdar et al., 2021) would be particularly useful. Here, data assimilation, quantitative precipitation estimation, and rain radar and satellite analyses may be employed (Bauer et al., 2015; Kawabata et al., 2018; Branch et al., 2020; Schwitalla and Wulfmeyer, 2014). The latter analyses, probably based on seasonal simulations, will be especially important to further test the plausibility of convective rainfall amounts from a statistical point of view. For now, we have at least some confidence that WRF V4 has reproduced convective cells in a satisfactory way in the region (Fonseca et al., 2022). Sensitivity to model resolution could be investigated by conducting large eddy (100-300 m) or turbulence-permitting (< 100 m) simulations (e.g., Bauer et al., 2020, 2023). A caveat here is that evaluation of model microphysics at finer scales remains scarce, unlike convection-permitting (CP) simulations (2–4 km grid scale). Fine-scale simulations would certainly provide further insights into physical processes. Finally, long-term temporal variability of impacts may be tested further by application of climate or multi-seasonal simulations, together with statistical analyses.
In summary, enhancing freshwater resources is essential for countries like the UAE, where water scarcity is becoming more severe, especially under continuing climate change. ABS systems offer a means of combatting this scarcity, augmenting the UAE's strategy of cloud seeding, desalination, and water importation. ABSs could be composed of a combination of black-painted PV panels and plant canopies, as long as the net effect of modified albedo, roughness, and energy balances is conducive to enhancement. Large-scale solar farms are being realized in the region already, and through clever design, there may be an opportunity to take advantage of combined rainfall enhancement and power generation. Work remains though to identify and measure the complex exchanges above and below the solar panels, especially if atmospheric interactions are to be successfully simulated. For instance, one may switch off solar electricity generation for a short time, when conducive atmospheric conditions are present. This would increase the heating of the atmosphere during the best conditions for rainfall enhancement. If a balance between base-load requirements and rainfall enhancement can be struck, there could be great potential for this synergy. There are other synergies too, such as the possibility to use solar-powered irrigation systems or desalination. Thus, ABS systems offer a flexible means of covering large areas to enhance rainfall and should therefore be made a high priority for further research.
A description of WRF V4 can be found at https://doi.org/10.5065/1dfh-6p97 (Skamarock et al., 2021). Data analyses were done with NCAR Command Language (NCL) V 6.6.2 software (2019) – Bounder, Colorado, UCAR/NCAR/CISL/TDD, available at https://doi.org/10.5065/D6WD3XH5 (NCAR, 2022). Other graphics were produced with OriginLab V10.0.0.154 (Academic) software (OriginLab, Northampton, MA), available at https://www.originlab.com/, last access: 4 March 2022.
The WRF model output data created for this study are too large to store in standard repositories but are available in NetCDF format on request. Access to the GRIB ECMWF Operational Analysis model-level data used for forcing WRF is restricted and not freely available. Further information may be obtained at https://www.ecmwf.int/en/forecasts/dataset/operational-archive, last access: 29 January 2024.
OB conducted all simulations and the majority of data analysis as well as preparing the paper. LJ provided scientific support and assisted with analysis and paper preparation. TS provided scientific support and assisted with analysis and paper preparation. KWS provided scientific support and helped to prepare the paper. VW contributed to experimental design and scientific support as well as helping to prepare the paper.
The contact author has declared that none of the authors has any competing interests.
Publisher's note: Copernicus Publications remains neutral with regard to jurisdictional claims made in the text, published maps, institutional affiliations, or any other geographical representation in this paper. While Copernicus Publications makes every effort to include appropriate place names, the final responsibility lies with the authors.
This material is based on work supported by the UAE Research Program for Rain Enhancement Science under the National Center of Meteorology, Abu Dhabi, UAE. Furthermore, we are grateful to the High-Performance Computing Center Stuttgart (HLRS) for providing support and computing time on the Hawk Apollo system. We are also grateful to ECMWF for providing operational analysis data.
This research has been supported by the UAE Research Program for Rain Enhancement Science.
This paper was edited by Daniel Kirk-Davidoff and reviewed by two anonymous referees.
Abdulrahman, S. A.: Water shortage in GCC countries: transferring water from Iraqi Kurdistan Region, Int. J. Environ. Stud., 77, 191–207, https://doi.org/10.1080/00207233.2019.1690335, 2020.
Al Azhar, M., Temimi, M., Zhao, J., and Ghedira, H.: Modeling of circulation in the Arabian Gulf and the Sea of Oman: Skill assessment and seasonal thermohaline structure, J. Geophys. Res.-Ocean., 121, 1700–1720, https://doi.org/10.1002/2015JC011038, 2016.
Albannay, S., Kazama, S., Oguma, K., Hashimoto, T., and Takizawa, S.: Water demand management based on water consumption data analysis in the Emirate Of Abu Dhabi, Water, 13, 2827, https://doi.org/10.3390/w13202827, 2021.
Albergel, C., de Rosnay, P., Balsamo, G., Isaksen, L., and Muñoz-Sabater, J.: Soil Moisture Analyses at ECMWF: Evaluation Using Global Ground-Based In Situ Observations, J. Hydrometeorol., 13, 1442–1460, https://doi.org/10.1175/JHM-D-11-0107.1, 2012.
Al Hosari, T., Al Mandous, A., Wehbe, Y., Shalaby, A., al Shamsi, N., al Naqbi, H., al Yazeedi, O., al Mazroui, A., and Farrah, S.: The UAE Cloud Seeding Program: A Statistical and Physical Evaluation, Atmosphere, 12, 1013, https://doi.org/10.3390/ATMOS12081013, 2021.
Ancell, B. C., Bogusz, A., Lauridsen, M. J., and Nauert, C. J.: Seeding Chaos: The Dire Consequences of Numerical Noise in NWP Perturbation Experiments, Bull. Am. Meteorol. Soc., 99, 615–628, https://doi.org/10.1175/BAMS-D-17-0129.1, 2018.
Balsamo, G., Beljaars, A., Scipal, K., Viterbo, P., van den Hurk, B., Hirschi, M., and Betts, A. K.: A Revised Hydrology for the ECMWF Model: Verification from Field Site to Terrestrial Water Storage and Impact in the Integrated Forecast System, J. Hydrometeorol., 10, 623–643, https://doi.org/10.1175/2008JHM1068.1, 2009.
Bauer, H.-S., Schwitalla, T., Wulfmeyer, V., Bakhshaii, A., Ehret, U., Neuper, M., and Caumont, O.: Quantitative precipitation estimation based on high-resolution numerical weather prediction and data assimilation with WRF – a performance test, Tellus A, 67, 25047, https://doi.org/10.3402/tellusa.v67.25047, 2015.
Bauer, H. S., Muppa, S. K., Wulfmeyer, V., Behrendt, A., Warrach-Sagi, K., and Späth, F.: Multi-nested WRF simulations for studying planetary boundary layer processes on the turbulence-permitting scale in a realistic mesoscale environment, Tellus A, 72, 1–28, https://doi.org/10.1080/16000870.2020.1761740, 2020.
Bauer, H.-S., Späth, F., Lange, D., Thundathil, R., Ingwersen, J., Behrendt, A., and Wulfmeyer, V.: Evolution of the convective boundary layer in a WRF simulation nested down to 100 m resolution during a cloud-free case of LAFE 2017 and comparison to observations, J. Geophys. Res.-Atmos., 128, e2022JD037212, https://doi.org/10.1029/2022JD037212, 2023.
Becker, K., Wulfmeyer, V., Berger, T., Gebel, J., and Münch, W.: Carbon farming in hot, dry coastal areas: an option for climate change mitigation, Earth Syst. Dynam., 4, 237–251, https://doi.org/10.5194/esd-4-237-2013, 2013.
Black, J. F., and Tarmy, B. L.: The Use of Asphalt Coatings to Increase Rainfall, J. Appl. Meteorol. Climatol., 2, 557–564, https://doi.org/10.1175/1520-0450(1963)002, 1963.
Böer, B.: An introduction to the climate of the United Arab Emirates, J. Arid Env., Academic Press, https://doi.org/10.1006/jare.1996.0162, 1997.
Branch, O., Warrach-Sagi, K., Wulfmeyer, V., and Cohen, S.: Simulation of semi-arid biomass plantations and irrigation using the WRF-NOAH model – a comparison with observations from Israel, Hydrol. Earth Syst. Sci., 18, 1761–1783, https://doi.org/10.5194/hess-18-1761-2014, 2014.
Branch, O., Behrendt, A., Gong, Z., Schwitalla, T., and Wulfmeyer, V.: Convection Initiation over the Eastern Arabian Peninsula, Meteorol. Z., 29, 67–77, https://doi.org/10.1127/METZ/2019/0997, 2020.
Branch, O., Schwitalla, T., Temimi, M., Fonseca, R., Nelli, N., Weston, M., Milovac, J., and Wulfmeyer, V.: Seasonal and diurnal performance of daily forecasts with WRF V3.8.1 over the United Arab Emirates, Geosci. Model Dev., 14, 1615–1637, https://doi.org/10.5194/gmd-14-1615-2021, 2021.
Branch, O. and Wulfmeyer, V.: Deliberate enhancement of rainfall using desert plantations, P. Natl. Acad. Sci. USA, 116, 18841–18847, https://doi.org/10.1073/pnas.1904754116, 2019.
Carrer, D., Pique, G., Ferlicoq, M., Ceamanos, X., and Ceschia, E.: What is the potential of cropland albedo management in the fight against global warming? A case study based on the use of cover crops, Environ. Res. Lett., 13, 044030, https://doi.org/10.1088/1748-9326/AAB650, 2018.
Cenedese, A. and Monti, P.: Interaction between an inland urban heat island and a sea-breeze flow: A laboratory study, J. Appl. Meteorol., 42, 1569–1583, https://doi.org/10.1175/1520-0450(2003)042<1569:IBAIUH>2.0.CO;2, 2003
Chrysoulakis, N., Grimmond, S., Feigenwinter, C., Lindberg, F., Gastellu-Etchegorry, J. P., Marconcini, M., Mitraka, Z., Stagakis, S., Crawford, B., Olofson, F., Landier, L., Morrison, W., and Parlow, E.: Urban energy exchanges monitoring from space, Sci. Rep., 8, 1–8, https://doi.org/10.1038/s41598-018-29873-x, 2018.
Condron, A.: Towing icebergs to arid regions to reduce water scarcity, Sci. Rep., 13, 365, https://doi.org/10.1038/s41598-022-26952-y, 2020.
Donlon, C. J., Martin, M., Stark, J., Roberts-Jones, J., Fiedler, E., and Wimmer, W.: The Operational Sea Surface Temperature and Sea Ice Analysis (OSTIA) system, Remote Sens. Environ., 116, 140–158, https://doi.org/10.1016/j.rse.2010.10.017, 2012.
Doughty, C. E., Field, C. B., Mcmillan, A. M. S., Doughty, C. E., Field, C. B., and Mcmillan, A. M. S.: Can crop albedo be increased through the modification of leaf trichomes, and could this cool regional climate? A letter, Climatic Change, 104, 379–387, https://doi.org/10.1007/s10584-010-9936-0, 2011.
Eager, R. E., Raman, S., Wootten, A., Westphal, D. L., Reid, J. S., and Al Mandoos, A.: A climatological study of the sea and land breezes in the Arabian Gulf region, J. Geophys. Res.-Atmos., 113, 1–12, https://doi.org/10.1029/2007JD009710, 2008.
Fan, Y., Li, Y., Wang, X., and Catalano, F.: A new convective velocity scale for studying diurnal urban heat island circulation, J. Appl. Meteorol. Clim., 55, 2151–2164, https://doi.org/10.1175/JAMC-D-16-0099.1, 2016.
Fonseca, R., Temimi, M., Thota, M. S., Nelli, N. R., Weston, M. J., Suzuki, K., Uchida, J., Kondapalli, N. K., Branch, O., Wehbe, Y., Al Hosari, T., Al Shamsi, N., and Shalaby, A.: On the analysis of the performance of WRF and nicam in a hyperarid environment, Weather Forecast., 35, 891–919, https://doi.org/10.1175/WAF-D-19-0210.1. 2020.
Fonseca, R., Francis, D., Nelli, N., Farrah, S., Wehbe, Y., Al Hosari, T., and Al Mazroui, A.: Assessment of the WRF Model as a Guidance Tool Into Cloud Seeding Operations in the United Arab Emirates, Earth Space Sci., 9, 891–919, https://doi.org/10.1029/2022EA002269, 2022.
Frei, C., Christensen, J. H., Déqué, M., Jacob, D., Jones, R. G., and Vidale, P. L.: Daily precipitation statistics in regional climate models: Evaluation and intercomparison for the European Alps, J. Geophys. Res.-Atmos., 108, 4124, https://doi.org/10.1029/2002JD002287, 2003.
Freitas, E. D., Rozoff, C. M., Cotton, W. R., and Silva Dias, P. L.: Interactions of an urban heat island and sea-breeze circulations during winter over the metropolitan area of São Paulo, Brazil, Bound.-Lay. Meteorol., 122, 43–65, https://doi.org/10.1007/s10546-006-9091-3, 2007.
Gerken, T., Ruddell, B. L., Yu, R., Stoy, P. C., and Drewry, D. T.: Robust observations of land-to-atmosphere feedbacks using the information flows of FLUXNET, Npj Clim. Atmos. Sci., 2, 37, https://doi.org/10.1038/s41612-019-0094-4, 2019.
Han, J. Y. and Baik, J. J.: A theoretical and numerical study of urban heat island-induced circulation and convection, J. Atmos. Sci., 65, 1859–1877, https://doi.org/10.1175/2007JAS2326.1, 2008.
Hidalgo, J., Masson, V., and Gimeno, L.: Scaling the daytime urban heat island and urban-breeze circulation, J. Appl. Meteorol. Climatol., 49, 889–901, https://doi.org/10.1175/2009JAMC2195.1, 2010.
Iacono, M. J., Delamere, J. S., Mlawer, E. J., Shephard, M. W., Clough, S. A., and Collins, W. D.: Radiative forcing by long-lived greenhouse gases: Calculations with the AER radiative transfer models, J. Geophys. Res.-Atmos., 113, 1–8, https://doi.org/10.1029/2008JD009944, 2008.
Jach, L., Warrach-Sagi, K., Ingwersen, J., Kaas, E., and Wulfmeyer, V.: Land Cover Impacts on Land-Atmosphere Coupling Strength in Climate Simulations with WRF Over Europe, J. Geophys. Res.-Atmos., 125, e2019JD031989, https://doi.org/10.1029/2019JD031989, 2020.
Jie Lu, Arya, S. P., Snyder, W. H., and Lawson, R. E. J.: A laboratory study of the urban heat island in a calm and stably stratified environment, Part I: temperature field, J. Appl. Meteorol., 36, 1377–1391, https://doi.org/10.1175/1520-0450(1997)036<1377:alsotu>2.0.co;2, 1997.
Kala, J. and Hirsch, A. L.: Could crop albedo modification reduce regional warming over Australia?, Weather Clim. Extrem., 30, 100282, https://doi.org/10.1016/J.WACE.2020.100282, 2020.
Kala, J., Hirsch, A. L., Ziehn, T., Perkins-Kirkpatrick, S. E., De Kauwe, M. G., and Pitman, A.: Assessing the potential for crop albedo enhancement in reducing heatwave frequency, duration, and intensity under future climate change, Weather Clim. Extrem., 35, 100415, https://doi.org/10.1016/J.WACE.2022.100415, 2022.
Kawabata, T., Schwitalla, T., Adachi, A., Bauer, H.-S., Wulfmeyer, V., Nagumo, N., and Yamauchi, H.: Observational operators for dual polarimetric radars in variational data assimilation systems (PolRad VAR v1.0), Geosci. Model Dev., 11, 2493–2501, https://doi.org/10.5194/gmd-11-2493-2018, 2018.
Latham, J., Kleypas, J., Hauser, R., Parkes, B., and Gadian, A.: Can marine cloud brightening reduce coral bleaching?, Atmos. Sci. Lett., 14, 214–219, https://doi.org/10.1002/asl2.442, 2013.
Latham, J., Gadian, A., Fournier, J., Parkes, B., Wadhams, P., and Chen, J.: Marine cloud brightening: regional applications, Philos. Trans. A, 372, 20140053, https://doi.org/10.1098/RSTA.2014.0053, 2014.
Lee, R. L. and Olfe, D. B.: Numerical calculations of temperature profiles over an urban heat island, Bound.-Lay. Meteorol., 7, 39–52, https://doi.org/10.1007/BF00224971, 1974.
Lee, T. R. and De Wekker, S. F. J.: Estimating daytime planetary boundary layer heights over a valley from rawinsonde observations at a nearby airport: An application to the page valley in Virginia, United States, J. Appl. Meteorol. Clim., 55, 791–809, https://doi.org/10.1175/JAMC-D-15-0300.1, 2016.
Lee, T. W., Lee, J. Y., and Wang, Z. H.: Scaling of the urban heat island intensity using time-dependent energy balance, Urb. Clim., 2, 16–24, https://doi.org/10.1016/J.UCLIM.2012.10.005, 2012.
Li, Y., Kalnay, E., Motesharrei, S., Rivas, J., Kucharski, F., Kirk-Davidoff, D., Bach, E., and Zeng, N.: Climate model shows large-scale wind and solar farms in the Sahara increase rain and vegetation, Science, 361, 1019–1022, https://doi.org/10.1126/science.aar5629, 2018.
Lu, Z., Zhang, Q., Miller, P. A., Zhang, Q., Berntell, E., and Smith, B.: Impacts of Large-Scale Sahara Solar Farms on Global Climate and Vegetation Cover, Geophys. Res. Lett., 48, e2020GL090789, https://doi.org/10.1029/2020GL090789, 2021.
Mlawer, E. J., Taubman, S. J., Brown, P. D., Iacono, M. J., and Clough, S. A.: Radiative transfer for inhomogeneous atmospheres: RRTM, a validated correlated-k model for the longwave, J. Geophys. Res.-Atmos., 102, 16663–16682, https://doi.org/10.1029/97jd00237, 1997.
Morrison, H. and Gettelman, A.: A new two-moment bulk stratiform cloud microphysics scheme in the community atmosphere model, version 3 (CAM3), Part I: Description and numerical tests, J. Clim., 21, 3642–3659, https://doi.org/10.1175/2008JCLI2105.1, 2008.
Mostamandi, S., Predybaylo, E., Osipov, S., Zolina, O., Gulev, S., Parajuli, S., and Stenchikov, G.: Sea Breeze Geoengineering to Increase Rainfall over the Arabian Red Sea Coastal Plains, J. Hydrometeorol., 23, 3–24, https://doi.org/10.1175/JHM-D-20-0266.1, 2022.
Nakanishi, M. and Niino, H.: An improved Mellor-Yamada Level-3 model: Its numerical stability and application to a regional prediction of advection fog, Bound.-Lay. Meteorol., 119, 397–407, https://doi.org/10.1007/s10546-005-9030-8, 2006.
NCAR: NCAR Command Language (NCL) V 6.6.2 software (2019) [software], Boulder, Colorado, UCAR/NCAR/CISL/TDD, https://doi.org/10.5065/D6WD3XH5, 2022.
Nelli, N. R., Temimi, M., Fonseca, R. M., Weston, M. J., Thota, M. S., Valappil, V. K., Branch, O., Wulfmeyer, V., Wehbe, Y., al Hosary, T., Shalaby, A., al Shamsi, N., and al Naqbi, H.: Impact of Roughness Length on WRF Simulated Land-Atmosphere Interactions Over a Hyper-Arid Region, Earth Space Sci., 7, e2020EA001165, https://doi.org/10.1029/2020EA001165, 2020.
Nemet, G. F.: Net radiative forcing from widespread deployment of photovoltaics, Environ. Sci. Technol., 43, 2173–2178, https://doi.org/10.1021/es801747c, 2009.
Niu, G. Y., Yang, Z. L., Mitchell, K. E., Chen, F., Ek, M. B., Barlage, M., Kumar, A., Manning, K., Niyogi, D., Rosero, E., Tewari, M., and Xia, Y.: The community Noah land surface model with multiparameterization options (Noah-MP): 1. Model description and evaluation with local-scale measurements, J. Geophys. Res.-Atmos., 116, 1–19, https://doi.org/10.1029/2010JD015139, 2011.
Offerle, B., Grimmond, C. S. B., and Fortuniak, K.: Heat Storage and Anthropogenic Heat Flux in Relation to the Energy Balance of a Central European City Centre, Int. J. Climatol., 25, 1405–1419, https://doi.org/10.1002/joc.1198, 2005.
Powers, J. G., Klemp, J. B., Skamarock, W. C., Davis, C. A., Dudhia, J., Gill, D. O., Coen, J. L., Gochis, D. J., Ahmadov, R., Grell, G. A., Michalakes, J., Trahan, S., Benjamin, S. G., Alexander, C. R., Dimego, G. J., Wang, W., Schwartz, C. S., Romine, G. S., Liu, Z., Snyder, C., Chen, F., Barlage, M., Yu, W., and Duda, M. G.: The weather research and forecasting model: Overview, system efforts, and future directions, Bull. Am. Meteorol. Soc., 98, 1717–1737, https://doi.org/10.1175/BAMS-D-15-00308.1, 2017.
Protogeropoulos, C. and Zachariou, A.: Photovoltaic module laboratory reflectivity measurements and comparison analysis with other reflecting surfaces, 25th European PV Solar Energy Conference, 355–358, https://doi.org/10.4229/25THEUPVSEC2010-1DV.2.16, 2010.
Quaas, J., Quaas, M. F., Boucher, O., and Rickels, W.: Regional climate engineering by radiation management: Prerequisites and prospects, Earth's Future, 4, 618–625, https://doi.org/10.1002/2016EF000440, 2016.
Ridgwell, A., Singarayer, J. S., Hetherington, A. M., and Valdes, P. J.: Tackling Regional Climate Change By Leaf Albedo Bio-geoengineering, Curr. Biol., 19, 146–150, https://doi.org/10.1016/j.cub.2008.12.025, 2009.
Saaroni, H., Bitan, A., Dor, E. Ben, and Feller, N.: The mixed results concerning the “oasis effect” in a rural settlement in the Negev Desert, Israel, J. Arid Environ., 58, 235–248, https://doi.org/10.1016/j.jaridenv.2003.08.010, 2004.
Salamanca, F., Zhang, Y., Barlage, M., Chen, F., Mahalov, A., and Miao, S.: Evaluation of the WRF-Urban Modeling System Coupled to Noah and Noah-MP Land Surface Models Over a Semiarid Urban Environment, J. Geophys. Res.-Atmos., 123, 2387–2408, https://doi.org/10.1002/2018JD028377, 2018.
Santanello, J. A., Dirmeyer, P. A., Ferguson, C. R., Findell, K. L., Tawfik, A. B., Berg, A., Ek, M., Gentine, P., Guillod, B. P., van Heerwaarden, C., Roundy, J., and Wulfmeyer, V.: Land–Atmosphere Interactions: The LoCo Perspective, Bull. Am. Meteorol. Soc., 99, 1253–1272, https://doi.org/10.1175/BAMS-D-17-0001.1, 2018.
Schwitalla, T. and Wulfmeyer, V.: Radar data assimilation experiments using the IPM WRF Rapid Update Cycle, Meteorol. Z., 23, 79–102, https://doi.org/10.1127/0941-2948/2014/0513, 2014.
Schwitalla, T., Branch, O., and Wulfmeyer, V.: Sensitivity study of the planetary boundary layer and microphysical schemes to the initialization of convection over the Arabian Peninsula, Q. J. Royal Meteorol. Soc., 146, 846–869, https://doi.org/10.1002/qj.3711, 2020.
Sefelnasr, A., Ebraheem, A. A., Faiz, M. A., Shi, X., Alghafli, K., Baig, F., al Rashad, M., Alshamsi, D., Ahamed, M. D., and Sherif, M.: Enhancement of Groundwater Recharge from Wadi Al Bih Dam, UAE, Water, 14, 3448, https://doi.org/10.3390/W14213448, 2022.
Seidel, D. J., Zhang, Y., Beljaars, A., Golaz, J.-C., Jacobson, A. R., and Medeiros, B.: Climatology of the planetary boundary layer over the continental United States and Europe, J. Geophys. Res.-Atmos., 117, 17106, https://doi.org/10.1029/2012JD018143, 2012.
Seneviratne, S. I., Phipps, S. J., Pitman, A. J., Hirsch, A. L., Davin, E. L., Donat, M. G., Hirschi, M., Lenton, A., Wilhelm, M., and Kravitz, B.: Land radiative management as contributor to regional-scale climate adaptation and mitigation, Nat. Geosci., 11, 88–96, https://doi.org/10.1038/s41561-017-0057-5, 2018.
Sherif, M., Sefelnasr, A., Al Rashed, M., Alshamsi, D., Zaidi, F. K., Alghafli, K., Baig, F., al-Turbak, A., Alfaifi, H., Loni, O. A., Ahamed, M. B., and Ebraheem, A. A.: A Review of Managed Aquifer Recharge Potential in the Middle East and North Africa Region with Examples from the Kingdom of Saudi Arabia and the United Arab Emirates, Water, 15, 742, https://doi.org/10.3390/W15040742, 2023.
Sherif, M., Mohamed, M., Kacimov, A., and Shetty, A.: Assessment of groundwater quality in the northeastern coastal area of UAE as precursor for desalination, Desalination, 273, 436–446, https://doi.org/10.1016/J.DESAL.2011.01.069, 2011.
Sherif, M. and Kacimov, A.: Seawater intrusion in the coastal aquifer of Wadi Ham, UAE, IAHS-AISH Publication, 312, 315–325, 2007.
Sieber, P., Böhme, S., Ericsson, N., and Hansson, P. A.: Albedo on cropland: Field-scale effects of current agricultural practices in Northern Europe, Agr. Forest Meteorol., 321, 108978, https://doi.org/10.1016/J.AGRFORMET.2022.108978, 2022.
Skamarock, W. C., Klemp, J. B., Dudhia, J., Gill, D. O., Liu, Z., Berner, J., Wang, W., Powers, J. G., Duda, M. G., Barker, D., and Huang, X.-Y.: A Description of the Advanced Research WRF Model Version 4.3 (No. NCAR/TN-556+STR), NSF [code], https://doi.org/10.5065/1dfh-6p97, 2021.
Soltani, A. and Sharifi, E.: Daily variation of urban heat island effect and its correlations to urban greenery: A case study of Adelaide, Front. Archit. Res., 6, 529–538, https://doi.org/10.1016/j.foar.2017.08.001, 2017.
Stewart, I. D., Krayenhoff, E. S., Voogt, J. A., Lachapelle, J. A., Allen, M. A., and Broadbent, A. M.: Time Evolution of the Surface Urban Heat Island, Earth's Future, 9, e2021EF002178, https://doi.org/10.1029/2021EF002178, 2021.
Taha, H.: The potential for air-temperature impact from large-scale deployment of solar photovoltaic arrays in urban areas, Sol. Energy, 91, 358–367, https://doi.org/10.1016/j.solener.2012.09.014, 2013.
Taraphdar, S., Pauluis, O. M., Xue, L., Liu, C., Rasmussen, R., Ajayamohan, R. S., Tessendorf, S., Jing, X., Chen, S., and Grabowski, W.: WRF Gray-Zone Simulations of Precipitation Over the Middle-East and the UAE: Impacts of Physical Parameterizations and Resolution, J. .Geophys. Res.-Atmos., 126, 1–23, https://doi.org/10.1029/2021JD034648, 2021.
Tawfik, A. B., Dirmeyer, P. A., and Santanello, J. A.: The heated condensation framework, Part I: Description and southern great plains case study, J. Hydrometeorol., 16, 1929–1945, https://doi.org/10.1175/JHM-D-14-0117.1, 2015a.
Tawfik, A. B., Dirmeyer, P. A., and Santanello, J. A.: The heated condensation framework. Part II: Climatological behavior of convective initiation and land-atmosphere coupling over the conterminous United States, J. Hydrometeorol., 16, 1946–1961, https://doi.org/10.1175/JHM-D-14-0118.1, 2015b.
Temimi, M., Fonseca, R., Nelli, N., Weston, M., Thota, M., Valappil, V., Branch, O., Wizemann, H. D., Kondapalli, N. K., Wehbe, Y., Hosary, T. Al, Shalaby, A., Shamsi, N. Al, and Naqbi, H. Al.: Assessing the impact of changes in land surface conditions on wrf predictions in arid regions, J. Hydrometeorol., 21, 2829–2853, https://doi.org/10.1175/JHM-D-20-0083.1, 2020.
Theocharous, E., Jensen, B., Gibbs, D., Chunnilall, Mole, R., C. J., Ahmed, N., Reveles, J. R., Harris, O. B., and Ahmed, N.: The partial space qualification of a vertically aligned carbon nanotube coating on aluminium substrates for EO applications, Opt. Express, 22, 7290–7307, https://doi.org/10.1364/OE.22.007290, 2014.
Tollefson, J.: Can artificially altered clouds save the Great Barrier Reef?, Nature, 596, 476–478, https://doi.org/10.1038/D41586-021-02290-3, 2021.
Valappil, V. K., Temimi, M., Weston, M., Fonseca, R., Nelli, N. R., Thota, M., and Kumar, K. N.: Assessing Bias Correction Methods in Support of Operational Weather Forecast in Arid Environment, Asia-Pacific, J. Atmos. Sci., 56, 333–347, https://doi.org/10.1007/s13143-019-00139-4, 2020.
Vogel, J. and Afshari, A.: Comparison of urban heat island intensity estimation methods using urbanized WRF in Berlin, Germany, Atmosphere, 11, 1338, https://doi.org/10.3390/atmos11121338, 2020.
Voogt, J. A. and Oke, T. R.: Thermal remote sensing of urban climates, Remote Sens. Environ., 86, 370–384, https://doi.org/10.1016/s0034-4257(03)00079-8, 2003.
Wehbe, Y., Temimi, M., Weston, M., Chaouch, N., Branch, O., Schwitalla, T., Wulfmeyer, V., Zhan, X., Liu, J., and Al Mandous, A.: Analysis of an extreme weather event in a hyper-arid region using WRF-Hydro coupling, station, and satellite data, Nat. Hazards Earth Syst. Sci., 19, 1129–1149, https://doi.org/10.5194/nhess-19-1129-2019, 2019.
Wulfmeyer, V., Branch, O., Warrach-Sagi, K., Bauer, H. S., Schwitalla, T., and Becker, K.: The impact of plantations on weather and climate in coastal desert regions, J. Appl. Meteorol. Clim., 53, 1143–1169, https://doi.org/10.1175/JAMC-D-13-0208.1, 2014.
Yagoub, M. M., AlSumaiti, T. S., Ebrahim, L., Ahmed, Y., and Abdulla, R.: Pattern of Water Use at the United Arab Emirates University, Water, 11, 2652, https://doi.org/10.3390/W11122652, 2019.
Zhang, N. and Wang, Y.: Mechanisms for the isolated convections triggered by the sea breeze front and the urban heat Island, Meteorol. Atmos. Phys., 133, 1143–1157, https://doi.org/10.1007/s00703-021-00800-6, 2021.
Zhang, X., Friedl, M. A., Schaaf, C. B., and Strahler, A. H.: Climate Controls on Vegetation Phenological Patterns in Northern Mid and High Latitudes Inferred from MODIS Data, Glob. Change Biol., 10, 1133–1145, https://doi.org/10.1111/j.1529-8817.2003.00784.x, 2004.