the Creative Commons Attribution 4.0 License.
the Creative Commons Attribution 4.0 License.
 | 09 Jan 2024
Extremely warm European summers preceded by sub-decadal North Atlantic ocean heat accumulation
Lara Wallberg
Laura Suarez-Gutierrez
Daniela Matei
Wolfgang A. Müller
The internal variability of European summer temperatures has been linked to various mechanisms on seasonal to sub- and multi-decadal timescales. We find that sub-decadal timescales dominate summer temperature variability over large parts of the continent and determine mechanisms controlling extremely warm summers on sub-decadal timescales. We show that the sub-decadal warm phases of bandpass-filtered European summer temperatures, hereinafter referred to as extremely warm European summers, are related to a strengthening of the North Atlantic Ocean subtropical gyre, an increase in meridional heat transport, and an accumulation of ocean heat content in the North Atlantic several years prior to the extreme summer. This ocean warming affects the ocean–atmosphere heat fluxes, leading to a weakening and northward displacement of the jet stream and increased probability of occurrence of high-pressure systems over Scandinavia. Thus, our findings link the occurrence of extremely warm European summers to the accumulation of heat in the North Atlantic Ocean and provide the potential to improve the predictability of extremely warm summers several years ahead, which is of great societal interest.
- Article
(8170 KB) - Full-text XML
- BibTeX
- EndNote


Extremely warm European summers have an increasingly large societal impact. Extreme temperatures can lead to severe health problems and are thus associated with increased mortality (Gasparrini et al., 2015; Vicedo-Cabrera et al., 2021). Furthermore, heat extremes can also lead to economic impacts, such as crop failure and water shortages (Ribeiro et al., 2020), along with political challenges, including climate-induced migration and the need for effective crisis management (Ceglar et al., 2019). European summers will become more extreme in a warming climate due to rising mean temperatures (Seneviratne et al., 2021) and also due to an increase in internal temperature variability (Schär et al., 2004; Fischer et al., 2012; Suarez-Gutierrez et al., 2020a). Moreover, when such extreme summers occur repeatedly year after year, they become even more threatening to the already vulnerable socioeconomic and ecological resilience of the region (Ruiter et al., 2020; Callahan and Mankin, 2022).
On timescales of days to several weeks, the main drivers of extreme heat are soil moisture deficits and moisture–temperature feedbacks (Seneviratne et al., 2006; Fischer and Schär, 2008; Vogel et al., 2017; Suarez-Gutierrez et al., 2020a), diabatic heating, adiabatic compression and advection (Röthlisberger and Papritz, 2023), and large-scale atmospheric patterns such as atmospheric blocking and the North Atlantic Oscillation (Meehl and Tebaldi, 2004; Horton et al., 2015; Li et al., 2020; Suarez-Gutierrez et al., 2020a). However, these short-term drivers of extreme temperatures could be influenced and conditioned by mechanisms on longer timescales. Long-memory mechanisms such as ocean heat inertia, i.e., the capacity to store heat and delay its transfer and release, have been found to influence mean summer temperature variability (Ghosh et al., 2016; Borchert et al., 2019). Examples for these long-term mechanisms influencing European temperatures are the Atlantic multi-decadal variability (AMV; Sutton and Hodson, 2005; Gao et al., 2019; Qasmi et al., 2021; Ruprich-Robert et al., 2021) or the El Niño–Southern Oscillation (ENSO; Martija-Díez et al., 2021). Further, the variability in the North Atlantic region has been shown to include a fully coupled atmosphere–ocean cycle with a period of about 7–10 years shown for various atmosphere- and ocean-related quantities, such as sea surface temperature and Gulf Stream indices (Czaja and Marshall, 2001; McCarthy et al., 2018), ocean heat content and overturning stream functions (Martin et al., 2019), prominent winter sea level pressure patterns (Czaja and Marshall, 2001), and the North Atlantic Oscillation (Costa and Verdiere, 2002). This cycle is associated with an active role of the atmospheric heat and momentum forcing, together with a delayed effect of the redistribution of North Atlantic water masses (Czaja and Marshall, 2001; Eden and Greatbatch, 2003; Reintges et al., 2016; Martin et al., 2019). In fact, this process has a significant impact on European summer temperatures as demonstrated by Müller et al. (2020). However, the assessment of drivers for extreme temperatures on such long-term timescales is currently limited (Simpson et al., 2018; Wu et al., 2019), and their relevance for extreme summers remains uncertain. This research addresses this question and presents a comprehensive explanation for the occurrence of extremely warm European summers in sub-decadal warm phases and their relation to the heat accumulation that occurs several years in advance.
Our investigation concentrates on the exceptionally warm European summers that occur in conjunction with positive sub-decadal temperature anomalies. To robustly capture the frequency and strength of such low-probability events, large sample sizes are needed. Here, we use one of the largest ensembles from a comprehensive, fully coupled Earth system model currently available, the Max Planck Institute Grand Ensemble with 100 ensemble members (MPI-GE; Maher et al., 2019). MPI-GE offers one of the most adequate representations of observed historical temperatures among single-model large climate models (Suarez-Gutierrez et al., 2021). MPI-GE is able to capture extreme summer temperatures (Suarez-Gutierrez et al., 2020b), including some of the most extreme European summer temperatures ever recorded (Suarez-Gutierrez et al., 2018, 2020a).
Using the MPI-GE, we examine the sub-decadal variability of extremely warm European summers and show how these summers are affected by North Atlantic Ocean heat content accumulation. We investigate whether the MPI-GE can represent sub-decadal temperature variability well and identify where these timescales dominate over Europe and are linked to European extreme temperatures. Additionally, we identify which processes in the North Atlantic Ocean precede the increase in the occurrence of extremely warm summers.
2.1 Model description
We use simulations from the Max Planck Institute Grand Ensemble (MPI-GE; Maher et al., 2019). These simulations are performed with MPI-ESM1.1 in the low-resolution setup (MPI-ESM-LR; Mauritsen et al., 2012; Giorgetta et al., 2013). MPI-GE consists of 100 simulations with different initial conditions and is one of the largest ensembles of a single, comprehensive, fully coupled climate model. In the atmosphere, the MPI-ESM-LR reaches up to 0.01 hPa (about 80 km) with 47 vertical levels and a horizontal resolution of 200 km at the Equator. In the ocean, the MPI-ESM-LR is formulated on a C grid and orthogonal curvilinear coordinates (Marsland et al., 2003). To circumvent grid singularities at the geographical North Pole, the northern grid pole is shifted to Greenland, leading to high resolution in the Arctic and the high-latitude sinking regions. In the ocean, the MPI-ESM-LR has 40 vertical levels and a horizontal resolution of about 1.5∘ on average and varies from a minimum of 12 km close to Greenland to a maximum of 180 km in the tropical Pacific. Here, we use monthly data averaged to seasonal summer means over June, July, and August (JJA) from 1950–2022 and analyze anomalies of the ocean heat content, the ocean heat transport, the barotropic stream function, and the ocean–atmosphere heat flux, as well as anomalies of the vertical temperature and the 2 m air temperature. For time-lagged analyses, up to 3 years prior to 1950 are analyzed. ERA5 data including the backward extension until 1950 are used as an observational reference to validate the results of the multi-tapering with MPI-GE. Therefore, the ERA5 data are re-gridded to the coarser MPI-GE grid (Hersbach et al., 2019).
2.2 Analysis methods
We linearly detrended all of our data in order to exclude the influence of global warming and other external forcings. Furthermore, we use a 5–10-year bandpass filter to remove frequencies and noise outside the sub-decadal range. Therefore, we use a standard top-hat filter response function. In order to investigate extremely warm European summers on sub-decadal timescales, hereafter referred to as extremely warm summers, we consider JJA mean 2 m air temperature anomalies in the region between 15–35∘ E and 45–60∘ N that exceed their 90th percentile and additionally occur in a positive bandpass-filtered phase (pooled in time and ensemble, 557 summers in total; T>90th percentile and Tbandpass>0). We use a cross-spectral analysis based on a multi-taper method to analyze how the MPI-GE can represent the sub-decadal temperature variability compared to ERA5 (Årthun et al., 2018). This multi-taper method is a spectral analysis technique to estimate the dominant time frequency content of time series by decomposing the data into a set of orthogonal tapers and computing a set of spectral estimates. The dominant time frequency is then identified as the highest spectral peak or mode in the resulting spectrum, which characterizes the dominant oscillatory patterns and variability of the data over time. We perform the multi-tapering for all 100 ensemble members and take the mean over all spectra for each grid point to ascertain the dominant timescale, where the dominant timescale is given by the highest significant peak (e.g., Årthun et al., 2018; Ghil et al., 2002). The significance of spectral peaks is determined by comparison with a red noise spectrum with a 95 % confidence interval. The significance of our results is tested with a bootstrap algorithm in which a reference index is computed in each grid point for 1000 randomly composed arrays of the corresponding variable (random sampling with replacement). We calculate the p value from our 1000 bootstraps and control for the false discovery rate (Eq. 3 in Wilks, 2016) with a chosen control level of αFDR=0.1.
We scale the bandpass-filtered summer mean anomalies by the standard deviation of unfiltered summer (JJA) mean anomalies during extremely warm European summers to better illustrate the imprint of the sub-decadal proportion of various climate variables on the occurrence of extremely warm European summers. In detail, we first calculate anomalies of the variables with respect to their long-term averages. We then define their total summer mean variability (σt) as the standard deviation of the unfiltered summer mean anomaly (x′) for years showing an extremely warm European summer (textreme, Eq. 1). We then divide the bandpass-filtered anomaly () by the total variability σt at the time of each heat extreme. Lastly, we average over all cases of extreme events (N) to obtain the scaled anomaly (, Eq. 2). All calculations of the scaled anomaly are performed grid-point-wise. The scaled anomaly simply illustrates the impact of sub-decadal processes on the occurrence of an extremely warm summer compared to the overall occurrence of extremely warm summers. The corresponding scaled anomalies are added to the respective figure captions.
3.1 Sub-decadal variability and extremely warm European summers
We use bandpass filtering and a cross-spectral analysis to identify the dominant time frequencies of European summer temperatures for each grid point in MPI-GE and ERA5 from 1950 to 2020 (Fig. 1a–b, “Data and methods” section). Areas with dominant sub-decadal variations (5–10-year variations) are found in MPI-GE over Scandinavia, the British Isles, the Iberian Peninsula, Italy, and large parts of central and eastern Europe. ERA5 and MPI-GE show high agreement for areas with dominant sub-decadal variations, especially over eastern Europe (Fig. 1a, b). MPI-GE reveals some limitations in the representation of multi-decadal timescales (>20 years), which are dominant in ERA5 in the northern and southernmost parts of the domain. On timescales between 10 and 20 years, only a few grid points are dominant. Even fewer dominant grid points are found on timescales longer than 20 years. The cross-spectral analysis reveals that MPI-GE is able to capture the large-scale distribution of the dominant sub-decadal variations compared to ERA5. This points towards the ability of the model to simulate the underlying large-scale mechanism in principle. However, there are still regional differences in the distribution, as can be found, for example, over southeastern Europe. The reasons are yet unclear and can be related to a regional displacement of the principal modes of large-scale variability compared to ERA5 or the limitation of the model to reflect the impact of the regional sea on extremes in this region (Beobide-Arsuaga et al., 2023).
Analyzing the ratio between all non-filtered heat extremes and those occurring in a positive bandpass-filtered phase, central Europe stands out as the area with the highest percentages (Fig. 1c). Regions within the Iberian Peninsula, northern Scandinavia, and Russia also stand out with coinciding extremely warm summers and sub-decadal variability. In summary, sub-decadal timescales of 5–10 years are the dominant scale of variability in European mean summer temperatures, and extremely warm summers tend to occur in 5–10-year phases of abnormally warm temperatures over large parts of central, eastern, and southern Europe.
The overlap between a dominant sub-decadal variability and the occurrence of extremely warm European summers is strongest over central Europe (central Europe is defined by 15–35∘ E; 45–60∘ N, Fig. 1c, blue box). The temperature of this region is also dominated by sub-decadal timescales overall (Fig. 1d); as expected from Fig. 1b, two significant peaks within the sub-decadal timescales can be found here as well. Other significant peaks could be found around 2 to 3 years and around 15 years, indicating the possible influence of other drivers and mechanisms. We investigate the behavior of several variables that characterize the North Atlantic Ocean heat content variability during extremely warm European summers as well as several years prior to their occurrence to further understand the simultaneous occurrence and the drivers of sub-decadal variability and extremely warm European summers.
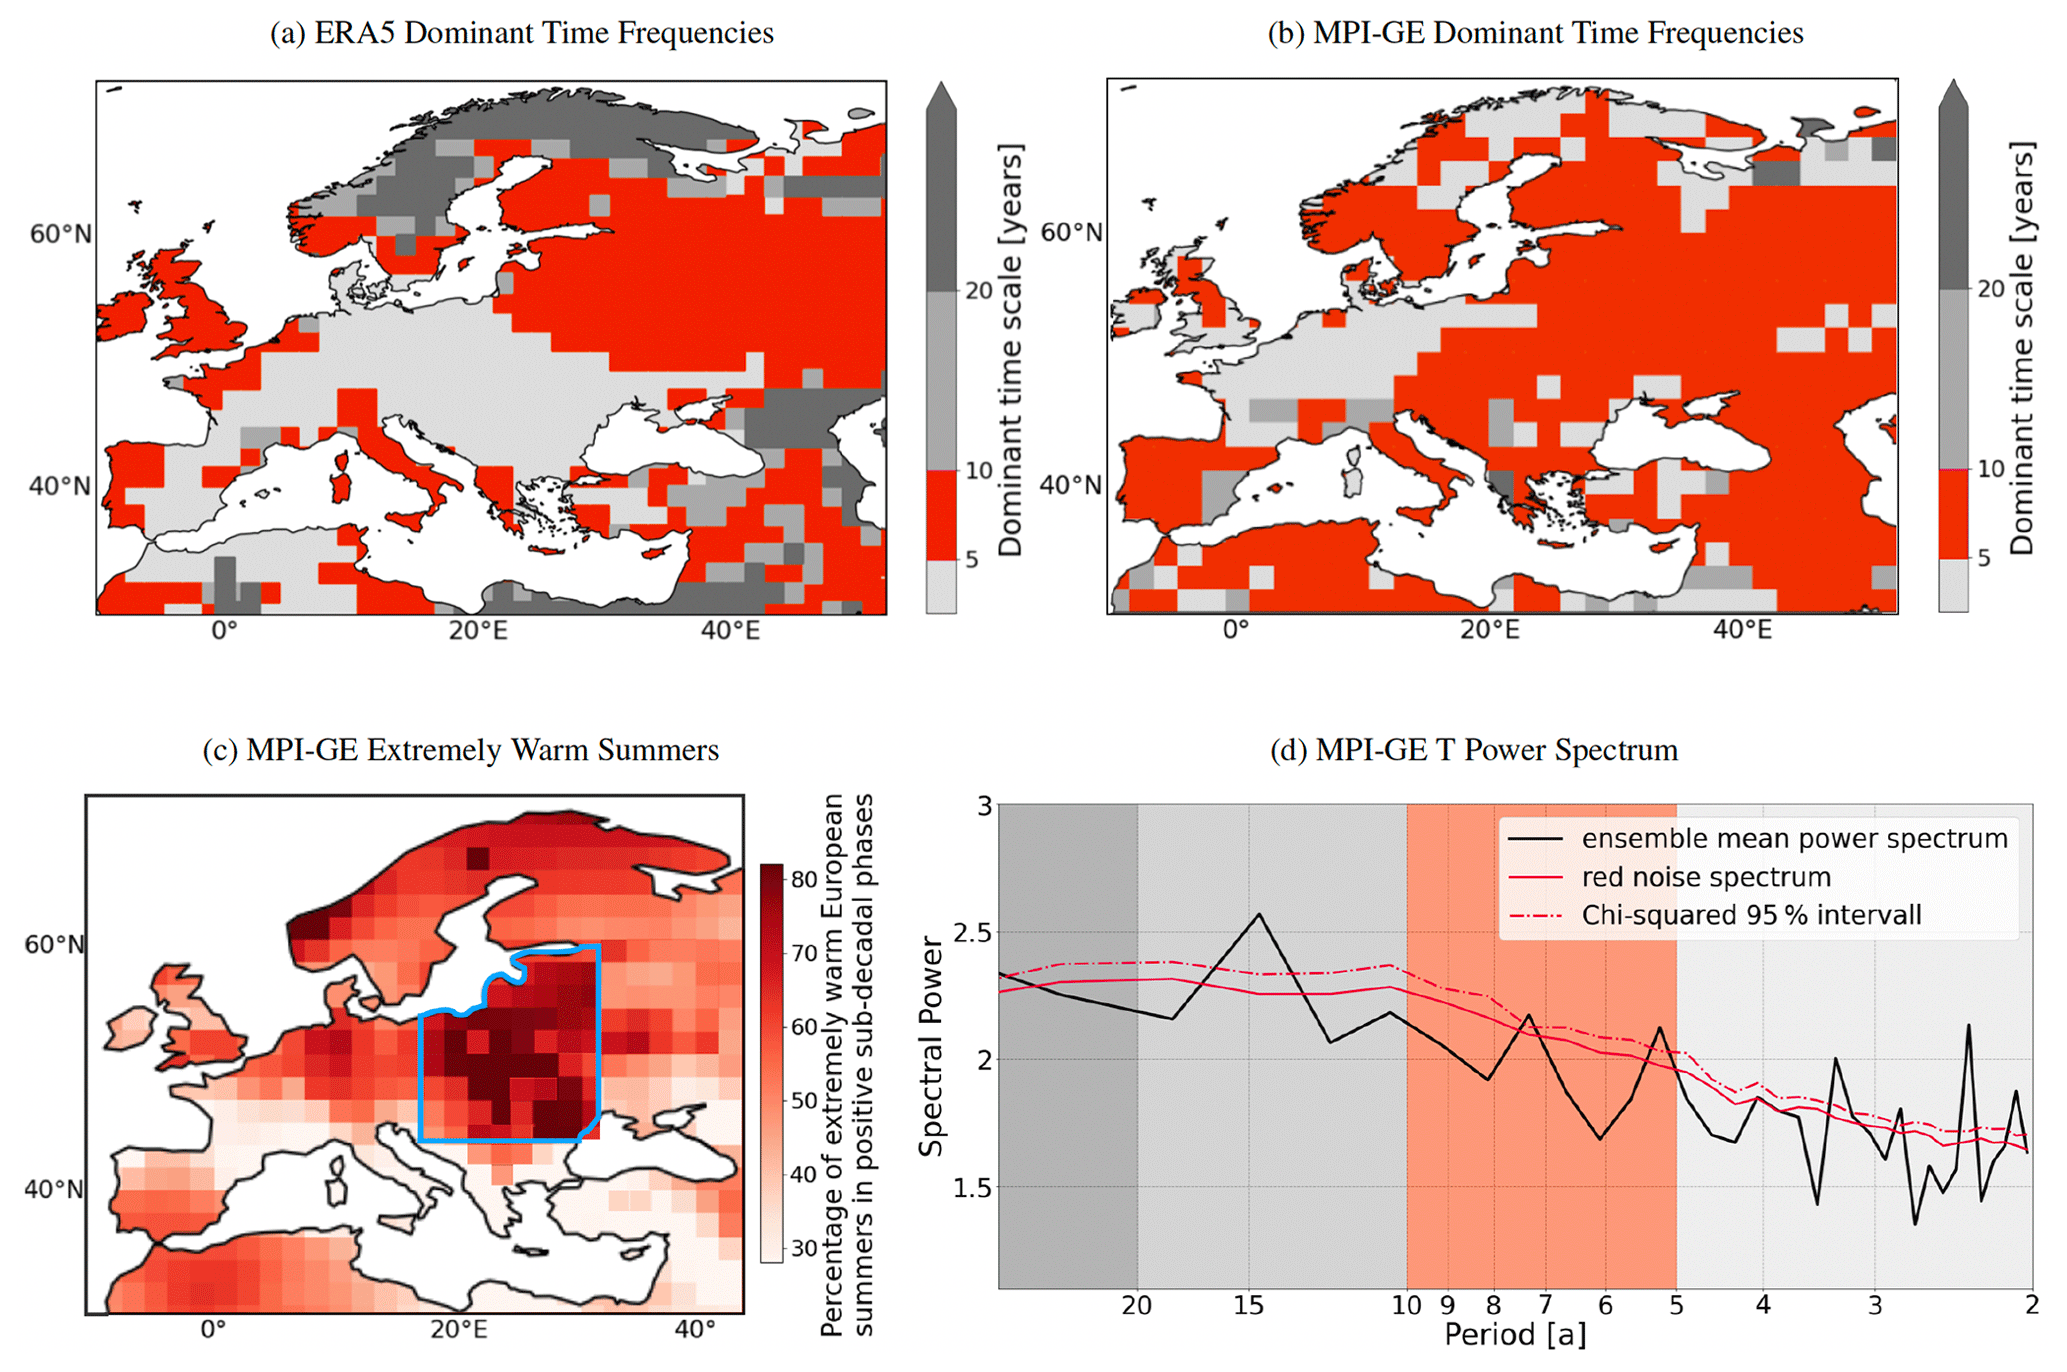
Figure 1Dominant time frequencies and their relation to extremely warm European summers. (a, b) Cross-spectral analysis, performed using the multi-taper method, showing the dominant timescales of European surface air temperature variability in (a) ERA5 and (b) MPI-GE (see the “Data and methods” section). Color shading in years. (c) Percentage of all heat extremes (T>90th percentile) occurring in a positive bandpass-filtered phase (Tbandpass>0) per grid point in MPI-GE. The blue box defines the region of interest for further analysis (central Europe, ∼ 15–35∘ E; 45–60∘ N). (d) Power spectrum of central European (spatial mean of blue box) surface air temperature (black line) in MPI-GE (averaged over all ensemble member spectra). The significance is shown via a red noise spectrum (solid red line) and the chi-squared 95 % interval (dashed red line). The background is color-coded according to the time intervals in (a) and (b). Period 1950–2022.
3.2 The North Atlantic Ocean and extremely warm European summers
We start our investigation with the North Atlantic ocean–atmosphere latent and sensible heat fluxes for lags up to 3 years prior to an extreme summer to examine whether the North Atlantic Ocean long-term variability could drive the sub-decadal variability in extremely warm European summers (Fig. 2a). At lag 0, when anomalies in the North Atlantic Ocean occur in the same year as the extreme summer, we find high anomalies in the western part of the North Atlantic Ocean (30–60∘ W; 25–40∘ N), as well as in the northeastern part of the North Atlantic Ocean (15–25∘ W; 50–70∘ N). These high positive anomalies in the North Atlantic Ocean, which indicate an above-average heat flux from the ocean to the atmosphere during extremely warm European summers and associated warming of the atmosphere, can be traced back several years prior to the extreme.
Although the global anomaly pattern suggests some relation to other long-term climate variability modes of the Pacific Ocean, such as the Pacific Decadal Oscillation and Tripolar Pacific Index (Fig. 2b), further analysis shows that, e.g., ENSO, does not drive the pattern described here (Table A1). The fraction of extremely warm European summers during the different ENSO phases is consistently low for different lags, whereas the fraction of extremely warm European summers strongly relies on the state of the North Atlantic oceanic variables. This means that no specific ENSO phase (El Niño, La Niña, neutral) can be concretely associated with extremely warm European summers on sub-decadal timescales. Whether this relationship is coincidental and caused by an extraneous process (Cane et al., 2017) or whether this response indicates a dynamical relationship between processes in the North Atlantic Ocean and the occurrence of extremely warm European summers is further investigated in the following.
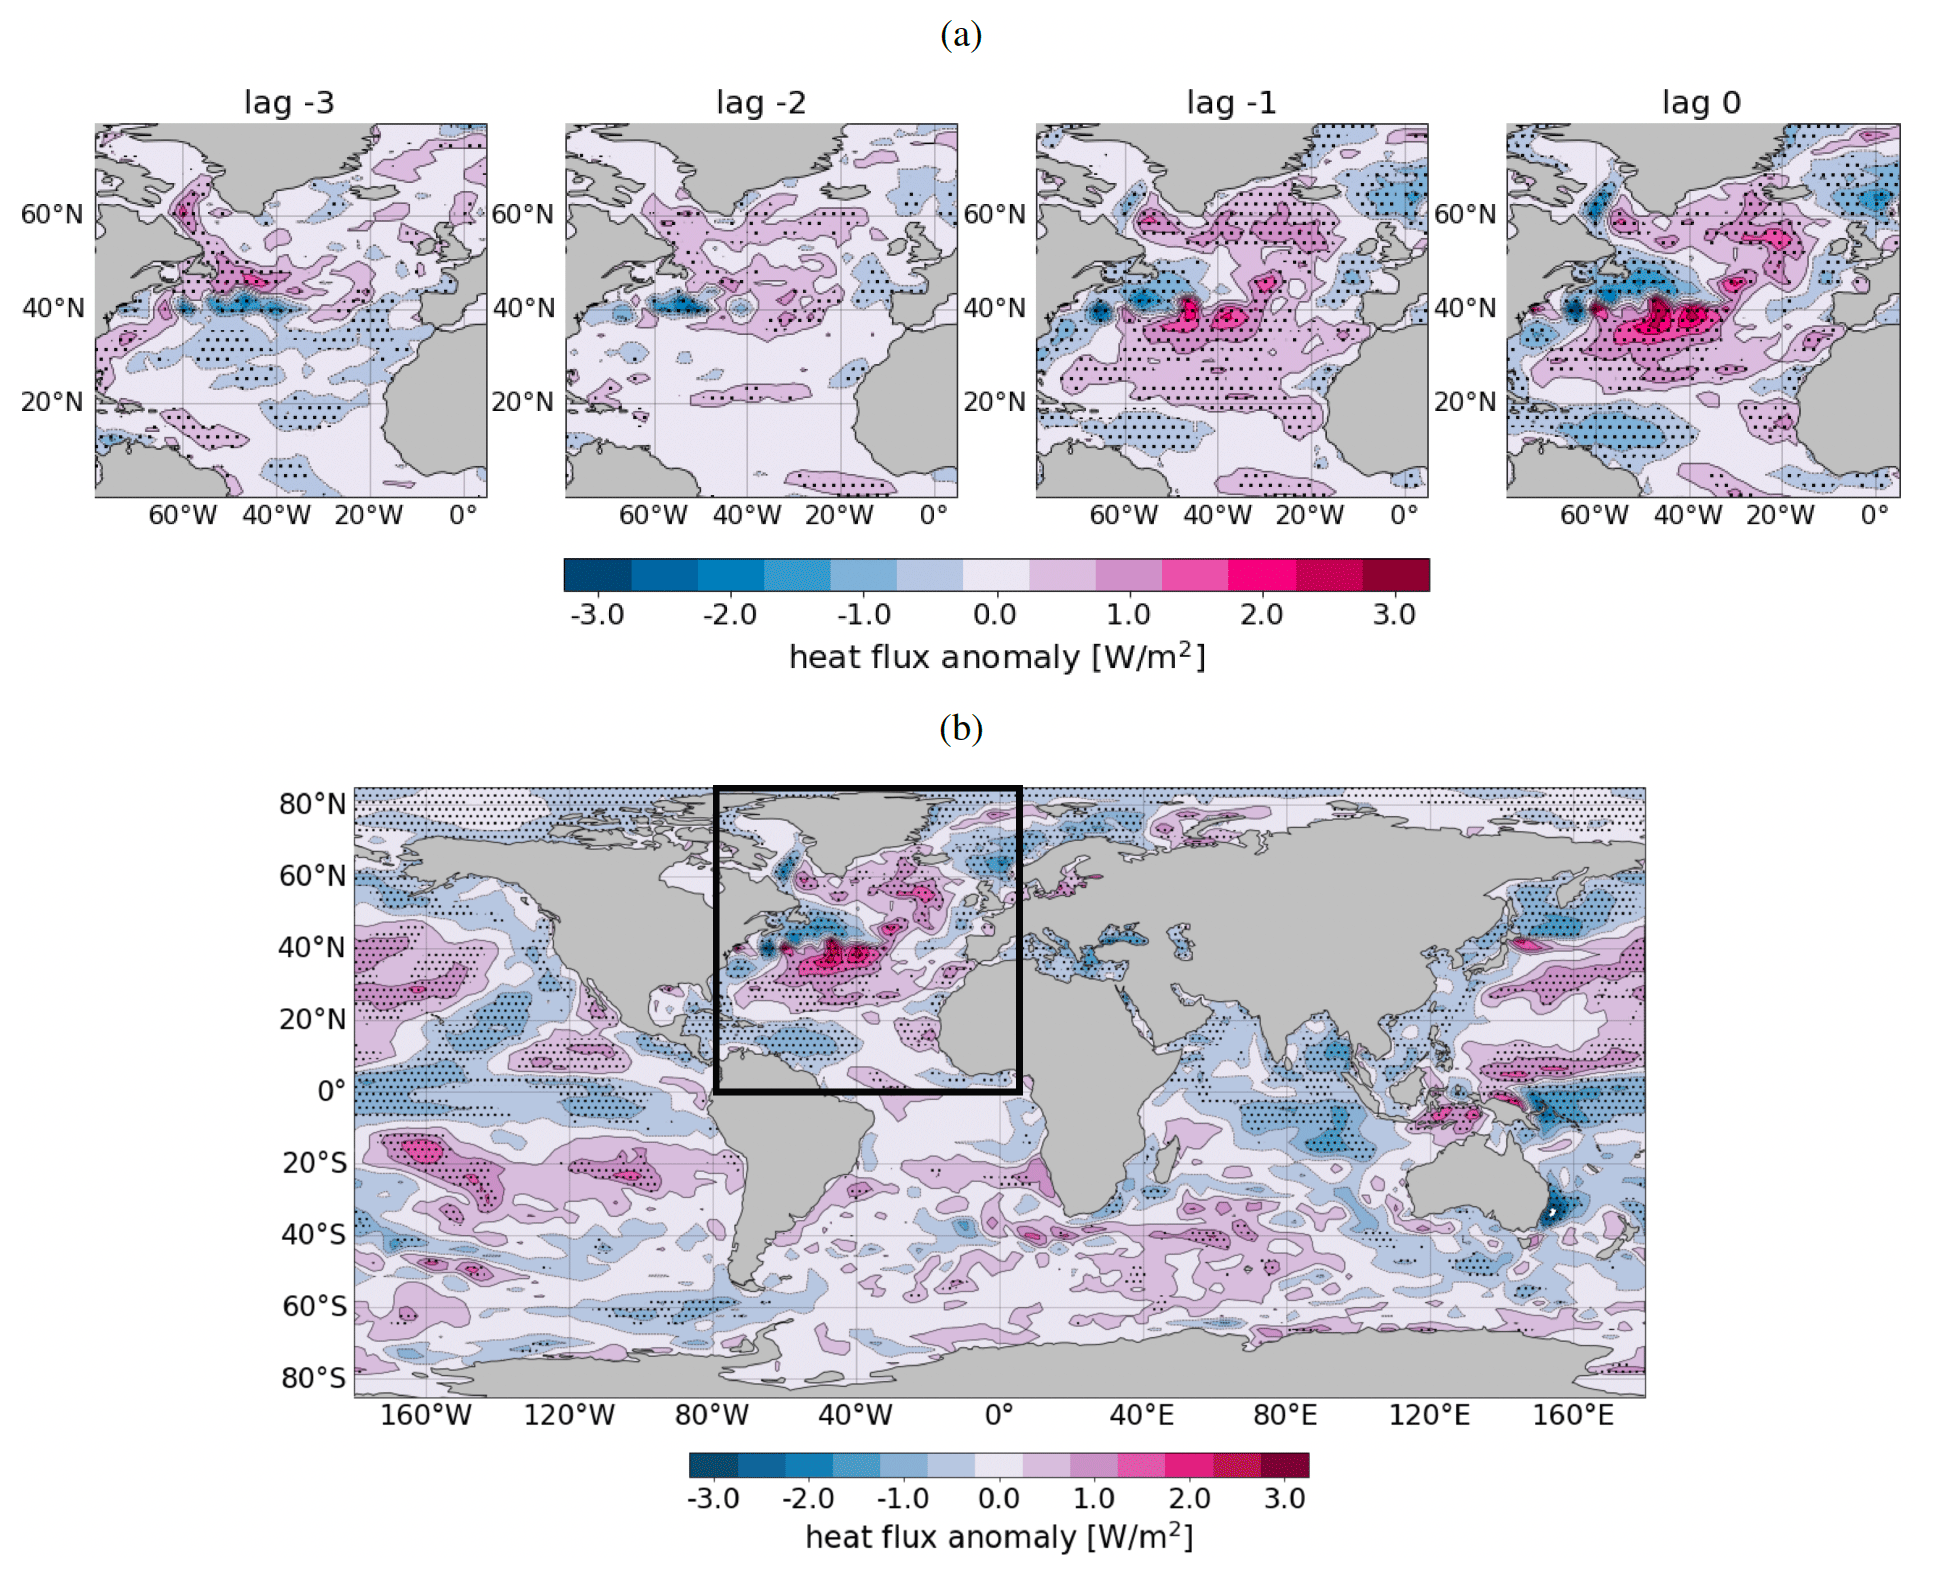
Figure 2Anomaly of 5–10-year bandpass-filtered Atlantic heat flux (latent + sensible) variability in MPI-GE for (a) different lags prior to extremely warm European summers and (b) lag 0 as a global map. Positive values indicate heat flux into the atmosphere. Values in Wm−2, lags in years. Dots denote significance at a 95 % confidence level. Period 1950–2022. For comparison the standard deviation of the year-to-year variation is of the order of 14 Wm−2, which means that the highest values in the figure correspond to around 20 % of the total variability.
3.3 Influence of North Atlantic Ocean heat accumulation on extremely warm European summers
We test if the oceanic variability in the North Atlantic Ocean can influence atmospheric circulation patterns via heat accumulation and release. Therefore, we evaluate the relationship between North Atlantic Ocean inertia and extremely warm European summers. First, we analyze the ocean heat content, which influences the temperature difference between the ocean and atmosphere and thus alters the rate of heat exchange; it is therefore a driver of the ocean–atmosphere heat flux. Here, we investigate anomalies of the 0–700 m averaged 5–10-year bandpass-filtered ocean heat content (Fig. 3a).
Starting around 3 years prior to extremely warm European summers, ocean heat content anomalies change from negative to positive all along the North Atlantic current, indicating an accumulation of heat in northern part of the subtropical gyre. For lag 0, these anomalies reach up to 25 % of the total variability of the ocean heat content.
The ocean heat content is controlled by the meridional ocean heat transport, which describes the movement of heat energy from one region of the ocean to another and can lead to changes in the ocean heat content in different regions over time. Here, further insight into the dynamics of the North Atlantic Ocean subtropical and subpolar region is provided by the 5–10-year bandpass-filtered ocean heat transport and its decomposition into a gyre and meridional circulation part (Fig. 3b; calculated independently, see Ghosh et al., 2023). The anomalies of the 5–10-year bandpass-filtered ocean heat transport reveals positive anomalies of the meridional heat transport around 20∘ N from 2 years prior to extremely warm summers onward. A substantial proportion of these positive anomalies of the meridional heat transport is not compensated for by ocean heat transport changes at 40∘ N. Here, due to the increased net heat transport around 40∘ N, the ocean heat content in that region will increase, leading to the previously described accumulation of ocean heat content. The accumulated heat is released at lag 0, mainly through the gyre ocean heat transport around 65∘ N. Altering the temperature gradient between the ocean and the atmosphere, this heat release in turn matches the positive ocean–atmosphere heat flux anomaly around 50–70∘ N (Fig. 2).
The ocean heat transport is influenced by the direction and strength of the horizontal oceanic currents, characterized by the barotropic stream function. The barotropic stream function refers to the circulation of ocean currents at a certain depth, where the flow is primarily influenced by pressure gradients. Changes in the barotropic stream function can indicate shifts in the paths and intensity of ocean currents. As a result, the direction and strength of heat transport in the ocean may be affected. This, in turn, leads to changes in the distribution of ocean heat content across different regions. Thus, the barotropic stream function provides further knowledge about the paths of ocean currents (Fig. 3c). Starting from 3 years prior to an extremely warm European summer, negative anomalies of the barotropic stream function occur in the northern part of the subtropical gyre, indicating a North Atlantic current weaker than its normal state, leading to a smaller horizontal volume transport and a southward-shifted subpolar gyre boundary around 3 years prior to an extremely warm summer. The anomalies of the barotropic stream function change sign to positive values about 1 year prior to extremely warm summers, indicating strengthening of the North Atlantic current and associated greater horizontal volume transport. Moreover, the North Atlantic current shifts by a few degrees north compared to the mean state, indicating a volume transport into higher latitudes via the North Atlantic current. This increased northern horizontal volume transport together with the transition of the ocean heat content indicates the accumulation of heat along the northern branch of the subtropical gyre.
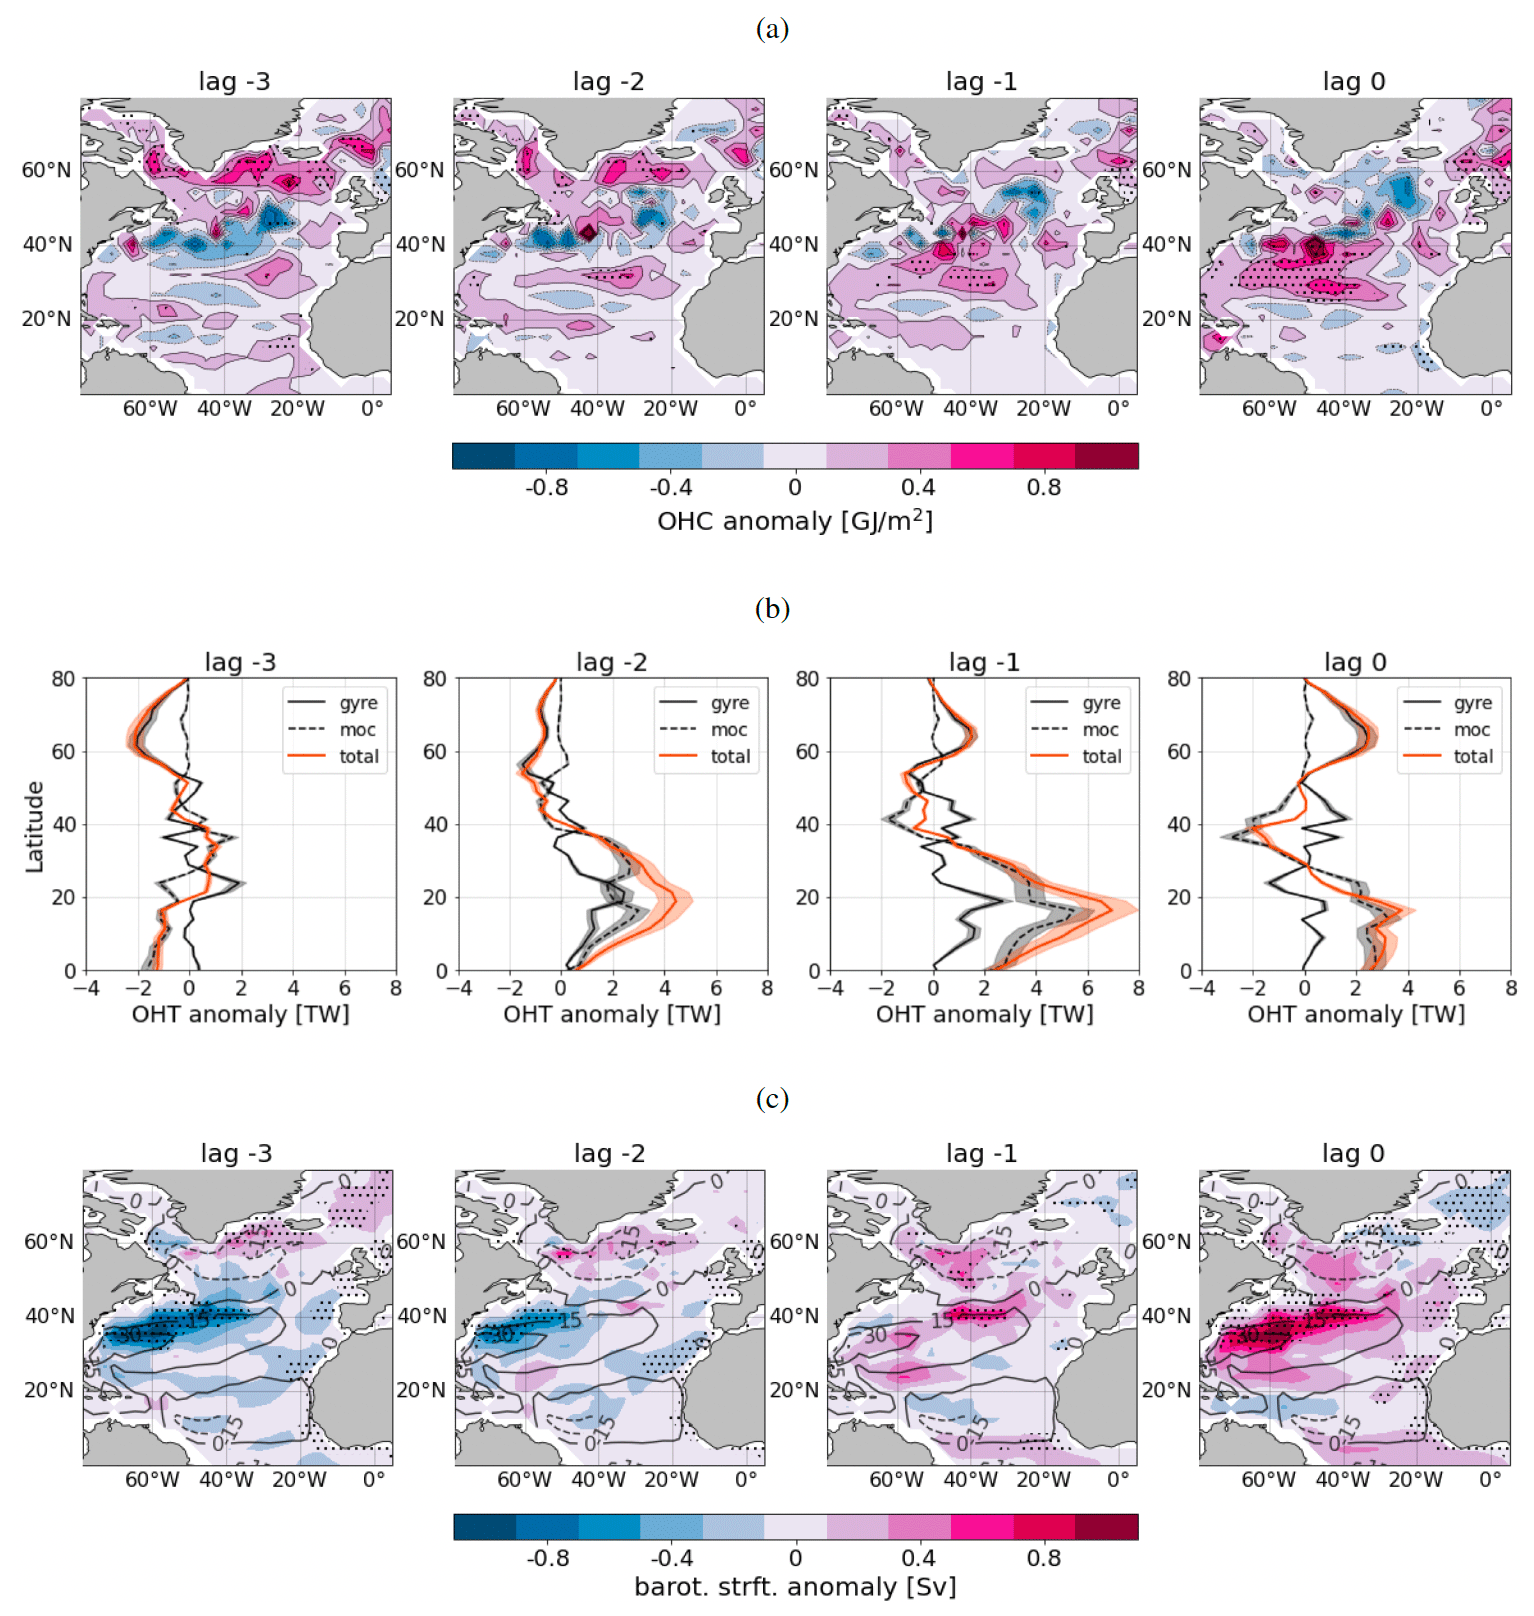
Figure 3Extremely warm European summers and their relation to ocean quantities. (a) Upper 700 m ocean heat content. Anomaly of 5–10-year bandpass-filtered ocean heat content variability in MPI-GE for different lags prior to extremely warm European summers; values given in GJm−2. For comparison the standard deviation of the year-to-year variation is of the order of 4.3 GJm−2, which means that the highest values in the figure correspond to around 25 % of the total variability. (b) Ocean heat transport. Anomaly of 5–10-year bandpass-filtered ocean heat transport variability in MPI-GE for different lags prior to extremely warm European summers; values given in TW. For comparison the standard deviation of the year-to-year variation is of the order of 50 TW, which means that the highest values in the figure correspond to around 15 % of the total variability. (c) Barotropic stream function. Anomaly of 5–10-year bandpass-filtered barotropic stream function variability in MPI-GE for different lags prior to extremely warm European summers; values given in Sv. Contour lines indicate the mean state of the barotropic stream function; values given in Sv. For comparison the standard deviation of the year-to-year variation is of the order of 8 Sv, which means that the highest values in the figure correspond to around 15 % of the total variability. All lags are given in years. Dots (a, c) and shading (b) denote significance at a 95 % confidence level. Period 1950–2022.
3.4 Atmospheric pathway leading to extremely warm European summers
About 3 years prior to an extremely warm European summer, heat accumulates along the North Atlantic current. This heat is subsequently released into the atmosphere at lag 0. Here, we explain the atmospheric response bridging the ocean heat accumulation with the European summer climate.
The anomaly of the 5–10-year bandpass-filtered atmospheric temperature reveals positive temperature anomalies, especially at higher latitudes around 50–60∘ N (Fig. 4a). These temperature anomalies spatially fit the previously located anomalies of the ocean heat content and resemble the heat accumulation shown in the previous section. Based on this dynamical linkage we conclude that the ocean is warming the atmosphere via the ocean–atmosphere heat flux rather than the atmosphere cooling the ocean. Our conclusion is also supported by the positive sign of the heat flux anomaly, indicative of heat flux transfer from the ocean to the atmosphere. The transfer of heat from the ocean to the atmosphere is strong enough that its signal reaches up to 200 hPa altitude, with a peak in the range of 400–600 hPa. This warming of the tropospheric high latitudes provides a decrease in the meridional temperature gradient and results in a reduction of wind shear due to the thermal wind balance. This leads to a weakened jet stream in the years with extremely warm summers compared to years without extremely warm European summers. In addition, the average position of the jet stream, in time and across ensemble members, is shifted northward during extremely warm European summers; this northward shift indicates the advance of subtropical air masses into higher latitudes (Fig. 4; orange contour lines).
The 5–10-year bandpass-filtered sea level pressure anomalies reveal a structure of a Scandinavian blocking, which can be identified considering years with and without extremely warm summers (Fig. 4b). The Scandinavian blocking can drive heat extremes over central Europe (Spensberger et al., 2020) and connects the sub-decadal North Atlantic Ocean heat accumulation, leading to extremely warm summers over central Europe via specific atmospheric conditions. Additionally, some studies show that the weakening of wind speeds during extremely warm European summers can increase the probability of atmospheric blocking (Woollings et al., 2018), which would in turn increase the likelihood of heat extremes (Kautz et al., 2022). Here, we show that the long-term accumulation of heat in the North Atlantic Ocean leads to an above average ocean–atmosphere heat flux, which in turn can influence the atmospheric circulation and could further affect the occurrence of long-lasting high-pressure systems, favoring blocking.
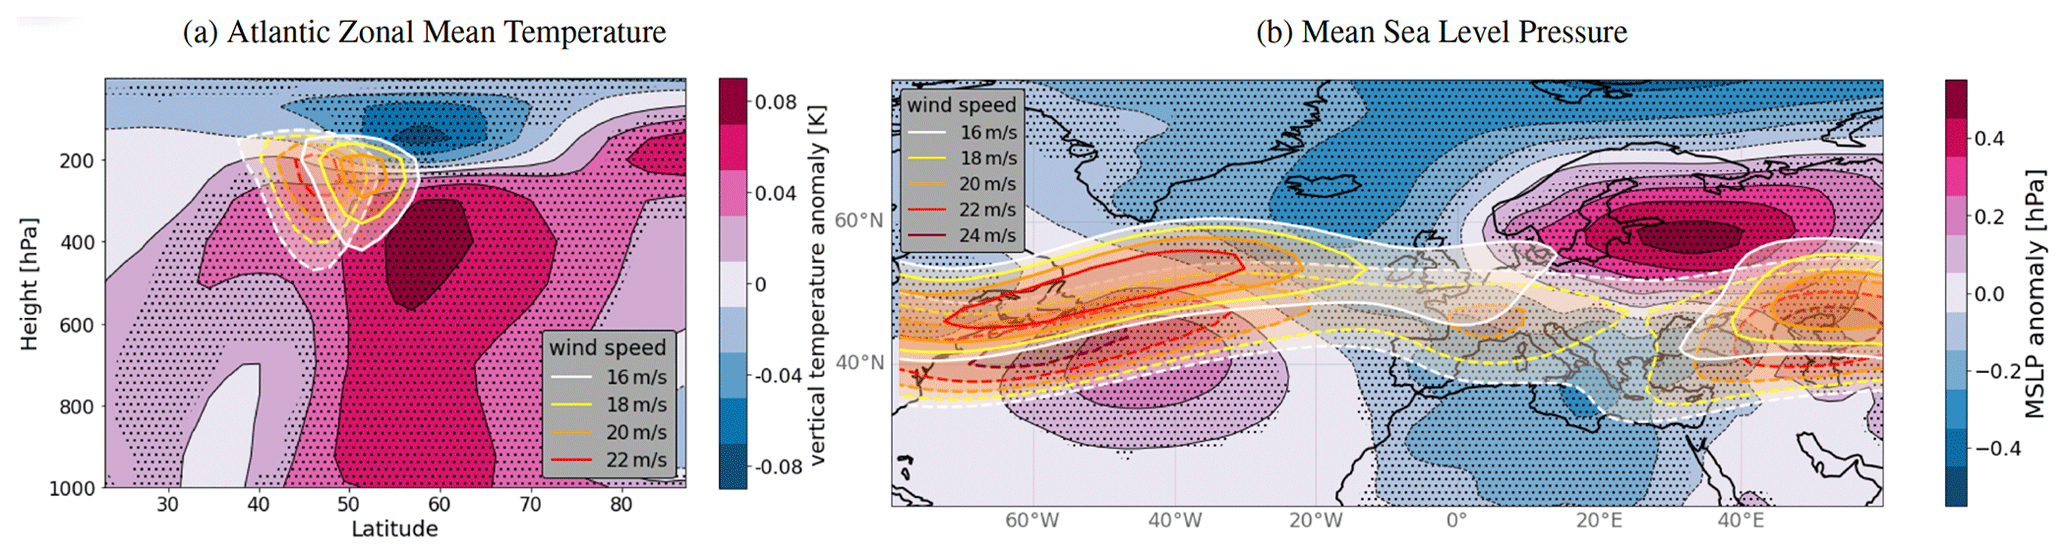
Figure 4Extremely warm European summers and their atmospheric pathway. (a) Anomaly of 5–10-year bandpass-filtered Atlantic zonal mean temperature variability in MPI-GE during extremely warm European summers (lag 0); values given in K. For comparison the standard deviation of the year-to-year variation is of the order of 0.3 K, which means that the highest values in the figure correspond to around 30 % of the total variability. (b) Anomaly of 5–10-year bandpass-filtered mean sea level pressure variability in MPI-GE during extremely warm European summers (lag 0); values given in hPa. For comparison the standard deviation of the year-to-year variation is of the order of 3 hPa, which means that the highest values in the figure correspond to around 15 % of the total variability. The orange contour lines indicate the mean position of the jet stream (given by the mean zonal wind speed over 200–300 hPa) averaged over years showing an extremely warm European summer (solid line) and years showing no extremely warm summer (dashed line); values given in m s−1. Dots denote significance at a 95 % confidence level. Period 1950–2022.
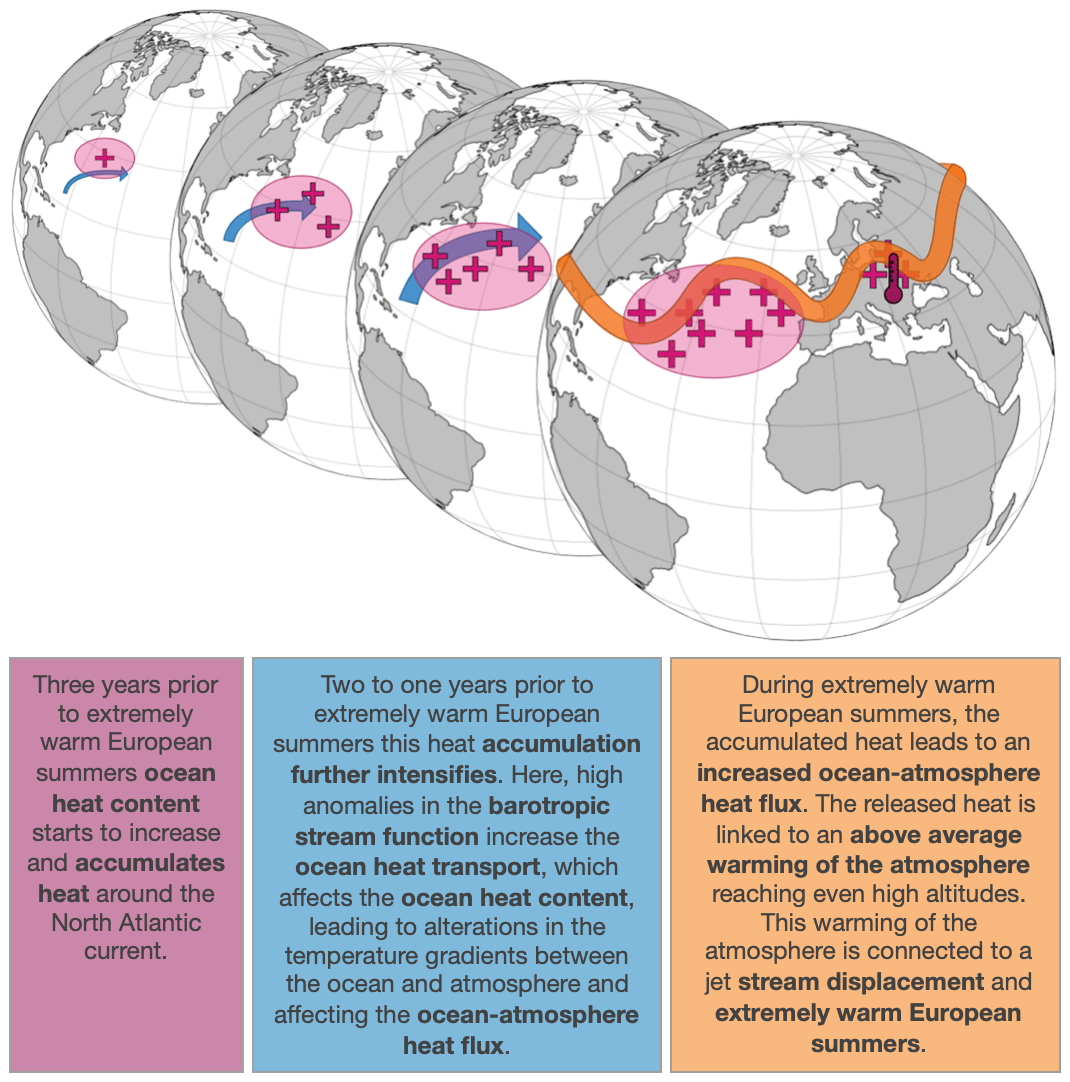
Figure 5Schematic sketch illustrating the described mechanism. The blue arrows illustrate the increasing North Atlantic current; the pink crosses indicate the increase in ocean heat content and accumulation of heat, and the orange belt illustrates the jet stream. The thermometer at lag 0 illustrates the extremely warm European summers.
The North Atlantic Ocean heat accumulation impacts the occurrence of extremely warm summers over central Europe on sub-decadal timescales in MPI-GE. Using MPI-GE, we show that starting several years prior, anomalies of the ocean heat transport and associated ocean heat content changes result in ocean–atmosphere heat flux anomalies leading to extremely warm European summers.
These positive anomalies of the ocean heat transport, as well as ocean heat content, lead to an intensification of the North Atlantic current and accumulation of heat content along the subtropical gyre. This accumulated heat content is released mainly through the ocean heat transport by the subpolar gyre to the atmosphere during extremely warm European summers. The released heat in turn leads to a displacement of the jet stream and enhanced atmospheric blocking conditions.
Although we focus on 3 years prior to the extremely warm summers, there is evidence potentially linking this mechanism to a fully coupled atmosphere–ocean cycle in the North Atlantic Ocean evolving in a 7–10-year period. Such oscillating behavior has been identified in a number of quantities involving observed sea surface temperatures and Gulf Steam indices (Czaja and Marshall, 2001; McCarthy et al., 2018), heat content and overturning stream functions (Martin et al., 2019), or the North Atlantic Oscillation (NAO; Costa and Verdiere, 2002). In fact, observations reveal that the European summer mean climate is ultimately connected to such a coupled atmosphere–ocean cycle (Müller et al., 2020). Comparable to our results, Martin et al. (2019) identified a similar atmosphere–ocean cycle using also the MPI-ESM in the low-resolution setup. Extending our analysis up to 8 years prior to extremely warm summers is in line with their results, indicating the close relationship of the occurrence of extremely warm European summers with the sub-decadal North Atlantic atmosphere–ocean cycle (see Figs. A1–3).
We find that the coupled oscillation in the North Atlantic Ocean influences the occurrence of very hot summers in Europe on sub-decadal timescales. However, on this timescale other modes of oceanic variability, such as the North Atlantic Oscillation, El Niño–Southern Oscillation, or Pacific Decadal Oscillation, may also be influential. Observed decadal teleconnections between the Pacific Ocean and North Atlantic Ocean have been shown, e.g,. in Müller et al. (2008). Global maps of heat flux during extremely warm European summers reveal negative anomalies within the tropical Pacific and patterns matching the Pacific decadal variability (PDV; 90–170∘ W, 20∘ N), indicating an influence of other external drivers. However, a direct effect of PDV or ENSO on the sub-decadal occurrence of extremely warm European summers has not been found here. Additionally, our findings might also be impacted by other mechanisms that interact with each other and possibly lead to the occurrence of extreme events over Europe. For example, the North Atlantic Oscillation (NAO) and the Atlantic multi-decadal variability (AMV) exert significant influence on the occurrence of extreme events over Europe (Scaife et al., 2008; Qasmi et al., 2021). The NAO plays a crucial role in shaping weather patterns, contributing to the development of heatwaves and droughts, while variations in the AMV can impact atmospheric circulation patterns, influencing the frequency and intensity of extreme events. Whether further climate modes have an impact on the proposed mechanism is beyond of the scope of this paper and should be further explored.
Here, we focus on extremely warm European summers associated with the decadal atmosphere–ocean coupling in the North Atlantic Ocean. However, given that the coupled cycle appears over several years, we expect that there is an influence not only in the summertime, but also for other seasons and respective extreme conditions, as well as further variables relevant for heat extremes, such as the daily maximum temperature. Furthermore, the presented process of ocean heat distribution changes at multiyear lead times prior to an extreme event could potentially enhance the predictability of European climate and extremes. Multiyear prediction skill of European climate has been achieved on the continental scale (Smith et al., 2020). However, an extension to predict extreme conditions has so far not fully been established (Borchert et al., 2019).
Moreover, the investigated sub-decadal extreme heat variability implies increased risk of heat-related socioeconomic and ecological impacts, in addition to year-to-year variability and rising temperatures due to increasing greenhouse gas (GHG) concentrations. Due to the prominence of the sub-decadal variability and due to the severity of the impacts, a deeper understanding of the sub-decadal processes leading to such extremely warm summers is crucial for reducing the uncertainties in both attribution and prediction of high-impact events, which in turn facilitates preparedness and the efficiency of adaptation and mitigation efforts. Lastly, replicating this analysis for different climate models would be of great importance to sample potential model uncertainty in these results and help us gain further understanding of this mechanism.
A1 Barotropic stream function and subpolar gyre
The fact that no pronounced anomalies of the barotropic stream function can be found in the area of the subpolar gyre is probably related to the filter method we chose. The 5–10-year bandpass filter filters out all signals that occur on larger or smaller timescales. According to Nigam et al. (2018) the subpolar gyre is subject to decadal variations of about 14 years and timescales which are not further relevant for our analysis.
A2 Link to fully coupled atmosphere–ocean cycle
Analyzing longer lags, in this case lag −7 to 0, prior to extremely warm European summers shows that the described mechanism can be seen as attached to a re-emerging fully coupled atmosphere–ocean cycle evolving in a 7–10-year period (Figs. A1–3). Such oscillating behavior, without linkage to European summer climate, has been identified and described in previous studies (Czaja and Marshall, 2001; McCarthy et al., 2018; Martin et al., 2019). In Martin et al. (2019) an NAO-like wind-driven forcing steering dipolar ocean overturning anomalies is associated with a contraction and weakening of the subpolar gyre (see their Fig. 6). In the following years, the barotropic stream function reveals a poleward shift and a strengthening of the North Atlantic current at the same time as the accumulation of ocean heat content (see their Fig. 7). The barotropic stream function in MPI-GE prior to heat extremes similarly illustrates strengthening of the North Atlantic current and accumulation of heat. For longer lags a phase reversal is apparent, similar to the oscillatory behavior of the coupling as described in Martin et al. (2019).
Table A1Fraction of events that coincide with extremely warm European summers in MPI-GE. Period 1950–2022. The percentages are given by the ratio between the number of events (e.g., El Niño events) during extremely warm European summers and the number of all occurring events.
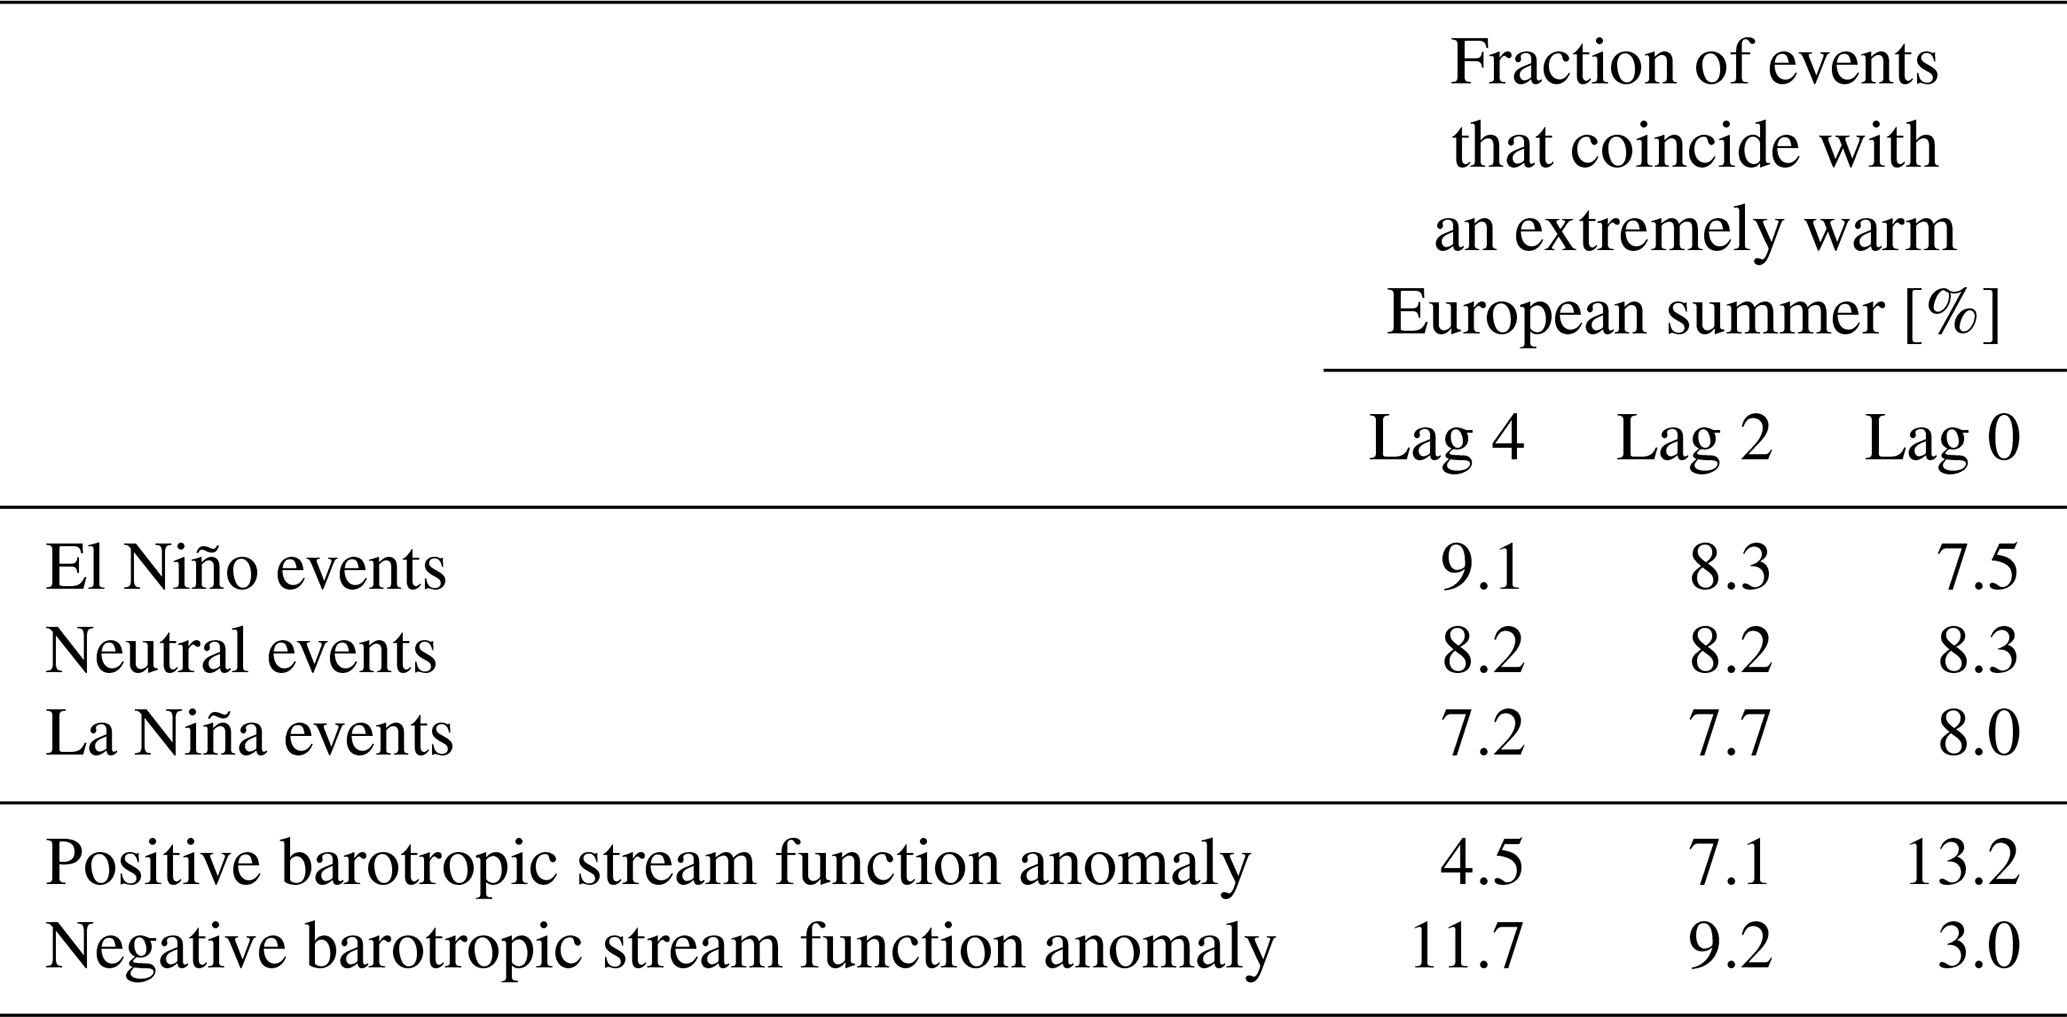
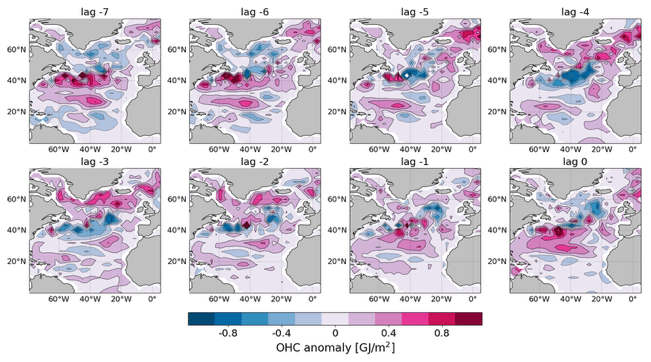
Figure A1Shift of the ocean heat content signal. Anomaly of 5–10-year bandpass-filtered ocean heat content (0–700 m, 30–60∘ W) variability in MPI-GE for different lags prior to heat extremes. Period 1950–2022.
A3 Influence of the El Niño–Southern Oscillation
Many studies have examined the influence of the El Niño–Southern Oscillation (ENSO) on European temperatures and also heat extremes (Martija-Díez et al., 2021). However, ENSO does not seem to play a dominant role for the mechanism studied here. On the one hand, the fraction of extremely warm European summers during the different ENSO phases (El Niño, La Niña, neutral) is consistently low for different lags, so no specific ENSO phase can be concretely linked to extremely warm European summers on sub-decadal timescales (Table A1). For this analysis, we defined ENSO phases by sea surface temperature (SSTs) exceeding a threshold of ± 1 standard deviation in the Niño-3.4 region; however, by testing other thresholds we verify that our conclusion is not threshold-sensitive. Our statement that extremely warm European summers are mainly driven by North Atlantic Ocean heat accumulation and not ENSO is further supported by the proportion of extremely warm European summers during positive–negative anomalies of the barotropic stream function in the North Atlantic Ocean. Here, a clear correlation between the two can be seen for different lags. While in lag 0 the extremely warm summers are mainly associated with positive anomalies of the barotropic stream function, in lag −4 these are mainly associated with negative anomalies of the barotropic stream function. Furthermore, for our study, no specific ENSO phase seem to be linked to specify anomalies of the barotropic stream function. In addition, the heat flux anomalies during extremely warm European summers show no typical ENSO pattern in the Niño-3.4 region (Fig. 2b). However, positive anomalies matching the North Pacific Index (NPI) could be found around 90–170∘ W, 20∘ N, indicating an influence of external drivers that, although beyond of the scope of this study, should be further explored.
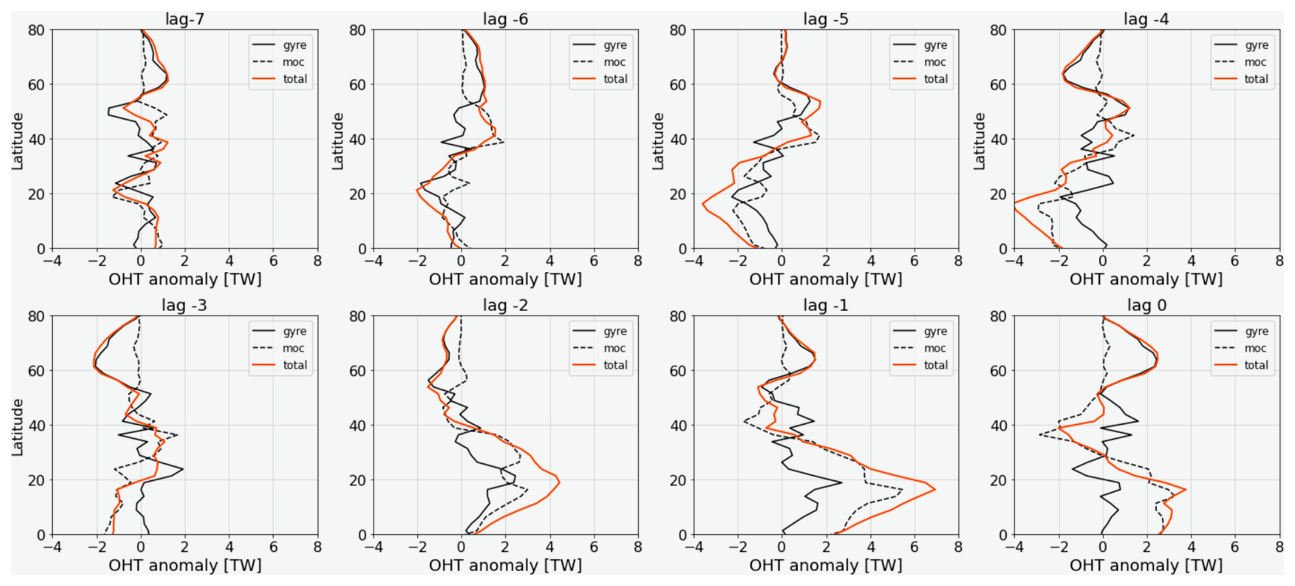
Figure A2Shift of the ocean heat transport signal. Anomaly of 5–10-year bandpass-filtered ocean heat transport variability in MPI-GE for different lags prior to heat extremes. Period 1950–2022.
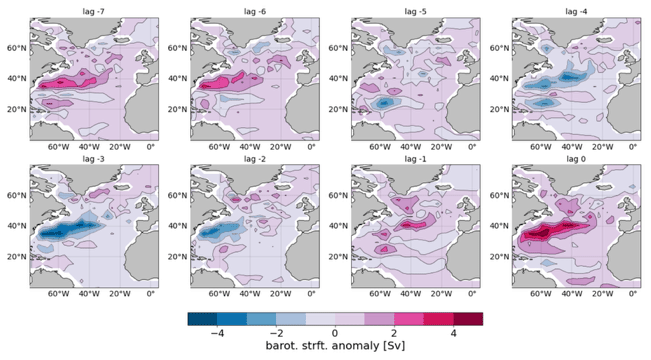
Figure A3Shift of the barotropic stream function signal. Anomaly of 5–10-year bandpass-filtered barotropic stream function variability in MPI-GE for different lags prior to heat extremes. Period 1950–2022.
Further simulation and download details for MPI-GE data can be found on our website (https://www.mpimet.mpg.de/en/grand-ensemble/, Maher et al., 2019). ERA5 reanalysis data are available from the Copernicus Data Store at https://doi.org/10.24381/cds.6860a573 (Hersbach et al., 2019).
LW did the analysis in correspondence with WAM, LSG, and DM and wrote the initial version of the paper. All authors commented on the paper. WAM, LSG, and DM provided guidance on the overall direction of the work.
The contact author has declared that none of the authors has any competing interests.
Publisher's note: Copernicus Publications remains neutral with regard to jurisdictional claims made in the text, published maps, institutional affiliations, or any other geographical representation in this paper. While Copernicus Publications makes every effort to include appropriate place names, the final responsibility lies with the authors.
We thank Luis Kornblueh, Jürgen Kröger, and Michael Botzet for producing the MPI-GE simulations we used for our analysis, Rohit Ghosh for providing the MPI-GE ocean heat transport data we used for our analysis, and Johann Jungclaus for reviewing the paper at an earlier stage. Additionally, we acknowledge the Swiss National Computing Centre (CSCS) and the German Climate Computing Center (DKRZ) for providing the necessary computational resources. Furthermore, we would like to thank Olivia Martius as well as two anonymous reviewers for their valuable comments within the review process.
This work was funded by the International Max Planck Research School on Earth System Modelling (IMPRS-ESM; Lara Wallberg), the ClimXtreme project DecHeat (grant no. 01LP1901F; Laura Suarez-Gutierrez, Wolfgang A. Müller), the European Union's Horizon Europe Framework Programme under a Marie Skłodowska-Curie (grant no. 101064940; Laura Suarez-Gutierrez), and the JPI Oceans NextG-Climate Science-ROADMAP project (grant no. 01LP2002A; Daniela Matei).
The article processing charges for this open-access publication were covered by the Max Planck Society.
This paper was edited by Olivia Martius and reviewed by two anonymous referees.
Årthun, M., Kolstad, E. W., Eldevik, T., and Keenlyside, N. S.: Time Scales and Sources of European Temperature Variability, Geophys. Res. Lett., 45, 3597–3604, https://doi.org/10.1002/2018gl077401, 2018. a, b
Beobide-Arsuaga, G., Düsterhus, A., Müller, W. A., Barnes, E. A., and Baehr, J.: Spring Regional Sea Surface Temperatures as a Precursor of European Summer Heatwaves, Geophys. Res. Lett., 50, e2022GL100727, https://doi.org/10.1029/2022gl100727, 2023. a
Borchert, L. F., Pohlmann, H., Baehr, J., Neddermann, N.-C., Suarez-Gutierrez, L., and Müller, W. A.: Decadal Predictions of the Probability of Occurrence for Warm Summer Temperature Extremes, Geophys. Res. Lett., 46, 14042–14051, https://doi.org/10.1029/2019gl085385, 2019. a, b
Callahan, C. W. and Mankin, J. S.: Globally unequal effect of extreme heat on economic growth, Sci. Adv., 8, eadd3726, https://doi.org/10.1126/sciadv.add3726, 2022. a
Cane, M. A., Clement, A. C., Murphy, L. N., and Bellomo, K.: Low-Pass Filtering, Heat Flux, and Atlantic Multidecadal Variability, J. Clim., 30, 7529–7553, https://doi.org/10.1175/jcli-d-16-0810.1, 2017. a
Ceglar, A., Zampieri, M., Toreti, A., and Dentener, F.: Observed Northward Migration of Agro-Climate Zones in Europe Will Further Accelerate Under Climate Change, Earths Future, 7, 1088–1101, https://doi.org/10.1029/2019ef001178, 2019. a
Costa, E. D. D. and Verdiere, A. C. D.: The 7.7-year North Atlantic Oscillation, Q. J. Roy. Meteorol. Soc., 128, 797–817, https://doi.org/10.1256/0035900021643692, 2002. a, b
Czaja, A. and Marshall, J.: Observations of atmosphere-ocean coupling in the North Atlantic, Q. J. Roy. Meteorol. Soc., 127, 1893–1916, https://doi.org/10.1002/qj.49712757603, 2001. a, b, c, d, e
Eden, C. and Greatbatch, R. J.: A Damped Decadal Oscillation in the North Atlantic Climate System, J. Clim., 16, 4043–4060, https://doi.org/10.1175/1520-0442(2003)016<4043:addoit>2.0.co;2, 2003. a
Fischer, E. M. and Schär, C.: Future changes in daily summer temperature variability: driving processes and role for temperature extremes, Clim. Dynam., 33, 917–935, https://doi.org/10.1007/s00382-008-0473-8, 2008. a
Fischer, E. M., Rajczak, J., and Schär, C.: Changes in European summer temperature variability revisited, Geophys. Res. Lett., 39, L19702, https://doi.org/10.1029/2012gl052730, 2012. a
Gao, M., Yang, J., Gong, D., Shi, P., Han, Z., and Kim, S.-J.: Footprints of Atlantic Multidecadal Oscillation in the Low-Frequency Variation of Extreme High Temperature in the Northern Hemisphere, J. Clim., 32, 791–802, https://doi.org/10.1175/jcli-d-18-0446.1, 2019. a
Gasparrini, A., Guo, Y., Hashizume, M., Kinney, P. L., Petkova, E. P., Lavigne, E., Zanobetti, A., Schwartz, J. D., Tobias, A., Leone, M., Tong, S., Honda, Y., Kim, H., and Armstrong, B. G.: Temporal Variation in Heat–Mortality Associations: A Multicountry Study, Environ. Health Perspect., 123, 1200–1207, https://doi.org/10.1289/ehp.1409070, 2015. a
Ghil, M., Allen, M. R., Dettinger, M. D., Ide, K., Kondrashov, D., Mann, M. E., Robertson, A. W., Saunders, A., Tian, Y., Varadi, F., and Yiou, P.: Advanced spectral methods for climatic time series, Rev. Geophys., 40, 3.1–3.41, https://doi.org/10.1029/2000rg000092, 2002. a
Ghosh, R., Müller, W. A., Baehr, J., and Bader, J.: Impact of observed North Atlantic multidecadal variations to European summer climate: a linear baroclinic response to surface heating, Clim. Dynam., 48, 3547–3563, https://doi.org/10.1007/s00382-016-3283-4, 2016. a
Ghosh, R., Putrasahan, D., Manzini, E., Lohmann, K., Keil, P., Hand, R., Bader, J., Matei, D., and Jungclaus, J. H.: Two Distinct Phases of North Atlantic Eastern Subpolar Gyre and Warming Hole Evolution under Global Warming, J. Clim., 36, 1881–1894, https://doi.org/10.1175/jcli-d-22-0222.1, 2023. a
Giorgetta, M. A., Jungclaus, J., Reick, C. H., Legutke, S., Bader, J., Böttinger, M., Brovkin, V., Crueger, T., Esch, M., Fieg, K., Glushak, K., Gayler, V., Haak, H., Hollweg, H.-D., Ilyina, T., Kinne, S., Kornblueh, L., Matei, D., Mauritsen, T., Mikolajewicz, U., Mueller, W., Notz, D., Pithan, F., Raddatz, T., Rast, S., Redler, R., Roeckner, E., Schmidt, H., Schnur, R., Segschneider, J., Six, K. D., Stockhause, M., Timmreck, C., Wegner, J., Widmann, H., Wieners, K.-H., Claussen, M., Marotzke, J., and Stevens, B.: Climate and carbon cycle changes from 1850 to 2100 in MPI-ESM simulations for the Coupled Model Intercomparison Project phase 5, J. Adv. Model. Earth Sy., 5, 572–597, https://doi.org/10.1002/jame.20038, 2013. a
Hersbach, H., Bell, B., Berrisford, P., Biavati, G., Horányi, A., Muñoz Sabater, J., Nicolas, J., Peubey, C., Radu, R., Rozum, I., Schepers, D., Simmons, A., Soci, C., Dee, D., and Thépaut, J.-N.: ERA5 hourly data on pressure levels from 1959 to present, Copernicus Climate Change Service, Climate Data Store [data set], https://doi.org/10.24381/cds.bd0915c6, 2019. a, b
Horton, D. E., Johnson, N. C., Singh, D., Swain, D. L., Rajaratnam, B., and Diffenbaugh, N. S.: Contribution of changes in atmospheric circulation patterns to extreme temperature trends, Nature, 522, 465–469, https://doi.org/10.1038/nature14550, 2015. a
Kautz, L.-A., Martius, O., Pfahl, S., Pinto, J. G., Ramos, A. M., Sousa, P. M., and Woollings, T.: Atmospheric blocking and weather extremes over the Euro-Atlantic sector – a review, Weather Clim. Dynam., 3, 305–336, https://doi.org/10.5194/wcd-3-305-2022, 2022. a
Li, M., Yao, Y., Simmonds, I., Luo, D., Zhong, L., and Chen, X.: Collaborative impact of the NAO and atmospheric blocking on European heatwaves, with a focus on the hot summer of 2018, Environ. Res. Lett., 15, 114003, https://doi.org/10.1088/1748-9326/aba6ad, 2020. a
Maher, N., Milinski, S., Suarez-Gutierrez, L., Botzet, M., Dobrynin, M., Kornblueh, L., Kröger, J., Takano, Y., Ghosh, R., Hedemann, C., Li, C., Li, H., Manzini, E., Notz, D., Putrasahan, D., Boysen, L., Claussen, M., Ilyina, T., Olonscheck, D., Raddatz, T., Stevens, B., and Marotzke, J.: The Max Planck Institute Grand Ensemble: Enabling the Exploration of Climate System Variability, J. Adv. Model. Earth Sy., 11, 2050–2069, https://doi.org/10.1029/2019ms001639, 2019. a, b, c
Marsland, S., Haak, H., Jungclaus, J., Latif, M., and Röske, F.: The Max-Planck-Institute global ocean/sea ice model with orthogonal curvilinear coordinates, Ocean Model., 5, 91–127, https://doi.org/10.1016/s1463-5003(02)00015-x, 2003. a
Martija-Díez, M., Rodríguez-Fonseca, B., and López-Parages, J.: ENSO Influence on Western European summer and fall Temperatures, J. Clim., 34, 8013–8031, https://doi.org/10.1175/jcli-d-20-0808.1, 2021. a, b
Martin, T., Reintges, A., and Latif, M.: Coupled North Atlantic Subdecadal Variability in CMIP5 Models, J. Geophys. Res.-Ocean., 124, 2404–2417, https://doi.org/10.1029/2018jc014539, 2019. a, b, c, d, e, f, g
Mauritsen, T., Stevens, B., Roeckner, E., Crueger, T., Esch, M., Giorgetta, M., Haak, H., Jungclaus, J., Klocke, D., Matei, D., Mikolajewicz, U., Notz, D., Pincus, R., Schmidt, H., and Tomassini, L.: Tuning the climate of a global model, J. Adv. Model. Earth Sy., 4, M00A01, https://doi.org/10.1029/2012ms000154, 2012. a
McCarthy, G. D., Joyce, T. M., and Josey, S. A.: Gulf Stream Variability in the Context of Quasi-Decadal and Multidecadal Atlantic Climate Variability, Geophys. Res. Lett., 45, 11257–11264, https://doi.org/10.1029/2018gl079336, 2018. a, b, c
Meehl, G. A. and Tebaldi, C.: More Intense, More Frequent, and Longer Lasting Heat Waves in the 21st Century, Science, 305, 994–997, https://doi.org/10.1126/science.1098704, 2004. a
Müller, W. A., Frankignoul, C., and Chouaib, N.: Observed decadal tropical Pacific–North Atlantic teleconnections, Geophys. Res. Lett., 35, L24810, https://doi.org/10.1029/2008gl035901, 2008. a
Müller, W. A., Borchert, L., and Ghosh, R.: Observed Subdecadal Variations of European Summer Temperatures, Geophys. Res. Lett., 47, e2019GL08604, https://doi.org/10.1029/2019gl086043, 2020. a, b
Nigam, S., Ruiz-Barradas, A., and Chafik, L.: Gulf Stream Excursions and Sectional Detachments Generate the Decadal Pulses in the Atlantic Multidecadal Oscillation, J. Clim., 31, 2853–2870, https://doi.org/10.1175/jcli-d-17-0010.1, 2018. a
Qasmi, S., Sanchez-Gomez, E., Ruprich-Robert, Y., Boé, J., and Cassou, C.: Modulation of the Occurrence of Heatwaves over the Euro-Mediterranean Region by the Intensity of the Atlantic Multidecadal Variability, J. Clim., 34, 1099–1114, https://doi.org/10.1175/jcli-d-19-0982.1, 2021. a, b
Reintges, A., Latif, M., and Park, W.: Sub-decadal North Atlantic Oscillation variability in observations and the Kiel Climate Model, Clim. Dynam., 48, 3475–3487, https://doi.org/10.1007/s00382-016-3279-0, 2016. a
Ribeiro, A. F. S., Russo, A., Gouveia, C. M., Páscoa, P., and Zscheischler, J.: Risk of crop failure due to compound dry and hot extremes estimated with nested copulas, Biogeosciences, 17, 4815–4830, https://doi.org/10.5194/bg-17-4815-2020, 2020. a
Röthlisberger, M. and Papritz, L.: Quantifying the physical processes leading to atmospheric hot extremes at a global scale, Nat. Geosci., 16, 210–216, https://doi.org/10.1038/s41561-023-01126-1, 2023. a
Ruiter, M. C., Couasnon, A., Homberg, M. J. C., Daniell, J. E., Gill, J. C., and Ward, P. J.: Why We Can No Longer Ignore Consecutive Disasters, Earths Future, 8, e2019EF001425, https://doi.org/10.1029/2019ef001425, 2020. a
Ruprich-Robert, Y., Moreno-Chamarro, E., Levine, X., Bellucci, A., Cassou, C., Castruccio, F., Davini, P., Eade, R., Gastineau, G., Hermanson, L., Hodson, D., Lohmann, K., Lopez-Parages, J., Monerie, P.-A., Nicolì, D., Qasmi, S., Roberts, C. D., Sanchez-Gomez, E., Danabasoglu, G., Dunstone, N., Martin-Rey, M., Msadek, R., Robson, J., Smith, D., and Tourigny, E.: Impacts of Atlantic multidecadal variability on the tropical Pacific: a multi-model study, npj Clim. Atmos. Sci., 4, 33, https://doi.org/10.1038/s41612-021-00188-5, 2021. a
Scaife, A. A., Folland, C. K., Alexander, L. V., Moberg, A., and Knight, J. R.: European Climate Extremes and the North Atlantic Oscillation, J. Clim., 21, 72–83, https://doi.org/10.1175/2007jcli1631.1, 2008. a
Schär, C., Vidale, P. L., Lüthi, D., Frei, C., Häberli, C., Liniger, M. A., and Appenzeller, C.: The role of increasing temperature variability in European summer heatwaves, Nature, 427, 332–336, https://doi.org/10.1038/nature02300, 2004. a
Seneviratne, Koster, R. D., Guo, Z., Dirmeyer, P. A., Kowalczyk, E., Lawrence, D., Liu, P., Mocko, D., Lu, C.-H., Oleson, K. W., and Verseghy, D.: Soil Moisture Memory in AGCM Simulations: Analysis of Global Land–Atmosphere Coupling Experiment (GLACE) Data, J. Hydrometeorol., 7, 1090–1112, https://doi.org/10.1175/jhm533.1, 2006. a
Seneviratne, Zhang, X., Adnan, M., Badi, W., Dereczynski, C., A. Di Luca, S. Ghosh, I. I. J. K. S. L. F. O. I. P. M. S. S. V.-S. M. W., and Zhou, B.: Weather and Climate Extreme Events in a Changing Climate, in: Climate Change 2021: The Physical Science Basis, Contribution of Working Group I to the Sixth Assessment Report of the Intergovernmental Panel on Climate Change, edited by: Seneviratne, S. I., Cambridge University Press, Cambridge, United Kingdom and New York, NY, USA, https://doi.org/10.1017/9781009157896.013, 2021. a
Simpson, I. R., Deser, C., McKinnon, K. A., and Barnes, E. A.: Modeled and Observed Multidecadal Variability in the North Atlantic Jet Stream and Its Connection to Sea Surface Temperatures, J. Clim., 31, 8313–8338, https://doi.org/10.1175/jcli-d-18-0168.1, 2018. a
Smith, D. M., Scaife, A. A., Eade, R., Athanasiadis, P., Bellucci, A., Bethke, I., Bilbao, R., Borchert, L. F., Caron, L.-P., Counillon, F., Danabasoglu, G., Delworth, T., Doblas-Reyes, F. J., Dunstone, N. J., Estella-Perez, V., Flavoni, S., Hermanson, L., Keenlyside, N., Kharin, V., Kimoto, M., Merryfield, W. J., Mignot, J., Mochizuki, T., Modali, K., Monerie, P.-A., Müller, W. A., Nicolí, D., Ortega, P., Pankatz, K., Pohlmann, H., Robson, J., Ruggieri, P., Sospedra-Alfonso, R., Swingedouw, D., Wang, Y., Wild, S., Yeager, S., Yang, X., and Zhang, L.: North Atlantic climate far more predictable than models imply, Nature, 583, 796–800, https://doi.org/10.1038/s41586-020-2525-0, 2020. a
Spensberger, C., Madonna, E., Boettcher, M., Grams, C. M., Papritz, L., Quinting, J. F., Röthlisberger, M., Sprenger, M., and Zschenderlein, P.: Dynamics of concurrent and sequential Central European and Scandinavian heatwaves, Q. J. Roy. Meteorol. Soc., 146, 2998–3013, https://doi.org/10.1002/qj.3822, 2020. a
Suarez-Gutierrez, L., Li, C., Müller, W. A., and Marotzke, J.: Internal variability in European summer temperatures at 1.5 ∘C and 2 ∘C of global warming, Environ. Res. Lett., 13, 064026, https://doi.org/10.1088/1748-9326/aaba58, 2018. a
Suarez-Gutierrez, L., Müller, W. A., Li, C., and Marotzke, J.: Dynamical and thermodynamical drivers of variability in European summer heat extremes, Clim. Dynam., 54, 4351–4366, https://doi.org/10.1007/s00382-020-05233-2, 2020a. a, b, c, d
Suarez-Gutierrez, L., Müller, W. A., Li, C., and Marotzke, J.: Hotspots of extreme heat under global warming, Clim. Dynam., 55, 429–447, https://doi.org/10.1007/s00382-020-05263-w, 2020b. a
Suarez-Gutierrez, L., Milinski, S., and Maher, N.: Exploiting large ensembles for a better yet simpler climate model evaluation, Clim. Dynam., 57, 2557–2580, https://doi.org/10.1007/s00382-021-05821-w, 2021. a
Sutton, R. T. and Hodson, D. L. R.: Atlantic Ocean Forcing of North American and European Summer Climate, Science, 309, 115–118, https://doi.org/10.1126/science.1109496, 2005. a
Vicedo-Cabrera, A. M., Scovronick, N., Sera, F., Royé, D., Schneider, R., Tobias, A., Astrom, C., Guo, Y., Honda, Y., Hondula, D. M., Abrutzky, R., Tong, S., de Sousa Zanotti Stagliorio Coelho, M., Saldiva, P. H. N., Lavigne, E., Correa, P. M., Ortega, N. V., Kan, H., Osorio, S., Kyselý, J., Urban, A., Orru, H., Indermitte, E., Jaakkola, J. J. K., Ryti, N., Pascal, M., Schneider, A., Katsouyanni, K., Samoli, E., Mayvaneh, F., Entezari, A., Goodman, P., Zeka, A., Michelozzi, P., de'Donato, F., Hashizume, M., Alahmad, B., Diaz, M. H., Valencia, C. D. L. C., Overcenco, A., Houthuijs, D., Ameling, C., Rao, S., Ruscio, F. D., Carrasco-Escobar, G., Seposo, X., Silva, S., Madureira, J., Holobaca, I. H., Fratianni, S., Acquaotta, F., Kim, H., Lee, W., Iniguez, C., Forsberg, B., Ragettli, M. S., Guo, Y. L. L., Chen, B. Y., Li, S., Armstrong, B., Aleman, A., Zanobetti, A., Schwartz, J., Dang, T. N., Dung, D. V., Gillett, N., Haines, A., Mengel, M., Huber, V., and Gasparrini, A.: The burden of heat-related mortality attributable to recent human-induced climate change, Nat. Clim. Change, 11, 492–500, https://doi.org/10.1038/s41558-021-01058-x, 2021. a
Vogel, M. M., Orth, R., Cheruy, F., Hagemann, S., Lorenz, R., Hurk, B. J. J. M., and Seneviratne, S. I.: Regional amplification of projected changes in extreme temperatures strongly controlled by soil moisture-temperature feedbacks, Geophys. Res. Lett., 44, 1511–1519, https://doi.org/10.1002/2016gl071235, 2017. a
Wilks, D. S.: The Stippling Shows Statistically Significant Grid Points: How Research Results are Routinely Overstated and Overinterpreted, and What to Do about It, Bull. Am. Meteorol. Soc., 97, 2263–2273, https://doi.org/10.1175/bams-d-15-00267.1, 2016. a
Woollings, T., Barnes, E., Hoskins, B., Kwon, Y.-O., Lee, R. W., Li, C., Madonna, E., McGraw, M., Parker, T., Rodrigues, R., Spensberger, C., and Williams, K.: Daily to Decadal Modulation of Jet Variability, J. Clim., 31, 1297–1314, https://doi.org/10.1175/jcli-d-17-0286.1, 2018. a
Wu, B., Zhou, T., Li, C., Müller, W. A., and Lin, J.: Improved decadal prediction of Northern-Hemisphere summer land temperature, Clim. Dynam., 53, 1357–1369, https://doi.org/10.1007/s00382-019-04658-8, 2019. a