the Creative Commons Attribution 4.0 License.
the Creative Commons Attribution 4.0 License.
 | 04 Sep 2023
Impacts of anthropogenic water regulation on global riverine dissolved organic carbon transport
Yanbin You
Longhuan Wang
Ruichao Li
Heng Yan
Yuhang Tian
Si Chen
Anthropogenic water regulation activities, including reservoir interception, surface water withdrawal, and groundwater extraction, alter riverine hydrologic processes and affect dissolved organic carbon (DOC) export from land to rivers and oceans. In this study, schemes describing soil DOC leaching, riverine DOC transport, and anthropogenic water regulation were developed and incorporated into the Community Land Model 5.0 (CLM5.0) and the River Transport Model (RTM). Three simulations by the developed model were conducted on a global scale from 1981–2013 to investigate the impacts of anthropogenic water regulation on riverine DOC transport. The validation results showed that DOC exports simulated by the developed model were in good agreement with global river observations. The simulations showed that DOC transport in most rivers was mainly influenced by reservoir interception and surface water withdrawal, especially in central North America and eastern China. Four major rivers, including the Danube, Yangtze, Mississippi, and Ganges rivers, have experienced reduced riverine DOC flows due to intense water management, with the largest effect occurring in winter and early spring. In the Danube and Yangtze river basins, the impact in 2013 was 4 to 5 times greater than in 1981, with a retention efficiency of over 50 %. The Ob river basin was almost unaffected. The total impact of anthropogenic water regulation reduced global annual riverine DOC exports to the ocean by approximately 13.36 ± 2.45 Tg C yr−1, and this effect increased from 4.83 % to 6.20 % during 1981–2013, particularly in the Pacific and Atlantic oceans.
- Article
(16262 KB) - Full-text XML
-
Supplement
(529 KB) - BibTeX
- EndNote


Rivers are a pipe linking the two major carbon pools of terrestrial and ocean ecosystems and are one of the key hubs of the global carbon cycle (Cole et al., 2007). According to the Fifth Assessment Report of the Intergovernmental Panel on Climate Change (IPCC AR5), terrestrial ecosystems deliver about 1.7 Pg C yr−1 to rivers through surface and subsurface runoff and about 0.9 Pg C yr−1 to oceans via rivers. Approximately 0.21 Pg of this is dissolved organic carbon (DOC) (Ludwig et al., 1996), which is equivalent to about 1 % of the global net primary productivity (NPP) of terrestrial ecosystems (Zhang, 2012). Riverine DOC is a rather highly reactive organic carbon and is easily decomposed. It is a direct source of carbon for microbial food webs in rivers and oceans, as well as a source of greenhouse gas emissions from freshwater systems (Li et al., 2019; Tranvik and Jansson, 2002). It deeply affects the biogeochemical cycles of rivers and offshore ecosystems. Therefore, it is important to clarify the transport characteristics of riverine DOC for estimating global carbon budgets.
In recent years, anthropogenic water management activities, including reservoir interception, surface water withdrawal, and groundwater extraction, have intensified the degree of interference with natural processes on the surface of river basins, altered the hydrological and hydraulic processes of rivers, and affected material circulation and transportation (Zhang, 2012). For example, extraction from underground aquifers affects hydrological systems, leading to a reduction in subsurface runoff and eventually to decreased soil carbon losses (Zeng et al., 2016), whereas activities such as irrigation can lead to increased surface runoff, resulting in increased soil carbon losses (Ren et al., 2016). Artificially constructed large reservoirs or dams disrupt the carbon cycle balance of the river continuum in its natural state (Maavara et al., 2017), resulting in retention of DOC and sediment, while lower river velocities and higher material concentrations lead to increased microbial activity in the waterbody, thus changing the nutrient state of the river ecosystem (Liu et al., 2022). However, the impact of these anthropogenic disturbances on riverine carbon transport has been ignored in estimations of the global carbon budget (Regnier et al., 2013).
Based on field surveys involving global riverine DOC transport flux estimation, the United Nations Environment Programme has constructed a world river discharge database, GEMS-GLORI, that lists 48 attributes of 555 major world rivers (Meybeck, 1982; Meybeck and Ragu, 2012). There are also regional survey programs, such as the Pan-Arctic River Transport of Nutrients, Organic Matter, and Suspended Sediments (PARTNERS; https://arcticgreatrivers.org/, last access: 25 August 2023) and the United States Geological Survey (USGS) Data Center (https://waterdata.usgs.gov/nwis, last access: 25 August 2023), which provide riverine organic carbon flux data for parts of large rivers. Field survey studies are directly limited by data availability and completeness and therefore mostly focus on large rivers in developed regions, making it difficult to cover rivers in other regions. Moreover, only annual averages are usually available, with no long-term time series variation. Some researchers have started to explore the mechanisms of riverine carbon flux changes using empirical statistical models, which combine observed data with driving factors including river basin characteristics (Ludwig et al., 1996), soil carbon and nitrogen ratios (Aitkenhead and McDowell, 2000), land-cover types (Harrison et al., 2005), and river discharge (Fabre et al., 2020). However, the empirical statistical method does not consider complex ecological processes within the watershed and cannot describe material changes in the river network in detail. To identify changes in carbon transport and its driving mechanisms spatially and explicitly, numerous process-based numerical models are currently used for DOC transport simulations. Futter et al. (2007) proposed the Integrated Catchments Model for Carbon (INCA-C), which explicitly considers land use, hydrological processes, soil carbon biogeochemical cycles, and surface water processes. Liao et al. (2019) developed a three-dimensional terrestrial ecosystem model (ECO3D) considering the influence of lateral water flows. These models simulate regional riverine DOC dynamics more accurately than earlier models, but their accuracy relies on complex parametric schemes of ecohydrological processes and extensive data surveys so that it is difficult to extend these models to global-scale simulations. Wu et al. (2014) integrated ecological driving factors and biogeochemical processes to develop a TRIPLEX-DOC model that predicts DOC metabolism, sorption, desorption, and loss processes in soils. Li et al. (2019) added a river hydrological process module to construct the TRIPLEX-HYDRA model and applied it to simulate global riverine DOC fluxes. However, the model did not consider the impact of human activities on riverine DOC transport. Tian et al. (2015) constructed the Dynamic Land Ecosystem Model (DLEM), a fully distributed model that integrates vegetation dynamics with processes such as water, carbon, nitrogen, and phosphorus cycling and the effects of human activities and climate change to simulate DOC flux transport in eastern North American rivers. To better quantify riverine carbon transport processes at the watershed scale, Yao et al. (2021) coupled the scale-adaptive water transport model (Li et al., 2013) to the DLEM and applied the result to two mid-Atlantic watersheds in the United States. Nevertheless, these models failed to consider the effects of anthropogenic water regulation activities. Furthermore, constructing numerical simulation models is a future development direction of riverine carbon flux estimation; at present, models are still not widely used to simulate riverine carbon transport (Camino-Serrano et al., 2018).
In this study, we incorporated global soil and riverine DOC transport schemes considering anthropogenic water regulation activities into the Community Land Model 5.0 (CLM5.0) and conducted numerical simulations at the global scale (spatial resolution of about 1∘ for the land processes and 0.5∘ for the river systems) during 1981–2013 to explore the impact of anthropogenic water regulation activities on land-to-ocean riverine DOC transport.
2.1 Model overview
The model was developed based on CLM5.0, which is the land component of the CESM (Community Earth System Model). The CLM is widely used to simulate and study land surface ecohydrological processes, surface energy exchange processes, and other biogeochemical processes. The latest version of the CLM updates most components of previous versions; explicitly represents land-use and land-cover change; and introduces a revised canopy interception parameterization and significant improvements in soil layer resolution, nitrogen cycle, and the snow model. Moreover, CLM5.0 includes two river-routing methods: the Model for Scale Adaptive River Transport (MOSART; Li et al., 2013) and the River Transport Model (RTM). Because the scale of this study was global, the routing method still uses the linear-scheme RTM.
However, CLM5.0 lacks an expression of the soil DOC leaching process and the DOC transport and transformation process in rivers. Therefore, in this paper, schemes for DOC leaching in soils and DOC transport in rivers are proposed and incorporated into CLM5.0 to simulate riverine carbon transport. To investigate the effect of anthropogenic water regulation activities on global riverine DOC transport, this study used the scheme proposed by Zeng et al. (2016) and coupled it with DOC transport processes. The model framework is shown in Fig. 1.
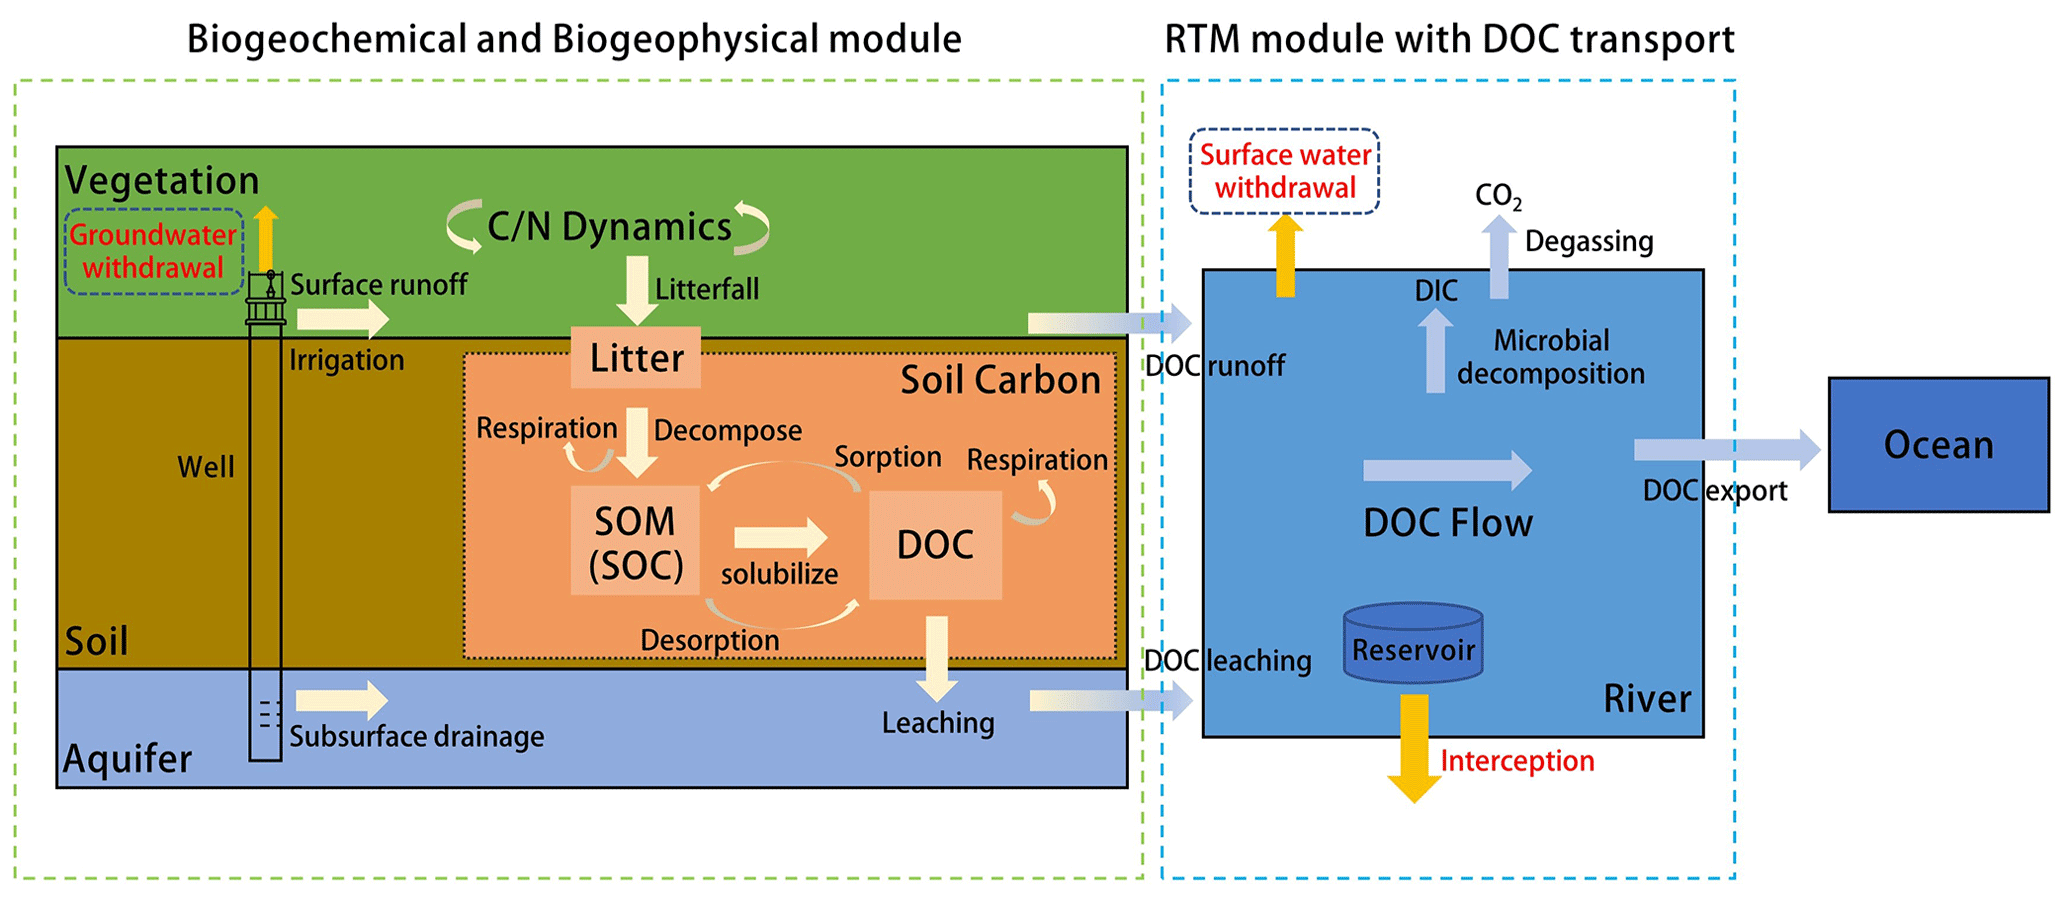
Figure 1Schematic diagram of the land surface model with riverine dissolved organic carbon (DOC) transport and anthropogenic water regulation (C: carbon; N: nitrogen; SOM: soil organic matter; SOC: soil organic carbon; DIC: dissolved inorganic carbon).
2.2 Soil DOC loss to the river
Riverine DOC is mainly derived from organic carbon leaching processes in soil ecosystems in the watershed (Gommet et al., 2022; Li et al., 2019). In CLM5.0, only the leaching process of soil mineral nitrogen is included, and therefore a DOC production and loss process was introduced in this study. The soil biochemistry module in CLM5.0 was constructed based on the CENTURY model (Parton et al., 1988), in which the decomposition of fresh litter into soil organic matter is defined as a transformation cascade between the coarse woody debris (CWD) pool, the litter pool, and the soil organic matter (SOM) pool. The NPP produced by plants eventually enters the soil in the form of litter to constitute the soil carbon pool, accompanied by an intervening loss through microbial heterotrophic respiration. Assuming that dissolved organic matter (DOM) production is part of the turnover of litter pools and soil organic matter pools and is proportional to soil water content, DOC production can be expressed as (Gerber et al., 2010)
where (g C m−2 s−1) is the DOC flux from the decomposition process, fDOM is the fraction that enters the soil DOM pool, θ (m3 m−3) is the soil water content, and CFu→d (g C m−2 s−1) is the carbon flux from upstream to downstream carbon pools in the decomposition cascade.
Soil organic carbon remaining after plant growth and soil respiration is subject to loss as a dissolved component leaching from the soil column. In this study, the DOC runoff is defined as the soil DOC in surface runoff, and the DOC leaching is defined as the subsurface losses of DOC in soil water. The fluxes are described as follows:
where DOCrunoff (g C m−2 s−1) denotes the soil DOC runoff, DOCleaching (g C m−2 s−1) denotes the soil DOC leaching, Qsurf (kg H2O m−2 s−1) denotes the surface runoff, Qdis (kg H2O m−2 s−1) denotes the subsurface discharge, and [DOC] (g C kg H2O−1) is the DOC concentration in the soil water solution.
where WStot_soil (kg H2O m−2) is the total mass of soil water content integrated over the soil column, and NSDOC (g C m−2) is the DOC in the soil pool.
Soil DOC readily complexes with metal ions in the soil and forms soil agglomerates, which enable soil DOC to be adsorbed onto soil particles. The DOC adsorption coefficients can be estimated as (Li et al., 2019; Neff and Asner, 2001)
where Xi (mg per g soil) represents the initial DOC concentration; RE (mg per g soil) is the amount of DOC desorbed (negative value) or adsorbed (positive value), calculated by the simple initial mass (IM) linear isotherm; and m (dimensionless coefficient) and b (mg per g soil) can be considered to be measures of potential DOC sorption and desorption by soil.
The soil heterotrophic respiration flux of DOC, SR (g C m−2 s−1), is estimated by an empirical function (Janssens and Pilegaard, 2003):
where T (∘C) is the soil temperature, R10 is the soil heterotrophic respiration flux at a soil temperature of 10 ∘C, and Qs10 is the soil respiration temperature sensitivity.
It is necessary to limit the total DOC runoff/leaching flux at each time step so that it does not exceed the total amount of DOC:
where DOCloss (g C m−2 s−1) denotes the soil DOC runoff or leaching.
2.3 Riverine DOC transport
Soil DOC enters the river network system along with surface and subsurface runoff, where it is lost due to processes such as microbial degradation. Therefore, based on the water transport framework, the large-scale riverine DOC transport equation can be defined as
where SDOC (kg C) is DOC storage within the current grid cell; RDOC (kg C s−1) and LDOC (kg C s−1) represent soil DOC runoff and leaching; kdoc (s−1) is the DOC decomposition rate in the river; Q10 (= 2.0) denotes the temperature coefficient; rt (∘) represents the river water temperature, which is calculated by a large-scale river water temperature model (Liu et al., 2020; van Vliet et al., 2012; Yearsley, 2009); (kg C s−1) is the sum of inflows of riverine DOC from neighboring upstream grid cells; and (kg C s−1) is the riverine DOC flux leaving the current grid cell. is calculated as follows:
where v (m s−1) is the effective riverine flow velocity, which is estimated by grid cell mean topographic slope β (Oleson et al., 2013), and d is the Euclidean distance between two adjacent grid cell centers.
2.4 Anthropogenic water regulation
Anthropogenic water regulation includes reservoir interception, surface water withdrawal, and groundwater extraction and use. Because reservoir interception and surface water withdrawal are closely related, they are together called surface water regulation. This study coupled the global reservoir operation scheme (Hanasaki et al., 2006) with the RTM using the method of Liu et al. (2019) to represent the interception effect of reservoirs on runoff and solutes. The method assumed that the inflow from the reservoir was the outflow from the current grid cell. Released flow from the reservoir was adjusted for specific uses (flood control, irrigation, etc.), and surface withdrawals were deducted from the released water (see Sect. S1 in the Supplement).
Surface water is extracted directly from natural rivers and reservoirs to meet human water demands (Wang et al., 2020; Xie et al., 2020; Liu et al., 2019):
where Ssw′ (mm) is the surface water storage after extraction, Ssw (mm) is the original surface water storage, qsw (mm s−1) is the rate of surface water intake, and Δt denotes the model time step.
The groundwater extraction process can be expressed as (Zeng et al., 2016)
where Sgw (mm) is the original unconfined aquifer water storage, qgw (mm s−1) is the rate of groundwater pumping, h (mm) represents the original groundwater table depth, s is the aquifer-specific yield, and Sgw′ (mm) and h′ (mm) denote the aquifer water storage and the groundwater table depth after pumping.
Human water use can be divided into agricultural irrigation water and other industrial and domestic water, where irrigation water is considered to be effective precipitation directly back to the soil surface, and other water is directly added to the model surface runoff and evapotranspiration fluxes in a certain proportion (Zou et al., 2015). This process can be estimated by the following equations:
where qtop (mm s−1) is the rate of net water flow entering the soil surface; qsurf and qevap (mm s−1) are surface runoff and evaporation; and qirrig, qind, and qdom (mm s−1) denote irrigation, industrial, and domestic water, respectively. The coefficients were set to 0.3 and 0.7 due to the limitation of data (Liu et al., 2019; Zou et al., 2014).
2.5 DOC transfer induced by water withdrawal and use
Anthropogenic water regulation activities also affect DOC transport processes between land and rivers. It was assumed here that (1) only the interception effect of reservoirs would be considered, ignoring the migration transformation process in reservoirs, and the loss rate in reservoirs would be equal to that in rivers; (2) because groundwater extraction usually occurs in situ and will pass through the filtering effect of the soil layer, the part of DOC that returned to soil with groundwater extraction was ignored; and (3) the loss rate in the process of DOC returning to soil was equal to that in rivers.
The process of reservoir interception leading to retention of carbon in rivers can be expressed as
where FDOC,r (kg C s−1) denotes the DOC flux retained by the reservoir, conr (kg C m−3) is the DOC concentration in the reservoir, and ΔQr (m3) is the water volume change in the reservoir. Therefore, the riverine DOC flux leaving the current grid cell is updated to
The DOC flux extracted from surface water is calculated based on the intake rate and the solute concentration conDOC (kg C m−3) in the current grid cell and return to the soil DOC pool after irrigation:
The reduction in soil DOC leaching due to groundwater extraction is then calculated based on soil DOC concentration and groundwater pumping rate:
3.1 Data sources
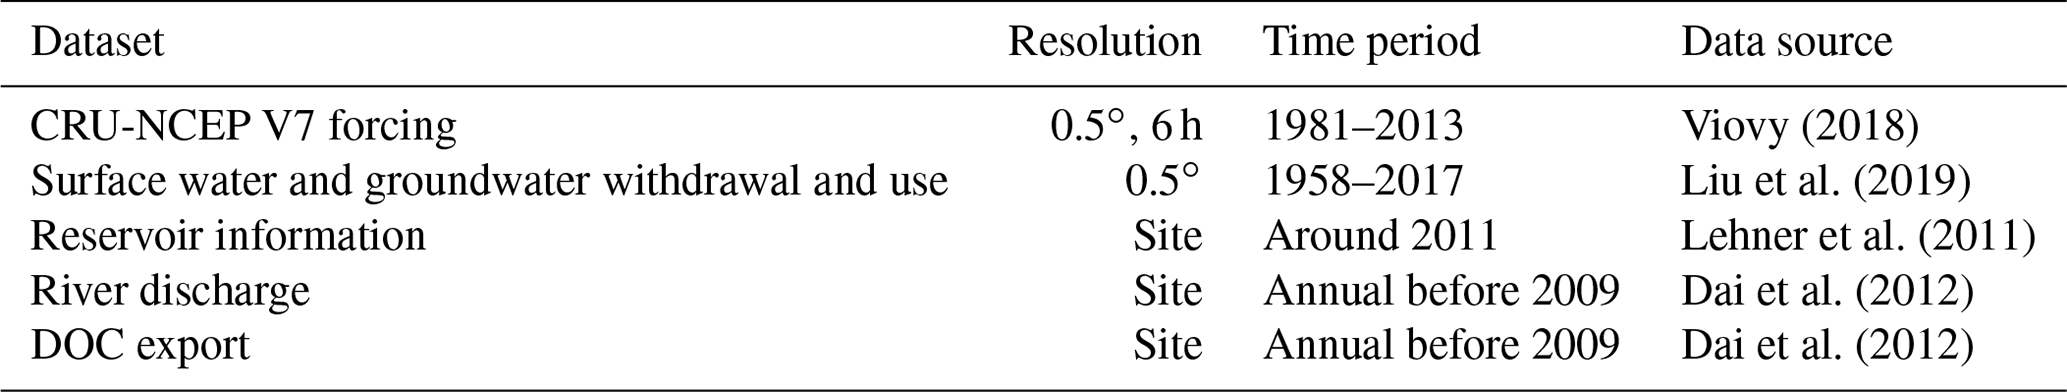
The climate input forcing dataset () used for the model proposed in this study was obtained from CRU-NCEP Version 7 (Viovy, 2018), including air temperature, humidity, incoming solar radiation, precipitation, surface pressures, and surface winds. The basic land surface datasets required to drive the model were set up using the default CLM5.0 settings with a spatial resolution of ; more details are available in the technical notes (Lawrence et al., 2018). The global monthly mean atmospheric CO2 concentration dataset came from the NOAA Earth System Research Laboratories (https://www.esrl.noaa.gov/gmd/ccgg/trends/global.html, last access: 1 June 2021).
Reservoir information was obtained from the Global Reservoir and Dam Database (GRanD; Lehner et al., 2011), containing information on 6862 dams and their associated reservoirs worldwide, and interpolated to a spatial resolution of (Fig. S2).
The human water use activity dataset was derived from the global long-term surface and groundwater withdrawal dataset estimated by Liu et al. (2019). The dataset has a spatial resolution of and contains agricultural, industrial, and domestic water demands from 1958 to 2017. It was derived based on five datasets: the water use dataset from the Food and Agricultural Organization (FAO); a shapefile dataset of national boundaries; the Global Map of Irrigation Areas, version 5 (GAMIP5; Siebert et al., 2013); the historical monthly soil moisture levels and saturated soil moisture levels (Zeng et al., 2017); and the FAO water information system for 2010, which contained the agricultural, industrial, and municipal water withdrawals.
3.2 Observation data
Because there are few datasets of long-time-series observations of DOC fluxes for large global rivers, annual averages were used to validate the model simulations. The dataset was derived from the database developed by Dai et al. (2012), which provides discharge and DOC flux observations for sites on the world's major large rivers. These sites were globally distributed and were influenced by various climatic and human activities.
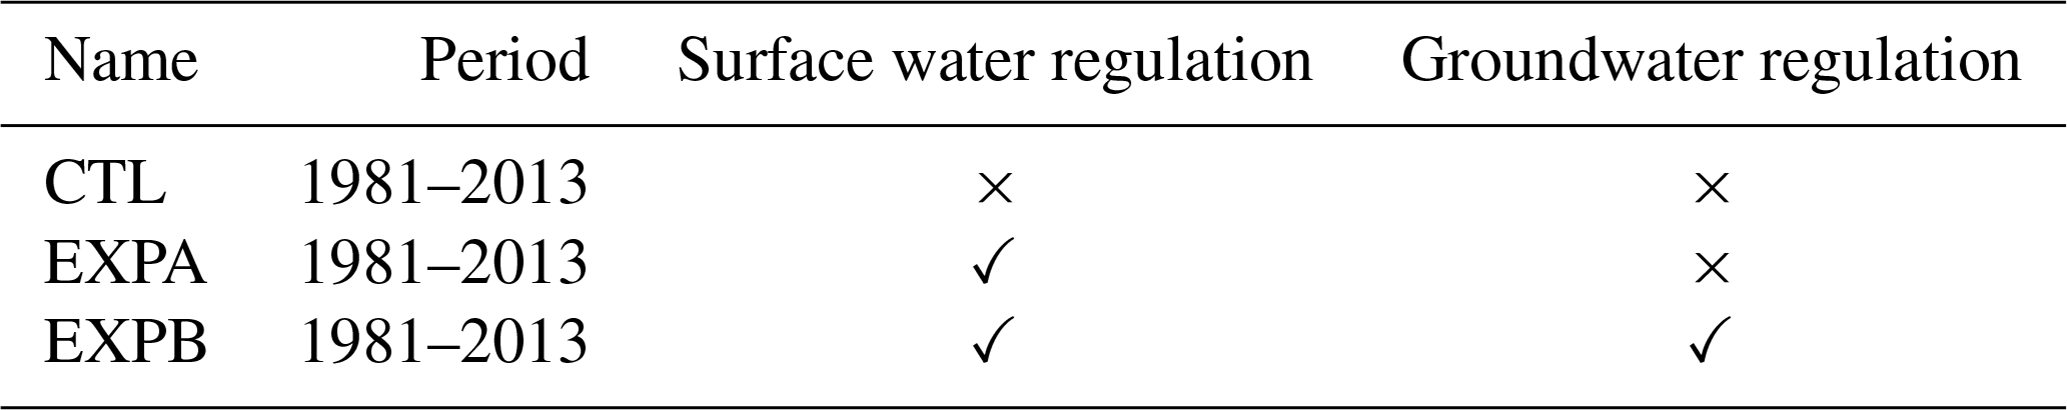
3.3 Experimental design
To investigate the effect of anthropogenic water regulation on DOC transport in rivers, three sets of simulations were designed using the developed model (Table 2). The first simulation (CTL) was a control experiment without considering any anthropogenic water regulation activities. The second simulation (EXPA) only considered surface water regulation, and the last simulation (EXPB) considered all anthropogenic water regulation. All simulations were run from 1981–2013 with a spatial resolution of for the land surface module and for the RTM. The results were output on a monthly scale. Before the formal numerical simulations, the 1901–1920 atmospheric-forcing data cycle was used to drive the model without any anthropogenic water regulation as the spin-up run to reach an equilibrium state.
4.1 Model evaluation
Figure 2 shows the spatial distribution of multi-year-average soil DOC losses, which are the sum of DOC surface runoff and subsurface leaching. The results show that the global distribution of soil DOC losses varied widely, especially in Russia and Southeast Asia, western Africa, and tropical South America, where the losses exceeded 1.8×10⁴ kg C km−2 yr−1, whereas low-runoff arid regions such as northwestern China, India, and North Africa had the smallest soil DOC losses. The tropics and the temperate regions of the Northern Hemisphere were the regions with the highest soil DOC losses, which is generally consistent with previous studies (Harrison et al., 2005).
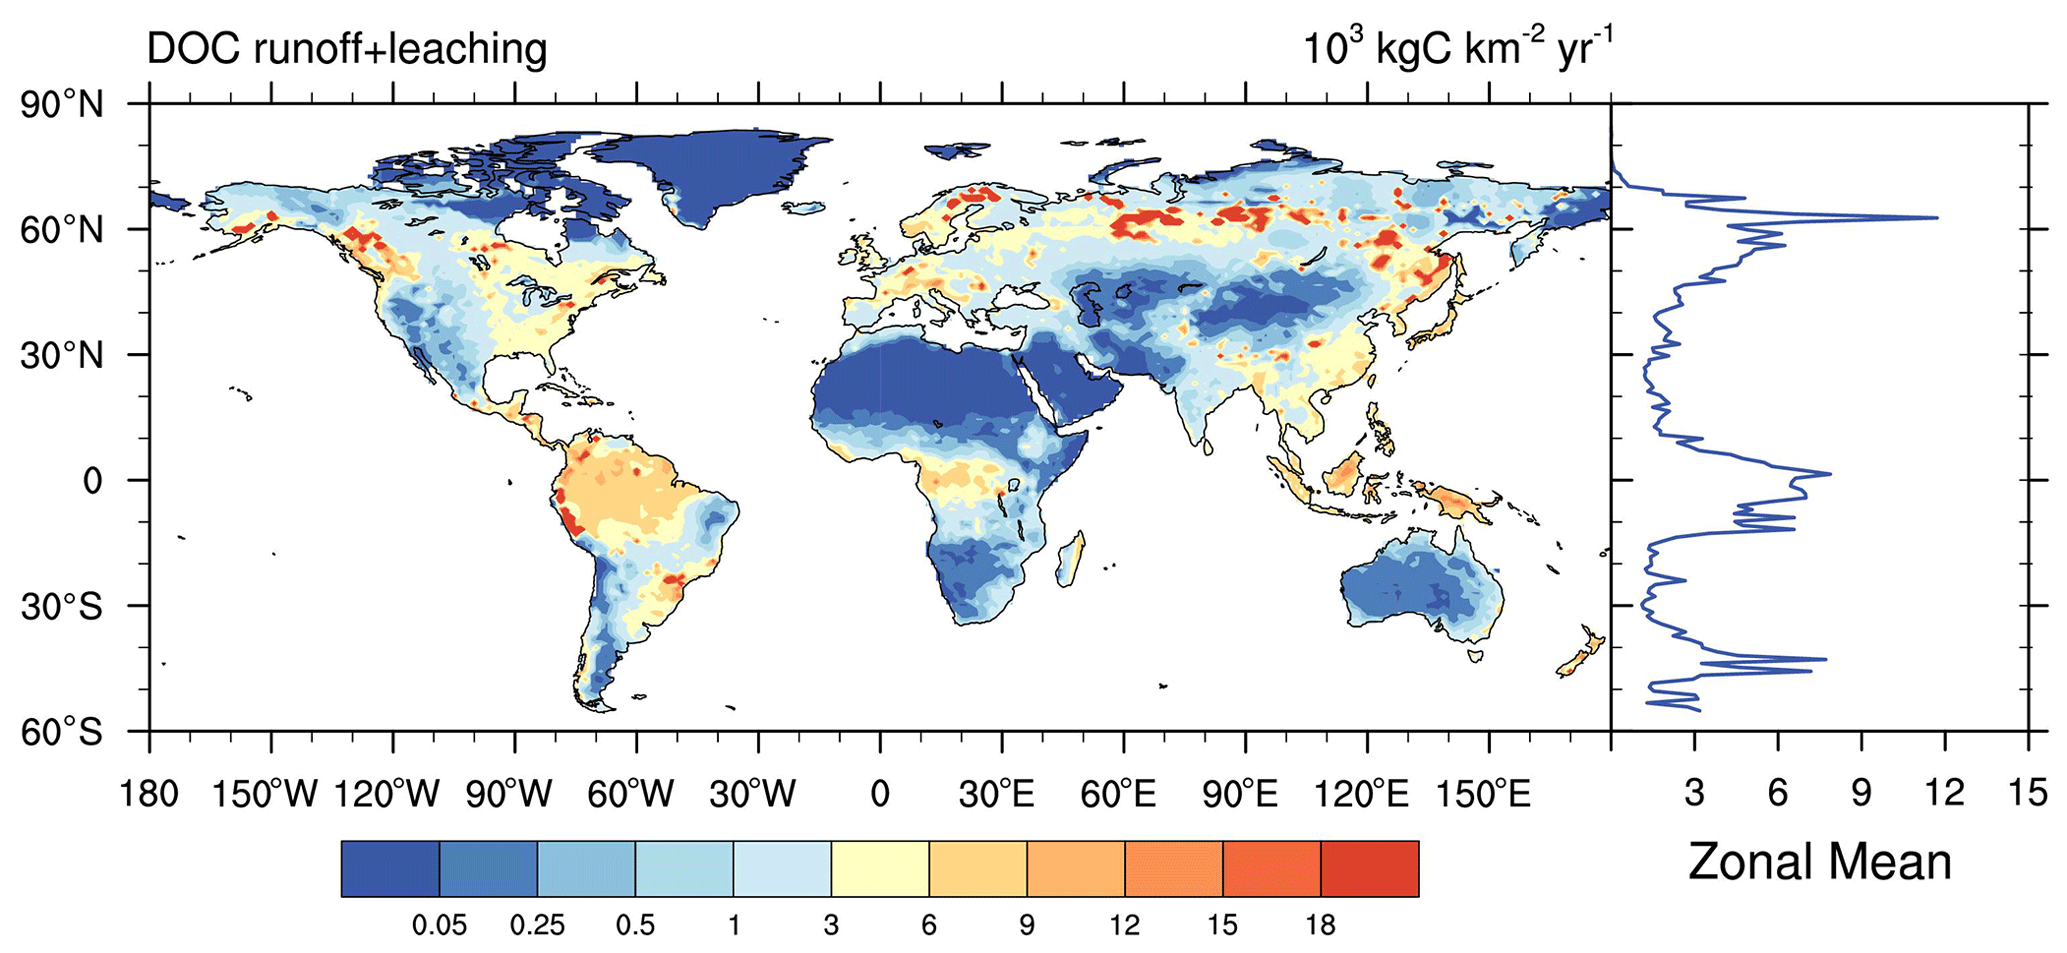
Figure 2Spatial distribution and zonal mean of multi-year-average soil DOC losses from 1981–2013.
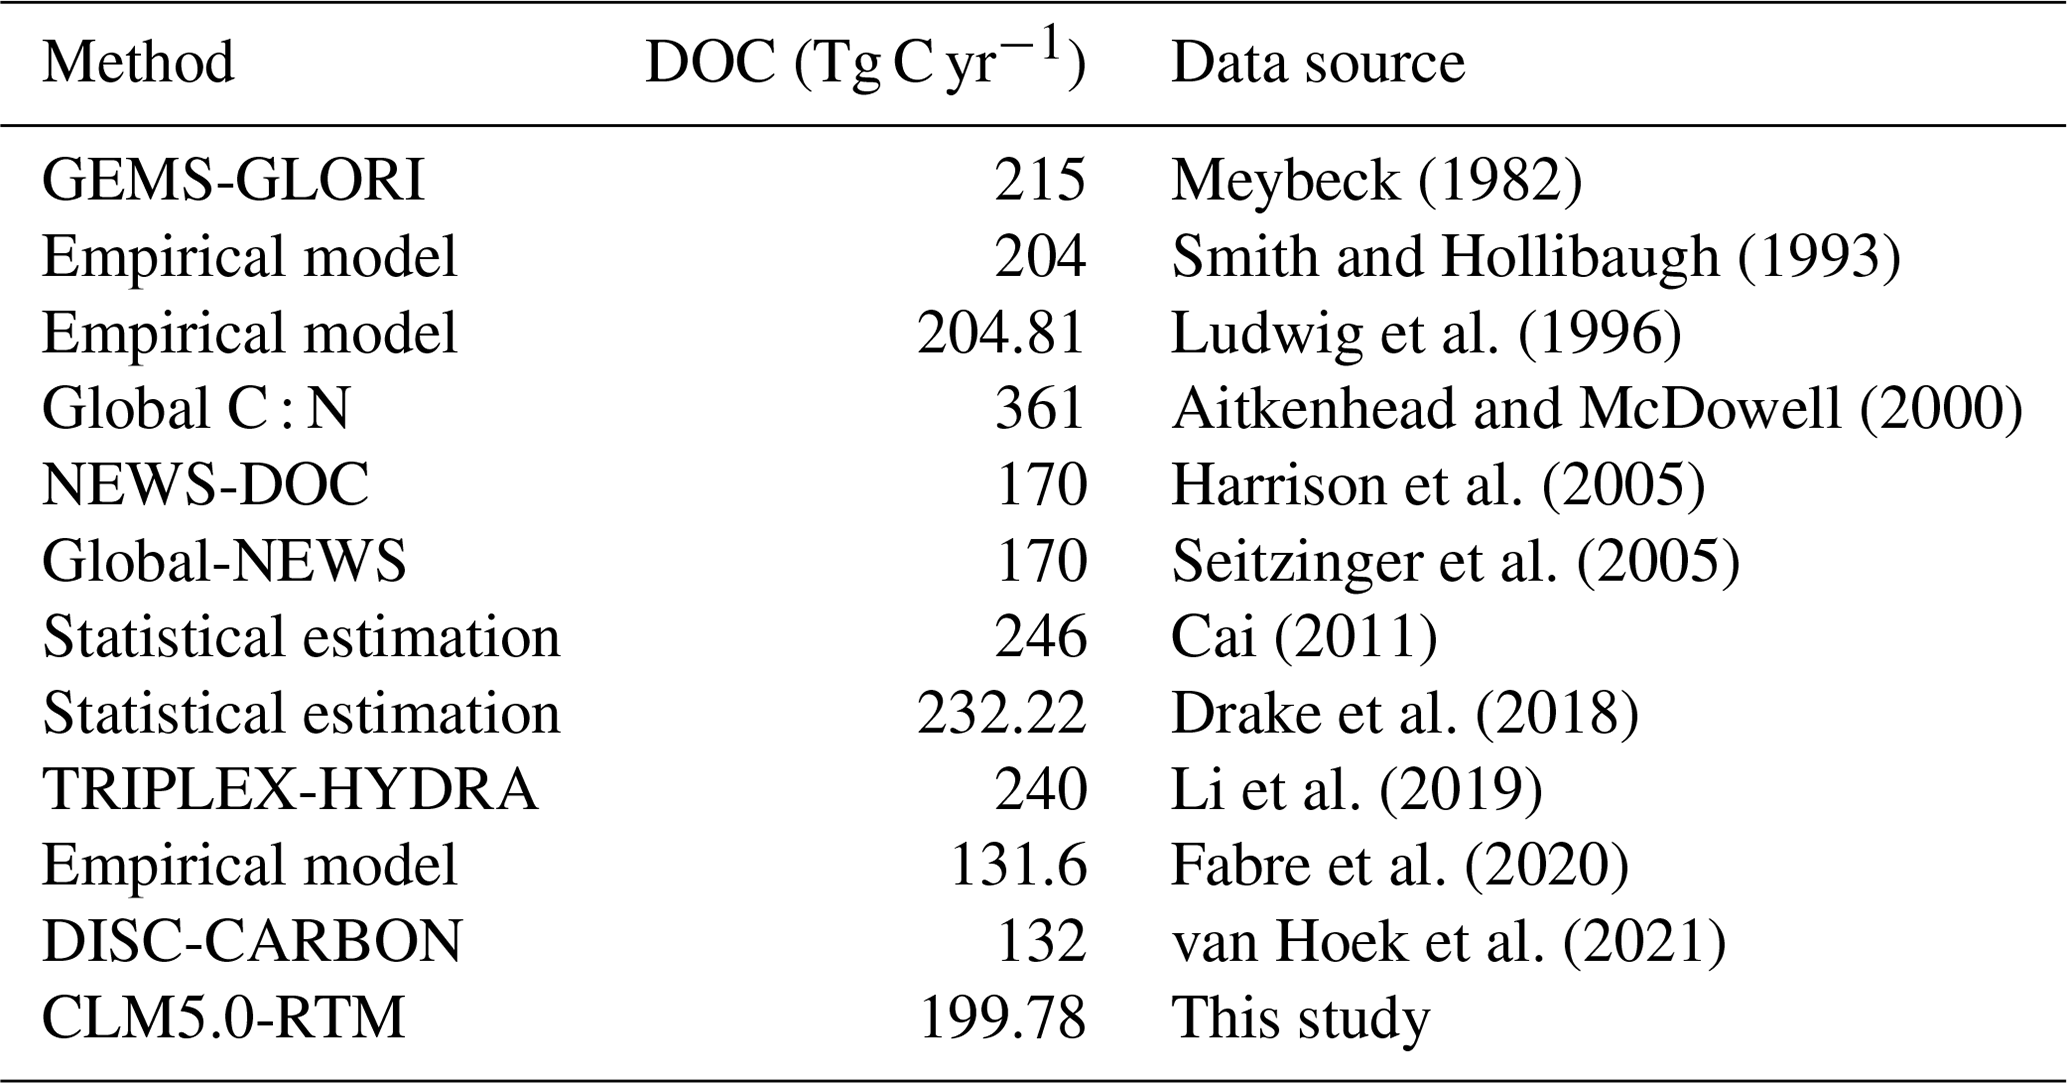
The multi-year-average river discharges and DOC export fluxes simulated by the developed model were then compared with observed data. Because the model resolution was , only 106 rivers with watershed areas larger than 2500 km2 were selected. The simulated river discharges were slightly underestimated (Fig. 3c) but fit well with observations (Fig. 3a) and provided a solid basis for subsequent simulation of river carbon exports. In addition, the simulated riverine DOC export fluxes tended to be overestimated in temperate regions and underestimated in the tropics (Fig. 3d) but were close to the 1:1 line compared to the observed DOC fluxes, with R2 reaching 0.61 and significantly correlated (Fig. 3b). Moreover, the total global river DOC export fluxes simulated by the proposed model were compared with the results of previous studies. We estimated that the global terrestrial ecosystem delivers about 199.78 ± 36.63 Tg (± 1 standard deviation) of DOC per year to the ocean via rivers, which was in the middle of the values derived from previous studies (Table 3). Therefore, it could be believed that the model has reasonable accuracy and can be applied to global-scale riverine DOC export simulation studies.
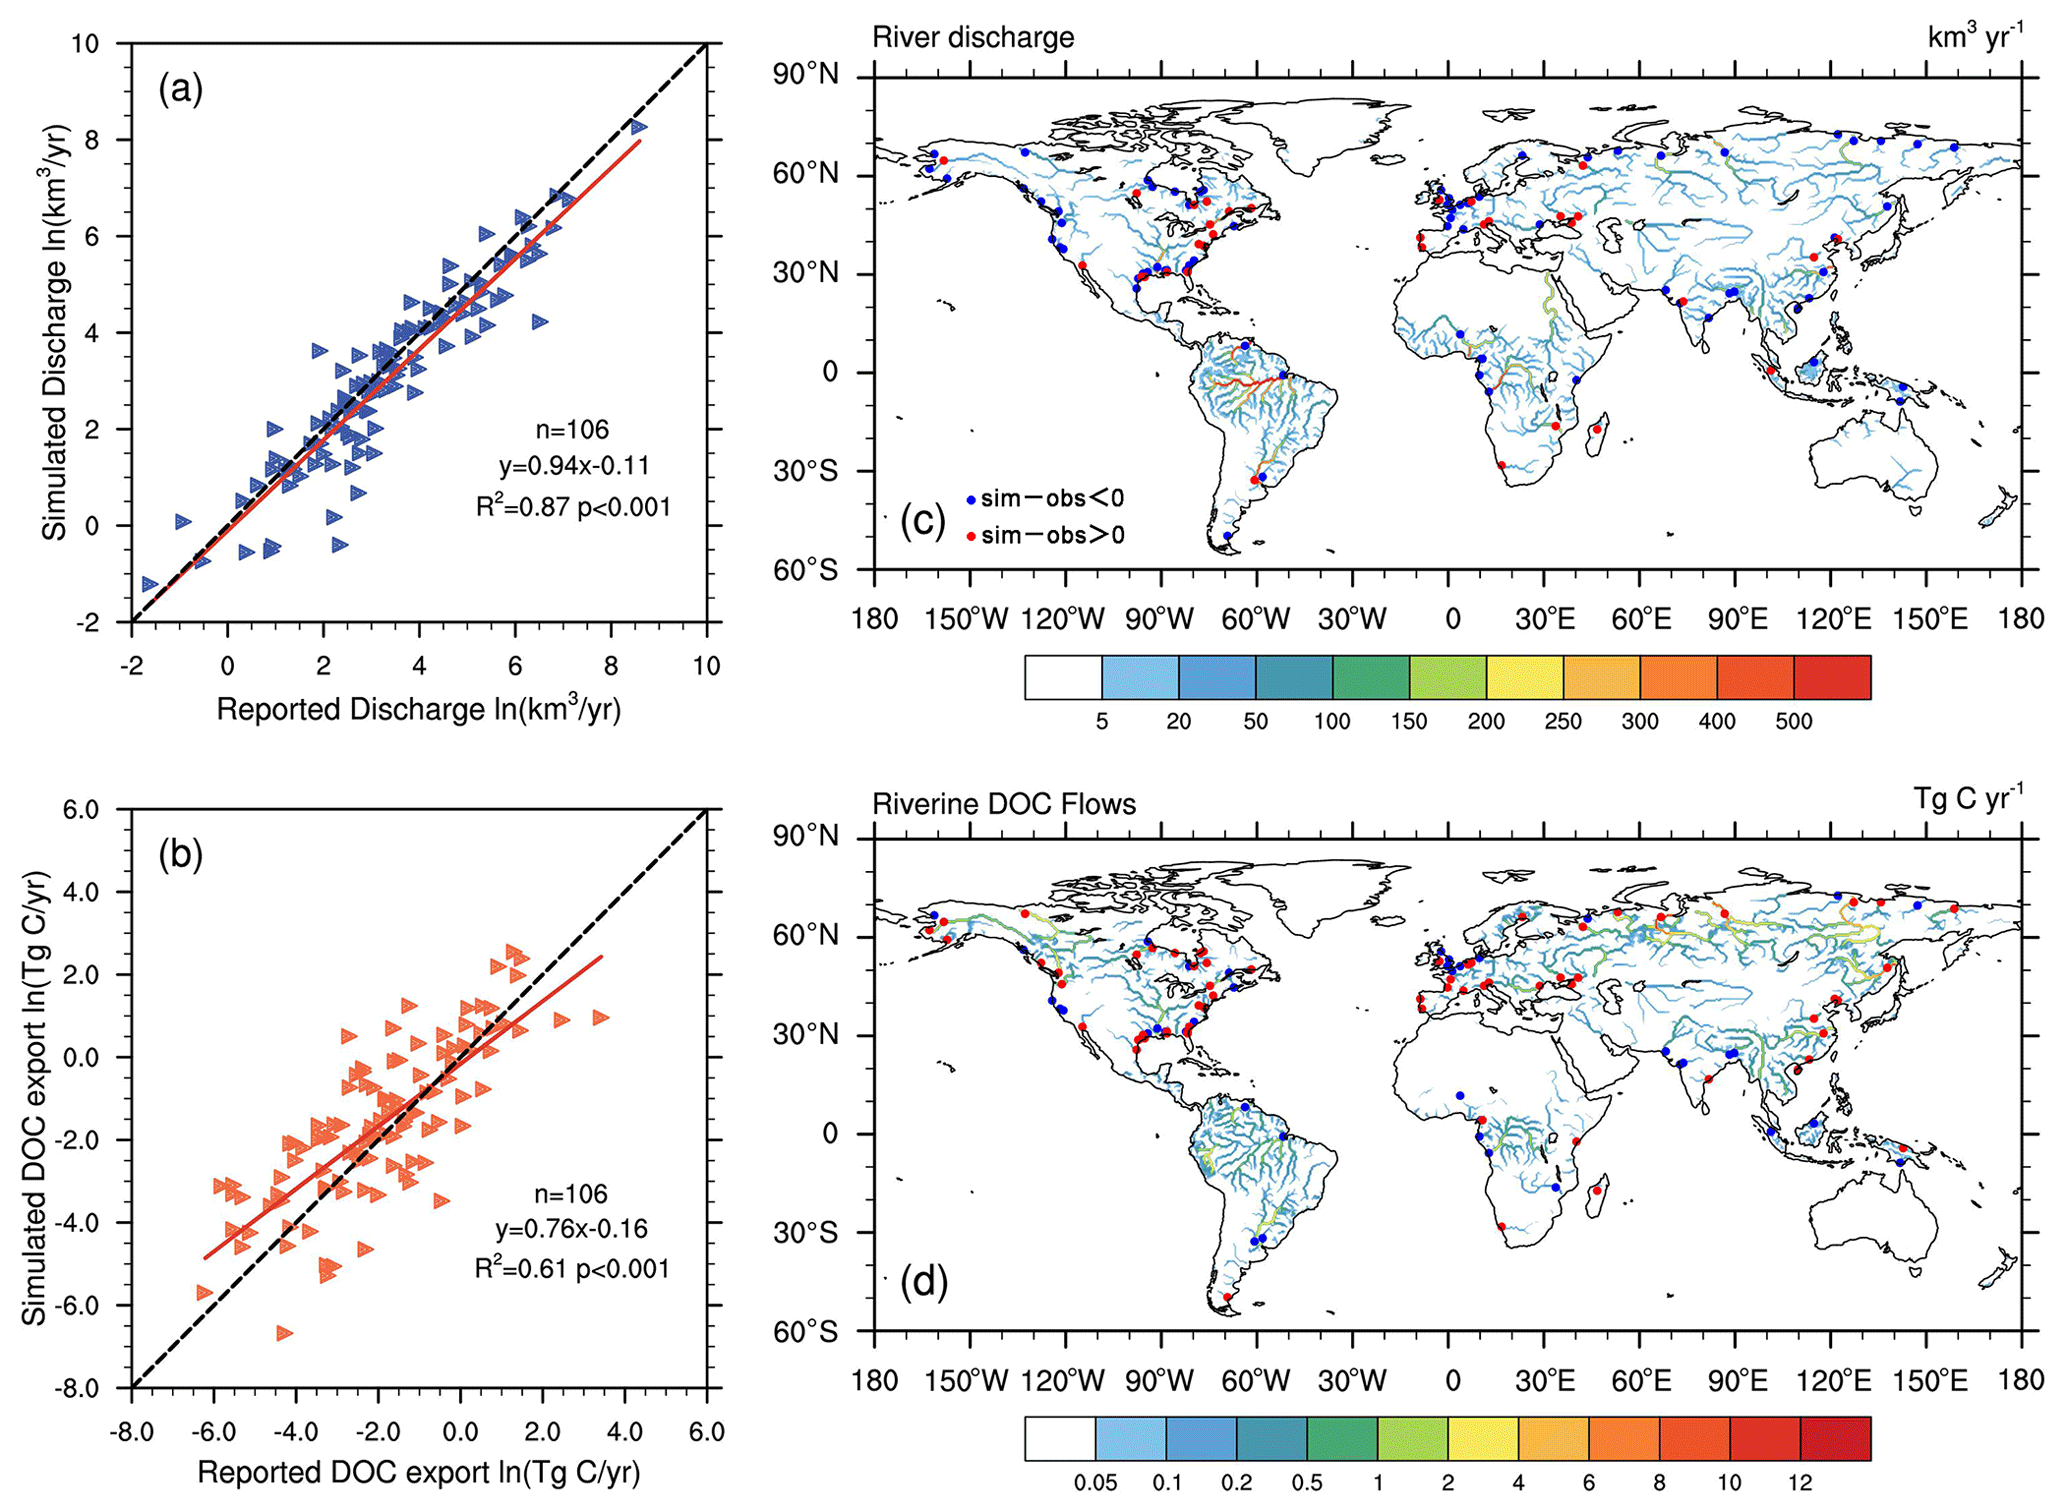
Figure 3Simulated and reported annual (a) river discharge and (b) riverine DOC export flux for 106 global rivers. Spatial distributions of (c) annual discharge and (d) annual riverine DOC exports during 1981–2013. The dots in the map correspond to the locations of the 106 river sites, where blue dots indicate sites that are simulated underestimates, and red dots indicate sites that are simulated overestimates.
Table 3Comparison of simulated global total riverine DOC export fluxes with previous studies.
4.2 Effects of surface water regulation on riverine DOC transport
The difference between EXPA and CTL was used to obtain the effect of surface water regulation on land surface hydrological variables. Surface water use has resulted in changes in latent and sensible heat fluxes in most global irrigation-water-using regions (Fig. 4a, b), especially in arid or semi-arid regions such as northern China, India, and the central United States, where latent heat fluxes have increased, and sensible heat fluxes have decreased. Soil and surface temperatures in these regions have also decreased due to the cooling effect of irrigation (Fig. 4c, d). Figure 4e shows that irrigation led to an overall increase in soil moisture, especially in northern India, western Europe, and the midwestern United States. In addition, irrigation also led to an increase in total runoff (Fig. 4f).
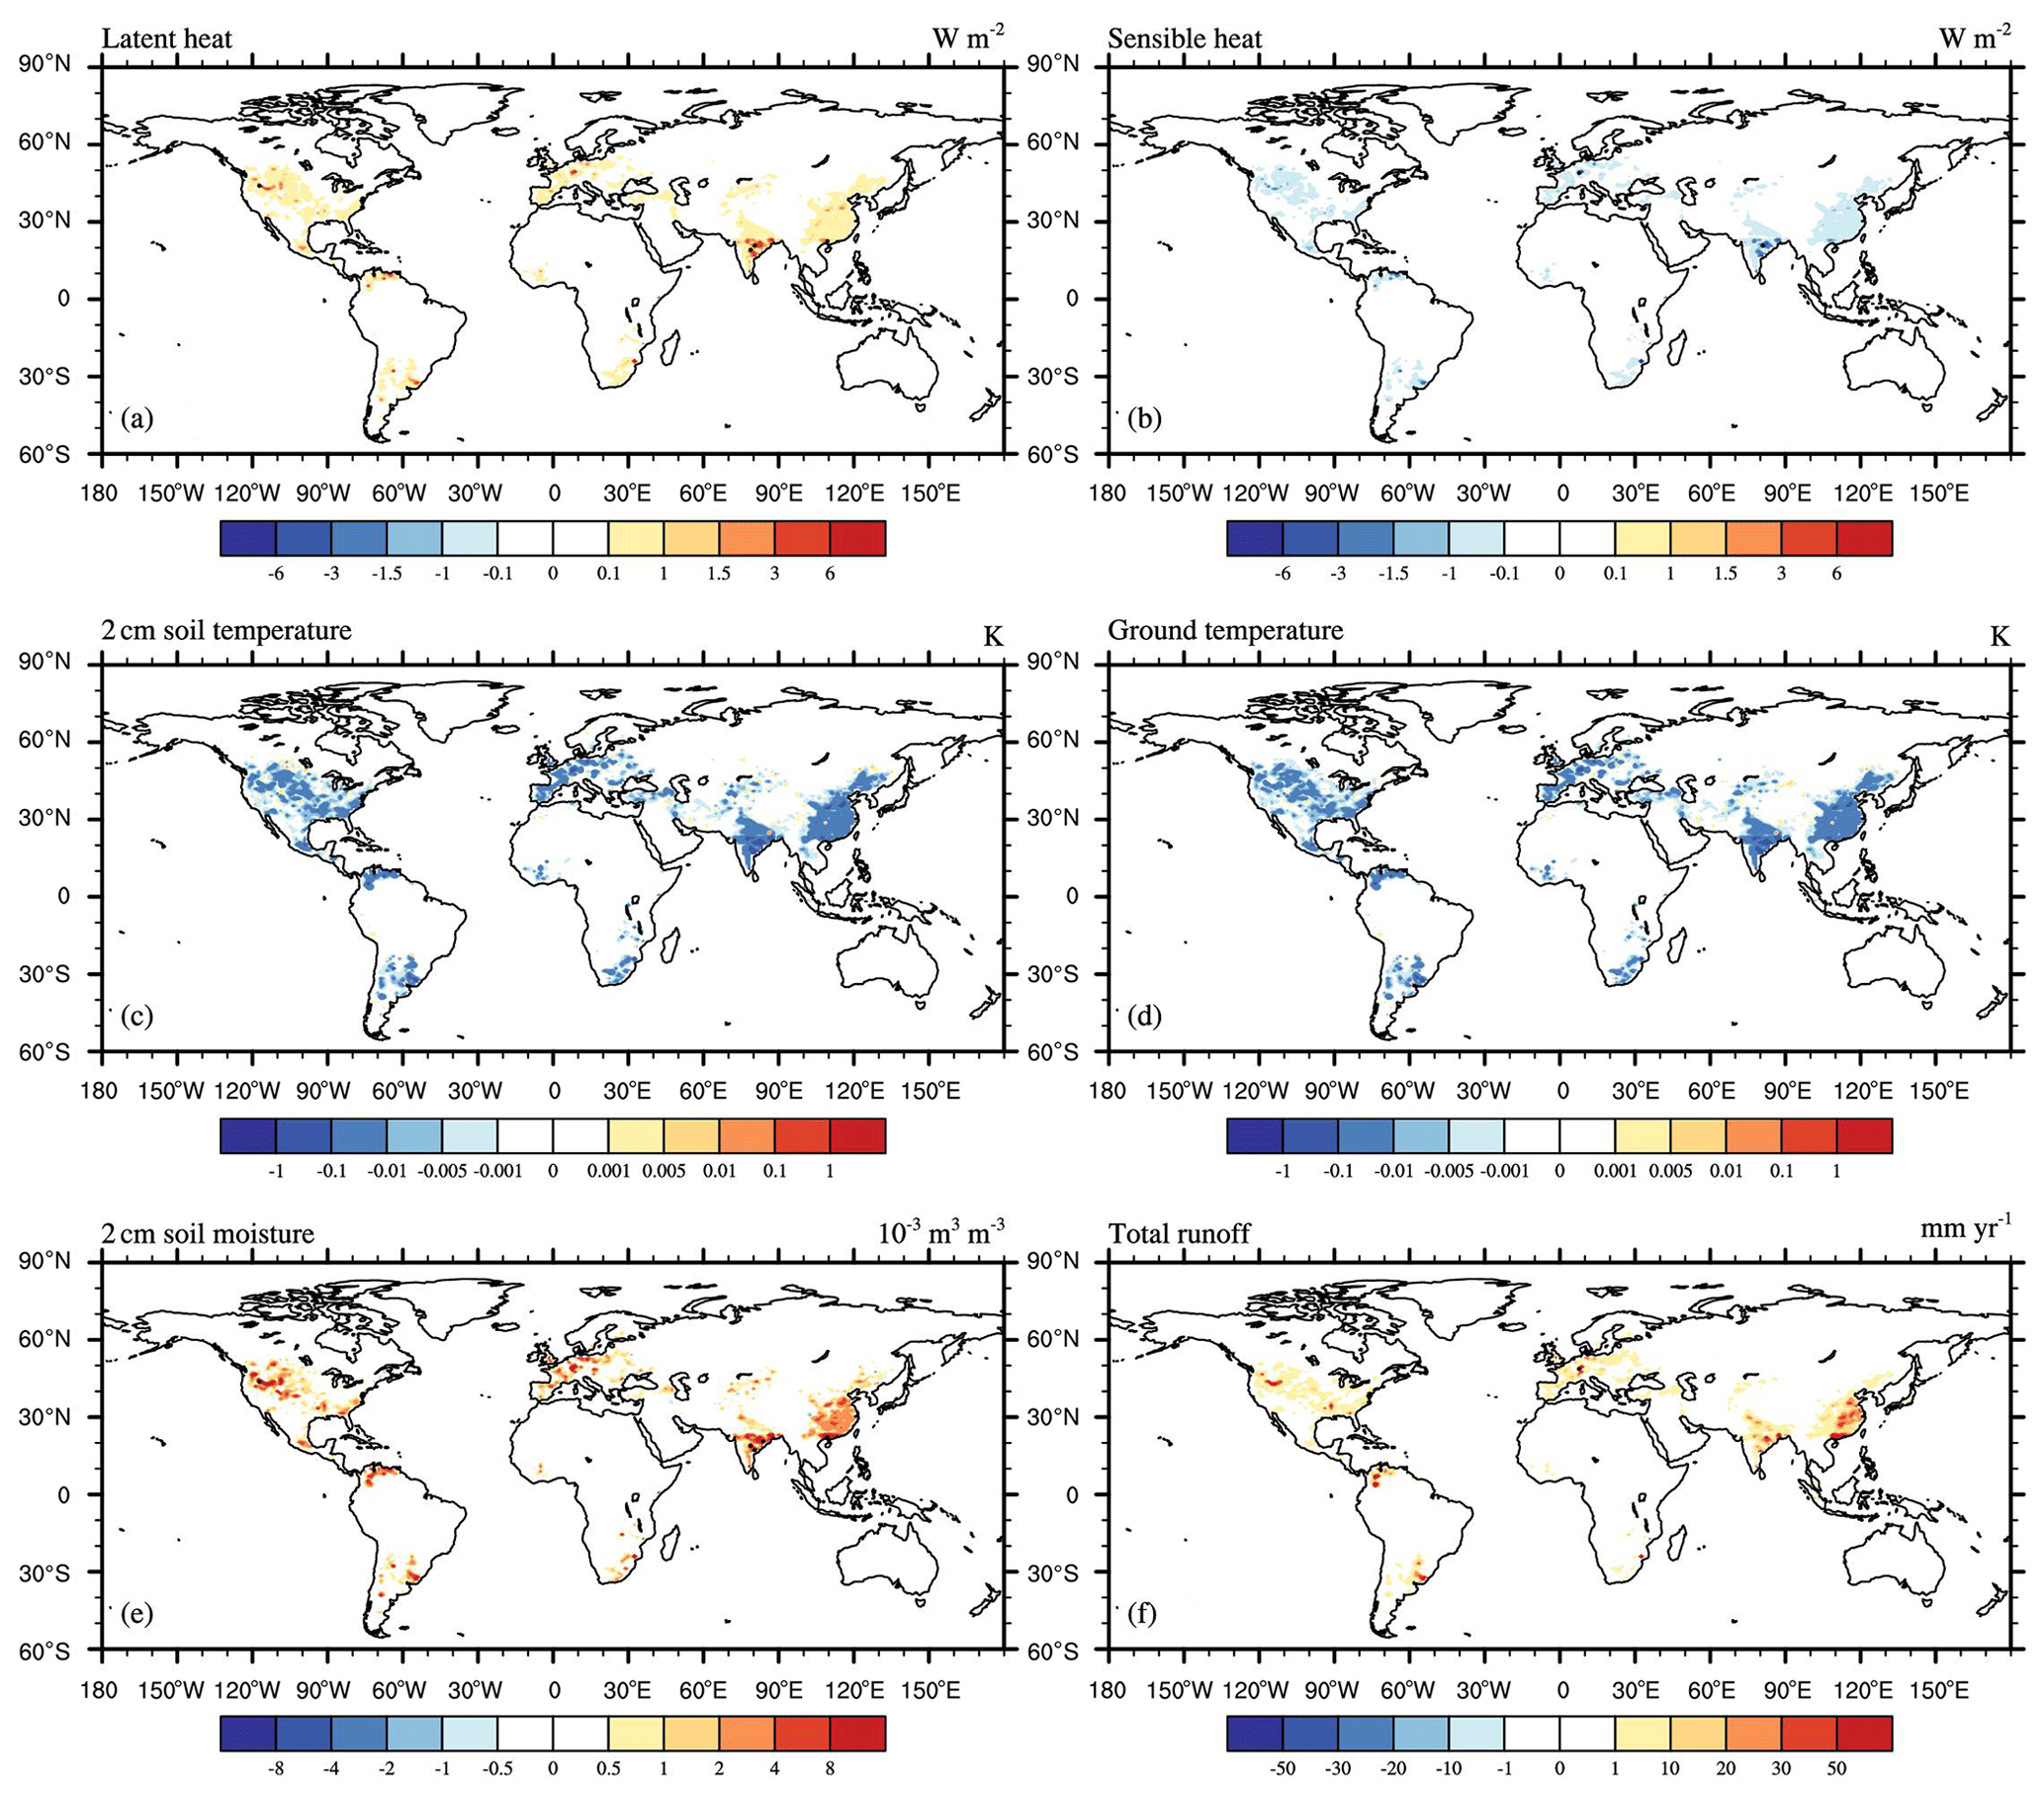
Figure 4Spatial distribution of multi-year-average differences in land surface hydrological variables between EXPA and CTL from 1981–2013: (a) latent heat flux, (b) sensible heat flux, (c) 2 cm soil temperature, (d) surface temperature, (e) 2 cm soil moisture, (f) total runoff. This figure demonstrates the effects of surface water regulation on land surface hydrological variables. The black dots are the regions that pass the significance t test at the 95 % confidence level.
Figure 5a and b display the effects of surface water regulation on soil carbon losses. Specifically, the hotspots of significantly increased surface DOC runoff were in areas of high agricultural influence, such as the central United States, northern India, and northern and eastern China, reaching up to 2000 kg C km−2 yr−1, but the increase in subsurface leaching was relatively small. This may have been the case because surface water withdrawals from rivers and reservoirs were returned to the soil by irrigation, bringing back some DOC, directly increasing surface runoff, and also increasing subsurface runoff and thus increasing soil DOC losses.
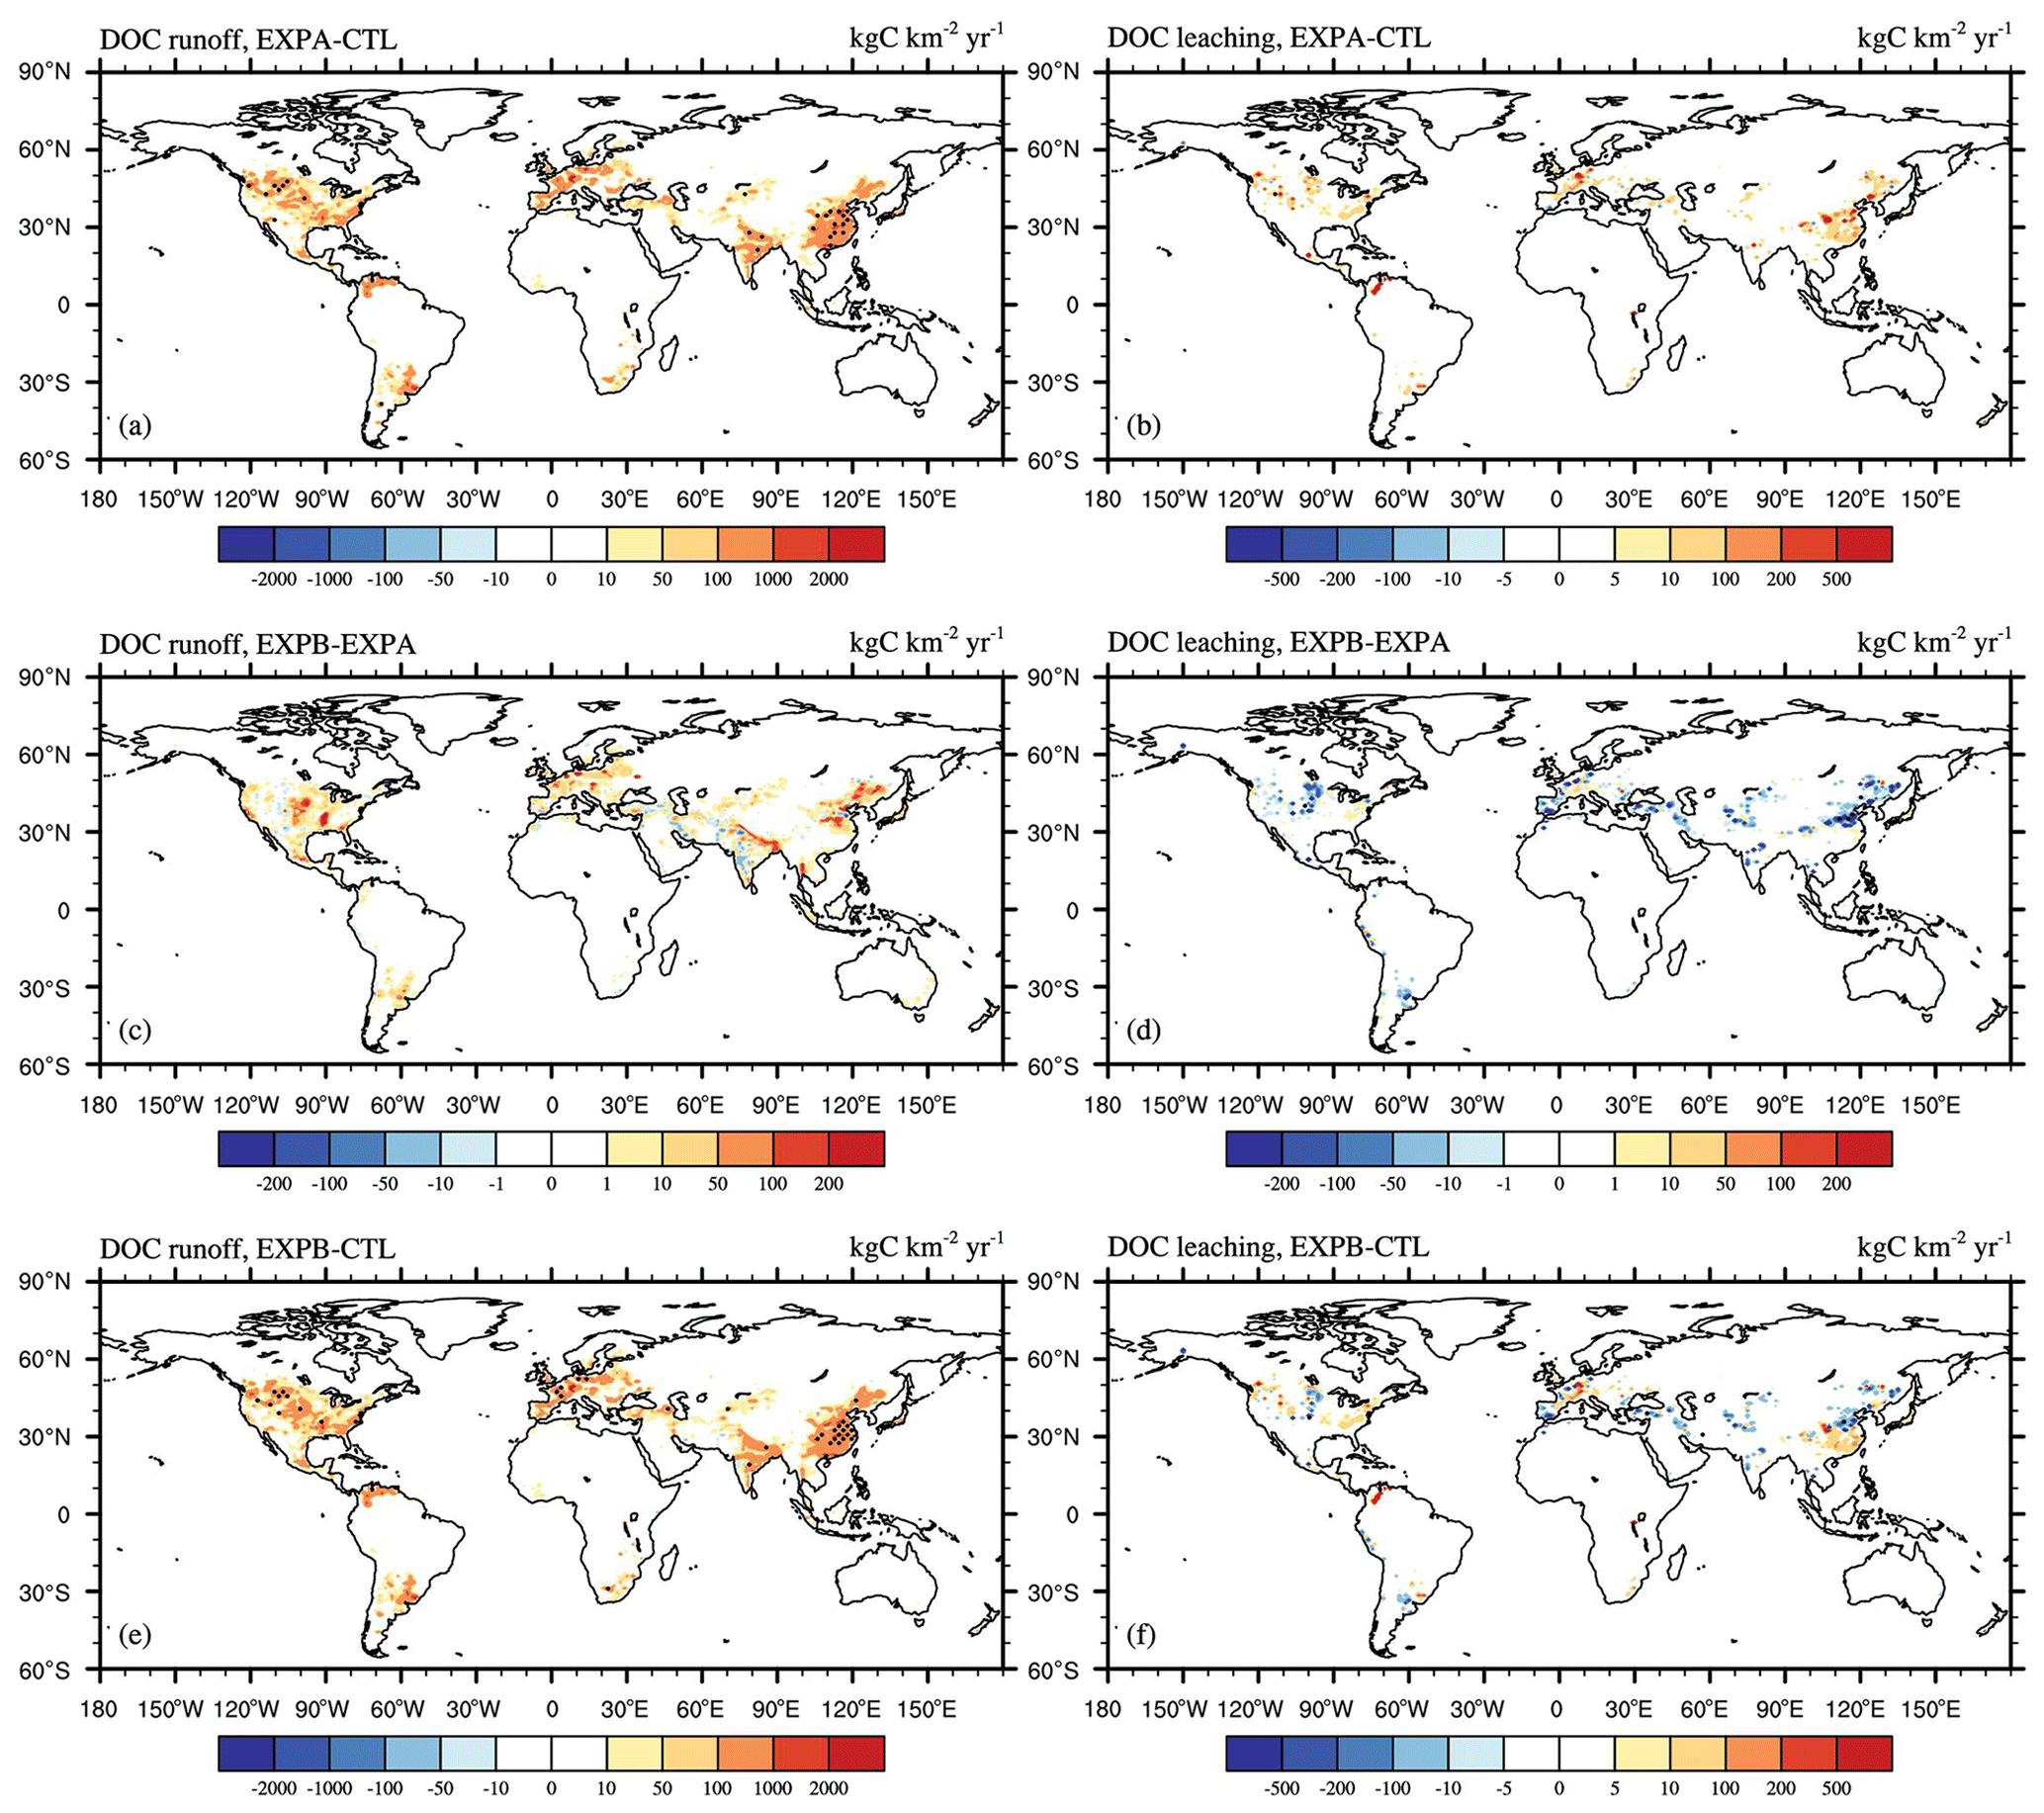
Figure 5Spatial distribution of the multi-year-average differences between different experiments from 1981–2013 in the (a) soil DOC runoff (EXPA–CTL), (b) soil DOC leaching (EXPA–CTL), (c) soil DOC runoff (EXPB–EXPA), (d) soil DOC leaching (EXPB–EXPA), (e) soil DOC runoff (EXPB–CTL), and (f) soil DOC leaching (EXPB–CTL). This figure demonstrates the effects of (a, b) surface water regulation, (c, d) groundwater regulation, and (e, f) anthropogenic water regulation on soil DOC losses. The black dots are the regions that pass the significance t test at the 95 % confidence level.
From Fig. 6a and b, surface water regulation had a significant effect on river discharge and riverine DOC flow. The combined effects of reservoir interception and surface water withdrawal reduced the discharge and DOC export of most rivers globally, with significant reductions of more than 50 Gg C yr−1 in the Yangtze, Yellow, Mississippi, and Ganges rivers and in some basins in western Europe. Some rivers in northern South America experienced increased riverine DOC export, but not significantly, probably because the increase in river flow caused by agricultural irrigation could have been greater than the decrease caused by surface water regulation.
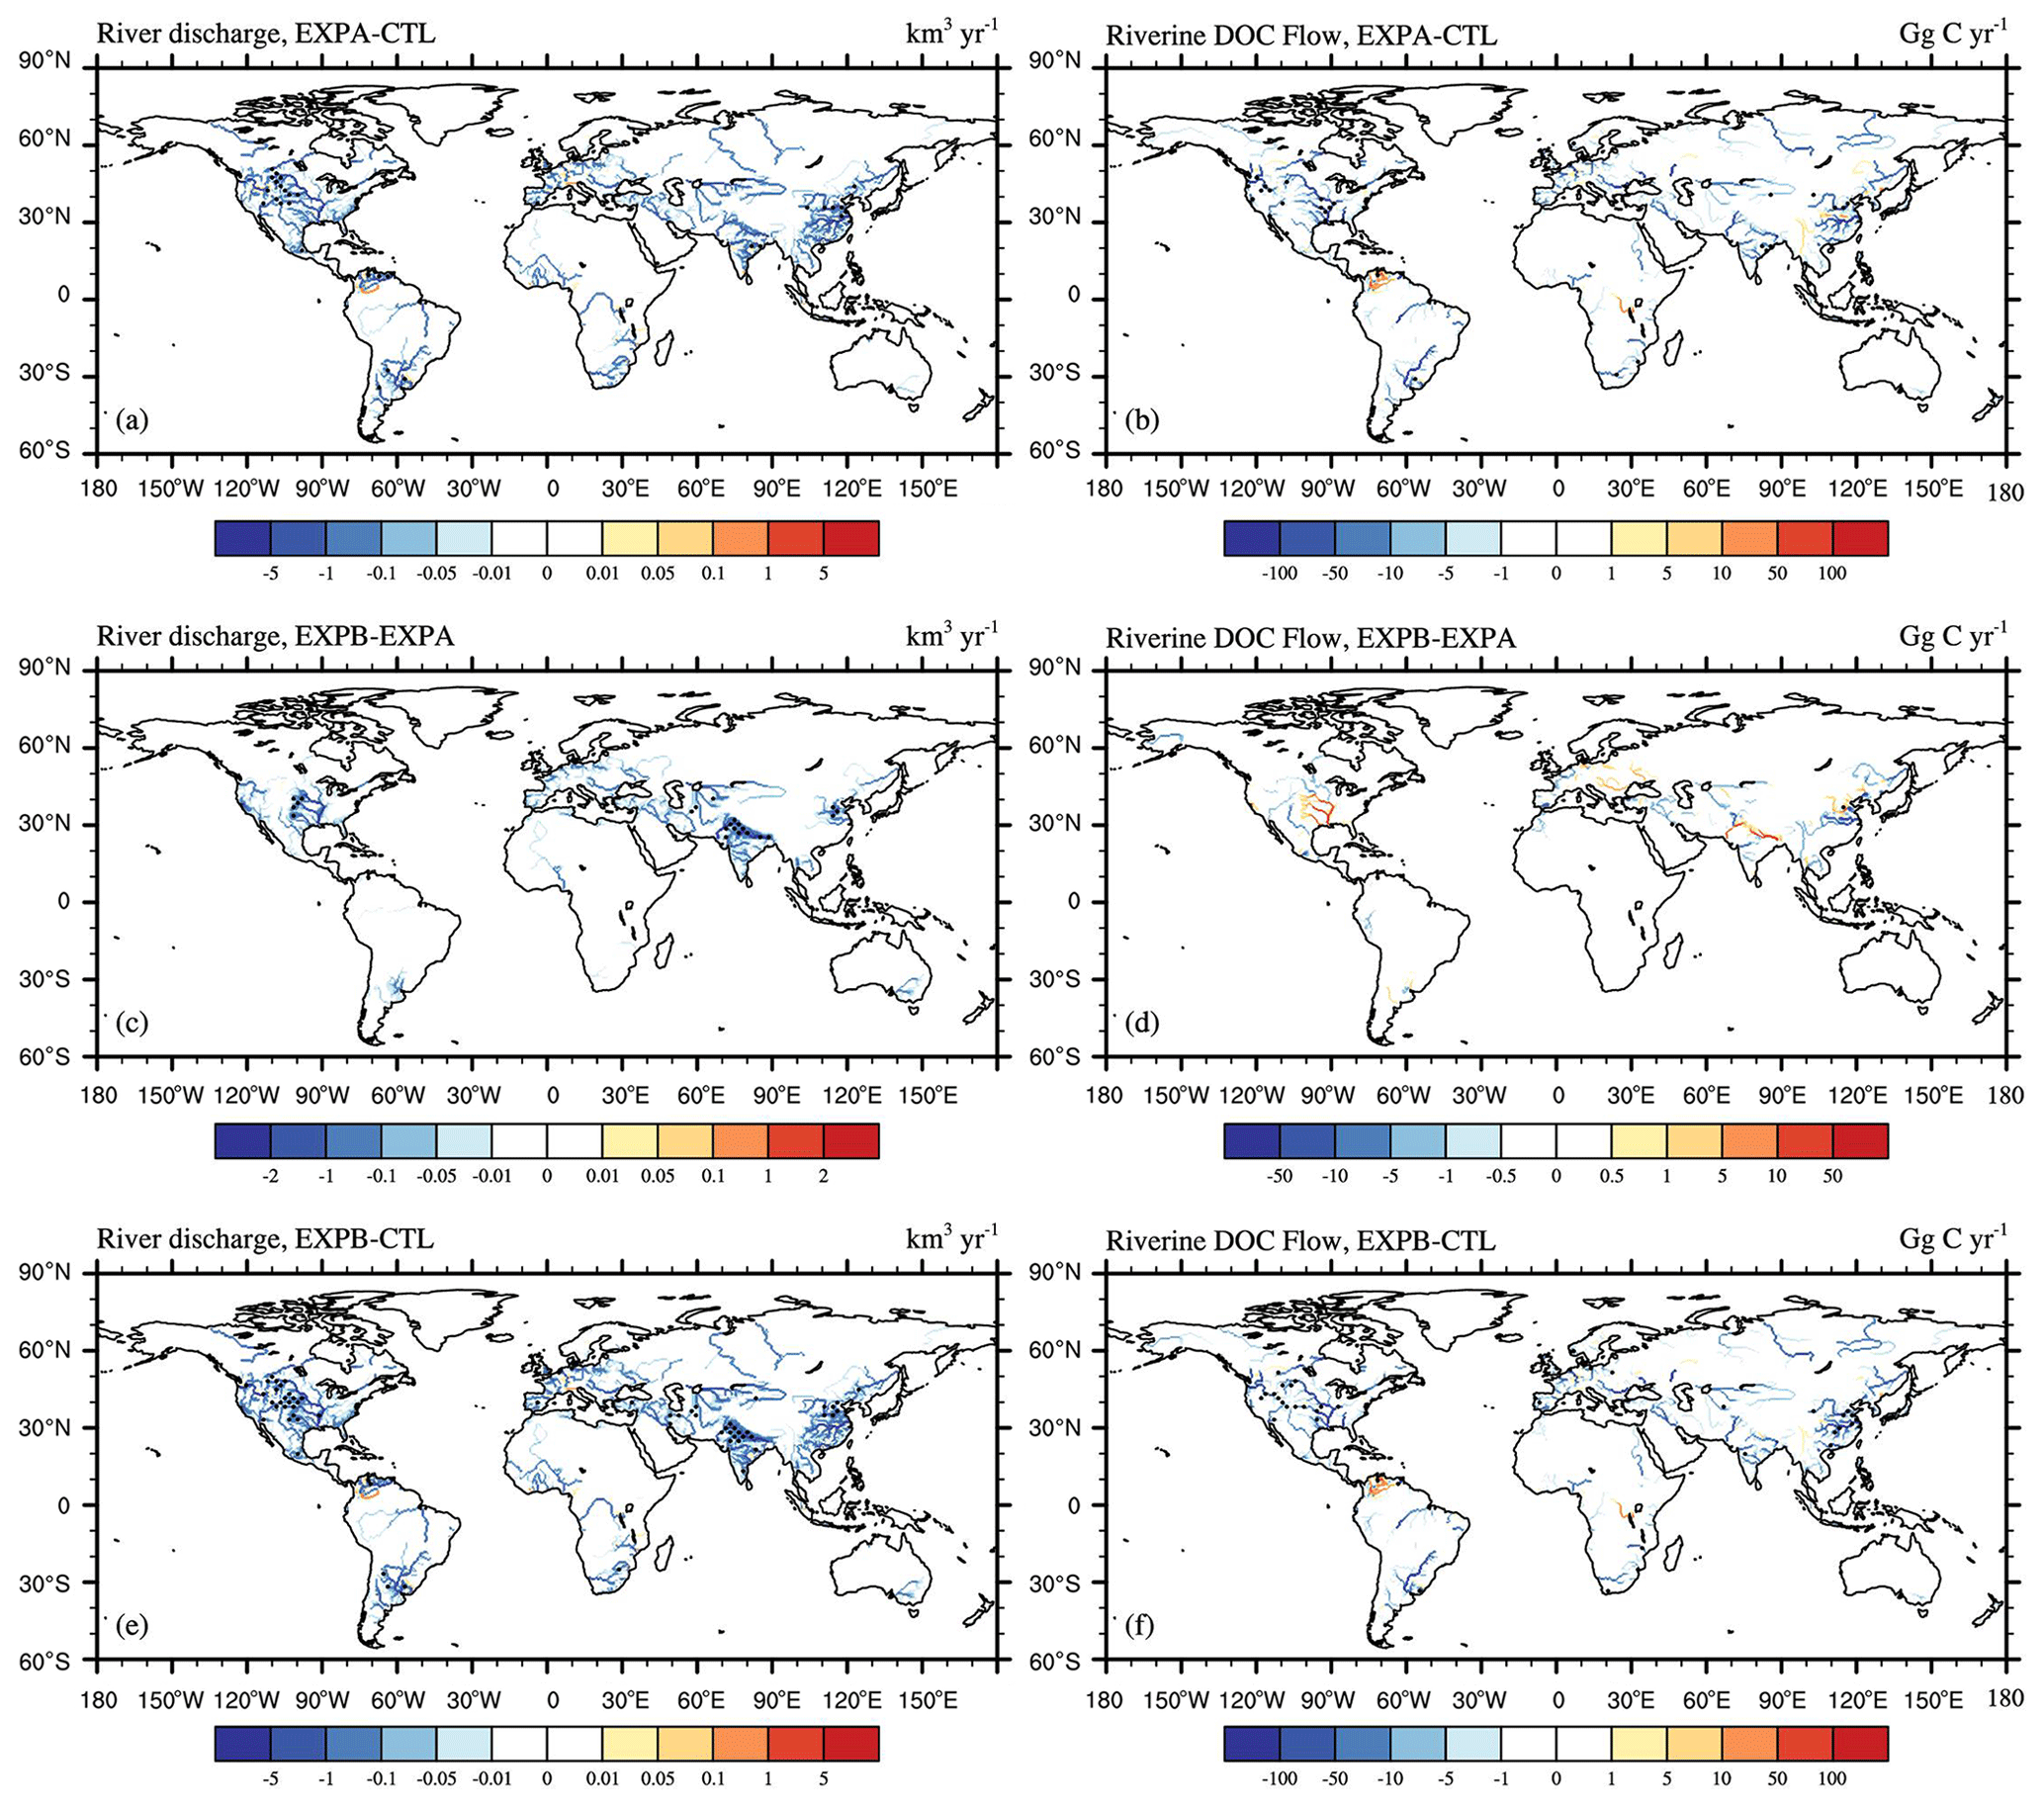
Figure 6Spatial distribution of the multi-year-average differences between different experiments from 1981–2013 in the (a) river discharge (EXPA–CTL), (b) riverine DOC flow (EXPA–CTL), (c) river discharge (EXPB–EXPA), (d) riverine DOC flow (EXPB–EXPA), (e) river discharge (EXPB–CTL), and (f) riverine DOC flow (EXPB–CTL). This figure demonstrates the effects of (a, b) surface water regulation, (c, d) groundwater regulation, and (e, f) anthropogenic water regulation on the river discharge and riverine DOC flow rate. The black dots are the regions that pass the significance t test at the 95 % confidence level.
The blue line in Fig. 7 represents the time series variation in surface water regulation of global riverine organic carbon to the ocean. Surface water regulation greatly reduced global riverine DOC transport to the ocean, from −11.1 Tg yr−1 in 1981 to −16.4 Tg yr−1 in 2013 (Fig. 7a), with a multi-year-average retention efficiency of about 6 %. This may be related to the fact that the reservoir adjusting the river discharge and intercepting the riverine DOC. The regions most affected by surface water regulation were the Pacific and Atlantic oceans, and as surface water use in these regions became more frequent, the reduction in DOC delivery to the ocean was intensified each year. There was no significant change in the Arctic Ocean region, which may have been due to less anthropogenic disturbance in this area.
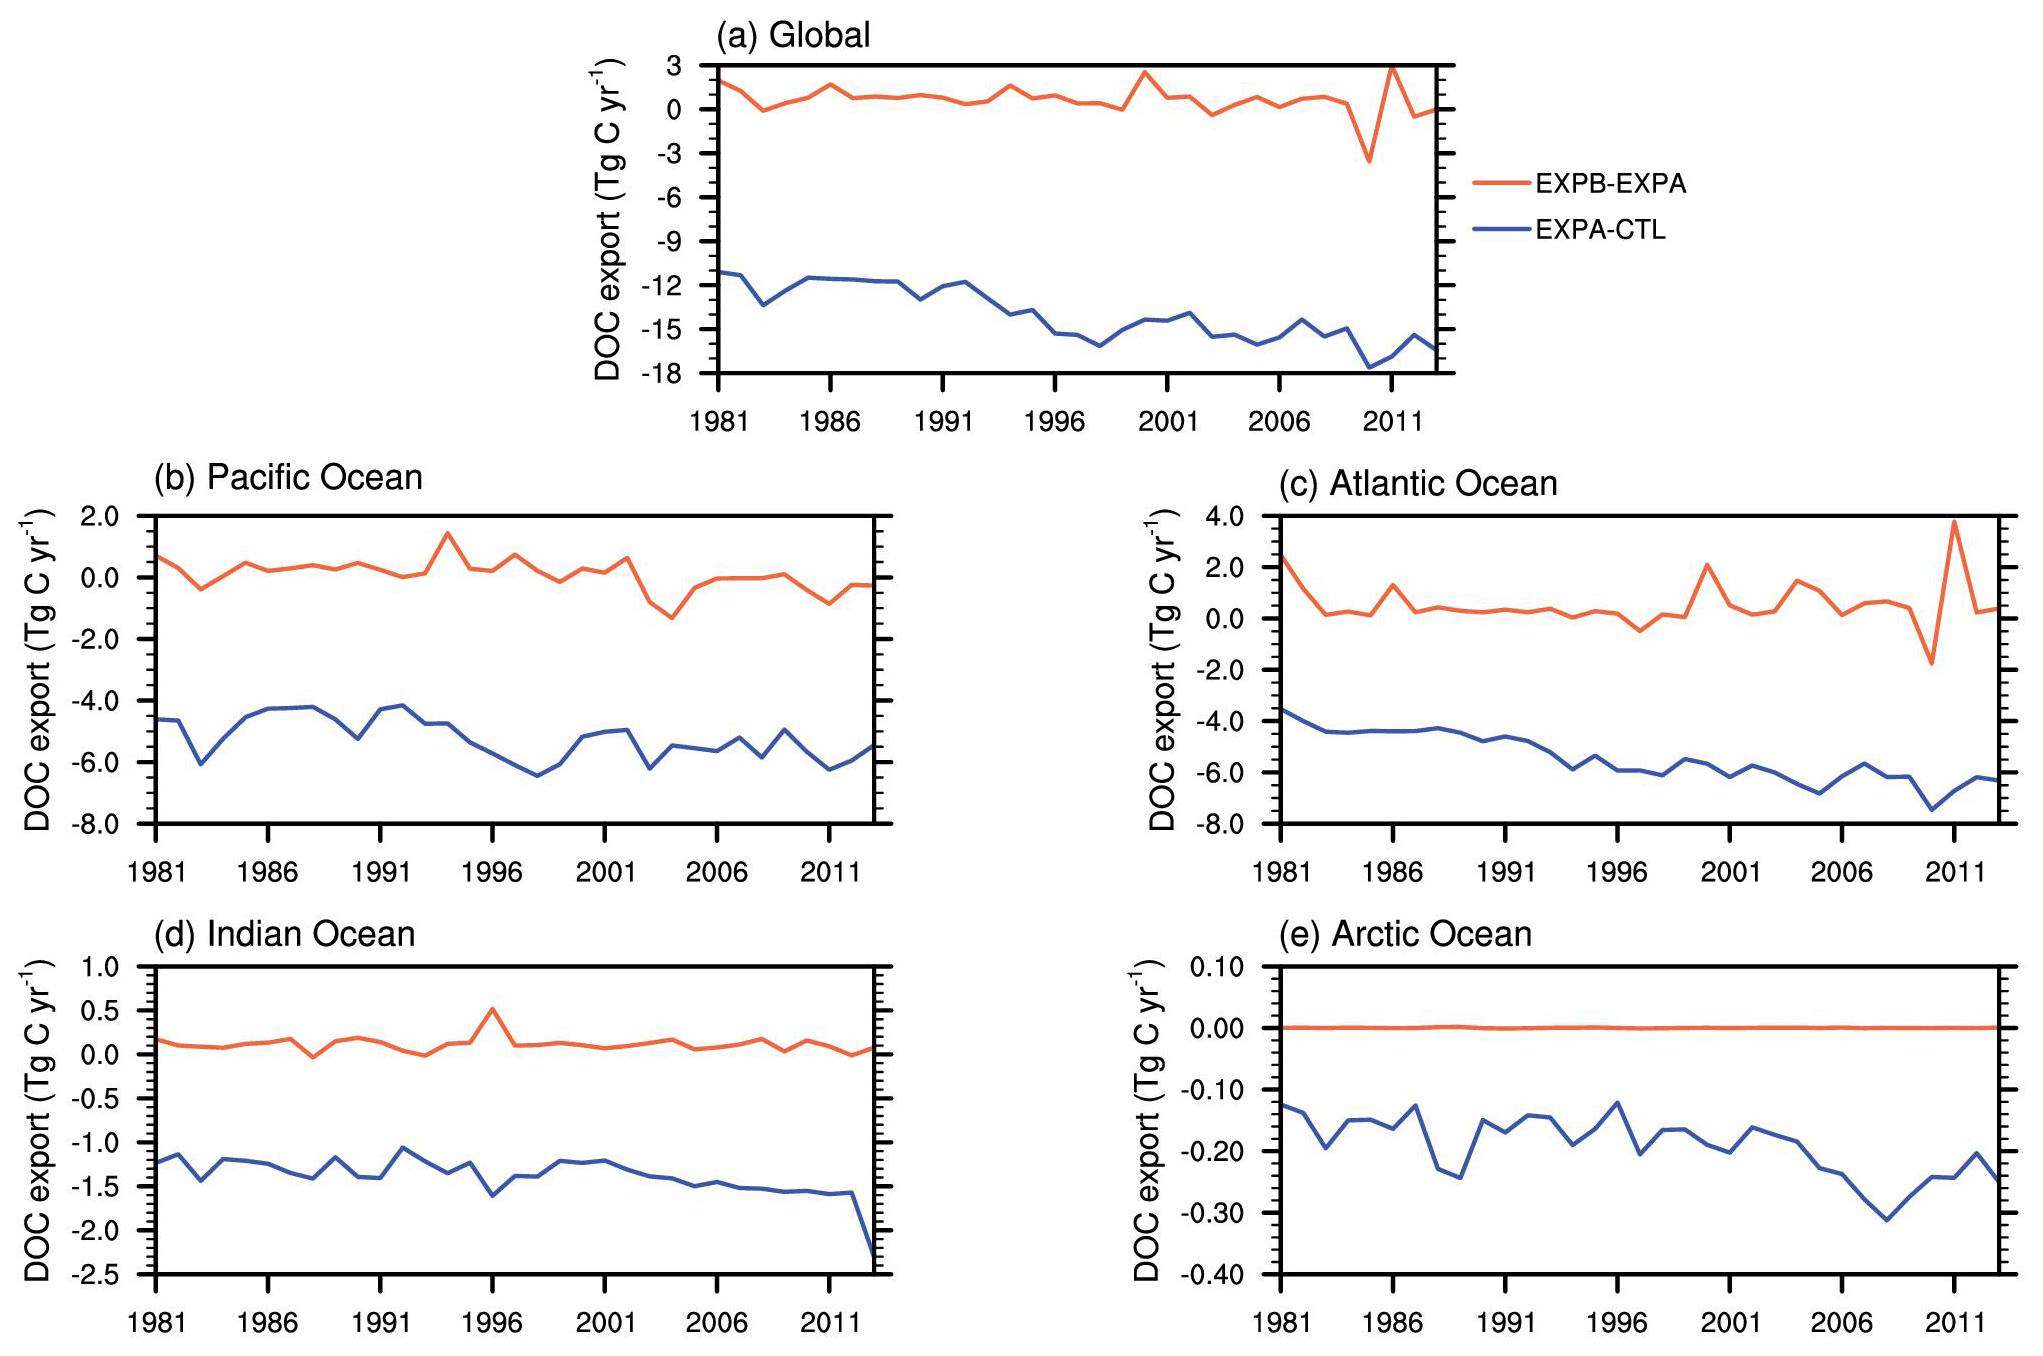
Figure 7Time series of changes in DOC export to oceans due to surface water (blue line) and groundwater regulation (orange line) from 1981–2013: (a) global, (b) Pacific Ocean, (c) Atlantic Ocean, (d) Indian Ocean, (e) Arctic Ocean.
4.3 Effects of groundwater regulation on riverine DOC transport
The effects of groundwater regulation on land surface hydrological variables were obtained using the difference between EXPB and EXPA, as shown in Fig. 8. It can be seen that groundwater extraction increased latent heat fluxes, decreased sensible heat fluxes, decreased soil and surface temperatures, and increased soil moisture in most regions of the world. The most significant impacts were in northern China, northern India, Pakistan, and the central United States, where climate conditions are dry, and groundwater extraction is frequent. Unlike surface water regulation, groundwater extraction has a negative impact on total runoff (Fig. 8f). Because groundwater is extracted from underground aquifers, whereas surface water is extracted from rivers and reservoirs, surface water use directly increases total land surface runoff. However, the impact of groundwater extraction on runoff depends on the groundwater pumping rate, infiltration rate, and soil evaporation capacity. The increase in latent heat flux leads to an increase in surface evapotranspiration, which results in a decrease in runoff.
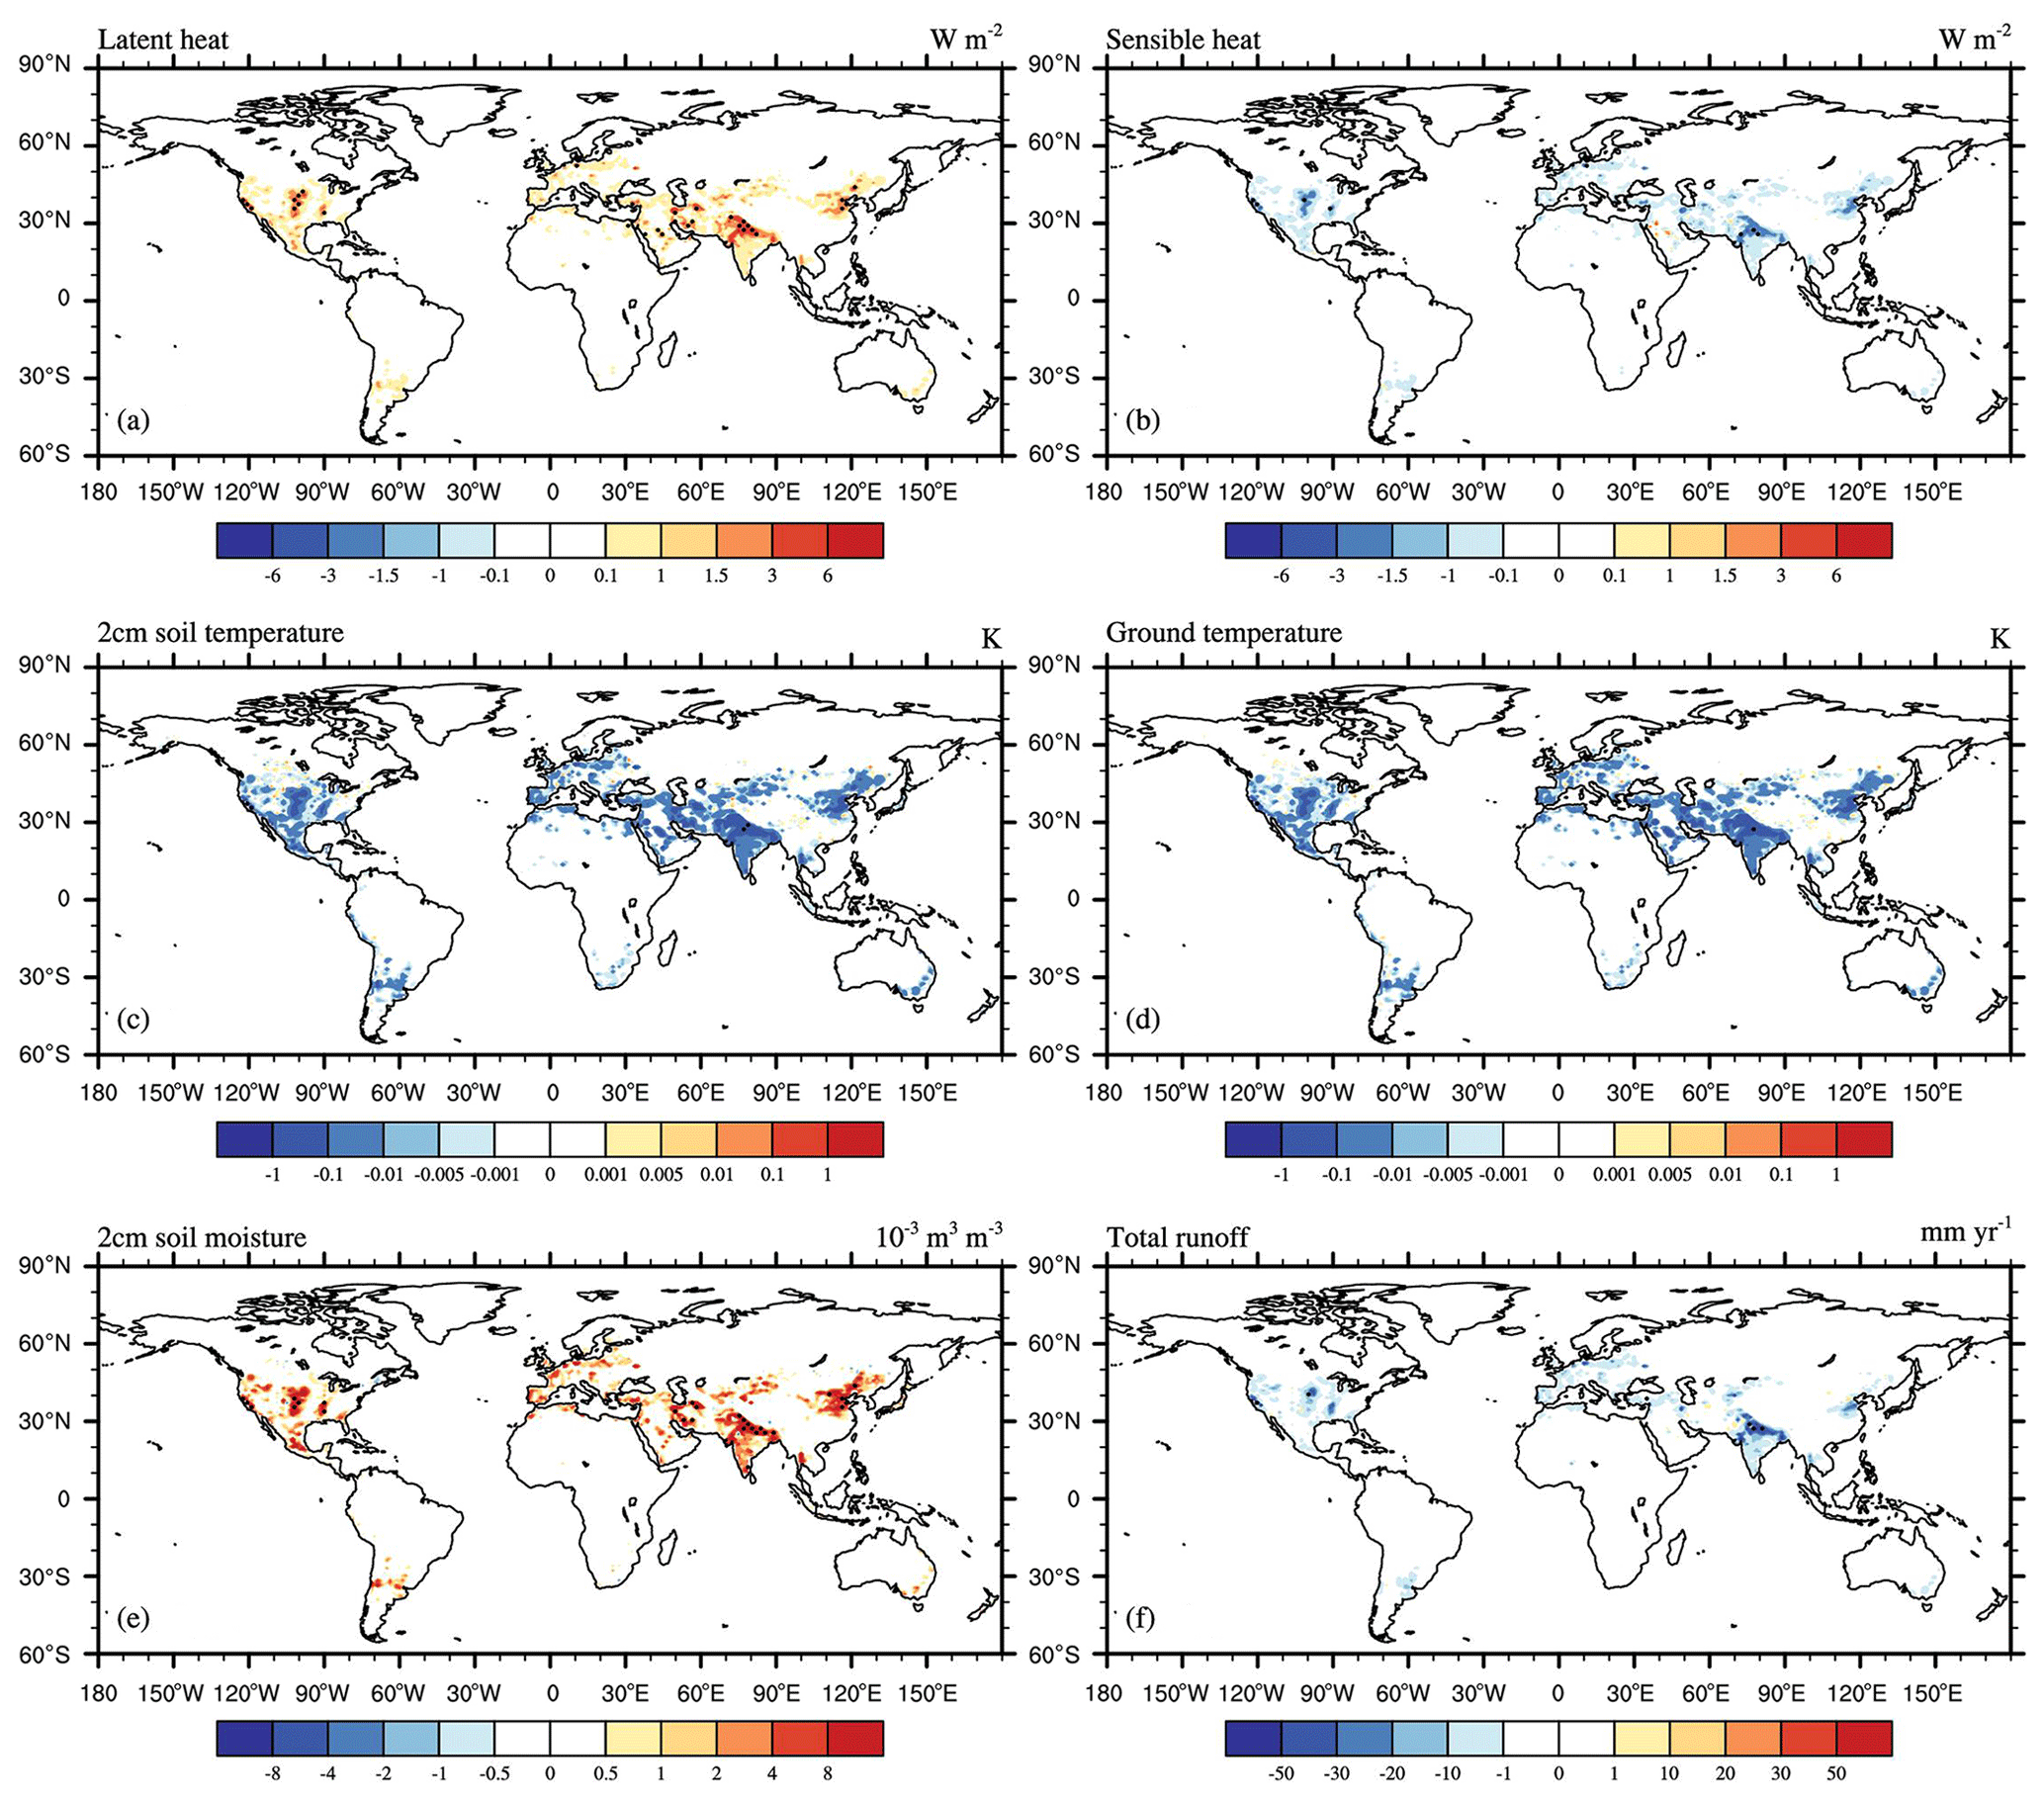
Figure 8Spatial distribution of multi-year-average differences in land surface hydrological variables between EXPB and EXPA from 1981–2013: (a) latent heat flux, (b) sensible heat flux, (c) 2 cm soil temperature, (d) surface temperature, (e) 2 cm soil moisture, (f) total runoff. This figure demonstrates the effects of groundwater regulation on land surface hydrological variables. The black dots are the regions that pass the significance t test at the 95 % confidence level.
Figure 5c and d show the effect of groundwater regulation on soil carbon losses. On the one hand, extracting water from underground aquifers led to a reduction in subsurface runoff and a consequent reduction in DOC leaching, especially in northern China and the central United States, where DOC leaching reductions reached 200 kg C yr−1. On the other hand, groundwater irrigation led to an increase in surface runoff, which led to an increase in DOC runoff. The most affected areas are characterized by well-developed agriculture.
Figure 6c and d show the spatial distribution of the effects of groundwater regulation on river discharge and DOC export from 1981–2013. It can be seen that river discharge significantly decreased in areas with high groundwater extraction rates, such as the central United States, Pakistan, Afghanistan, and northern China, resulting in a decrease in riverine DOC export. The largest decrease occurred in the Yangtze river basin in China, reaching 50 Gg C yr−1; most other rivers were around 10 Gg C yr−1. In addition, although river discharge was reduced in some river sections, soil DOC loss was higher, and DOC export fluxes were still increasing, especially in the lower Yellow, Mississippi, and Ganges river basins. This was due to the predominance of agricultural irrigation water in these regions.
The amount of carbon flux variation influenced by groundwater regulation was relatively small compared to that influenced by surface water regulation, but there was some interannual fluctuation, with the greatest impact during 2009–2012 (Fig. 7). The intermittent increase and decrease in the variation indicate that river carbon transport fluxes did not decrease directly with increases in groundwater pumping rate but were also related to the complex carbon and nitrogen cycling processes in terrestrial ecosystems. In addition, irrigation after groundwater extraction from an underground aquifer did not consider directly sending DOC back to the soil carbon pool, and therefore the carbon flux changes were smaller. Because groundwater regulation activities are mostly concentrated in the northern temperate zone, the Pacific and Atlantic regions were the most obviously affected, whereas the remaining regions did not change much.
4.4 Effects of anthropogenic water regulation on riverine DOC transport
This section discusses the combined effects of anthropogenic water regulation on soil and riverine carbon transport using the EXPB-minus-CTL results. The effects of anthropogenic water regulation on total runoff both increased and decreased globally (Fig. 9f). The western United States, Venezuela, and northern China showed an increase in runoff due to the high intensity of irrigation water use in agriculture. In contrast, regions such as northern India and the central United States showed a decrease in runoff due to frequent groundwater extraction. Overall, human water regulation activities led to an increase in latent heat fluxes and soil moisture and a decrease in sensible heat fluxes and in soil and ground temperatures.
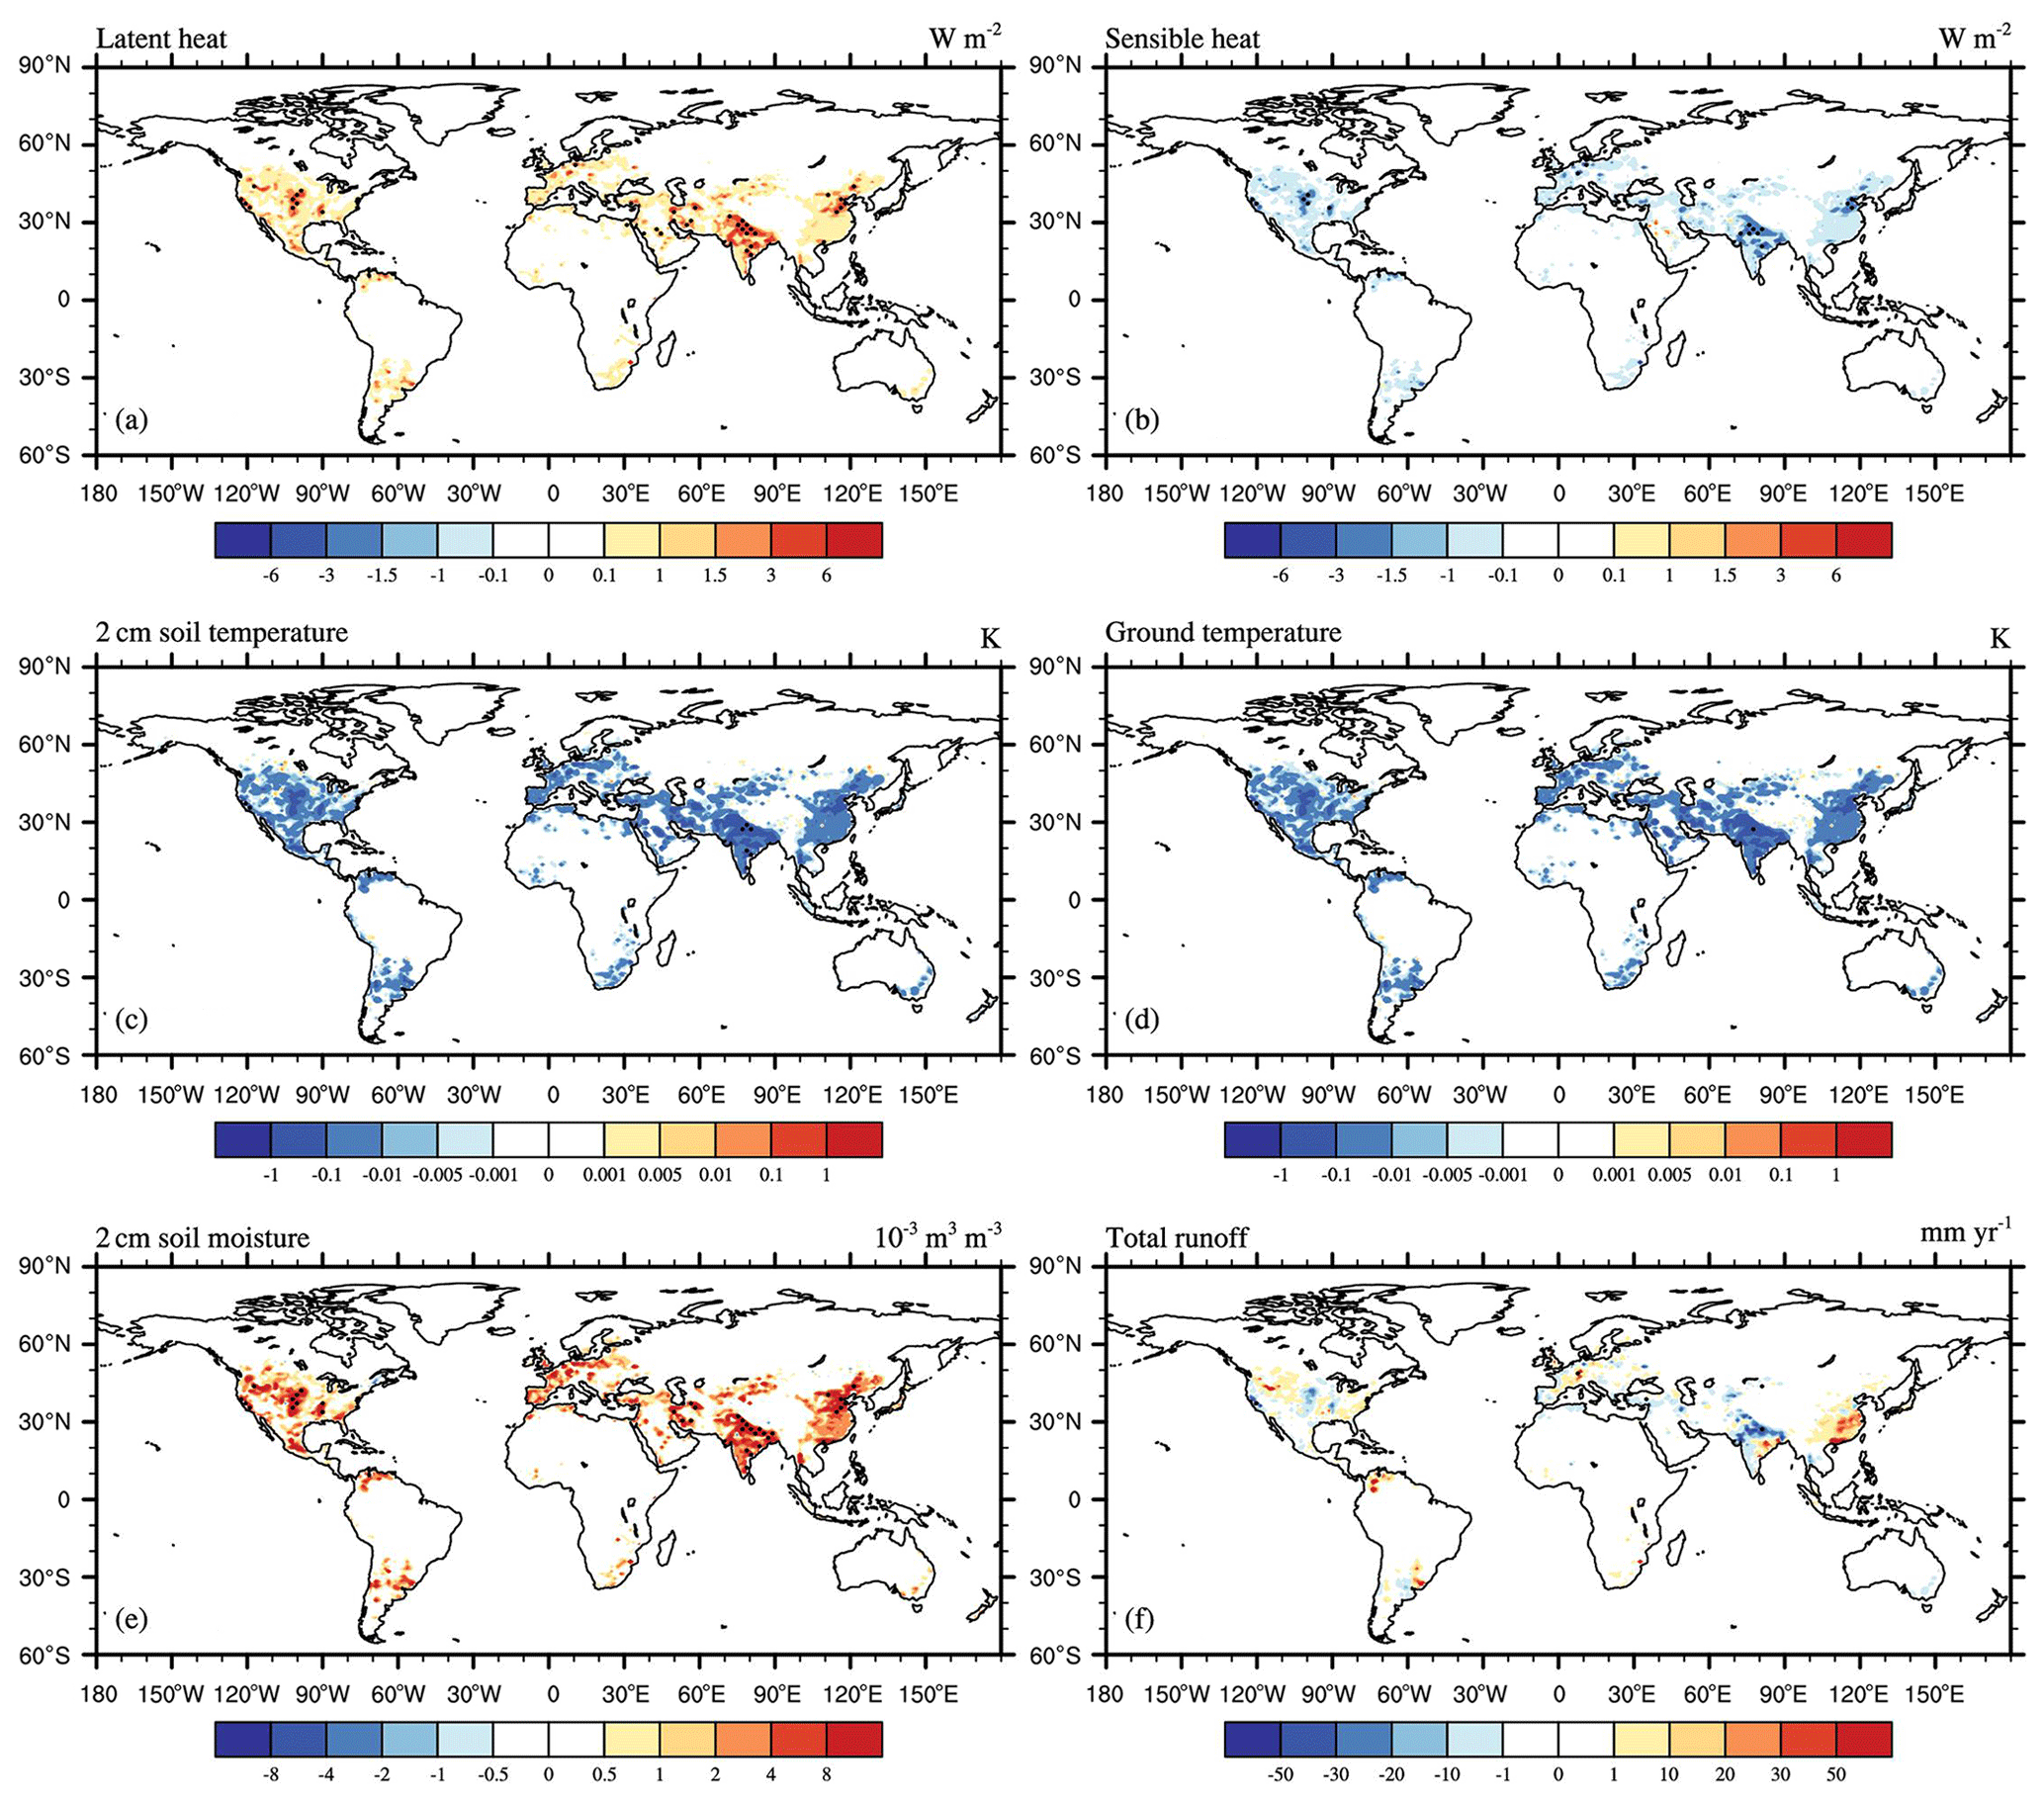
Figure 9Spatial distribution of multi-year-average differences in land surface hydrological variables between EXPB and CTL from 1981–2013: (a) latent heat flux, (b) sensible heat flux, (c) 2 cm soil temperature, (d) surface temperature, (e) 2 cm soil moisture, (f) total runoff. This figure demonstrates the effects of anthropogenic water regulation on land surface hydrological variables. The black dots are the regions that pass the significance t test at the 95 % confidence level.
Figure 5e shows that soil DOC runoff increased, especially in northern China and the midwestern United States. DOC leaching decreased in some river sections (Fig. 5f), but not significantly. Although soil DOC runoff showed an overall increase, DOC export fluxes decreased in most rivers globally due to water regulation (Fig. 6f). On the one hand, human water use activities led to a decrease in river discharge (Fig. 6e), and on the other hand, reservoirs have intercepted some of riverine DOC, which led to an increase in microbial activity, resulting in a decrease in river carbon flux. In contrast, in the Mississippi and Ganges river basins, although groundwater regulation increased their DOC export fluxes (Fig. 6d), they still showed a decrease under the negative feedback effect of surface water regulation, indicating that most rivers globally are mainly influenced by reservoir interception and surface water withdrawal.
Five typical rivers were selected to exhibit how anthropogenic water regulation affects monthly and annual average DOC flows in rivers. The selected rivers were the Mississippi in the United States, the Danube in Europe, the Ob in Russia, the Yangtze in China, and the Ganges in India. Figure 10 displays the seasonal and interannual variation in DOC flow rates in the five rivers as calculated by the three sets of simulations, respectively. Anthropogenic water regulation had a significant impact on the Mississippi, Danube, Yangtze, and Ganges rivers, which decreased significantly in winter and early spring, whereas the Ob was almost unaffected. This was the case because of weak water management activities in the Ob, whereas the other subtropical and temperate rivers had intense water management activities and significant seasonal variation in runoff. In addition, only the Mississippi, Yangtze, and Ganges rivers were affected by minor groundwater regulation, usually occurring during dry periods, whereas in most seasons, the rivers were affected only by surface water regulation (including reservoir interception). The annual results showed a significantly strengthening trend of riverine DOC reduction due to the influence of anthropogenic water regulation, especially in the Danube and Yangtze rivers, where the retention percentage in 2013 was 4 to 5 times higher than in 1981, up to more than 50 %, indicating a clear intensification of human water management activities. The influence on the Mississippi and Ganges rivers increased slightly and stabilized at about 30 %–40 %, whereas the influence on the Ob was almost 0 %.
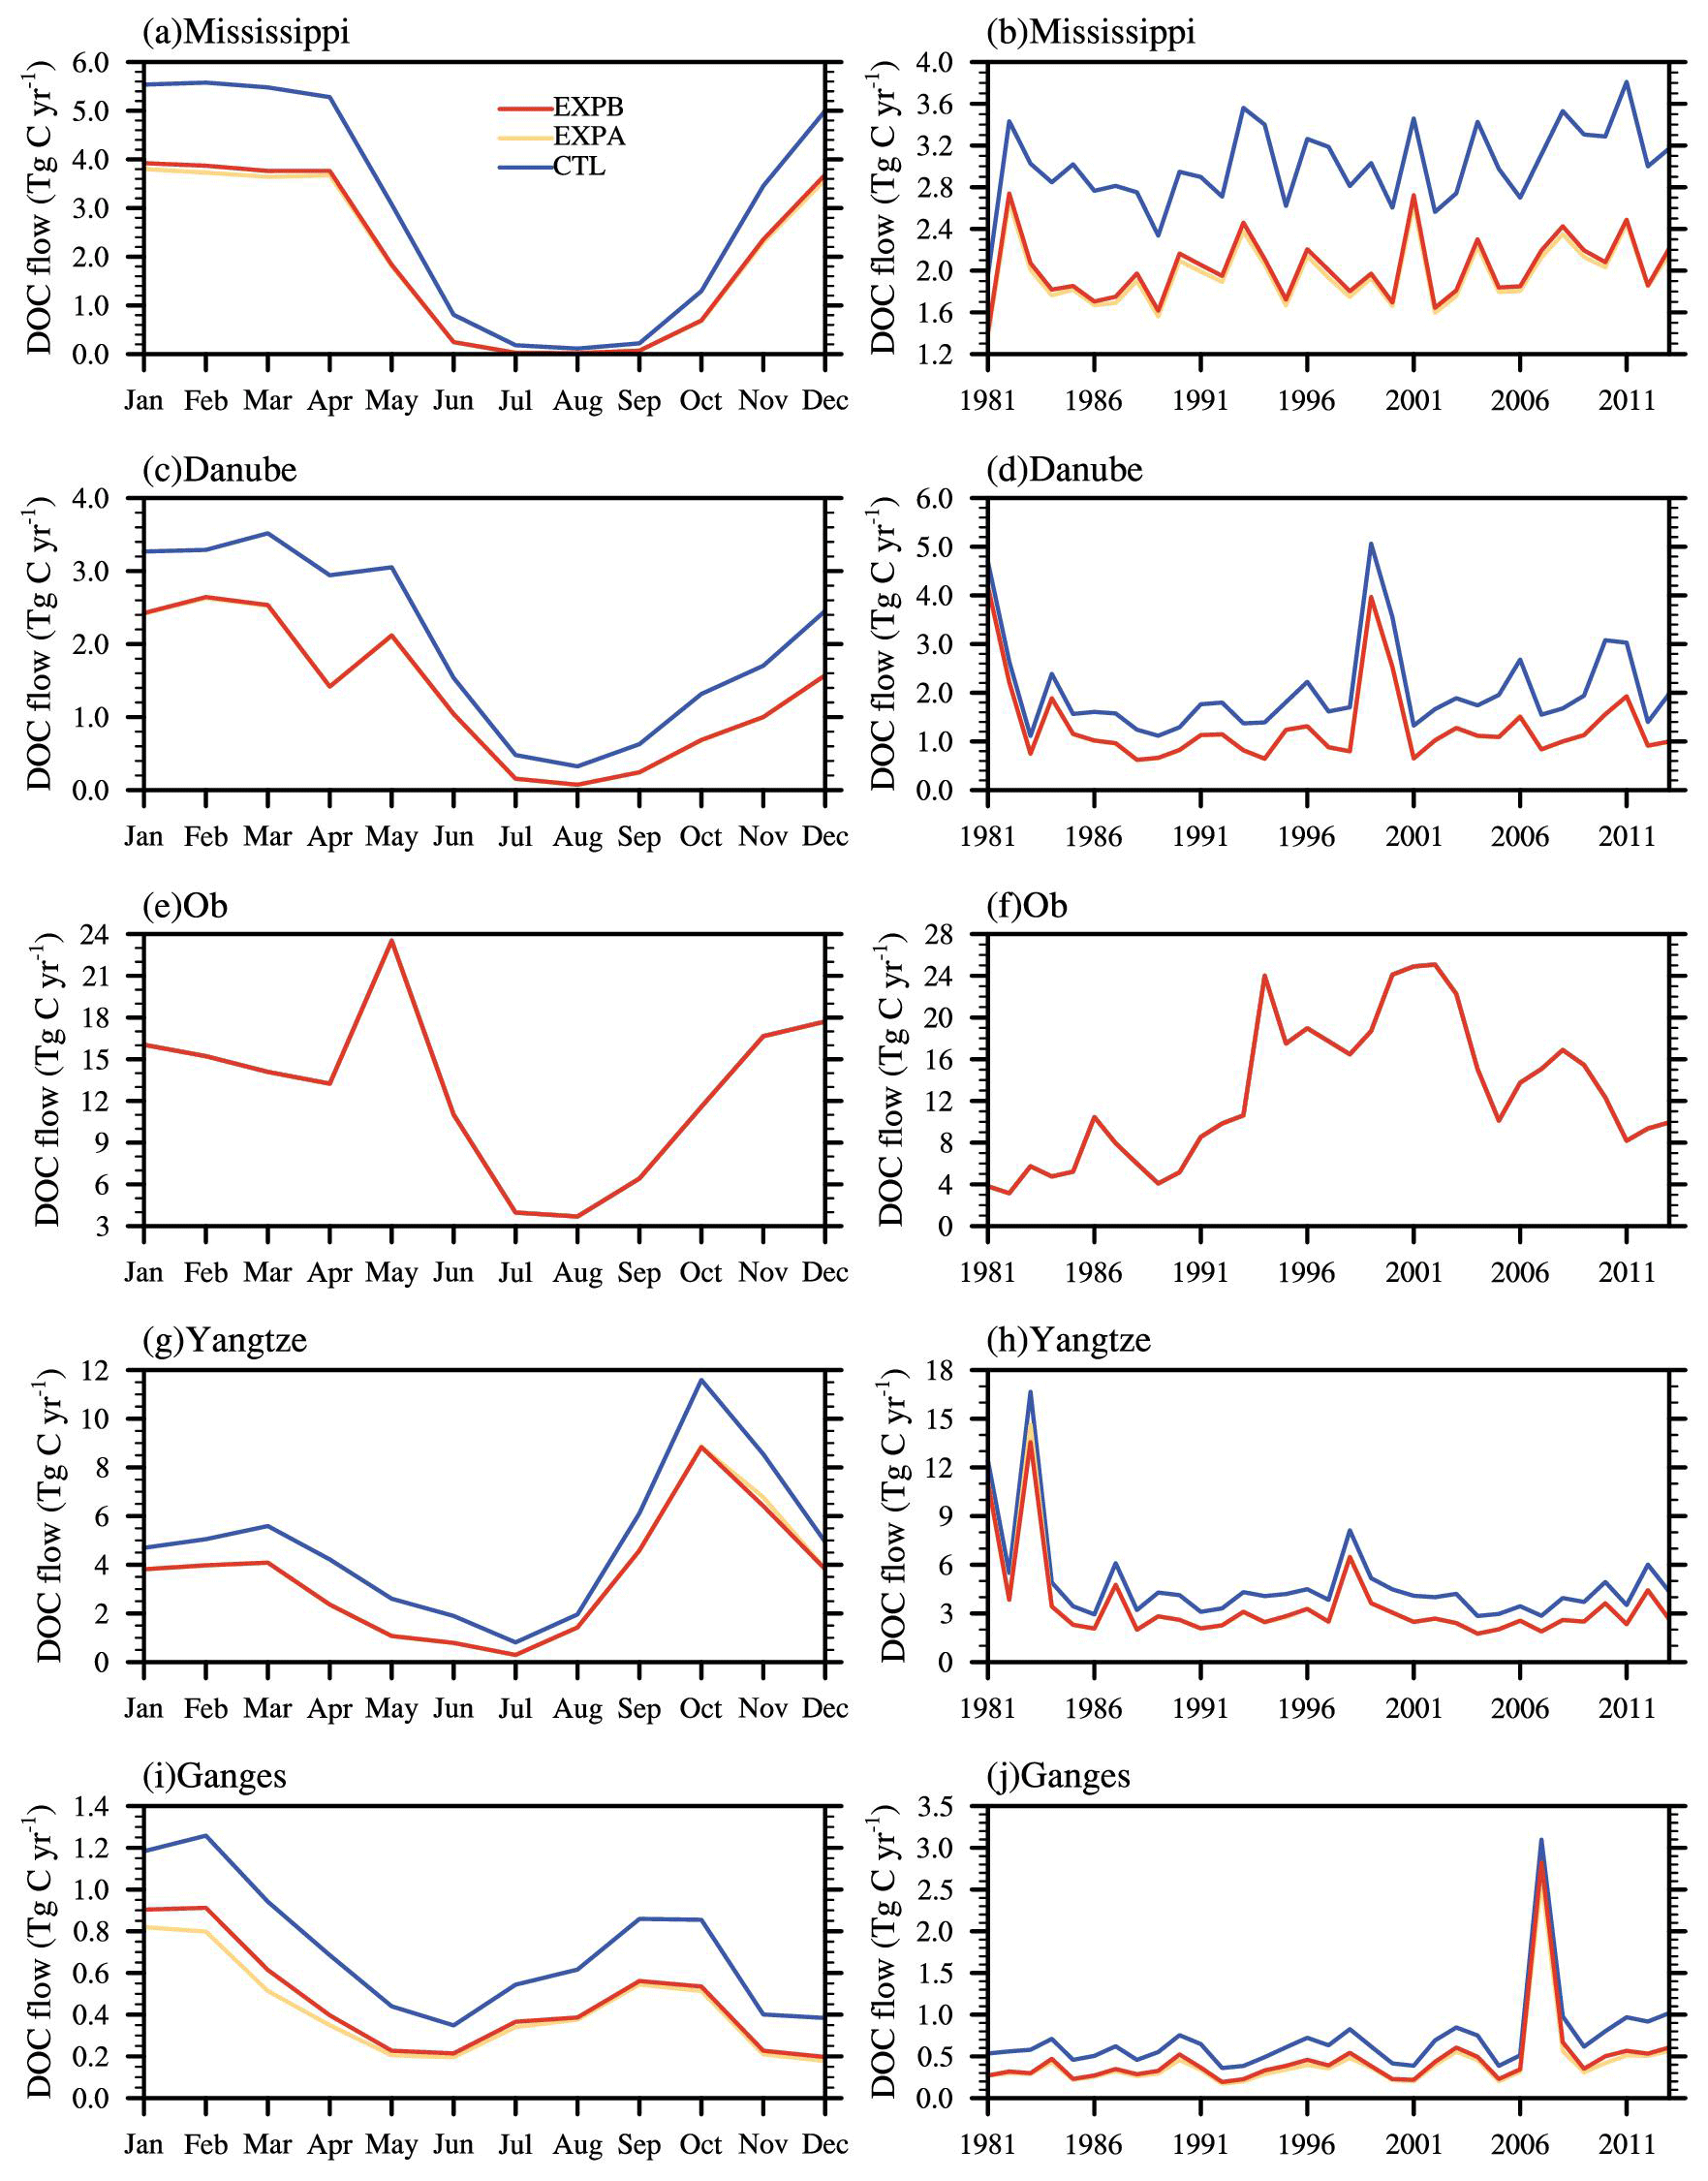
Figure 10Time series of (a, c, e, g, i) monthly and (b, d, f, h, j) annual average riverine DOC flow rates for the five typical rivers simulated by CTL (blue line), EXPA (yellow line), and EXPB (red line): (a, b) Mississippi (32.25∘ N, 91.25∘ W), (c, d) Danube (45.25∘ N, 28.75∘ E), (e, f) Ob (66.25∘ N, 66.75∘ E), (g, h) Yangtze (30.75∘ N, 117.75∘ E), (i, j) Ganges (24.25∘ N, 88.25∘ E).
Riverine DOC export fluxes have obvious spatial heterogeneity. Six zones were defined according to the latitudes where the river mouths are located, and the effects of the presence or absence of anthropogenic water regulation on DOC export fluxes are shown in Fig. 11. The hotspot regions of riverine DOC export are concentrated in the tropics (23.5∘ S–23.5∘ N) and the mid-latitudes and high latitudes of the Northern Hemisphere (40–90∘ N). The DOC export fluxes of rivers between 40 and 66∘ N accounted for 35.32 % of total global export flux. Due to anthropogenic water regulation, the global DOC export flux was reduced by 13.36 ± 2.45 Tg C yr−1 compared to the case with no human regulation, with the greatest impact concentrated in the subtropical and temperate regions of the Northern Hemisphere (23.5–66∘ N) because this is the region with the highest intensity of human water use activity.
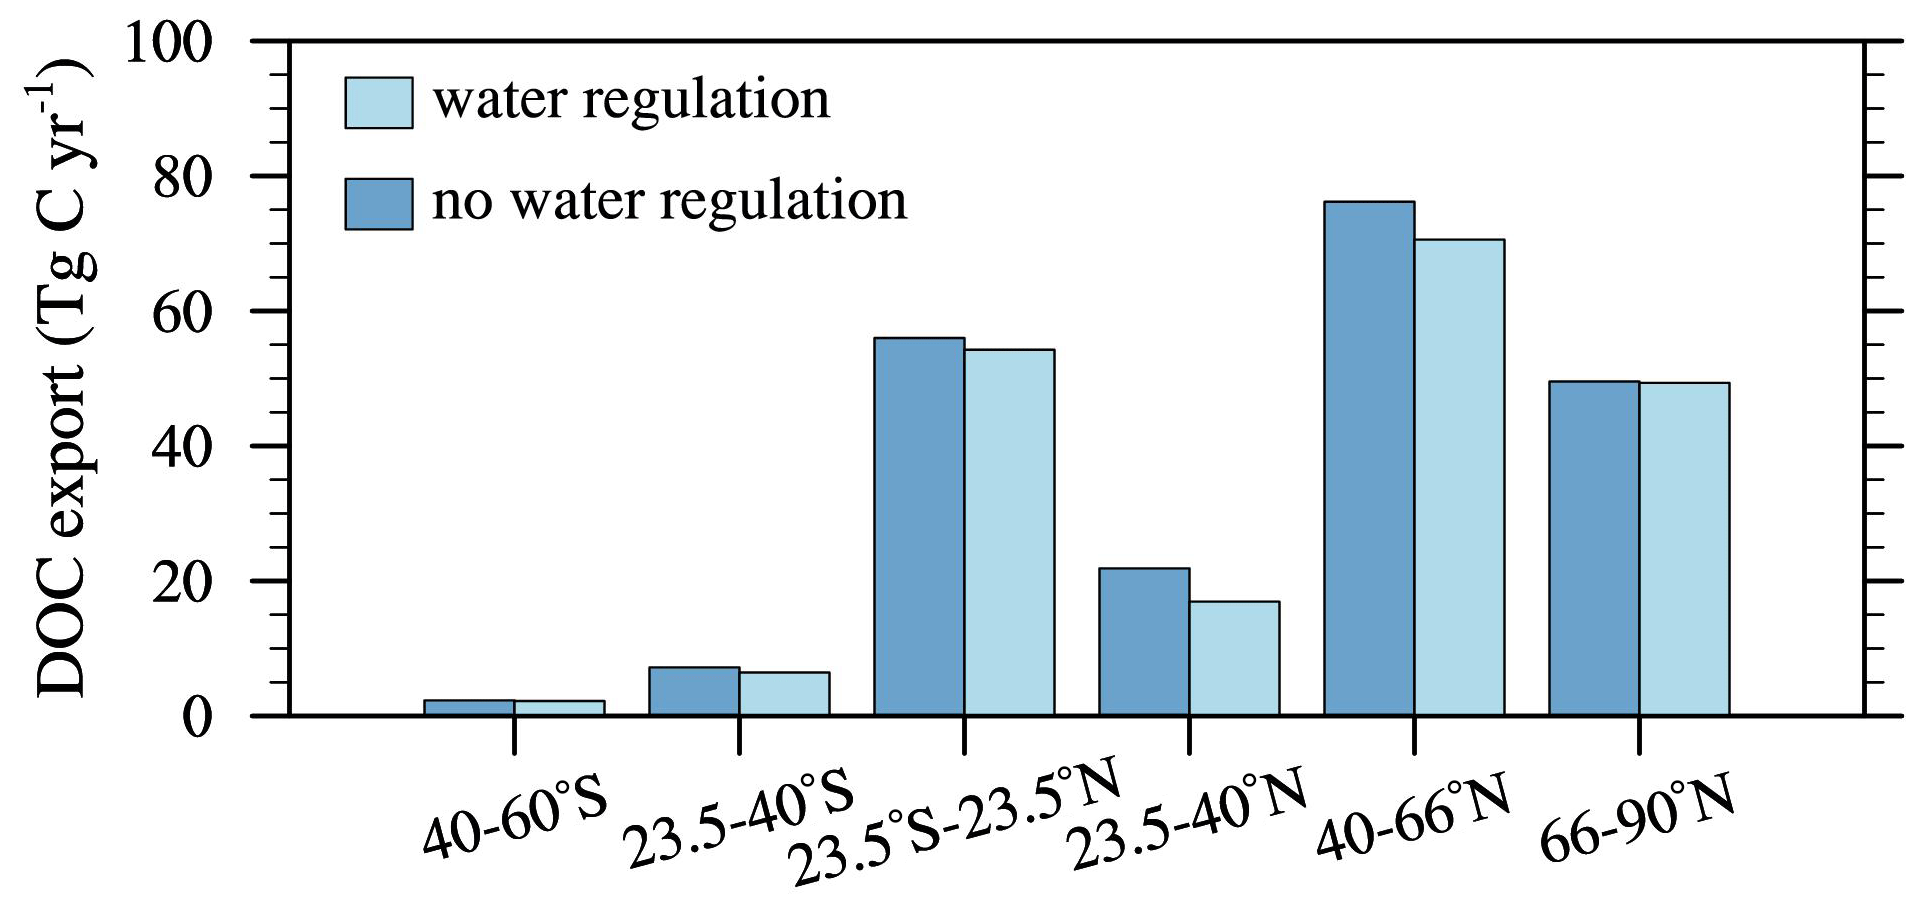
Figure 11Bar chart of latitudinal band distribution of multi-year-average DOC export fluxes from 1981–2013. Dark blue indicates no water regulation, and light blue indicates anthropogenic water regulation.
Overall, anthropogenic water regulation reduced global riverine carbon fluxes, and the reduction in DOC fluxes also intensified over time, from −9.13 to −16.45 Tg C yr−1 (Fig. 12). The reduction percentage also increased from 4.83 % to 6.20 %. Rivers in the Pacific and Atlantic regions were more affected by water regulation, and the interannual changes were more consistent with the global picture. The flux of rivers into the Indian Ocean, which was reduced by water regulation, was about 1.27 ± 0.23 Tg C yr−1, which was small compared to the global flux, and the flux into the Arctic Ocean was almost negligible due to the scarcity of human activities.
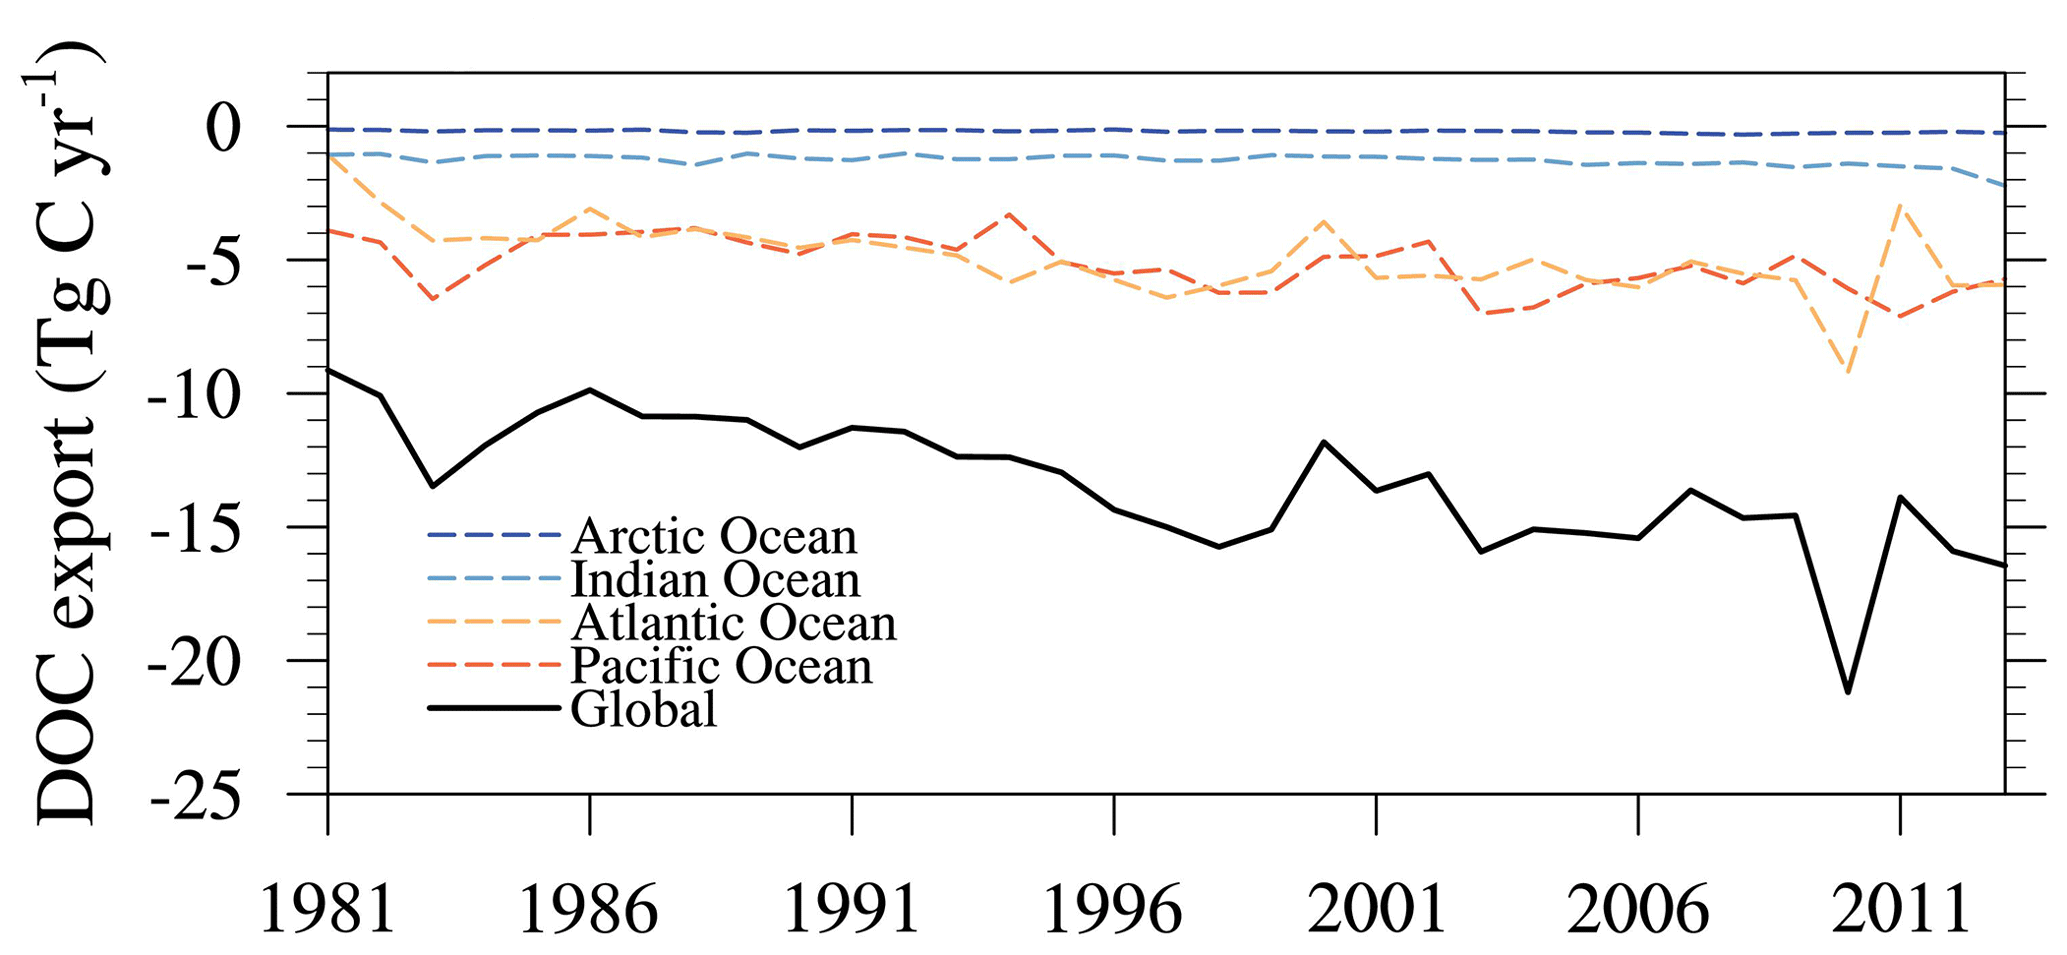
Figure 12Interannual variability in the impact of anthropogenic water regulation on riverine DOC delivery from rivers to the ocean.
This study has developed schemes that consider soil and riverine DOC dynamics and anthropogenic water regulation activities and has incorporated them into the land surface model CLM5.0. The simulated river discharges and riverine DOC export fluxes were in good agreement with observations obtained for 106 major world rivers. Surface water and groundwater use datasets were used as inputs to the model, and three sets of numerical simulations were conducted from 1981–2013 on a global scale to investigate the effects of anthropogenic water regulation on riverine DOC transport.
The main conclusions of this study are as follows. First, anthropogenic water regulation activities increased soil losses in most arid and semi-arid regions of the world, although groundwater extraction reduced subsurface runoff and decreased DOC leaching; however, this decrease was less than the increase in DOC runoff due to irrigation. Second, the DOC export fluxes of the Yangtze, Yellow, Mississippi, and Ganges river basins were significantly reduced by reservoir regulation and surface water withdrawal. However, DOC export fluxes in these areas showed an increase under groundwater regulation, but the increase was small, indicating that DOC transport in most rivers globally is mainly influenced by reservoir interception and surface water regulation. Third, further analysis showed that subtropical and temperate rivers with intensive water management regimes were more affected and that DOC flows decreased substantially in winter and early spring. The retention percentage has been increasing year by year, up to over 50 %, indicating a clear intensification of human water management activities, especially along the Danube and Yangtze rivers. In addition, the greatest impact of anthropogenic water regulation activities was concentrated in the region from 23.5 to 66∘ N because this zone contains the highest intensity of human water use activities. Fourth, global riverine DOC flux transport to the ocean decreased by an average of 13.36 ± 2.45 Tg C yr−1 due to anthropogenic water regulation activities, and the decrease in DOC flux became more pronounced with time, from −9.13 Tg C yr−1 (4.83 %) in 1981 to −16.45 Tg C yr−1 (6.20 %) in 2013, especially in the Pacific and Atlantic Ocean regions. Meanwhile, the Arctic Ocean region was almost unaffected due to low anthropogenic disturbance. In general, this study has developed an effective scheme to simulate DOC export from terrestrial to aquatic systems, which is important for improving carbon budget estimation and integrated ecosystem management.
However, there are still some limitations and uncertainties in the developed model that need to be addressed in the future. In this study, we evaluated global riverine DOC transport using observations from a limited number of river sites in literature records, which may have induced a bias. Additionally, the simplification of the carbon dynamics of soils and rivers, the uniform parameters, and the input datasets also produce some uncertainties. To advance the current model, more observed datasets and more complex schemes of carbon dynamics are needed. In addition, other human activities, such as fertilization, wastewater discharge, and land use change, have a significant impact on riverine carbon transport (Regnier et al., 2013) and should be considered in our future work.
The observed river discharge and riverine DOC export data are available in Dai et al. (2012). The source code of CLM5.0 is available online (https://www.cesm.ucar.edu/models/clm, Terrestrial Sciences Section, 2019). The FORTRAN code of the model developed in this study is available upon request. Please contact Zhenghui Xie at zxie@lasg.iap.ac.cn. The drawing language is the NCAR Command Language.
The supplement related to this article is available online at: https://doi.org/10.5194/esd-14-897-2023-supplement.
The scientific framing of this paper was developed by YY, ZX, and BJ. The model was initiated by YY and YW. The literature review was performed by HY, YT, and SC. Analyses and scientific post-processing were performed by LW and RL. All authors discussed the results and contributed to the writing of the paper.
The contact author has declared that none of the authors has any competing interests.
Publisher’s note: Copernicus Publications remains neutral with regard to jurisdictional claims in published maps and institutional affiliations.
This work was jointly supported by the National Key Research and Development Program of China (grant no. 2022YFC3201903), the National Natural Science Foundation of China (grant nos. 41830967 and 42175163), the Youth Innovation Promotion Association CAS (2021073), and the National Key Scientific and Technological Infrastructure project “Earth System Science Numerical Simulator Facility” (EarthLab). We would like to thank the editor and the three anonymous reviewers for their constructive and thoughtful comments.
This research has been supported by the National Key Research and Development Program of China (grant no. 2022YFC3201903), the National Natural Science Foundation of China (grant nos. 41830967 and 42175163), the Youth Innovation Promotion Association CAS (grant no. 2021073), and the National Key Scientific and Technological Infrastructure project “Earth System Science Numerical Simulator Facility” (EarthLab).
This paper was edited by Fubao Sun and reviewed by three anonymous referees.
Aitkenhead, J. A. and McDowell, W. H.: Soil C:N ratio as a predictor of annual riverine DOC flux at local and global scales, Global Biogeochem. Cy., 14, 127–138, https://doi.org/10.1029/1999GB900083, 2000.
Cai, W.: Estuarine and Coastal Ocean Carbon Paradox: CO2 Sinks or Sites of Terrestrial Carbon Incineration?, Annu. Rev. Mar. Sci., 3, 123–145, https://doi.org/10.1146/annurev-marine-120709-142723, 2011.
Camino-Serrano, M., Guenet, B., Luyssaert, S., Ciais, P., Bastrikov, V., De Vos, B., Gielen, B., Gleixner, G., Jornet-Puig, A., Kaiser, K., Kothawala, D., Lauerwald, R., Peñuelas, J., Schrumpf, M., Vicca, S., Vuichard, N., Walmsley, D., and Janssens, I. A.: ORCHIDEE-SOM: modeling soil organic carbon (SOC) and dissolved organic carbon (DOC) dynamics along vertical soil profiles in Europe, Geosci. Model Dev., 11, 937–957, https://doi.org/10.5194/gmd-11-937-2018, 2018.
Cole, J. J., Prairie, Y. T., Caraco, N. F., McDowell, W. H., Tranvik, L. J., Striegl, R. G., Duarte, C. M., Kortelainen, P., Downing, J. A., Middelburg, J. J., and Melack, J.: Plumbing the Global Carbon Cycle: Integrating Inland Waters into the Terrestrial Carbon Budget, Ecosystems, 10, 172–185, https://doi.org/10.1007/s10021-006-9013-8, 2007.
Dai, M., Yin, Z., Meng, F., Liu, Q., and Cai, W.-J.: Spatial distribution of riverine DOC inputs to the ocean: an updated global synthesis, Curr. Opin. Environ. Sustain., 4, 170–178, https://doi.org/10.1016/j.cosust.2012.03.003, 2012.
Drake, T. W., Raymond, P. A., and Spencer, R. G. M.: Terrestrial carbon inputs to inland waters: A current synthesis of estimates and uncertainty, Limnol. Oceanogr. Lett., 3, 132–142, https://doi.org/10.1002/lol2.10055, 2018.
Fabre, C., Sauvage, S., Probst, J.-L., and Sánchez-Pérez, J. M.: Global-scale daily riverine DOC fluxes from lands to the oceans with a generic model, Glob. Planet. Change, 194, 103294, https://doi.org/10.1016/j.gloplacha.2020.103294, 2020.
Futter, M. N., Butterfield, D., Cosby, B. J., Dillon, P. J., Wade, A. J., and Whitehead, P. G.: Modeling the mechanisms that control in-stream dissolved organic carbon dynamics in upland and forested catchments: MODELING SURFACE WATER DOC, Water Resour. Res., 43, W02424, https://doi.org/10.1029/2006WR004960, 2007.
Gerber, S., Hedin, L. O., Oppenheimer, M., Pacala, S. W., and Shevliakova, E.: Nitrogen cycling and feedbacks in a global dynamic land model, Global Biogeochem. Cy., 24, GB1001, https://doi.org/10.1029/2008GB003336, 2010.
Gommet, C., Lauerwald, R., Ciais, P., Guenet, B., Zhang, H., and Regnier, P.: Spatiotemporal patterns and drivers of terrestrial dissolved organic carbon (DOC) leaching into the European river network, Earth Syst. Dynam., 13, 393–418, https://doi.org/10.5194/esd-13-393-2022, 2022.
Hanasaki, N., Kanae, S., and Oki, T.: A reservoir operation scheme for global river routing models, J. Hydrol., 327, 22–41, https://doi.org/10.1016/j.jhydrol.2005.11.011, 2006.
Harrison, J. A., Caraco, N., and Seitzinger, S. P.: Global patterns and sources of dissolved organic matter export to the coastal zone: Results from a spatially explicit, global model: Global Dissolved Organic Matter Export, Global Biogeochem. Cy., 19, GB4S04, https://doi.org/10.1029/2005GB002480, 2005.
Janssens, I. A. and Pilegaard, K.: Large seasonal changes in Q10 of soil respiration in a beech forest: SHORT-TERM Q10 OF SOIL RESPIRATION, Glob. Change Biol., 9, 911–918, https://doi.org/10.1046/j.1365-2486.2003.00636.x, 2003.
Lawrence, D., Fisher, R., and Koven, C.: Technical Description of version 5.0 of the Community Land Model (CLM), NCAR, NCAR, Boulder, US, CO, National Center for Atmospheric Research, 2018.
Lehner, B., Liermann, C. R., Revenga, C., Vörösmarty, C., Fekete, B., Crouzet, P., Döll, P., Endejan, M., Frenken, K., Magome, J., Nilsson, C., Robertson, J. C., Rödel, R., Sindorf, N., and Wisser, D.: High-resolution mapping of the world's reservoirs and dams for sustainable river-flow management, Front. Ecol. Environ., 9, 494–502, https://doi.org/10.1890/100125, 2011.
Li, H., Wigmosta, M. S., Wu, H., Huang, M., Ke, Y., Coleman, A. M., and Leung, L. R.: A Physically Based Runoff Routing Model for Land Surface and Earth System Models, J. Hydrometeorol., 14, 808–828, https://doi.org/10.1175/JHM-D-12-015.1, 2013.
Li, M., Peng, C., Zhou, X., Yang, Y., Guo, Y., Shi, G., and Zhu, Q.: Modeling Global Riverine DOC Flux Dynamics From 1951 to 2015, J. Adv. Model. Earth Syst., 11, 514–530, https://doi.org/10.1029/2018MS001363, 2019.
Liao, C., Zhuang, Q., Leung, L. R., and Guo, L.: Quantifying Dissolved Organic Carbon Dynamics Using a Three-Dimensional Terrestrial Ecosystem Model at High Spatial-Temporal Resolutions, J. Adv. Model. Earth Syst., 11, 4489–4512, https://doi.org/10.1029/2019MS001792, 2019.
Liu, S., Xie, Z., Zeng, Y., Liu, B., Li, R., Wang, Y., Wang, L., Qin, P., Jia, B., and Xie, J.: Effects of anthropogenic nitrogen discharge on dissolved inorganic nitrogen transport in global rivers, Glob. Change Biol., 25, 1493–1513, https://doi.org/10.1111/gcb.14570, 2019.
Liu, S., Xie, Z., Liu, B., Wang, Y., Gao, J., Zeng, Y., Xie, J., Xie, Z., Jia, B., Qin, P., Li, R., Wang, L., and Chen, S.: Global river water warming due to climate change and anthropogenic heat emission, Glob. Planet. Change, 193, 103289, https://doi.org/10.1016/j.gloplacha.2020.103289, 2020.
Liu, S., Maavara, T., Brinkerhoff, C. B., and Raymond, P. A.: Global Controls on DOC Reaction Versus Export in Watersheds: A Damköhler Number Analysis, Global Biogeochem. Cy., 36, e2021GB007278, https://doi.org/10.1029/2021GB007278, 2022.
Ludwig, W., Probst, J.-L., and Kempe, S.: Predicting the oceanic input of organic carbon by continental erosion, Global Biogeochem. Cy., 10, 23–41, https://doi.org/10.1029/95GB02925, 1996.
Maavara, T., Lauerwald, R., Regnier, P., and Van Cappellen, P.: Global perturbation of organic carbon cycling by river damming, Nat. Commun., 8, 15347, https://doi.org/10.1038/ncomms15347, 2017.
Meybeck, M.: Carbon, nitrogen, and phosphorus transport by world rivers, Am. J. Sci., 282, 401–450, https://doi.org/10.2475/ajs.282.4.401, 1982.
Meybeck, M. and Ragu, A.: GEMS-GLORI world river discharge database, PANGAEA, https://doi.org/10.1594/PANGAEA.804574, 2012.
Neff, J. C. and Asner, G. P.: Dissolved Organic Carbon in Terrestrial Ecosystems: Synthesis and a Model, Ecosystems, 4, 29–48, https://doi.org/10.1007/s100210000058, 2001.
Oleson, K. W., Lawrence, D. M., and Bonan, G. B.: Technical Description of version 4.5 of the Community Land Model (CLM), NCAR, NCAR, Boulder, US, CO, National Center for Atmospheric Research, 2013.
Parton, W. J., Stewart, J. W. B., and Cole, C. V.: Dynamics of C, N, P and S in Grassland Soils: A Model, Biogeochemistry, 5, 109–131, https://doi.org/10.1007/BF02180320, 1988.
Regnier, P., Friedlingstein, P., Ciais, P., Mackenzie, F. T., Gruber, N., Janssens, I. A., Laruelle, G. G., Lauerwald, R., Luyssaert, S., Andersson, A. J., Arndt, S., Arnosti, C., Borges, A. V., Dale, A. W., Gallego-Sala, A., Goddéris, Y., Goossens, N., Hartmann, J., Heinze, C., Ilyina, T., Joos, F., LaRowe, D. E., Leifeld, J., Meysman, F. J. R., Munhoven, G., Raymond, P. A., Spahni, R., Suntharalingam, P., and Thullner, M.: Anthropogenic perturbation of the carbon fluxes from land to ocean, Nat. Geosci., 6, 597–607, https://doi.org/10.1038/ngeo1830, 2013.
Ren, W., Tian, H., Cai, W.-J., Lohrenz, S. E., Hopkinson, C. S., Huang, W.-J., Yang, J., Tao, B., Pan, S., and He, R.: Century-long increasing trend and variability of dissolved organic carbon export from the Mississippi River basin driven by natural and anthropogenic forcing: Export of DOC from the Mississippi River, Global Biogeochem. Cy., 30, 1288–1299, https://doi.org/10.1002/2016GB005395, 2016.
Seitzinger, S. P., Harrison, J. A., Dumont, E., Beusen, A. H. W., and Bouwman, A. F.: Sources and delivery of carbon, nitrogen, and phosphorus to the coastal zone: An overview of Global Nutrient Export from Watersheds (NEWS) models and their application, Global Biogeochem. Cy., 19, GB4S01, https://doi.org/10.1029/2005GB002606, 2005.
Siebert, S., Henrich, V., Frenken, K., and Burke, J.: Update of the digital global map of irrigation areas to version 5, Institute of Crop Science and Resource Conservation, University of Bonn, Germany, https://doi.org/10.13140/2.1.2660.6728, 2013.
Smith, S. V. and Hollibaugh, J. T.: Coastal metabolism and the oceanic organic carbon balance, Rev. Geophys., 31, 75–89, https://doi.org/10.1029/92RG02584, 1993.
Terrestrial Sciences Section (TSS): Climate and Global Dynamics Division (CGD) at the National Center for Atmospheric Research (NCAR), CESM Land Model Working Group, CESM Biogeochemistry Working Group [code], CLM5 (Community Land Model version 5.0), https://www.cesm.ucar.edu/models/clm (last access: 1 June 2021), 2019.
Tian, H., Yang, Q., Najjar, R. G., Ren, W., Friedrichs, M. A. M., Hopkinson, C. S., and Pan, S.: Anthropogenic and climatic influences on carbon fluxes from eastern North America to the Atlantic Ocean: A process-based modeling study, J. Geophys. Res.-Biogeo., 120, 757–772, https://doi.org/10.1002/2014JG002760, 2015.
Tranvik, L. J. and Jansson, M.: Terrestrial export of organic carbon, Nature, 415, 861–862, https://doi.org/10.1038/415861b, 2002.
Viovy, N.: CRUNCEP Version 7 – Atmospheric Forcing Data for the Community Land Model, Research Data Archive at the National Center for Atmospheric Research, Computational and Information Systems Laboratory, https://doi.org/10.5065/PZ8F-F017, 2018.
van Hoek, W. J., Wang, J., Vilmin, L., Beusen, A. H. W., Mogollón, J. M., Müller, G., Pika, P. A., Liu, X., Langeveld, J. J., Bouwman, A. F., and Middelburg, J. J.: Exploring Spatially Explicit Changes in Carbon Budgets of Global River Basins during the 20th Century, Environ. Sci. Technol., 55, 16757–16769, https://doi.org/10.1021/acs.est.1c04605, 2021.
van Vliet, M. T. H., Yearsley, J. R., Franssen, W. H. P., Ludwig, F., Haddeland, I., Lettenmaier, D. P., and Kabat, P.: Coupled daily streamflow and water temperature modelling in large river basins, Hydrol. Earth Syst. Sci., 16, 4303–4321, https://doi.org/10.5194/hess-16-4303-2012, 2012.
Wang, Y., Xie, Z., Liu, S., Wang, L., Li, R., Chen, S., Jia, B., Qin, P., and Xie, J.: Effects of Anthropogenic Disturbances and Climate Change on Riverine Dissolved Inorganic Nitrogen Transport, J. Adv. Model. Earth Syst., 12, e2020MS002234, https://doi.org/10.1029/2020MS002234, 2020.
Wu, H., Peng, C., Moore, T. R., Hua, D., Li, C., Zhu, Q., Peichl, M., Arain, M. A., and Guo, Z.: Modeling dissolved organic carbon in temperate forest soils: TRIPLEX-DOC model development and validation, Geosci. Model Dev., 7, 867–881, https://doi.org/10.5194/gmd-7-867-2014, 2014.
Xie, Z., Wang, L., Wang, Y., Liu, B., Li, R., Xie, J., Zeng, Y., Liu, S., Gao, J., Chen, S., Jia, B., and Qin, P.: Land Surface Model CAS-LSM: Model Description and Evaluation, J. Adv. Model. Earth Syst., 12, e2020MS002339, https://doi.org/10.1029/2020MS002339, 2020.
Yao, Y., Tian, H., Pan, S., Najjar, R. G., Friedrichs, M. A. M., Bian, Z., Li, H., and Hofmann, E. E.: Riverine Carbon Cycling Over the Past Century in the Mid-Atlantic Region of the United States, J. Geophys. Res.-Biogeo., 126, e2020JG005968, https://doi.org/10.1029/2020JG005968, 2021.
Yearsley, J.: A semi-Lagrangian water temperature model for advection-dominated river systems, Water Resour. Res., 45, W12405, https://doi.org/10.1029/2008WR007629, 2009.
Zeng, Y., Xie, Z., Yu, Y., Liu, S., Wang, L., Zou, J., Qin, P., and Jia, B.: Effects of anthropogenic water regulation and groundwater lateral flow on land processes, J. Adv. Model. Earth Syst., 8, 1106–1131, https://doi.org/10.1002/2016MS000646, 2016.
Zeng, Y., Xie, Z., and Zou, J.: Hydrologic and Climatic Responses to Global Anthropogenic Groundwater Extraction, J. Clim., 30, 71–90, https://doi.org/10.1175/JCLI-D-16-0209.1, 2017.
Zhang, Y.: The review of the research of the riverine organic carbon cycle, Journal of Henan Polytechnic University, Nat. Sci., 31, 344–351, https://doi.org/10.16186/j.cnki.1673-9787.2012.03.006, 2012.
Zou, J., Xie, Z., Yu, Y., Zhan, C., and Sun, Q.: Climatic responses to anthropogenic groundwater exploitation: a case study of the Haihe River Basin, Northern China, Clim. Dynam., 42, 2125–2145, https://doi.org/10.1007/s00382-013-1995-2, 2014.
Zou, J., Xie, Z., Zhan, C., Qin, P., Sun, Q., Jia, B., and Xia, J.: Effects of anthropogenic groundwater exploitation on land surface processes: A case study of the Haihe River Basin, northern China, J. Hydrol., 524, 625–641, https://doi.org/10.1016/j.jhydrol.2015.03.026, 2015.