the Creative Commons Attribution 4.0 License.
the Creative Commons Attribution 4.0 License.
 | 26 Apr 2023
Countries most exposed to individual and concurrent extremes and near-permanent extreme conditions at different global warming levels
Fulden Batibeniz
Mathias Hauser
Sonia Isabelle Seneviratne
It is now certain that human-induced climate change is increasing the incidence of extreme temperature, precipitation and drought events globally. A critical aspect of these extremes is their potential concurrency that can result in substantial impacts on society and environmental systems. Therefore, quantifying concurrent extremes in current and projected climate is necessary to take measures and adapt to future challenges associated with such conditions. Here we investigate changes in individual and concurrent extremes in multi-model simulations of the sixth phase of the Coupled Model Intercomparison Project (CMIP6) for different global warming levels (GWLs). We focus on the individual and simultaneous occurrence of the extreme events, encompassing heatwaves, droughts, maximum 1 d precipitation (Rx1day), and extreme wind (wind), as well as the compound events heatwave–drought and Rx1day–wind in the pre-industrial period (1850–1900; reference period), for approximately present conditions (+1 ∘C of global warming), and at three higher global warming levels (GWLs of +1.5, +2 and +3 ∘C). We focus our analysis on 139 countries and three climatic macro-regions: northern mid- and high-latitude countries (MHC), subtropical countries (STC), and tropical countries (TRC). We find that, on a global scale, most individual extremes become more frequent and affect more land area for higher GWLs. Changes in frequency of individual heatwaves, droughts, Rx1day and extreme wind with higher GWLs cause shifts in timing and disproportionate increases in frequency of concurrent events across different months and different regions. As a result, concurrent occurrences of the investigated extremes become 2.0 to 9.6 times more frequent at +3 ∘C of global warming compared to the pre-industrial period. At +3 ∘C the most dramatic increase is identified for concurrent heatwave–drought events, with a 9.6-times increase for MHC, an 8.4-times increase for STC and a 6.8-times increase for TRC compared to the pre-industrial period. By contrast, Rx1day–wind events increased the most in TRC (5.3 times), followed by STC (2.3 times) and MHC (2.0 times) at +3 ∘C with respect to the pre-industrial period. Based on the 2015 population, these frequency changes imply an increase in the number of concurrent heatwave–drought (Rx1day–wind) events per capita for 82 % (41 %) of countries. Our results also suggest that there are almost no time periods (on average 0 or only 1 month per year) without heatwaves, droughts, Rx1day and extreme wind for 21 countries at +1.5 ∘C of global warming, 37 countries at +2 ∘C and 85 countries at +3 ∘C, compared to 2 countries at +1 ∘C of global warming. This shows that a large number of countries will shift to near-permanent extreme conditions even at global warming levels consistent with the limits of the Paris Agreement. Given the projected disproportionate frequency increases and decreasing non-event months across GWLs, our results strongly emphasize the risks of uncurbed greenhouse gas emissions.
- Article
(6923 KB) - Full-text XML
- BibTeX
- EndNote


The socioeconomic impacts of individual and concurrent extremes are accelerating with increasing global warming (IPCC, 2021). The intervals between extremes are becoming shorter, which puts vulnerable communities and ecosystems at risk. In addition, while most countries are affected by climate extremes, some economies in the global south are more vulnerable than advanced economies in the Northern Hemisphere (Guo et al., 2021). These emerging challenges motivate the need for a comprehensive analysis of potential changes in exposure to individual and concurrent extremes on the population and country level.
Human-induced climate change is exacerbating climate extremes in every region across the globe (Seneviratne et al., 2021). This increase in climate extremes cannot be explained without human influence on the climate system and threatens both developed countries and developing countries. It is noteworthy that low-income and high-population countries have been the most affected by climate extremes in terms of economic and environmental fatalities during the last 2 decades (Eckstein et al., 2021). This indicates the inequity between CO2 high-emitter and low-emitter countries when dealing with climate-induced risks and impacts. Our motivation here is to provide a comprehensive assessment of potential changes in population exposure to climate extremes across countries with different climates.
Previous studies typically focus on current and/or projected changes of single extremes (Tebaldi et al., 2006; Orlowsky and Seneviratne, 2012; Alexander et al., 2006; Westra et al., 2013; Mondal and Mujumdar, 2015; Bao et al., 2017; Alizadeh et al., 2022), whereas recently there has been more attention on compound events – multiple extremes occurring either simultaneously and/or consecutively – due to the rising awareness about their potential amplified impacts (Seneviratne et al., 2010; Mazdiyasni and AghaKouchak, 2015; Forzieri et al., 2016; Zscheischler and Seneviratne, 2017; Vogel et al., 2017; Batibeniz et al., 2020a; Vogel et al., 2020; Saeed et al., 2021; Schwingshackl et al., 2021; Kelebek et al., 2021). The impacts associated with compound events are expected to be higher than impacts caused by individual extremes. For example, a combination of extreme wind and extreme precipitation can increase the destruction of infrastructure and economic losses. As climate change alters the nature of weather and climate events (extreme or not), compound events composed of these events are expected to be unprecedented in terms of severity and intensity (Seneviratne et al., 2021). This emerging understanding makes it necessary to quantify the projected changes in the characteristics of both individual and compound events.
A range of obstacles hinders a reliable estimation of the likelihood of compound events. Extreme events are rare by definition and compound extreme events even more so. Additionally, a robust understanding and detailed spatiotemporal information on exposure to multivariate extremes require high spatiotemporal coverage. This hinders the assessment of observation-based compound events. Therefore, large model ensembles (Champagne et al., 2020; Poschlod et al., 2020; Vogel et al., 2020; Ridder et al., 2021), process-based model simulations (Couasnon et al., 2020) and reanalysis data (Martius et al., 2016) can complement observational data. In particular, multi-GCM (global climate model) ensembles capture the uncertainty in the large-scale climate and can be a useful tool to investigate compound events in current and future climate.
In this study, we investigate the individual occurrences of heatwaves, droughts, extreme precipitation, and extreme wind, as well as concurrent heatwave–drought, and extreme precipitation and extreme wind events, all of which can have severe impacts on different sectors. The first combination – heatwave–drought – influences wildfire, crops, natural vegetation, power plants and fisheries (Zscheischler et al., 2020). The second combination – extreme wind and precipitation – can cause storm surges, flooding, and result in the destruction of infrastructure and damage to the economy. Several studies have found that heatwave–drought occurrences have increased in the last 4 to 5 decades (Schubert et al., 2014; Mazdiyasni and AghaKouchak, 2015; Sharma and Mujumdar, 2017; Zscheischler and Seneviratne, 2017; Kirono et al., 2017; Zhou and Liu, 2018; Hao et al., 2018; Sarhadi et al., 2018; Manning et al., 2019; Alizadeh et al., 2020; Feng et al., 2020; Kong et al., 2020; Li et al., 2020; Ridder et al., 2020; Mukherjee and Mishra, 2021; Wu et al., 2021) and are projected to increase in the future (Diffenbaugh et al., 2015; Herrera-Estrada and Sheffield, 2017; Sedlmeier et al., 2018; Li et al., 2019). This increase is mostly attributed to the increase in heatwave occurrences (Bevacqua et al., 2022). Indeed, even when droughts alone do not display an increasing tendency, compound occurrences of heatwave and drought events are expected to increase (Sarhadi et al., 2018; Yu and Zhai, 2020). Compound precipitation and wind extremes have also been investigated in the observational period over many regions including the Mediterranean Basin (Raveh-Rubin and Wernli, 2015), Europe (De Luca et al., 2020; Zscheischler et al., 2021), Great Britain (Tilloy et al., 2022) and at the global scale (Martius et al., 2016; Messmer and Simmonds, 2021). However, these studies differ in methodology, time and spatial scale, and future changes of precipitation–wind extremes have, to the best of our knowledge, not been covered in the compound event context or not been evaluated together with heatwave–drought events.
Here we analyse changes in frequency and timing of climate-induced individual and concurrent extreme events, as well as the population exposure to these events. It is important to note that for a risk assessment vulnerability would also have to be considered, but this lies beyond the scope of this study. Building on previous work on projected changes in compound extreme events and human exposure (Batibeniz et al., 2020a; Lange et al., 2020; Chen et al., 2020; Mukherjee et al., 2021; Liu et al., 2021; Alizadeh et al., 2022; Das et al., 2022; Shen et al., 2022), we investigate for the first time the human exposure to co-occurring extreme precipitation–wind events, in addition to co-occurring heatwave–drought events and individual extremes. We do so in a manner consistent with the Sixth Assessment Report of the Intergovernmental Panel on Climate Change (IPCC AR6) framework by analysing the projections for different global warming levels (GWLs, +1, +1.5, +2 and +3 ∘C) relative to pre-industrial conditions on country and regional scales.
2.1 Climate model data
We use CMIP6 simulations (Eyring et al., 2016) of 14 climate models to perform individual and concurrent event analysis in the pre-industrial period (1850–1900) and at four GWLs (see below) for the shared socioeconomic pathway (SSP) projection marking the high end of future forcing pathways (SSP5-8.5) (Jones and O'Neill, 2016, 2020). The SSP5-8.5 experiment represents high-mitigation and low-adaptation challenges resulting in radiative forcing of 8.5 W m−2 by the end of 2100. Because we present our results at GWLs we do not expect our results to strongly depend on the choice of the scenario (Seneviratne et al., 2016; Seneviratne and Hauser, 2020; Wartenburger et al., 2017). We use the same ensemble member (r1i1p1) of each model. We retrieve daily maximum temperature, precipitation, maximum wind, and soil moisture data from each model and use conservative remapping (Jones, 1999) to regrid them onto a common 2.5∘ × 2.5∘ longitude–latitude grid to enable comparison across different models. The full list of models is provided in Table A1 in Appendix A.
2.2 Population counts
In the population exposure analysis, we use gridded population counts retrieved from Gridded Population of the World version 4 (GPWv4) dataset (CIESIN, 2018). The GPWv4 dataset provides population distributions at various grid resolutions. For our analysis, we use the 1∘ resolution data which we transform into 2.5∘ grid resolution to match the resolution of the climate data. GPWv4 data are available for the period from 2000 to 2020 at 5-year intervals. However, we only use 2015 population counts in this paper as they are representative of the world population at +1 ∘C of global warming. To investigate the effect of climate change, we keep the population fixed at 2015 levels for approximately +1 ∘C of global warming while allowing the counts of climate events to change at GWLs. This approach enables us to examine the cause–effect relationship between increasing temperatures and projected changes in extreme events. Furthermore, using climate change projections and population distributions in combination allows us to investigate changes in the exposure to climate extremes at the regional and country levels.
2.3 Climate regions
We focus our analysis on three climatic macro-regions: northern mid- and high-latitude countries (MHC), subtropical countries (STC), and tropical countries (TRC) (Fig. 1). These climate regions are created by aggregating country polygons. The assessments are performed and presented on a regional scale and country scale to emphasize the response of different climatic regions and countries to individual and concurrent extremes. We show results for climate regions in Figs. 3–5 and on the country level in Figs. 6–8.
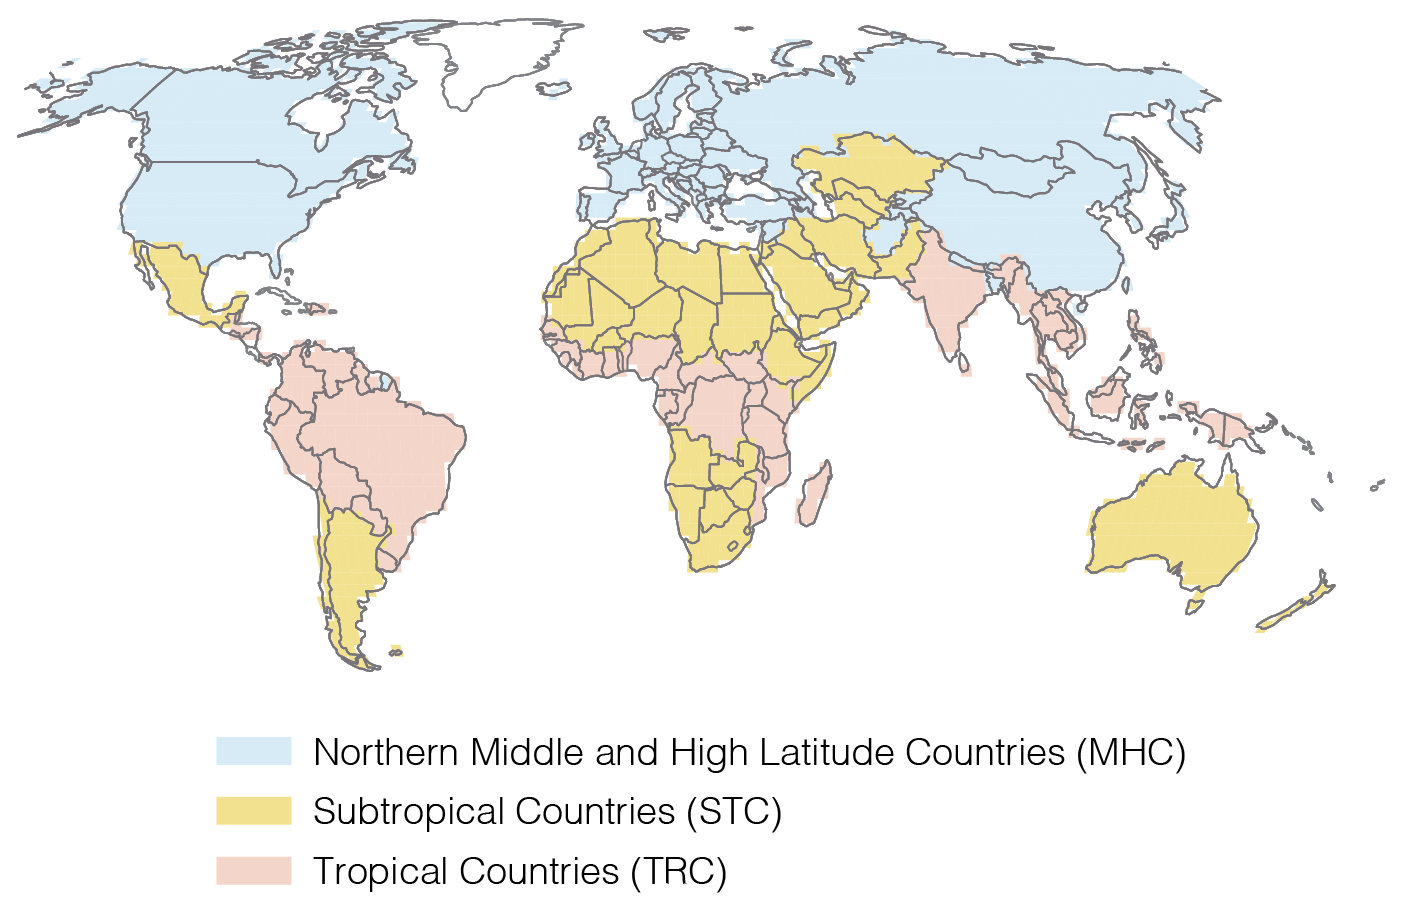
Figure 1World map is divided into three climatic macro-regions: northern mid- and high-latitude countries (MHC), subtropical countries (STC), and tropical countries (TRC).
2.4 Global temperature and warming level calculation
We perform our analysis considering +1, +1.5, +2 and +3 ∘C global warming levels to be consistent with the IPCC AR6 context (Seneviratne et al., 2021). Warming levels are 20-year periods unique to each model due to different climate sensitivity and internal variability. The warming levels are defined as the first 20-year period where global mean temperature anomalies exceed the given temperature (e.g. +2 ∘C). We first calculate the annual average global temperature (Fig. 2a). Then, we subtract the average global temperature of the pre-industrial period (1850–1900; reference period) from every year between 1850–2100 and take the 20-year running mean (Fig. 2b). The first year a certain anomaly such as +1, +1.5, +2 and +3 ∘C is exceeded is the central year of the warming level period, and the warming level period is obtained by subtracting 10 and adding 9 to the central year (Fig. 2b, c; horizontal bars). For example, IPSL-CM6A-LR first exceeds +2 ∘C of warming in 2036, so the period selected for this model is 2025–2044 (Fig. 2c, red bar). On the other hand, MRI-ESM2-0 reaches +2 ∘C of warming in 2040, and the period selected is 2029–2048 (Fig. 2c, orange bar).
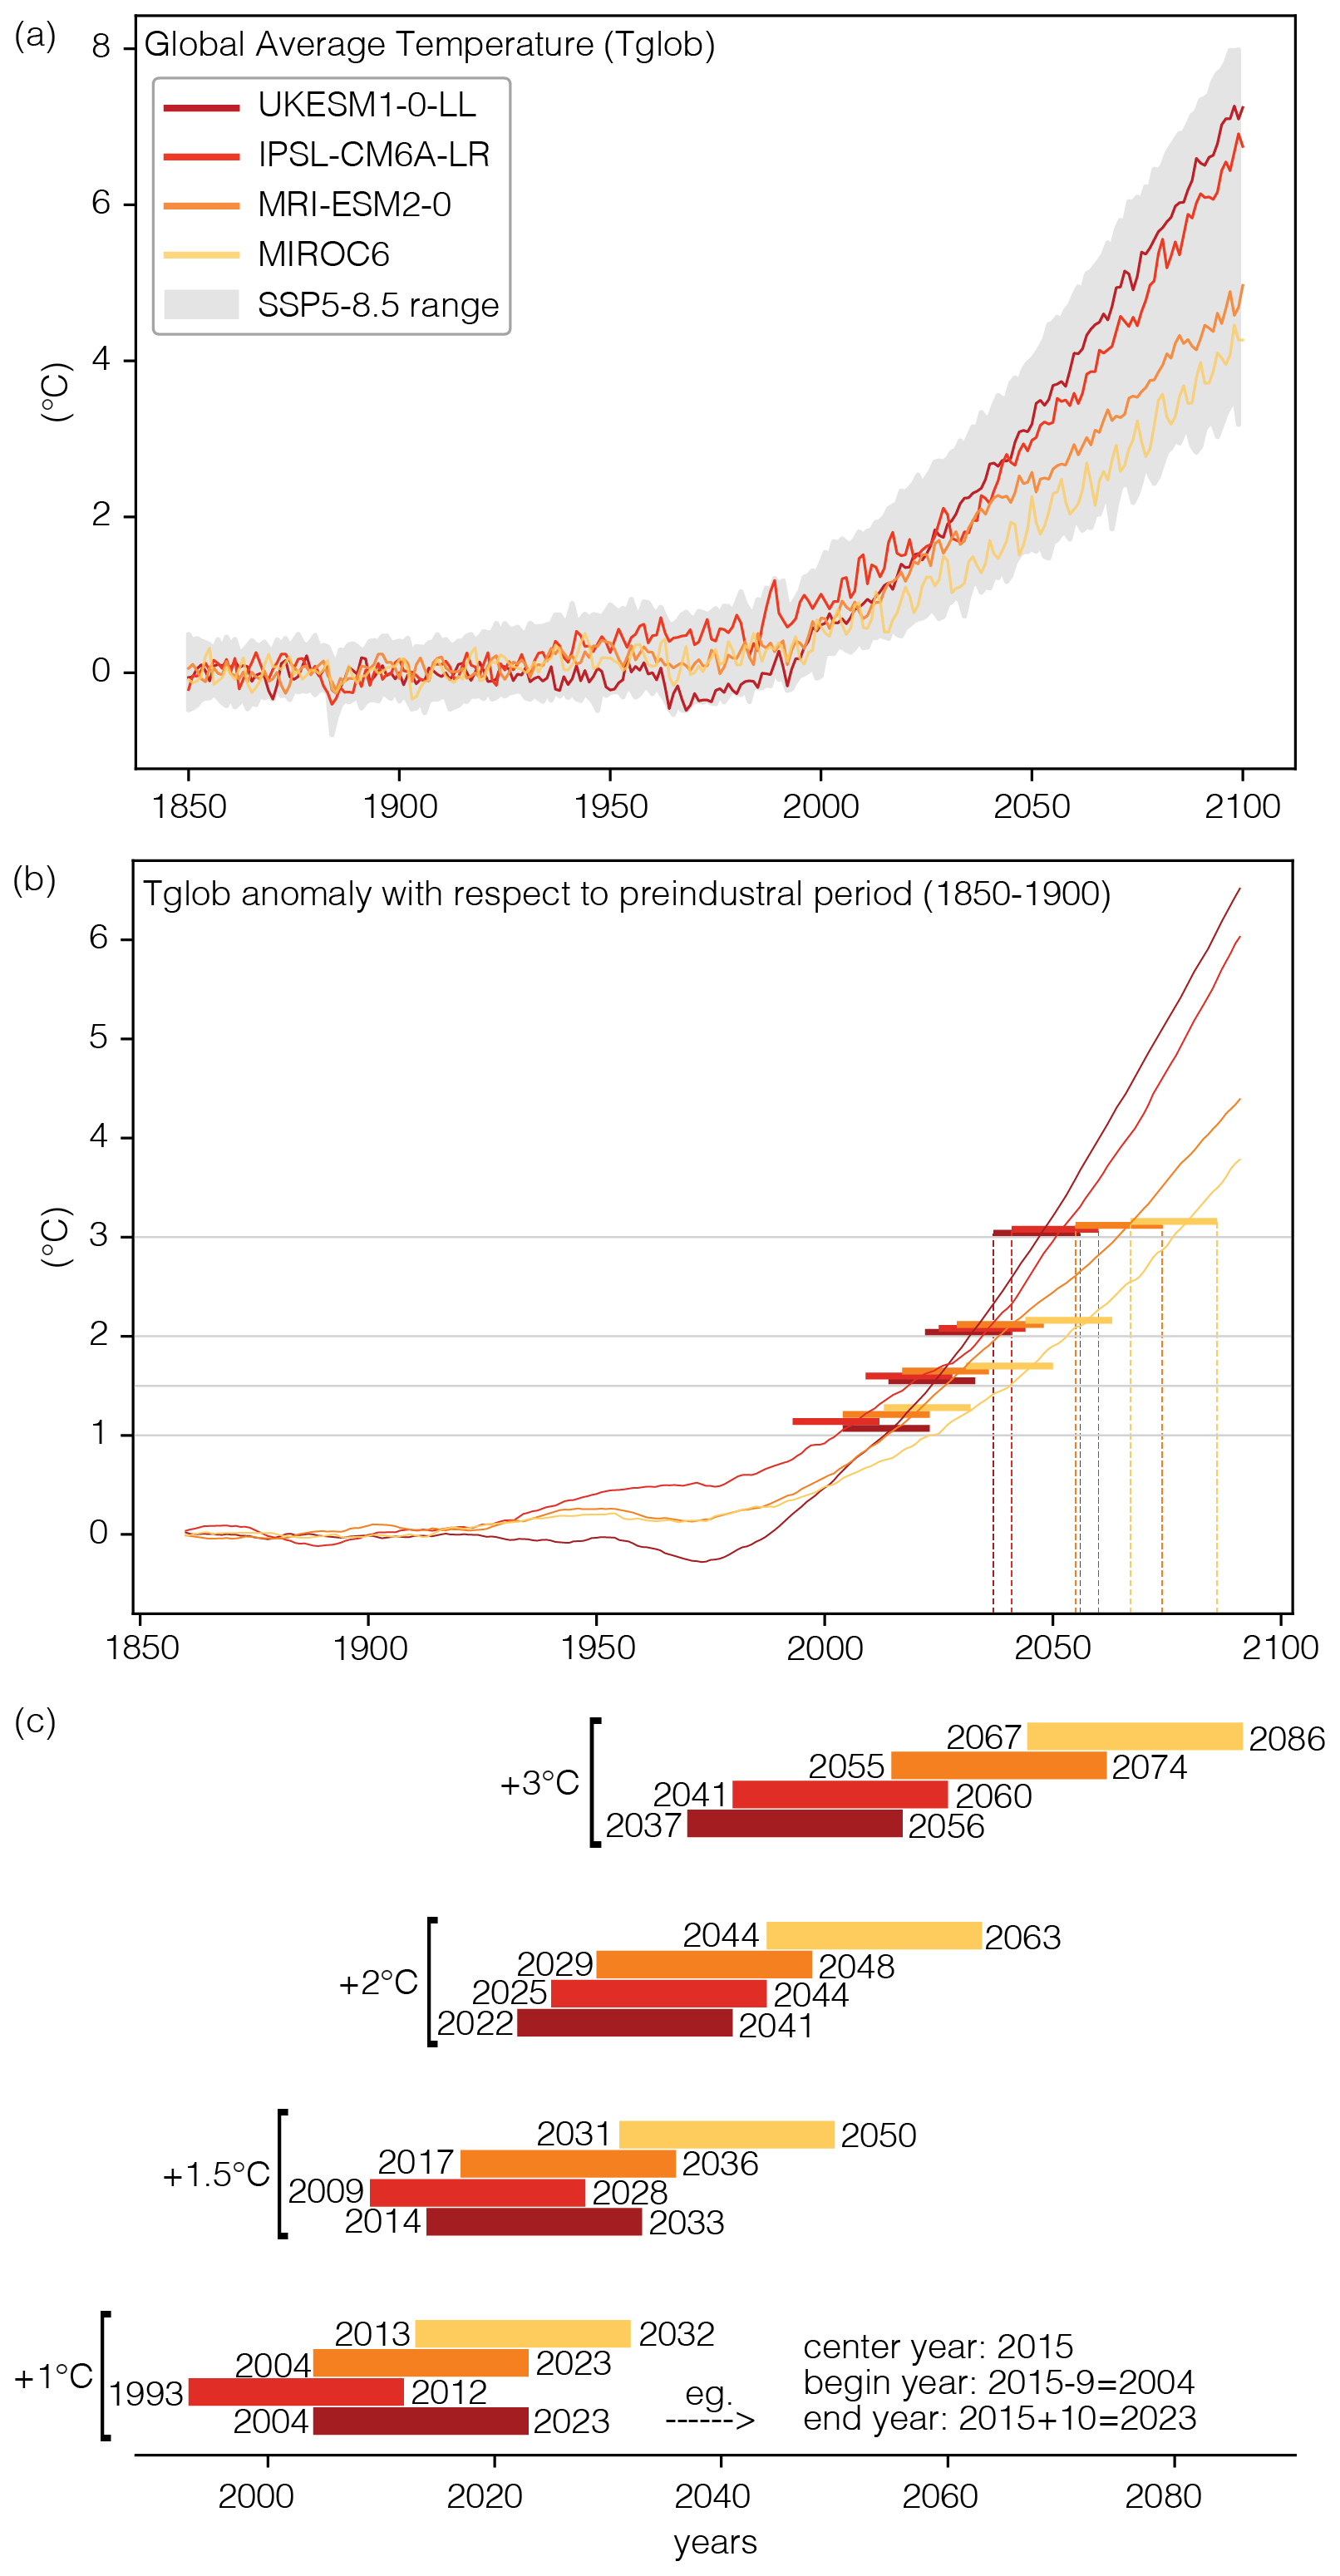
Figure 2Global warming level calculation steps. (a) Global average temperature for four example models under SSP5-8.5 scenario. Coloured lines refer to four models, and the shaded grey area refers to the spread of temperature variability in all SSP5-8.5 CMIP6 models. (b) The 20-year running average of temperature anomaly with respect to the pre-industrial period. Horizontal bars represent warming level periods (+1, +1.5, +2, +3 ∘C) for each model and are shifted vertically to ease understanding. (c) Zoomed version of bars (warming level periods) in panel (b) to show corresponding years.
2.5 Definition of individual events
For our analysis, we calculate heatwaves, drought, heavy precipitation and extreme wind events empirically. For each model, we define extreme events based on their occurrences below (above) the 10th (90th) percentile during the pre-industrial period with a bootstrap resampling procedure (Sect. 2.7 for details). All the calculations are performed on the 2.5∘ × 2.5∘ grid for daily values. The daily events are then aggregated to a monthly timescale, such that a month with one or more daily events is marked an “event month” and otherwise as a “non-event month”.
Heatwave. We use daily maximum temperature to determine heatwave events. We first calculate the 90th percentile for each calendar day using a 31 d moving window over the pre-industrial period with a bootstrap resampling procedure. We then identify a day as a heatwave event if the daily maximum temperature exceeds the daily 90th percentile for at least 3 consecutive days.
Drought. We compute drought using daily soil moisture data. We use soil moisture to define drought events because it directly represents water availability, in contrast to many other measures (e.g. the standardized precipitation index, SPI) that are based on precipitation scarcity (Seneviratne et al., 2010). We first normalize soil moisture by subtracting the mean of each month and dividing it by its standard deviation over the pre-industrial period. We then compute the 10th percentile for each calendar day using a 31 d moving window over the pre-industrial period as in heatwave calculation. The day is then defined as a drought event if it falls below its 10th percentile.
Rx1day. We use daily precipitation to calculate monthly maximum 1 d precipitation events. We find the maximum 1 d precipitation of each month in the pre-industrial period and define the 90th percentile for each calendar month. Heavy precipitation events are then defined as the days where precipitation is above the monthly threshold.
Extreme wind. We use maximum daily wind speed to calculate extreme wind. For the 90th-percentile calculation we use monthly maximum wind speeds in the pre-industrial period. Extreme wind speed days are then defined as days where daily wind speed is above the 90th percentile.
2.6 Definition of concurrent events
We define concurrent events as events that occur on the same day in a month and affect the same location. We assess two types of concurrent events: combined heatwave and drought events as well as Rx1day and extreme wind events. Thus, if a specific month experiences two individual events on the same day, it is marked as an “event month” for that grid cell and month. For example, if there is a drought event occurring on the same days with a heatwave event regardless of the number of concurrent events, we mark that month as an “event month” and otherwise as a “non-event month”.
2.7 Bootstrap resampling procedure
Percentile-based indices for climate change detection may create artificial jumps at the beginning and end of the reference period (Zhang et al., 2005). These discontinuities can lead to an artificial frequency increase outside the reference period. Therefore, we used the bootstrap resampling procedure proposed by Zhang et al. (2005) to overcome this problem. From the 51-year reference period we consecutively excluded 1 year and included 1 random year from the remaining years in which the thresholds are estimated. The threshold we found from every iteration is used on the excluded year. Fifty-one thresholds obtained from bootstrap resampling procedures are then averaged and used for the future period. Applying this procedure improved our results in terms of inhomogeneities occurring outside the reference period for heatwave, Rx1day and extreme wind; however, it did not affect the drought frequencies. Nevertheless, we used this approach to estimate the thresholds of all extreme indices to be consistent methodologically. We refer readers to Zhang et al. (2005) for detailed information about the bootstrap resampling procedure.
3.1 Future changes in individual and concurrent extremes over the climate regions
We illustrate the development of the investigated events with the help of Venn diagrams, which allow us to analyse the frequencies of individual, isolated and concurrent exceedances at the same time. We visualize the individual events by circles and their concurrency by the intersection of these circles. Given two event types A and B, the three numbers on the sets represent the frequencies of an isolated first event (A − (A∩B)), a concurrent event (A∩B) and an isolated second event (B − (A∩B)) in percentage. The two numbers over the sets show the individual event shares of the first (A) and second (B) event, respectively. The displayed results represent the regional and multi-model mean. The reason we illustrate the mean instead of a median is to avoid showing different shares from different models for each set. We thereby focus on three continental climate regions (MHC, STC and TRC) for pre-industrial, current (+1 ∘C) and future climate (+1.5, +2 and +3 ∘C) (Fig. 3a, b).
At the current warming level, the isolated heatwave frequency more than doubled compared to pre-industrial levels in MHC (2.1 times more compared to pre-industrial levels) and STC (2.6), and it quadrupled in TRC (4.4) (Table 1). The event fraction at +3 ∘C and the acceleration of the increase across warming levels in isolated heatwave events are the most in TRC (55.3 %, 7.5 times more compared to pre-industrial levels). Isolated drought events, on the other hand, tend to decrease for higher GWLs in all regions. This is mostly because drought events that occur together with heatwave events increase with higher GWLs. Concurrent heatwave and drought events are projected to increase in all climate regions with higher GWLs. At the current GWL, the number of concurrent events is estimated to occur about ∼ 3 times more frequently for MHC and TRC and 4.6 times more frequently for STC compared to the pre-industrial period. The strongest increase across the warming levels occurs for MHC (9.6) and STC (8.4) followed by TRC (6.8). The event fraction at +3 ∘C is similar in MHC and STC (24.0 % and 23.6 %) and greater in TRC (33.2 %); however, the proportional increase is the strongest in MHC compared to pre-industrial levels.
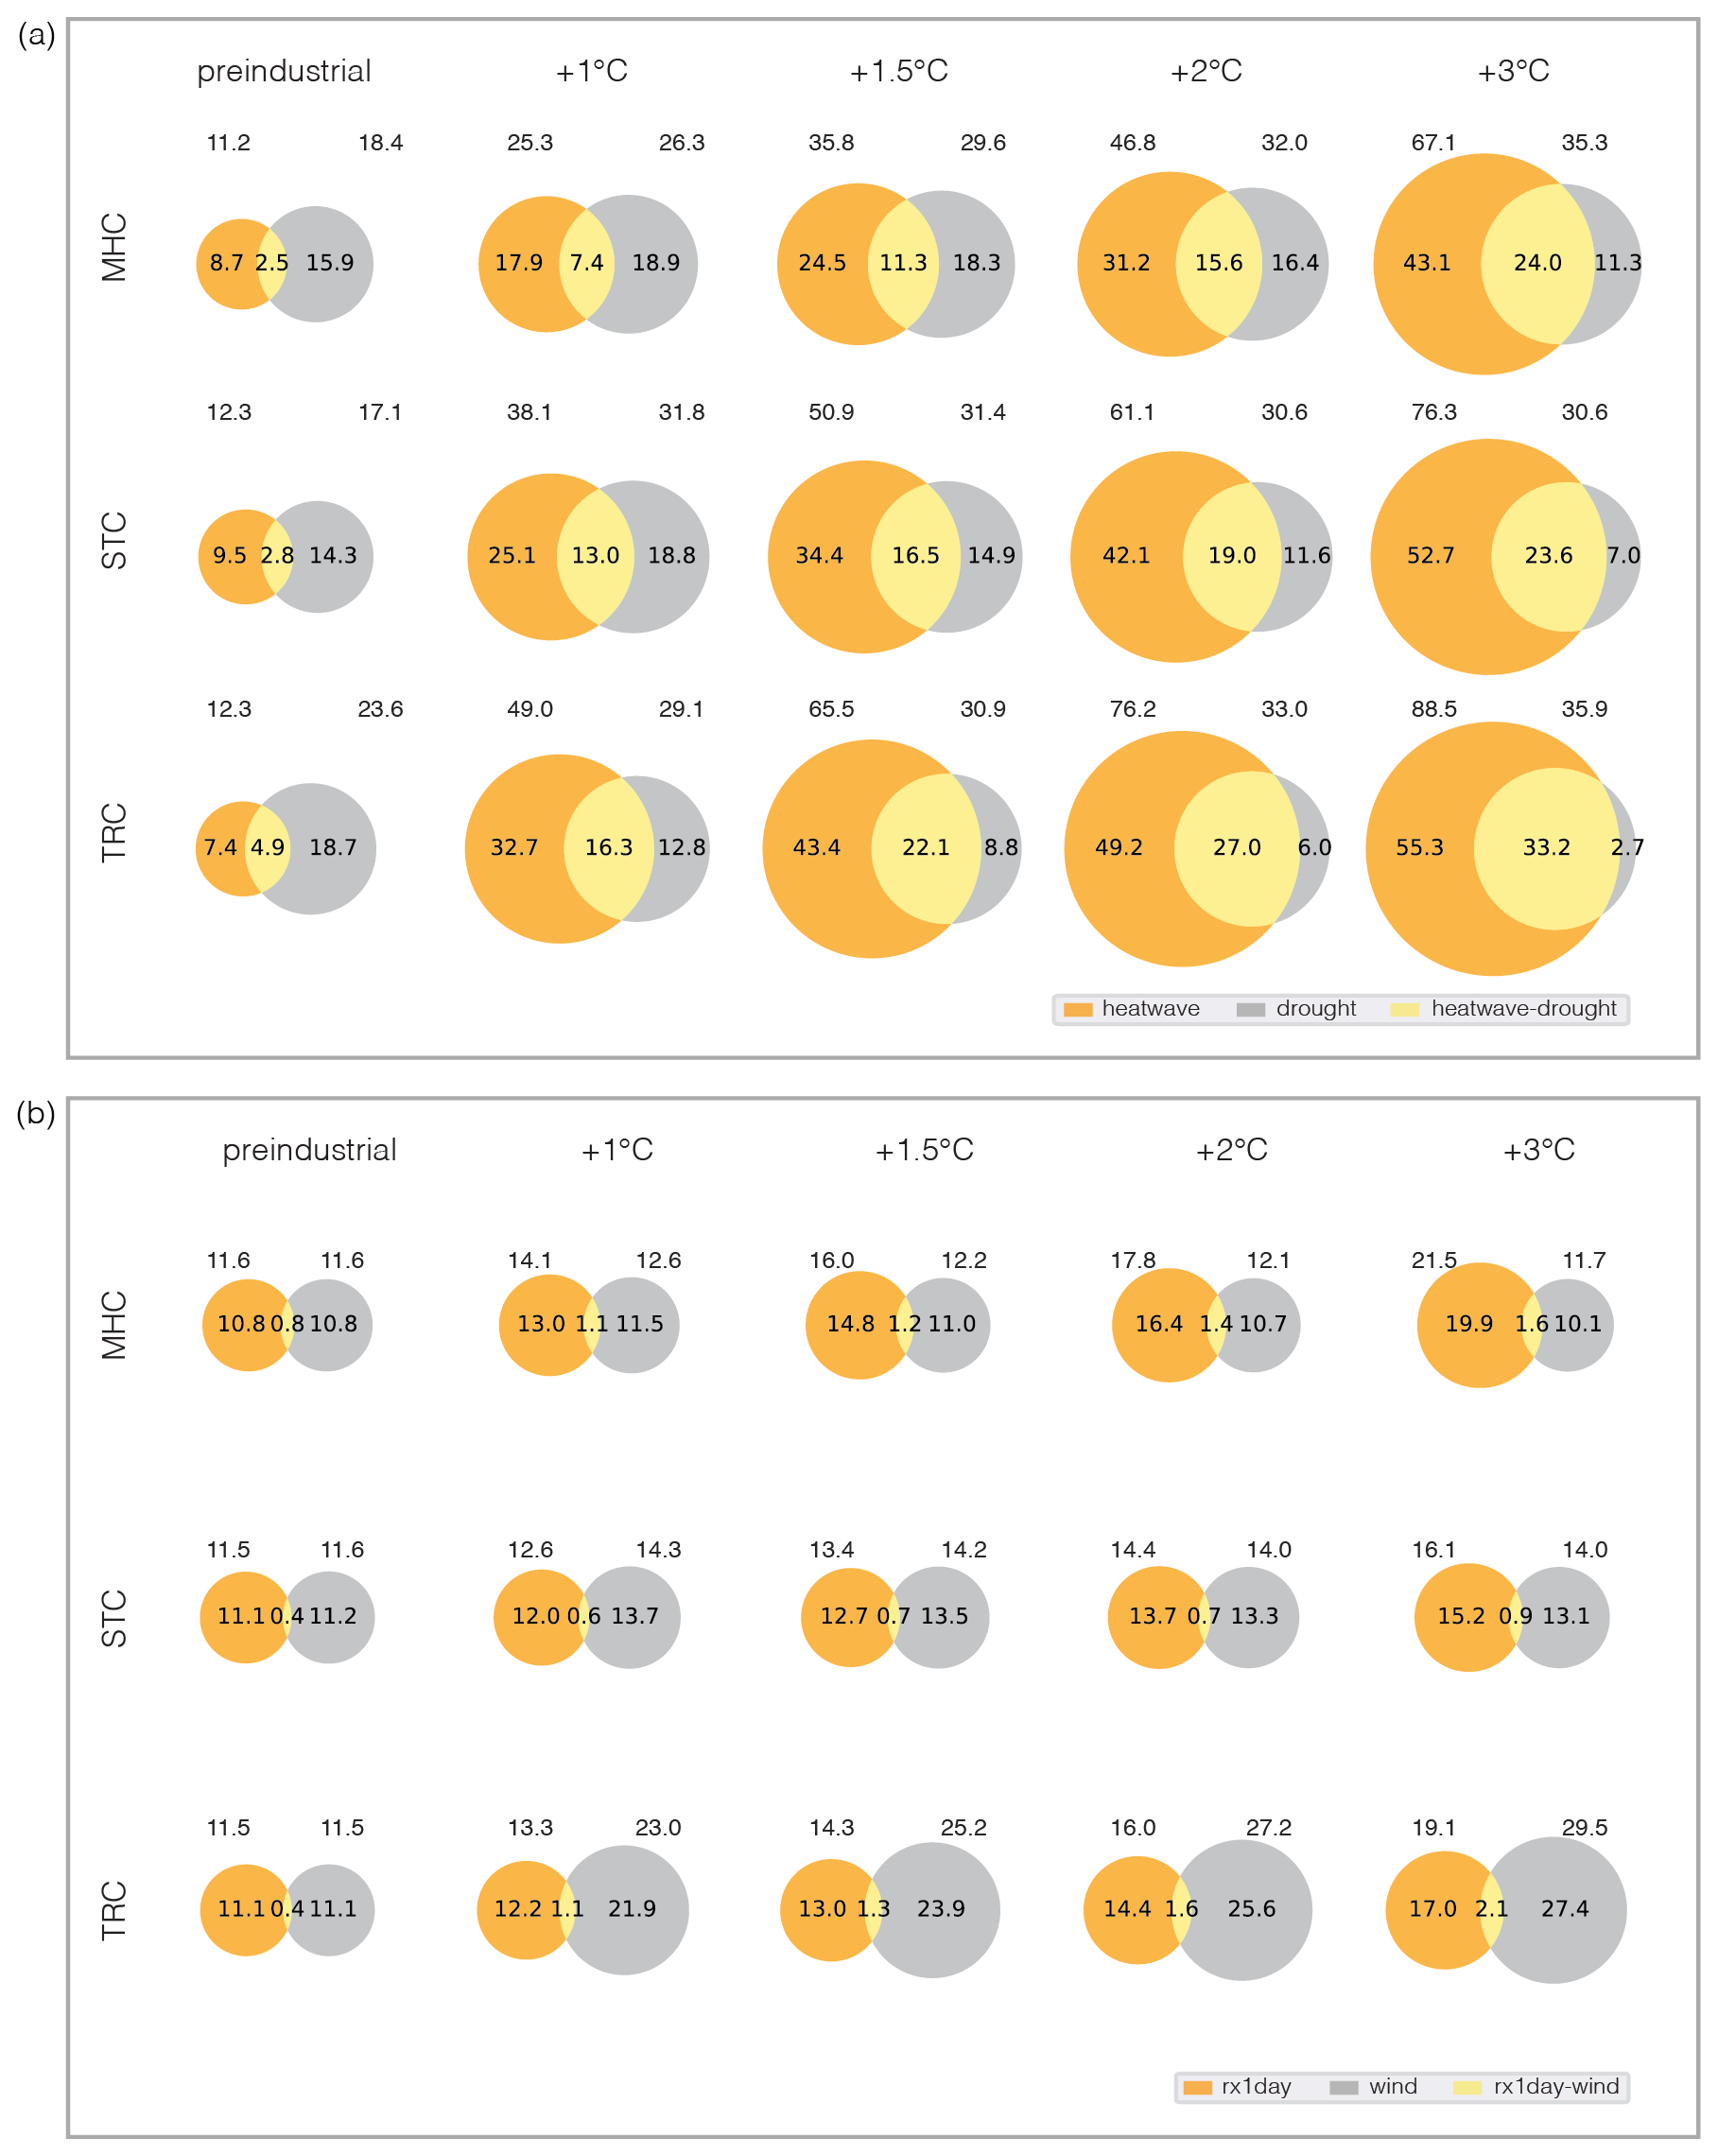
Figure 3Venn diagrams of (a) heatwave–drought and (b) Rx1day–wind storm events at global warming levels. The values show the individual and concurrent frequency of events in MHC, STC and TRC in the pre-industrial period and at +1, +1.5, +2 and +3 ∘C GWLs. Areas of the circles are proportional to the frequencies ( %) and represent the multi-model mean. The numbers above the Venn diagrams represent the total share of individual events including the ones occurring during concurrent events.
Table 1Increase in isolated and concurrent events at global warming levels relative to pre-industrial levels. Heatwave is denoted by ”hw”.
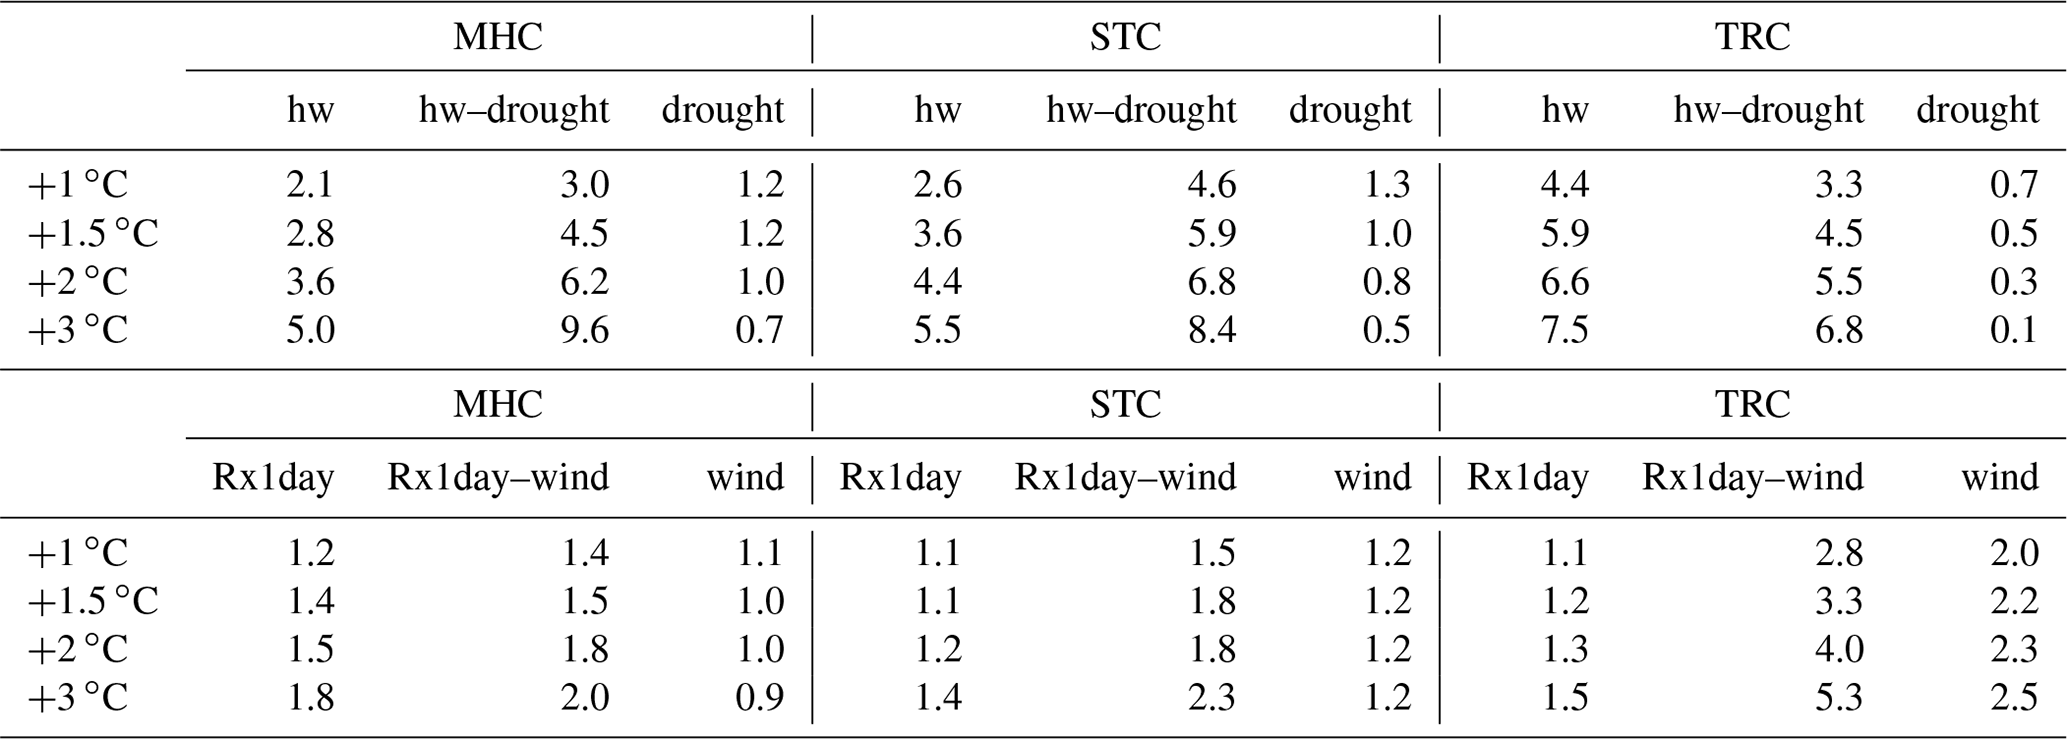
In Fig. 3b, we show Rx1day and wind events. The most dramatic increase in isolated and individual Rx1day events is detected in MHC. The frequency of isolated Rx1day events gradually increases across the warming levels by a factor of 1.2, 1.4, 1.5 and 1.8 for +1, +1.5, +2 and +3 ∘C with respect to pre-industrial levels. The hotspot for isolated wind events is TRC. The increase reaches 2.0 times at the +1 ∘C GWL and continues to increase to 2.2, 2.3 and 2.5 for +1.5, +2 and +3 ∘C. For MHC and STC, isolated and individual wind events show an increasing tendency up to +1 ∘C and start to decrease at +1.5, +2 and +3 ∘C. On the other hand, concurrent Rx1day and wind events are already ∼ 1.5 times the pre-industrial levels at +1 ∘C of warming and are projected to increase further for the +3 ∘C GWL. Even though the percentage of concurrent events is smaller compared to isolated and individual events, the relative increase is larger across warming levels. Concurrent Rx1day–wind event fractions are projected to increase 5.3 times for TRC, 2.3 times for STC and 2.0 times for MHC at the +3 ∘C GWL.
3.2 Timing of individual and concurrent extremes
To gain further insight info future individual and concurrent extremes across the climate regions, we now focus on their frequency and timing for each calendar month under pre-industrial conditions and at GWLs (Figs. 4 and 5). Again, we first consider heatwave and drought events (Fig. 4). As expected, heatwaves increase strongly with global warming (Fig. 4, top row). At +1 ∘C of global warming, the associated changes are already far beyond the conditions from pre-industrial levels and show further gradual increase across the global warming levels. The increase in heatwaves are heterogeneous across months. This unequal distribution leads to much larger increases in some months than suggested by the annual average (Fig. 3). The increase is especially inhomogeneous for MHC. At +1 ∘C of global warming, heatwave events occur mostly in summer. However, for higher GWLs there is a sharp increase for most months especially July and August. In STC and TRC, the increase across warming levels is more homogenous, with a slight shift towards June, July and August in STC.
Due to its less variable structure in time, drought indicates a more continuous increase across months for all regions (Fig. 4, middle row). The most dramatic increase of drought is observed for summer months in MHC, while STC and TRC show a relatively homogenous increase over the months. Interestingly, STC sees a small decrease in individual drought events in most months for +3 ∘C of warming.
The development of concurrent heatwave–drought events is not simply the combination of the individual events (Fig. 4, bottom row). They also show a general increase which, however, has some distinct features. The pattern in MHC is especially interesting: the months from June to October indicate a sharp increase, in contrast to the winter months. For STC, the frequency increase is maximum in September for +3 ∘C of warming. With higher GWLs there is a shift in timing of the highest values from summer to autumn months. While it is at its highest in July for +1 ∘C of global warming, it is at its highest in August for +3 ∘C of global warming. In the case of TRC, there is also a shift in the timing of the maximum frequency of heatwave–drought events. For +1 ∘C of warming May shows the highest value, whereas for +3 ∘C of warming June stands out. We observe highest frequency increases in summer and autumn months with respect to pre-industrial levels.
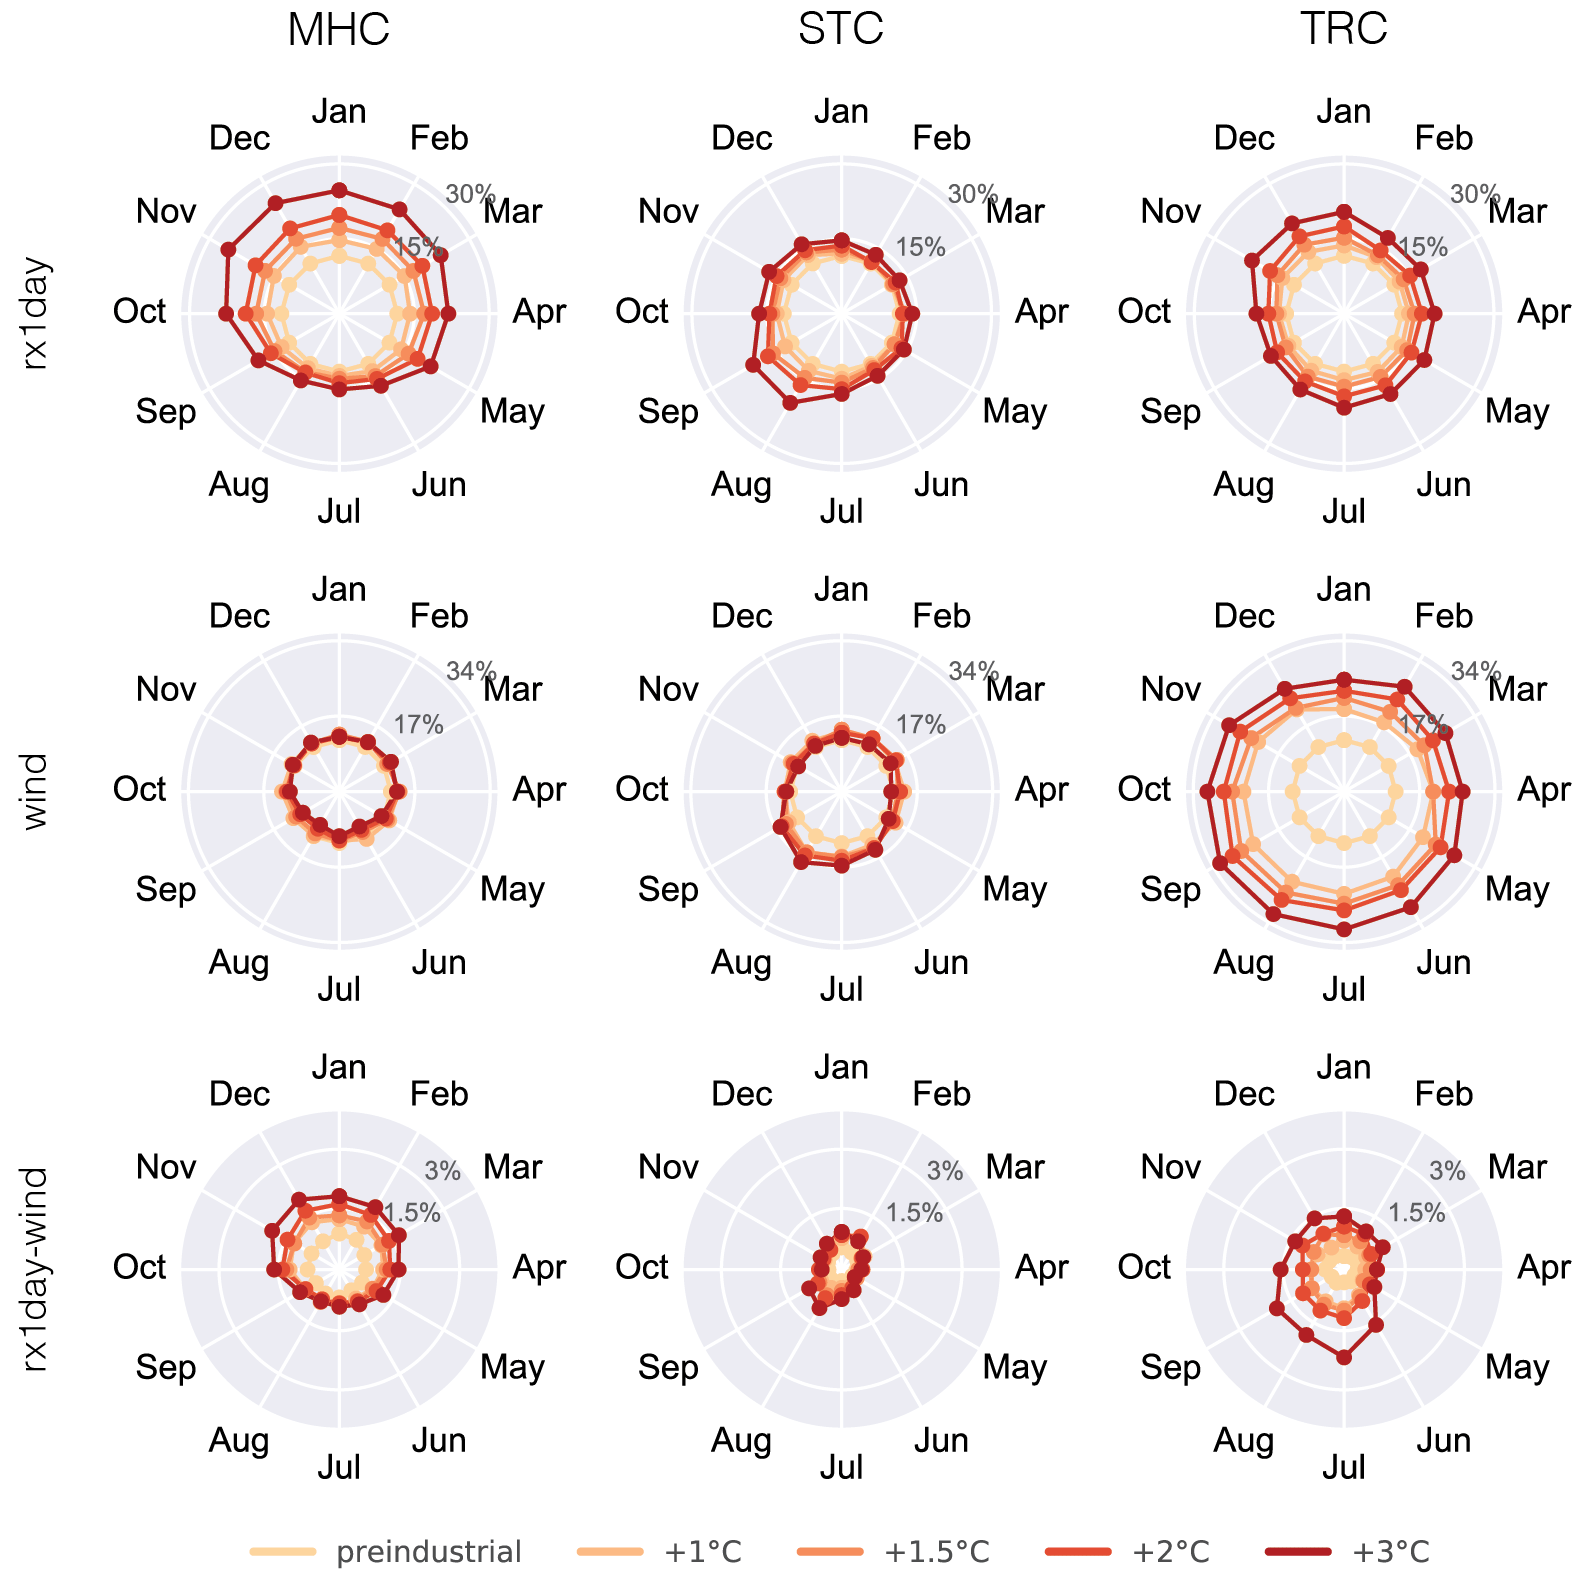
The Rx1day, wind and Rx1day–wind events mostly indicate an increase across all months and warming levels (Fig. 5). However, in some regions it is not uniform across months. Individual occurrences of Rx1day events are on the rise across the GWLs and regions. At +3 ∘C of global warming, MHC indicates the highest increase in months between October and May. The increase is more homogenous for STC and TRC. Nonetheless, events seem to increase the most in August and September for STC and November for TRC for the highest GWL. Wind extremes vary more compared to Rx1day events across the regions. The most dramatic increase is identified in TRC from June to November. The second-highest increase in frequency is observed for STC followed by MHC. However, it is interesting to note that for STC while the months between June and September indicate an increase, the rest of the months indicate a decrease with higher GWLs. Additionally, the highest frequency in extreme wind is observed in August. These increases in individual event frequencies lead to a difference among the regions for concurrent Rx1day–wind events. While there is an increase in winter and spring for MHC, there is an increase in July for STC and all months but especially June to October in TRC.
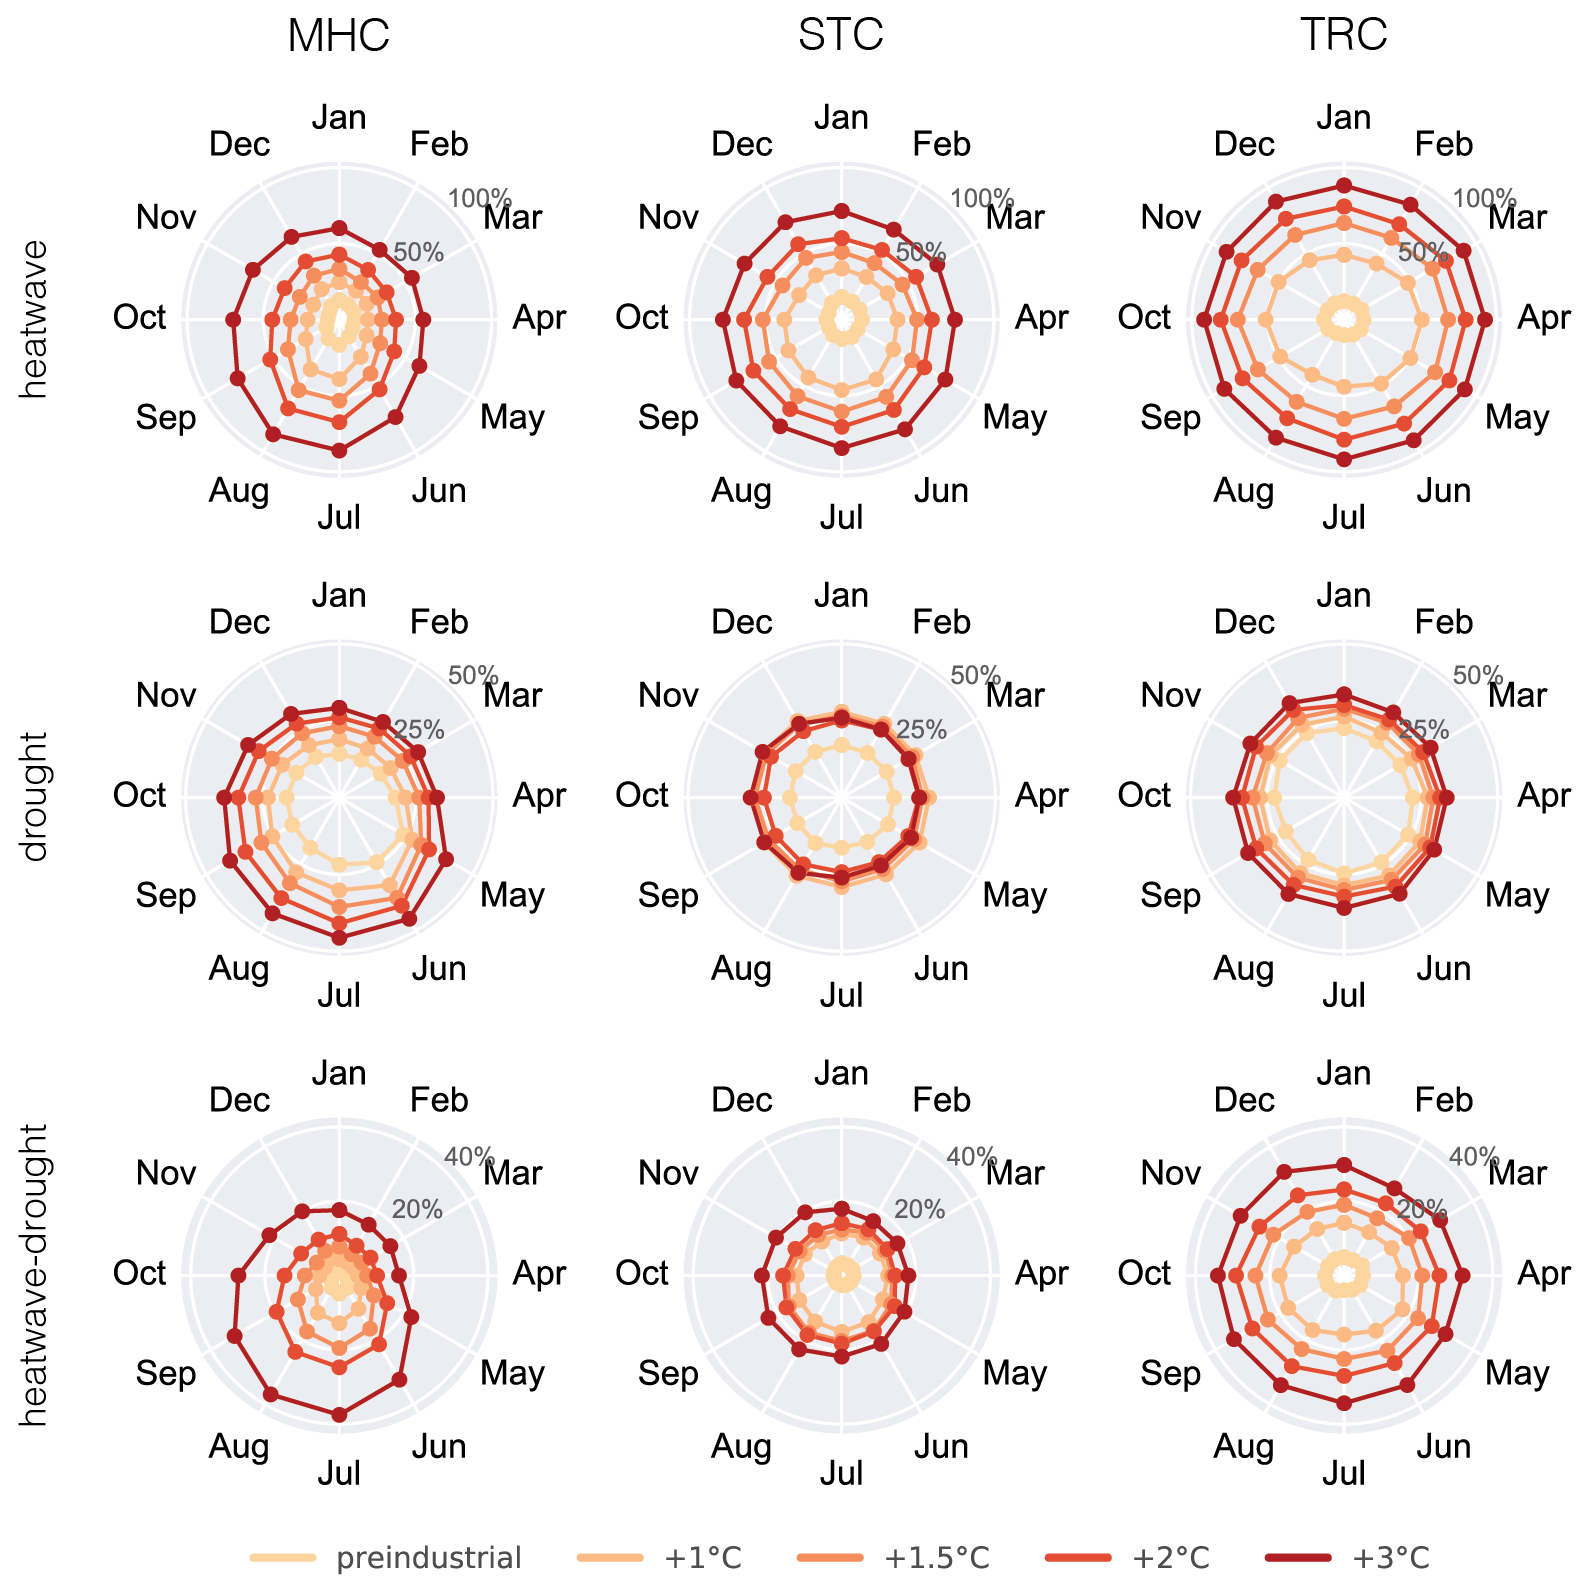
Figure 4Timing and frequency of heatwave, drought and concurrent heatwave–drought events in MHC, STC and TRC at the pre-industrial period and at +1, +1.5, +2 and +3 ∘C global warming levels in percent.
3.3 Hotspots of changes in individual and concurrent extremes
This section presents the potential hotspots that are prone to an increase in exposure to multiple hazards in a future climate (Fig. 6). We performed this analysis for the four individual event types (Fig. 6, part [a]) and the two concurrent event types (Fig. 6, part [b]) at GWLs. The first row shows how many of the event types increased at least 20 % relative to the pre-industrial period, and the second row shows how many of the event types increased at least 100 % (i.e. a doubling of the event frequency).
Considering the individual extremes with the lower threshold (20 %; Fig. 6, part [a], top row), two out of four individual extremes show increase across almost the entire globe – even at a GWL of +1 ∘C. There are three countries that show an increase in all extremes at the +3 ∘C GWL, namely Mali, Colombia and Peru. Many countries, including most of the South American countries, European countries, the United States, Canada, China, and some countries in central, west and south Africa, display a change in three individual extremes at the +3 ∘C GWL (Fig. 6, part [a], and Fig. B1, part [a], in Appendix B). For the higher threshold and +1 ∘C of global warming, two out of four individual events already doubled pre-industrial levels for countries in north and north-eastern South America and countries located in the south of the Mediterranean Sea. This increase is projected to continue and affect more land area for higher GWLs. The most prominent hotspots of change are Ghana, the Republic of the Congo, Cameroon, Ecuador, Venezuela, Belize, Nicaragua, Guyana and Colombia, where the common driver is the heatwave events (Fig. 6, part [a], and Fig. B1, part [a]).
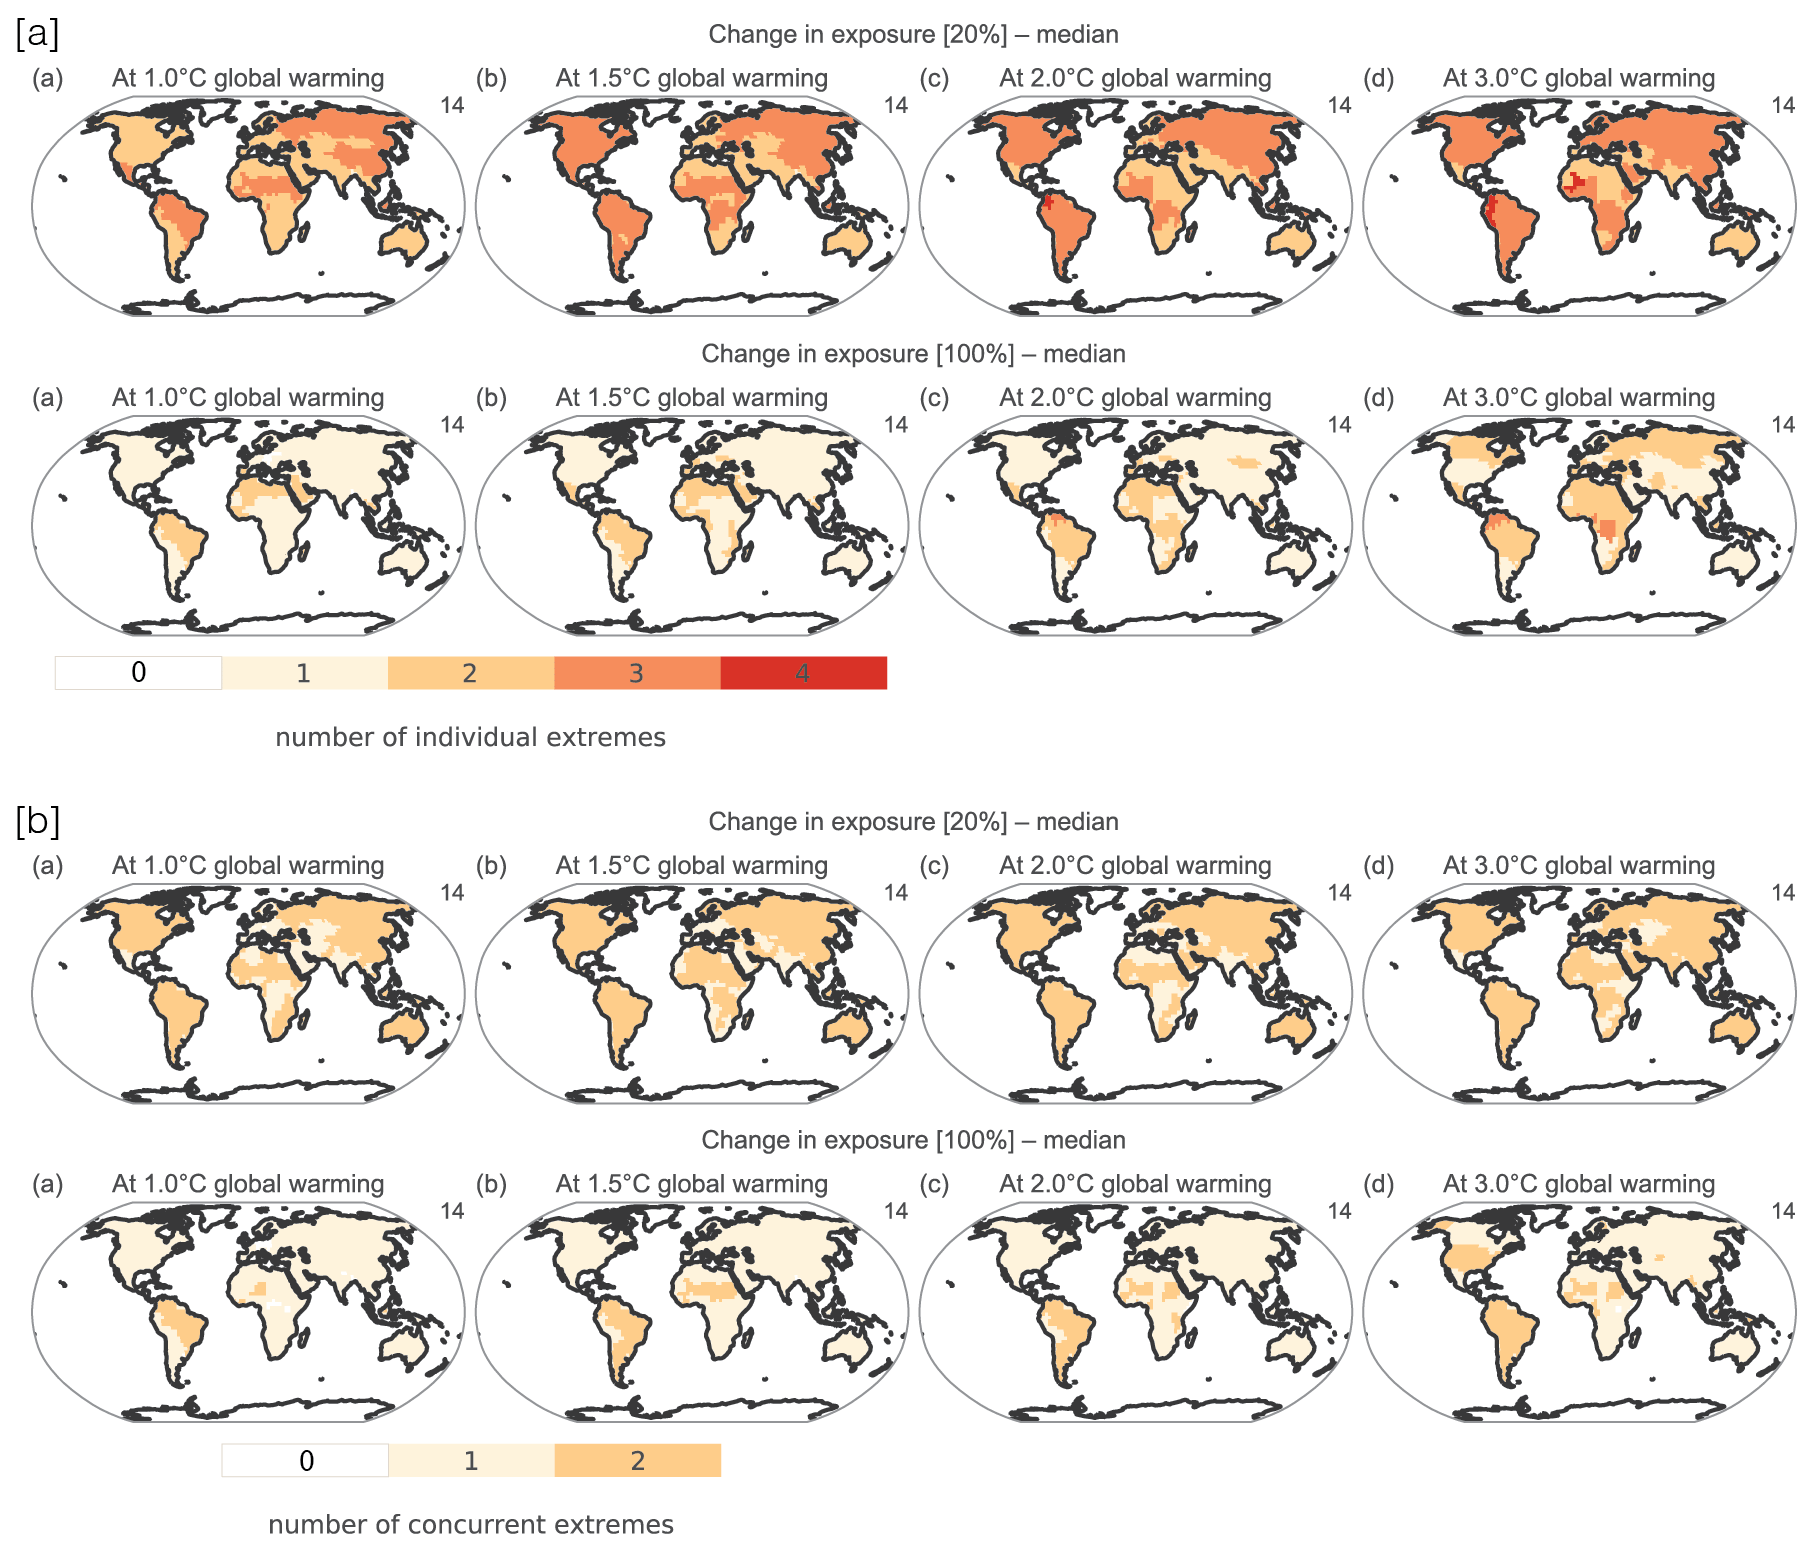
Figure 6[a] Countries exposed to an increase in the event frequency for one, two, three or four individual extremes (heatwave, drought, Rx1day, wind) with relative increases over 20 % (top row) and 100 % (bottom row) with respect to the pre-industrial period. [b] Countries exposed to 1 or 2 concurrent extremes (heatwave–drought, Rx1day–wind) with relative increases over 20 % (top row) and 100 % (bottom row) with respect to the pre-industrial period.
Both concurrent extreme pairs display a 20 % increase at all GWLs in most countries except Mexico, India, some parts of Africa, Europe and western Asia (Fig. 6, part [b], top row). This extends to almost the whole globe with higher GWLs. Some countries in South America and western Africa already double the pre-industrial levels of heatwave–drought and Rx1day–wind frequency at +1 ∘C of warming (Fig. 6, part [b], bottom row). The regions where only one event doubles in frequency are mostly driven by heatwave–drought events (Fig. B1, part [b]). At +3 ∘C of global warming both extreme pairs permanently double the pre-industrial levels for the United States, most countries in South America and some countries in Africa. At +3 ∘C of global warming, Rx1day–wind events occurring in Mexico, western and central Europe, and some countries surrounding the Mediterranean Sea do not contribute to 100 % change, whereas heatwave–drought events occurring in Kazakhstan and some countries in Africa do not contribute to 100 % change.
3.4 Population exposure
Projected changes in individual and concurrent occurrences of heatwave, drought, Rx1day and wind events suggest a growing risk for population exposure across the globe. In addition, the global population is expected to continue its growth, further exacerbating the risk for human and natural systems. For example, SSP5 projects the average world population to grow from 7.29 billion in 2015 to its maximum in 2060 (8.6 billion) and decrease thereafter to about 7.4 billion people by 2100 – the lowest population size among SSPs (Jones and O'Neill, 2016, 2020). However, to estimate the population exposure on a country-by-country basis we use 2015 levels (7.33 billion) provided in the GPWv4 data. Thus, in this study, we do not consider increasing population from SSP5 but hold it constant at 2015 levels for several reasons. (i) Comparing GPWv4 with SSP5 projections suggest that the population in 2015 is 39 million people higher (7.29 billion) in SSP5 than in GWPv4, with an even higher discrepancy for 2020. (ii) Population projections are given for time periods while we report our results for global warming levels. Because each GCM reaches a warming level at a different period, it would be difficult to assign a population number to the GWL. (iii) The projected population in SSP5 is strictly larger than in 2015, which suggests that our exposure based on 2015 population is conservative and gives a lower estimate.
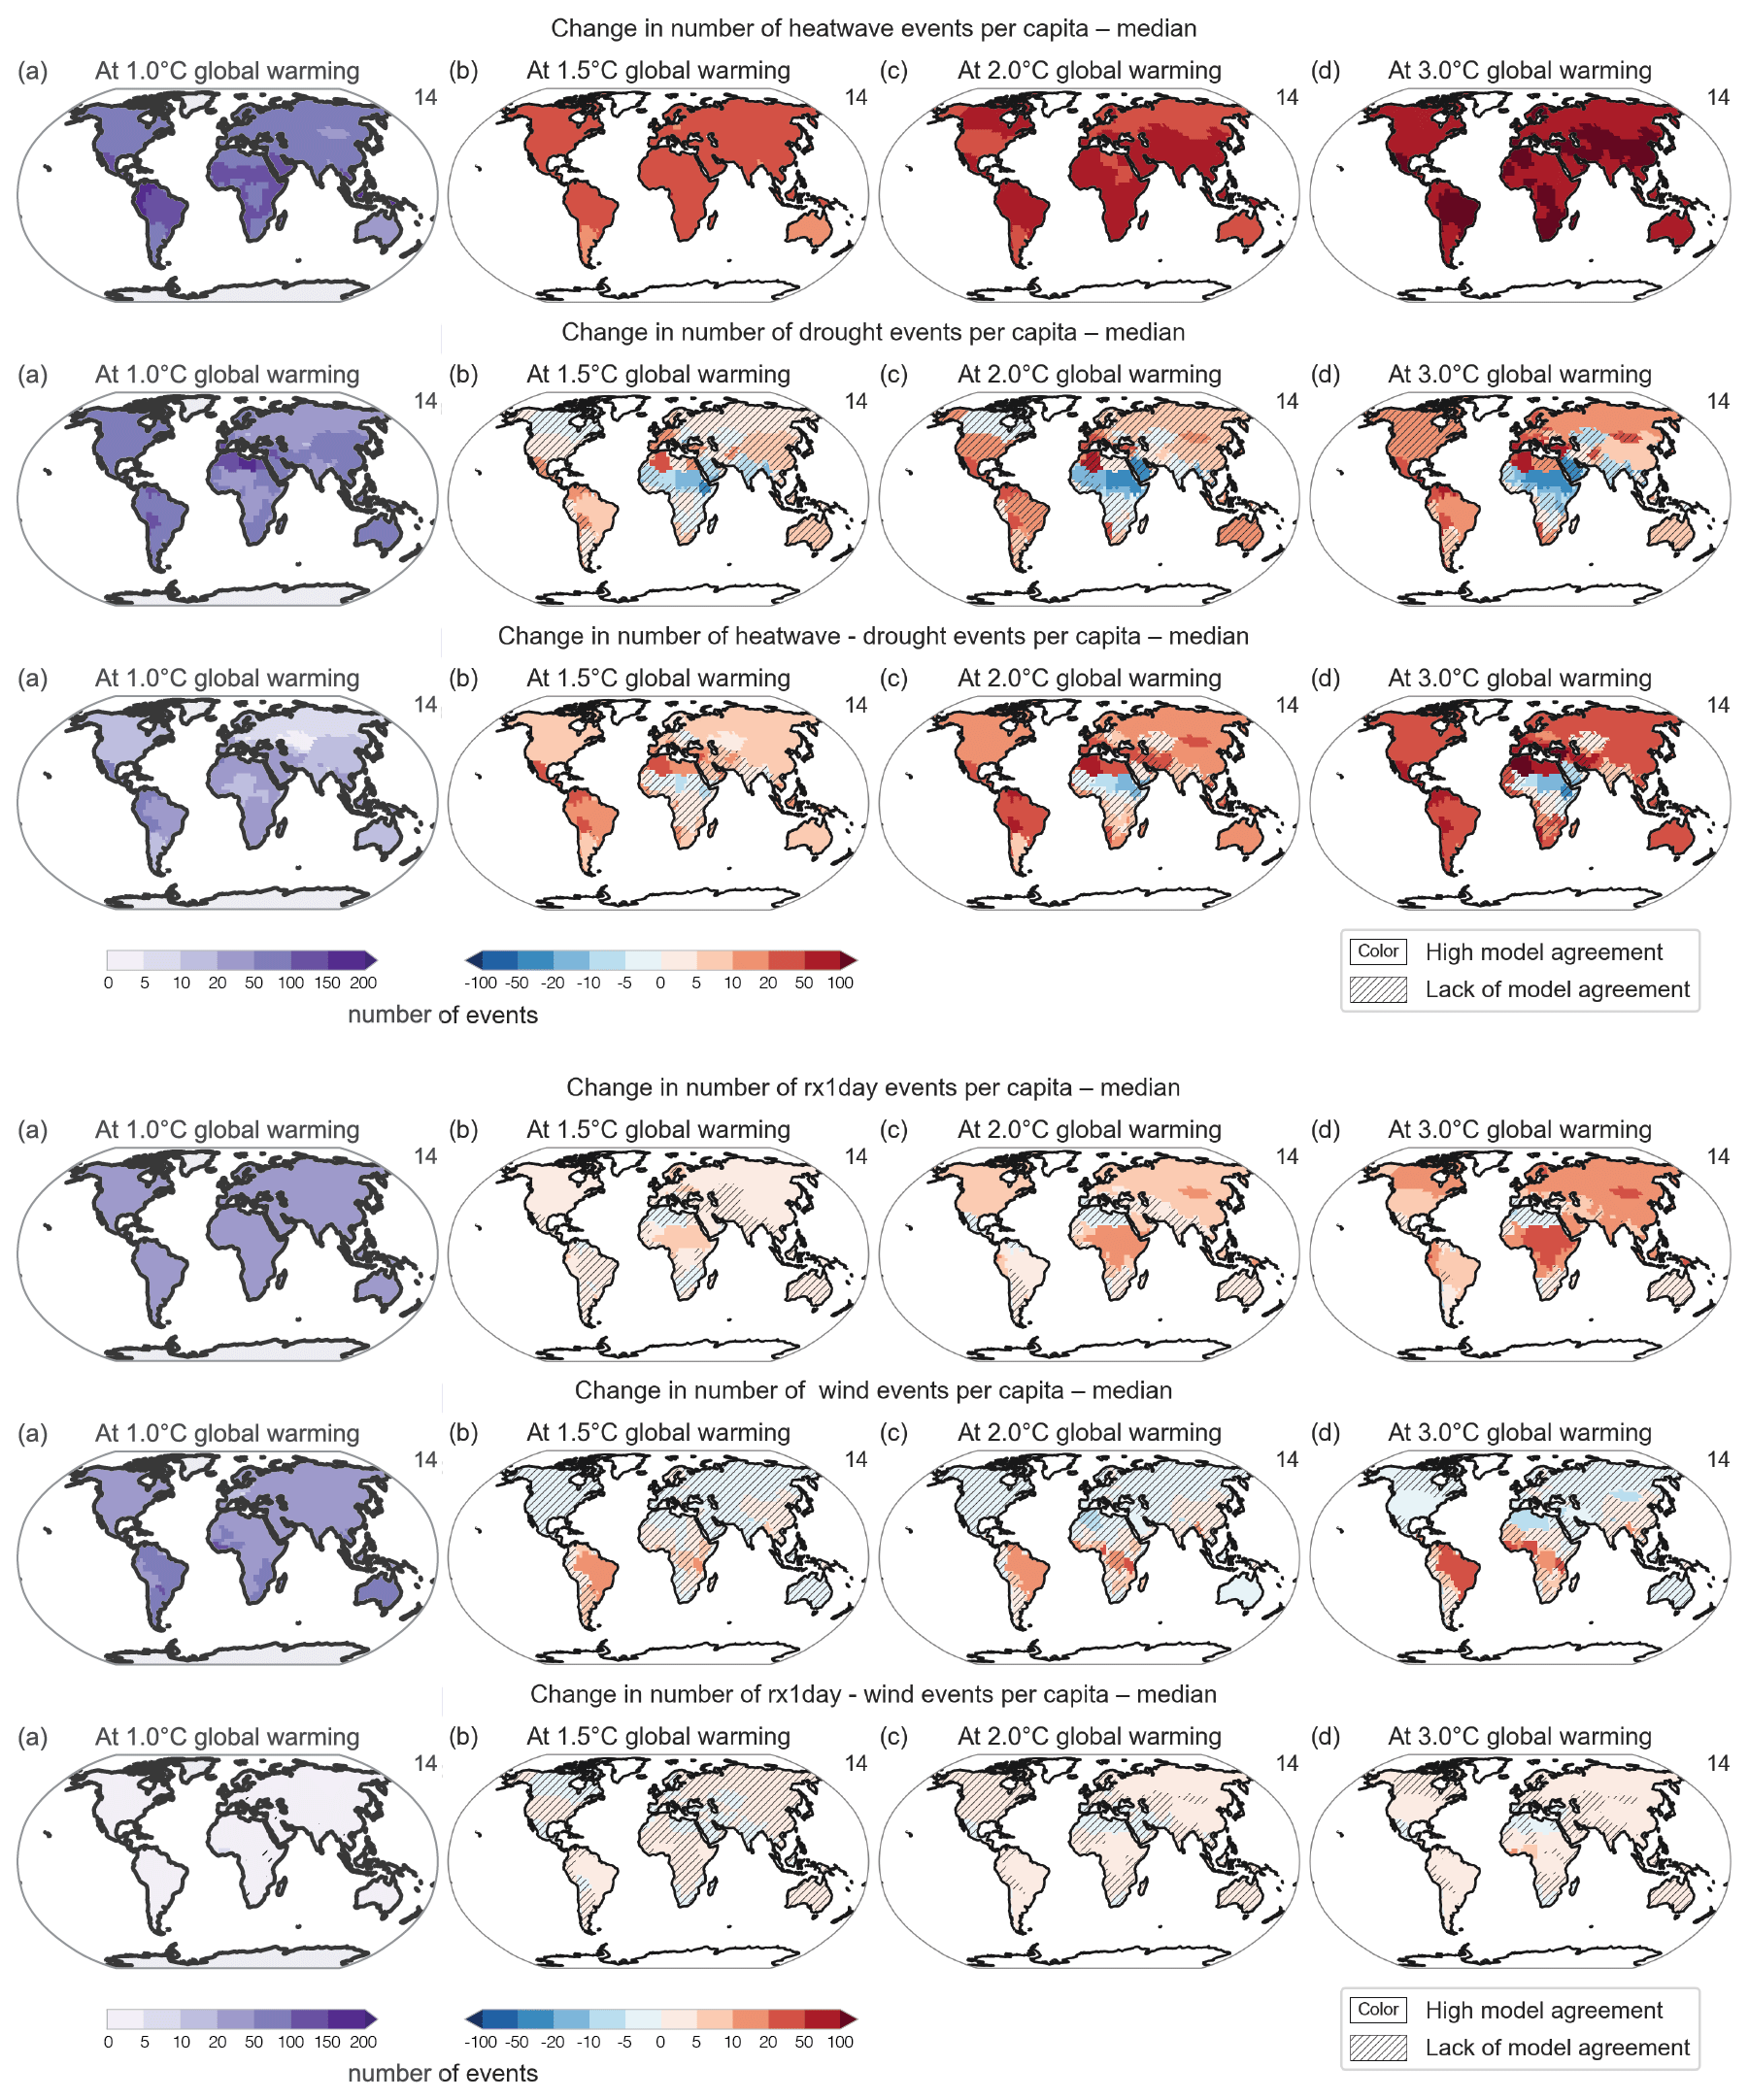
Figure 7Number of individual and concurrent extremes per capita (a) at +1 ∘C and (b, c, d) change at +1.5, +2 and +3 ∘C with respect to +1 ∘C. Population counts for 2015 have been used for the analysis. Colours refer to high model agreement, and hatched areas refer to lack of model agreement.
Figure 7 shows the number of events per capita for 139 countries. The temporal span of this analysis is 20 years (20 years ⋅ 12 months = 240 time steps) for each GWL. We multiply hazards (binary) (Fig. B2) at each grid cell with the gridded population (Fig. B3a). We then sum all the values on the country level and divide it with the total population of that country (Fig. B3b). The obtained value is the number of events (or months) per capita in that specific country which cannot exceed 240. Using this approach allows us to consider the hazard at grid cells where population is not zero. Colours represent high model agreement (80 % and above), and hatched areas represent low model agreement (less than 80 %) in sign across models. In Fig. 7, the first column represents the current (+1 ∘C) number of events per capita, and the second, third and fourth columns show the projected changes in the number of events at +1.5, +2 and +3 ∘C GWLs with respect to +1 ∘C. Even when not taking the expected rise in the human population into account, increases in extremes alone are projected to increase the event number per capita in most countries. For +1 ∘C of global warming, heatwave events range between ∼ 34 and ∼ 181 events per capita. The number of events per capita increases by ∼ 10 to 51 events for +1.5 ∘C, ∼ 18 to 85 events for +2 ∘C and ∼ 45 to 146 events for the +3 ∘C GWL with high model agreement. The increase in number of events per capita for 80 % of the countries is above 25 events, 51 events and 86 events for +1.5, +2 and +3 ∘C GWLs with respect to +1 ∘C. In case of drought, half of the countries indicate a continuous increase with higher GWLs up to ∼ 78 more events. The most vulnerable countries for drought are the Mediterranean countries, China, some European countries, Mexico and north-western countries of South America. Furthermore, the number of drought events per capita seems to be the least recurring event for some countries in Africa. For +1 ∘C of global warming, concurrent heatwave–drought events range between ∼ 3 and ∼ 88 events per capita across the globe, and these numbers gradually increase for higher global warming levels for 82 % of the countries, with high model agreement. The number of events per capita increases gradually across the globe except for some countries in the African continent. The most dramatic increase is observed for countries in the Mediterranean Basin. The number of events tends to increase for all the countries in MHC, South America and Australia, with more than 100 events per capita.
Individual Rx1day event numbers per capita are not very variable across the globe for +1 ∘C of global warming (between ∼ 23 and 41). The number of Rx1day events per capita is on the rise for higher global warming levels except Mediterranean countries, Australia, Mexico, and north and south African countries, with some even showing a small decrease (lack of model agreement). At +2 ∘C of global warming, Rx1day events increase the most for tropical countries in the African continent. This increase continues for +3 ∘C of global warming almost everywhere across the globe. Wind extremes are increasing mostly for tropical countries, including north-western countries of South America and some countries in central Africa. Most of the MHC and STC countries experience a decrease in the number of events per capita down to ∼ 7 events for higher global warming levels (lack of model agreement). The number of events per capita for concurrent Rx1day and wind events is increasing in 41 % of the countries. We observe the highest increase over the tropical countries in Africa up to ∼ 10 more events.
3.5 Non-event months
Figure 8 shows the percentage of “normal” – non-event – months that countries experience, i.e. the percentage of months without any individual events studied in this paper (median of GCMs). We calculate the fraction of non-event months for each year (e.g. 6 normal months out of 12 corresponds to 0.5) over the 20-year period comprising the GWLs. We then take the mean of fractions and multiply with 100 to calculate the percentage of non-event months for each GWL. At the pre-industrial level, 60 % of the months are normal, meaning that there are ∼ 7 normal months in every year across the globe. At the first glance, we see that with higher global warming levels, the percentage of normal months decreases gradually across the globe, with some countries being more prone to the change. Independent of the frequency of events, all countries become a hotspot for individual extremes with increasing global warming. At current conditions, at ca. +1 ∘C of global warming, 129 (out of 139) countries have 50 % (6 months) or less normal months. A total of 23 of these countries, mostly with a tropical climate, have less than 20 % (∼ 2–3 month) normal months, and 2 countries have less than 10 % normal months (shown with grey colour), meaning that there is either 1 or no single month without individual events. At +1.5 ∘C of global warming, the percentage of normal months is less than 20 % for 51 countries. A total of 21 of these countries are projected to have less than 10 % normal months. These countries are mostly located in tropical climates. At +2 ∘C of global warming, 79 countries are projected to have less than 20 % of normal months, whereas almost half of these countries (37) are projected to experience extreme events every month. In a +3 ∘C world, 85 countries experience the above-mentioned four individual events almost every month, whereas non-event months are between 10 %–20 % for 41 countries and 20 %–30 % for 11 countries. These results show that a large number of countries will shift to near-permanent extreme conditions, even at global warming levels consistent with the limits of the Paris Agreement.

Figure 8Percentage of non-event months (months without individual extremes) at warming levels (+1, +1.5, +2 and +3 ∘C).
Our results highlight the increasing frequency of heatwaves, droughts, Rx1day and wind extremes with global mean warming. These findings, in particular the respective spatial patterns and increasing signals, are in accordance with the findings of the Sixth Assessment Report of the Intergovernmental Panel on Climate Change (IPCC AR6). In the IPCC AR6 report, projected changes in annual maximum daily precipitation (Rx1day) and annual maximum temperature (TXx) indicate an increase over almost all land areas, while soil moisture drought shows a heterogeneous pattern (Seneviratne et al., 2021). Additionally, mean wind is expected to increase gradually in the 21st century in some tropical regions and decrease for the rest of the global land areas (Ranasinghe et al., 2021). In this work, individual heatwaves, droughts, Rx1day and wind extremes present consistent results with the above-mentioned indices. Increasing occurrence of these individual extremes can have important implications for natural and human systems. Therefore, the compatibility between the IPCC AR6 report and our results increases the confidence in our estimates of concurrent extremes that are associated with even more severe effects than the respective individual extremes.
With higher global warming levels, we have seen a sharp increase in concurrent heatwave–drought events in three climate regions, with the most dramatic increase in northern mid- and high-latitude countries (MHC) followed by subtropical countries (STC) (Fig. 3a). As opposed to heatwave–drought events, Rx1day–wind events increase the most in tropical countries (TRC) (Fig. 3b). The frequency differences among regions can be explained by varying climatic regimes. For instance, STC is more affected by warm–dry conditions than TRC because arid climate zones have more climate variability than equatorial climate zones. Another reason behind the frequency differences across regions can be the underlying dynamical and thermodynamic processes such as atmospheric circulation and teleconnection patterns. For example, compound droughts in the Amazon are associated mainly with El Niño–Southern Oscillation (ENSO) (Singh et al., 2021), and wet and windy extremes in north-western Europe are associated with the positive phase of the North Atlantic Oscillation (NAO) (De Luca et al., 2020). These findings correspond to regional findings in our analysis. Some studies have found that polar amplification weakens the north–south temperature gradient and warms up the cold extremes in mid- and high latitudes (Holmes et al., 2016; Gross et al., 2020), which is perhaps why MHC has prevailing heatwave–drought conditions. Another important thermodynamic process that can amplify temperature extremes is the lapse rate feedback mechanism. This mechanism increases temperature extremes in mid- to high latitudes, while it decreases temperature extremes in tropics (Seneviratne et al., 2021). This direct influence on temperature extremes can be an indirect influence on precipitation extremes by altering the circulation patterns (dynamic processes) (Sillmann et al., 2017). Another key mechanism responsible for frequency increase can be the interaction between land and atmosphere (Seneviratne et al., 2010). Lack of moisture during droughts limits land evaporation, which leads to an increase in sensible heat and in turn increases temperatures (Chiang et al., 2018). Furthermore, the change in moisture sources and sinks due to the future increases in greenhouse gas forcing will likely alter the hydrologic cycle (Batibeniz et al., 2020b), and such changes will likely intensify the land–atmosphere feedback mechanism, causing concurrent warm and dry conditions. These explain why we found an increase in droughts occurring together with heatwaves in the projection period. Additionally, the enhancement of the concurrent very hot–dry warm seasons in many regions has also been linked with increasing dependence between temperature and precipitation associated with global warming (Zscheischler and Seneviratne, 2017). Moreover, it has been found that future occurrences of compound hot–dry events over land are connected with the variations in precipitation trends (Bevacqua et al., 2022). Our analyses show similar dipolar responses between heatwave–drought events and Rx1day–wind events in some countries.
Our results highlight the positive trend both in individual and concurrent events with higher global warming levels. The probability of occurrence of compound extremes is much lower than individual extremes by definition. Our results showcase this as individual events overall increase more than concurrent events. However, the multivariate structure of heatwave–drought and Rx1day–wind events changes in the future across all climate regions. The interchangeable relationship between individual and concurrent events can be a sign of distributional changes in mean climate. In any case, increasing frequency decreases the number of non-event months without any individual extreme (Fig. 8), which leaves less and less time for adaptation and recovery. Additionally, timing analysis indicates either abrupt increases or shifts in individual and concurrent extremes (Figs. 4, 5). The inhomogeneous increases in frequency and changes in timing pose a risk for different sectors such as agriculture, tourism and health. These changes may serve as a red flag for countries with an economy depending on these sectors.
Our analysis indicates that exposure to multivariate extremes is on the rise across the globe. For some countries, there is a dipolar pattern between exposures to heatwave–drought events and Rx1day–wind events. While the Mediterranean countries, southern Africa and Mexico have an increase (decrease) in heatwave–drought (Rx1day–wind) events, central Africa and the Arabian Peninsula have a decrease (increase). Amazonia, southern Africa, the Sahel, India, and Southeast Asia have been projected as a hotspot for increasing temperatures and are the most vulnerable regions to extreme events (Bathiany et al., 2018). We find similar regional responses to increasing global warming levels. Low-income countries have been found to be more economically vulnerable to weather and climate extremes than rich countries (Jones and Olken, 2010; Dell et al., 2012, 2014). Therefore, these highly populated vulnerable countries that are prone to the largest changes in multi-hazard exposures could potentially be at larger risk.
The damage that extreme events cause is not only related to the frequency, severity or magnitude of the events but also to socioeconomic factors (Botzen et al., 2010; Jahn, 2015; Frame et al., 2020; IPCC, 2021) such as land use, income, education, employment and community safety. Different economic and social structures will alter the adaptive capacity to climate change. This makes it difficult to disassociate climate-related hazards from socioeconomic factors. Even so, assuming that projected future changes will take place in a world with a society and economy similar to today would help to understand the relative impacts of climate change on exposure. However, the global population is currently growing at a rate of around 1.1 % per year, with the majority of this growth occurring in developing countries (Roser et al., 2013). The population living in the urban extent of Europe in 2015 is projected to increase more than 5 % by 2050 (United Nations et al., 2019), and SSP population projections also estimate an increase in population (Jones and O'Neill, 2016). The distribution of population growth across different regions and demographic groups can vary; therefore, using population projections to investigate the human contribution to the change in exposure could help understand future risks more (Batibeniz et al., 2020a; Mukherjee et al., 2021). Our results provide evidence for an already existing vulnerability that may further increase in regions where extreme events will become more frequent due to climate change.
Investigating future changes in impactful individual and concurrent extremes is important to prepare for future climate risks. In this study, we have investigated the current state (∼ +1 ∘C of global warming) and projected change of individual and concurrent occurrences of heatwave, drought, Rx1day and wind events at global warming levels (GWLs) of +1.5, +2 and +3 ∘C relative to the pre-industrial period on the level of countries and climatic macro-regions. Projections as a function of GWLs provide useful information for stakeholders in the context of the Paris Agreement, which has set a limit for global warming stabilization “well below 2 ∘C” and an aim to pursue efforts to limit global warming to +1.5 ∘C (UNFCCC, 2015). Analyses of simulations from 14 CMIP6 global climate models allowed us to gain a robust understanding of extremes in current and future climate.
Our results indicate that all climate regions are under the increasing influence of concurrent hot–dry (heatwave–drought) events and Rx1day–wind events with higher GWLs. Even though this change is more substantial for heatwave–drought events, Rx1day–wind events are also on the rise. However, the order of the increase of events across regions shows a clear contrast. For heatwave–drought events, the increase is largest in northern mid- and high-latitude countries (MHC), followed by subtropical countries (STC) and tropical countries (TRC), whereas for Rx1day–wind events the order is the opposite. While heatwave–drought events increased substantially, Rx1day–wind events increased less in MHC and STC. However, in TRC the increasing rate of heatwave–drought and Rx1day–wind events is similar, indicating the less variable climate in TRC. Isolated events are on the rise for heatwave and Rx1day events, whereas they are decreasing for drought and wind events, meaning that towards a warmer world, drought (wind) events are projected to co-occur with heatwave (Rx1day) events rather than occurring solely.
Our results also highlight the important timing shifts in the occurrence of individual and concurrent extremes in the future climate. Individual extreme events increase inhomogeneously across months, leading to unprecedented frequency increases in some months in the future. Another important highlight of our study is increasing human exposure to concurrent extremes even without considering the expected rise in the human population. With higher GWLs, the number of events per capita increases continuously in 53 countries for Rx1day–wind events, whereas this is valid for twice the number of countries for heatwave–drought events. Our results also suggest non-event months are gradually decreasing for countries and that 85 countries will experience individual events nearly every month (i.e. less than 10 % of non-event months) in a +3 ∘C warmer world. But this also affects several countries at +1.5 ∘C (21 countries) or +2 ∘C of global warming (37 countries). This shows that a large number of countries will shift to near-permanent extreme conditions (less than 10 % of non-event months) even at global warming levels consistent with the limits of the Paris Agreement. Furthermore, our results suggest that there is a prevailing increase in frequency, shifts in timing of concurrent extremes from +1.5 to +2 ∘C of global warming, thus exacerbating human exposure to these extremes with increasing global warming.
Despite many robust findings of our study, which are consistent with past assessments (Seneviratne et al., 2021) but also provide some new insights on the projected changes in extremes with increasing global warming, many sources of uncertainty need to be emphasized. This study relies on climate model simulations for both past and projected changes in climate extremes. For historical changes, observational analyses could complement the provided results, but given the difficulty of investigating extreme events statistically due to their rare nature, climate models have been widely used for historical analyses in the literature (Sillmann et al., 2017; Miralles et al., 2019) using both regional and global climate models (Zhu and Yang, 2020; Zhu et al., 2020; Srivastava et al., 2020; Krishnan and Bhaskaran, 2020). We focus here on global simulations of standard resolution, which can be a limitation in regions of steep terrain. Indeed, high-resolution regional models have been utilized especially for replication of wind and precipitation extremes at regions with complex local features (Coppola et al., 2021; Outten and Sobolowski, 2021; Reale et al., 2021; Stocchi et al., 2022), while global climate models are often used to investigate the relationship between land surface conditions and extreme statistics (Seneviratne et al., 2013; Hauser et al., 2016; Rasmijn et al., 2018). However, the robust, large-scale investigation of extremes requires global model simulations with standard resolution, which often have lower computational cost compared to high-resolution global simulations and allow us to obtain global statistical information compared to regional high-resolution simulations. Despite remaining uncertainties related to model deficiencies in some physical processes, natural variability (Wilcox and Donner, 2007; Rossow et al., 2013; Pfahl et al., 2017) and feedback mechanisms (Orlowsky and Seneviratne, 2013; Mueller and Seneviratne, 2014), CMIP6 is widely regarded as one of the most comprehensive and reliable sources for global information on climate change and is used in many extreme studies. Additionally, these models have a higher resolution, have mostly higher climate sensitivity and produce better replication of physical, chemical and biological processes compared to CMIP5 (Coupled Model Intercomparison Project 5) used in IPCC AR5 (IPCC, 2021).
In conclusion, this study highlights the increasing occurrence of several single and compound extreme events with increasing global warming, with major increases in affected countries and human exposure even at levels of global warming consistent with the limits of the Paris Agreement. In particular, a substantial fraction of countries would be near permanently affected by extreme events already at +1.5 ∘C and even more so at +2 and +3 ∘C of global warming. The identified unprecedented changes in frequency and timing of extreme events would lead to an elevated risk for the environment and society across the globe. Therefore, our results suggest an urgent need for concrete actions to mitigate the current greenhouse gas emissions.
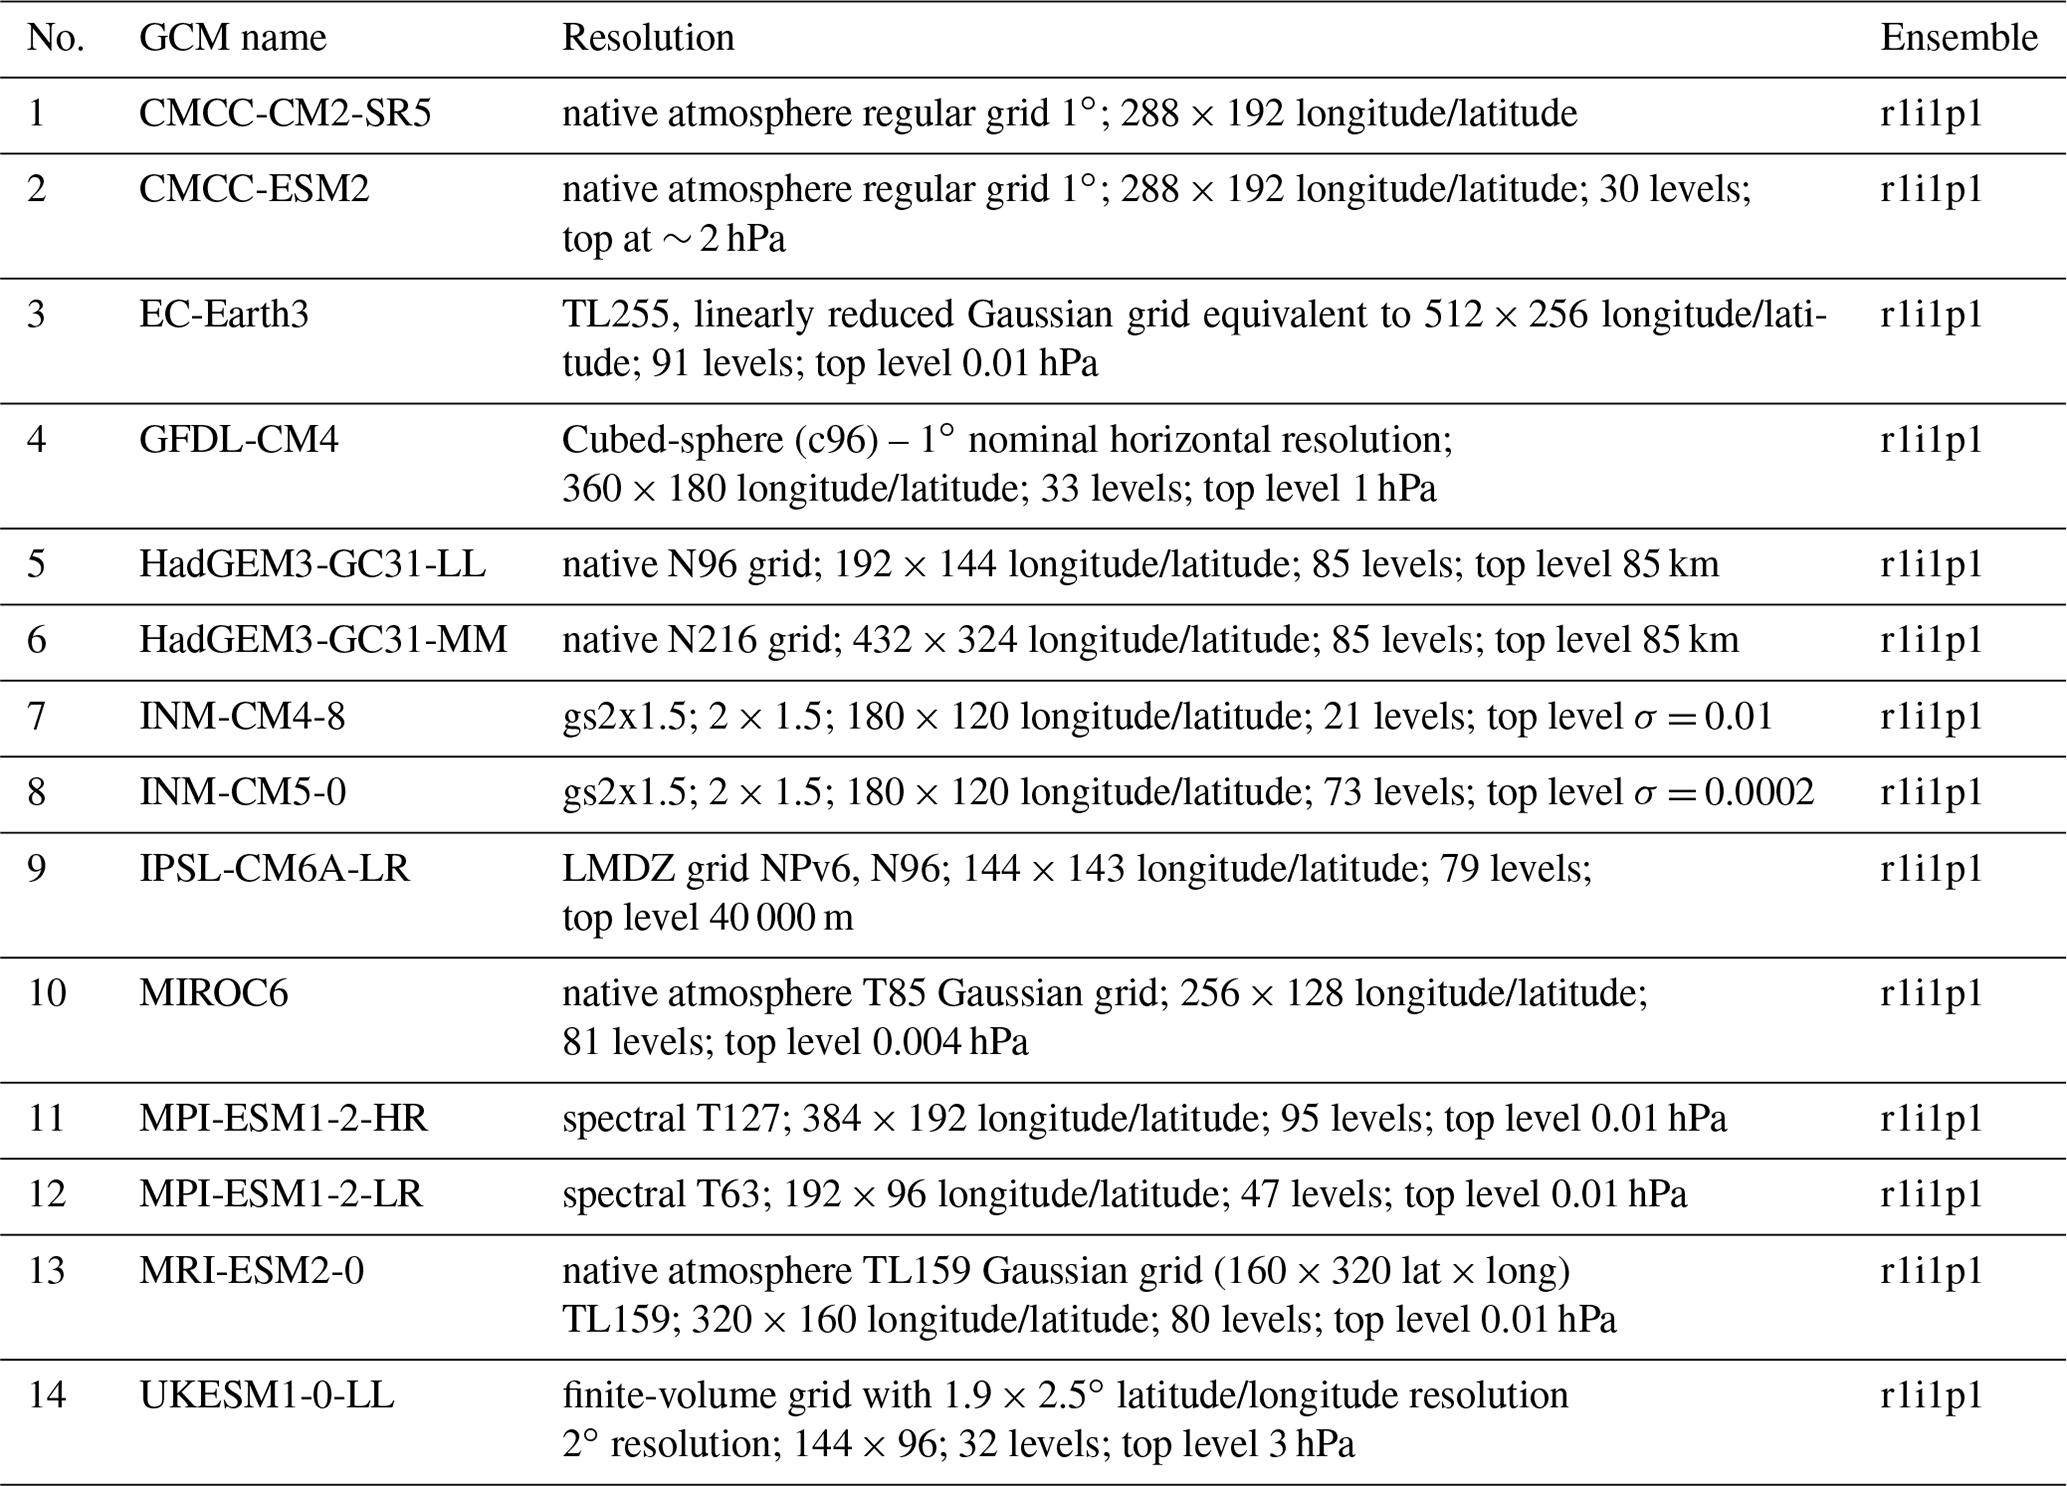
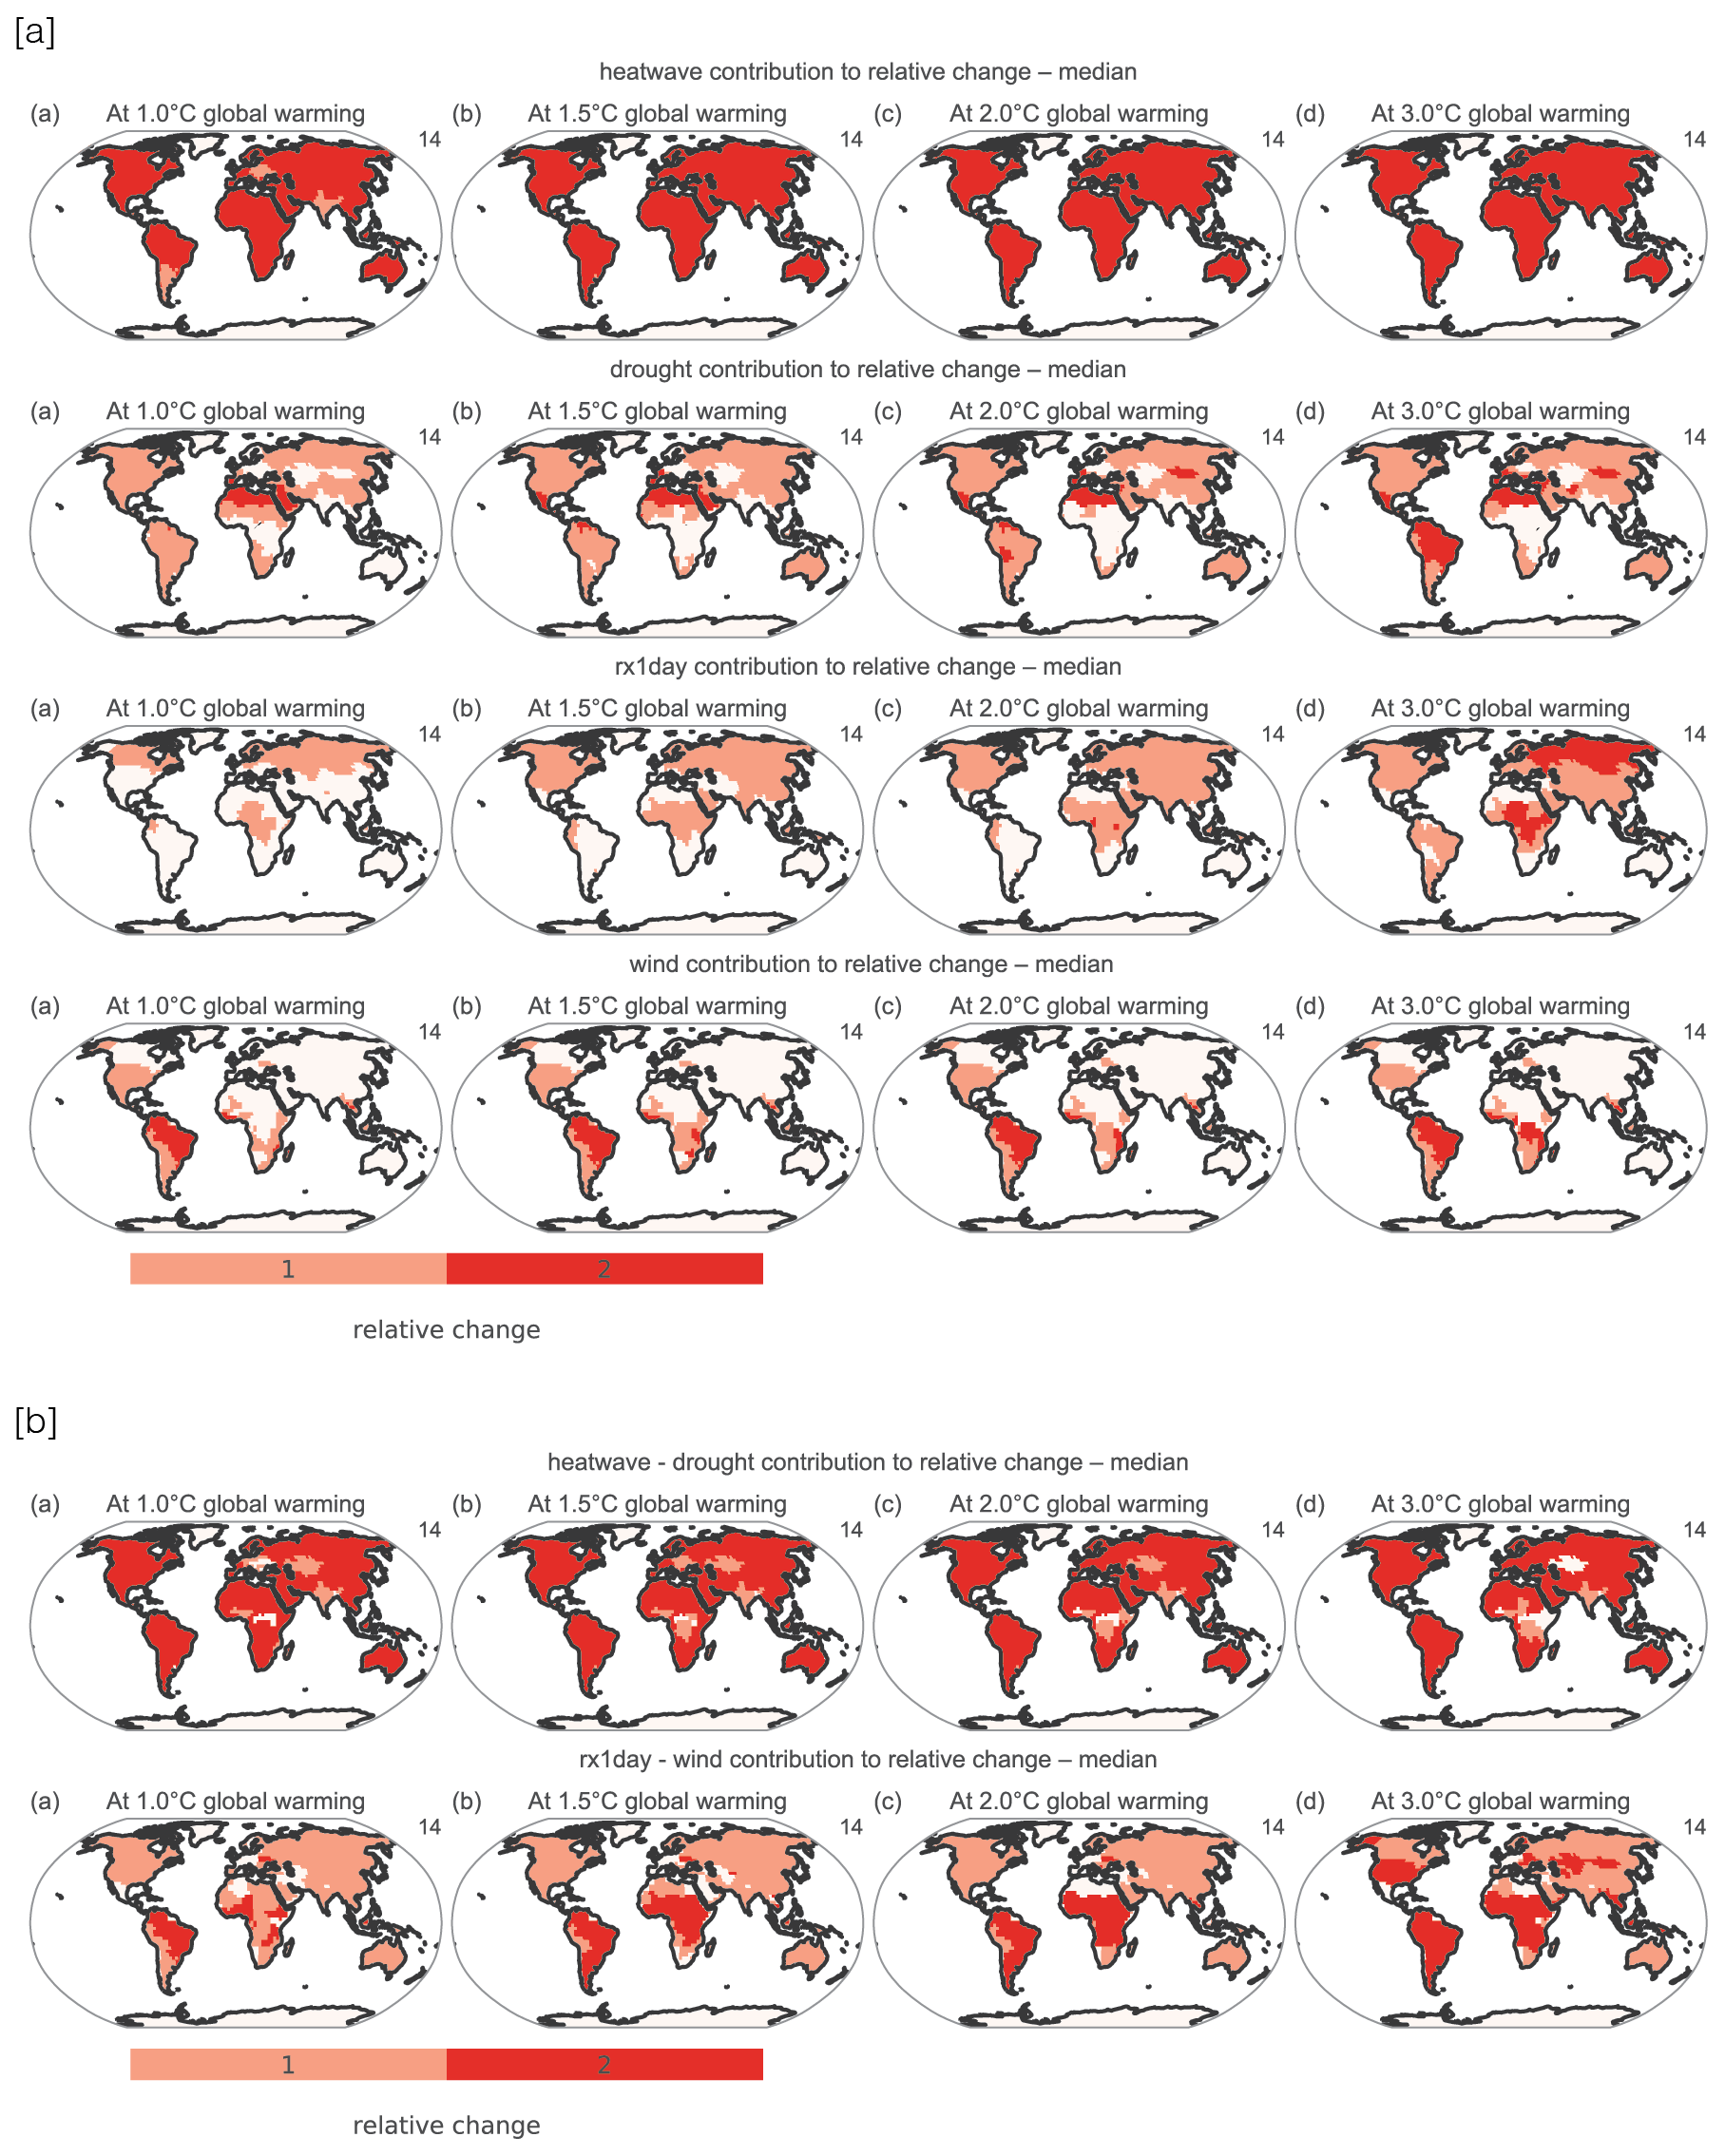
Figure B1The 20 % relative change (shown with 1) and 100 % relative change (shown with 2) of each individual extreme [a] and concurrent extreme [b].
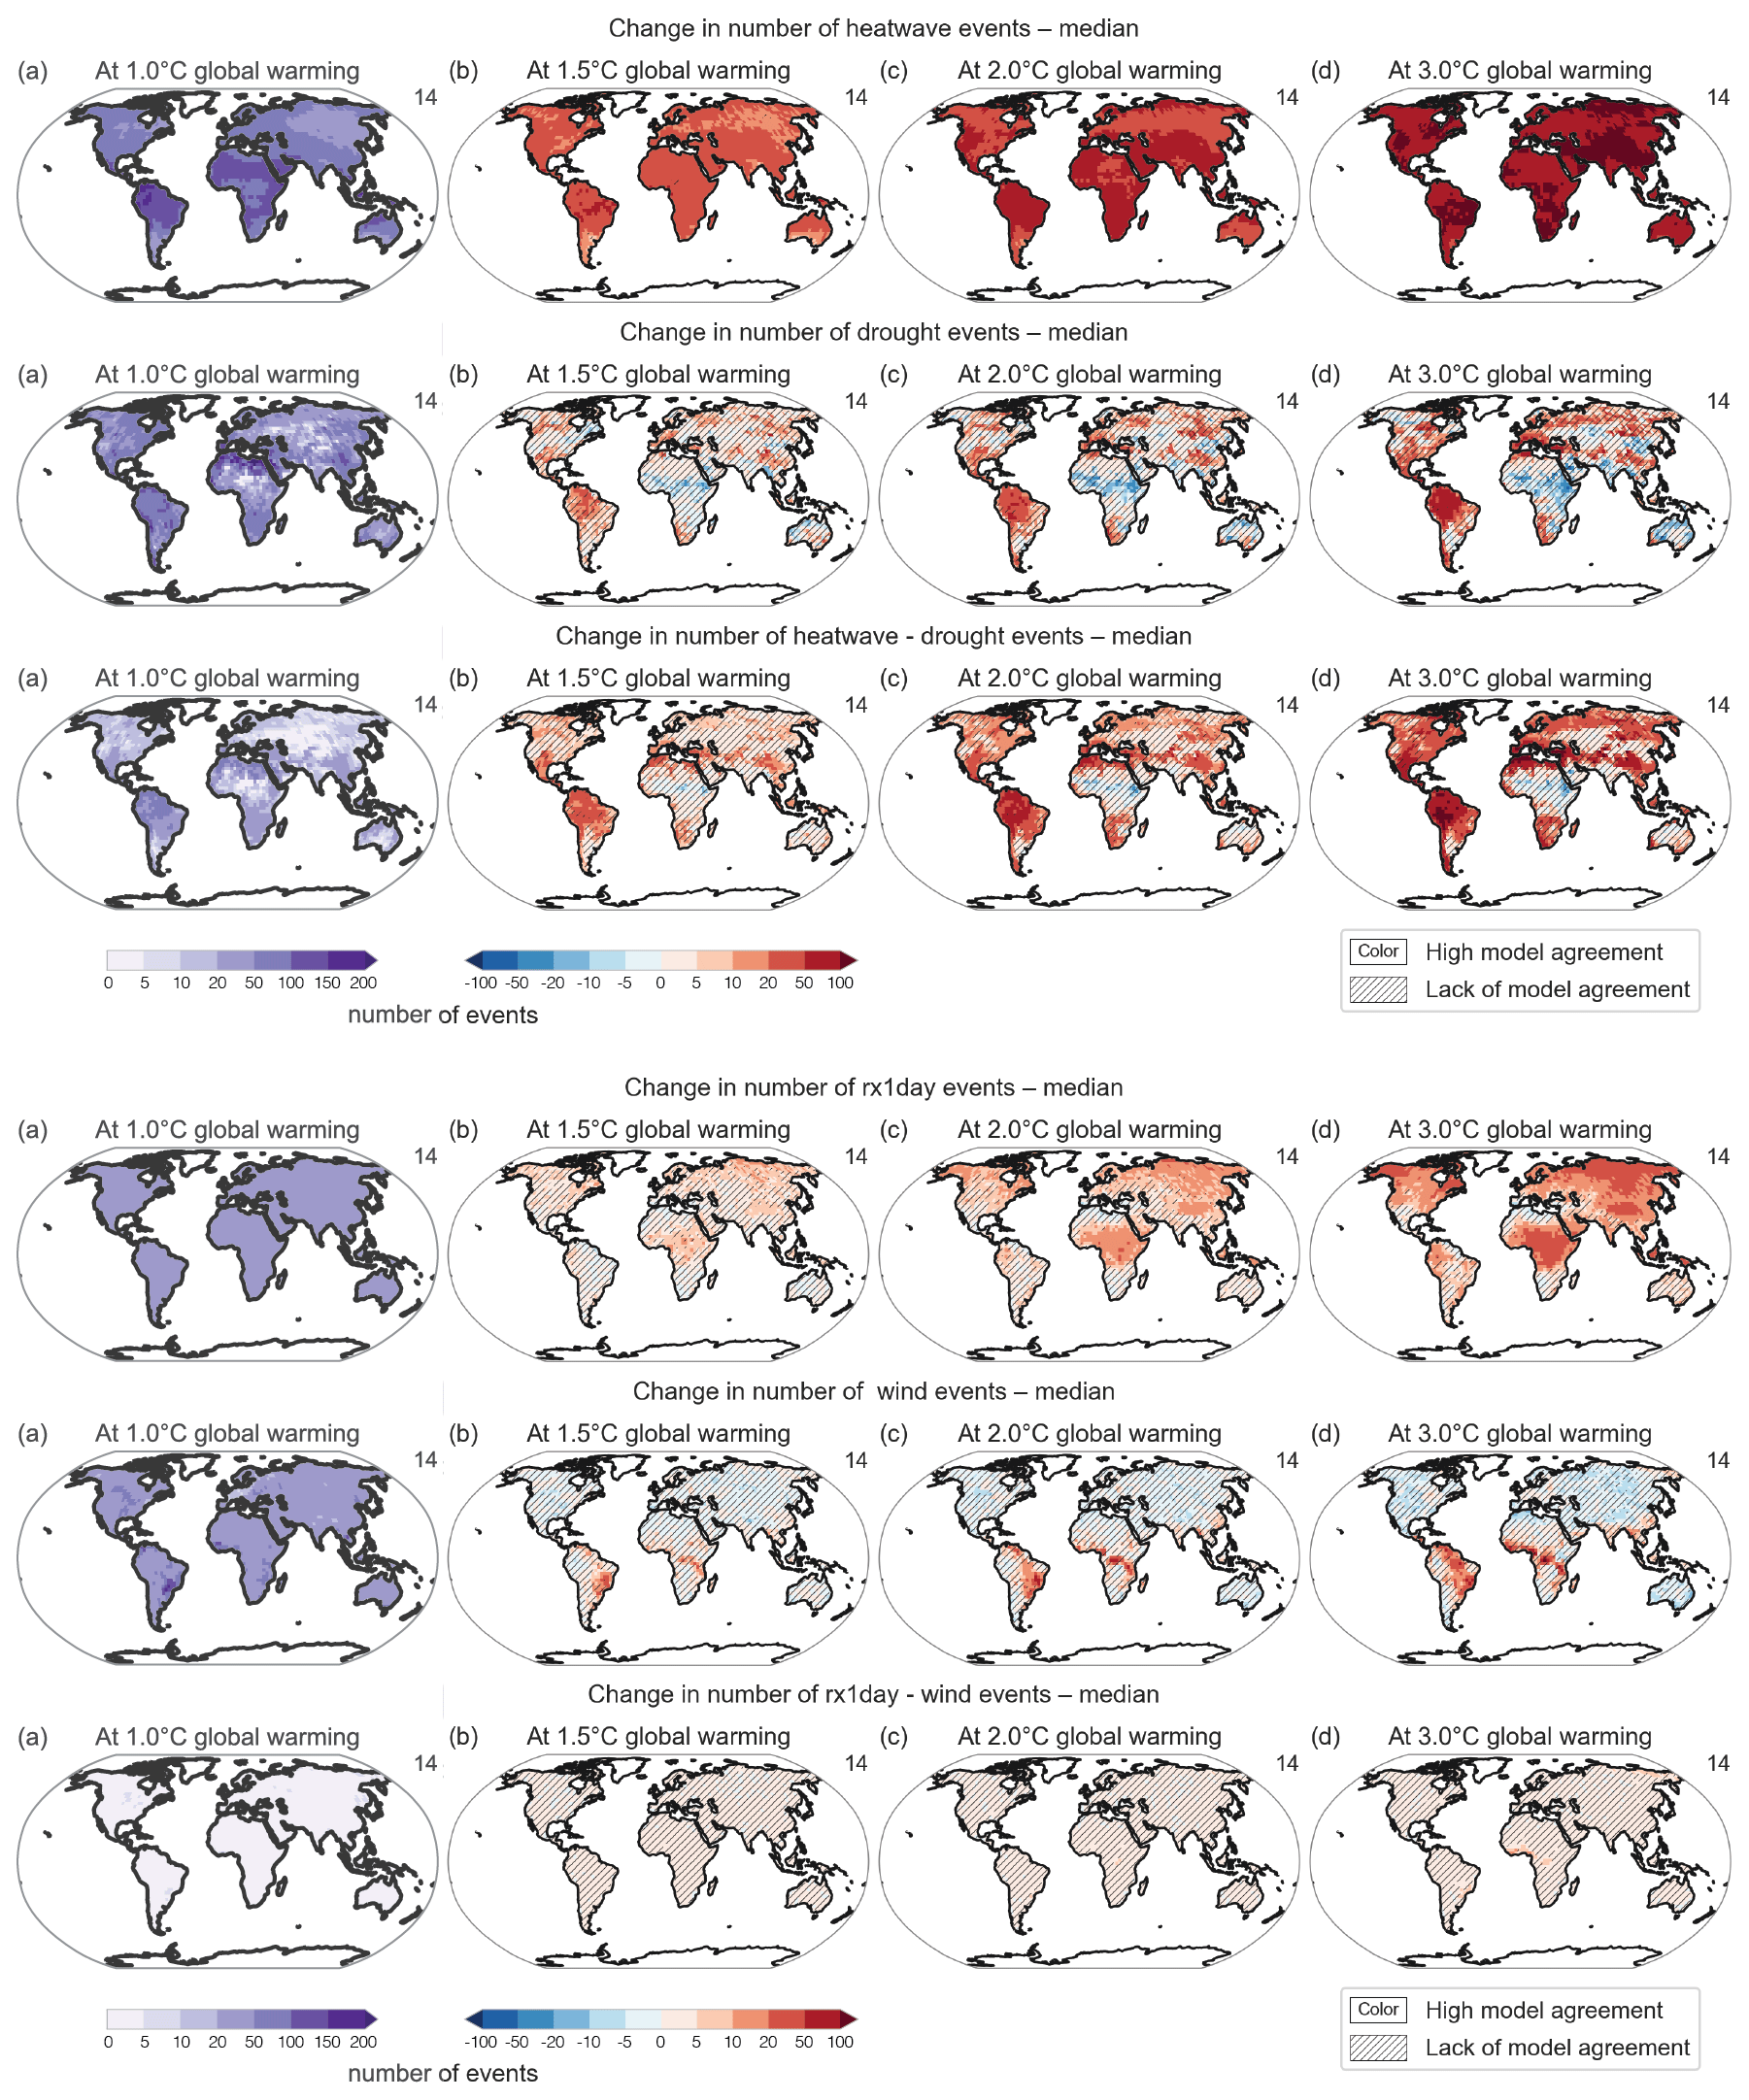
Figure B2Number of individual and concurrent extremes (a) at +1 ∘C and (b, c, d) change at +1.5, +2 and +3 ∘C with respect to +1 ∘C. Colours refer to high model agreement, and hatched areas refer to lack of model agreement.

Figure B3Population from GWPv4 at (a) 2.5∘ grid level and (b) country level.
GPWv4 data used for population analysis are provided by the NASA Socioeconomic Data and Applications Center (SEDAC) and are available at https://doi.org/10.7927/H4JW8BX5 (CIESIN, 2018). Extreme indices have been generated using data archived on the ETH Zurich CMIP6 repository (https://doi.org/10.5281/ZENODO.3734128, Brunner et al., 2020). Access to CMIP6 model outputs is also possible through different Earth System Grid Federation (ESGF) data nodes.
FB, MH and SIS planned the study; FB performed the analyses with support and guidance from MH and SIS; FB wrote the manuscript draft; MH and SIS reviewed and edited the manuscript. All authors were involved in discussions of the results and streamlining the text.
The contact author has declared that none of the authors has any competing interests.
Publisher’s note: Copernicus Publications remains neutral with regard to jurisdictional claims in published maps and institutional affiliations.
This study was funded by the Swiss National Science Foundation (SNSF) through the Compound Events in a Changing Climate (CECC) (grant agreement ID IZCOZ0_189941) project contributing to the European COST Action CA17109, “Understanding and modeling compound climate and weather events” (DAMOCLES).
We acknowledge the World Climate Research Programme's Working Group on Coupled Modelling, which is responsible for the Coupled Model Intercomparison Project (CMIP), and we thank the climate modeling groups (listed in Table A1 in Appendix A) for producing and making their model output available. Furthermore, we are indebted to Urs Beyerle, Lukas Brunner and Ruth Lorenz for downloading and curating the CMIP6 data.
This research has been supported by the Schweizerischer Nationalfonds zur Förderung der Wissenschaftlichen Forschung (grant no. IZCOZ0_189941).
This paper was edited by Chandrika Thulaseedharan Dhanya and reviewed by Mojtaba Sadegh, Arpita Mondal, and one anonymous referee.
Alexander, L. V., Zhang, X., Peterson, T. C., Caesar, J., Gleason, B., Klein Tank, A. M. G., Haylock, M., Collins, D., Trewin, B., Rahimzadeh, F., Tagipour, A., Rupa Kumar, K., Revadekar, J., Griffiths, G., Vincent, L., Stephenson, D. B., Burn, J., Aguilar, E., Brunet, M., Taylor, M., New, M., Zhai, P., Rusticucci, M., and Vazquez-Aguirre, J. L.: Global observed changes in daily climate extremes of temperature and precipitation, J. Geophys. Res., 111, D05109, https://doi.org/10.1029/2005JD006290, 2006.
Alizadeh, M. R., Adamowski, J., Nikoo, M. R., AghaKouchak, A., Dennison, P., and Sadegh, M.: A century of observations reveals increasing likelihood of continental-scale compound dry–hot extremes, Sci. Adv., 6, eaaz4571, https://doi.org/10.1126/sciadv.aaz4571, 2020.
Alizadeh, M. R., Abatzoglou, J. T., Adamowski, J. F., Prestemon, J. P., Chittoori, B., Akbari Asanjan, A., and Sadegh, M.: Increasing Heat-Stress Inequality in a Warming Climate, Earth's Future, 10, e2021EF002488, https://doi.org/10.1029/2021EF002488, 2022.
Bao, J., Sherwood, S. C., Alexander, L. V., and Evans, J. P.: Future increases in extreme precipitation exceed observed scaling rates, Nat. Clim. Change, 7, 128–132, https://doi.org/10.1038/nclimate3201, 2017.
Bathiany, S., Dakos, V., Scheffer, M., and Lenton, T. M.: Climate models predict increasing temperature variability in poor countries, Sci. Adv., 4, eaar5809, https://doi.org/10.1126/sciadv.aar5809, 2018.
Batibeniz, F., Ashfaq, M., Diffenbaugh, N. S., Key, K., Evans, K. J., Turuncoglu, U. U., and Önol, B.: Doubling of U.S. Population Exposure to Climate Extremes by 2050, Earth's Future, 8, e2019EF001421, https://doi.org/10.1029/2019EF001421, 2020a.
Batibeniz, F., Ashfaq, M., Önol, B., Turuncoglu, U. U., Mehmood, S., and Evans, K. J.: Identification of major moisture sources across the Mediterranean Basin, Clim. Dynam., 54, 4109–4127, https://doi.org/10.1007/s00382-020-05224-3, 2020b.
Bevacqua, E., Zappa, G., Lehner, F., and Zscheischler, J.: Precipitation trends determine future occurrences of compound hot–dry events, Nat. Clim. Change, 12, 350–355, https://doi.org/10.1038/s41558-022-01309-5, 2022.
Botzen, W. J. W., van den Bergh, J. C. J. M., and Bouwer, L. M.: Climate change and increased risk for the insurance sector: a global perspective and an assessment for the Netherlands, Nat. Hazards, 52, 577–598, https://doi.org/10.1007/s11069-009-9404-1, 2010.
Brunner, L., Hauser, M., Lorenz, R., and Beyerle, U.: The ETH Zurich CMIP6 next generation archive: technical documentation, Zenodo [data set], https://doi.org/10.5281/ZENODO.3734128, 2020.
Champagne, O., Leduc, M., Coulibaly, P., and Arain, M. A.: Winter hydrometeorological extreme events modulated by large-scale atmospheric circulation in southern Ontario, Earth Syst. Dynam., 11, 301–318, https://doi.org/10.5194/esd-11-301-2020, 2020.
Chen, H., Sun, J., and Li, H.: Increased population exposure to precipitation extremes under future warmer climates, Environ. Res. Lett., 15, 034048, https://doi.org/10.1088/1748-9326/ab751f, 2020.
Chiang, F., Mazdiyasni, O., and AghaKouchak, A.: Amplified warming of droughts in southern United States in observations and model simulations, Sci. Adv., 4, eaat2380, https://doi.org/10.1126/sciadv.aat2380, 2018.
CIESN (Center for International Earth Science Information Network – Columbia University): Gridded Population of the World, Version 4 (GPWv4), Population Count, Revision 11, SEDAC [data set], https://doi.org/10.7927/H4JW8BX5, 2018.
Coppola, E., Raffaele, F., Giorgi, F., Giuliani, G., Xuejie, G., Ciarlo, J. M., Sines, T. R., Torres-Alavez, J. A., Das, S., di Sante, F., Pichelli, E., Glazer, R., Müller, S. K., Abba Omar, S., Ashfaq, M., Bukovsky, M., Im, E.-S., Jacob, D., Teichmann, C., Remedio, A., Remke, T., Kriegsmann, A., Bülow, K., Weber, T., Buntemeyer, L., Sieck, K., and Rechid, D.: Climate hazard indices projections based on CORDEX-CORE, CMIP5 and CMIP6 ensemble, Clim. Dynam., 57, 1293–1383, https://doi.org/10.1007/s00382-021-05640-z, 2021.
Couasnon, A., Eilander, D., Muis, S., Veldkamp, T. I. E., Haigh, I. D., Wahl, T., Winsemius, H. C., and Ward, P. J.: Measuring compound flood potential from river discharge and storm surge extremes at the global scale, Nat. Hazards Earth Syst. Sci., 20, 489–504, https://doi.org/10.5194/nhess-20-489-2020, 2020.
Das, J., Manikanta, V., and Umamahesh, N. V.: Population exposure to compound extreme events in India under different emission and population scenarios, Sci. Total Environ., 806, 150424, https://doi.org/10.1016/j.scitotenv.2021.150424, 2022.
De Luca, P., Messori, G., Pons, F. M. E., and Faranda, D.: Dynamical systems theory sheds new light on compound climate extremes in Europe and Eastern North America, Q. J. Roy. Meteor. Soc., 146, 1636–1650, https://doi.org/10.1002/qj.3757, 2020.
Dell, M., Jones, B. F., and Olken, B. A.: Temperature Shocks and Economic Growth: Evidence from the Last Half Century, Am. Econ. J.-Macroecon., 4, 66–95, https://doi.org/10.1257/mac.4.3.66, 2012.
Dell, M., Jones, B. F., and Olken, B. A.: What Do We Learn from the Weather? The New Climate-Economy Literature, J. Econ. Lit., 52, 740–798, https://doi.org/10.1257/jel.52.3.740, 2014.
Diffenbaugh, N. S., Swain, D. L., and Touma, D.: Anthropogenic warming has increased drought risk in California, P. Natl. Acad. Sci. USA, 112, 3931–3936, https://doi.org/10.1073/pnas.1422385112, 2015.
Eckstein, D., Künzel, V., and Schafer, L.: GLOBAL CLIMATE RISK INDEX 2021 Who Suffers Most from Extreme Weather Events? Westher-Related Loss Events in 2019 and 2000–2019, Germanwatch e.V., https://www.germanwatch.org/en/cri (last access: 17 April 2023), 2021.
Eyring, V., Bony, S., Meehl, G. A., Senior, C. A., Stevens, B., Stouffer, R. J., and Taylor, K. E.: Overview of the Coupled Model Intercomparison Project Phase 6 (CMIP6) experimental design and organization, Geosci. Model Dev., 9, 1937–1958, https://doi.org/10.5194/gmd-9-1937-2016, 2016.
Feng, S., Wu, X., Hao, Z., Hao, Y., Zhang, X., and Hao, F.: A database for characteristics and variations of global compound dry and hot events, Weather and Climate Extremes, 30, 100299, https://doi.org/10.1016/j.wace.2020.100299, 2020.
Forzieri, G., Feyen, L., Russo, S., Vousdoukas, M., Alfieri, L., Outten, S., Migliavacca, M., Bianchi, A., Rojas, R., and Cid, A.: Multi-hazard assessment in Europe under climate change, Climatic Change, 137, 105–119, https://doi.org/10.1007/s10584-016-1661-x, 2016.
Frame, D. J., Rosier, S. M., Noy, I., Harrington, L. J., Carey-Smith, T., Sparrow, S. N., Stone, D. A., and Dean, S. M.: Climate change attribution and the economic costs of extreme weather events: a study on damages from extreme rainfall and drought, Climatic Change, 162, 781–797, https://doi.org/10.1007/s10584-020-02729-y, 2020.
Gross, M. H., Donat, M. G., Alexander, L. V., and Sherwood, S. C.: Amplified warming of seasonal cold extremes relative to the mean in the Northern Hemisphere extratropics, Earth Syst. Dynam., 11, 97–111, https://doi.org/10.5194/esd-11-97-2020, 2020.
Guo, J., Kubli, D., Saner, P., Ronke, P., and Swiss Re Institute: The Economics of Climate Change: No Action Not an Option, Swiss Re Institute, 2021.
Hao, Z., Hao, F., Singh, V. P., and Zhang, X.: Changes in the severity of compound drought and hot extremes over global land areas, Environ. Res. Lett., 13, 124022, https://doi.org/10.1088/1748-9326/aaee96, 2018.
Hauser, M., Orth, R., and Seneviratne, S. I.: Role of soil moisture versus recent climate change for the 2010 heat wave in western Russia, Geophys. Res. Lett., 43, 2819–2826, https://doi.org/10.1002/2016GL068036, 2016.
Herrera-Estrada, J. E. and Sheffield, J.: Uncertainties in Future Projections of Summer Droughts and Heat Waves over the Contiguous United States, J. Climate, 30, 6225–6246, https://doi.org/10.1175/JCLI-D-16-0491.1, 2017.
Holmes, C. R., Woollings, T., Hawkins, E., and de Vries, H.: Robust Future Changes in Temperature Variability under Greenhouse Gas Forcing and the Relationship with Thermal Advection, J. Climate, 29, 2221–2236, https://doi.org/10.1175/JCLI-D-14-00735.1, 2016.
IPCC: Summary for Policymakers, in: Climate Change 2021: The Physical Science Basis. Contribution of Working Group I to the Sixth Assessment Report of the Intergovernmental Panel on Climate Change, edited by: Masson-Delmotte, V., Zhai, P., Pirani, A., Connors, S. L., Péan, C., Berger, S., Caud, N., Chen, Y., Goldfarb, L., Gomis, M. I., Huang, M., Leitzell, K., Lonnoy, E., Matthews, J. B. R., Maycock, T. K., Waterfield, T., Yelekçi, O., Yu, R., and Zhou, B., Cambridge University Press, Cambridge, United Kingdom and New York, NY, USA, 3–32, https://doi.org/10.1017/9781009157896.001, 2021.
Jahn, M.: Economics of extreme weather events: Terminology and regional impact models, Weather and Climate Extremes, 10, 29–39, https://doi.org/10.1016/j.wace.2015.08.005, 2015.
Jones, B. and O'Neill, B. C.: Spatially explicit global population scenarios consistent with the Shared Socioeconomic Pathways, Environ. Res. Lett., 11, 084003, https://doi.org/10.1088/1748-9326/11/8/084003, 2016.
Jones, B. and O'Neill, B. C.: Global One-Eighth Degree Population Base Year and Projection Grids Based on the Shared Socioeconomic Pathways, Revision 01, Palisades, New York, NASA Socioeconomic Data and Applications Center (SEDAC), https://doi.org/10.7927/m30p-j498, 2020.
Jones, B. F. and Olken, B. A.: Climate Shocks and Exports, Am. Econ. Rev., 100, 454–459, https://doi.org/10.1257/aer.100.2.454, 2010.
Jones, P. W.: First- and Second-Order Conservative Remapping Schemes for Grids in Spherical Coordinates, Mon. Weather Rev., 127, 2204–2210, https://doi.org/10.1175/1520-0493(1999)127<2204:FASOCR>2.0.CO;2, 1999.
Kelebek, M. B., Batibeniz, F., and Önol, B.: Exposure Assessment of Climate Extremes over the Europe–Mediterranean Region, Atmosphere, 12, 633, https://doi.org/10.3390/atmos12050633, 2021.
Kirono, D. G. C., Hennessy, K. J., and Grose, M. R.: Increasing risk of months with low rainfall and high temperature in southeast Australia for the past 150 years, Climate Risk Management, 16, 10–21, https://doi.org/10.1016/j.crm.2017.04.001, 2017.
Kong, Q., Guerreiro, S. B., Blenkinsop, S., Li, X.-F., and Fowler, H. J.: Increases in summertime concurrent drought and heatwave in Eastern China, Weather and Climate Extremes, 28, 100242, https://doi.org/10.1016/j.wace.2019.100242, 2020.
Krishnan, A. and Bhaskaran, P. K.: Skill assessment of global climate model wind speed from CMIP5 and CMIP6 and evaluation of projections for the Bay of Bengal, Clim. Dynam., 55, 2667–2687, https://doi.org/10.1007/s00382-020-05406-z, 2020.
Lange, S., Volkholz, J., Geiger, T., Zhao, F., Vega, I., Veldkamp, T., Reyer, C. P. O., Warszawski, L., Huber, V., Jägermeyr, J., Schewe, J., Bresch, D. N., Büchner, M., Chang, J., Ciais, P., Dury, M., Emanuel, K., Folberth, C., Gerten, D., Gosling, S. N., Grillakis, M., Hanasaki, N., Henrot, A., Hickler, T., Honda, Y., Ito, A., Khabarov, N., Koutroulis, A., Liu, W., Müller, C., Nishina, K., Ostberg, S., Müller Schmied, H., Seneviratne, S. I., Stacke, T., Steinkamp, J., Thiery, W., Wada, Y., Willner, S., Yang, H., Yoshikawa, M., Yue, C., and Frieler, K.: Projecting Exposure to Extreme Climate Impact Events Across Six Event Categories and Three Spatial Scales, Earth's Future, 8, e2020EF001616, https://doi.org/10.1029/2020EF001616, 2020.
Li, L., Yao, N., Li, Y., Liu, D. L., Wang, B., and Ayantobo, O. O.: Future projections of extreme temperature events in different sub-regions of China, Atmos. Res., 217, 150–164, https://doi.org/10.1016/j.atmosres.2018.10.019, 2019.
Li, L., Wang, R., Lv, G., Ning, L., and Yuan, L.: Likelihood of warm-season compound dry and hot extremes increased with stronger dependence, Climatology (Global Change), ESS Open Archive [data set], https://doi.org/10.1002/essoar.10505090.1, 2020.
Liu, W., Sun, F., Feng, Y., Li, C., Chen, J., Sang, Y.-F., and Zhang, Q.: Increasing population exposure to global warm-season concurrent dry and hot extremes under different warming levels, Environ. Res. Lett., 16, 094002, https://doi.org/10.1088/1748-9326/ac188f, 2021.
Manning, C., Widmann, M., Bevacqua, E., Van Loon, A. F., Maraun, D., and Vrac, M.: Increased probability of compound long-duration dry and hot events in Europe during summer (1950–2013), Environ. Res. Lett., 14, 094006, https://doi.org/10.1088/1748-9326/ab23bf, 2019.
Martius, O., Pfahl, S., and Chevalier, C.: A global quantification of compound precipitation and wind extremes: COMPOUND PRECIPITATION AND WIND EXTREMES, Geophys. Res. Lett., 43, 7709–7717, https://doi.org/10.1002/2016GL070017, 2016.
Mazdiyasni, O. and AghaKouchak, A.: Substantial increase in concurrent droughts and heatwaves in the United States, P. Natl. Acad. Sci. USA, 112, 11484–11489, https://doi.org/10.1073/pnas.1422945112, 2015.
Messmer, M. and Simmonds, I.: Global analysis of cyclone-induced compound precipitation and wind extreme events, Weather and Climate Extremes, 32, 100324, https://doi.org/10.1016/j.wace.2021.100324, 2021.
Miralles, D. G., Gentine, P., Seneviratne, S. I., and Teuling, A. J.: Land-atmospheric feedbacks during droughts and heatwaves: state of the science and current challenges: Land feedbacks during droughts and heatwaves, Ann. N.Y. Acad. Sci., 1436, 19–35, https://doi.org/10.1111/nyas.13912, 2019.
Mondal, A. and Mujumdar, P. P.: Modeling non-stationarity in intensity, duration and frequency of extreme rainfall over India, J. Hydrol., 521, 217–231, https://doi.org/10.1016/j.jhydrol.2014.11.071, 2015.
Mueller, B. and Seneviratne, S. I.: Systematic land climate and evapotranspiration biases in CMIP5 simulations, Geophys. Res. Lett., 41, 128–134, https://doi.org/10.1002/2013GL058055, 2014.
Mukherjee, S. and Mishra, A. K.: Increase in Compound Drought and Heatwaves in a Warming World, Geophys. Res. Lett., 48, e2020GL090617, https://doi.org/10.1029/2020GL090617, 2021.
Mukherjee, S., Mishra, A. K., Mann, M. E., and Raymond, C.: Anthropogenic Warming and Population Growth May Double US Heat Stress by the Late 21st Century, Earth's Future, 9, e2020EF001886, https://doi.org/10.1029/2020EF001886, 2021.
Orlowsky, B. and Seneviratne, S. I.: Global changes in extreme events: regional and seasonal dimension, Climatic Change, 110, 669–696, https://doi.org/10.1007/s10584-011-0122-9, 2012.
Orlowsky, B. and Seneviratne, S. I.: Elusive drought: uncertainty in observed trends and short- and long-term CMIP5 projections, Hydrol. Earth Syst. Sci., 17, 1765–1781, https://doi.org/10.5194/hess-17-1765-2013, 2013.
Outten, S. and Sobolowski, S.: Extreme wind projections over Europe from the Euro-CORDEX regional climate models, Weather and Climate Extremes, 33, 100363, https://doi.org/10.1016/j.wace.2021.100363, 2021.
Pfahl, S., O'Gorman, P. A., and Fischer, E. M.: Understanding the regional pattern of projected future changes in extreme precipitation, Nat. Clim. Change, 7, 423–427, https://doi.org/10.1038/nclimate3287, 2017.
Poschlod, B., Zscheischler, J., Sillmann, J., Wood, R. R., and Ludwig, R.: Climate change effects on hydrometeorological compound events over southern Norway, Weather and Climate Extremes, 28, 100253, https://doi.org/10.1016/j.wace.2020.100253, 2020.
Ranasinghe, R., Ruane, A. C., Vautard, R., Arnell, N., Coppola, E., Cruz, F. A., Dessai, S., Islam, A. S., Rahimi, M., Ruiz Carrascal, D., Sillmann, J., Sylla, M. B., Tebaldi, C., Wang, W., and Zaaboul, R.: Climate Change Information for Regional Impact and for Risk Assessment, in: Climate Change 2021: The Physical Science Basis. Contribution of Working Group I to the Sixth Assessment Report of the Intergovernmental Panel on Climate Change, edited by: Masson-Delmotte, V., Zhai, P., Pirani, A., Connors, S. L., Péan, C., Berger, S., Caud, N., Chen, Y., Goldfarb, L., Gomis, M. I., Huang, M., Leitzell, K., Lonnoy, E., Matthews, J. B. R., Maycock, T. K., Waterfield, T., Yelekçi, O., Yu, R., and Zhou, B., Cambridge University Press, Cambridge, United Kingdom and New York, NY, USA, 1767–1926, https://doi.org/10.1017/9781009157896.014, 2021.
Rasmijn, L. M., van der Schrier, G., Bintanja, R., Barkmeijer, J., Sterl, A., and Hazeleger, W.: Future equivalent of 2010 Russian heatwave intensified by weakening soil moisture constraints, Nat. Clim. Change, 8, 381–385, https://doi.org/10.1038/s41558-018-0114-0, 2018.
Raveh-Rubin, S. and Wernli, H.: Large-scale wind and precipitation extremes in the Mediterranean: a climatological analysis for 1979–2012: Mediterranean Large-scale Wind and Precipitation Extremes, Q. J. Roy. Meteor. Soc., 141, 2404–2417, https://doi.org/10.1002/qj.2531, 2015.
Reale, M., Cabos Narvaez, W. D., Cavicchia, L., Conte, D., Coppola, E., Flaounas, E., Giorgi, F., Gualdi, S., Hochman, A., Li, L., Lionello, P., Podrascanin, Z., Salon, S., Sanchez-Gomez, E., Scoccimarro, E., Sein, D. V., and Somot, S.: Future projections of Mediterranean cyclone characteristics using the Med-CORDEX ensemble of coupled regional climate system models, Clim. Dynam., 58, 2501–2524, https://doi.org/10.1007/s00382-021-06018-x, 2021.
Ridder, N. N., Pitman, A. J., Westra, S., Ukkola, A., Do, H. X., Bador, M., Hirsch, A. L., Evans, J. P., Di Luca, A., and Zscheischler, J.: Global hotspots for the occurrence of compound events, Nat. Commun., 11, 5956, https://doi.org/10.1038/s41467-020-19639-3, 2020.
Ridder, N. N., Pitman, A. J., and Ukkola, A. M.: Do CMIP6 Climate Models Simulate Global or Regional Compound Events Skillfully?, Geophys. Res. Lett., 48, e2020GL091152, https://doi.org/10.1029/2020GL091152, 2021.
Roser, M., Ritchie, H., Ortiz-Ospina, E., and Rodés-Guirao, L.: World Population Growth, Our World in Data, https://ourworldindata.org/world-population-growth (last access: 18 April 2023), 2013.
Rossow, W. B., Mekonnen, A., Pearl, C., and Goncalves, W.: Tropical Precipitation Extremes, J. Climate, 26, 1457–1466, https://doi.org/10.1175/JCLI-D-11-00725.1, 2013.
Saeed, F., Schleussner, C., and Ashfaq, M.: Deadly Heat Stress to Become Commonplace Across South Asia Already at 1.5 ∘C of Global Warming, Geophys. Res. Lett., 48, e2020GL091191, https://doi.org/10.1029/2020GL091191, 2021.
Sarhadi, A., Ausín, M. C., Wiper, M. P., Touma, D., and Diffenbaugh, N. S.: Multidimensional risk in a nonstationary climate: Joint probability of increasingly severe warm and dry conditions, Sci. Adv., 4, eaau3487, https://doi.org/10.1126/sciadv.aau3487, 2018.
Schubert, S. D., Wang, H., Koster, R. D., Suarez, M. J., and Groisman, P. Y.: Northern Eurasian Heat Waves and Droughts, J. Climate, 27, 3169–3207, https://doi.org/10.1175/JCLI-D-13-00360.1, 2014.
Schwingshackl, C., Sillmann, J., Vicedo-Cabrera, A. M., Sandstad, M., and Aunan, K.: Heat Stress Indicators in CMIP6: Estimating Future Trends and Exceedances of Impact-Relevant Thresholds, Earth's Future, 9, e2020EF001885, https://doi.org/10.1029/2020EF001885, 2021.
Sedlmeier, K., Feldmann, H., and Schädler, G.: Compound summer temperature and precipitation extremes over central Europe, Theor. Appl. Climatol., 131, 1493–1501, https://doi.org/10.1007/s00704-017-2061-5, 2018.
Seneviratne, S. I. and Hauser, M.: Regional Climate Sensitivity of Climate Extremes in CMIP6 Versus CMIP5 Multimodel Ensembles, Earth's Future, 8, https://doi.org/10.1029/2019EF001474, 2020.
Seneviratne, S. I., Corti, T., Davin, E. L., Hirschi, M., Jaeger, E. B., Lehner, I., Orlowsky, B., and Teuling, A. J.: Investigating soil moisture–climate interactions in a changing climate: A review, Earth-Sci. Rev., 99, 125–161, https://doi.org/10.1016/j.earscirev.2010.02.004, 2010.
Seneviratne, S. I., Wilhelm, M., Stanelle, T., Hurk, B., Hagemann, S., Berg, A., Cheruy, F., Higgins, M. E., Meier, A., Brovkin, V., Claussen, M., Ducharne, A., Dufresne, J., Findell, K. L., Ghattas, J., Lawrence, D. M., Malyshev, S., Rummukainen, M., and Smith, B.: Impact of soil moisture-climate feedbacks on CMIP5 projections: First results from the GLACE-CMIP5 experiment, Geophys. Res. Lett., 40, 5212–5217, https://doi.org/10.1002/grl.50956, 2013.
Seneviratne, S. I., Donat, M. G., Pitman, A. J., Knutti, R., and Wilby, R. L.: Allowable CO2 emissions based on regional and impact-related climate targets, Nature, 529, 477–483, https://doi.org/10.1038/nature16542, 2016.
Seneviratne, S. I., Zhang, X., Adnan, M., Badi, W., Dereczynski, C., Di Luca, A., Ghosh, S., Iskandar, I., Kossin, J., Lewis, S., Otto, F., Pinto, I., Satoh, M., Vicente-Serrano, S. M., Wehner, M., and Zhou, B.: Weather and Climate Extreme Events in a Changing Climate, in: Climate Change 2021: The Physical Science Basis. Contribution of Working Group I to the Sixth Assessment Report of the Intergovernmental Panel on Climate Change, edited by: Masson-Delmotte, V., Zhai, P., Pirani, A., Connors, S. L., Péan, C., Berger, S., Caud, N., Chen, Y., Goldfarb, L., Gomis, M. I., Huang, M., Leitzell, K., Lonnoy, E., Matthews, J. B. R., Maycock, T. K., Waterfield, T., Yelekçi, O., Yu, R., and Zhou, B., Cambridge University Press, Cambridge, United Kingdom and New York, NY, USA, 1513–1766, https://doi.org/10.1017/9781009157896.013, 2021.
Sharma, S. and Mujumdar, P.: Increasing frequency and spatial extent of concurrent meteorological droughts and heatwaves in India, Sci. Rep., 7, 15582, https://doi.org/10.1038/s41598-017-15896-3, 2017.
Shen, L., Wen, J., Zhang, Y., Ullah, S., Cheng, J., and Meng, X.: Changes in population exposure to extreme precipitation in the Yangtze River Delta, China, Climate Services, 27, 100317, https://doi.org/10.1016/j.cliser.2022.100317, 2022.
Sillmann, J., Thorarinsdottir, T., Keenlyside, N., Schaller, N., Alexander, L. V., Hegerl, G., Seneviratne, S. I., Vautard, R., Zhang, X., and Zwiers, F. W.: Understanding, modeling and predicting weather and climate extremes: Challenges and opportunities, Weather and Climate Extremes, 18, 65–74, https://doi.org/10.1016/j.wace.2017.10.003, 2017.
Singh, J., Ashfaq, M., Skinner, C., Anderson, W., Mishra, V., and Singh, D.: Enhanced risk of concurrent regional droughts with increased ENSO variability and warming, In Review, https://doi.org/10.21203/rs.3.rs-347426/v1, 2021.
Srivastava, A., Grotjahn, R., and Ullrich, P. A.: Evaluation of historical CMIP6 model simulations of extreme precipitation over contiguous US regions, Weather and Climate Extremes, 29, 100268, https://doi.org/10.1016/j.wace.2020.100268, 2020.
Stocchi, P., Pichelli, E., Torres Alavez, J. A., Coppola, E., Giuliani, G., and Giorgi, F.: Non-Hydrostatic Regcm4 (Regcm4-NH): Evaluation of Precipitation Statistics at the Convection-Permitting Scale over Different Domains, Atmosphere, 13, 861, https://doi.org/10.3390/atmos13060861, 2022.
Tebaldi, C., Hayhoe, K., Arblaster, J. M., and Meehl, G. A.: Going to the Extremes: An Intercomparison of Model-Simulated Historical and Future Changes in Extreme Events, Climatic Change, 79, 185–211, https://doi.org/10.1007/s10584-006-9051-4, 2006.
Tilloy, A., Malamud, B. D., and Joly-Laugel, A.: A methodology for the spatiotemporal identification of compound hazards: wind and precipitation extremes in Great Britain (1979–2019), Earth Syst. Dynam., 13, 993–1020, https://doi.org/10.5194/esd-13-993-2022, 2022.
UNFCCC (United Nations Framework Convention on Climate Change): Adoption of the Paris Agreement, Report No. FCCC/CP/2015/L.9/Rev.1, United Nations Framework Convention on Climate Change, Bonn, Germany, 2015.
United Nations, Department of Economic and Social Affairs, Population Division: World Urbanization Prospects: The 2018 Revision, New York, United Nations, ST/ESA/SER.A/420, 2019.
Vogel, M. M., Orth, R., Cheruy, F., Hagemann, S., Lorenz, R., Hurk, B. J. J. M., and Seneviratne, S. I.: Regional amplification of projected changes in extreme temperatures strongly controlled by soil moisture-temperature feedbacks, Geophys. Res. Lett., 44, 1511–1519, https://doi.org/10.1002/2016GL071235, 2017.
Vogel, M. M., Hauser, M., and Seneviratne, S. I.: Projected changes in hot, dry and wet extreme events' clusters in CMIP6 multi-model ensemble, Environ. Res. Lett., 15, 094021, https://doi.org/10.1088/1748-9326/ab90a7, 2020.
Wartenburger, R., Hirschi, M., Donat, M. G., Greve, P., Pitman, A. J., and Seneviratne, S. I.: Changes in regional climate extremes as a function of global mean temperature: an interactive plotting framework, Geosci. Model Dev., 10, 3609–3634, https://doi.org/10.5194/gmd-10-3609-2017, 2017.
Westra, S., Alexander, L. V., and Zwiers, F. W.: Global Increasing Trends in Annual Maximum Daily Precipitation, J. Climate, 26, 3904–3918, https://doi.org/10.1175/JCLI-D-12-00502.1, 2013.
Wilcox, E. M. and Donner, L. J.: The Frequency of Extreme Rain Events in Satellite Rain-Rate Estimates and an Atmospheric General Circulation Model, J. Climate, 20, 53–69, https://doi.org/10.1175/JCLI3987.1, 2007.
Wu, S., Chan, T. O., Zhang, W., Ning, G., Wang, P., Tong, X., Xu, F., Tian, H., Han, Y., Zhao, Y., and Luo, M.: Increasing Compound Heat and Precipitation Extremes Elevated by Urbanization in South China, Front. Earth Sci., 9, 636777, https://doi.org/10.3389/feart.2021.636777, 2021.
Yu, R. and Zhai, P.: More frequent and widespread persistent compound drought and heat event observed in China, Sci. Rep., 10, 14576, https://doi.org/10.1038/s41598-020-71312-3, 2020.
Zhang, X., Hegerl, G., Zwiers, F. W., and Kenyon, J.: Avoiding Inhomogeneity in Percentile-Based Indices of Temperature Extremes, J. Climate, 18, 1641–1651, https://doi.org/10.1175/JCLI3366.1, 2005.
Zhou, P. and Liu, Z.: Likelihood of concurrent climate extremes and variations over China, Environ. Res. Lett., 13, 094023, https://doi.org/10.1088/1748-9326/aade9e, 2018.
Zhu, H., Jiang, Z., Li, J., Li, W., Sun, C., and Li, L.: Does CMIP6 Inspire More Confidence in Simulating Climate Extremes over China?, Adv. Atmos. Sci., 37, 1119–1132, https://doi.org/10.1007/s00376-020-9289-1, 2020.
Zhu, Y.-Y. and Yang, S.: Evaluation of CMIP6 for historical temperature and precipitation over the Tibetan Plateau and its comparison with CMIP5, Advances in Climate Change Research, 11, 239–251, https://doi.org/10.1016/j.accre.2020.08.001, 2020.
Zscheischler, J. and Seneviratne, S. I.: Dependence of drivers affects risks associated with compound events, Sci. Adv., 3, e1700263, https://doi.org/10.1126/sciadv.1700263, 2017.
Zscheischler, J., van den Hurk, B., Ward, P. J., and Westra, S.: Multivariate extremes and compound events, in: Climate Extremes and Their Implications for Impact and Risk Assessment, Elsevier, 59–76, https://doi.org/10.1016/B978-0-12-814895-2.00004-5, 2020.
Zscheischler, J., Naveau, P., Martius, O., Engelke, S., and Raible, C. C.: Evaluating the dependence structure of compound precipitation and wind speed extremes, Earth Syst. Dynam., 12, 1–16, https://doi.org/10.5194/esd-12-1-2021, 2021.