the Creative Commons Attribution 4.0 License.
the Creative Commons Attribution 4.0 License.
 | 24 Jan 2023
PInc-PanTher estimates of Arctic permafrost soil carbon under the GeoMIP G6solar and G6sulfur experiments
John C. Moore
Circum-Arctic permafrost stores large amounts of frozen carbon that must be maintained to avoid catastrophic climate change. Solar geoengineering has the potential to cool the Arctic surface by increasing planetary albedo but could also reduce tundra productivity. Here, we improve the data-constrained PInc-PanTher model of permafrost carbon storage by including estimates of plant productivity and rhizosphere priming on soil carbon. Six earth system models are used to drive the model, running G6solar (solar dimming) and G6sulfur (stratospheric sulfate aerosols) experiments, which reduce radiative forcing from SSP5-8.5 (no mitigation) to SSP2-4.5 (substantive mitigation) levels. By 2100, simulations indicate a loss of 9.2 ± 0.4 million km2 (mean ± standard error) of permafrost area and 81 ± 8 Pg of soil carbon under the SSP5-8.5 scenario. In comparison, under SSP2-4.5, G6solar, and G6sulfur, permafrost area loss would be mitigated by approximately 39 %, 37 %, and 34 % and soil carbon loss by 42 %, 54 %, and 47 %, respectively, relative to SSP5-8.5. Uncertainties in permafrost soil C loss estimates arise mainly from changes in vegetation productivity. Increased carbon flux from vegetation to soil raises soil C storage, while the priming effects of root exudates lowers it, with a net mitigating effect on soil C loss. Despite model differences, the protective effects of G6solar and G6sulfur on permafrost area and soil C storage are consistent and significant for all ESMs. G6 experiments mitigate ∼ of permafrost area loss and halve carbon loss for SSP5-8.5, averting USD 0–70 trillion (mean of USD 20 trillion) in economic losses through reduced permafrost emissions.
- Article
(8883 KB) - Full-text XML
-
Supplement
(374 KB) - BibTeX
- EndNote


There is a roughly 50 % chance that the world will limit warming to 2 ∘C above pre-industrial if current international carbon emission commitments are fully met (Liu et al., 2022; Meinshausen et al., 2022). Relying on increased carbon sinks or CO2 removal to compensate for, or offset, fossil fuel emissions is not, at present, a reliable substitute for emissions controls (Fankhauser et al., 2022), and various effects of CO2 already in the atmosphere will persist for centuries. Over recent decades the Arctic has warmed much faster than the global average (IPCC SROCC, 2020), placing much of the cryosphere, including the permafrost, at risk of thaw (Biskaborn et al., 2019). The large hysteresis in the water–ice phase change and associated climate feedbacks make this an essentially irreversible change and a potential “tipping point” (McKay et al., 2022). Permafrost covers 22 % of the exposed land area in the Northern Hemisphere (Obu et al., 2019) and contains ∼ 1000 Pg of soil organic carbon in its upper 3 m (Hugelius et al., 2014; Mishra et al., 2021). Deepening of the seasonally thawed permafrost active layer will induce microbial degradation of previously frozen soil organic carbon to CO2 and CH4, producing the permafrost carbon–climate feedback (PCF). An extreme warming scenario where no emissions mitigation occurs (RCP8.5 or similar) is expected to reduce the area of Arctic permafrost by 30 %–99 % by 2100 and soil carbon storage by many tens of petagrams of carbon, with a multi-model average estimate of 92 ± 17 Pg C (Schuur et al., 2015; IPCC SROCC, 2020).
Solar geoengineering (SG), a class of methods that limit or reverse anthropogenic climate change by reducing the amount of sunlight reaching earth, has the potential to change earth's climate, moderating climate hazards (Irvine et al., 2019). The principal advantage of SG compared with CO2 removal and substantial emission reductions is that temperatures can be reduced far faster. SG may also face fewer technical and financial hurdles (Aldy et al., 2021); however, the potential for damage by SG has not yet been fully explored (Zarnetske et al., 2021). In an earlier study, Chen et al. (2020) found that five of seven CMIP5 earth system models (ESMs) driven by the Geoengineering Model Intercomparison Project (GeoMIP) G4 stratospheric aerosol injection geoengineering scheme simulated significant mitigation of Arctic permafrost soil carbon loss. The G4 scenario specifies an injection of SO2 into the equatorial lower stratosphere at an annual rate equivalent to about of the 1991 Mt. Pinatubo volcanic eruption under the RCP4.5 moderate pure greenhouse gas (GHG) emissions scenario. The ESMs used and specification of the geoengineering scenarios have since been improved for the CMIP6 round of experiments.
Table 1The CMIP6 models used in this study and their main features. The attributes of ESMs listed here are relevant to the soil temperature (TSL), net primary productivity (NPP), and gross primary productivity (GPP) outputs, which are used to drive a mechanistic soil carbon model for simulating permafrost carbon dynamics. G6sulfur aerosols indicate the use of prescribed aerosol optical depth (AOD) or internally calculated values derived from injected SO2 (Visioni et al., 2021).
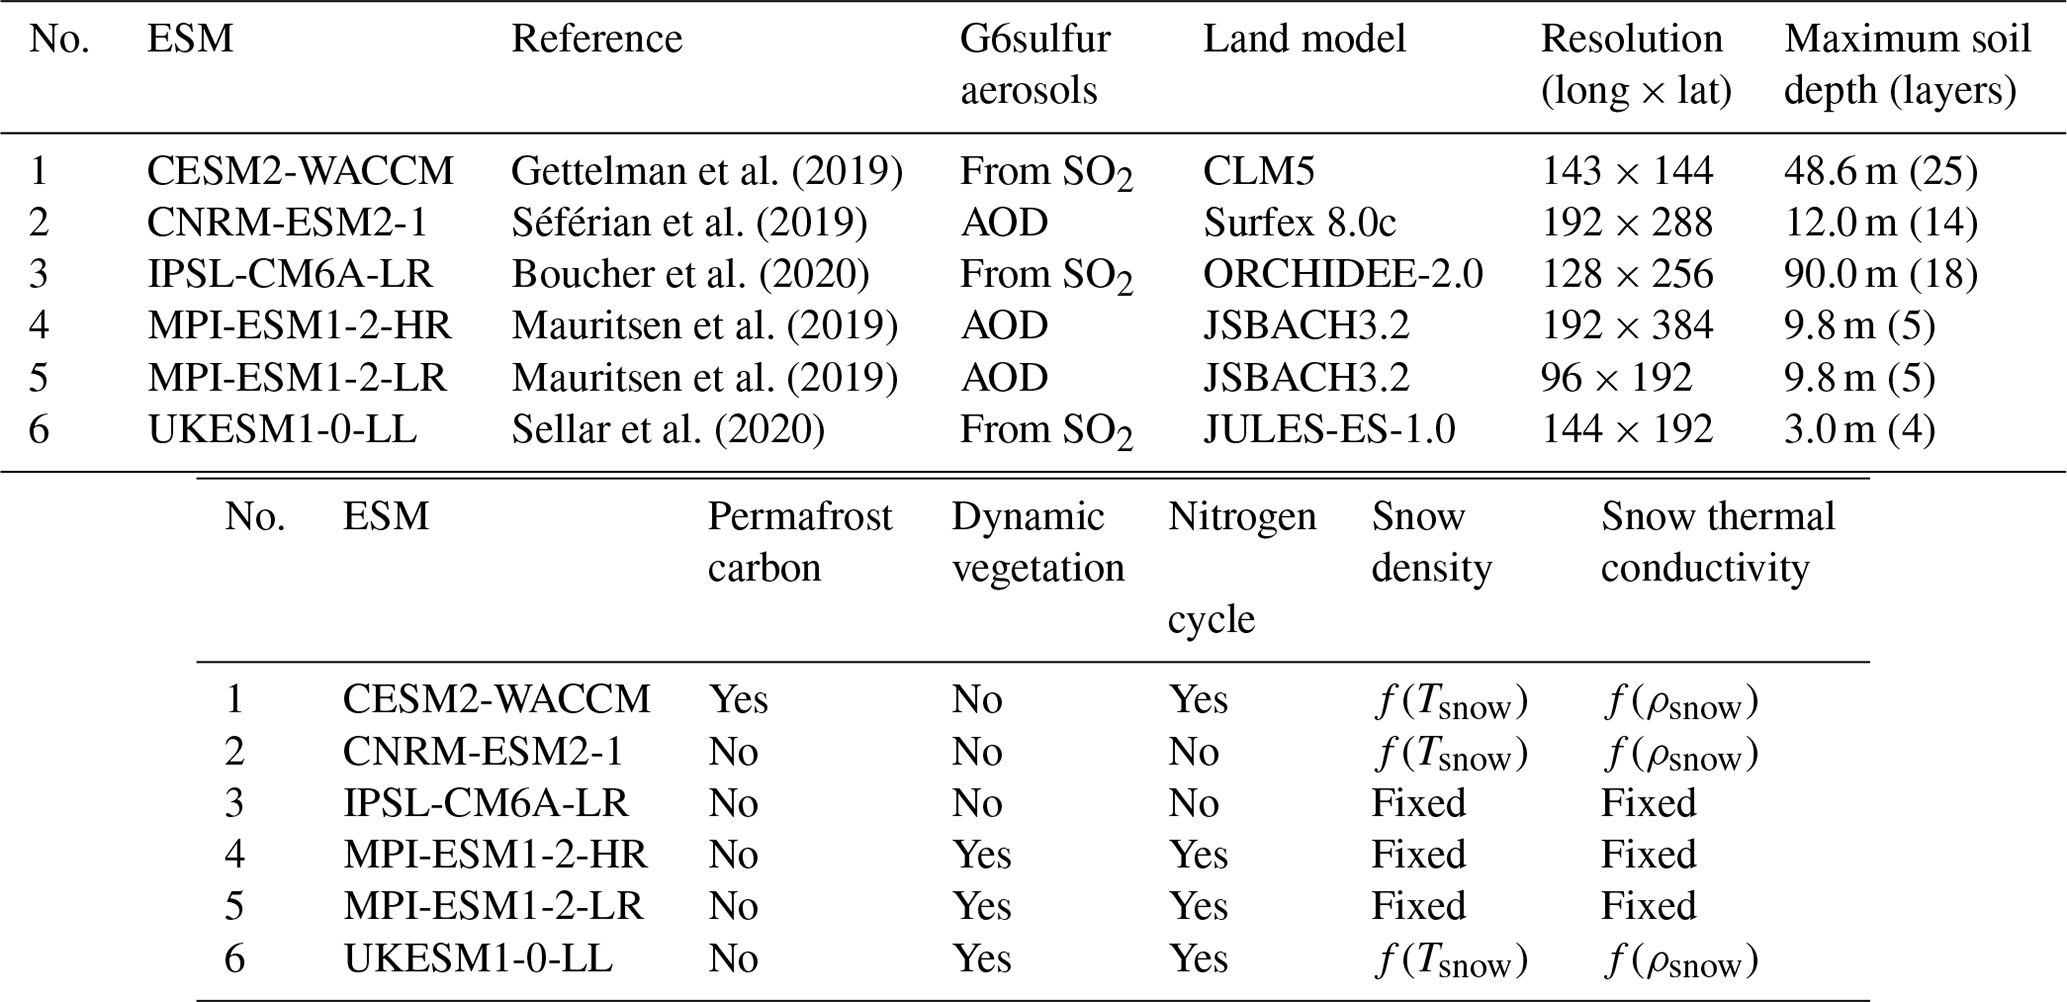
We investigate the response of permafrost area and soil C stocks to GHG- and SG-imposed changes in radiative forcing, comparing two SG schemes (G6solar: solar dimming; G6sulfur: stratospheric sulfate aerosols), as well as high-GHG (SSP5-8.5) and medium-GHG (SSP2-4.5) scenarios. The G6solar and G6sulfur experiments are part of the GeoMIP6 (Kravitz et al., 2015), which specifies a reduction in radiative forcing from the SSP5-8.5 to SSP2-4.5 level by solar irradiance reduction or stratospheric aerosol injection, respectively. G6 may represent slightly more realistic simulations than previous scenarios such as G4, since the amount of SG required to meet the goal varies over time and is dependent on ESM climate and sulfate aerosol sensitivity. The implementation of the G6sulfur experiment varies with the sophistication of the ESM atmospheric physical-chemistry component, ranging from calculations dependent on SO2 emissions to prescribed aerosol optical depth distributions (Visioni et al., 2021). More sophisticated SG deployment strategies are being explored such as the latitudes of injection and its seasonality (Lee et al., 2021, 2022) but are still at the single-ESM simulation stage, while the G6 experiments have been simulated by six ESMs (Table 1).
We use the outputs of the six CMIP6 ESMs to drive a data-constrained, process-based permafrost carbon model and compare the results it gives to the soil carbon changes calculated directly within each of the ESMs. These six ESMs contain simulations for the G6solar, G6sulfur, SSP5-8.5, and SSP2-4.5 scenarios up to 2100, and their first ensemble members were used for analysis. The primary objective is to determine the effects of implementing the G6solar and G6sulfur experiments on permafrost area and soil carbon loss and to assess whether the six ESMs produce a response consistent with expectations that the cooling effect of SG will inhibit Arctic warming, slow permafrost degradation, and reduce PCF-induced GHG emissions. We then assess the economic benefits of G6-type geoengineering proposals for avoiding catastrophic permafrost degradation through an integrated assessment model that links the warming potential of the PCF to the corresponding economic impacts.
2.1 Model description and bias correction for ESM simulations
CMIP6 ESMs have many improvements over preceding generations of CMIP models, including better treatment of snow radiative transfer and insulation effects, soil hydrology, and vegetation dynamics (Fox-Kemper et al., 2021). However, estimates of permafrost extent and carbon stock changes still vary across models, which has been associated with deficiencies in the representation of soil thermodynamics and carbon dynamics (Burke et al., 2020; Mudryk et al., 2020). Of the six CMIP6 models we used (Table 1), only the CESM2-WACCM land surface model (CLM5) adjusted permafrost carbon stocks to the latest observations and included a vertically resolved soil carbon representation, which is important for more consistent modelling of real-world soil carbon (Varney et al., 2022). The other five ESMs estimated initial Arctic permafrost carbon stocks (CSoil) between 67–475 Pg (Table S1 in the Supplement), which are much smaller than observed estimates (Hugelius et al., 2014; Mishra et al., 2021). MPI-ESM1-2-HR does not report CSoil, but it shares many features with MPI-ESM1-2-LR and so may be expected to have similar Csoil. CESM2-WACCM simulates a slight decrease in CSoil under SSP5-8.5, while the other ESMs show an increase in CSoil (Table S1). This is explained by the underestimation of initial permafrost CSoil, which then leads to an underestimation of future soil C decomposition. CSoil flux from surface vegetation increases due to GHG-driven increases in productivity, and this input flux exceeds soil C decomposition in those models with little initial soil carbon.
Maximum soil depth, number of soil layers, and snow schemes are important for soil temperature (TSL) simulation (Wang et al., 2016). CESM2-WACCM, CNRM-ESM2-1, and IPSL-CM6A-LR simulate more than 10 soil layers with a maximum depth greater than 10 m (Table 1), potentially producing more accurate soil temperature profiles compared with models that have shallower soil depths and fewer layers. Parametric schemes that model snow density and snow thermal conductivity as a function of snow temperature and snow density (Table 1) and take into account the mechanical compaction process of snow may provide more accurate TSL simulations than those using fixed snow parameters (Wang et al., 2016). In addition, ESMs with a dynamic vegetation and nitrogen cycle (MPI-ESM1-2-HR, MPI-ESM1-2-LR, and UKESM1-0-LL) may be able to more accurately model changes in vegetation C pools and input fluxes to soil C pools (Table 1).
Since the ESMs produce great differences in the key parameters that drive carbon storage in the permafrost region, we eliminate the systematic errors in ESM simulations by a bias correction procedure. We bias-correct the TSL, NPP, and GPP outputs of the ESMs with the trend-preserving Inter-Sectoral Impact Model Intercomparison Project (ISI-MIP) method (Hempel et al., 2013). This method produces a distribution of each parameter that matches the mean of the reference field over its record length but maintains the ESM-dependent time trend of each field. The bias correction process downscales the data to match the chosen reference field, in this case the 0.1∘ × 0.1∘ reanalysis data and satellite observations from 2015 to 2020. Our study region excludes sporadic/isolated patches of permafrost and dynamics of non-permafrost soil orders occurring within discontinuous permafrost regions because we are primarily concerned with forced, large-scale permafrost degradation and mitigated soil carbon loss in response to the cooling effects of SG.
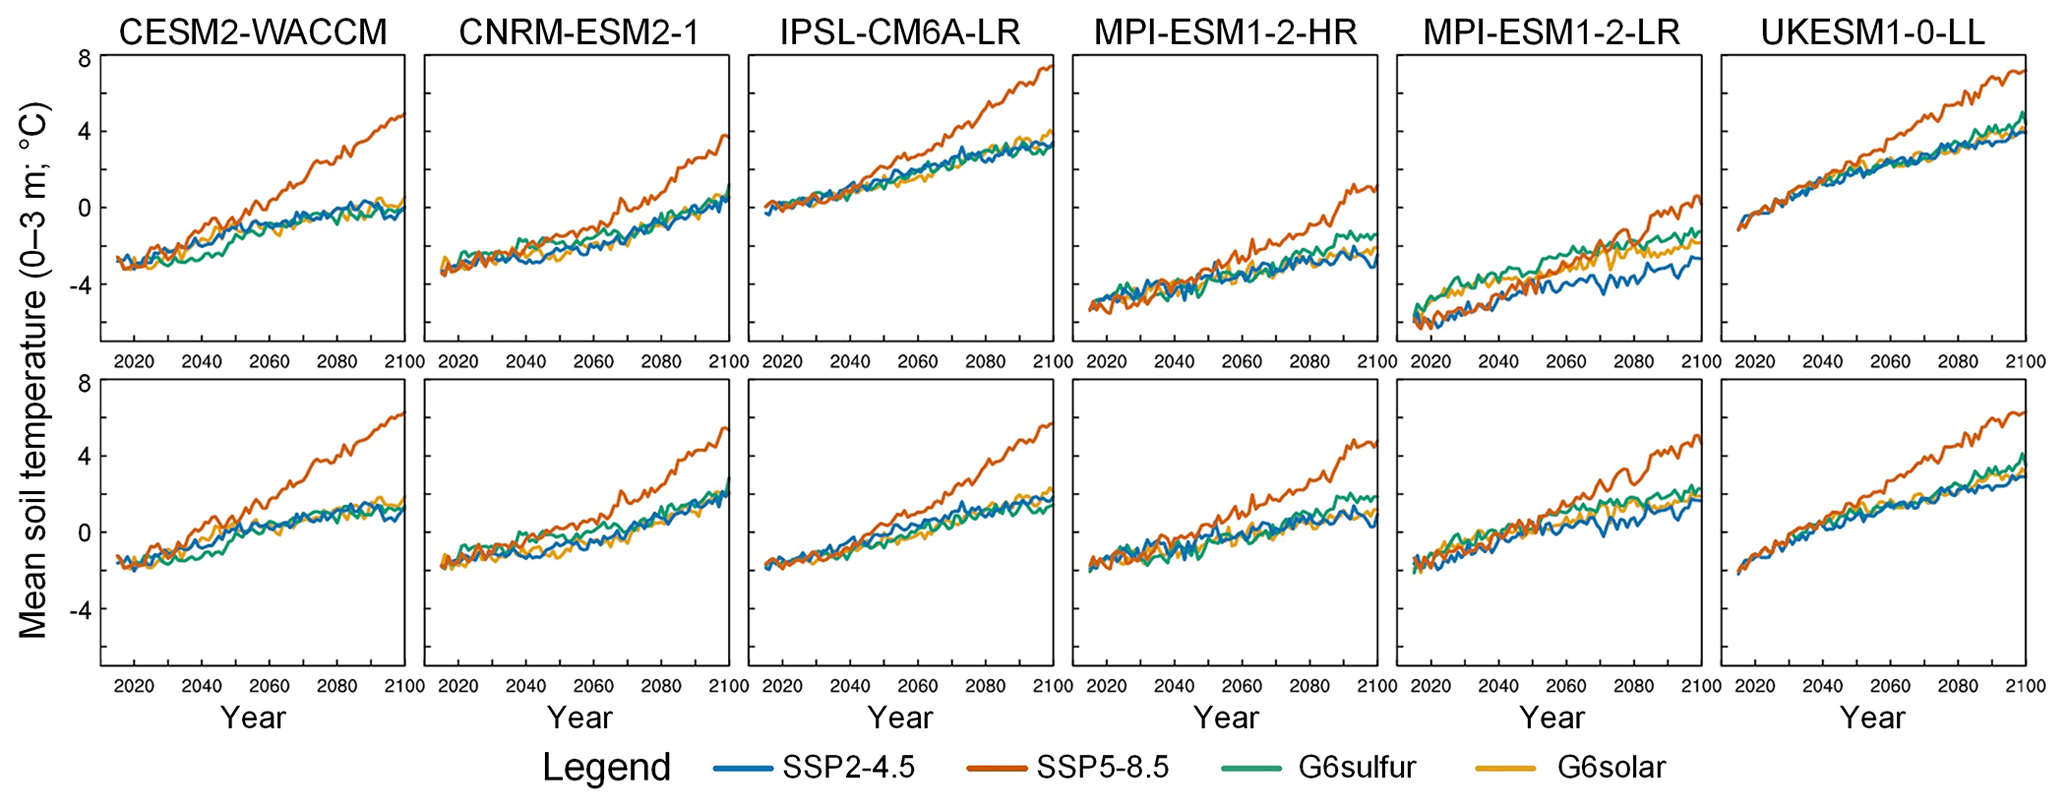
Figure 1Bias correction of soil temperature (TSL). Mean annual soil temperature in the upper 3 m of the circum-Arctic permafrost region before (top row) and after (bottom row) bias correction. The bias correction offsets for each ESM are shown in Table 2.
The TSL outputs of ESMs are bias-corrected using soil temperatures from ERA5-Land reanalysis data (Muñoz-Sabater et al., 2021). Figure 1 shows the need for initial bias correction before assessing permafrost degradation and soil C loss, since the soil and snow physical processes that determine the thermal properties of permafrost soils differ greatly among the CMIP6 ESMs. Before bias correction, the mean annual soil temperatures simulated by four ESMs are 2 to 4 ∘C lower than that of the ERA5-Land. Since decomposition rate is a nonlinear function of TSL, lower simulated TSL leads to an underestimation of soil C loss. The upward trends in soil temperature are preserved after bias correction, and the G6solar and G6sulfur experiments effectively reduce soil temperature to levels similar to those of the SSP2-4.5 simulations (Fig. 1), despite GHG levels being as in SSP5-8.5. The six CMIP6 ESMs simulated soil temperatures in the circum-Arctic permafrost region increase by 7.2 ± 0.2 (mean ± standard error), 3.3 ± 0.2, 3.5 ± 0.2, and 3.6 ± 0.3 ∘C between 2020 and 2100 under the SSP5-8.5, SSP2-4.5, G6solar, and G6sulfur scenarios, respectively.
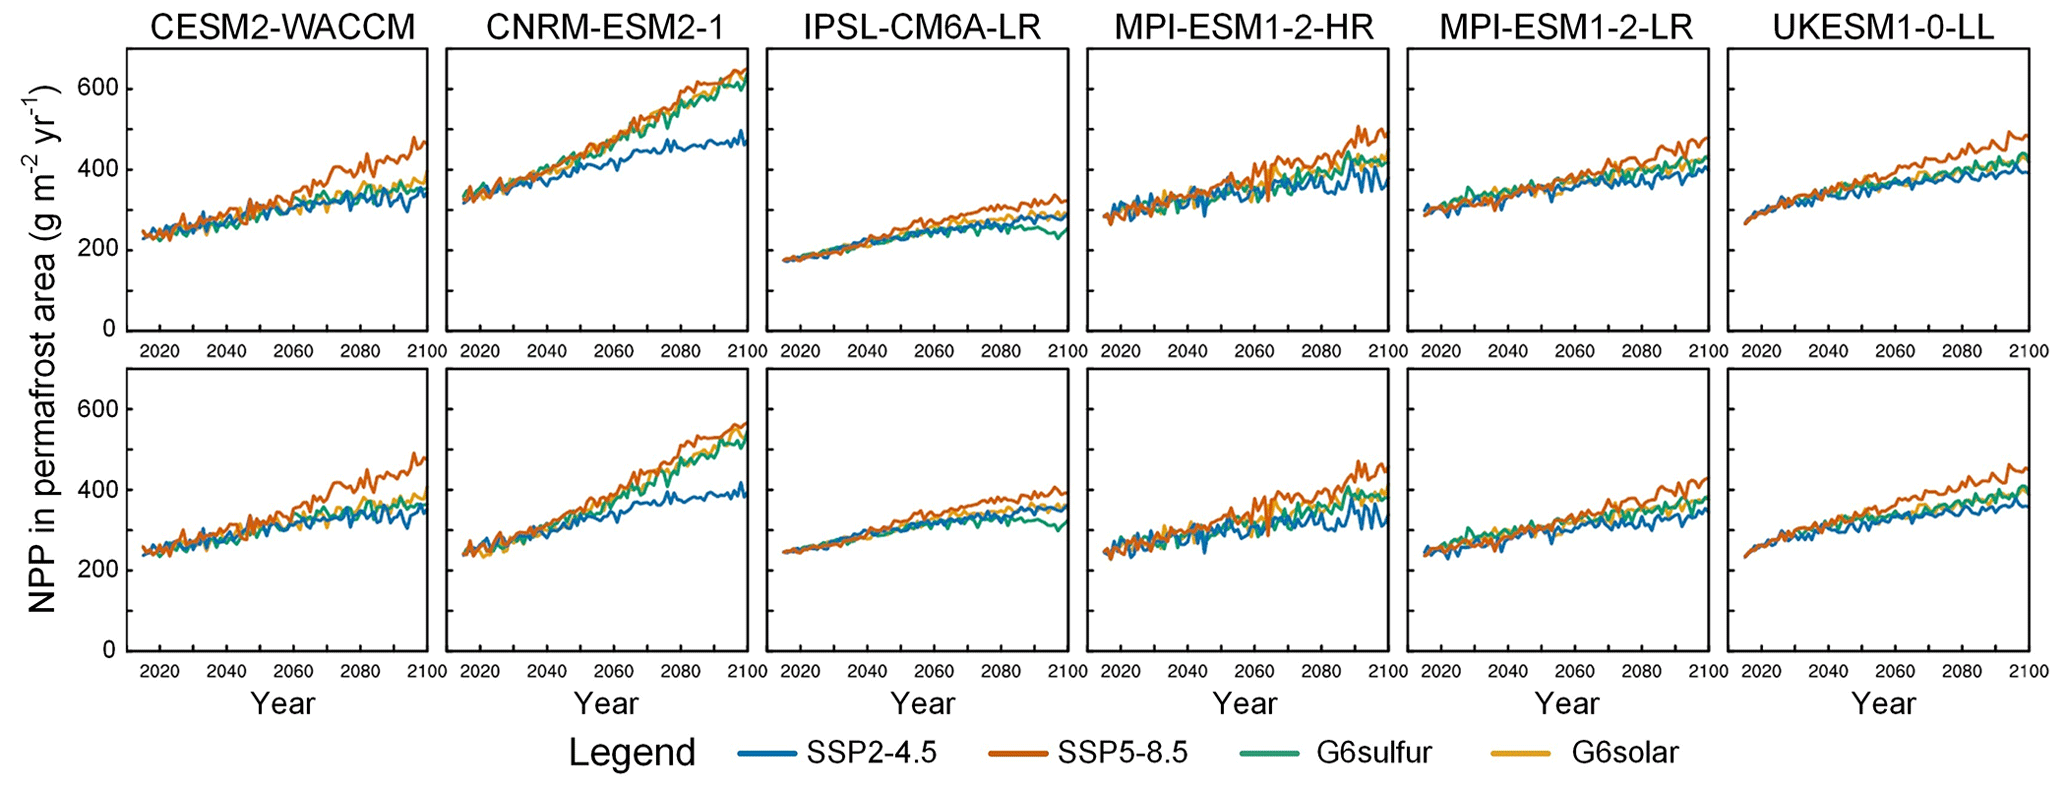
Figure 2Bias correction of net primary productivity (NPP). Mean NPP in the permafrost region before (top row) and after (bottom row) bias correction. The bias correction offsets for each ESM are shown in Table 2.
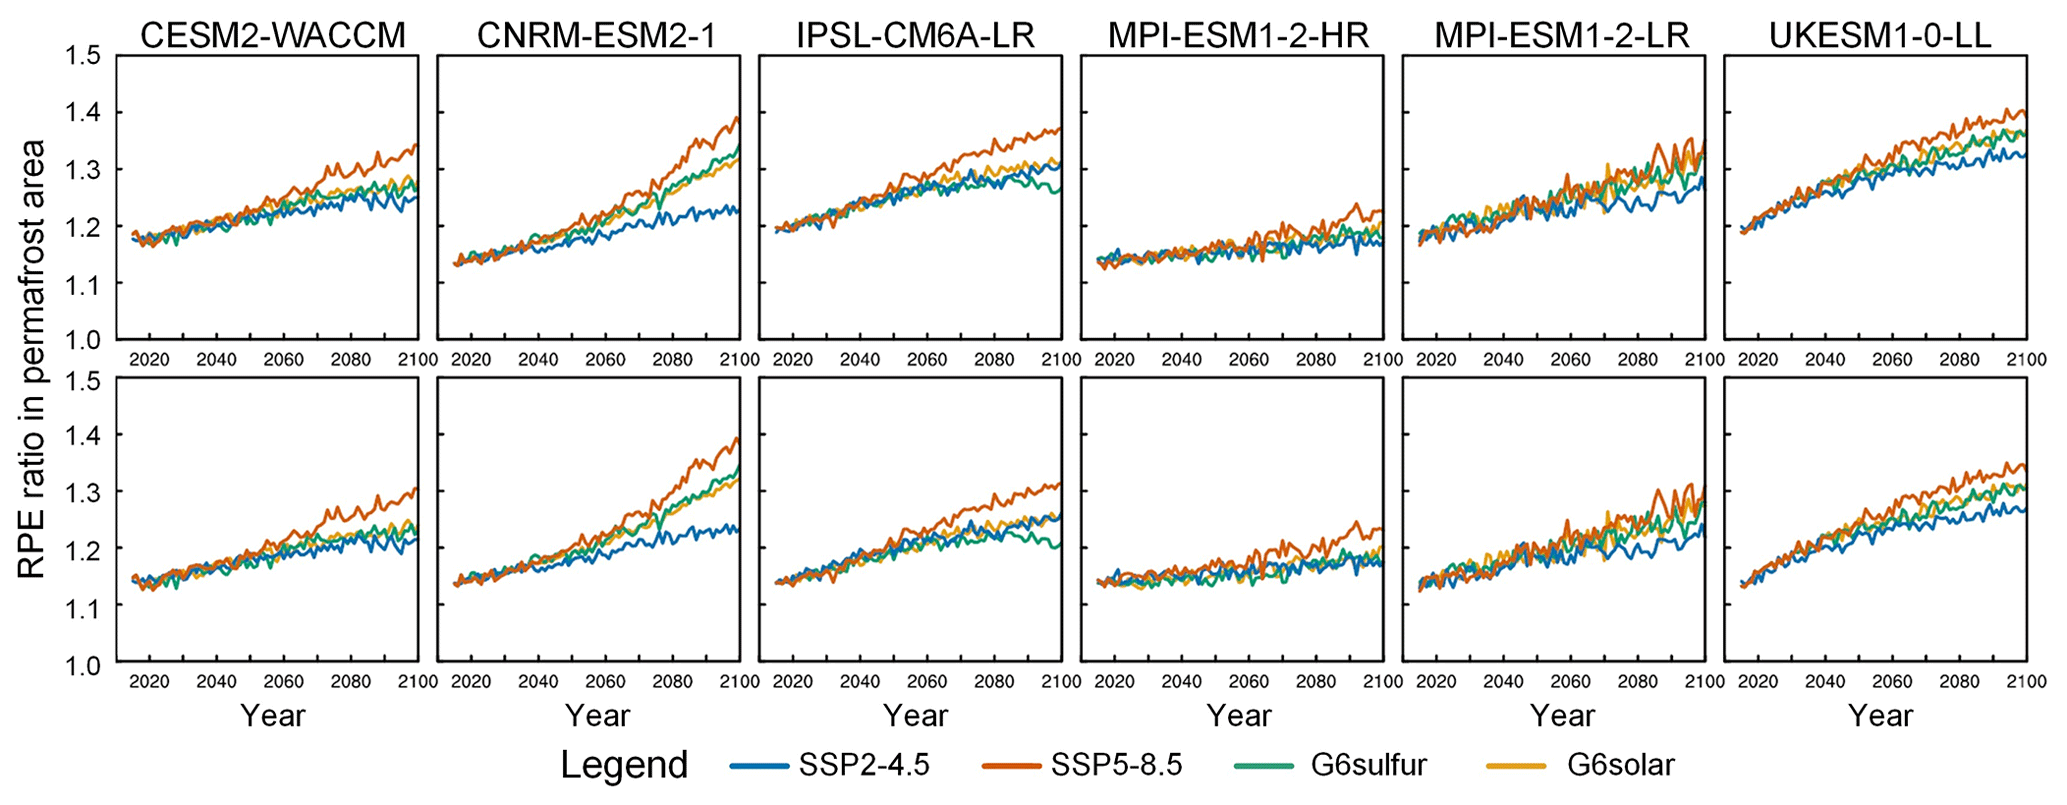
Figure 3Bias correction of rhizosphere priming effect (RPE) ratio. Mean RPE ratio in the permafrost region before (top row) and after (bottom row) bias correction. RPE ratio is calculated from gross primary productivity (GPP). The bias correction offsets for each ESM are shown in Table 2.
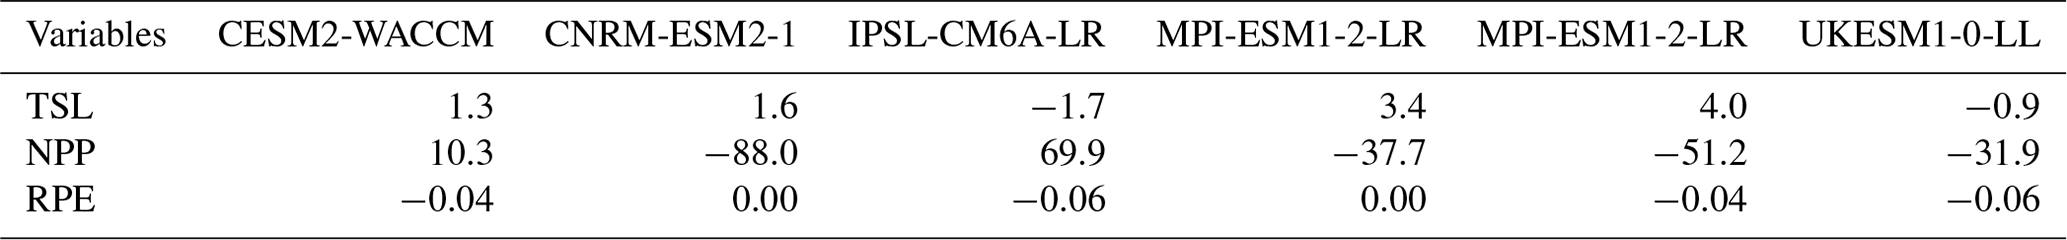
Table 2Bias correction mean offsets of TSL, NPP, and RPE. Mean offsets of soil temperature (TSL; ∘C), net primary productivity (NPP; ), and rhizosphere priming effect (RPE; unitless) for all scenarios over the period 2015–2020. Negative values represent that reference data are smaller than the original ESM simulations.
The NPP and GPP outputs of ESMs are bias-corrected using the corresponding MODIS products (Running and Zhao, 2019). Simulations show that both vegetation productivity and root activity in the permafrost region are expected to increase in the future (Figs. 2 and 3), due to rising temperature and atmospheric CO2 fertilization. The increase in plant productivity will lead to greater input fluxes from plant litter to the soil C pool, but on the other hand, plant root exudates will alter soil pH values and enhance microbial decomposition activity through the rhizosphere priming effect (RPE). The RPE ratio is defined as the ratio of respiration from plant-affected over non-plant-affected soils, which can be estimated from GPP based on the relation found by a wide-ranging meta-analysis of permafrost soils (Keuper et al., 2020). The NPP and RPE simulations under the G6solar and G6sulfur experiments are expected to fall between the SSP5-8.5 and SSP2-4.5 scenarios because the SG reduces the temperature but not the atmospheric CO2 concentration. CNRM-ESM2-1 simulates the greatest rises in NPP and RPE by 2100, while IPSL-CM6A-LR is notably lower under the G6sulfur scenario than the other ESMs, and the remaining four models simulate similar trends (Figs. 2 and 3).
2.2 The modified PInc-PanTher model
Instead of using the carbon stock and carbon flux outputs of ESMs for our primary analysis, we use bias-corrected ESM outputs of TSL, NPP, and RPE to drive a specially modified PInc-PanTher model to estimate permafrost carbon. PInc-PanTher, a data-constrained model developed by Koven et al. (2015) for estimating PCF, is characterized by compiled soil C maps and laboratory incubation syntheses specifically from permafrost soils. Permafrost soil C maps are derived from the thematic soil classification maps published by the Permafrost Carbon Network (Hugelius et al., 2014), with a horizontal resolution of 0.1∘ and divided vertically into four layers: 0–0.3, 0.3–1, 1–2, and 2–3 m. The initial permafrost soil C storage in the upper 3 m of soils is 727 Pg C, which excludes non-permafrost soils, with 280 Pg C in the discontinuous permafrost regions (Hugelius et al., 2014). While typical terrestrial C models use a single set of decomposition constants to model the transient dynamics of soil C losses, PInc-PanTher builds a parallel three-pool, first-order decomposition model based on soil incubation meta-analysis to calculate a set of parameters that best describe permafrost C losses for the laboratory incubations (Koven et al., 2015). The fraction of each pool in the decomposition constants can be determined in two ways: dependent on the soil C:N ratio and dependent on the ratio of mineral and organic matter in the soil (Schädel et al., 2014). In this study we use the average of these two methods.
The standard PInc-PanTher model considers only the effect of TSL on microbial decomposition and ignores vegetation dynamics; i.e. the input C flux into the soil pool is fixed, and the effect of plant roots is not considered. We introduce time-varying input C fluxes and RPE ratios into the modified PInc-PanTher model to reflect the effects of plant productivity changes on microbial decomposition and permafrost soil C storage. The change in permafrost C stock (Cp) with time can be expressed as a function of NPP, TSL, and RPE as
where P(NPP,t) is the time-dependent input C flux, which we assume to be proportional to NPP on annual scales in every soil layer. The initial carbon flux into the soil pool is inferred from the initial steady state, which satisfies the condition that soil C loss and input are in equilibrium during the first 5 years (2015–2019). This initial equilibrium assumption ignores decomposition occurring in the active layer in the current climate and aims to remove the effects of decomposition that would also occur under a constant climate for predicting the response of soil carbon loss to future soil warming (Koven et al., 2015). The decay constant at the reference temperature (5 ∘C) is represented by k and equals the inverse of the turnover time. Q10(TSL) is a function of soil temperature that controls the decomposition rates and which assumes a 2.5-fold increase in respiration rate for each 10 ∘C increase in soil temperature. Given the strong nonlinear relationship between decomposition rate and soil temperature, PInc-PanTher calculates decomposition rate based on the temperature of each month and then averaged over the course of a year rather than using the annual-mean temperature directly for the calculation. The parameters of the PInc-PanTher model are derived from laboratory incubation syntheses and literature reviews. For a more detailed description, please refer to Koven et al. (2015). The RPE ratio reflects the effect of plant roots on soil respiration rate and is calculated as
where root respiration is estimated to be 3.6 % of GPP (Keuper et al., 2020). RPE-induced respiration is dominated by the shallow soil layer because most roots are the upper soil; thus we fix the RPE ratio to 1 for soil layers > 0.3 m in depth.
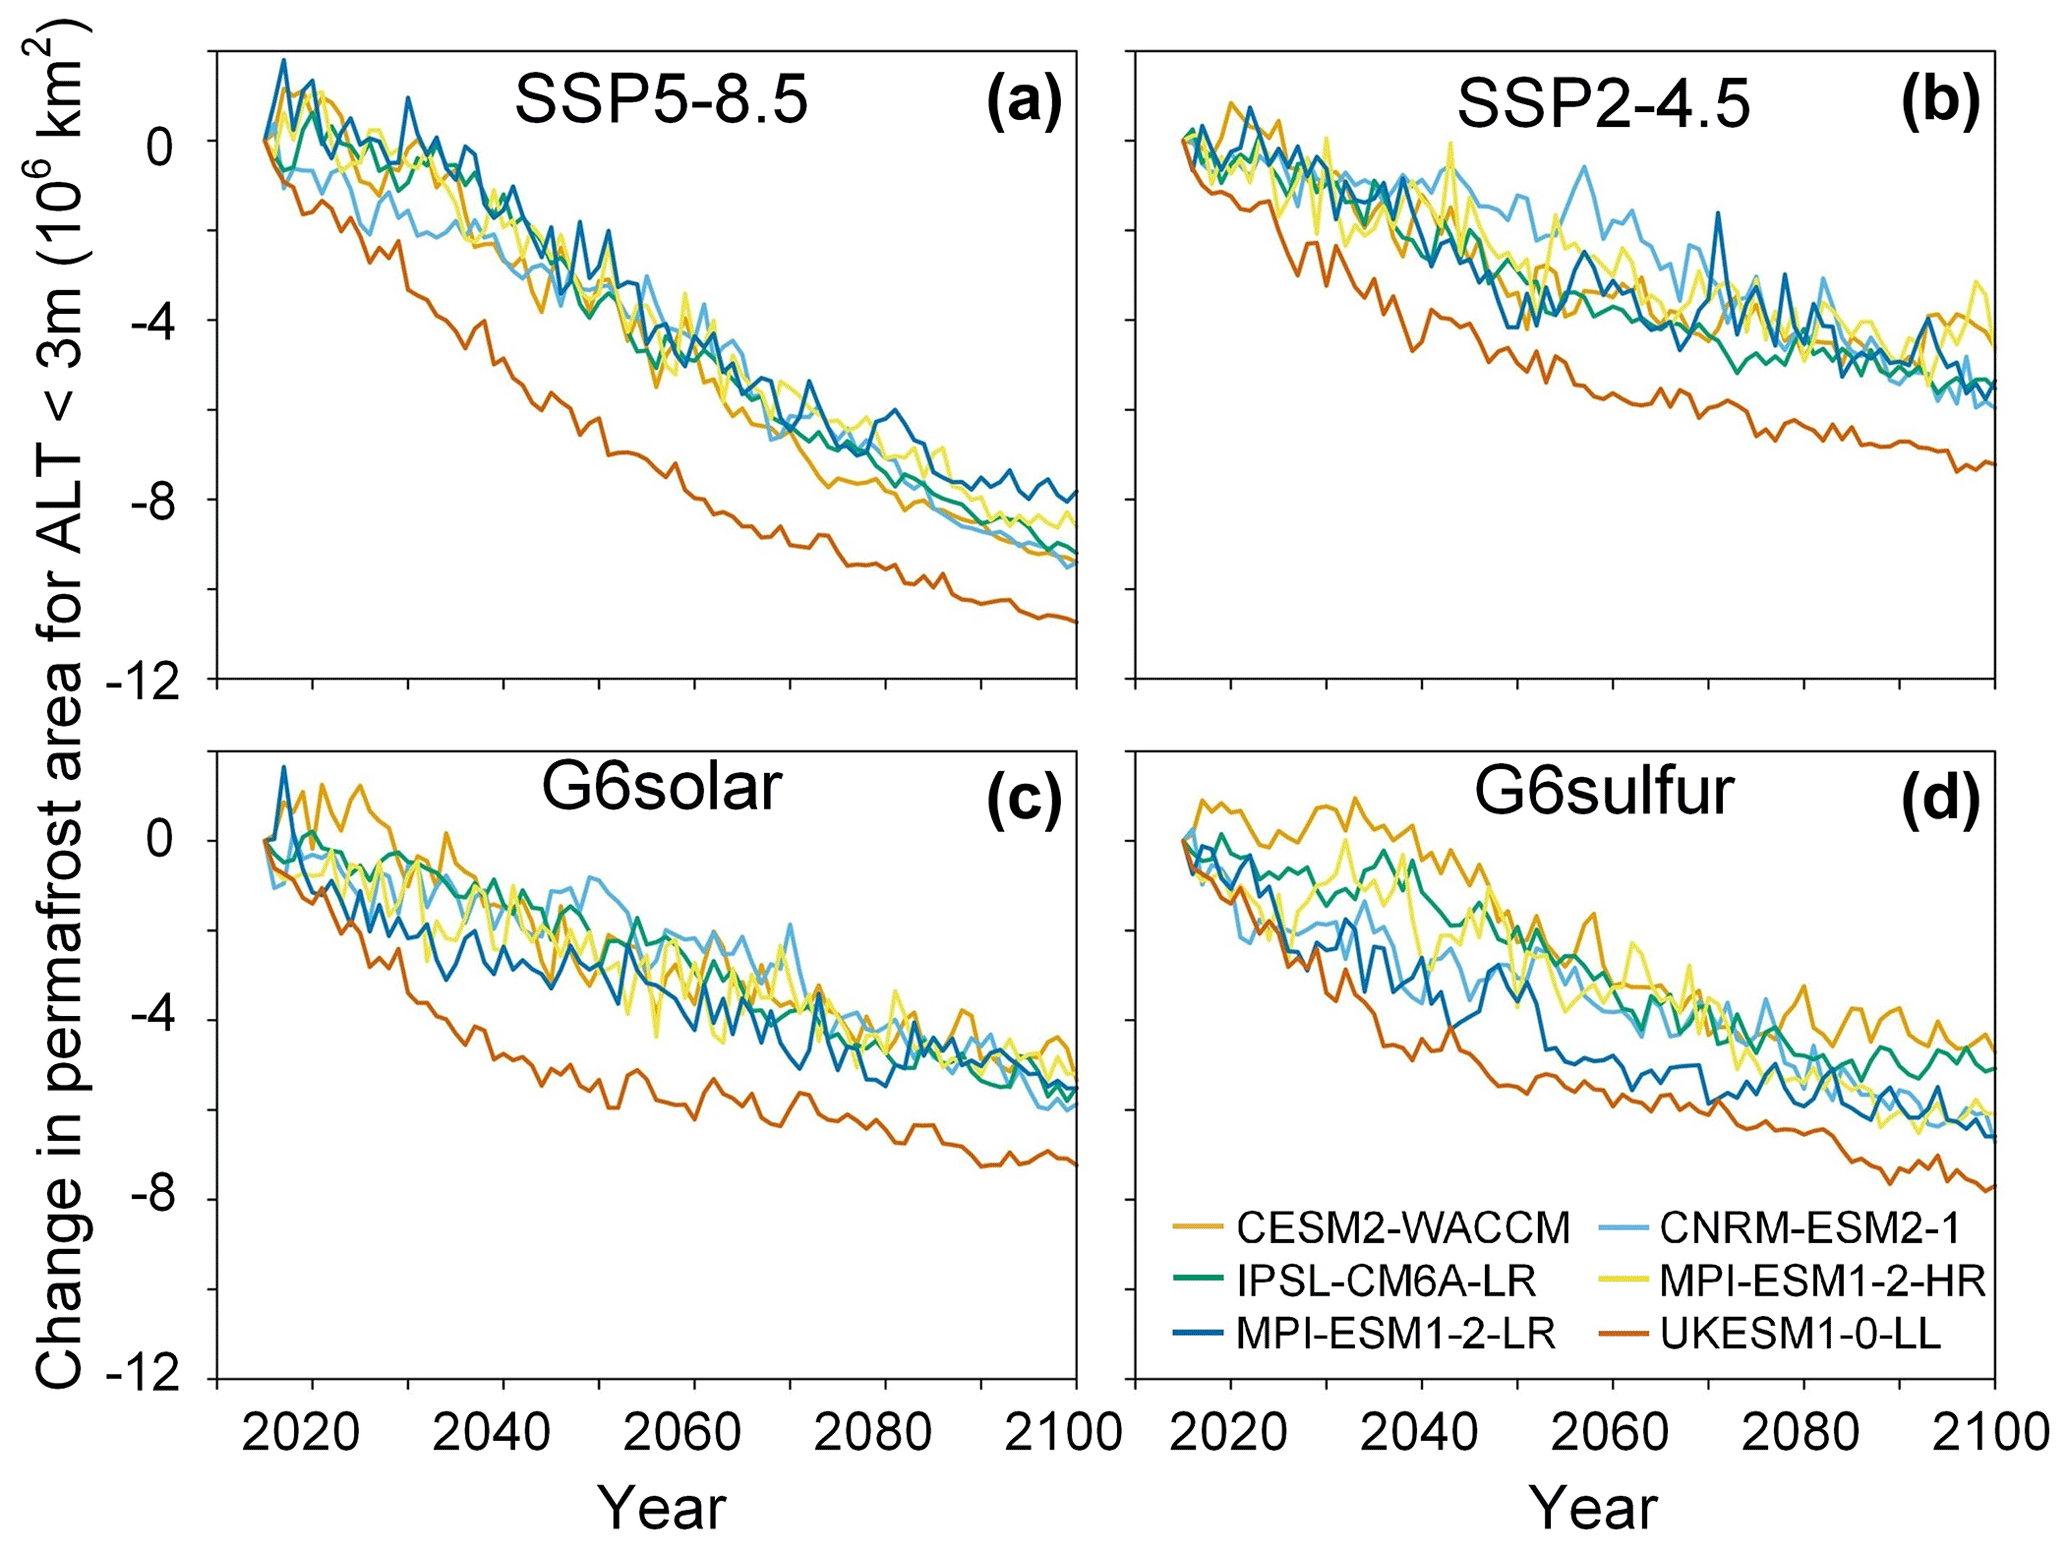
Figure 4Cumulative change in circum-Arctic permafrost area derived from bias-corrected TSL. Simulations are performed under the (a) SSP5-8.5, (b) SSP2-4.5, (c) G6solar, and (d) G6sulfur scenarios up to the year 2100.
2.3 PAGE-ICE integrated assessment model
PAGE-ICE is an updated version of the PAGE (Policy Analysis of Greenhouse Effects) model (Hope and Schaefer, 2016), ICE stands for Ice, Climate, and Economy and incorporates the permafrost carbon feedback into the economic impact assessment of climate change (Yumashev et al., 2019). PAGE-ICE includes multiple updates to climate science and economics from IPCC AR5 and subsequent literature, providing economic assessments of climate-driven impacts in four sectors (Liu et al., 2022), which include economic (damages to overall economy), non-economic (public health and ecosystem services), sea level rise (relocation and coastal flood damage), and discontinuity (large-scale damage associated with climatic tipping points). Damages to infrastructure from permafrost degradation are not included in the PAGE-ICE economic impact assessment but have a non-negligible impact (Hjort et al., 2022).
Here, we use PAGE-ICE to assess the socioeconomic benefits of G6 experiments for mitigating permafrost degradation and maintaining the stability of permafrost C storage. The G6 experiments are assumed to follow the same socioeconomic trajectory and emission pathway as the baseline scenario SSP5-8.5. We first simulate the impact of the G6 experiments to reduce permafrost CO2 and CH4 emissions on future climate change, based on the simplified climate module built into PAGE-ICE. We then use the damage function “PAGE09 & IPCC AR5 & Burke” provided by PAGE-ICE, which is chosen to make the assessment comparable with existing studies (Hope and Schaefer, 2016; Chen et al., 2020), linking global and regional warming to GDP losses. Finally, the estimated climate damages are processed using the “equity-weighted ON, PTP discounting” (where PTP is the pure time preference) scheme provided by the discounting module of PAGE-ICE, converting changes in consumption to utility through the elasticity of marginal utility (EMUC) to correct for regional income differences and discounting aggregates based on the PTP rate. In PAGE-ICE, both PTP and EMUC follow triangular distributions with ranges of 0.1–2 (mode is 1) and 0.5–2 (mode is 1), respectively.
3.1 Projected permafrost area loss
Warming causes widespread degradation of permafrost, and Fig. 4 shows the changes in circum-Arctic permafrost area over time for the period 2020–2100 as diagnosed by a mean annual ground temperature of 0 ∘C at 3 m depth, which is approximately the bottom of the active layer. Simulations of permafrost area change across ESMs show a high degree of agreement (Fig. 4), except for UKESM1-0-LL, which shows greater area reduction due to the largest simulated warming (Fig. 1). Permafrost area and other results we give as the multi-model mean ± standard error are projected to decrease by 9.2 ± 0.4, 5.6 ± 0.4, 5.8 ± 0.3, and 6.1 ± 0.4 million km2 under the SSP5-8.5, SSP2-4.5, G6solar, and G6sulfur scenarios, respectively.
Table 3G6 impacts on soil temperatures, permafrost degradation, and soil C storage. Cooled soil temperature (∘C), preserved permafrost area (millions of square kilometres), and retained permafrost soil C (Pg) at the end of the century for the G6solar and G6sulfur scenarios relative to the SSP5-8.5 scenario. All values are significant at the 95 % level according to the Wilcoxon signed-rank test.

The soil temperature cooling under the G6 experiments and the slowing permafrost degradation are significant (Table 3). By 2100, compared with the SSP5-8.5 scenario, the G6solar and G6sulfur experiments will reduce annual-mean soil temperatures in the permafrost region by 3.5 ± 0.2 and 3.3 ± 0.4 ∘C, respectively, and mitigate 3.4 ± 0.2 and 3.1 ± 0.5 million km2 of permafrost degradation. It is perhaps surprising that the simulated permafrost area loss (and carbon loss; see next section) is so similar under both G6 scenarios, given that G6sulfur has more residual temperature differences and across-ESM variability than G6solar (Visioni et al., 2021). Under both G6 experiments, but especially G6sulfur, the polar regions are undercooled, as is the boreal permafrost zone. This is not inherent to stratospheric aerosol injection, but a consequence of the G6 specification of tropical injection and global radiative forcing (hence temperature) target. The bias correction procedure for TSL removes much of the across-ESM differences and offsets from observational data at the start of the simulation period (Fig. 1 and Table 2). G6sulfur produces a weaker response with larger uncertainty than G6solar, as may be expected given the ESM-dependent implementation of the radiative response to aerosols in the G6sulfur scheme compared with the much simpler G6solar simulation. Despite model differences, the protective effects of the two G6 schemes on permafrost extent are consistent and significant at the 95 % level for all six ESMs (Table 3).
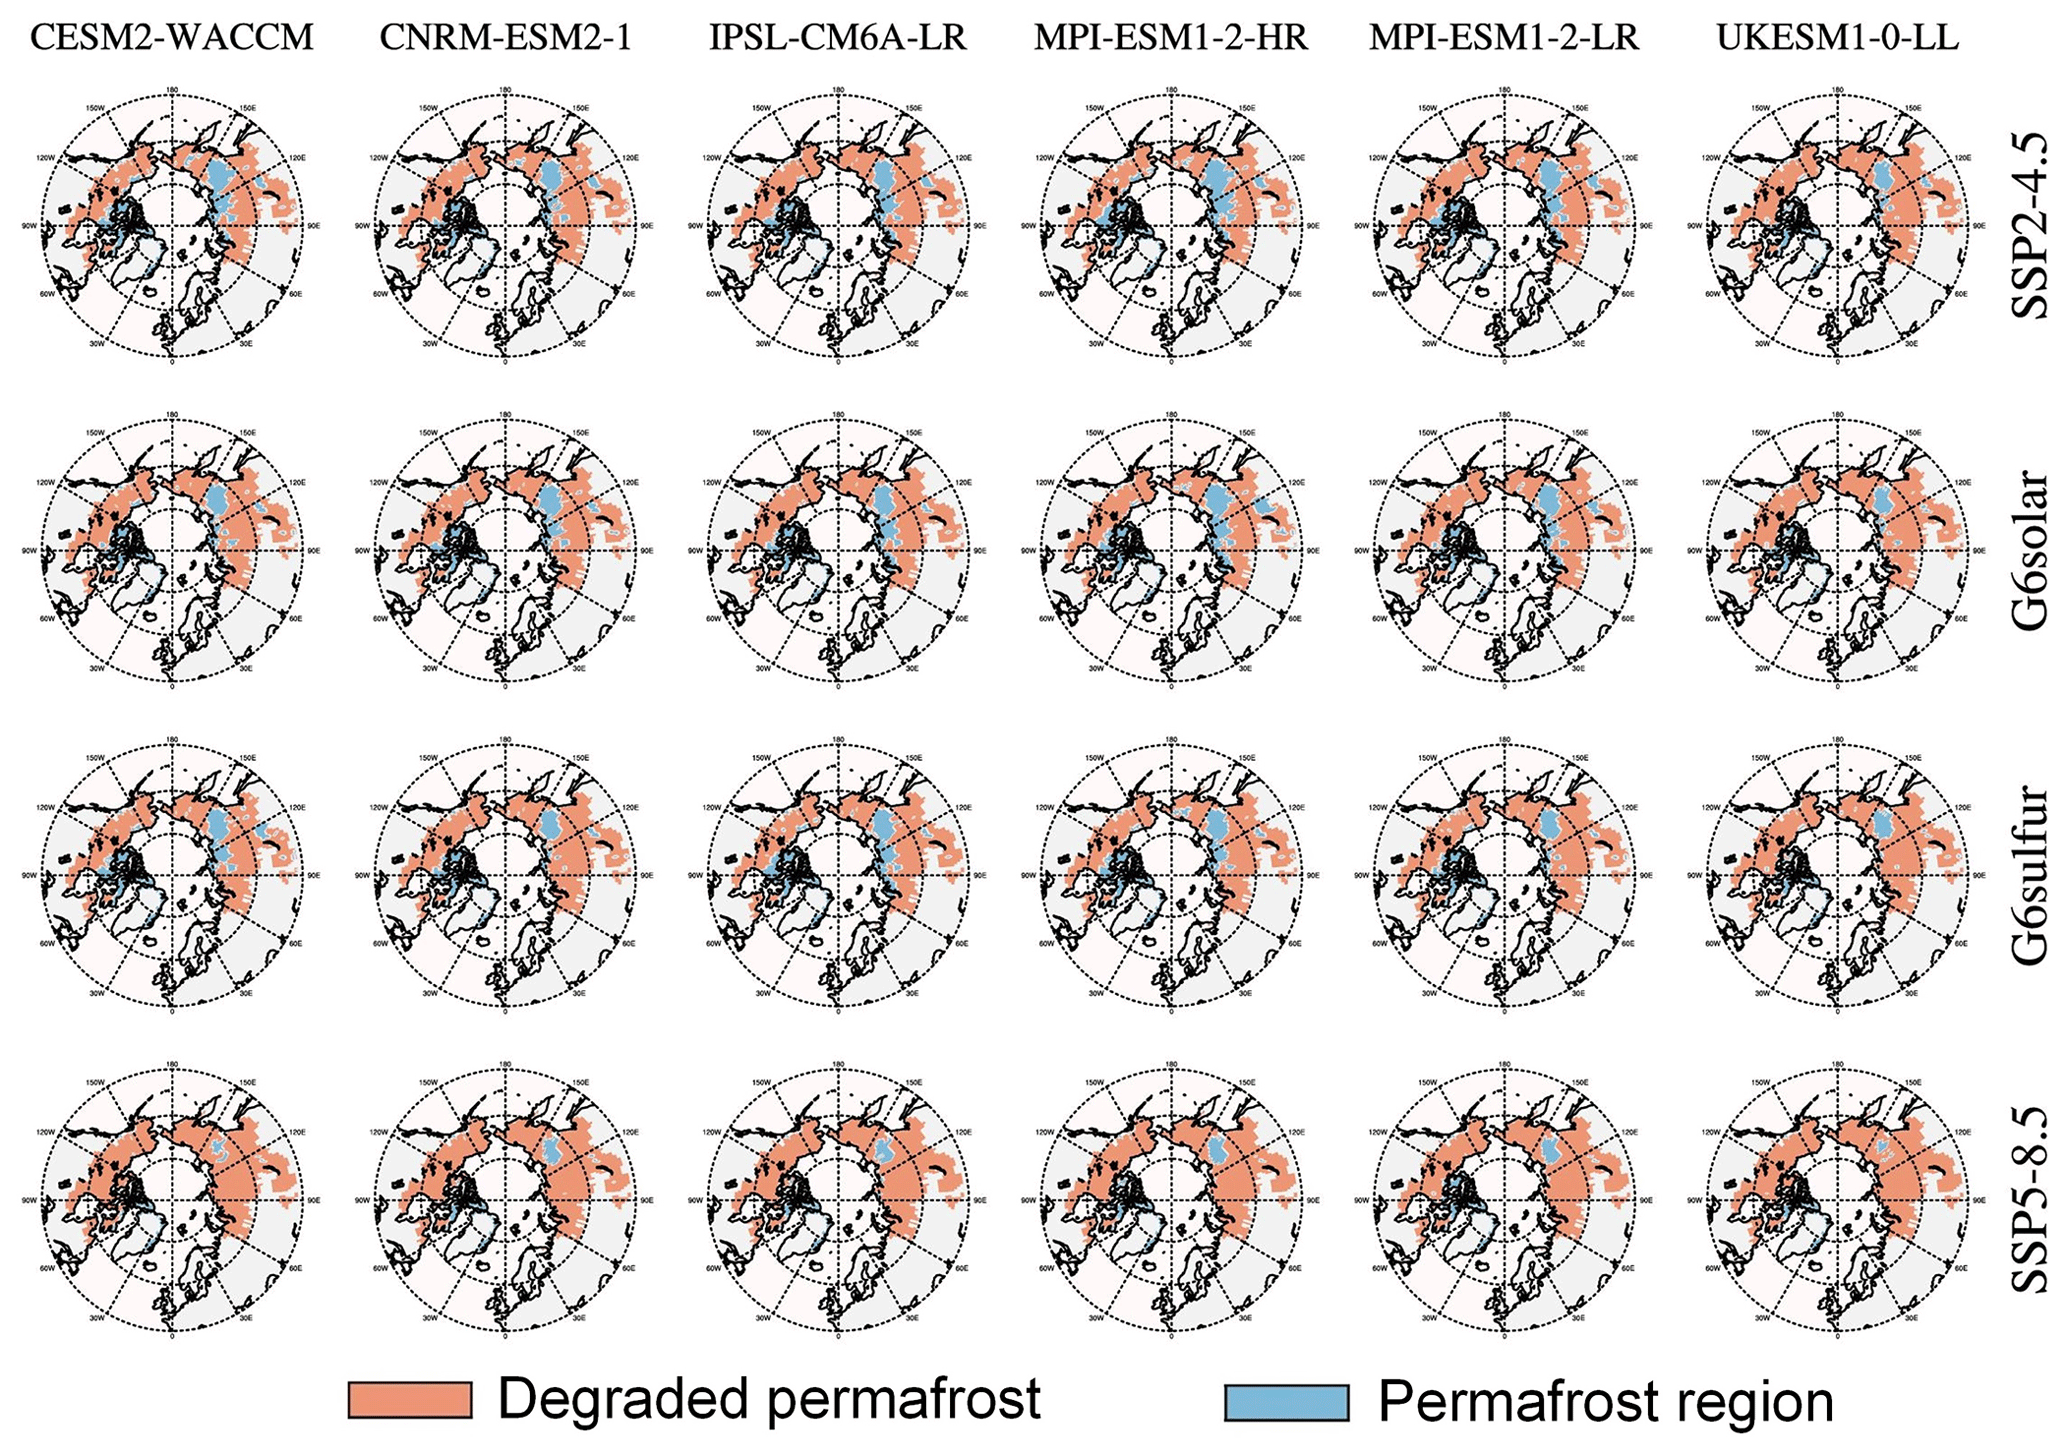
Figure 5Maps of permafrost extent in the year 2100, derived from the bias-corrected TSL outputs of six ESMs. Permafrost regions with active layer depths greater than 3 m in 2100 are considered degraded permafrost.
Figure 5 shows the spatial distribution of the simulated permafrost extent in 2100 for the four scenarios. The initial permafrost extent was derived from the boundary of the permafrost soil C maps (Hugelius et al., 2014). Only small patches of permafrost in the Canadian Archipelago and central Siberia are preserved under the SSP5-8.5 scenario, while more permafrost at high latitudes remains under the SSP2-4.5 and G6 scenarios (Fig. 5). Large-scale degradation of circum-Arctic permafrost is simulated even under moderate mitigation and G6 geoengineering scenarios. Relative to the SSP5-8.5 scenario, G6 experiments can reduce permafrost area loss by about on average; i.e. they can protect about 3 million km2 of permafrost area (Table 3).
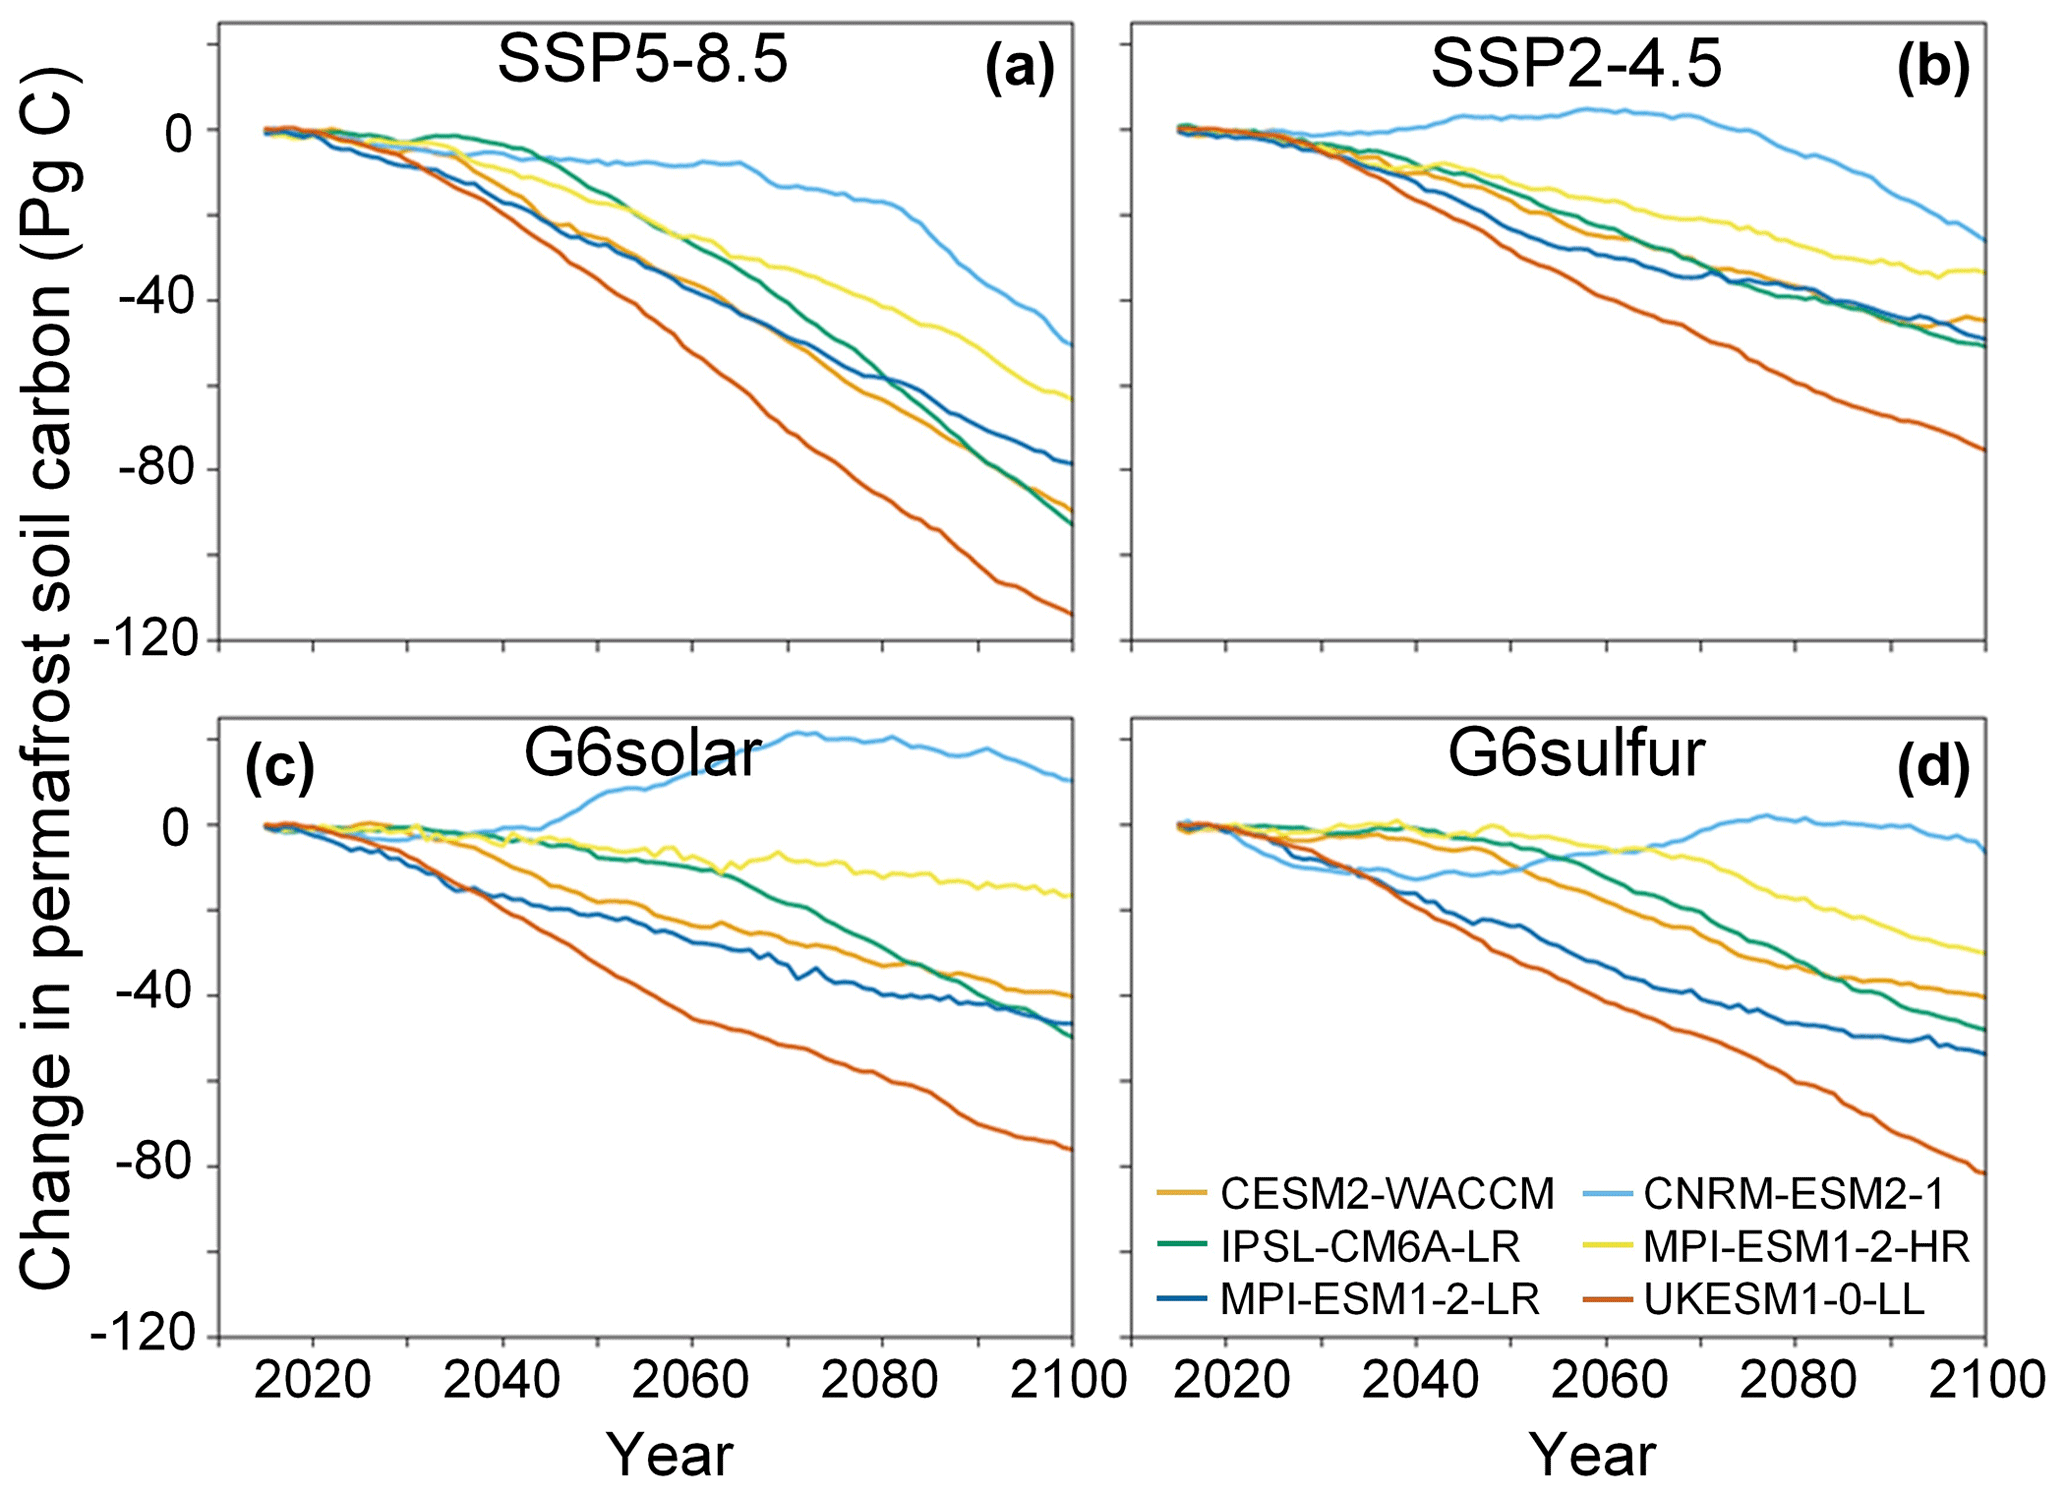
Figure 6Cumulative change in circum-Arctic permafrost C storage obtained from modified PInc-PanTher driven by TSL, NPP, and RPE simulations. Simulations are performed under the SSP5-8.5, SSP2-4.5, G6solar, and G6sulfur scenarios up to the year 2100.
3.2 Projected permafrost C loss
Based on the modified PInc-PanTher model and bias-corrected TSL, NPP, and RPE simulations, we calculate the change in permafrost soil C over time for the period 2020–2100 (Fig. 6). Permafrost soil C is expected to lose 81 ± 8, 47 ± 6, 37 ± 11, and 43 ± 9 Pg C under the SSP5-8.5, SSP2-4.5, G6solar, and G6sulfur scenarios, respectively. Our estimated permafrost C losses for the SSP5-8.5 projection are within the uncertainty range of the 92 ± 17 Pg C estimate based on a literature compilation (Schuur et al., 2015). The permafrost C losses under the SSP2-4.5 scenario we simulate are within the central part of the range of 11–135 Pg C reported by Burke et al. (2013) and higher than the range of 12.2–33.4 Pg C reported by Koven et al. (2015). There is considerable variation in the predictions of permafrost C loss among the models (Fig. 6), with UKESM1-0-LL simulating the most and CNRM-ESM2-1 the least carbon loss under all scenarios. This follows from UKESM1-0-LL predicting the most pronounced TSL rises, while CNRM-ESM2-1 predicts the greatest NPP increases (Figs. 1 and 2).
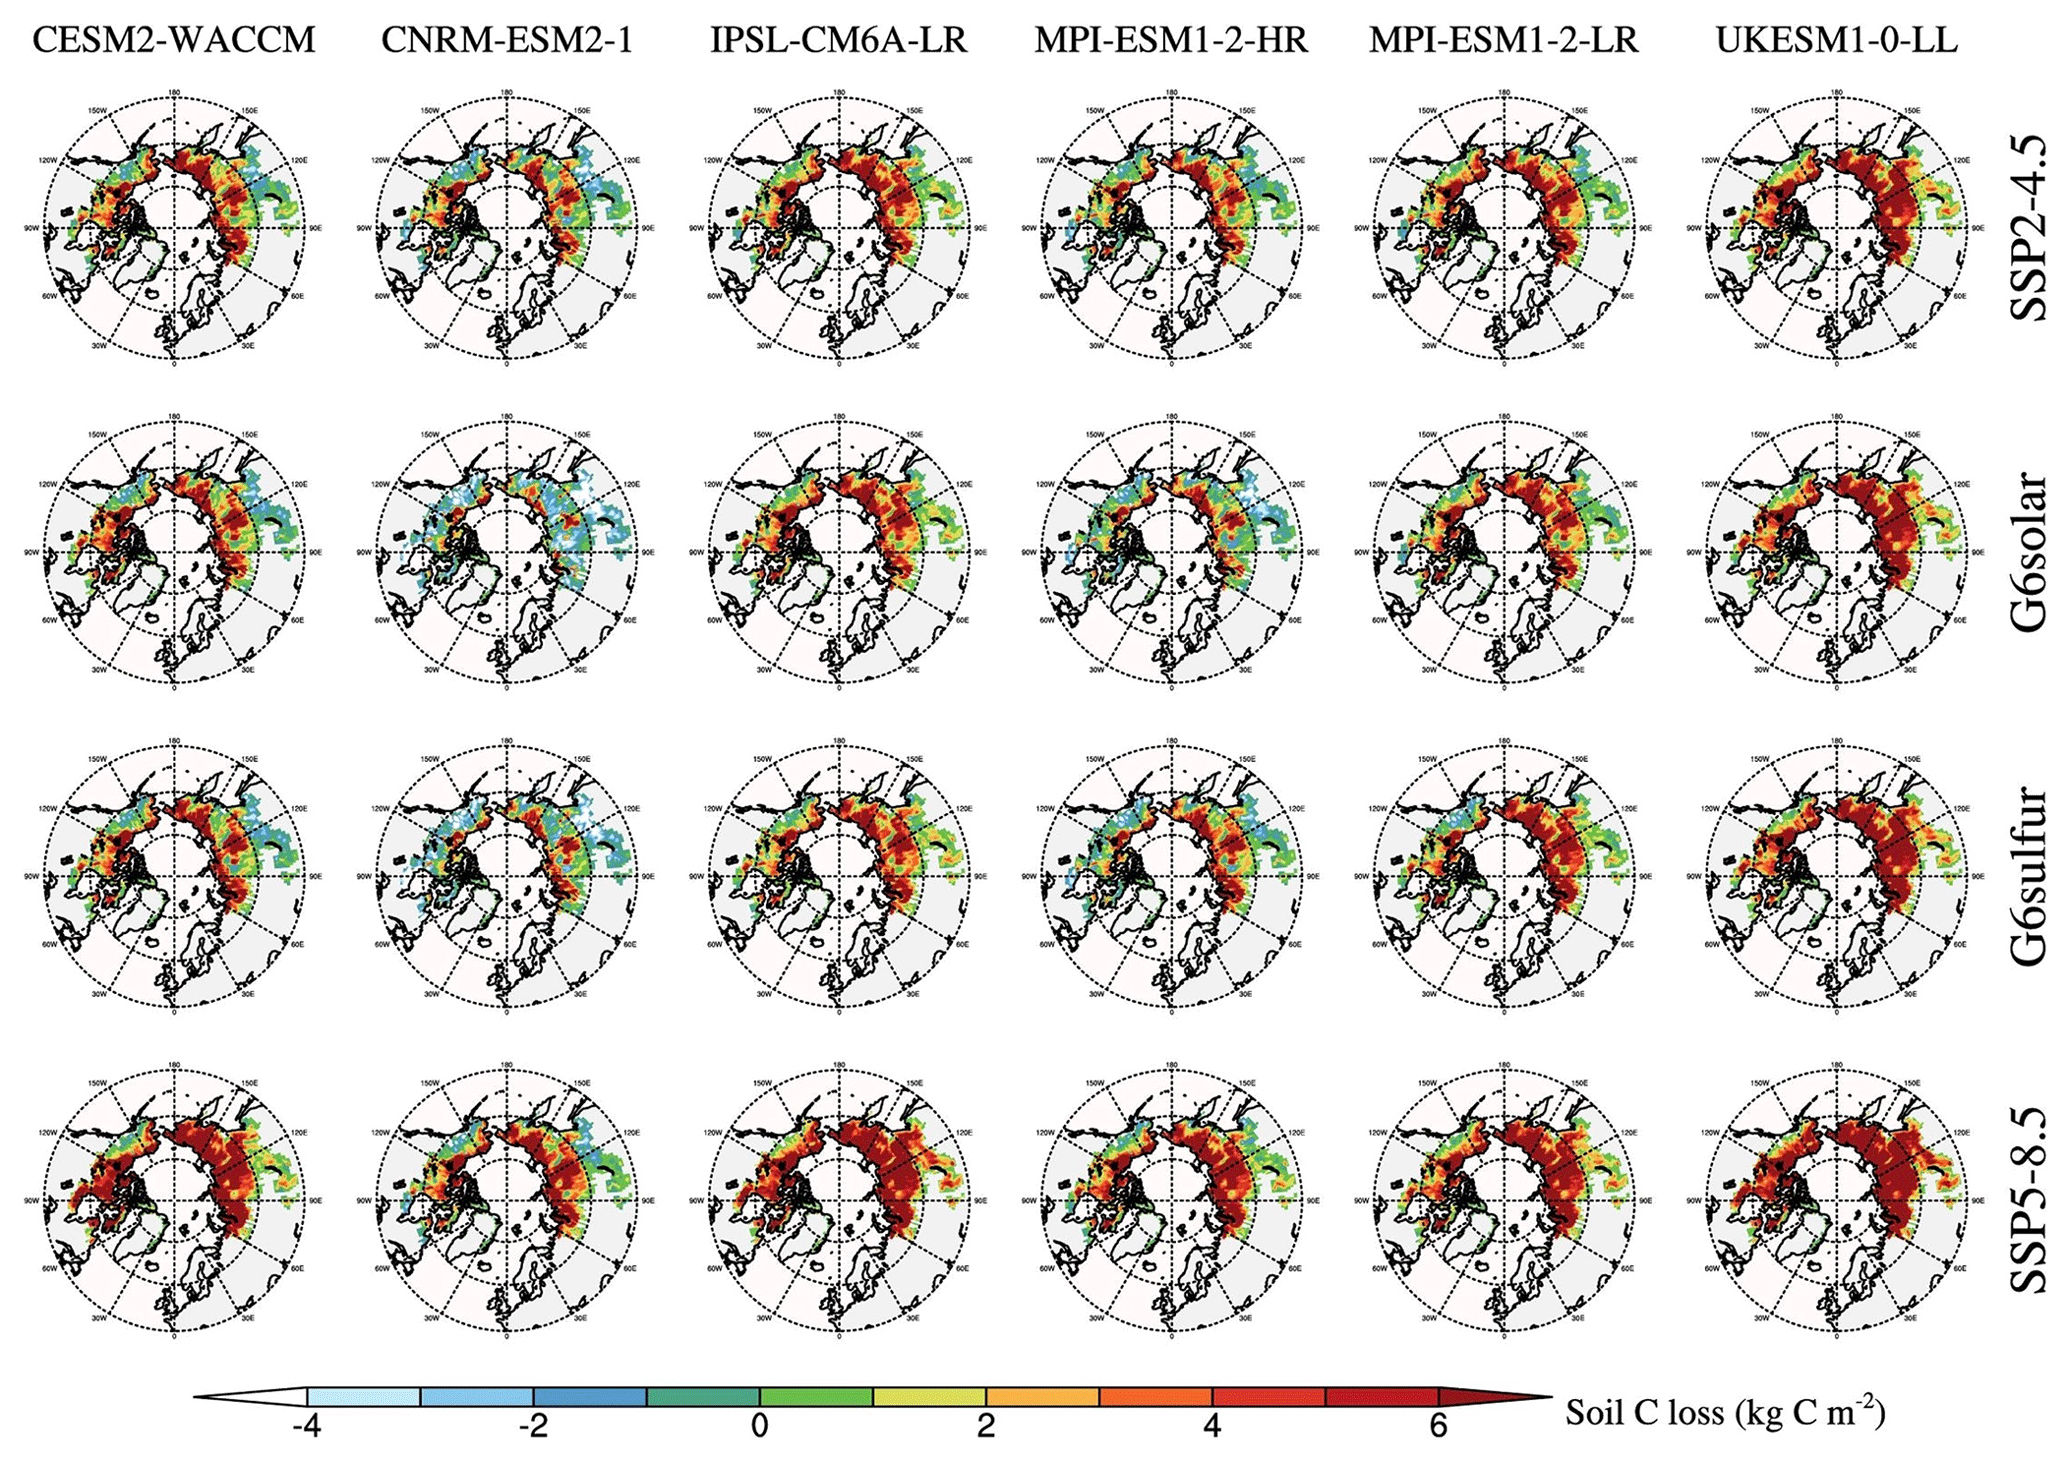
Figure 7Maps of permafrost soil C losses between 2020 and 2100 integrated from the surface to 3 m depth, obtained from modified PInc-PanTher driven by TSL, NPP, and RPE simulations.
There are model differences and spatial heterogeneity in the simulated soil C loss (Fig. 7), and the spatial distribution is related to initial C stocks and controlled by the distributions of TSL, NPP, and RPE. Core permafrost regions such as Siberia play a dominant role, while the southern permafrost margin is less affected (Fig. 7). The reason for this is that permafrost soils at the southern edges are usually already in a state of seasonal or permanent thaw and remain so as the climate warms, in contrast, at high Arctic latitudes, where much carbon has accumulated, and rising summer temperatures greatly prolong the thawing time and promote decomposition.
Compared with SSP5-8.5, G6solar and G6sulfur retain 45 ± 4 and 38 ± 3 Pg C (Table 3), respectively, almost halving the permafrost soil C loss. G6solar and G6sulfur provide more protection against permafrost soil C loss than does SSP2-4.5, mainly due to higher vegetation productivity (Fig. 2) driven by their higher GHG concentrations. In addition, soil C losses for G6solar and G6sulfur differ from each other in some regions such as North America and European Russia more than in other regions. This may be related to changes in tropospheric dynamic circulation caused by stratospheric sulfate aerosols (Visioni et al., 2020), although little research has been done on such large-scale circulation changes to date.
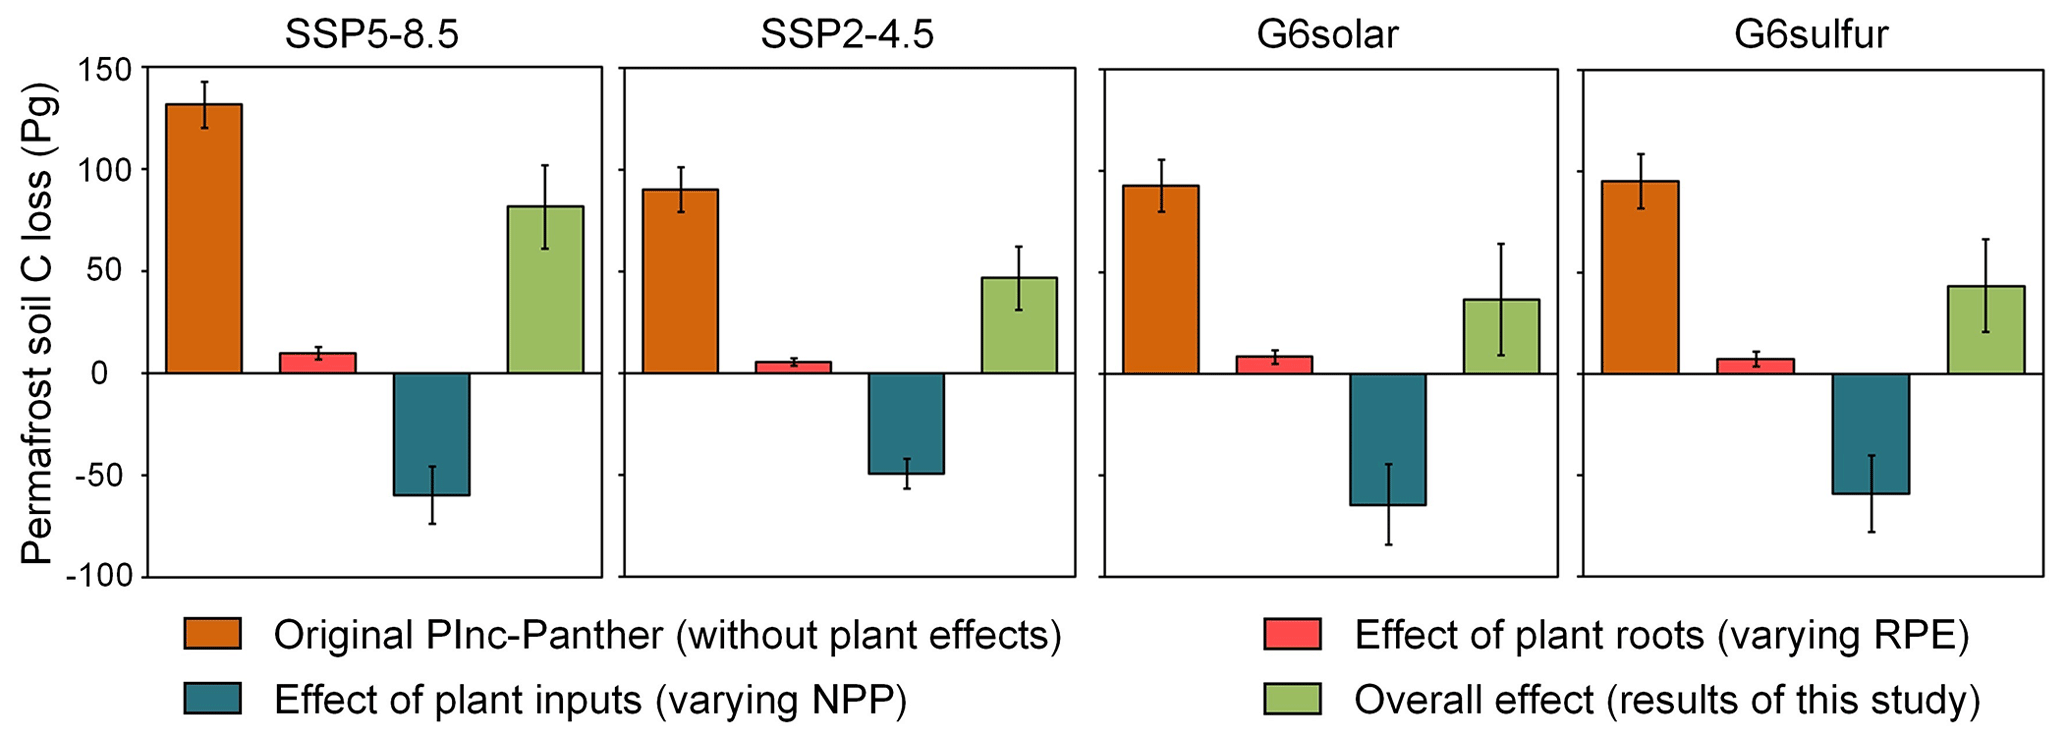
Figure 8Cumulative permafrost soil C loss between 2020 and 2100 obtained from the original PInc-PanTher model (without plant effects) and the modified PInc-PanTher model we used (with varying NPP and RPE), as well as the effects of plant inputs (NPP) and roots (RPE) on soil C loss. Bars represent the ensemble mean of the six ESMs, with the error line range being the standard deviation. Negative values represent permafrost C gain.
3.3 Sources of uncertainty in C estimates
How differences in TSL, RPE, and NPP affect permafrost soil C is shown in Fig. 8. The original PInc-PanTher model only considers the effect of temperature on soil respiration; hence the soil C loss is dominated by TSL, and the C losses simulated under the SSP2-4.5, G6solar, and G6sulfur scenarios are very similar, with relatively small uncertainties. Changes in vegetation productivity due to warming and CO2 fertilization have both positive and negative effects on the permafrost carbon–climate feedback (Koven et al., 2015). On the one hand, shrub expansion in the tundra and poleward displacement of the tundra–taiga ecotone boundary will change the distribution of plant productivity and increase C inputs to the soil. On the other hand, plant root exudates have priming effects on soil C turnover and will speed up the decomposition of organic matter. The positive and negative effects of vegetation partially offset each other, with the overall effect being to mitigate soil C loss.
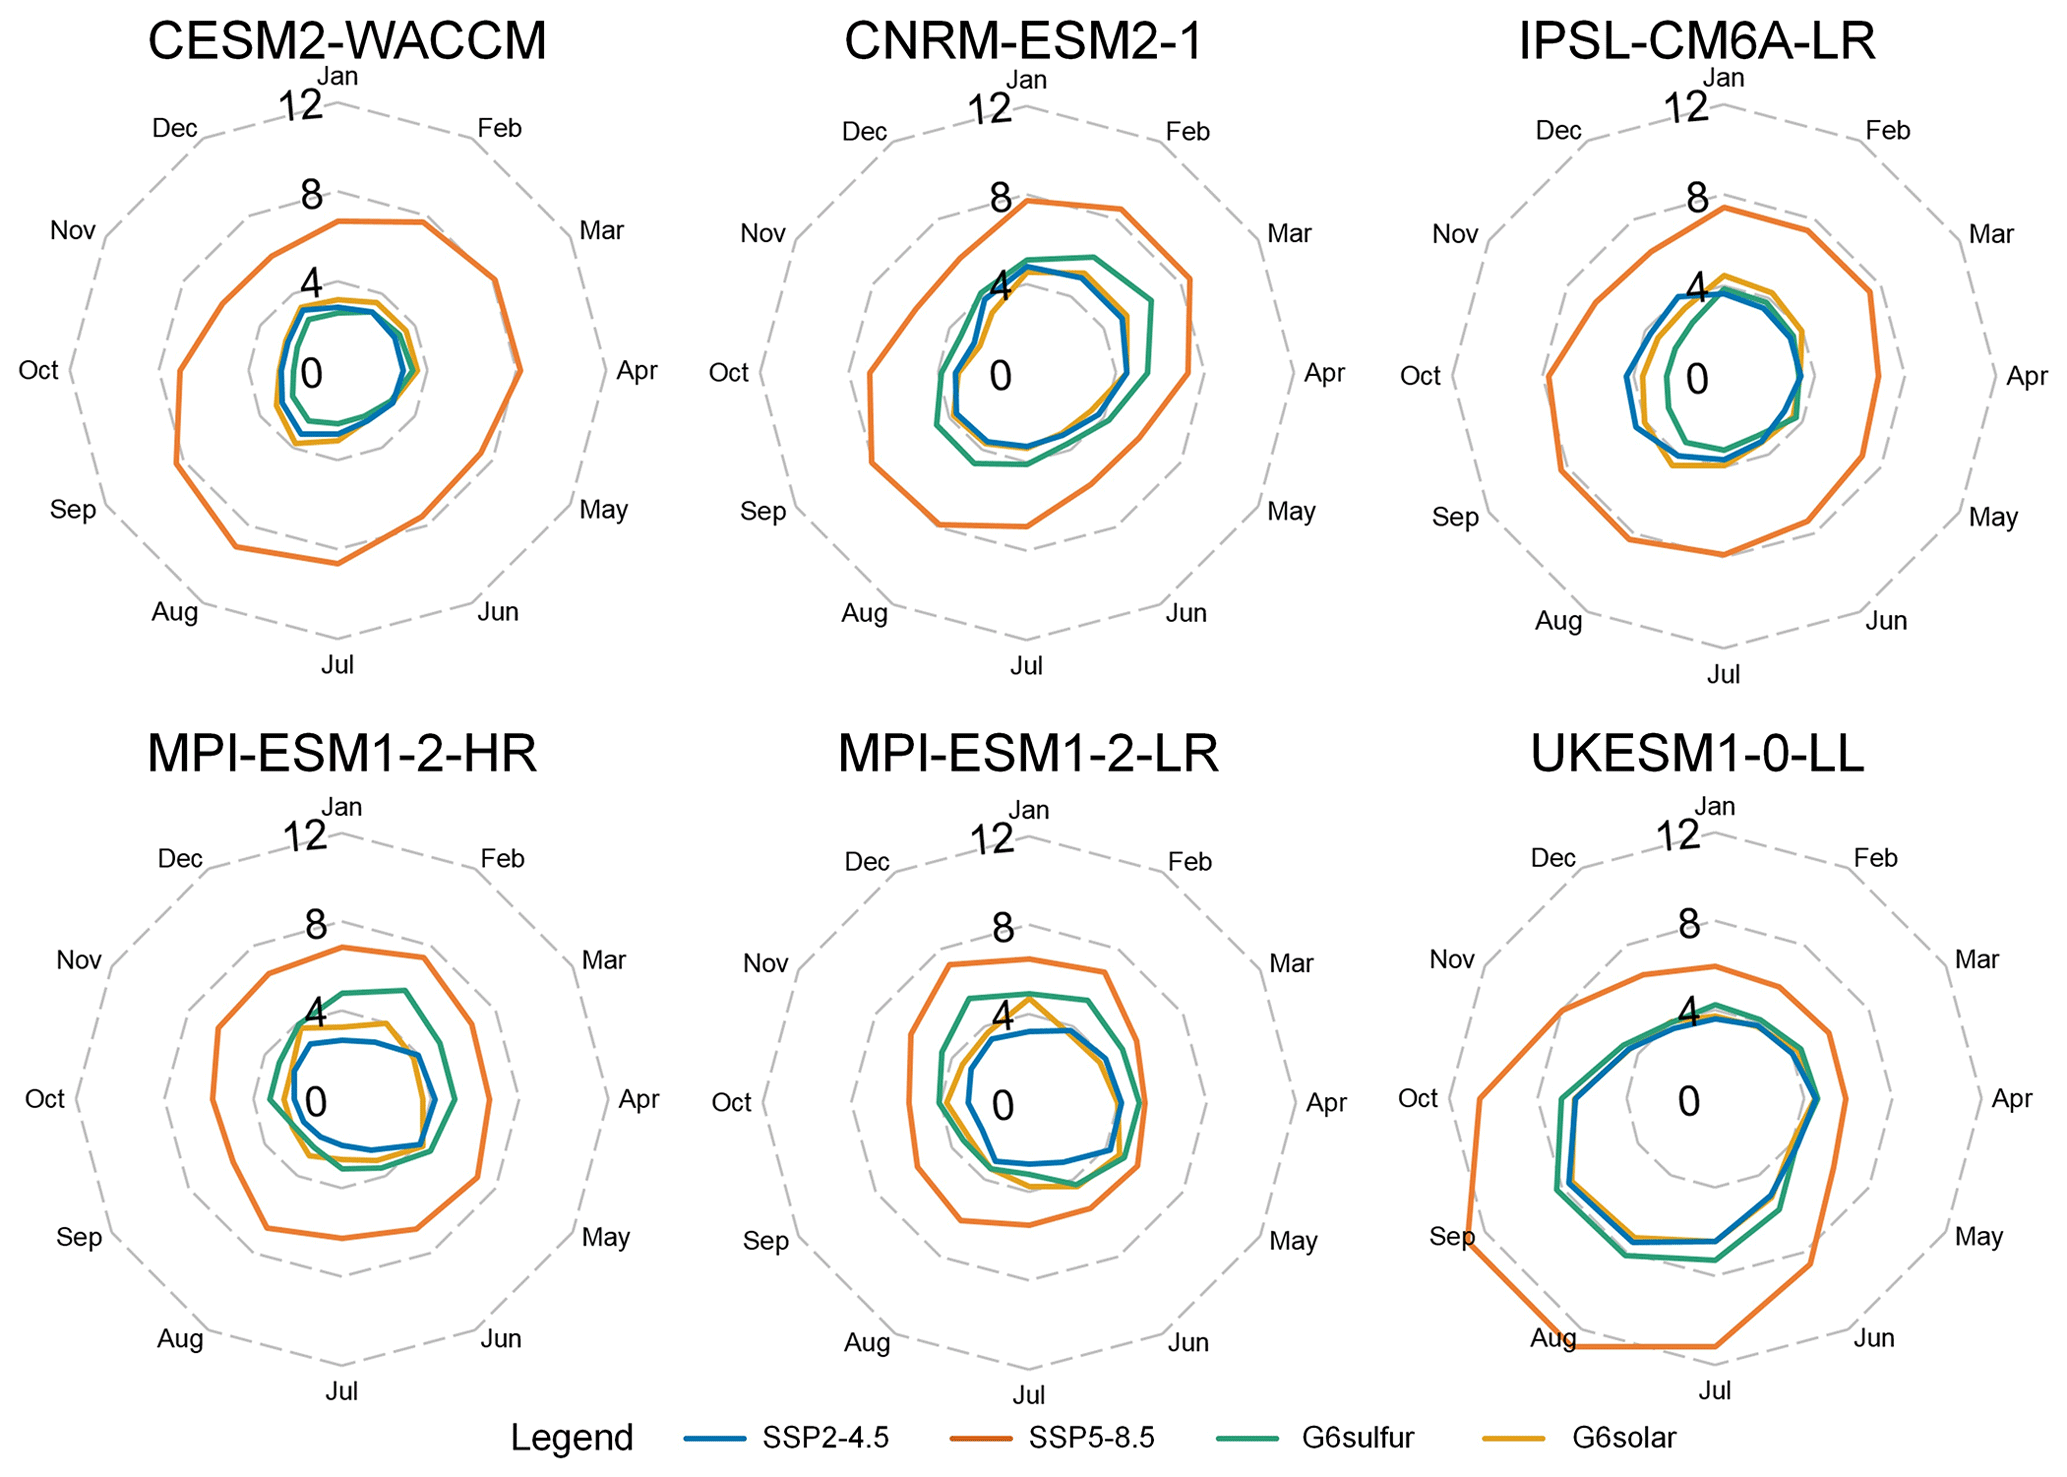
Figure 9Monthly soil temperature change between 2020 and 2100. Warming in monthly soil temperature (∘C) for each ESM over the period 2020–2100 under the SSP2-4.5, SSP5-8.5, G6sulfur, and G6solar scenarios.
Soil C losses under the two G6 scenarios are slightly lower than that of the SSP2-4.5 scenario after taking the effect of vegetation into account, but with clearly larger uncertainties for G6solar than the other scenarios. Specifically, RPE will increase the net loss of soil C, causing additional permafrost emissions of about 6 to 10 Pg C between 2020 and 2100 under the four scenarios. Our estimates are within, but towards the lower range of those reported by Keuper et al. (2020), who estimated RPE-induced soil C loss to be 5.9–75 Pg C (mean of 38 Pg C) for RCP4.5 and 6.0–80 Pg C (mean of 40 Pg C) for RCP8.5. PInc-PanTher simulates the steady-state equilibrium of the input C flux and decomposition rate during initialization, whereas RPE ratios rise from about 5 % to 15 % between 2020 and 2100, leading to additional soil C losses (Fig. 3). In comparison, the change in NPP is more dramatic, increasing by between ∼ 40 % and ∼ 80 % from 2020 to 2100 (Fig. 2). Increasing input C flux allows more carbon to be retained in the permafrost soils; thus the lower C loss and larger uncertainty under the G6solar and G6sulfur scenarios compared with SSP2-4.5 are mainly caused by the large across-model spread in NPP change (Fig. 8).
We further analysed the differences among ESMs and find that the three models with better snow schemes (CESM2-WACCM, CNRM-ESM2-1, and UKESM1-0-LL) exhibit seasonal differences in warming, while the other three models with fixed snow parameters (Table 1) simulate little or no seasonal differences in warming (Fig. 9). The exponential relationship between soil temperature and respiration rate suggests that a 1 ∘C increase in soil temperature has a greater effect on permafrost soil C decomposition during warmer months as compared to colder months. Among all ESMs, UKESM1-0-LL produces the most prominent warming in July–September, with SSP5-8.5 producing a warming of ∼ 12 ∘C and the other three scenarios producing warming of ∼ 8 ∘C, thus simulating the largest soil C loss. Under the SSP5-8.5 scenario, CESM2-WACCM and CNRM-ESM2-1 have a similar mean annual warming of about 8 ∘C, as does UKESM1-0-LL, but with a warm season 4 ∘C cooler (Fig. 9), so their simulated C losses are lower than UKESM1-0-LL (Fig. 6). MPI-ESM1-2-HR and MPI-ESM1-2-LR share the same land surface module at different resolutions (Table 1) but produce TSL, NPP, and RPE simulations that differ in both range and spatial distribution, resulting in C loss estimates that can vary by 15–30 Pg (Fig. 6). Overall, parametric differences among ESMs and uncertainties associated with future simulations cannot overshadow the strong indications that G6 solar and sulfate geoengineering can effectively suppress Arctic warming, slow permafrost degradation, and conserve soil C storage (Table 3).
3.4 Economic benefits from retained permafrost C
We estimate the economic benefits of permafrost soil C retained under the G6 simulations using the latest PAGE-ICE integrated assessment model (Yumashev et al., 2019). PAGE-ICE has been widely used in the assessments of climate policy and the social cost of carbon and, of high relevance to this study, the additional costs associated with Arctic permafrost degradation (Yumashev et al., 2019; Chen et al., 2020; Liu et al., 2022). The overall economic impacts of SG are highly complex and include both positive benefits of avoided warming and a variety of potential negative impacts, with many unknown unknowns (Irvine et al., 2019; Zarnetske et al., 2021). Here we evaluate, based on PAGE-ICE, the economic impacts of the reduced CO2 and CH4 emissions by SG through attenuated PCF, which is the less controversial part of the economic impact assessment related to geoengineering (Chen et al., 2020).
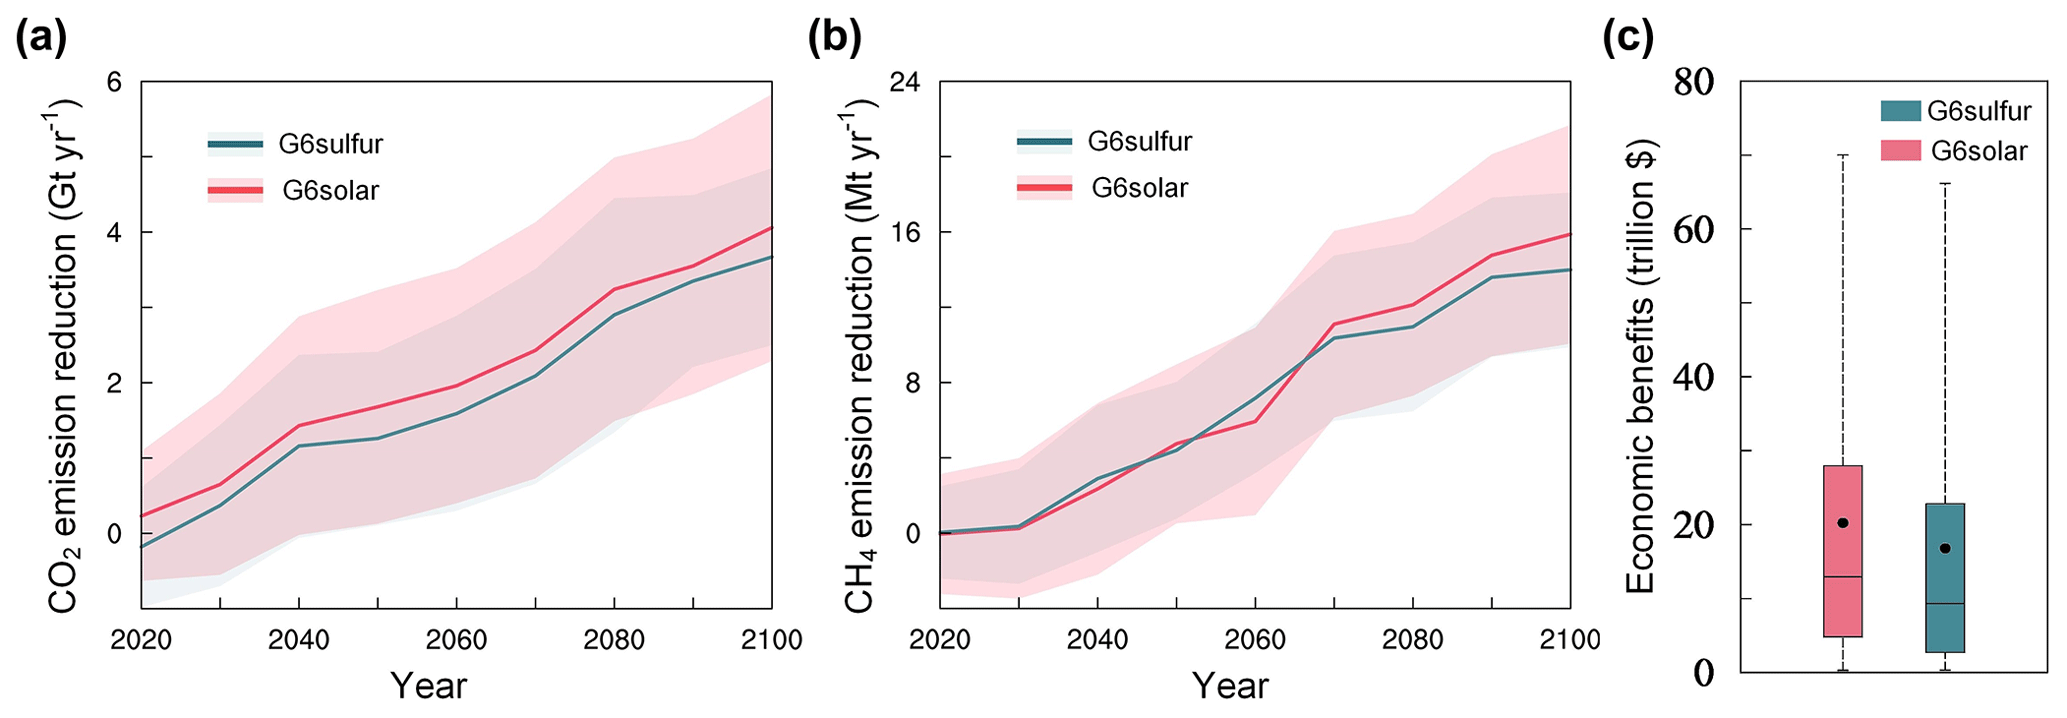
Figure 10Reduced emissions of (a) CO2 and (b) CH4 due to retained permafrost C for G6solar and G6sulfur compared with the SSP5-8.5 scenario. Solid lines represent the mean of the six ESMs, and shaded areas represent the mean ± standard deviation. (c) Cumulative economic benefits between 2020 and 2100 due to attenuated PCF, obtained from 100 000 Monte Carlo runs of PAGE-ICE. Whiskers: 5 %–95 % range; boxes: 25 %–75 % range; horizontal lines: median; dots: mean.
Figure 10 illustrates the reduction in permafrost CO2 and CH4 emissions due to the cooling effect of SG for the G6solar and G6sulfur scenarios compared with the baseline SSP5-8.5 scenario and their cumulative economic impacts over the period 2020–2100. The permafrost CO2 and CH4 emissions reduced by the two G6 schemes do not show significant differences from each other, and their values show an approximately linear increasing trend with time, with a wide range of uncertainty. By 2100, the reduced permafrost emissions are about 4 Gt CO2 yr−1 and 16 Mt CH4 yr−1 (Fig. 10). Methane emissions from permafrost are influenced by many factors such as the degree of waterlogging, soil carbon–nitrogen ratio, and local biome (Treat et al., 2015). We assume that CH4 emissions are 2.3 % of the overall soil respiration rate based on available studies and expert assessments (Schuur et al., 2013; Schneider Von Deimling et al., 2015; Gasser et al., 2018) and that the remaining soil carbon is emitted as CO2.
Assuming the same socioeconomic trajectory as SSP5-8.5, we simulate the economic benefits of the reduced permafrost emissions from SG (mean ± 1σ, as Gaussian distributions) by incorporating them into the PAGE-ICE. We then estimate the cumulative sum of the discounted economic impacts over the period 2020–2100, considering the time value of money and the loss of utility (Fig. 10c). All reported results are derived from an ensemble of 100 000 Monte Carlo simulations to perturb model parameters related to GHG emissions, climate modelling, economic damages, and discounting; explore uncertainties in the economic impacts of climate damages; and establish probability distributions of the results. The simulations show that the 90 % confidence intervals of the economic benefits due to the attenuated PCF are expected to be USD 0–70 trillion (mean of USD 20 trillion) and USD 0–67 trillion (mean of USD 18 trillion) for G6solar and G6sulfur, respectively. In about 5 % of the simulations, small negative benefits – that is harm – are predicted, the 2.5 percentiles being USD −9 and USD −11 trillion for G6solar and G6sulfur, respectively, and, for comparison, the corresponding 97.5 percentiles are USD 90 and USD 77 trillion.
The modified PInc-PanTher model used in this study considers the effects of varying plant productivity on input fluxes and root activity and provides data-constrained estimates of the large-scale permafrost C response to warming. Circum-Arctic permafrost soil C is projected to lose 81 ± 8, 47 ± 6, 37 ± 11, and 43 ± 9 Pg C during 2020–2100 under SSP5-8.5, SSP2-4.5, G6solar, and G6sulfur scenarios, respectively. The permafrost soil C losses estimated in this study are close to estimates based on a literature compilation (Schuur et al., 2015) but differed in sign from the soil C outputs of most CMIP6 ESMs (Table S1). All ESMs except CESM2-WACCM estimate permafrost soils to be a carbon sink over the 21st century rather than a carbon source (Table S1) because their simulated initial soil carbon stocks are much smaller than the observed estimates, leading to an underestimation of soil C loss. The bias correction process for TSL also shows that most ESMs underestimate soil temperatures in recent decades compared with the ERA5-Land reanalysis data (Fig. 1).
Gains in vegetation C are expected to partially compensate or even overcompensate for losses in soil C in the permafrost region over the century (McGuire et al., 2018). The vegetation C pool (CVeg) in the permafrost region is expected to increase by 46 ± 7, 31 ± 5, 38 ± 7, and 36 ± 6 Pg C between 2020 and 2100 under the SSP5-8.5, SSP2-4.5, G6solar, and G6sulfur scenarios, respectively (Table S1). Thus, for the circum-Arctic permafrost ecosystem, gains in vegetation C will largely offset losses in soil C. The higher plant productivity under the G6solar and G6sulfur experiments is expected to retain more C in the ecosystem compared with SSP2-4.5. Lee et al. (2022) studied two Arctic-only stratospheric aerosol injection strategies using CESM2-WACCM and found that the reduction in vegetation carbon gains due to SG outweighed the increase in permafrost soil carbon.
This study explores PCF estimates associated with the gradual thawing of permafrost as a response to deepening of the active layer, loss of permafrost, soil warming, and the lengthening of the seasonal thaw period. Some important disturbances, such as tundra fires, thermokarst, and thermoerosion, may lead to abrupt permafrost thaw and enhanced CO2 and CH4 emissions (Walter Anthony et al., 2018; Turetsky et al., 2020; Miner et al., 2022) and are not included in the simulations due to both their limited implementation and physical understanding in process-based carbon models. However, the cooling effect of SG will certainly have a positive impact on avoiding abrupt permafrost thaw.
Our results show that for all six ESM simulations, the protective effect of the G6solar and G6sulfur experiments on permafrost area and soil C is significant at the 95 % level (Table 3). Implementation of G6 experiments on the basis of the SSP5-8.5 scenario could reduce permafrost area loss by and halve soil C loss, resulting in economic benefits of about USD 0–70 trillion (mean of USD 20 trillion) by 2100. The implementation cost of stratospheric aerosol injection is strongly dependent on the injection scenario specified but for high greenhouse gas emission and a consequent degree of cooling, comparable to the G6sulfur scenario, is estimated at USD 30–70 billion per year (Smith, 2020). Our experiments thus show that SG, at least as defined by G6, but also likely including other schemes that target polar regions more specifically, has considerable global economic benefits even if only the permafrost carbon is included in the calculations. Given the undoubted global benefits of preserving the Arctic permafrost, there are probably arguments to be made for financing its active conservation as a global good. This would require a mechanism over and above the simple accumulation of carbon that comes with increases in vegetative productivity, which would already be considered in a global carbon tax mechanism. Land surface albedo modification may pay for itself with a carbon tax as low as USD 5 per tonne (Macias-Fauria et al., 2020), but such measures are probably unfeasible to implement widely in the remaining decades of this century. Since the stewards of the permafrost are by and large relatively poor and marginalized populations, such a recognition of the monetary value of the stored carbon in the permafrost could serve as a valuable tool for achieving the UN sustainable development goals in the Arctic.
All model data used in this work are available from the Earth System Grid Federation (WCRP, 2022; https://esgf-node.llnl.gov/projects/cmip6, last access: 3 July 2022). The standard PInc-PanTher model is from Koven et al. (2015). The ISI-MIP bias correction method is from https://github.com/SantanderMetGroup/downscaleR (last access: 17 January 2023). PAGE-ICE software is from Yumashev et al. (2019).
The supplement related to this article is available online at: https://doi.org/10.5194/esd-14-39-2023-supplement.
YC and AL conceived and designed the analysis. AL collected the data and performed the analysis. AL and YC wrote the paper, and JCM provided critical suggestions and revised the paper. All authors contributed to the discussion.
The contact author has declared that none of the authors has any competing interests.
Publisher's note: Copernicus Publications remains neutral with regard to jurisdictional claims in published maps and institutional affiliations.
This article is part of the special issue “Resolving uncertainties in solar geoengineering through multi-model and large-ensemble simulations (ACP/ESD inter-journal SI)”. It is not associated with a conference.
We thank the climate modelling groups for participating in the Geoengineering Model Intercomparison Project and their model development teams, the CLIVAR/WCRP Working Group on Coupled Modelling for endorsing the GeoMIP, and the scientists managing the earth system grid data nodes who have assisted with making GeoMIP output available. We thank three anonymous referees for their valuable suggestions.
This research has been supported by the National Key Research and Development Program of China (grant no. 2021YFB3900105), the National Natural Science Foundation of China (grant no. 41941006), and the Finnish Academy COLD Consortium (grant no. 322430).
This paper was edited by Somnath Baidya Roy and reviewed by three anonymous referees.
Aldy, J. E., Felgenhauer, T., Pizer, W. A., Tavoni, M., Belaia, M., Borsuk, M. E., Ghosh, A., Heutel, G., Heyen, D., Horton, J., Keith, D., Merk, C., Moreno-Cruz, J., Reynolds, J. L., Ricke, K., Rickels, W., Shayegh, S., Smith, W., Tilmes, S., Wagner, G., and Wiener, J. B.: Social science research to inform solar geoengineering, Science, 374, 815–818, https://doi.org/10.1126/science.abj6517, 2021.
Biskaborn, B. K., Smith, S. L., Noetzli, J., Matthes, H., Vieira, G., Streletskiy, D. A., Schoeneich, P., Romanovsky, V. E., Lewkowicz, A. G., Abramov, A., Allard, M., Boike, J., Cable, W. L., Christiansen, H. H., Delaloye, R., Diekmann, B., Drozdov, D., Etzelmüller, B., Grosse, G., Guglielmin, M., Ingeman-Nielsen, T., Isaksen, K., Ishikawa, M., Johansson, M., Johannsson, H., Joo, A., Kaverin, D., Kholodov, A., Konstantinov, P., Kröger, T., Lambiel, C., Lanckman, J. P., Luo, D., Malkova, G., Meiklejohn, I., Moskalenko, N., Oliva, M., Phillips, M., Ramos, M., Sannel, A. B. K., Sergeev, D., Seybold, C., Skryabin, P., Vasiliev, A., Wu, Q., Yoshikawa, K., Zheleznyak, M., and Lantuit, H.: Permafrost is warming at a global scale, Nat. Commun., 10, 264, https://doi.org/10.1038/s41467-018-08240-4, 2019.
Boucher, O., Servonnat, J., Albright, A. L., Aumont, O., Balkanski, Y., Bastrikov, V., Bekki, S., Bonnet, R., Bony, S., Bopp, L., Braconnot, P., Brockmann, P., Cadule, P., Caubel, A., Cheruy, F., Codron, F., Cozic, A., Cugnet, D., D'Andrea, F., Davini, P., de Lavergne, C., Denvil, S., Deshayes, J., Devilliers, M., Ducharne, A., Dufresne, J. L., Dupont, E., Éthé, C., Fairhead, L., Falletti, L., Flavoni, S., Foujols, M. A., Gardoll, S., Gastineau, G., Ghattas, J., Grandpeix, J. Y., Guenet, B., Guez, L. E., Guilyardi, E., Guimberteau, M., Hauglustaine, D., Hourdin, F., Idelkadi, A., Joussaume, S., Kageyama, M., Khodri, M., Krinner, G., Lebas, N., Levavasseur, G., Lévy, C., Li, L., Lott, F., Lurton, T., Luyssaert, S., Madec, G., Madeleine, J. B., Maignan, F., Marchand, M., Marti, O., Mellul, L., Meurdesoif, Y., Mignot, J., Musat, I., Ottlé, C., Peylin, P., Planton, Y., Polcher, J., Rio, C., Rochetin, N., Rousset, C., Sepulchre, P., Sima, A., Swingedouw, D., Thiéblemont, R., Traore, A. K., Vancoppenolle, M., Vial, J., Vialard, J., Viovy, N., and Vuichard, N.: Presentation and Evaluation of the IPSL-CM6A-LR Climate Model, J. Adv. Model. Earth Sy., 12, e2019MS002010, https://doi.org/10.1029/2019MS002010, 2020.
Burke, E. J., Jones, C. D., and Koven, C. D.: Estimating the permafrost-carbon climate response in the CMIP5 climate models using a simplified approach, J. Climate, 26, 4897–4909, https://doi.org/10.1175/JCLI-D-12-00550.1, 2013.
Burke, E. J., Zhang, Y., and Krinner, G.: Evaluating permafrost physics in the Coupled Model Intercomparison Project 6 (CMIP6) models and their sensitivity to climate change, The Cryosphere, 14, 3155–3174, https://doi.org/10.5194/tc-14-3155-2020, 2020.
Chen, Y., Liu, A., and Moore, J. C.: Mitigation of Arctic permafrost carbon loss through stratospheric aerosol geoengineering, Nat. Commun., 11, 2430, https://doi.org/10.1038/s41467-020-16357-8, 2020.
Fankhauser, S., Smith, S. M., Allen, M., Axelsson, K., Hale, T., Hepburn, C., Kendall, J. M., Khosla, R., Lezaun, J., Mitchell-Larson, E., Obersteiner, M., Rajamani, L., Rickaby, R., Seddon, N., and Wetzer, T.: The meaning of net zero and how to get it right, Nat. Clim. Change, 12, 15–21, https://doi.org/10.1038/s41558-021-01245-w, 2022.
Fox-Kemper, B., Hewitt, H., Xiao, C., Aðalgeirsdóttir, G., Drijfhout, S., Edwards, T., Golledge, N., Hemer, M., Kopp, R., Krinner, G., Mix, A., Notz, D., Nowiciki, S., Nurhati, I., Ruiz, J., Sallée, J., Slangen, A., and Yu, Y.: Ocean, Cryosphere and Sea Level Change, in: Climate Change 2021 Phys. Sci. Basis, Contrib. Work. Gr. I to Sixth Assess. Rep. Intergov. Panel Clim. Chang., Cambridge University Press, United Kingdom and New York, NY, USA, 2021.
Gasser, T., Kechiar, M., Ciais, P., Burke, E. J., Kleinen, T., Zhu, D., Huang, Y., Ekici, A., and Obersteiner, M.: Path-dependent reductions in CO2 emission budgets caused by permafrost carbon release, Nat. Geosci., 11, 830–835, https://doi.org/10.1038/s41561-018-0227-0, 2018.
Gettelman, A., Hannay, C., Bacmeister, J. T., Neale, R. B., Pendergrass, A. G., Danabasoglu, G., Lamarque, J. F., Fasullo, J. T., Bailey, D. A., Lawrence, D. M., and Mills, M. J.: High Climate Sensitivity in the Community Earth System Model Version 2 (CESM2), Geophys. Res. Lett., 46, 8329–8337, https://doi.org/10.1029/2019GL083978, 2019.
Hempel, S., Frieler, K., Warszawski, L., Schewe, J., and Piontek, F.: A trend-preserving bias correction – the ISI-MIP approach, Earth Syst. Dynam., 4, 219–236, https://doi.org/10.5194/esd-4-219-2013, 2013.
Hjort, J., Streletskiy, D., Doré, G., Wu, Q., Bjella, K., and Luoto, M.: Impacts of permafrost degradation on infrastructure, Nat. Rev. Earth. Environ., 3, 24–38, https://doi.org/10.1038/s43017-021-00247-8, 2022.
Hope, C. and Schaefer, K.: Economic impacts of carbon dioxide and methane released from thawing permafrost, Nat. Clim. Change, 6, 56–59, https://doi.org/10.1038/nclimate2807, 2016.
Hugelius, G., Strauss, J., Zubrzycki, S., Harden, J. W., Schuur, E. A. G., Ping, C.-L., Schirrmeister, L., Grosse, G., Michaelson, G. J., Koven, C. D., O'Donnell, J. A., Elberling, B., Mishra, U., Camill, P., Yu, Z., Palmtag, J., and Kuhry, P.: Estimated stocks of circumpolar permafrost carbon with quantified uncertainty ranges and identified data gaps, Biogeosciences, 11, 6573–6593, https://doi.org/10.5194/bg-11-6573-2014, 2014.
IPCC SROCC: IPCC Special Report on the Ocean and Cryosphere in a Changing Climate, Intergov. Panel Clim. Chang., 2020.
Irvine, P., Emanuel, K., He, J., Horowitz, L. W., Vecchi, G., and Keith, D.: Halving warming with idealized solar geoengineering moderates key climate hazards, Nat. Clim. Change, 9, 295–299, https://doi.org/10.1038/s41558-019-0398-8, 2019.
Keuper, F., Wild, B., Kummu, M., Beer, C., Blume-Werry, G., Fontaine, S., Gavazov, K., Gentsch, N., Guggenberger, G., Hugelius, G., Jalava, M., Koven, C., Krab, E. J., Kuhry, P., Monteux, S., Richter, A., Shahzad, T., Weedon, J. T., and Dorrepaal, E.: Carbon loss from northern circumpolar permafrost soils amplified by rhizosphere priming, Nat. Geosci., 13, 560–565, https://doi.org/10.1038/s41561-020-0607-0, 2020.
Koven, C. D., Schuur, E. A. G., Schädel, C., Bohn, T. J., Burke, E. J., Chen, G., Chen, X., Ciais, P., Grosse, G., Harden, J. W., Hayes, D. J., Hugelius, G., Jafarov, E. E., Krinner, G., Kuhry, P., Lawrence, D. M., MacDougall, A. H., Marchenko, S. S., McGuire, A. D., Natali, S. M., Nicolsky, D. J., Olefeldt, D., Peng, S., Romanovsky, V. E., Schaefer, K. M., Strauss, J., Treat, C. C., and Turetsky, M.: A simplified, data-constrained approach to estimate the permafrost carbon–climate feedback, Philos. T. R. Soc. A, 373, 20140423, https://doi.org/10.1098/rsta.2014.0423, 2015.
Kravitz, B., Robock, A., Tilmes, S., Boucher, O., English, J. M., Irvine, P. J., Jones, A., Lawrence, M. G., MacCracken, M., Muri, H., Moore, J. C., Niemeier, U., Phipps, S. J., Sillmann, J., Storelvmo, T., Wang, H., and Watanabe, S.: The Geoengineering Model Intercomparison Project Phase 6 (GeoMIP6): simulation design and preliminary results, Geosci. Model Dev., 8, 3379–3392, https://doi.org/10.5194/gmd-8-3379-2015, 2015.
Lee, W. R., MacMartin, D. G., Visioni, D., and Kravitz, B.: High-latitude stratospheric aerosol geoengineering can be more effective if injection is limited to spring, Geophys. Res. Lett., 48, e2021GL092696, https://doi.org/10.1029/2021GL092696, 2021.
Lee, W. R., MacMartin, D. G., Visioni, D., Kravitz, B., Chen, Y., Moore, J. C., Leguy, G., Lawrence, D. M., and Bailey, D. A.: High-latitude stratospheric aerosol injection to preserve the Arctic, Earth and Space Science Open Archive [preprint], https://doi.org/10.1002/essoar.10512047.1, 22 November 2022, 2022.
Liu, A., Chen, Y., and Cheng, X.: Social cost of carbon under a carbon-neutral pathway, Environ. Res. Lett., 17, 054031, https://doi.org/10.1088/1748-9326/ac6819, 2022.
Macias-Fauria, M., Jepson, P., Zimov, N., and Malhi, Y.: Pleistocene Arctic megafaunal ecological engineering as a natural climate solution?, Philos. T. R. Soc. B, 375, 20190122, https://doi.org/10.1098/rstb.2019.0122, 2020.
Mauritsen, T., Bader, J., Becker, T., Behrens, J., Bittner, M., Brokopf, R., Brovkin, V., Claussen, M., Crueger, T., Esch, M., Fast, I., Fiedler, S., Fläschner, D., Gayler, V., Giorgetta, M., Goll, D. S., Haak, H., Hagemann, S., Hedemann, C., Hohenegger, C., Ilyina, T., Jahns, T., Jimenéz-de-la-Cuesta, D., Jungclaus, J., Kleinen, T., Kloster, S., Kracher, D., Kinne, S., Kleberg, D., Lasslop, G., Kornblueh, L., Marotzke, J., Matei, D., Meraner, K., Mikolajewicz, U., Modali, K., Möbis, B., Müller, W. A., Nabel, J. E. M. S., Nam, C. C. W., Notz, D., Nyawira, S. S., Paulsen, H., Peters, K., Pincus, R., Pohlmann, H., Pongratz, J., Popp, M., Raddatz, T. J., Rast, S., Redler, R., Reick, C. H., Rohrschneider, T., Schemann, V., Schmidt, H., Schnur, R., Schulzweida, U., Six, K. D., Stein, L., Stemmler, I., Stevens, B., von Storch, J. S., Tian, F., Voigt, A., Vrese, P., Wieners, K. H., Wilkenskjeld, S., Winkler, A., and Roeckner, E.: Developments in the MPI-M Earth System Model version 1.2 (MPI-ESM1.2) and Its Response to Increasing CO2, J. Adv. Model. Earth Sy., 11, 998–1038, https://doi.org/10.1029/2018MS001400, 2019.
McGuire, A. D., Lawrence, D. M., Koven, C., Clein, J. S., Burke, E., Chen, G., Jafarov, E., MacDougall, A. H., Marchenko, S., Nicolsky, D., Peng, S., Rinke, A., Ciais, P., Gouttevin, I., Hayes, D. J., Ji, D., Krinner, G., Moore, J. C., Romanovsky, V., Schädel, C., Schaefer, K., Schuur, E. A. G., and Zhuang, Q.: Dependence of the evolution of carbon dynamics in the northern permafrost region on the trajectory of climate change, P. Natl. Acad. Sci. USA, 115, 3882–3887, https://doi.org/10.1073/pnas.1719903115, 2018.
McKay, D. I. A., Staal, A., Abrams, J. F., Winkelmann, R., Sakschewski, B., Loriani, S., Fetzer, I., Cornell, S. E., Rockström, J., and Lenton, T. M.: Exceeding 1.5 ∘C global warming could trigger multiple climate tipping points, Science, 377, eabn7950, https://doi.org/10.1126/science.abn7950, 2022.
Meinshausen, M., Lewis, J., McGlade, C., Gütschow, J., Nicholls, Z., Burdon, R., Cozzi, L., and Hackmann, B.: Realization of Paris Agreement pledges may limit warming just below 2 ∘C, Nature, https://doi.org/10.1038/s41586-022-04553-z, 2022.
Miner, K. R., Turetsky, M. R., Malina, E., Bartsch, A., Tamminen, J., McGuire, A. D., Fix, A., Sweeney, C., Elder, C. D., and Miller, C. E.: Permafrost carbon emissions in a changing Arctic, Nat. Rev. Earth. Environ., 3, 55–67, https://doi.org/10.1038/s43017-021-00230-3, 2022.
Mishra, U., Hugelius, G., Shelef, E., Yang, Y., Strauss, J., Lupachev, A., Harden, J. W., Jastrow, J. D., Ping, C. L., Riley, W. J., Schuur, E. A. G., Matamala, R., Siewert, M., Nave, L. E., Koven, C. D., Fuchs, M., Palmtag, J., Kuhry, P., Treat, C. C., Zubrzycki, S., Hoffman, F. M., Elberling, B., Camill, P., Veremeeva, A., and Orr, A.: Spatial heterogeneity and environmental predictors of permafrost region soil organic carbon stocks, Sci. Adv., 7, eaaz5236, https://doi.org/10.1126/sciadv.aaz5236, 2021.
Mudryk, L., Santolaria-Otín, M., Krinner, G., Ménégoz, M., Derksen, C., Brutel-Vuilmet, C., Brady, M., and Essery, R.: Historical Northern Hemisphere snow cover trends and projected changes in the CMIP6 multi-model ensemble, The Cryosphere, 14, 2495–2514, https://doi.org/10.5194/tc-14-2495-2020, 2020.
Muñoz-Sabater, J., Dutra, E., Agustí-Panareda, A., Albergel, C., Arduini, G., Balsamo, G., Boussetta, S., Choulga, M., Harrigan, S., Hersbach, H., Martens, B., Miralles, D. G., Piles, M., Rodríguez-Fernández, N. J., Zsoter, E., Buontempo, C., and Thépaut, J.-N.: ERA5-Land: a state-of-the-art global reanalysis dataset for land applications, Earth Syst. Sci. Data, 13, 4349–4383, https://doi.org/10.5194/essd-13-4349-2021, 2021.
Obu, J., Westermann, S., Bartsch, A., Berdnikov, N., Christiansen, H. H., Dashtseren, A., Delaloye, R., Elberling, B., Etzelmüller, B., Kholodov, A., Khomutov, A., Kääb, A., Leibman, M. O., Lewkowicz, A. G., Panda, S. K., Romanovsky, V., Way, R. G., Westergaard-Nielsen, A., Wu, T., Yamkhin, J., and Zou, D.: Northern Hemisphere permafrost map based on TTOP modelling for 2000–2016 at 1 km2 scale, Earth Sci Rev., 193, 299–316, https://doi.org/10.1016/j.earscirev.2019.04.023, 2019.
Running, S. W. and Zhao, M.: User's Guide Daily GPP and Annual NPP (MOD17A2H/A3H) and Year-end Gap-Filled (MOD17A2HGF/A3HGF) Products NASA Earth Observing System MODIS Land Algorithm (For Collection 6), NASA EOSDIS L. Process. DAAC, 2019.
Schädel, C., Schuur, E. A. G., Bracho, R., Elberling, B., Knoblauch, C., Lee, H., Luo, Y., Shaver, G. R., and Turetsky, M. R.: Circumpolar assessment of permafrost C quality and its vulnerability over time using long-term incubation data, Glob. Change Biol., 20, 641–652, https://doi.org/10.1111/gcb.12417, 2014.
Schneider von Deimling, T., Grosse, G., Strauss, J., Schirrmeister, L., Morgenstern, A., Schaphoff, S., Meinshausen, M., and Boike, J.: Observation-based modelling of permafrost carbon fluxes with accounting for deep carbon deposits and thermokarst activity, Biogeosciences, 12, 3469–3488, https://doi.org/10.5194/bg-12-3469-2015, 2015.
Schuur, E. A. G., Abbott, B. W., Bowden, W. B., Brovkin, V., Camill, P., Canadell, J. G., Chanton, J. P., Chapin, F. S., Christensen, T. R., Ciais, P., Crosby, B. T., Czimczik, C. I., Grosse, G., Harden, J., Hayes, D. J., Hugelius, G., Jastrow, J. D., Jones, J. B., Kleinen, T., Koven, C. D., Krinner, G., Kuhry, P., Lawrence, D. M., McGuire, A. D., Natali, S. M., O'Donnell, J. A., Ping, C. L., Riley, W. J., Rinke, A., Romanovsky, V. E., Sannel, A. B. K., Schädel, C., Schaefer, K., Sky, J., Subin, Z. M., Tarnocai, C., Turetsky, M. R., Waldrop, M. P., Walter Anthony, K. M., Wickland, K. P., Wilson, C. J., and Zimov, S. A.: Expert assessment of vulnerability of permafrost carbon to climate change, Climatic Change, 119, 359–374, https://doi.org/10.1007/s10584-013-0730-7, 2013.
Schuur, E. A. G., McGuire, A. D., Schädel, C., Grosse, G., Harden, J. W., Hayes, D. J., Hugelius, G., Koven, C. D., Kuhry, P., Lawrence, D. M., Natali, S. M., Olefeldt, D., Romanovsky, V. E., Schaefer, K., Turetsky, M. R., Treat, C. C., and Vonk, J. E.: Climate change and the permafrost carbon feedback, Nature, 520, 171–179, https://doi.org/10.1038/nature14338, 2015.
Séférian, R., Nabat, P., Michou, M., Saint-Martin, D., Voldoire, A., Colin, J., Decharme, B., Delire, C., Berthet, S., Chevallier, M., Sénési, S., Franchisteguy, L., Vial, J., Mallet, M., Joetzjer, E., Geoffroy, O., Guérémy, J. F., Moine, M. P., Msadek, R., Ribes, A., Rocher, M., Roehrig, R., Salas-y-Mélia, D., Sanchez, E., Terray, L., Valcke, S., Waldman, R., Aumont, O., Bopp, L., Deshayes, J., Éthé, C., and Madec, G.: Evaluation of CNRM Earth System Model, CNRM-ESM2-1: Role of Earth System Processes in Present-Day and Future Climate, J. Adv. Model. Earth Sy., 11, 4182–4227, https://doi.org/10.1029/2019MS001791, 2019.
Sellar, A. A., Walton, J., Jones, C. G., Wood, R., Abraham, N. L., Andrejczuk, M., Andrews, M. B., Andrews, T., Archibald, A. T., de Mora, L., Dyson, H., Elkington, M., Ellis, R., Florek, P., Good, P., Gohar, L., Haddad, S., Hardiman, S. C., Hogan, E., Iwi, A., Jones, C. D., Johnson, B., Kelley, D. I., Kettleborough, J., Knight, J. R., Köhler, M. O., Kuhlbrodt, T., Liddicoat, S., Linova-Pavlova, I., Mizielinski, M. S., Morgenstern, O., Mulcahy, J., Neininger, E., O'Connor, F. M., Petrie, R., Ridley, J., Rioual, J. C., Roberts, M., Robertson, E., Rumbold, S., Seddon, J., Shepherd, H., Shim, S., Stephens, A., Teixiera, J. C., Tang, Y., Williams, J., Wiltshire, A., and Griffiths, P. T.: Implementation of U. K. Earth System Models for CMIP6, J. Adv. Model. Earth Sy., 12, e2019MS001946, https://doi.org/10.1029/2019MS001946, 2020.
Smith, W.: The cost of stratospheric aerosol injection through 2100, Environ. Res. Lett., 15, 114004, https://doi.org/10.1088/1748-9326/aba7e7, 2020.
Treat, C. C., Natali, S. M., Ernakovich, J., Iversen, C. M., Lupascu, M., Mcguire, A. D., Norby, R. J., Roy Chowdhury, T., Richter, A., Šantrůčková, H., Schädel, C., Schuur, E. A. G., Sloan, V. L., Turetsky, M. R., and Waldrop, M. P.: A pan-Arctic synthesis of CH4 and CO2 production from anoxic soil incubations, Glob. Change Biol., 21, 2787–2803, https://doi.org/10.1111/gcb.12875, 2015.
Turetsky, M. R., Abbott, B. W., Jones, M. C., Anthony, K. W., Olefeldt, D., Schuur, E. A. G., Grosse, G., Kuhry, P., Hugelius, G., Koven, C., Lawrence, D. M., Gibson, C., Sannel, A. B. K., and McGuire, A. D.: Carbon release through abrupt permafrost thaw, Nat. Geosci., 13, 138–143, https://doi.org/10.1038/s41561-019-0526-0, 2020.
Varney, R. M., Chadburn, S. E., Burke, E. J., and Cox, P. M.: Evaluation of soil carbon simulation in CMIP6 Earth system models, Biogeosciences, 19, 4671–4704, https://doi.org/10.5194/bg-19-4671-2022, 2022.
Visioni, D., MacMartin, D. G., Kravitz, B., Lee, W., Simpson, I. R., and Richter, J. H.: Reduced Poleward Transport Due to Stratospheric Heating Under Stratospheric Aerosols Geoengineering, Geophys. Res. Lett., 47, e2020GL089470, https://doi.org/10.1029/2020GL089470, 2020.
Visioni, D., MacMartin, D. G., Kravitz, B., Boucher, O., Jones, A., Lurton, T., Martine, M., Mills, M. J., Nabat, P., Niemeier, U., Séférian, R., and Tilmes, S.: Identifying the sources of uncertainty in climate model simulations of solar radiation modification with the G6sulfur and G6solar Geoengineering Model Intercomparison Project (GeoMIP) simulations, Atmos. Chem. Phys., 21, 10039–10063, https://doi.org/10.5194/acp-21-10039-2021, 2021.
Walter Anthony, K., Schneider von Deimling, T., Nitze, I., Frolking, S., Emond, A., Daanen, R., Anthony, P., Lindgren, P., Jones, B., and Grosse, G.: 21st-century modeled permafrost carbon emissions accelerated by abrupt thaw beneath lakes, Nat. Commun., 9, 3262, https://doi.org/10.1038/s41467-018-05738-9, 2018.
Wang, W., Rinke, A., Moore, J. C., Cui, X., Ji, D., Li, Q., Zhang, N., Wang, C., Zhang, S., Lawrence, D. M., McGuire, A. D., Zhang, W., Delire, C., Koven, C., Saito, K., MacDougall, A., Burke, E., and Decharme, B.: Diagnostic and model dependent uncertainty of simulated Tibetan permafrost area, The Cryosphere, 10, 287–306, https://doi.org/10.5194/tc-10-287-2016, 2016.
WCRP: CMIP6 project data, ESGF [data set], World Climate Research Programme, https://esgf-node.llnl.gov/projects/cmip6/ (last access: 3 July 2022), 2022.
Yumashev, D., Hope, C., Schaefer, K., Riemann-Campe, K., Iglesias-Suarez, F., Jafarov, E., Burke, E. J., Young, P. J., Elshorbany, Y., and Whiteman, G.: Climate policy implications of nonlinear decline of Arctic land permafrost and other cryosphere elements, Nat. Commun., 10, 1900, https://doi.org/10.1038/s41467-019-09863-x, 2019.
Zarnetske, P. L., Gurevitch, J., Franklin, J., Groffman, P. M., Harrison, C. S., Hellmann, J. J., Hoffman, F. M., Kothari, S., Robock, A., Tilmes, S., Visioni, D., Wu, J., Xia, L., and Yang, C. E.: Potential ecological impacts of climate intervention by reflecting sunlight to cool Earth, P. Natl. Acad. Sci. USA, 118, e1921854118, https://doi.org/10.1073/pnas.1921854118, 2021.