the Creative Commons Attribution 4.0 License.
the Creative Commons Attribution 4.0 License.
 | 01 Mar 2023
Persistent La Niñas drive joint soybean harvest failures in North and South America
Sem Vijverberg
Anne F. Van Loon
Jeroen Aerts
Dim Coumou
Around 80 % of global soybean supply is produced in southeast South America (SESA), central Brazil (CB) and the United States (US) alone. This concentration of production in few regions makes global soybean supply sensitive to spatially compounding harvest failures. Weather variability is a key driver of soybean variability, with soybeans being especially vulnerable to hot and dry conditions during the reproductive growth stage in summer. El Niño–Southern Oscillation (ENSO) teleconnections can influence summer weather conditions across the Americas, presenting potential risks for spatially compounding harvest failures. Here, we develop causal structural models to quantify the influence of ENSO on soybean yields via mediating variables like local weather conditions and extratropical sea surface temperatures (SSTs). We show that soybean yields are predominately driven by soil moisture conditions in summer, explaining ∼50 %, 18 % and 40 % of yield variability in SESA, CB and the US respectively. Summer soil moisture is strongly driven by spring soil moisture, as well as by remote extratropical SST patterns in both hemispheres. Both of these soil moisture drivers are again influenced by ENSO. Our causal models show that persistent negative ENSO anomalies of −1.5 standard deviation (SD) lead to a −0.4 SD soybean reduction in the US and SESA. When spring soil moisture and extratropical SST precursors are pronouncedly negative (−1.5 SD), then estimated soybean losses increase to −0.9 SD for the US and SESA. Thus, by influencing extratropical SSTs and spring soil moisture, persistent La Niñas can trigger substantial soybean losses in both the US and SESA, with only minor potential gains in CB. Our findings highlight the physical pathways by which ENSO conditions can drive spatially compounding events. Such information may increase preparedness against climate-related global soybean supply shocks.
- Article
(5405 KB) - Full-text XML
-
Supplement
(684 KB) - BibTeX
- EndNote


Joint soybean harvest failures in key producing regions can put substantial pressure on the global food system (Venter, 2022). The highly interconnected global food trade network means local crop failures can trigger cascading impacts, affecting commodity prices, food security and regional socio-political instability (Bren D'Amour et al., 2016; Puma, 2019; Puma et al., 2015; Torreggiani et al., 2018; Von Uexkull et al., 2016). Food crises are seldom attributable to one single factor. Nevertheless, unfavorable weather and climate conditions can threaten the stability of the global food system. For example, both the 2007–2008 and 2010–2011 global food crises coincided with climate-driven production shortages in major crop-producing regions (Anderson, 2018; Braun, 2008; Bren D'Amour et al., 2016; Gilbert and Morgan, 2010; Timmer, 2010).
Global soybean supply is particularly sensitive to joint production failures, as more than 80 % of global market supply comes from the United States, Brazil and Argentina alone (Anderson et al., 2017b; Iizumi and Sakai, 2020; Torreggiani et al., 2018; Wellesley et al., 2017). A large part of the soybean production is dedicated to animal feed (Cassidy et al., 2013). In consequence, production deficits can also affect the growing market for animal products (Cassidy et al., 2013; Leister et al., 2015). For instance, drought conditions in 2012 in the US, Argentina and southern Brazil led to important local soybean harvest failures (Elliott et al., 2018; van Garderen and Mindlin, 2022; Goulart et al., 2021; Hoerling et al., 2014). These triggered global shortages in soybean supply, affected the livestock industry and led to unprecedented increases in soybean commodity price (Leister et al., 2015; Voora et al., 2020; Zhang et al., 2018).
Soybean harvest failures are often related to anomalously hot and dry conditions in summer (Hamed et al., 2021). Studies have shown that interannual climate variability is one key factor that strongly impacts crop yields (Lobell et al., 2011; Lobell and Field, 2007; Ray et al., 2015). Soybean crops are particularly vulnerable during the reproductive period, occurring mainly in January–February–March (JFM) for South America and July–August–September (JAS) for North America (Anderson et al., 2017a, b; Ortiz-Bobea et al., 2019). Hot and dry conditions can occur over large spatial domains and thereby trigger important national production deficits (Elliott et al., 2018; Geirinhas et al., 2021; Lesk and Anderson, 2021). Such conditions are often linked to large-scale oceanic and atmospheric anomalies, which can induce spatially compounding crop failures in key soybean production regions (Anderson et al., 2017b; Heino et al., 2018; Steptoe et al., 2018).
To assess global soybean supply risks, it is essential to investigate the co-occurrence of summertime hot–dry conditions over the main soybean-producing regions. Previous work highlighted that El Niño–Southern Oscillation (ENSO) variability can drive correlated risk in North and South American soybean-producing regions (Anderson et al., 2017a, b, 2018, 2019). ENSO pathways that have an impacts on soybean production in North or South America can be either direct or indirect. For example, ENSO can directly affect the reproductive period soil moisture levels (i.e., in summer) and thereby crop yields (Anderson et al., 2017b). But, ENSO can also affect spring soil moisture, indirectly affecting soybean production via soil moisture memory (Anderson et al., 2017b). Similarly, ENSO can affect extratropical sea surface temperature (SST) regions that can subsequently induce atmospheric teleconnections of their own, which might impact crops during the summer reproductive period (Anderson et al., 2017b; MacLeod et al., 2021; Vijverberg and Coumou, 2022). Relevant examples are the North Pacific SST conditions, which can influence boreal summer hot and dry conditions in the US, and the South Atlantic SSTs, conditions which can influence austral summer hot and dry conditions in South America (Barros et al., 2000; Cai et al., 2020; Doyle and Barros, 2002; Gelbrecht et al., 2021; Jorgetti et al., 2014; McKinnon et al., 2016; Sasaki et al., 2021; Vijverberg et al., 2020; Vijverberg and Coumou, 2022). Both these patterns are influenced by ENSO teleconnections, which highlights a complex chain of causes and effects that can lead to spatially compounding soybean losses (Alexander et al., 2002; Cai et al., 2020; Gelbrecht et al., 2021; Vijverberg and Coumou, 2022).
Understanding and quantifying the causal teleconnection pathways impacting global soybean production is essential to assess risks of joint production failure under present and future climate. Nevertheless, a self-consistent framework linking the direct and indirect effects of ENSO on global soybean production is currently missing. Still, multiple studies have focused on specific sub-elements of such a causal network, providing a rich scientific basis to connect relevant variables together. Here, we connect these pieces of evidence by constructing linear structural causal models that allow us to quantify direct and indirect effects on soybean yields in the main growing regions. We first identify the direct and indirect effects of summer soil moisture, temperature and antecedent soil moisture (spring) on yield anomalies in the three regions of study separately. We then proceed to identify the main SST teleconnections affecting local summer hot and dry conditions in the three considered regions. Finally, we investigate the influence of ENSO on those SSTs and thereby its role in modulating spatially compounding soybean harvest failures.
2.1 Soybean yield data
Soybean crop statistics at county scale for the period 1980–2019 for the United States, Argentina and Brazil are obtained from the US Department of Agriculture (USDA) National Agricultural Statistics Service (NASS) quick-stats database (https://quickstats.nass.usda.gov/, last access: 1 February 2022), the Integrated Agricultural Information System (http://www.siia.gov.ar/, last access: 1 February 2022) and the Brazilian Institute of Geography and Statistics (https://www.ibge.gov.br/https://www.conab.gov.br/, last access: 1 February 2022), respectively. A linear trend is removed from yield values at county scale to eliminate long-term effects largely due to technological improvements over the study period. Spatial information on the harvested area and the extent of the rainfed managed soybean production is obtained from the monthly irrigated and rainfed crop area database around the year 2000 (MIRCA2000), a global gridded dataset at a 0.5∘ resolution (Portmann et al., 2010). Counties are selected for further analysis when at least 30 out of the 40 possible county-scale yield data points are available and when rainfed agriculture constitutes at least 90 % of the county-scale production area share. Selected counties are grouped into three regions qualitatively defined based on existing literature on regional climatic regimes (Anderson et al., 2019; Beck et al., 2018). Soybean production counties in Argentina and south Brazil are combined into one region, which we refer to as the southeast South American (SESA) region. The central Brazilian (CB) production counties are combined into one region, and the eastern United Stated production counties are combined into one region (US; Fig. 1a). Wisconsin, Michigan, Minnesota and North and South Dakota are omitted from the US cluster, as these northern states were previously shown to have a different seasonal climate sensitivity compared to the rest of the US regions considered (Hamed et al., 2021; Schauberger et al., 2017). The final retained soybean production area in this study represents 57 % of the total production area across North and South America, as per the MIRCA2000 dataset. Weighted spatial average time series are calculated at regional level for the three defined regions using local harvested area as weight (Fig. 1b). In this way, regionally averaged time series emphasize major producing counties in each cluster rather than counties with less contribution to overall production.
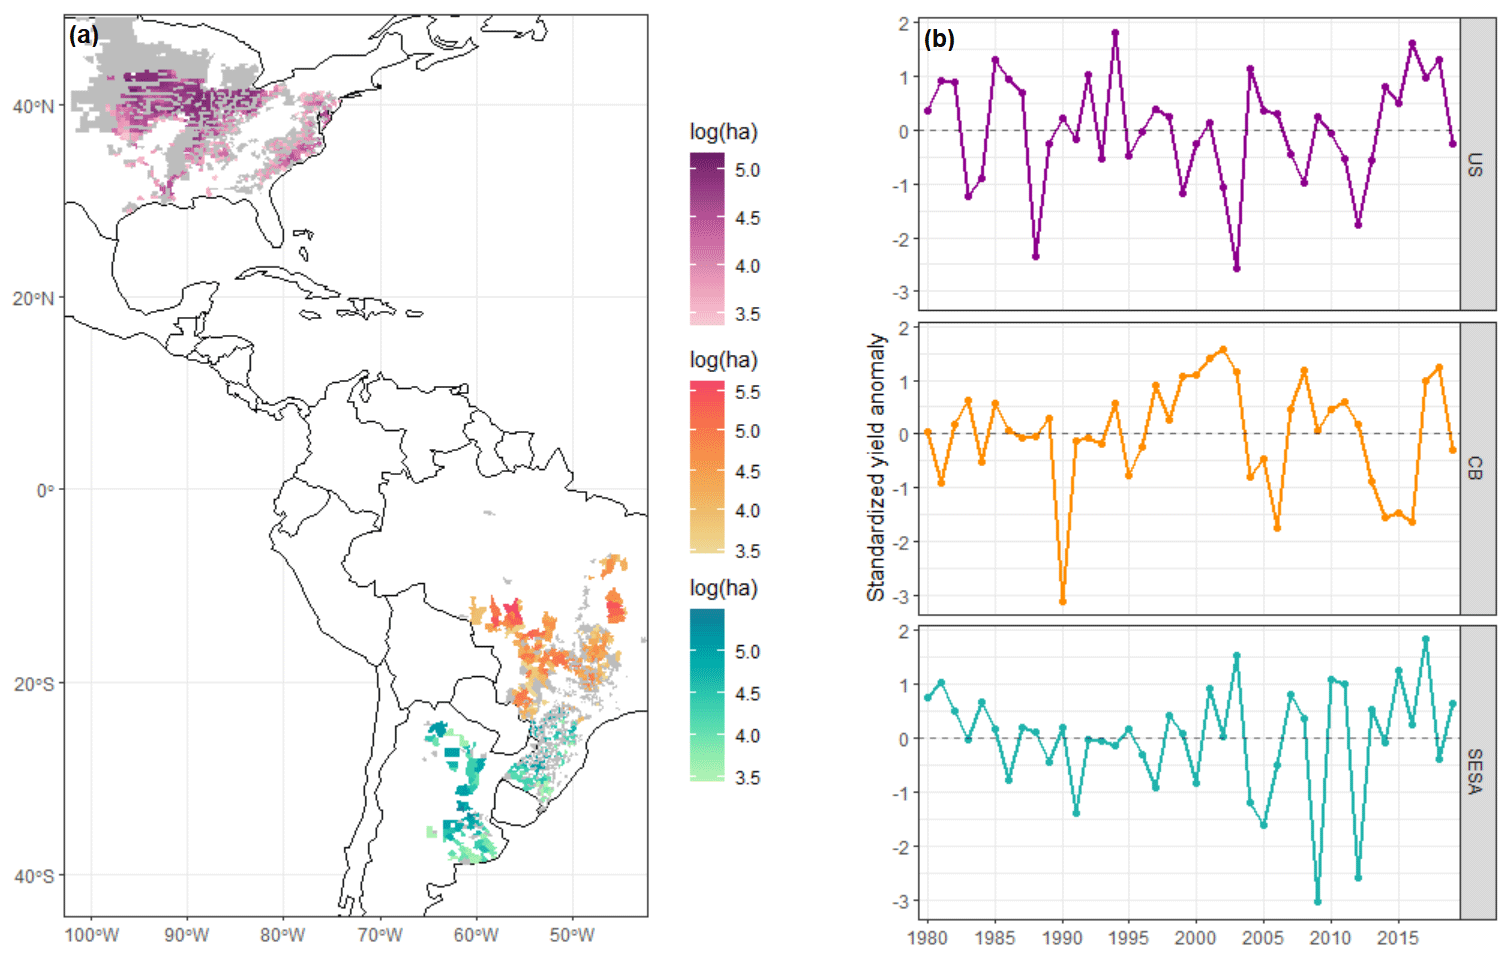
Figure 1(a) Soybean harvested area in hectares (ha) per county (logarithmic scale) in North and South American breadbaskets considered for this analysis. Colors represent three separate cluster regions: US (purple), central Brazil (orange) and southeast South America (green). Gray represents regions that have been masked out due to data availability and land management. (b) Harvest area weighted-average yield time series for the three considered target regions.
2.2 Climate data
The soybean main growing season extends from October to May in the SESA and CB regions and April to October in the US region (Portmann et al., 2010). In what follows, growing season conditions are split into vegetative (spring) and reproductive (summer) stages to account for the varying soybean weather sensitivities across time. The vegetative stage (spring period) is considered to extend over October, November and December (OND) for regions in the Southern Hemisphere and April, May and June (AMJ) for regions in the Northern Hemisphere. The reproductive stage (summer period) is considered to extend over January, February and March (JFM) for regions in the Southern Hemisphere and July, August and September (JAS) for regions in the Northern Hemisphere. Other studies have considered a more dynamic representation of crop developmental stages based on, for example, phenological heat units (Schauberger et al., 2017). Nevertheless, these have led to qualitatively similar results, and therefore, we have opted here to simply rely on fixed 3-month periods. Root zone soil moisture (SM; m3 m−3) is obtained from the modeled GLEAM v3.5a dataset that assimilates observed satellite-based soil moisture input (Martens et al., 2017). The dataset is downloaded at 0.5∘ grid resolution for the period 1980–2019 and temporally averaged over the aforementioned vegetative (spring) and reproductive (summer) periods. Maximum temperature (Tmax; ∘C) and rainfall (mm) are obtained from the bias-adjusted WFDE5 v2.0 reanalysis dataset covering the period 1979–2019 at a daily time step and a 0.5∘ grid resolution (Cucchi et al., 2020). In order to isolate particularly harmful temperatures, maximum temperature is further processed into killing degree days (KDD) using 35 ∘C as the critical temperature threshold (Tc). KDD is calculated following Eq. (1):
where is the maximum temperature on the i-th day, and n is the number of crop summer days. For simplicity, we refer to KDD as extreme heat in what follows. Rainfall is summed over the respective spring and summer periods. All three variables are initially linearly detrended at the grid cell level and at a monthly time scale to remove the long-term climate change signal. In a second step, all climatic variables are spatially averaged over considered regions using a similar harvest area weighted spatial average approach.
In order to analyze large-scale drivers of local hot and dry conditions, monthly geopotential height at 500 hPa (Z500) and sea surface temperature (SST) variables are obtained from the ERA-5 reanalysis at 1∘ grid resolution for the period (1979–2019; Hersbach, 2017). These variables are first detrended at the grid cell level to remove the long-term climate change signal, then they are averaged over the respective spring and summer periods. Furthermore, 3-monthly ENSO time series are constructed based on spatial averages of sea surface temperature (SST) anomalies in the Niño3.4 region (5∘ N–5∘ S, 170–120∘ W).
2.3 A framework for quantifying causal pathways among climate and yield variables
We apply structural equation modeling (SEM) fitted using the robust maximum likelihood estimator to model the relative influence of spring antecedent soil moisture, summer soil moisture, rainfall and extreme heat on soybean yields in the three distinct regions. Then, this framework is again applied to model the influence of remote teleconnections on regional climate and soybean yields in the three regions. SEM is a form of multiple linear regression analysis that aims to quantify direct and indirect causal effects in a set of correlated variables (Fan et al., 2016). One key value of such a modeling framework is that it allows causal assumptions implied by a user-defined directed a-cyclical graph (DAG) to be tested. A DAG is a path diagram with directed arrows indicating the hypothesized structure in which information flows among a set of variables. Each path is represented by a standardized path coefficient that quantifies the direct effect of a driving variable on a response variable. The overall model goodness of fit is assessed using the χ2 statistic, with (Pχ2<0.05) set as a cut-off significance level. The χ2 statistic tests the null hypothesis that claims no difference between observed and model-estimated covariance matrices. It follows that model goodness of fit is concluded by failure to reject the null hypothesis (Shipley, 2000). For statistical robustness, bootstrapped estimates based on 1000 draws are produced for all estimated coefficients.
2.4 Linking local soil moisture conditions to Z500 and SST fields
We use same-season and lagged correlation maps for Z500 and SST fields against spatially averaged summer-period soil moisture for all regions separately. Due to multiple significance testing, we account for the false discovery rate using the Benjamini–Hochberg correction and consider a corrected significance threshold set at PFDR<0.05 (Benjamini and Hochberg, 1995). The strongly correlating regions that are found are in line with the current literature on links between large-scale teleconnections and local summer climate variability in the US, SESA and CB. These regions are encapsulated by a bounding box and used to calculate spatial covariance time series between the SST anomalies and the SST correlation pattern, rendering a 1 d time series. The correlation pattern is weighted by the inverse of the p value (PFDR) to emphasize strongly correlating grid cells (Vijverberg and Coumou, 2022). These time series are meant to present a summary of the highlighted SST pattern and are used to model the direct relationship between large-scale SST variability and local soil moisture variability.
3.1 Impacts of hot and dry conditions on soybean yields
Using SEM, we test whether the data can reject or confirm the hypothesized causal diagram. A central causal hypothesis, common to all three distinct production regions, assumes that yield variability is driven primarily by extreme heat and dry soils during summer (JAS for the US, JFM for the SESA and CB regions; Fig. 2). We further hypothesize that soil moisture during summer is influenced by same-season (summer) rainfall variability and antecedent (spring) soil moisture conditions (AMJ for the US, OND for the SESA and CB regions). Finally, we hypothesize that soil moisture drives extreme heat in summer. While, physically, soil moisture and temperature are characterized by two-way coupling on synoptic timescales, here we set the causal link upward (i.e., from soil moisture to extreme heat), as we are primarily interested in slower processes operating on (sub)-seasonal timescales. Our regions (particularly US and SESA) are characterized by transitional climate regimes with typically moisture-limited conditions during summer (Hamed et al., 2021; Lesk et al., 2021; Seneviratne et al., 2010). In such soil-moisture-limited regions, the downward effect of high temperatures on soil moisture via evaporation is typically small (as there is limited or no water available for evaporation). In contrast, this limited evaporation implies strong sensible heat fluxes and thus a strong upward effect from soil moisture to temperature (Miralles et al., 2019; Seneviratne et al., 2010).
Using SEM, we show that those causal assumptions are consistent with the data in the three different regions (P values for χ2 test = 0.51, 0.2 and 0.12 for CB, SESA and US, respectively). Specifically, the effects of spring soil moisture and summer-period precipitation on crop yields are, to first order approximation, fully mediated by summer soil moisture in all regions and thus only indirectly effect crops.
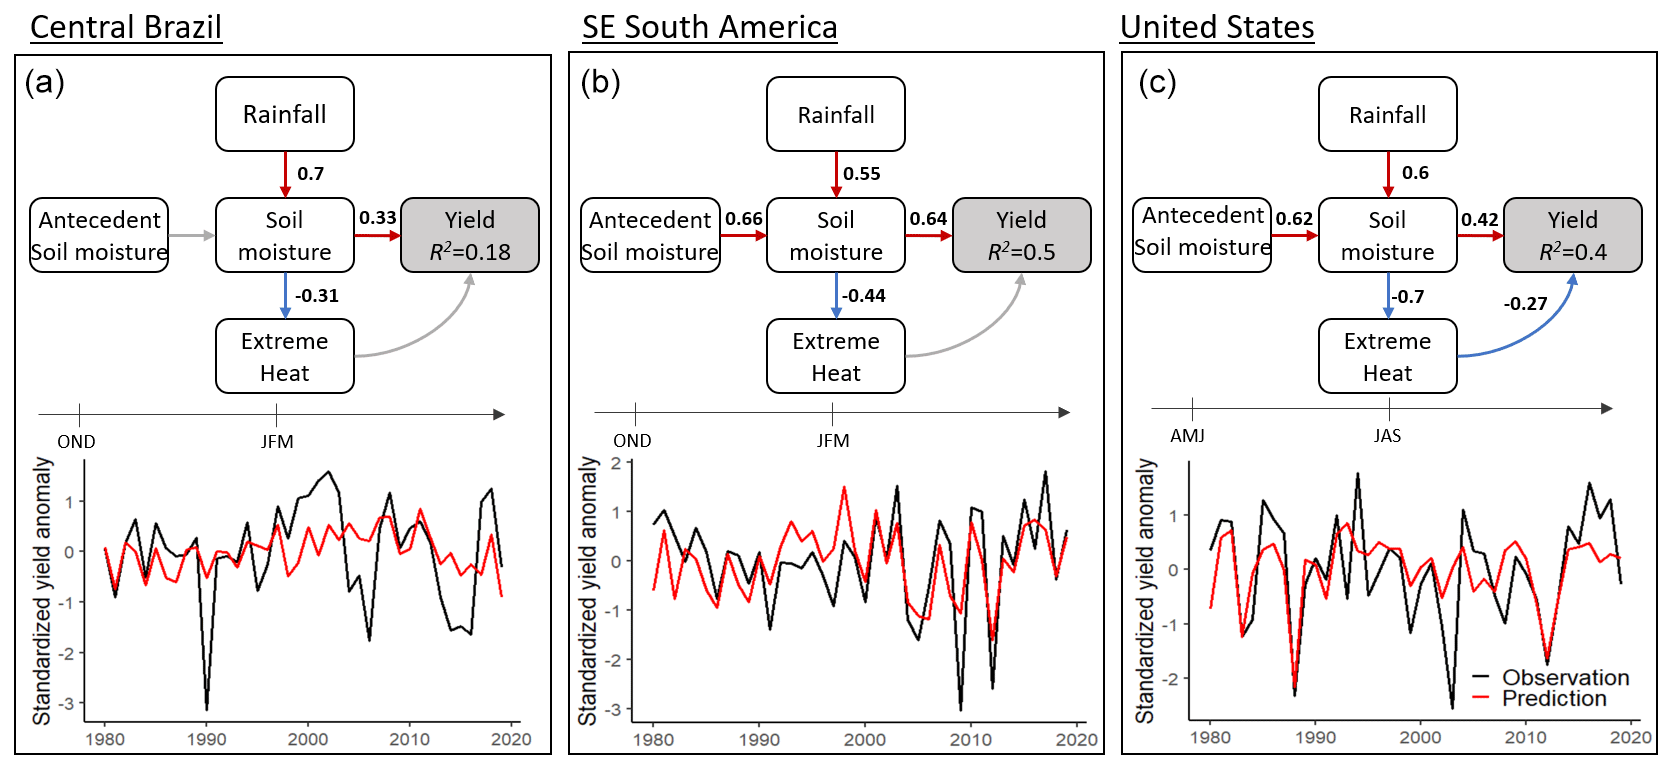
Figure 2Structural equation models quantifying the impacts of hot and dry conditions on crop yields in central Brazil (a), SE South America (b) and the United States (c). Red arrows show positive significant relationships and blue arrows show negative significant relationships (P<0.05) between variables. Gray arrows show statistically insignificant relationships (P>0.05). Observed yield time series are displayed in black, and predicted yield time series are displayed in red.
Extreme heat and soil moisture during summer explain 18 %, 50 % and 40 % of soybean yield interannual variability in the CB, SESA and US regions, respectively. Summer soil moisture is found to be the main driver of yield variability in all three regions (path coefficients of 0.33, 0.64 and 0.42, all statistically significant (P<0.05), for the CB, SESA and US regions, respectively). Extreme heat has a considerably weaker effect (path coefficients of −0.18, −0.13 and −0.27 for the CB, SESA and US regions, respectively, with only the US link being statistically significant (P<0.05)). Extreme heat itself is strongly and significantly (P<0.05) driven by same-season soil moisture in all regions (path coefficients of −0.31, −0.44 and −0.7 for the CB, SESA and US regions, respectively). Spring soil moisture and summer precipitation equally influenced summer soil moisture in the US and SESA regions (path coefficients of 0.6 and 0.55, respectively; both are statistically significant P<0.05). In CB, spring soil moisture is not a significant driver of summer soil moisture, with only a significant contribution from summer precipitation to same-season soil moisture conditions (path coefficient of 0.7, P<0.05). Bootstrapped estimates for the aforementioned path coefficients are presented in Fig. A1a in the Appendix. Tested conditional independence claims implied by our causal diagram are presented in Table S1 in the Supplement.
3.2 Large-scale ocean and atmospheric drivers of hot and dry conditions in South America
We consider large-scale climate drivers of summer soil moisture, given its prominent role in affecting yield variability in all considered regions (Fig. 2). To identify relevant large-scale climate drivers, we calculate same-season and lagged correlation maps for both SST and Z500 anomalies with summer-period soil moisture (Figs. 3a–d, 4a–b). Significant correlations are found between SST areas and summer-period soil moisture for all considered regions. For Z500, significant correlations (PFDR<0.1) are only found for the SESA region (Fig. A2). Nevertheless, both SST and Z500 correlation maps show physically plausible and consistent patterns, and therefore, we interpret them jointly, using relevant teleconnection literature.
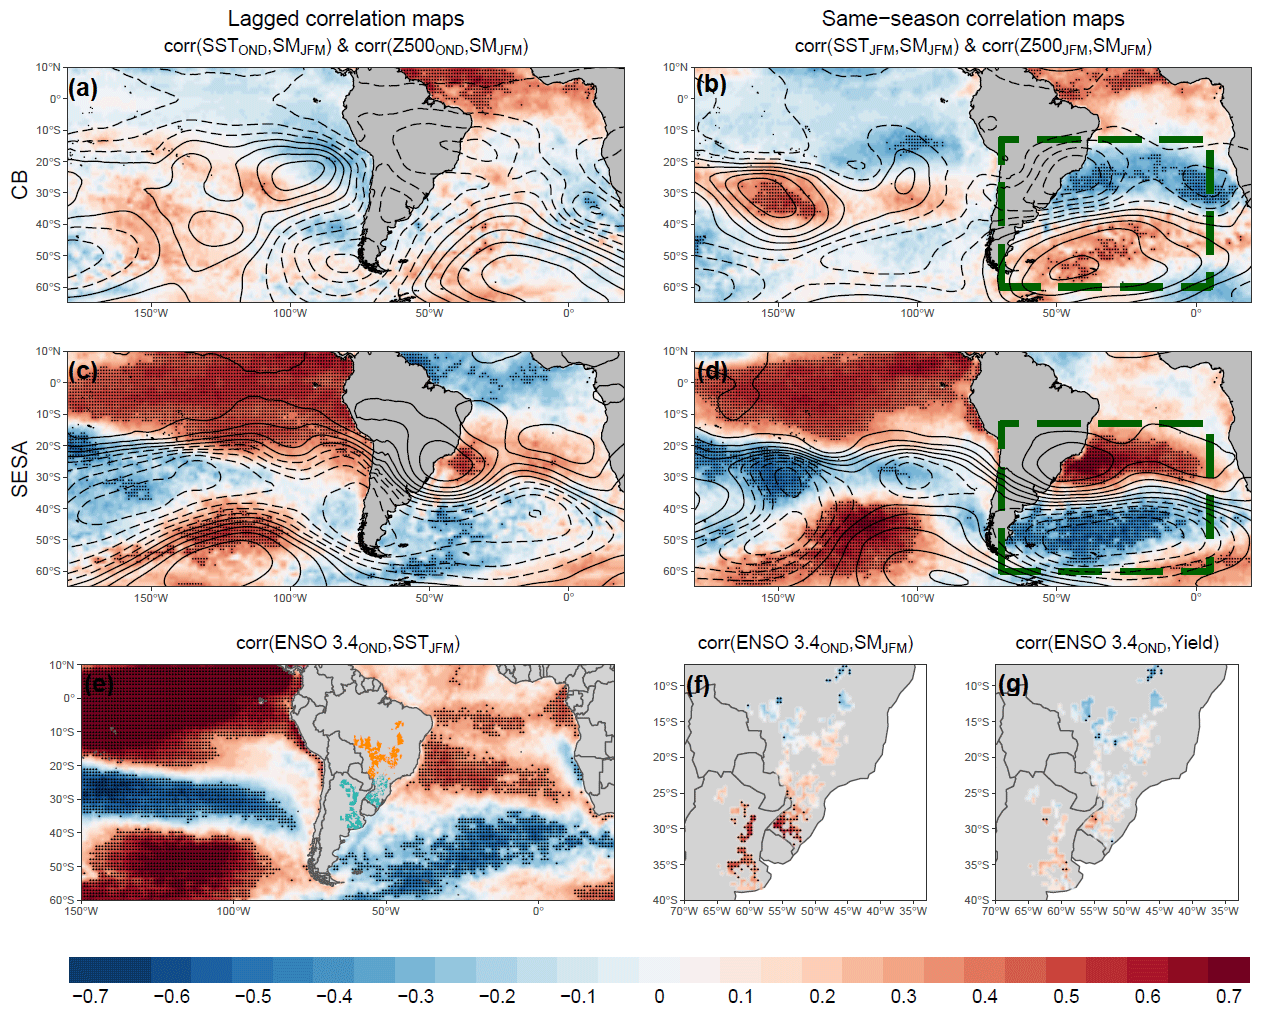
Figure 3(a–d) Correlation maps at both lagged and same-season time steps for Z500 (contours) and SST (colors) against austral summer (JFM) soil moisture. Contour lines represent Z500 correlations with 0.1 increment, whereas negative values are dashed. (e–g) Correlation maps for lagged OND ENSO 3.4 index against austral summer SST (JFM), soil moisture (JFM) and yield anomaly in CB and SESA. Stippling indicates statistical significance (PFDR<0.05) after having corrected for false-discovery rate using the Benjamini–Hochberg correction. The green rectangles in (b) and (d) indicate the SST areas used to calculate the spatial covariance time series.
The correlation maps for the SESA and CB regions show, to first order, opposite patterns for both SST and Z500 (Fig. 3), in particular for the same-season correlation maps (Fig. 3b–d). These opposite patterns between the two regions are in line with the well-documented South Atlantic convergence zone (SACZ) activity and characterize the dominant dipole pattern of summer moisture variability over subtropical South America (Boers et al., 2014; Gonzalez and Vera, 2014; Rodrigues et al., 2019). A suppressed SACZ event is associated with a high-pressure system over eastern South America, which induces low soil moisture levels over the CB region (Rodrigues et al., 2019). Concurrently, such a pattern reinforces the southward direction of the South American low-level jet (SALLJ), which is the main channel of moisture transport from the Amazon to the subtropics, leading to higher moisture levels in the SESA region. During an enhanced SACZ event, the opposite happens, with a low-pressure system over eastern South America channeling moisture from the Amazon eastward toward the CB region, in turn reducing moisture transport toward the SESA region (Boers et al., 2014; Gelbrecht et al., 2021; Gonzalez and Vera, 2014; Montini, 2019; Rodrigues et al., 2019). The southern and eastward directions of moisture transport from the Amazon into the subtropics characterize the two main SALLJ regimes (Boers et al., 2014).
The SACZ position and intensity are linked to the South Atlantic SST conditions, although some studies also highlight that SACZ variability can itself force South Atlantic SST conditions (De Almeida et al., 2007; Chaves and Nobre, 2004; Coelho et al., 2016; Doyle and Barros, 2002; Jorgetti et al., 2014; Seager et al., 2010; Zilli et al., 2019). Here, we find a summer dipole pattern of strong and significant SST correlations in the South Atlantic with opposite effects on SESA and CB soil moisture (Fig. 3b, d). This SST pattern shows high correspondence with the atmospheric circulation over the eastern part of South America, and both patterns are reminiscent of previously discussed SACZ activity. We find that a high (low)-pressure system over eastern South America coupled with adjacent warm (cold) South Atlantic SST conditions leads to high (low) soil moisture over SESA and low (high) soil moisture over the CB region (Fig. 3b–d). Hints of such a pattern can be detected in the lagged correlation maps (Fig. 3a–c), but the relationship is clearly stronger for same-season correlation maps, in line with the peak SACZ activity in austral summer (Jorgetti et al., 2014). We consider the austral summer SST correlation pattern within the green rectangles (Fig. 3b–d) as being representative of the SACZ activity and associated low-level jet regimes, incorporating both the SACZ atmospheric imprint on SST and the potential effects of South Atlantic SST on the SACZ. We summarize the South Atlantic SST pattern into a 1 d time series by calculating a spatial covariance time series for both SESA and CB regions separately. The 1 d summary time series for both regions are perfectly anti-correlated (Fig. S1 in the Supplement). This reinforces the adequacy of the highlighted South Atlantic SST dipole pattern, hereafter South Atlantic pattern (SA), to represent the dominant opposite signal in moisture variability over CB and SESA regions.
In addition to the SA pattern, we find contrasting correlations between CB and SESA in both the tropical Atlantic and tropical Pacific. Our results highlight that warmer SSTs in the tropical Atlantic, in particular during the austral spring period, are associated with increased moisture in the CB and decreased moisture in SESA (Fig. 3a–c). SST in the tropical Atlantic affects the position of the intertropical convergence zone (ITCZ) where cold (warm) SST strengthens (weakens) the southward shift of the ITCZ (Cai et al., 2020). A southward-located ITCZ is typically associated with a southward SALLJ flow toward the subtropics, leading to increased moisture in the SESA and decreased in CB (Gelbrecht et al., 2021). ENSO anomalies, on the other hand, trigger a pattern of stationary Rossby waves, referred to as the Pacific–South American (PSA) pattern that we also find in the Z500 correlation lines extending from the Pacific to the Atlantic Basin (Fig. 3a–d). These are most pronounced for the SESA region and seem to originate from the tropical Pacific in austral spring (Fig. 3c) compared to a more southern origin close to Indonesia in austral summer (Fig. 3d). These South Pacific wave trains in spring can impact the low-level jet SST conditions in the South Atlantic and the SACZ position, in turn playing a key role in modulating summer moisture variability in South America (Gelbrecht et al., 2018, 2021; Silva et al., 2009).
We explore the effects of ENSO on austral summer climate variability and crop yields in South America by calculating grid-based correlation maps of the ENSO3.4 index versus summer SSTs (Fig. 3e), summer soil moisture (Fig. 3f) and soybean yield (Fig. 3g). Two ENSO time series, averaged over OND and JFM, are considered to capture lagged and same-season ENSO effects on summer conditions. Both lagged (Fig. 3e) and same-season (Fig. S2) correlation maps show similar ENSO effects on all variables considered. The similarity between the correlation patterns of ENSO–SST (Fig. 3e) and soil moisture–SST (Fig. 3b, d) suggests that ENSO plays a significant role in influencing the austral summer SA pattern, which has direct effects on local summer soil moisture conditions. Lagged and same-season ENSO correlations with summer-period soil moisture (JFM) and yield anomaly report positive correlations between 40 and 25∘ S and negative correlations between 20 and 5∘ S (Fig. 3f, g). This is consistent with the initial consideration of two distinct production regions in South America, in addition to the opposite effects of the SA pattern on CB and SESA regions highlighted above.
ENSO time series for both seasons show a stronger relationship with soil moisture compared to yield anomaly. Assuming that summer soil moisture is the direct causal driver of local yield anomalies, weaker ENSO correlations against yield anomaly can be understood as loss of predictive signal along the causal chain. To further explore this, we calculate grid-based correlation maps for crop yields, the SA pattern and antecedent (spring) soil moisture against summer-period soil moisture (Fig. A3). As expected, we find that summer soil moisture is the strongest predictor of soybean yields at grid cell level. Furthermore, we find that the SA pattern is a stronger predictor of summer-period SM compared to the ENSO index. We interpret the stronger correlations between pairs of variables (summer SM–crop yields and SA pattern–summer SM) as preliminary evidence for the, primarily, indirect effect between ENSO and summer SM. This suggests that ENSO effects on soybean yields are, to a large extent, mediated by the relationships between the ENSO–SA pattern and ENSO–antecedent SM.
3.3 Large-scale ocean and atmospheric drivers of hot and dry conditions in the US
SST and Z500 correlation maps for summer-period soil moisture in the US show a similar resembling pattern at lagged and same season time steps (Fig. 4a–b).
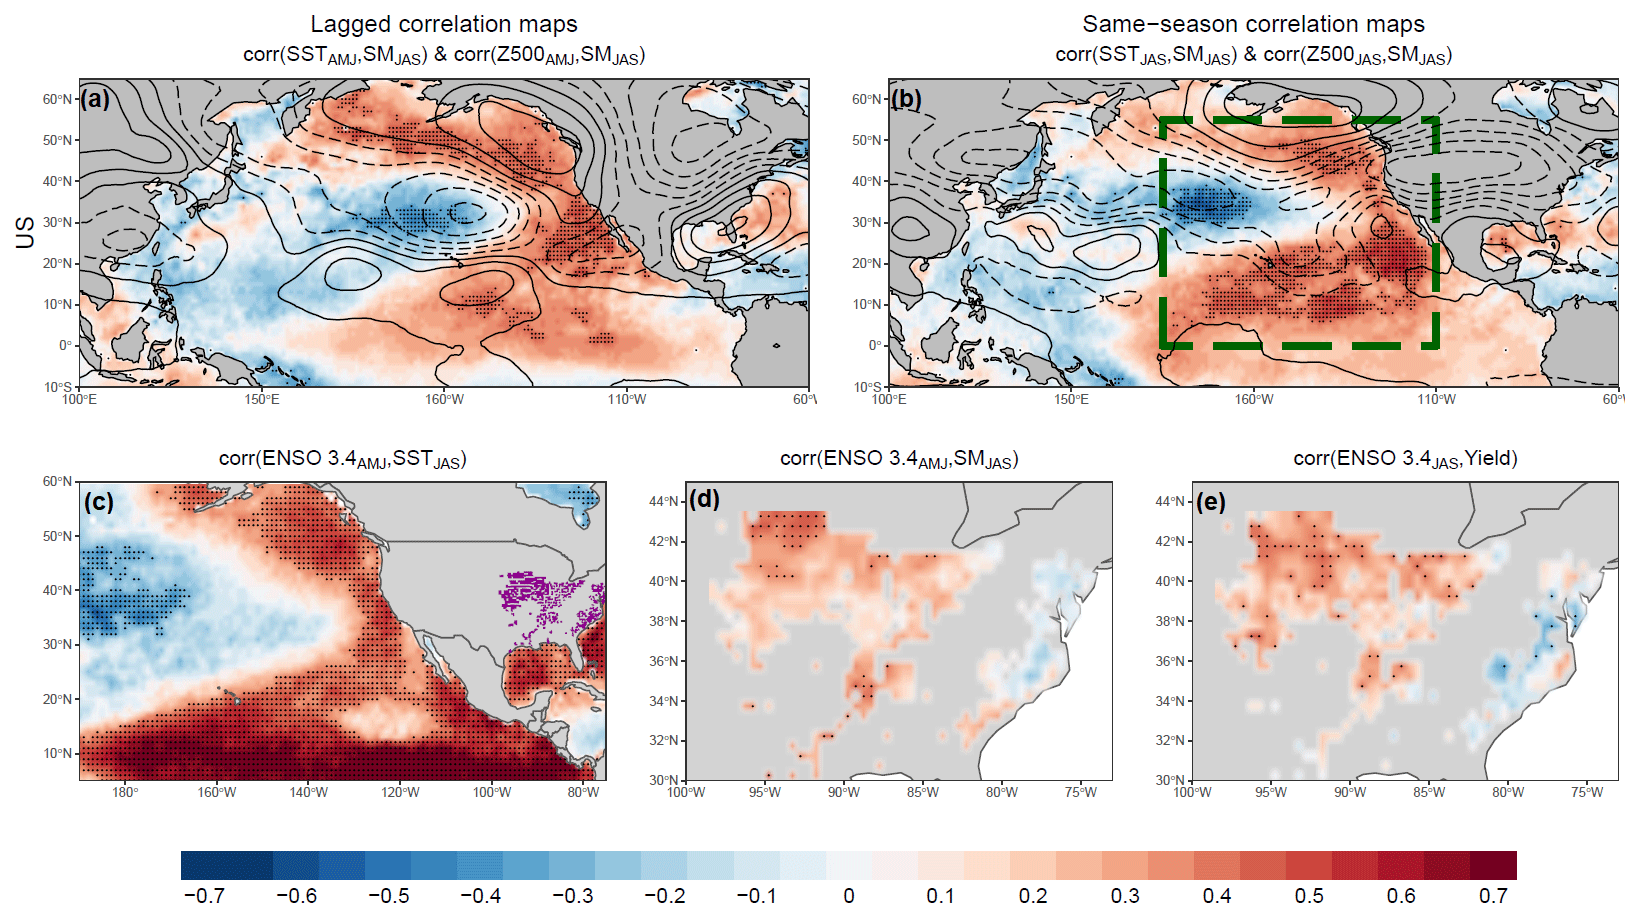
Figure 4(a, b) Correlation maps at both lagged and same-season time steps for Z500 (contours) and SST (colors) against boreal summer (JAS) soil moisture. Contour lines represent Z500 correlations with 0.1 increment, whereas negative values are dashed. (c–e) Correlation maps for lagged AMJ ENSO 3.4 index against boreal summer SST (JAS), soil moisture (JAS) and yield anomaly in the US. Stippling indicates statistical significance (PFDR<0.05) after having corrected for false-discovery rate using the Benjamini–Hochberg correction. The green rectangle in (b) indicates the SST area used to calculate the spatial covariance time series.
We find a significant SST dipole pattern in the North Pacific which is similar to the Pacific decadal oscillation (PDO) pattern. In particular, our results show that low soil moisture in the US region is associated with a PDO-like negative state that persists throughout the growing season (Fig. 4a–b). The Z500 contour lines show an arching Rossby wave structure that originates from the Pacific toward the North American continent in both boreal spring and summer (Fig. 4a–b). The boreal spring arching wave has a center of origin close to the tropical Pacific region and shows strong resemblance to the typical ENSO-forced teleconnection. The summer Rossby wave has a more zonal structure and does not seem to be connected to tropical regions. Previous research showed that ENSO forces an extratropical PDO-like SST pattern in winter and spring, which in turn drives Rossby waves in summer and carries significant predictive skill for summer hot and dry conditions in the eastern US (McKinnon et al., 2016; Vijverberg et al., 2020; Vijverberg and Coumou, 2022).
We summarize the North Pacific SST dipole pattern into a 1 d time series, hereafter the North Pacific pattern (NP), by calculating a weighted spatial covariance time series based on the highlighted SST area in green (Fig. 4b). The 1 d time series correlates highly with the PDO index (correlation of 0.73; Fig. S3), confirming the visual resemblance to the PDO pattern. Additionally, the SST correlation maps highlight that cold SST conditions in the tropical Pacific lead to low summer soil moisture in the US. This is particularly the case in spring where significant correlations are present in the tropical Pacific (Fig. 4a). The relevance of the tropical SST conditions in spring along the ENSO-like teleconnection highlighted in the Z500 correlation map suggests a significant ENSO role in affecting summer soil moisture in the US.
In a parallel assessment to the South American regions, we calculate grid-based correlations for summer SST (JAS), summer soil moisture (JAS) and soybean yield against the ENSO 3.4 index in AMJ (Fig. 4c–e). Correlation maps based on the ENSO 3.4 index in JAS give largely similar effects (Fig. S4). ENSO time series in both AMJ and JAS are significantly correlated to a summer SST pattern in the North Pacific that is very similar to the NP pattern (Fig. 4b–c). Over most regions, the ENSO index is positively correlated with summer soil moisture and yield anomalies. Only in the most eastern part is summer soil moisture negatively correlated with spring ENSO (AMJ) (Fig. 4d–e). This is in agreement with the spatial pattern of the Z500 AMJ correlation lines against summer-period soil moisture, which shows opposite pressure systems following a wave train pattern (Fig. 4a).
ENSO can predict equally well summer soil moisture (Fig. 4d) and yield anomaly in the US (Fig. 4e). The relatively high correlation between ENSO–crop yield compared to the correlation between ENSO–summer SM can be related to the unaccounted causal chain linking ENSO to extreme temperatures and, finally, yield anomalies. Extreme temperatures have a significant impact on crop yields in the US region but not in the CB and SESA regions (Fig. 2). Moreover, we calculate grid-based correlation maps for crop yields, the NP pattern and antecedent (spring) soil moisture against summer soil moisture (Fig. A4). Similarly to the South American analyses, we find that summer soil moisture is the main driver of soybean yields at the grid cell level and that the NP pattern is a stronger predictor of summer soil moisture than the ENSO index. In line with previous work (Vijverberg and Coumou, 2022), we hypothesize that ENSO indirectly affects summer soil moisture by modulating the NP pattern from winter to summer. In the next section, we explicitly test for direct and indirect ENSO influence on summer soil moisture in all considered regions.
3.4 Causal model linking ENSO to yield via extratropical SST and soil moisture
The analyses above show that ENSO has a central role in modulating soil moisture conditions and thereby yields in the three soybean regions. Our preferred physical interpretation is that ENSO impacts spring soil moisture directly and summer soil moisture conditions only indirectly via extratropical SSTs. We now apply SEM to test whether the data can confirm this physical hypothesis (Fig. 5).

Figure 5Structural equation models showing assumed hypothesis linking ENSO variability in OND, JFM, AMJ and JAS to yield anomaly in CB, SESA and US regions. Red arrows show positive significant relationships while blue arrows show negative significant relationships (P<0.05) between variables. Gray arrows show insignificant relationships (P>0.05). SM stands for soil moisture, SA stands for South Atlantic pattern, and NP stands for North Pacific pattern.
Causal assumptions implied by the network are consistent with the data in all regions (P value for χ2 test = 0.07, 0.37, 0.18 for CB, SESA and the US, respectively). To first order approximation, this implies that the effects of large-scale SST drivers and antecedent soil moisture conditions on local crop yields are mediated by summer soil moisture. With respect to ENSO, we find that the effects of austral and boreal spring ENSO on summer soil moisture are fully mediated by antecedent soil moisture and the extratropical SST pattern. Furthermore, we do not find a statistically significant link between austral and boreal summer ENSO and summer soil moisture. Thus, we do not find evidence for a direct link from ENSO to summer soil moisture. ENSO during austral and boreal summer also does not significantly affect same-season extratropical SA or NP patterns, which suggests that summer extratropical SSTs are primarily driven by spring ENSO conditions. We find that austral and boreal spring ENSO has a significant positive effect on same-season spring soil moisture conditions for the SESA (path coefficient of 0.42) and US (path coefficient of 0.42) regions but not for the CB region. Additionally, we find that austral spring ENSO (OND) is a strong predictor of the SA pattern in JFM (path coefficient of 0.5). Likewise, boreal spring ENSO (AMJ) is a strong predictor of the NP pattern in JAS (path coefficient of 0.57). The SA pattern predicts an opposite signal of soil moisture over CB and SESA, with path coefficients of −0.49 and 0.47, whereas the NP pattern is a strong predictor of US summer soil moisture (path coefficient 0.55). Bootstrapped estimates for the aforementioned path coefficients are presented in Fig. A1b in the Appendix. Tested conditional independence claims implied by our causal diagram are presented in Table S2.
We find that ENSO plays a significant role for SESA and the US. It does so via affecting spring soil moisture conditions and regional extratropical SST patterns (the SA and NP patterns) in summer, which subsequently affect summer soil moisture and, therefore, yield. From these results, it follows that persistent La Niña states (i.e., La Niña events in OND that persist into AMJ) enhance the risk of spatially compounded soy yield failures in SESA and the US. Using our causal graphs, we estimate that a persistent ENSO index of −1.5 SD in austral and boreal spring (of the year after) leads to a −0.4 SD change in soybean yields in both regions, and the positive effect on yields in CB during such persistent La Nina evolution is only small (+0.1 SD). The estimated impacts on soy yields are larger for a −1.5 SD change in both antecedent soil moisture and extratropical SST patterns, with a −0.9 SD change predicted for soybean yield in SESA and the US and a +0.3 SD change predicted in CB. These larger predicted yield deviations based on antecedent soil moisture and the extratropical SST precursor are expected given the direction of information flow in our proposed causal diagram. Still, different ENSO evolutions can have distinct impacts on the co-occurrence of soy failures in North and South America. Typically, ENSO develops in boreal summer, peaks in boreal winter and decays in the following boreal spring. Developing La Niña years since 1950 have all been preceded by boreal winter El Niño conditions (Jong et al., 2020); i.e., they are not from ENSO neutral. Such conditions can lead to contrasting summer soil moisture and soy yield production conditions in SESA and the US. To illustrate this conditional co-variability among regions, we examine composites of summer soil moisture, extreme heat and soy yields across the Americas for different ENSO evolutions. Persistent La Niña years are characterized by hot and dry summers and low yields in the US and SESA (Fig. A5). These anomalies are even more pronounced for years with negative SA and NP patterns, consistent with the analysis above (Fig. A6). Nevertheless, developing La Niña years show an opposite signal, with wet and cool summers in SESA and hot and dry summers in the US favoring a compensating effect between the two regions (Fig. A7).
We use structural equation modeling to quantify the relationship between soybean yields and extreme heat, rainfall and soil moisture in the US, SESA and CB regions. We take a physics-guided approach to construct a causal diagram that visualizes and quantifies the hypothesized causal structure in the data. We assume summer extreme heat and soil moisture to be the direct drivers of soybean yields in the three regions. Furthermore, we assume that summer soil moisture is directly influenced by antecedent (spring) soil moisture and same-season rainfall. Finally, we assume that extreme heat in summer is effected by same-season soil moisture conditions via land–atmosphere feedbacks. Model goodness of fit tested via the chi-square statistic suggests the plausibility of the hypothesized causal structure. We note that previous works have shown that soybean yields can also be impacted by excessive rainfall and soil moisture (Li et al., 2019). Future studies can explore the direct negative effects of high rainfall on crop yields in conjugation with the indirect positive effects via replenishment of soil moisture.
We find that summer soil moisture captures most of the hot and dry climate signal in soybean yield variability for all regions. This does not mean that extreme heat on its own is not an important crop stressor. In fact, leaf-scale experiments show that drought and heat limit crop growth via distinct physical pathways (Rizhsky et al., 2002, 2004; Suzuki et al., 2014). Nevertheless, here we show that extreme heat itself is strongly driven by moisture deficits in summer. Moisture and temperature variables are linked by atmospheric circulation and land–atmosphere feedbacks in the climate system, where both can co-occur and induce reinforcing physical feedbacks (Lesk et al., 2021; Seneviratne et al., 2010). The strong atmospheric coupling is typically characterized by a persistent high-pressure system creating clear skies that result in high temperatures and dry conditions and in turn lead to fast depletion of soil moisture (Basara et al., 2019). Land–atmosphere feedbacks can drive temperatures up due to a lack of cooling by evapotranspiration when soils are dry, which can further exacerbate hot and dry conditions (Lesk et al., 2021; Seneviratne et al., 2010; Sippel et al., 2016, 2018).
Here, we interpret the summer-period soil moisture variable as being indicative of such compound hot and dry conditions, with both land–atmosphere feedbacks and atmospheric circulation mechanisms potentially at play. We find that summer soil moisture is strongly preconditioned by antecedent soil moisture in the SESA and US regions. Soil moisture memory can persist over several months, which implies that spring anomalies can influence summer soil moisture conditions and in turn intensify summer land–atmosphere feedbacks (Anderson et al., 2017a; Hamed et al., 2021; Sippel et al., 2018; Sippela et al., 2016). The lack of a significant relationship between antecedent (spring) and summer soil moisture in the CB region could be related to local land–atmosphere feedbacks, which can force an inverse relationship between austral spring and summer moisture conditions, particularly during ENSO events (Grimm et al., 2007). Low moisture and high temperature conditions during spring over central east Brazil can increase moisture flux from the Amazon into the CB region, leading to higher moisture conditions in summer (Cai et al., 2020). We note that the soybean yield model for the CB region has significantly less predictability compared to the other two regions, which highlights that further investigation is needed in this region for more robust results. For example, here we assume a static crop calendar and harvesting area map, which can be suboptimal due to recent changes in the timing and duration of the dominant growing season in the region (Anderson et al., 2017a).
We show that a dipole pattern in the South Atlantic drives an opposite signal in austral summer soil moisture (JFM) in the CB and SESA regions. This pattern is closely related to the SACZ position and intensity in addition to the SALLJ regime, both of which are key mechanisms that explain the opposite moisture anomalies in the CB and the SESA regions during austral summer (Boers et al., 2014; Gelbrecht et al., 2021). This dipole pattern has been shown to be caused by Southern Hemisphere Rossby waves, which are dominated by the Madden–Julian oscillation variability at an intraseasonal timescale and by ENSO variability at an interannual timescale (Barros et al., 2008; Cai et al., 2020; Cunningham and Cavalcanti, 2006; Drumond and Ambrizzi, 2006; Gelbrecht et al., 2021; Rodrigues et al., 2019). We show that a dipole pattern in the North Pacific drives boreal summer soil moisture variability (JAS) in the US. This is in line with previous research that showed that the North Pacific SST pattern causes a Rossby wave structure that forces a persistent high-pressure system over large parts of the US (McKinnon et al., 2016; Vijverberg and Coumou, 2022). The NP pattern can be detected already in boreal spring and arguably even earlier, as ENSO teleconnections in boreal winter and spring reinforce the NP pattern via the so-called atmospheric bridge (Alexander et al., 2002).
In line with previous research, we consider the ENSO phenomenon to be an overarching causal driver which influences soybean growing seasons in both North and South America (Anderson et al., 2017a, b, 2018). Here, we show that ENSO conditions are particularly impactful in spring in South and North America, acting directly on antecedent (spring) soil moisture and the SA and NP patterns. The value of considering ENSO effects on summer soil moisture and, in turn, crop yields via mediating variables such as the extratropical SST conditions and antecedent soil moisture allows for a more detailed description of conditions that can lead to spatially compounded crop failures in North and South America. As the extratropical SST conditions can vary independently of ENSO, accounting for them explicitly gives potentially higher predictability for associated simultaneous production failures. Similarly, it can explain why not all ENSO events translate into impacts over the respective soybean regions.
We find non-significant ENSO effects in austral and boreal summer over South and North America, respectively. Previous research shows that Southern Hemisphere ENSO teleconnections are very weak in summer due to the weak Equator-to-pole temperature gradient and the dominant role of the SACZ over the summer circulation in South America (Cai et al., 2020; Cazes-Boezio et al., 2003). Similarly, weak ENSO conditions during boreal summer in addition to the dominant influence of the North Pacific variability on summer moisture variability in the US can explain the weaker ENSO teleconnection in summer (Vijverberg and Coumou, 2022). Here, we consider El Niño and La Niña events to have symmetrical impacts, which emphasizes dynamics related to a typical ENSO event. Nevertheless, we note that diversity in the impacts between phases has been previously shown (Cai et al., 2020). Moreover, different ENSO flavors have been highlighted, such as the East Pacific or central Pacific regimes, which can lead to different global teleconnections (Strnad et al., 2022). Furthermore, other modes of summer moisture variability can modulate the impacts of ENSO on considered soybean-producing regions. For instance, the South Atlantic dipole mode, Indian Ocean variability and the south annular mode can all affect climate variability in South America during the soybean-growing season (Cai et al., 2020). Nevertheless, here we focus on ENSO given its global impacts on both the Northern and Southern Hemispheres in addition to its documented causal influence on the aforementioned modes of climate variability (Cai et al., 2020; Ham et al., 2021; Sun et al., 2017).
Finally, we show that persistent La Niña conditions cause significantly lower yields in the US and SESA regions. An opposite, although less pronounced, effect is shown for the CB region. Strong La Niña events such as those in 2010–2012 coincided with strong negative yield anomalies in the US and SESA regions, in addition to unprecedent increases in the global soybean price (van Garderen and Mindlin, 2022; Hoerling et al., 2014). Future change in the frequency of ENSO phases is highly uncertain, and recent work highlighted that current climate models may not be representing the associated physical processes well (Seager et al., 2019, 2022; Wills et al., 2022). This has important consequences on the projected future risk of spatially compounded soybean production failures. The storyline approach can be an alternative framework to explore the potential impacts of such a spatially compounded event in a warmer world (Goulart et al., 2022; Shepherd, 2019). This is particularly useful for future planning given the current large physical uncertainties in climate models with respect to ENSO-linked processes.
We presented a data-driven causal framework that links ENSO variability to extratropical SST patterns and local weather and soybean yield conditions in the US, Brazil and Argentina. We found that soybean yields are strongly linked to summer soil moisture in all three regions, with smaller effects in CB. Soil moisture during the summer is affected by antecedent soil moisture (spring) and extratropical SST patterns, both of which are influenced by ENSO. Using causal networks to model these teleconnections represents a relatively simple improvement to more typical regression analysis, enabling explicit hypothesis testing and thus a better understanding of cause–effect relationships. Our analyses indicate that persistent La Niñas cause significantly lower yields in the US and SESA regions and only give a minorly positive yield effect in the CB region. A persistent La Niña event of moderate magnitude (ENSO index of −1.5 SD) corresponds to a reduction of −0.4 SD in soybean yields in both the US and SESA, substantially constraining global soybean production.
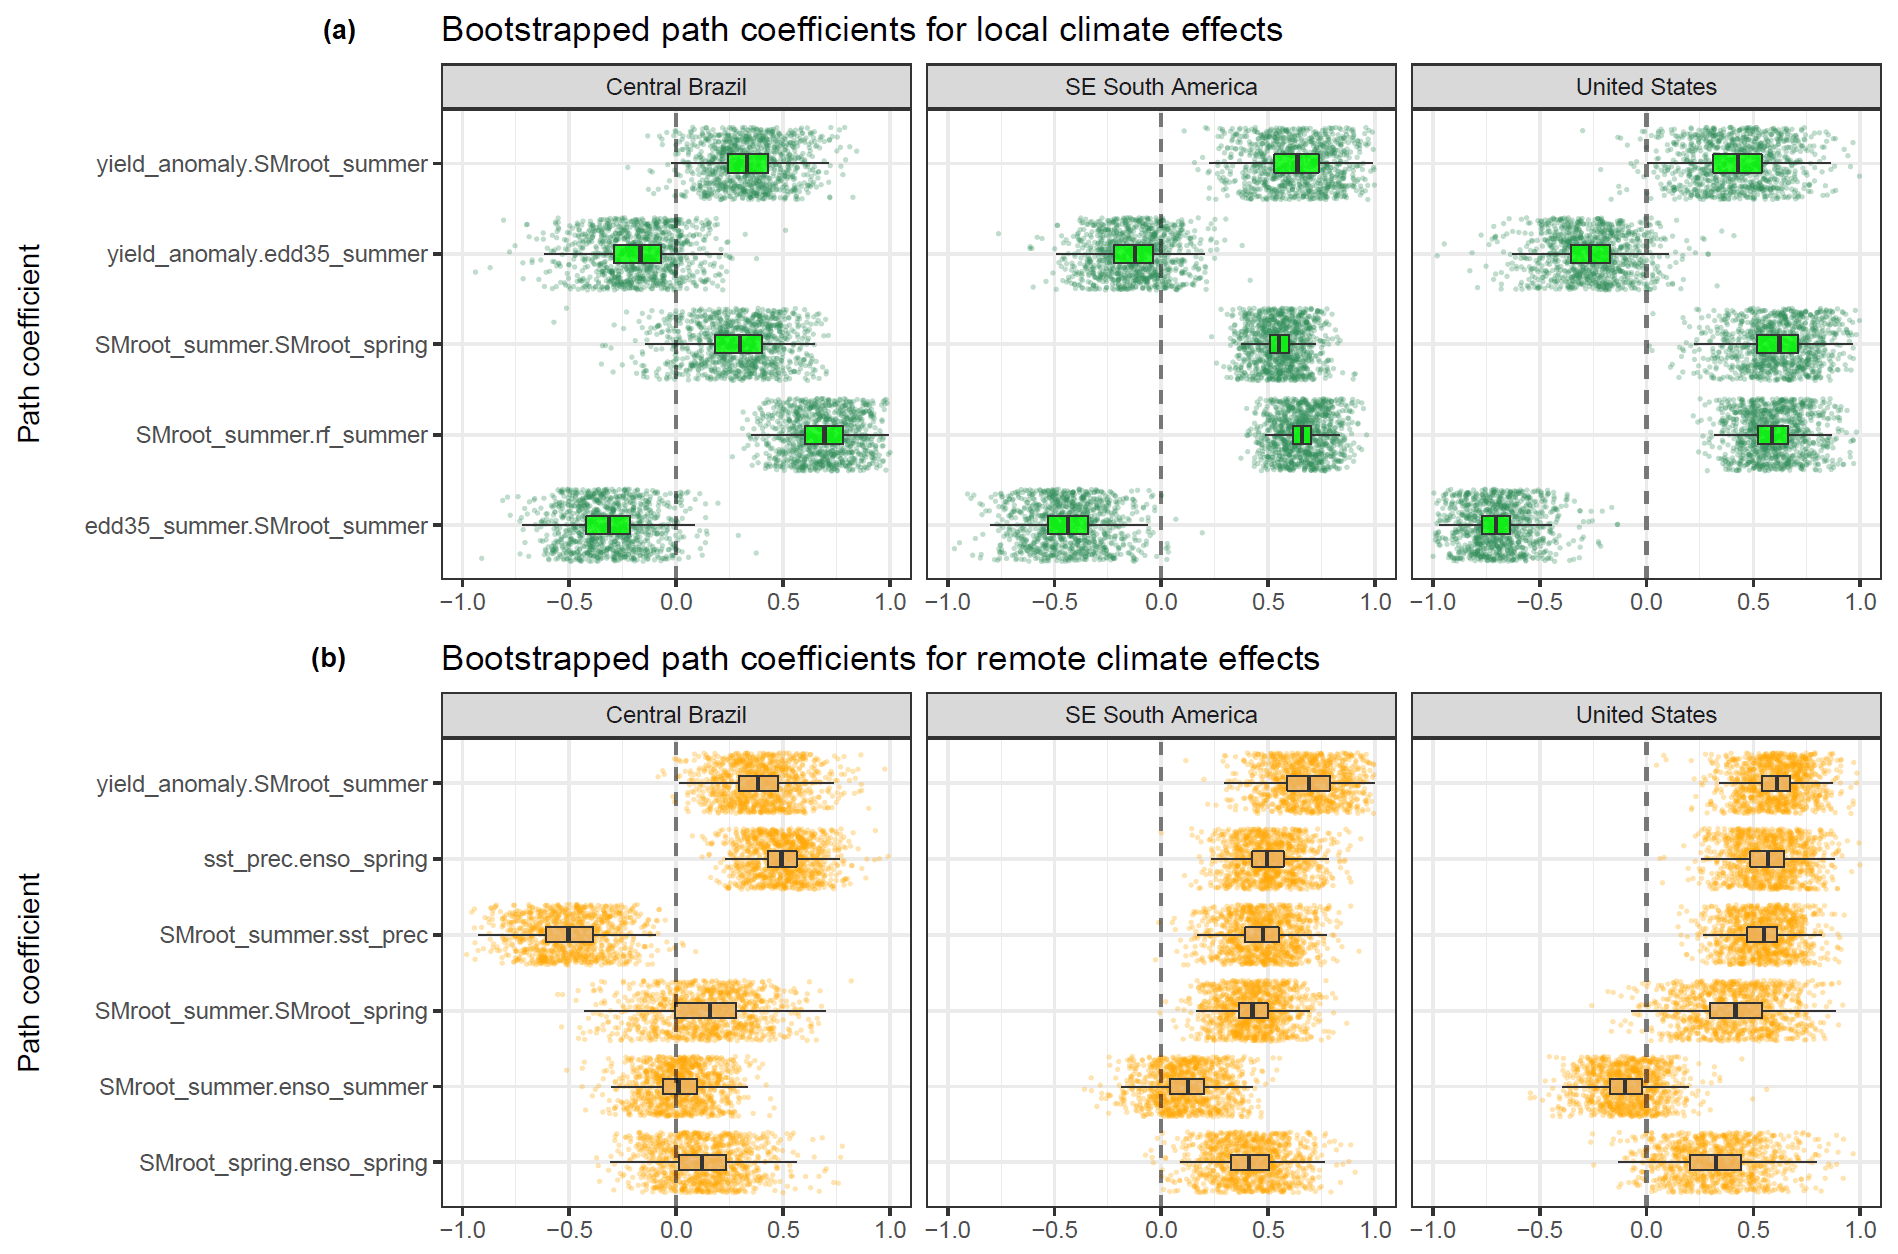
Figure A1(a) Bootstrapped path coefficient estimates based on 1000 draws for local climate effect models. (b) Bootstrapped path coefficient estimates based on 1000 draws for remote climate effect models. The path coefficient names are listed as X1.X2 and represent the direct effect of X2 on X1. “edd35” stands for extreme heat, “rf” stands for rainfall, “sst_prec” stands for the NP–SA pattern, and “SMroot” stands for for soil moisture.
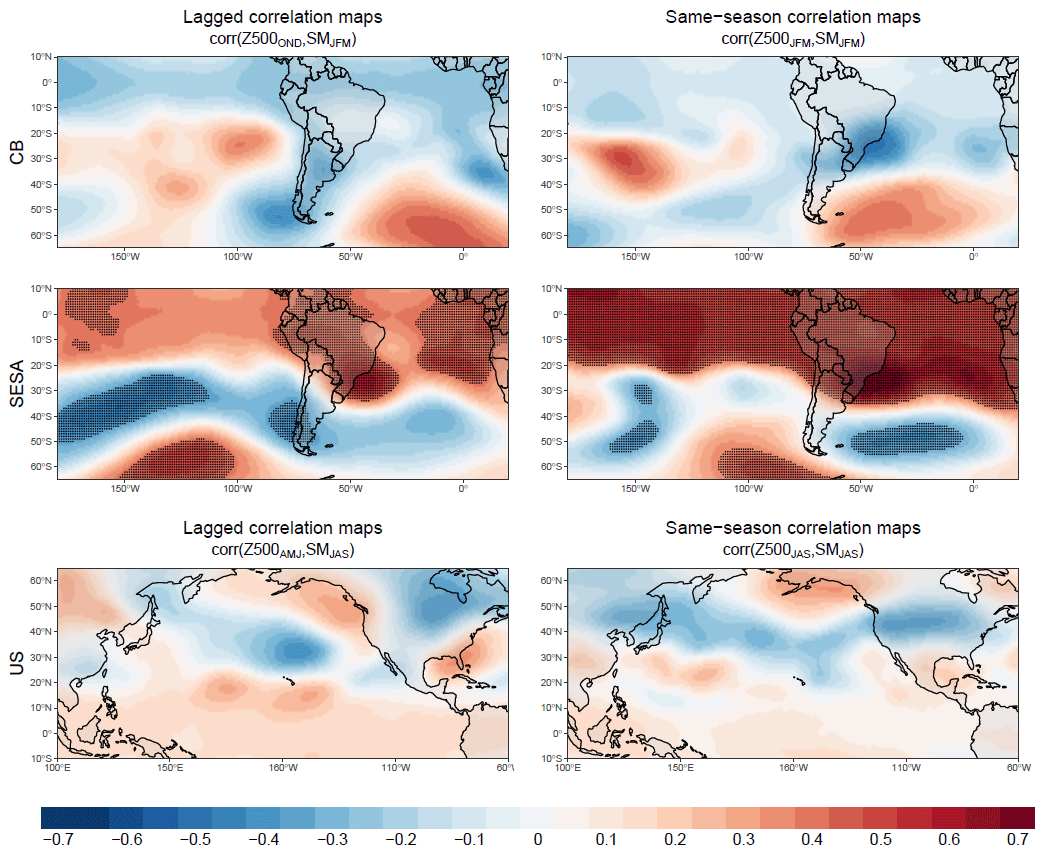
Figure A2Correlation maps at both lagged and same-season time steps for Z500 variable against summer soil moisture. Stippling indicates statistical significance (PFDR<0.1) after having corrected for false-discovery rate using the Benjamini–Hochberg correction.

Figure A3Grid-based correlation maps for crop yields, the SA pattern and antecedent (austral spring – OND) soil moisture against summer soil moisture (austral summer – JFM).
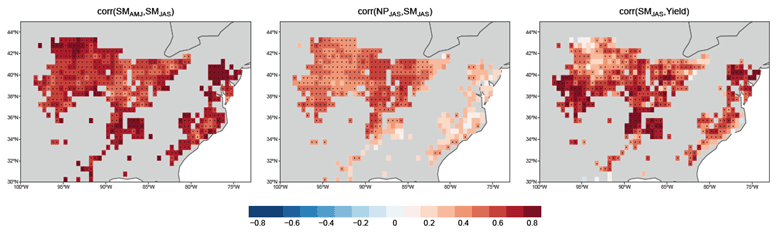
Figure A4Grid-based correlation maps for crop yields, the NP pattern and antecedent (boreal spring – AMJ) soil moisture against summer soil moisture (boreal summer – JAS).
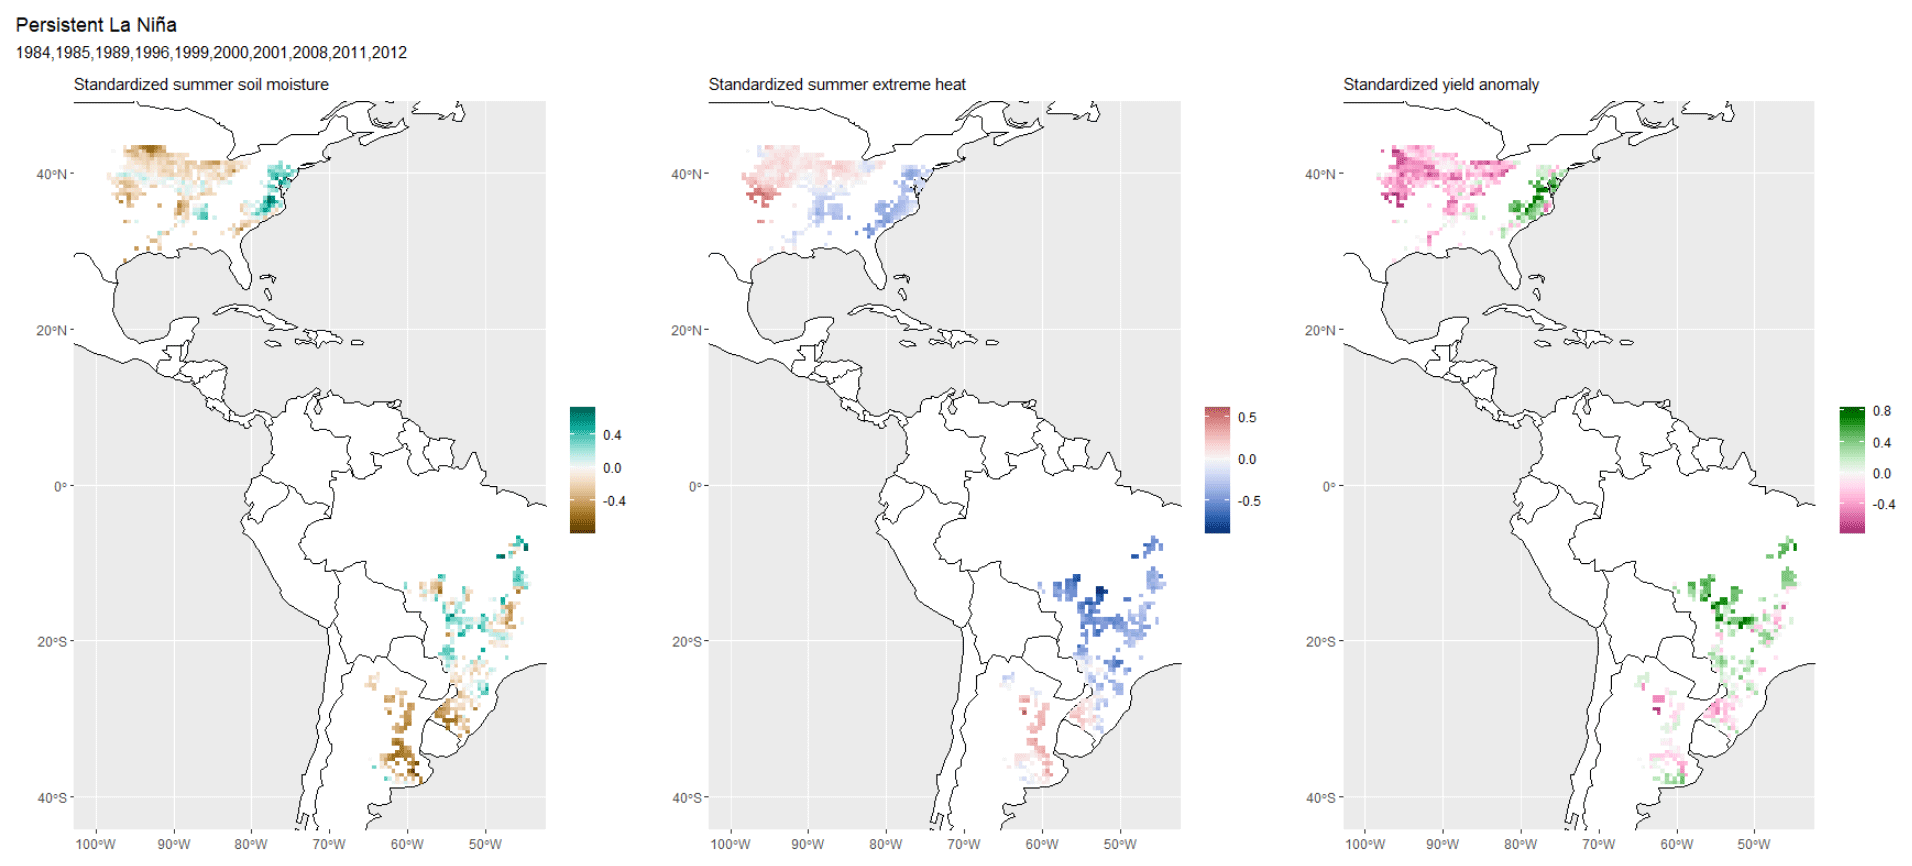
Figure A5Composites of summer soil moisture, summer extreme heat and soybean yield anomalies for persistent La Niña years (indicated in the subtitle). Summer periods are JFM in the Southern Hemisphere and JAS in the Northern Hemisphere. Persistent La Niña years are defined as events when both OND and AMJ ENSO indices are below −0.5.
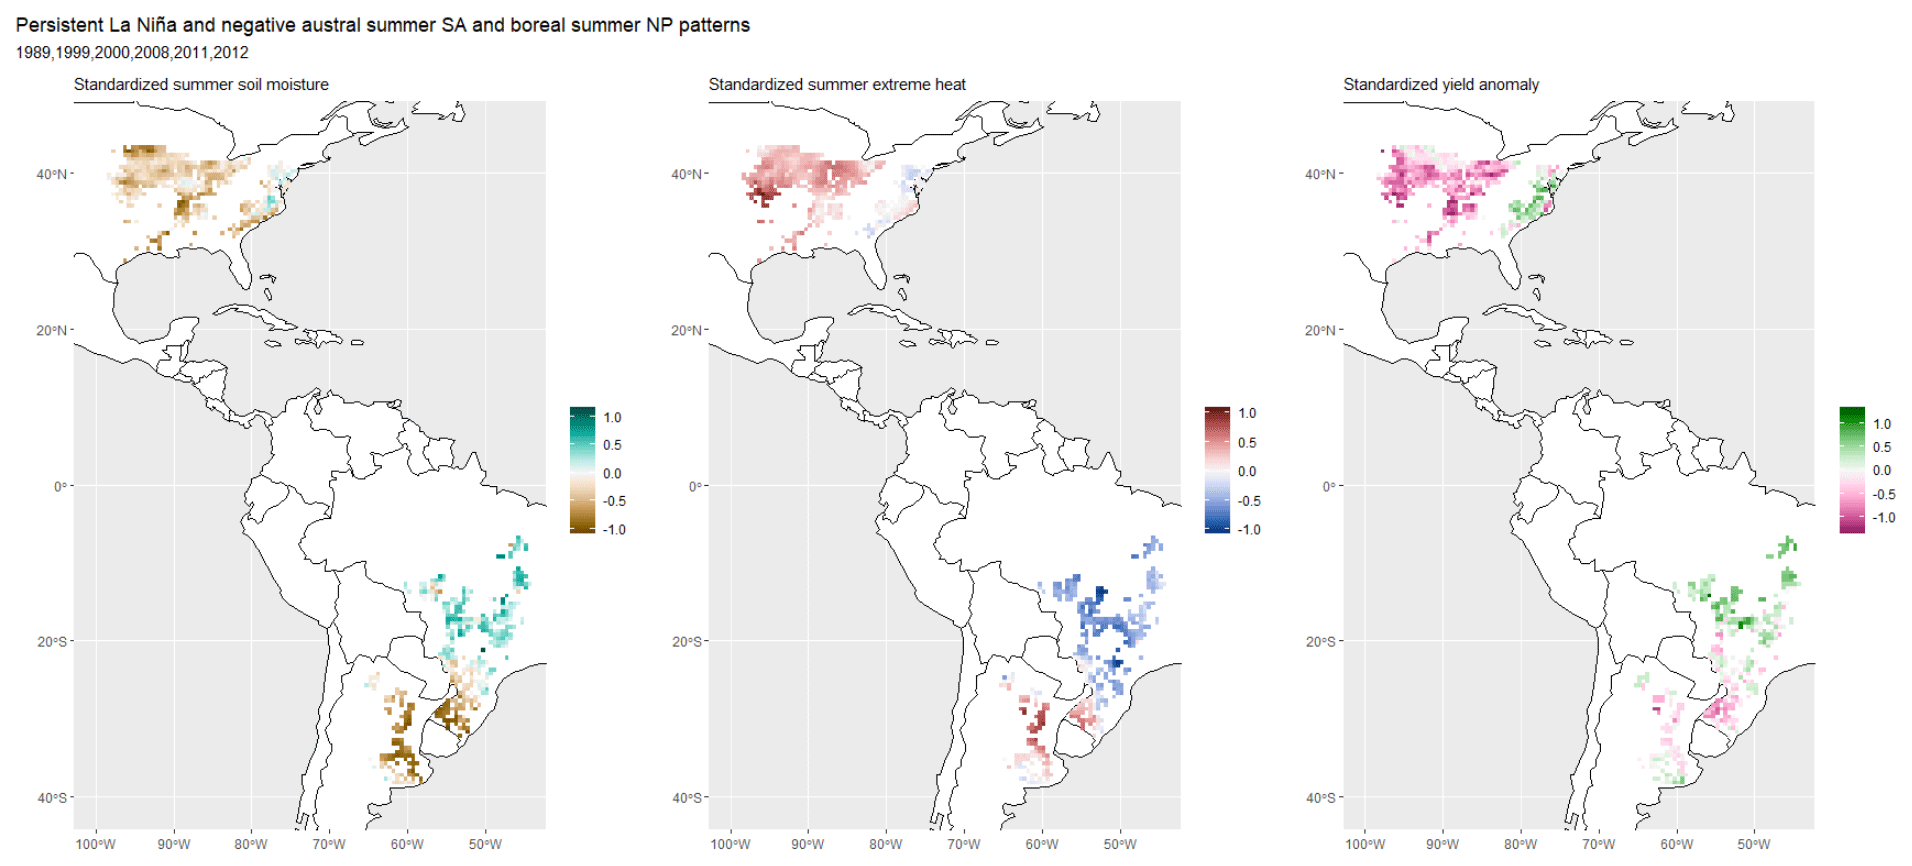
Figure A6Similar to Fig. A5, but the subset additionally filters for years when both the Southern Hemisphere summer SA pattern & Northern Hemisphere summer NP pattern are negative.

Figure A7Similar to Fig. A5 but considering developing La Niña years as per Jong et al. (2020).
The code is available from the corresponding author upon reasonable request.
Data used in this study are freely available in the cited literature.
The supplement related to this article is available online at: https://doi.org/10.5194/esd-14-255-2023-supplement.
RH, SV and DC designed the study. RH performed the analysis and wrote the initial draft of the paper. All authors contributed to the development of the analysis, the interpretation of the results and the writing of the paper.
The contact author has declared that none of the authors has any competing interests.
Publisher's note: Copernicus Publications remains neutral with regard to jurisdictional claims in published maps and institutional affiliations.
We are grateful to the two anonymous reviewers and the editor, whose comments helped improve an earlier version of this paper.
This research has been supported by the European Union's Horizon 2020 Research and Innovation programme (RECEIPT; grant no. 820712).
This paper was edited by Olivia Martius and reviewed by two anonymous referees.
Alexander, M. A., Bladé, I., Newman, M., Lanzante, J. R., Lau, N. C., and Scott, J. D.: The atmospheric bridge: The influence of ENSO teleconnections on air-sea interaction over the global oceans, J. Climate, 15, 2205–2231, https://doi.org/10.1175/1520-0442(2002)015<2205:TABTIO>2.0.CO;2, 2002.
Anderson, W. B.: Climate Variability Poses a Correlated Risk to Global Food Production, https://doi.org/10.7916/D8766Z04, 2018.
Anderson, W., Seager, R., Baethgen, W., and Cane, M.: Crop production variability in North and South America forced by life-cycles of the El Niño Southern Oscillation, Agr. Forest Meteorol., 239, 151–165, https://doi.org/10.1016/j.agrformet.2017.03.008, 2017a.
Anderson, W., Seager, R., Baethgen, W., and Cane, M.: Life cycles of agriculturally relevant ENSO teleconnections in North and South America, Int. J. Climatol., 37, 3297–3318, https://doi.org/10.1002/joc.4916, 2017b.
Anderson, W., Seager, R., Baethgen, W., and Cane, M.: Trans-Pacific ENSO teleconnections pose a correlated risk to agriculture, Agr. Forest Meteorol., 262, 298–309, https://doi.org/10.1016/j.agrformet.2018.07.023, 2018.
Anderson, W. B., Seager, R., Baethgen, W., Cane, M., and You, L.: Synchronous crop failures and climate-forced production variability, Sci. Adv., 5, 1–10, https://doi.org/10.1126/sciadv.aaw1976, 2019.
Barros, V. Y., Gonzalez, M., Liebmann, B., and Camilloni, I. Y.: Influence of the South Atlantic convergence zone and South Atlantic Sea surface temperature on interannual summer rainfall variability in Southeastern South America, Theor. Appl. Climatol., 133, 123–133, 2000.
Barros, V. R., Doyle, M. E., and Camilloni, I. A.: Precipitation trends in southeastern South America: Relationship with ENSO phases and with low-level circulation, Theor. Appl. Climatol., 93, 19–33, https://doi.org/10.1007/s00704-007-0329-x, 2008.
Basara, J. B., Christian, J. I.,Wakefield, R. A., Otkin, J. A., Hunt, E. H., and Brown, D. P.: The evolution, propagation, and spread of flash drought in the Central United States during 2012, Environ. Res. Lett., 14, 8, https://doi.org/10.1088/1748-9326/ab2cc0, 2019.
Beck, H. E., Zimmermann, N. E., McVicar, T. R., Vergopolan, N., Berg, A., and Wood, E. F.: Present and future köppen-geiger climate classification maps at 1-km resolution, Sci. Data, 5, 1–12, https://doi.org/10.1038/sdata.2018.214, 2018.
Benjamini, Y. and Hochberg, Y.: Controlling the False Discovery Rate: A Practical and Powerful Approach to Multiple Testing, J. R. Stat. Soc. Ser. B, 57, 289–300, https://doi.org/10.1111/j.2517-6161.1995.tb02031.x, 1995.
Boers, N., Rheinwalt, A., Bookhagen, B., and Barbosa, H. M. J.: The South American rainfall dipole: A complex network, 7397–7405, Geophys. Res. Lett., 41, 20, https://doi.org/10.1002/2014GL061829.1, 2014.
Braun, J.: The food crisis isn't over, Nature, 456, 701–701, 2008.
Bren D’Amour, C., Wenz, L., Kalkuhl, M., Christoph Steckel, J., and Creutzig, F.: Teleconnected food supply shocks, Environ. 75 Res. Lett., 11, 3, https://doi.org/10.1088/1748-9326/11/3/035007, 2016.
Cai, W., McPhaden, M. J., Grimm, A. M., Rodrigues, R. R., Taschetto, A. S., Garreaud, R. D., Dewitte, B., Poveda, G., Ham, Y. G., Santoso, A., Ng, B., Anderson, W., Wang, G., Geng, T., Jo, H. S., Marengo, J. A., Alves, L. M., Osman, M., Li, S., Wu, L., Karamperidou, C., Takahashi, K., and Vera, C.: Climate impacts of the El Niño–Southern Oscillation on South America, Nat. Rev. Earth Environ., 1, 215–231, https://doi.org/10.1038/s43017-020-0040-3, 2020.
Cassidy, E. S., West, P. C., Gerber, J. S., and Foley, J. A.: Redefining agricultural yields: From tonnes to people nourished per hectare, Environ. Res. Lett., 8, 3, https://doi.org/10.1088/1748-9326/8/3/034015, 2013.
Cazes-Boezio, G., Robertson, A. W., and Mechoso, C. R.: Seasonal dependence of ENSO teleconnections over South America and relationships with precipitation in Uruguay, J. Climate, 16, 1159–1176, https://doi.org/10.1175/1520-0442(2003)16<1159:SDOETO>2.0.CO;2, 2003.
Chaves, R. R. and Nobre, P.: Interactions between sea surface temperature over the South Atlantic Ocean and the South Atlantic Convergence Zone, Geophys. Res. Lett., 31, 1–4, https://doi.org/10.1029/2003GL018647, 2004.
Coelho, C. A. S., de Oliveira, C. P., Ambrizzi, T., Reboita, M. S., Carpenedo, C. B., Campos, J. L. P. S., Tomaziello, A. C. N., Pampuch, L. A., Custódio, M. de S., Dutra, L. M. M., Da Rocha, R. P., and Rehbein, A.: The 2014 southeast Brazil austral summer drought: regional scale mechanisms and teleconnections, Clim. Dynam., 46, 3737–3752, https://doi.org/10.1007/s00382-015-2800-1, 2016.
Cucchi, M., Weedon, G. P., Amici, A., Bellouin, N., Lange, S., Müller Schmied, H., Hersbach, H., and Buontempo, C.: WFDE5: bias-adjusted ERA5 reanalysis data for impact studies, Earth Syst. Sci. Data, 12, 2097–2120, https://doi.org/10.5194/essd-12-2097-2020, 2020.
Cunningham, C. A. C. and Cavalcanti, I. F. A.: Intraseasonal modes of variability affecting the South Atlantic Convergence Zone, Int. J. Climatol., 26, 1165–1180, https://doi.org/10.1002/joc.1309, 2006.
De Almeida, R. A. F., Nobre, P., Haarsma, R. J., and Campos, E. J. D.: Negative ocean-atmosphere feedback in the South Atlantic Convergence Zone, Geophys. Res. Lett., 34, 1–5, https://doi.org/10.1029/2007GL030401, 2007.
Doyle, M. E. and Barros, V. R.: Midsummer low-level circulation and precipitation in subtropical South America and related sea surface temperature anomalies in the South Atlantic, J. Climate, 15, 3394–3410, https://doi.org/10.1175/1520-0442(2002)015<3394:MLLCAP>2.0.CO;2, 2002.
Drumond, A. R. M. and Ambrizzi, T.: Inter ENSO variability and its influence over the South American monsoon system, Adv. Geosci., 6, 167–171, https://doi.org/10.5194/adgeo-6-167-2006, 2006.
Elliott, J., Glotter, M., Ruane, A. C., Boote, K. J., Hatfield, J. L., Jones, J. W., Rosenzweig, C., Smith, L. A., and Foster, I.: Characterizing agricultural impacts of recent large-scale US droughts and changing technology and management, Agr. Syst., 159, 275–281, https://doi.org/10.1016/j.agsy.2017.07.012, 2018.
Fan, Y., Chen, J., Shirkey, G., John, R., Wu, S. R., Park, H., and Shao, C.: Applications of structural equation modeling (SEM) in ecological studies: an updated review, Ecol. Process., 5, 1–12, https://doi.org/10.1186/s13717-016-0063-3, 2016.
Geirinhas, J. L., Russo, A., Libonati, R., Sousa, P. M., Miralles, D. G., and Trigo, R. M.: Recent increasing frequency of compound summer drought and heatwaves in Southeast Brazil, Environ. Res. Lett., 16, 3, https://doi.org/10.1088/1748-9326/abe0eb, 2021.
Gelbrecht, M., Boers, N., and Kurths, J.: Phase coherence between precipitation in South America and Rossby waves, Sci. Adv., 4, 1–10, https://doi.org/10.1126/sciadv.aau3191, 2018.
Gelbrecht, M., Boers, N., and Kurths, J.: Variability of the low-level circulation of the South American Monsoon analysed with complex networks, Eur. Phys. J. Spec. Top., 230, 3101–3120, https://doi.org/10.1140/epjs/s11734-021-00187-w, 2021.
Gilbert, C. L. and Morgan, C. W.: Food price volatility, Philos. T. Roy. Soc. B, 365, 3023–3034, https://doi.org/10.1098/rstb.2010.0139, 2010.
Gonzalez, P. L. M. and Vera, C. S.: Summer precipitation variability over South America on long and short intraseasonal timescales, Clim. Dynam., 43, 1993–2007, https://doi.org/10.1007/s00382-013-2023-2, 2014.
Goulart, H. M. D., van der Wiel, K., Folberth, C., Balkovic, J., and van den Hurk, B.: Storylines of weather-induced crop failure events under climate change, Earth Syst. Dynam., 12, 1503–1527, https://doi.org/10.5194/esd-12-1503-2021, 2021.
Goulart, H. M. D., Wiel, K. Van Der, Folberth, C., and Hurk, B. Van Den: Increase of simultaneous soybean failures due to climate change, Authorea Preprints, 1–20, 2022.
Grimm, A. M., Pal, J. S., and Giorgi, F.: Connection between spring conditions and peak summer monsoon rainfall in South America: Role of soil moisture, surface temperature, and topography in eastern Brazil, J. Climate, 20, 5929–5945, https://doi.org/10.1175/2007JCLI1684.1, 2007.
Ham, Y. G., Lee, H. J., Jo, H. S., Lee, S. G., Cai, W., and Rodrigues, R. R.: Inter-Basin Interaction Between Variability in the South Atlantic Ocean and the El Niño/Southern Oscillation, Geophys. Res. Lett., 48, 1–11, https://doi.org/10.1029/2021GL093338, 2021.
Hamed, R., Van Loon, A. F., Aerts, J., and Coumou, D.: Impacts of compound hot–dry extremes on US soybean yields, Earth Syst. Dynam., 12, 1371–1391, https://doi.org/10.5194/esd-12-1371-2021, 2021.
Heino, M., Puma, M. J., Ward, P. J., Gerten, D., Heck, V., Siebert, S., and Kummu, M.: Two-thirds of global cropland area impacted by climate oscillations, Nat. Commun., 9, 1–10, https://doi.org/10.1038/s41467-017-02071-5, 2018.
Hersbach, H.: News from C3S: ERA5, Using ECMWF's Forecast, 1–27, https://www.ecmwf.int/sites/default/files/elibrary/2017/17312-news-c3s-era5.pdf (last access: 1 February 2022), 2017.
Hoerling, M., Eischeid, J., Kumar, A., Leung, R., Mariotti, A., Mo, K., Schubert, S., and Seager, R.: Causes and predictability of the 2012 great plains drought, B. Am. Meteorol. Soc., 95, 269–282, https://doi.org/10.1175/BAMS-D-13-00055.1, 2014.
Iizumi, T. and Sakai, T.: The global dataset of historical yields for major crops 1981–2016, Sci. Data, 7, 1–7, https://doi.org/10.1038/s41597-020-0433-7, 2020.
Jong, B. T., Ting, M., Seager, R., and Anderson, W. B.: ENSO Teleconnections and Impacts on U.S. Summertime Temperature during a Multiyear la Niña Life Cycle, J. Climate, 33, 6009–6024, https://doi.org/10.1175/JCLI-D-19-0701.1, 2020.
Jorgetti, T., da Silva Dias, P. L., and de Freitas, E. D.: The relationship between South Atlantic SST and SACZ intensity and positioning, Clim. Dynam., 42, 3077–3086, https://doi.org/10.1007/s00382-013-1998-z, 2014.
Leister, A. M., Paarlberg, P. L., and Lee, J. G.: Dynamic effects of drought on U.S. crop and livestock sectors, J. Agric. Appl. Econ., 47, 261–284, https://doi.org/10.1017/aae.2015.8, 2015.
Lesk, C. and Anderson, W.: Decadal variability modulates trends in concurrent heat and drought over global croplands, Environ. Res. 105 Lett., 16, 5, https://doi.org/10.1088/1748-9326/abeb35, 2021.
Lesk, C., Coffel, E., Winter, J., Ray, D., Zscheischler, J., Seneviratne, S. I., and Horton, R.: Stronger temperature–moisture couplings exacerbate the impact of climate warming on global crop yields, Nat. Food, 2, 683–691, https://doi.org/10.1038/s43016-021-00341-6, 2021.
Li, Y., Guan, K., Schnitkey, G. D., DeLucia, E., and Peng, B.: Excessive rainfall leads to maize yield loss of a comparable magnitude to extreme drought in the United States, Glob. Chang. Biol., 25, 2325–2337, https://doi.org/10.1111/gcb.14628, 2019.
Lobell, D. B. and Field, C. B.: Global scale climate-crop yield relationships and the impacts of recent warming, Environ. Res. Lett., 2, 1, https://doi.org/10.1088/1748-9326/2/1/014002, 2007
Lobell, D. B., Schlenker, W., and Costa-Roberts, J.: Climate trends and global crop production since 1980, Science, 333, 616–620, https://doi.org/10.1126/science.1204531, 2011.
Silva, G. A. M., Ambrizzi, T., and Marengo, J. A.: Observational evidences on the modulation of the South American Low Level Jet east of the Andes according the ENSO variability, Ann. Geophys., 27, 645–657, https://doi.org/10.5194/angeo-27-645-2009, 2009.
MacLeod, D., Graham, R., O'Reilly, C., Otieno, G., and Todd, M.: Causal pathways linking different flavours of ENSO with the Greater Horn of Africa short rains, Atmos. Sci. Lett., 22, 1–11, https://doi.org/10.1002/asl.1015, 2021.
Martens, B., Miralles, D. G., Lievens, H., van der Schalie, R., de Jeu, R. A. M., Fernández-Prieto, D., Beck, H. E., Dorigo, W. A., and Verhoest, N. E. C.: GLEAM v3: satellite-based land evaporation and root-zone soil moisture, Geosci. Model Dev., 10, 1903–1925, https://doi.org/10.5194/gmd-10-1903-2017, 2017.
McKinnon, K. A., Rhines, A., Tingley, M. P., and Huybers, P.: Long-lead predictions of eastern United States hot days from Pacific sea surface temperatures, Nat. Geosci., 9, 389–394, https://doi.org/10.1038/ngeo2687, 2016.
Miralles, D. G., Gentine, P., Seneviratne, S. I., and Teuling, A. J.: Land–atmospheric feedbacks during droughts and heatwaves: state of the science and current challenges, Ann. N. Y. Acad. Sci., 1436, 19–35, https://doi.org/10.1111/nyas.13912, 2019.
Montini, T. L.: The South American Low – Level Jets: A New Climatology , Variability, and Changes, J. Geophys. Res.-Atmos., 2003, 1200–1218, https://doi.org/10.1029/2018JD029634, 2019.
Ortiz-Bobea, A., Wang, H., Carrillo, C. M., and Ault, T. R.: Un30 packing the climatic drivers of US agricultural yields, Environ. Res. Lett., 14, 6, https://doi.org/10.1088/1748-9326/ab1e75, 2019.
Portmann, F. T., Siebert, S., and Döll, P.: MIRCA2000-Global monthly irrigated and rainfed crop areas around the year 2000: A new high-resolution data set for agricultural and hydrological modeling, Global Biogeochem. Cy., 24, https://doi.org/10.1029/2008gb003435, 2010.
Puma, M. J.: Resilience of the global food system, Nat. Sustain., 2, 260–261, https://doi.org/10.1038/s41893-019-0274-6, 2019.
Puma, M. J., Bose, S., Chon, S. Y., and Cook, B. I.: Assessing the evolving fragility of the global food system, Environ. Res. Lett., 10, 2, https://doi.org/10.1088/1748-9326/10/2/024007, 2015.
Ray, D. K., Gerber, J. S., Macdonald, G. K., and West, P. C.: Climate variation explains a third of global crop yield variability, Nat. Commun., 6, 1–9, https://doi.org/10.1038/ncomms6989, 2015.
Rizhsky, L., Liang, H., and Mittler, R.: The combined effect of drought stress and heat shock on gene expression in tobacco, Plant Physiol., 130, 1143–1151, https://doi.org/10.1104/pp.006858, 2002.
Rizhsky, L., Liang, H., Shuman, J., Shulaev, V., Davletova, S., and Mittler, R.: When defense pathways collide, The response of arabidopsis to a combination of drought and heat stress, Plant Physiol., 134, 1683–1696, https://doi.org/10.1104/pp.103.033431, 2004.
Rodrigues, R. R., Taschetto, A. S., Sen Gupta, A., and Foltz, G. R.: Common cause for severe droughts in South America and marine heatwaves in the South Atlantic, Nat. Geosci., 12, 620–626, https://doi.org/10.1038/s41561-019-0393-8, 2019.
Sasaki, D. K., Gramcianinov, C. B., Castro, B., and Dottori, M.: Intraseasonal variability of ocean surface wind waves in the western South Atlantic: the role of cyclones and the Pacific South American pattern, Weather Clim. Dyn., 2, 1149–1166, https://doi.org/10.5194/wcd-2-1149-2021, 2021.
Schauberger, B., Gornott, C., and Wechsung, F.: Global evaluation of a semiempirical model for yield anomalies and application to within-season yield forecasting, Glob. Chang. Biol., 23, 4750–4764, https://doi.org/10.1111/gcb.13738, 2017.
Seager, R., Naik, N., Baethgen, W., Robertson, A., Kushnir, Y., Nakamura, J., and Jurburg, S.: Tropical oceanic causes of interannual to multidecadal precipitation variability in southeast South America over the past century, J. Climate, 23, 5517–5539, https://doi.org/10.1175/2010JCLI3578.1, 2010.
Seager, R., Cane, M., Henderson, N., Lee, D. E., Abernathey, R., and Zhang, H.: Strengthening tropical Pacific zonal sea surface temperature gradient consistent with rising greenhouse gases, Nat. Clim. Chang., 9, 517–522, https://doi.org/10.1038/s41558-019-0505-x, 2019.
Seager, R., Henderson, N., and Cane, M.: Persistent Discrepancies between Observed and Modeled Trends in the Tropical Pacific Ocean, J. Climate, 35, 4571–4584, https://doi.org/10.1175/JCLI-D-21-0648.1, 2022.
Seneviratne, S. I., Corti, T., Davin, E. L., Hirschi, M., Jaeger, E. B., Lehner, I., Orlowsky, B., and Teuling, A. J.: Investigating soil moisture-climate interactions in a changing climate: A review, Earth-Sci. Rev., 99, 125–161, https://doi.org/10.1016/j.earscirev.2010.02.004, 2010.
Shepherd, T. G.: Storyline approach to the construction of regional climate change information, P. Roy. Soc. A-Math. Phy., 475, 2225, https://doi.org/10.1098/rspa.2019.0013, 2019.
Shipley, B.: Cause and Correlation in Biology: A User's Guide to Path Analysis, Structural Equations and Causal Inference. Cambridge: Cambridge University Press, https://doi.org/10.1017/CBO9780511605949, 2000.
Sippel, S., Zscheischler, J., and Reichstein, M.: Ecosystem impacts of climate extremes crucially depend on the timing, P. Natl. Acad. Sci. USA, 113, 5768–5770, https://doi.org/10.1073/pnas.1605667113, 2016.
Sippel, S., Reichstein, M., Ma, X., Mahecha, M. D., Lange, H., Flach, M., and Frank, D.: Drought, Heat, and the Carbon Cycle: a Review, Curr. Clim. Chang. Reports, 4, 266–286, https://doi.org/10.1007/s40641-018-0103-4, 2018.
Sippela, S., Zscheischlerb, J., and Reichsteina, M.: Ecosystem impacts of climate extremes crucially depend on the timing, P. Natl. Acad. Sci. USA, 113, 5768–5770, https://doi.org/10.1073/pnas.1605667113, 2016.
Steptoe, H., Jones, S. E. O., and Fox, H.: Correlations Between Extreme Atmospheric Hazards and Global Teleconnections: Implications for Multihazard Resilience, Rev. Geophys., 56, 50–78, https://doi.org/10.1002/2017RG000567, 2018.
Strnad, F. M., Schlör, J., Fröhlich, C., and Goswami, B.: Teleconnection patterns of different El Nino types revealed by climate network curvature, http://arxiv.org/abs/2203.07035 (last access: 10 February 2023), 2022.
Sun, X., Cook, K. H., and Vizy, E. K.: The South Atlantic subtropical high: Climatology and interannual variability, J. Climate, 30, 3279–3296, https://doi.org/10.1175/JCLI-D-16-0705.1, 2017.
Suzuki, N., Rivero, R. M., Shulaev, V., Blumwald, E., and Mittler, R.: Abiotic and biotic stress combinations, New Phytol., 203, 32–43, https://doi.org/10.1111/nph.12797, 2014.
Timmer, C. P.: Reflections on food crises past, Food Pol., 35, 1–11, https://doi.org/10.1016/j.foodpol.2009.09.002, 2010.
Torreggiani, S., Mangioni, G., Puma, M. J., and Fagiolo, G.: Identifying the community structure of the food-trade international multi-network, Environ. Res. Lett., 13, 5, https://doi.org/10.1088/1748-9326/aabf23, 2018
van Garderen, L. and Mindlin, J.: A storyline attribution of the 2011/2012 drought in Southeastern South America, Weather, 77, 212–218, https://doi.org/10.1002/wea.4185, 2022.
Von Uexkull, N., Croicu, M., Fjelde, H., and Buhaug, H.: Civil conflict sensitivity to growing-season drought, P. Natl. Acad. Sci. USA, 113, 12391–12396, https://doi.org/10.1073/pnas.1607542113, 2016.
Venter, T.: Lessons from the High Soybean Prices of 2012 and 2022, 1–6, https://www.tridge.com/stories/lessons-from-the-high-soybean-prices-of-2012-and-2022 (last access: 10 February 2023), 2022.
Vijverberg, S. and Coumou, D.: The role of the Pacific Decadal Oscillation and ocean-atmosphere interactions in driving US temperature variability, npj Clim. Atmos. Sci., 5, 1–11, https://doi.org/10.1038/s41612-022-00237-7, 2022.
Vijverberg, S., Schmeits, M., van der Wiel, K., and Coumou, D.: Subseasonal Statistical Forecasts of Eastern U.S. Hot Temperature Events, Mon. Weather Rev., 148, 4799–4822, https://doi.org/10.1175/MWR-D-19-0409.1, 2020.
Voora, V., Larrea, C., and Bermudez, S.: Global Market Report: Soybeans, Int. Inst. Sustain. Dev., https://www.iisd.org/system/files/2020-10/ssi-global-market-report-soybean.pdf, (last access: 10 February 2023), 2020.
Wellesley, L., Preston, F., Lehne, J., and Bailey, R.: Chokepoints in global food trade: Assessing the risk, Res. Transp. Bus. Manag., 25, 15–28, https://doi.org/10.1016/j.rtbm.2017.07.007, 2017.
Wills, R. C. J., Dong, Y., Proistosecu, C., Armour, K. C., and Battisti, D. S.: Systematic climate model biases in the large-scale patterns of recent sea-surface temperature and sea-level pressure change, Geophys. Res. Lett., 49, 17, https://doi.org/10.1029/2022gl100011, 2022.
Zhang, D., Zang, G., Li, J., Ma, K., and Liu, H.: Prediction of soybean price in China using QR-RBF neural network model, Comput. Electron. Agric., 154, 10–17, https://doi.org/10.1016/j.compag.2018.08.016, 2018.
Zilli, M. T., Carvalho, L. M. V., and Lintner, B. R.: The poleward shift of South Atlantic Convergence Zone in recent decades, Clim. Dynam., 52, 2545–2563, https://doi.org/10.1007/s00382-018-4277-1, 2019.