the Creative Commons Attribution 4.0 License.
the Creative Commons Attribution 4.0 License.
 | 23 Feb 2023
Spatiotemporal changes in the boreal forest in Siberia over the period 1985–2015 against the background of climate change
Wenxue Fu
Yu Tao
Mingyang Li
Huadong Guo
Climate change has been proven to be an indisputable fact and to be occurring at a faster rate (compared to the other regions at the same latitude of the world) in boreal forest areas. Climate change has been observed to have a strong influence on forests; however, until now, the amount of quantitative information on the climate drivers that are producing changes in boreal forest has been limited. The objectives of this work were to quantify the spatiotemporal characteristics of boreal forest and forest types and to find the significant climate drivers that are producing changes in boreal forest. The boreal forest in Krasnoyarsk Krai, Siberia, Russia, which lies within the latitude range 51–69∘ N, was selected as the study area. The distribution of the boreal forest and forest types in the years 1985, 1995, 2005 and 2015 were derived from a series of Landsat data. The spatiotemporal changes in the boreal forest and forest types that occurred over each 10-year period within each 2∘ latitudinal zone between 51 and 69∘ N from 1985 to 2015 were then comprehensively analyzed. The results show that the total area of forest increased over the study period and that the increase was fastest in the high-latitude zone between 63 and 69∘ N. The increases in the areas of broad-leaved and coniferous forests were found to have different characteristics. In the medium-latitude zone between 57 and 63∘ N in particular, the area of broad-leaved forest grew faster than that of coniferous forest. Finally, the influence of the climate factors of temperature and precipitation on changes in the forests was analyzed. The results indicate that temperature rather than precipitation is the main climate factor that is driving change.
- Article
(6329 KB) - Full-text XML
- BibTeX
- EndNote


Boreal forests occupy between 8 % and 11 % of the Earth's land surface and store a large fraction of global terrestrial carbon. These forests are found throughout the polar regions of the Northern Hemisphere (at latitudes of 45–70∘ N) and cover 33 % of the total circumpolar region, mainly in the Nordic countries (Finland, Sweden, Norway and Iceland), Russia and North America (Canada and Alaska) (Allison and Treseder, 2011). The boreal forest biome has one of the largest geographic footprints of any terrestrial biome on the planet (Olson et al., 2001). To date, research into shifts in the range of this biome has predominately focused on the advance of boreal tree species into tundra or alpine habitats (i.e., treeline advance; see Harsch et al., 2009) or on the species-specific responses of temperate tree species (Zhu et al., 2012).
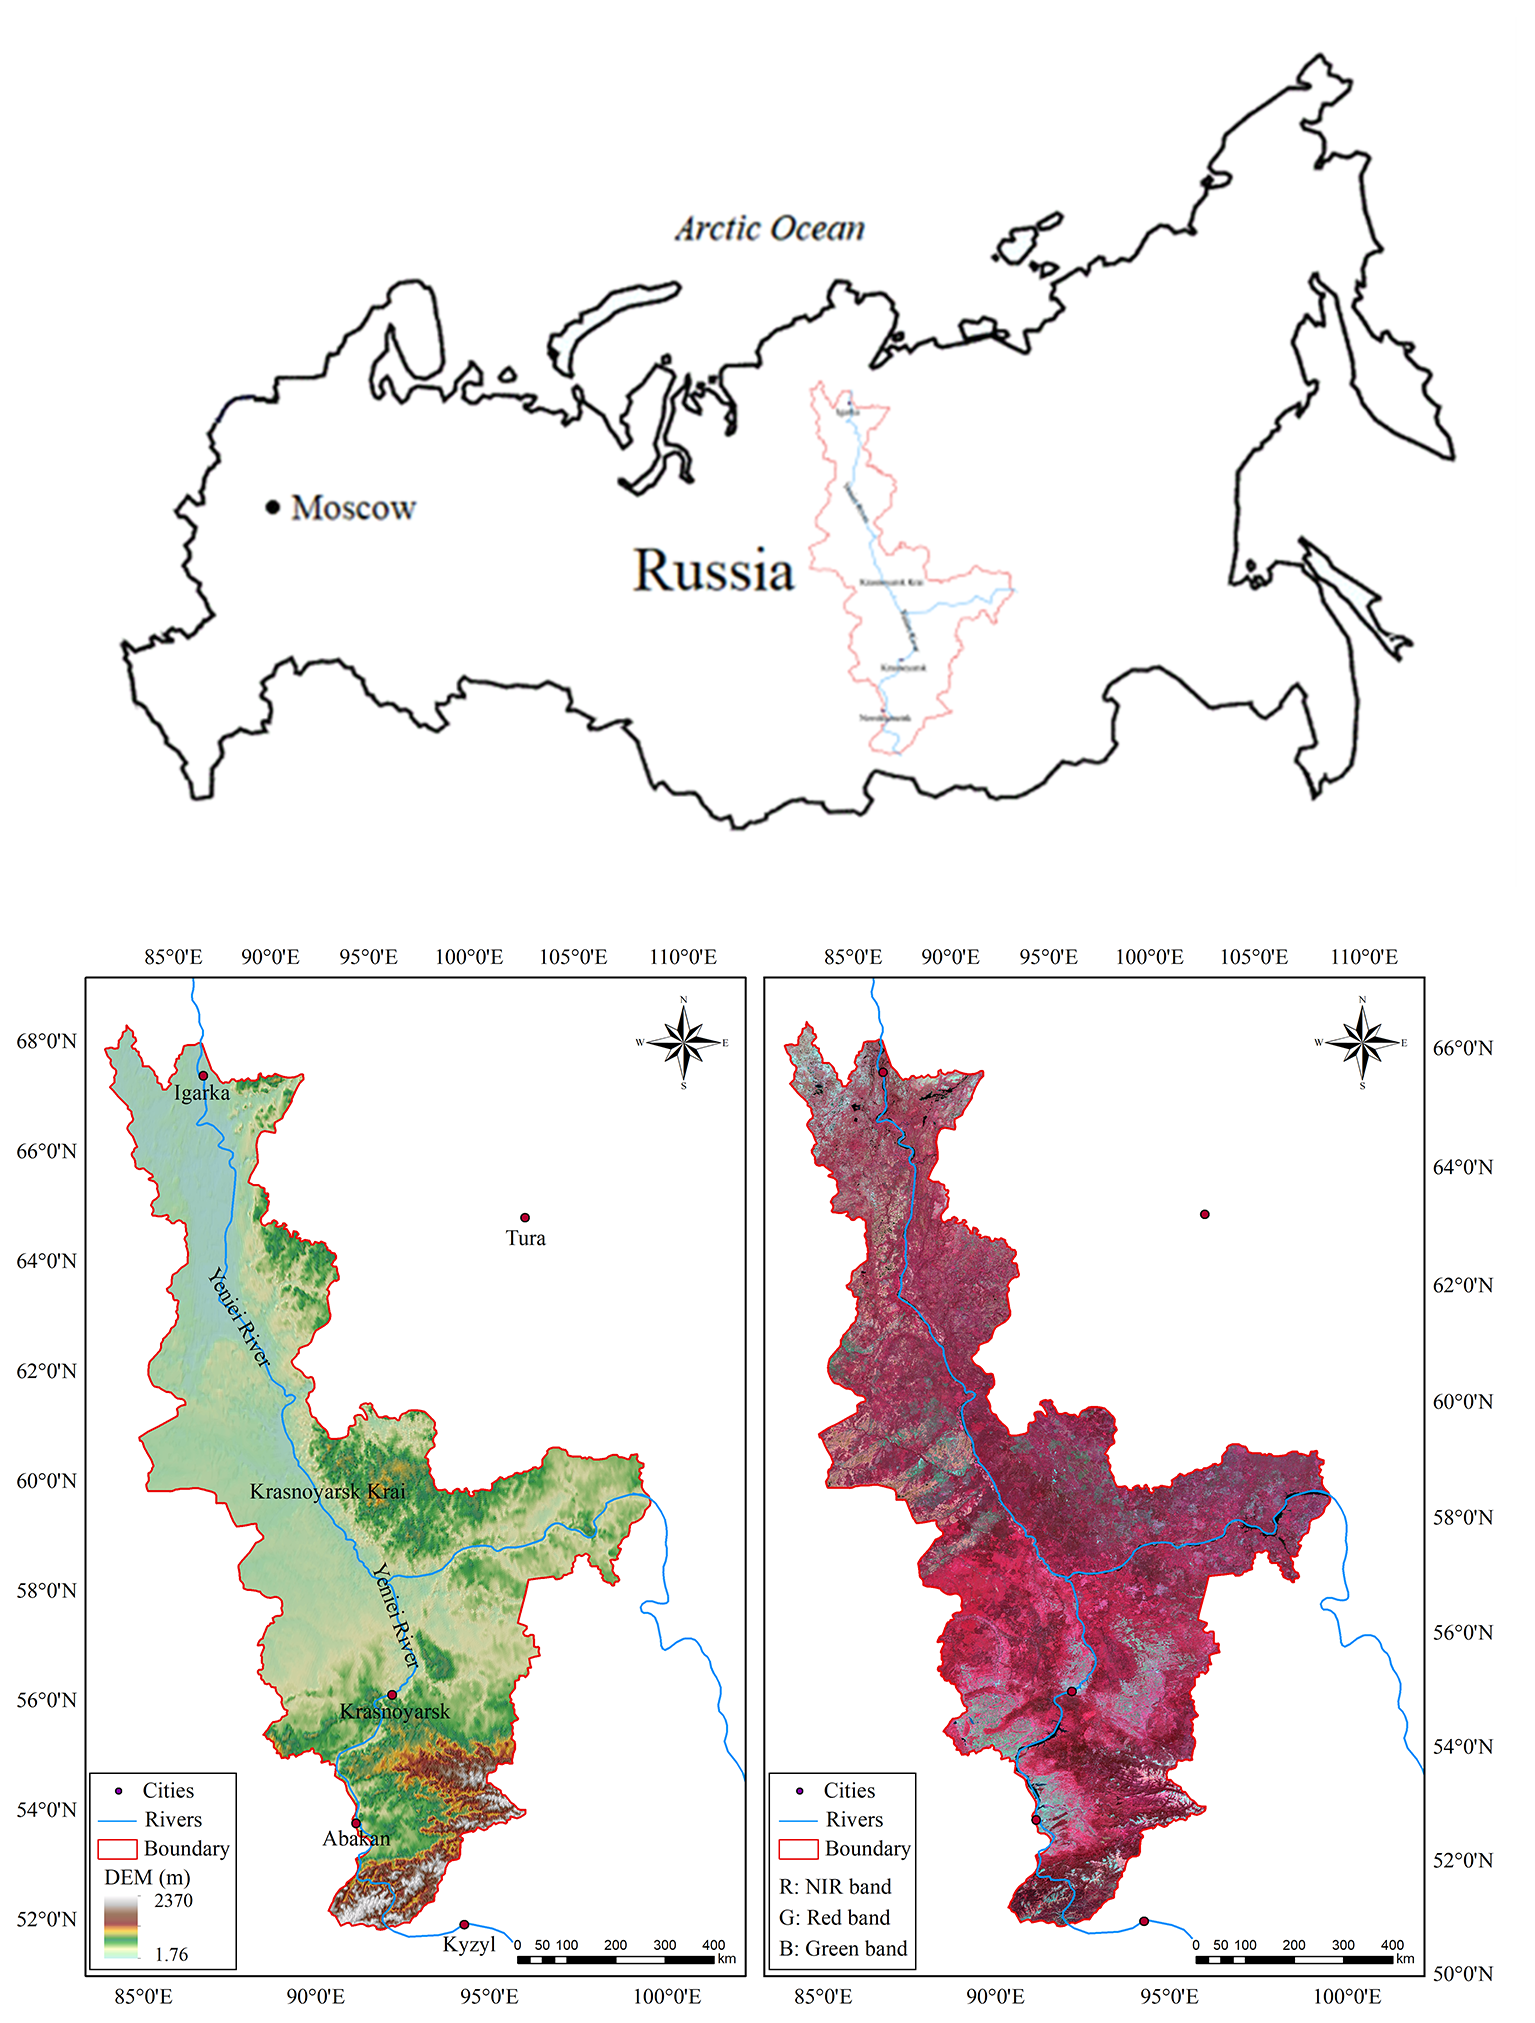
Figure 1Location of the study area together with the DEM and false-color composite of Landsat 8 images.
Climate change is expected to lead to changes in temperature and precipitation – factors which strongly influence boreal forests. In addition, the dynamics of the boreal forest will have a significant impact on global climate–biosphere feedback. Research has indicated that latitudes north of 40∘ are expected to experience the greatest temperature increases due to climate change (Serreze et al., 2000; Michael et al., 2021). In northern regions, the impacts of climate change are expected to be acute and the ecological response to climate change will vary spatially (Walther et al., 2002). Changes to biodiversity are one of the expected responses to climate change; for example, some of the most important conifer species in British Columbia are expected to lose a large portion of their suitable habitat (Hamann and Wang, 2006). These changes will lead to significant spatiotemporal changes in boreal forest. Most importantly, climate change is expected to reduce climatic constraints on plant growth (Nemani et al., 2003): warmer, wetter conditions will result in increased vegetation productivity, which has been demonstrated to be an indirect indicator of biodiversity, correlated with geographic variation in species richness (Coops et al., 2008; Nelson et al., 2014).
There has been much research on the effect of climate change on boreal forest. It has been observed that the growth of boreal forest has been influenced by global warming in the past decade or more. However, there are clear spatiotemporal differences in these effects (Alibakhshi et al., 2020). For example, Hou et al. (2020) found that vegetation phenology indicators in Finland's boreal forests showed spatiotemporal differences in response to climate variables in different months; i.e., vegetation in different regions showed different patterns of response to climate variables. Models and investigations have suggested that warming will induce northern migration of the treeline and an alteration in the mosaic structure of boreal forests; it has also been shown that, as temperatures increase, white spruce tree growth is declining (Soja et al., 2007). Over the past 30 years, spring and autumn temperatures over northern latitudes have increased by about 1.1 and 0.8 ∘C, respectively (Mitchell and Jones, 2005), and the thermal potential growing season has lengthened by about 10.5 d (Barichivich et al., 2013). Several studies indicate that increasing warming may result in acceleration of the northward expansion of boreal forests (Veraverbeke et al., 2017), as well as the observation of a greening trend characterized by a longer growing season and greater photosynthetic activity (Piao et al., 2008). Shuman et al. (2011) showed that climate warming may convert Siberia's deciduous larch (Larix spp.) to evergreen conifer forests and thus decrease regional surface albedo; at the continental scale, when temperature is increased, larch-dominated sites become vulnerable to early replacement by evergreen conifers. Ratcliffe et al. (2017) investigated a forested peatland in western Siberia and showed that climate change has caused the expansion of forested peatlands and increased tree cover. In addition, it is highly probable that the annual mean temperature in Canada's boreal forest region will increase by at least 2 ∘C by 2050 in this century, which may lead to effects on the ecological functioning of the region's boreal forests, such as triggering a process of forest decline and re-establishment lasting several decades, while also releasing significant quantities of greenhouse gases that will amplify the future global warming trend (Price et al., 2013). In practice, it is a challenge to quantify the effects of climate change on boreal forest because there are great uncertainties attached to possible interactions among them, as well as with other land use pressures (Price et al., 2013). Therefore, the extent of the boreal forest response to climate change is still not fully understood.
A practical method of examining trends in forest cover at large scales is to employ remotely sensed data. Satellite-based monitoring can be implemented consistently across large regions at annual or interannual intervals. Time series of MODIS (Moderate Resolution Imaging Spectroradiometer) satellite data have been commonly used as a data source in many forest studies. However, the relatively coarse spatial resolution of these data is not sufficient to detect forest cover changes accurately as it has been shown that substantial proportions of land cover changes occur at scales below 250 m (Jia et al., 2014; Heiskanen et al., 2012). Medium-resolution data, such as those acquired by the Landsat series of sensors including the Thematic Mapper (TM), Enhanced Thematic Mapper Plus (ETM+) and Operational Land Imager (OLI), represent the most widely used multispectral datasets that can be used for monitoring natural and human-induced landscape changes at the scale of tens of meters over periods of years or decades (Matasci et al., 2018; Hadi et al., 2016; Hermosilla et al., 2019). These data have been widely used for forest cover mapping and change detection because changes in forest cover due to anthropogenic factors usually happen at small scales (Townshend et al., 2012). For example, White et al. (2017) used the extensive Landsat archive to produce annual, gap-free surface reflectance composites for exploring forest disturbance and recovery characteristics in Canadian boreal forests. Sulla-Menashe et al. (2018) used normalized difference vegetation index (NDVI) time series from Landsat to explore geographic patterns of greening and browning in Canadian boreal forests and revealed that continued long-term climate change has the potential to significantly alter the character and function of Canadian boreal forests, with greening observed to be most prevalent in eastern Canada and browning occurring primarily in western Canada.
The objectives of this work were to quantify the spatiotemporal changes occurring in the boreal forests in Siberia and then to find which climate factor was the main driver of these changes. To do this, we tried to answer the following questions. (i) What is the extent of the changes in boreal forest cover and forest types that are occurring? (ii) In which latitude zones are the forest cover and forest types most sensitive to climate change? (iii) Which climate change factor is the main driver influencing change in the boreal forest in Siberia?
In order to answer the questions and meet our objectives, the following work was undertaken.
-
A typical area of Siberian boreal forest in Krasnoyarsk Krai, Russia, which extended from the temperate to the frigid zones, was selected as a research area. Forest cover and forest type data for the years 1985, 1995, 2005 and 2015 were retrieved from the Landsat series of imagery.
-
The characteristics of the spatiotemporal changes in the boreal forest cover and forest types within different latitude zones over the period 1985–2015 were quantified. The results were validated using 987 points sampled from high-resolution Gaofen-2 satellite images (spatial resolution: 0.81 m) and were found to have an overall accuracy of about 90.37 %.
-
The influences of two climate factors – temperature and precipitation – on changes in boreal forest were analyzed so that the main climate factor driving these changes could be identified.
The boreal forest in Krasnoyarsk Krai in central Russia, which is also located in the middle of Siberia (Fig. 1), was selected as the study area. This area extends from approximately 51 to 69∘ N and from 84 to 110∘ E. The climatic zones found in this area range from temperate in the south to frigid in the north (Brandt, 2009), which means that the latitude range was considered sufficiently large for an analysis of the sensitivity of the forest to climate change to be carried out.
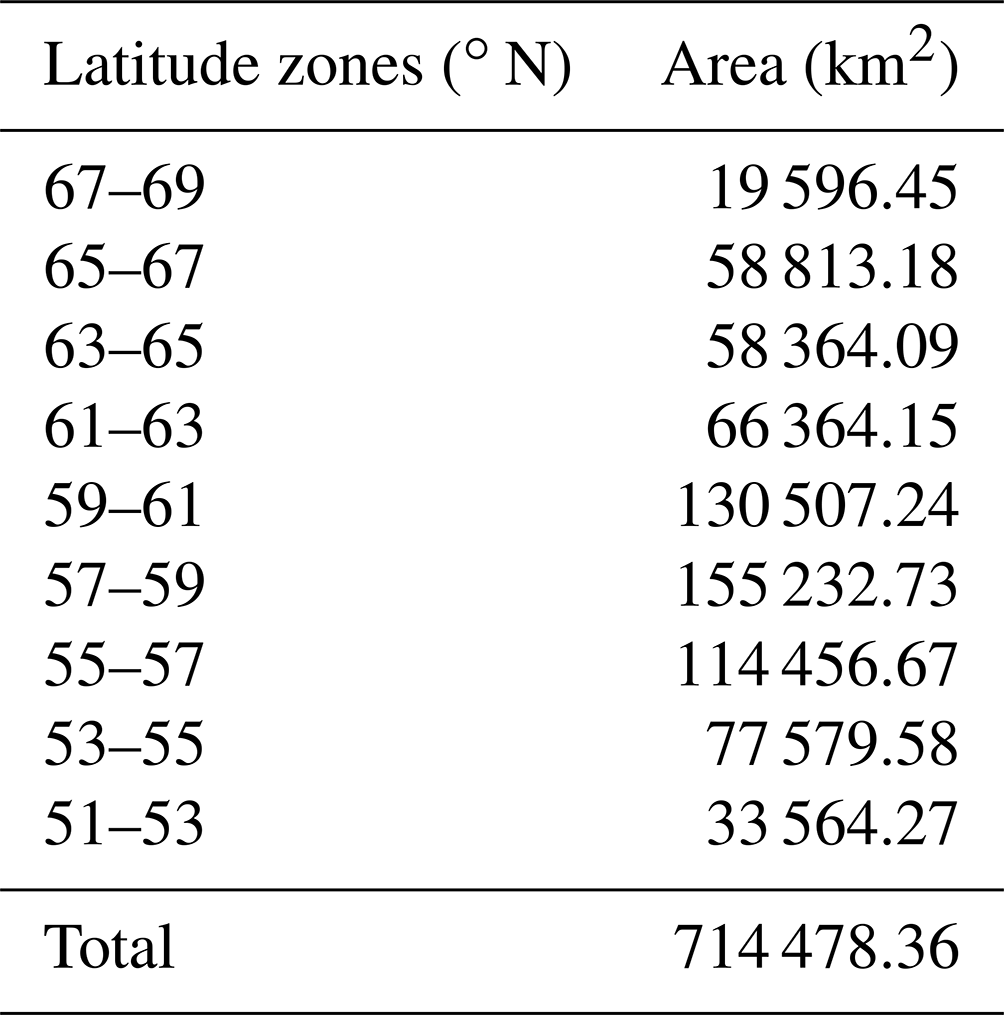
The climate in the study area is strongly continental with a large temperature gradient from south to north. In the north there are fewer than 40 d each year with temperatures above 10 ∘C, whereas in the south there are about 110–120 such days. The average temperature in January is −36 ∘C in the north and −18 ∘C in the south, and in July it is 10 ∘C in the north and 20 ∘C in the south. The annual precipitation in the north of the area is 200–300 mm; in the south it is about 1000 mm. The area is sparsely populated; a small number of towns and villages are scattered across the south, surrounded by areas of farmland. We divided the study area into nine latitude zones, each with a width of 2∘, from south to north. The area of each of these zones is shown in Table 1.
3.1 Data
More than 300 Landsat Thematic Mapper (TM) and Operational Land Imager (OLI) scenes of the study area containing little to no cloud cover were obtained from the United States Geological Survey (USGS) (http://glovis.usgs.gov/, last access: 25 November 2018). These images were acquired mainly in the years 1985, 1995, 2005 and 2015. Most of the images were acquired during summer (June to September); three images with no snow over the southern area acquired in October and some data from adjacent years were used to make up for the lack of data in the target years. Level 1 Tier 1 data with a spatial resolution of 30 m were used. In addition, four Gaofen-2 (GF-2) satellite panchromatic images acquired in 2015 that had a spatial resolution of 0.81 m were acquired for validation purposes.
The climate datasets ERA5-Land (Hersbach et al., 2020) and ERA-20CM (Hersbach et al., 2015), obtained from the European Centre for Medium Range Weather Forecasts (ECMWF), were used as the source of temperature and precipitation data. The digital elevation model (DEM) data (at 30 m spatial resolution) were obtained from the ASTER GDEM V03 dataset, which was also used in this study so that the influence of the elevation could be analyzed.
3.2 Methods
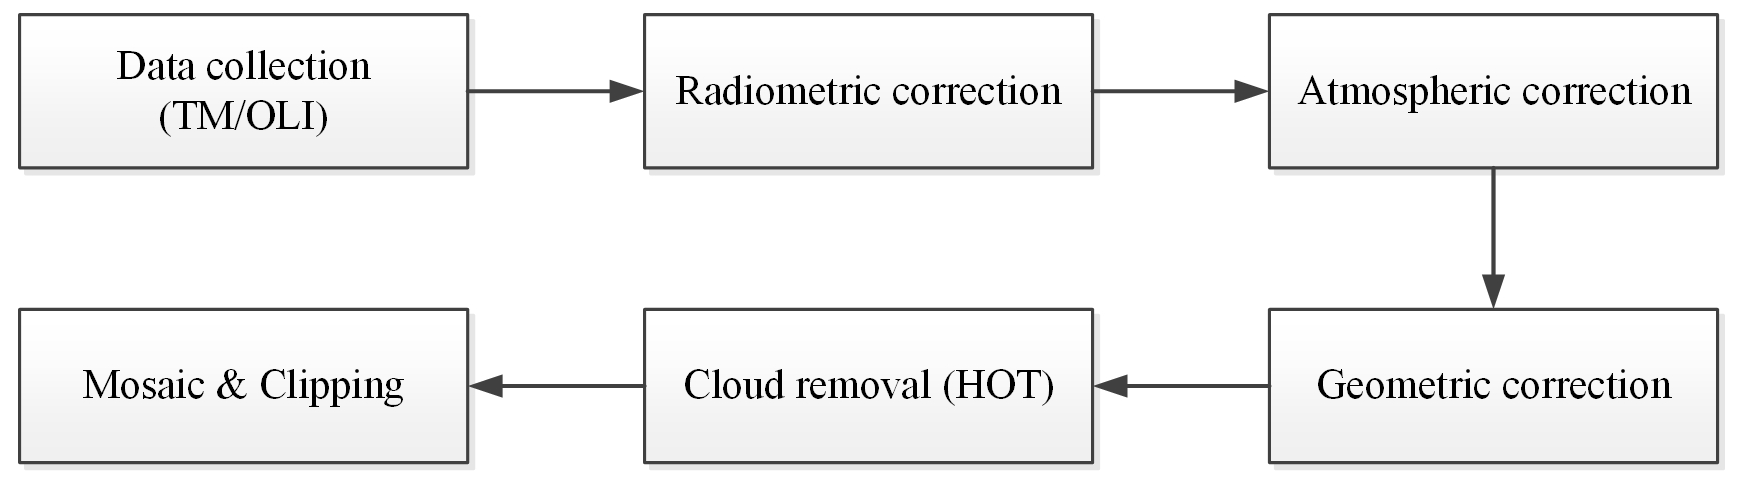
3.2.1 Landsat data preprocessing
Image preprocessing, including radiometric and atmospheric correction to eliminate radiometric and geometric distortion, was carried out. Following this, a haze optimized transformation (HOT) algorithm was used to identify and remove noise due to thin clouds (Zhang et al., 2002; Li et al., 2019; Liu et al., 2017). Firstly, the clear line was determined according to the high correlation between the blue and red bands in the clear region, and then the HOT value was calculated using the transform equation:
where ρ1 and ρ3 are the reflectance of the blue and red bands of TM and OLI images, respectively. I represents the intercept of the clear line, and θ is the inclination of the clear line.
The cloud images were classified by the HOT value, which represented the cloud thickness, and then the Landsat image in the cloud region and clear region was automatically classified using just one near-infrared band and two shortwave infrared bands. The image in the cloud region of visible bands was matched to the image in the clear region according to the cloud class and object classification to remove the effect of the cloud (Tian and Fu, 2020).
3.2.2 Forest cover and type classification
First, a simple decision tree algorithm was used to distinguish vegetation from non-vegetation. In this classification, two vegetation indices, NDVI and ratio vegetation index (RVI), were used for the discrimination between forest and non-forest land. NDVI can effectively weaken the effects of complex terrain in image information extraction and enhance the distinction between vegetation and other land types, which is helpful for improving the accuracy and credibility of forest information extraction. The RVI can better reflect the difference of vegetation growth and coverage and is suitable for vegetation monitoring in areas with vigorous vegetation growth and high coverage. The annual maximum NDVI (NDVImax) values of built-up areas, barren lands and sparsely vegetated lands are usually lower than 0.30, whereas forest NDVImax values are usually higher than 0.50 (Qin et al., 2015). Subsequently, we determined the decision tree classification rules based on sample training: NDVI values greater than 0.62 and RVI values greater than 6.0 were selected as vegetation land; otherwise, land was regarded as non-vegetation land. Next, the areas of vegetation were further classified as being forest or “other” vegetation. In this work, it was found that different plants have different spectral reflectance peaks in the near-infrared band; this band is highly sensitive to the differences in reflectance that result from different types of leaves having different internal structures and colors (Lewis, 2002). Vegetation objects with reflectance values of less than 0.38 in the near-infrared were determined to be forest land.
Finally, a random forest (RF) algorithm was used to discriminate coniferous and broad-leaved forests from areas of vegetation (Breiman, 2001; Strobl et al., 2007; Cutler et al., 2008; Svetnik et al., 2003; Rodriguez-Galiano et al., 2013; Assiri, 2021; Climent et al., 2019). Representative training samples are one of the most critical components of the RF algorithm. In this study, we selected the sample points used for the classification for different years based on Landsat images that refer to GF-2 images and Google Earth images (Gong et al., 2013). Six bands, Landsat TM bands 1–5 and 7 as well as Landsat OLI bands 2–7, were selected as characteristic spectral variables, and meanwhile NDVI, the normalized difference built-up index (NDBI) (Cha et al., 2003) and the RVI were also selected as index characteristic variables for classification in RF.
3.3 Accuracy validation
We selected 987 randomly distributed sampling points from the GF-2 images acquired in 2015 for the accuracy validation. The overall accuracy was found to be 90.37 %, and the F1 scores (Chen et al., 2021; Pontius and Millones, 2011) for the broad-leaved, coniferous forest and non-forest land were 0.85, 0.93 and 0.91, respectively. Considering the consistency of the Landsat series of images, the above validation was still considered to be valid for the earlier years because it is difficult to obtain measured data or high-resolution satellite images of the study area for these times.
4.1 Spatiotemporal changes in forest characteristics within the different latitude zones
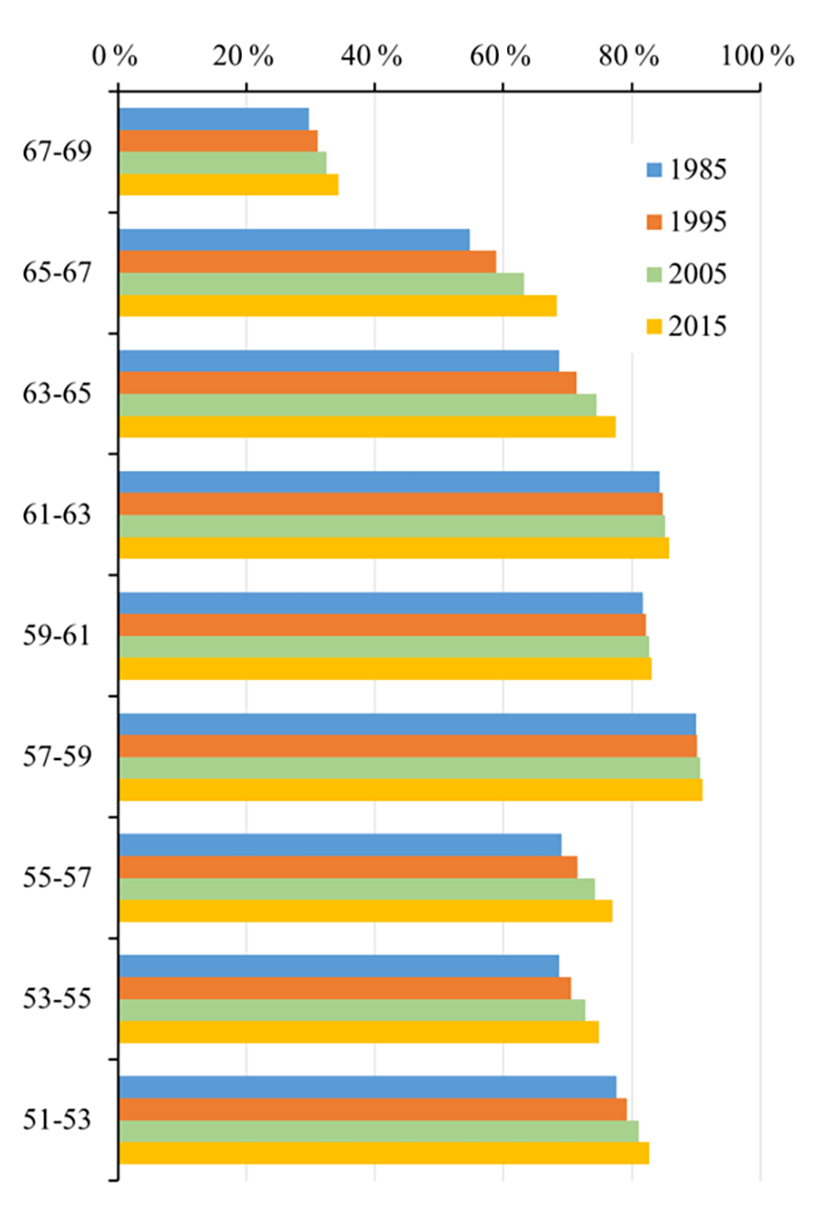
First of all, as shown in Fig. 3, we analyzed the spatial distribution of the boreal forest within the different latitude zones in 1985, 1995, 2005 and 2015. The overall forest coverage in the study area was high – up to 80.5 % – but with significant spatial variations. As the amount of human activity in the study area is limited, these differences can be considered to be caused mainly by natural factors. It was found that the forest coverage within the zones with latitudes in the range 51–67∘ N was above 60 % but that this declined sharply to about 34.4 % at 67–69∘ N. The highest rate of forest coverage – about 90 % – occurred in the 57–59∘ N zone. In the lower-latitude zones in the range 53–57∘ N, the forest coverage was slightly lower as a result of a certain amount of human activity.
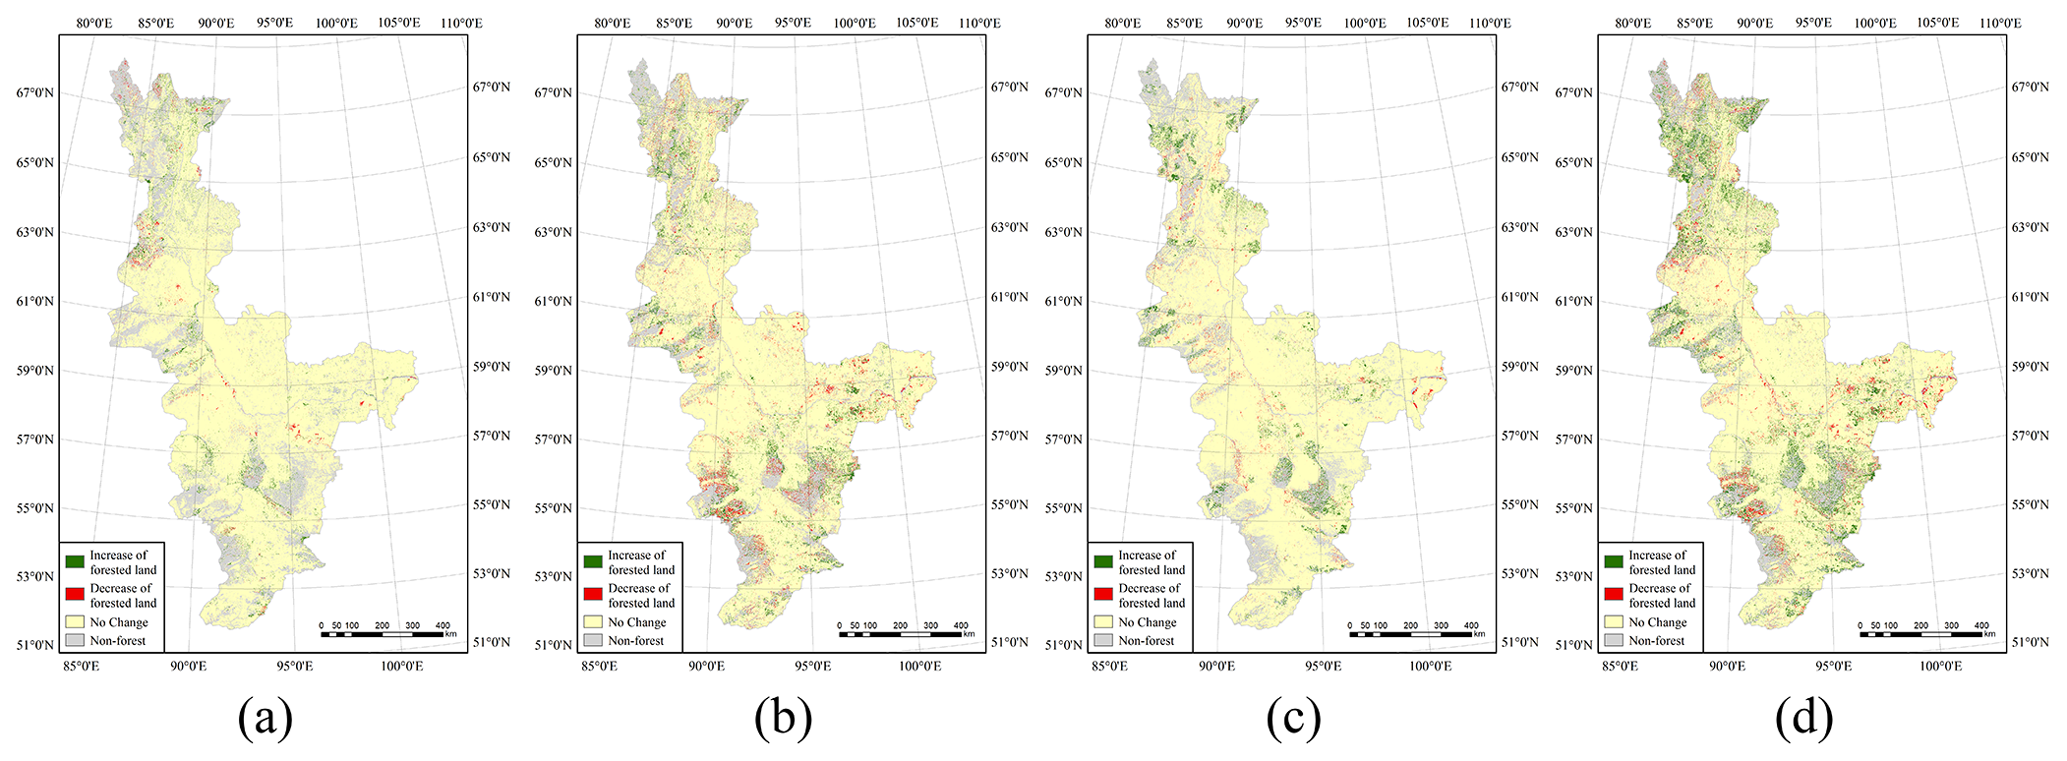
Figure 4Changes in boreal forest coverage in the time intervals (a) 1985–1995, (b) 1995–2005, (c) 2005–2015 and (d) 1985–2015.
An important problem that we focused on was the significant spatiotemporal change in the boreal forest coverage that occurred over the 3 decades of the study period. We retrieved the changes for the four time intervals of 1985–1995, 1995–2005, 2005–2015 and 1985–2015 – the results are shown in Fig. 4. The first three images reflect the changes that occurred over each 10-year interval; the final image shows the overall change over the 3 decades. Quantitative information about the changes that occurred over the four different time intervals is given in Table 2, and charts detailing the spatiotemporal changes are shown in Fig. 5. However, empirical NDVI values for different times and regions are not universal (Ma et al., 2019). Therefore, the results of the threshold-based method (decision tree) used in this study for the classification of forested and non-forested land may have uncertainty. Future research could use machine learning or deep learning methods to classify forests to improve the accuracy of classification.
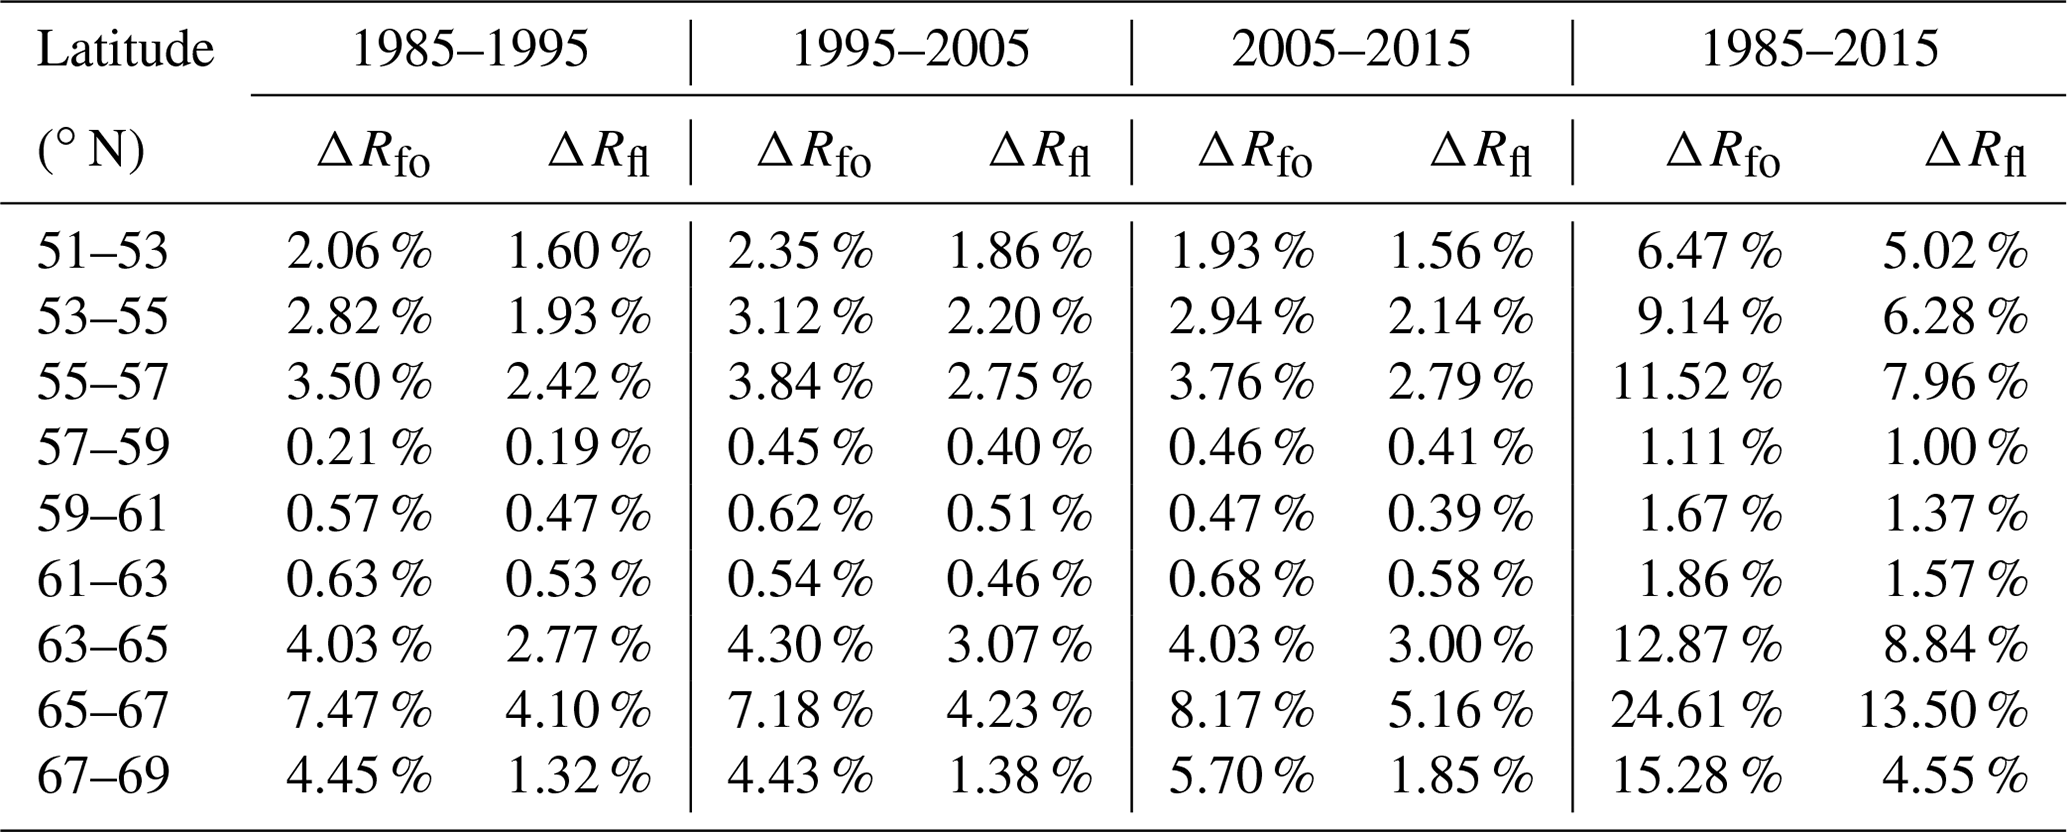
Overall, the forest coverage within all of the latitude zones increased continuously over the 3 decades of the study. We first analyzed the characteristics of the ratio ΔRfo, which is the ratio of the increase in the area of forest to the original area, as well as of ΔRfl, which is the ratio of the increase in the area of forest to the total land area. First, it can be seen that in the center of the study area from 57–63∘ N, ΔRfo and ΔRfl were relatively stable and had average values of less than 2 % over the period 1985–2015. Taking into account the accuracy of the forest cover retrieval, it can be considered that the forest coverage in this zone has not changed over the study period, which means that the cover of boreal forest in this zone has not been significantly affected by climate change. The rate of forest coverage in this zone was also highest in the study area – more than 80 % in some areas – as has been discussed above.
In the other latitude zones, the values of the ratios ΔRfo and ΔRfl were significantly higher. The fastest change was observed in the northernmost zone (63–69∘ N), which is also the zone where the climate warming is projected to be the highest. Over the period 1985–2015, the average value of ΔRfo was about 17 %; for ΔRfl, it was about 9 %. The highest rates of increase in forest cover occurred in the zone 65–67∘ N, where ΔRfo and ΔRfl were about 24.61 % and 13.50 %, respectively, which is equivalent to average annual values of about 0.76 % and 0.44 %. Finally, in the southern zone from 51–57∘ N, the average value of ΔRfo was about 9 % and of ΔRfl about 6 %.
There were also temporal variations in the changes in forest coverage, especially in the high-latitude zones. For example, between 65 and 69∘ N, the amount of forest coverage showed an accelerating trend over the study period, with average values of ΔRfo and ΔRfl of 6.00 % and 2.70 %, respectively, for the time interval 1985–1995 and 7.00 % and 3.50 %, respectively, for 2005–2015. However, the rates of increase in forest coverage in the other latitude zones were relatively stable over the study period.
Table 2Quantitative details of the changes in boreal forest coverage in each latitude zone.
4.2 Spatiotemporal characteristics of changes in forest types
4.2.1 Spatiotemporal differences in the ranges of forest types
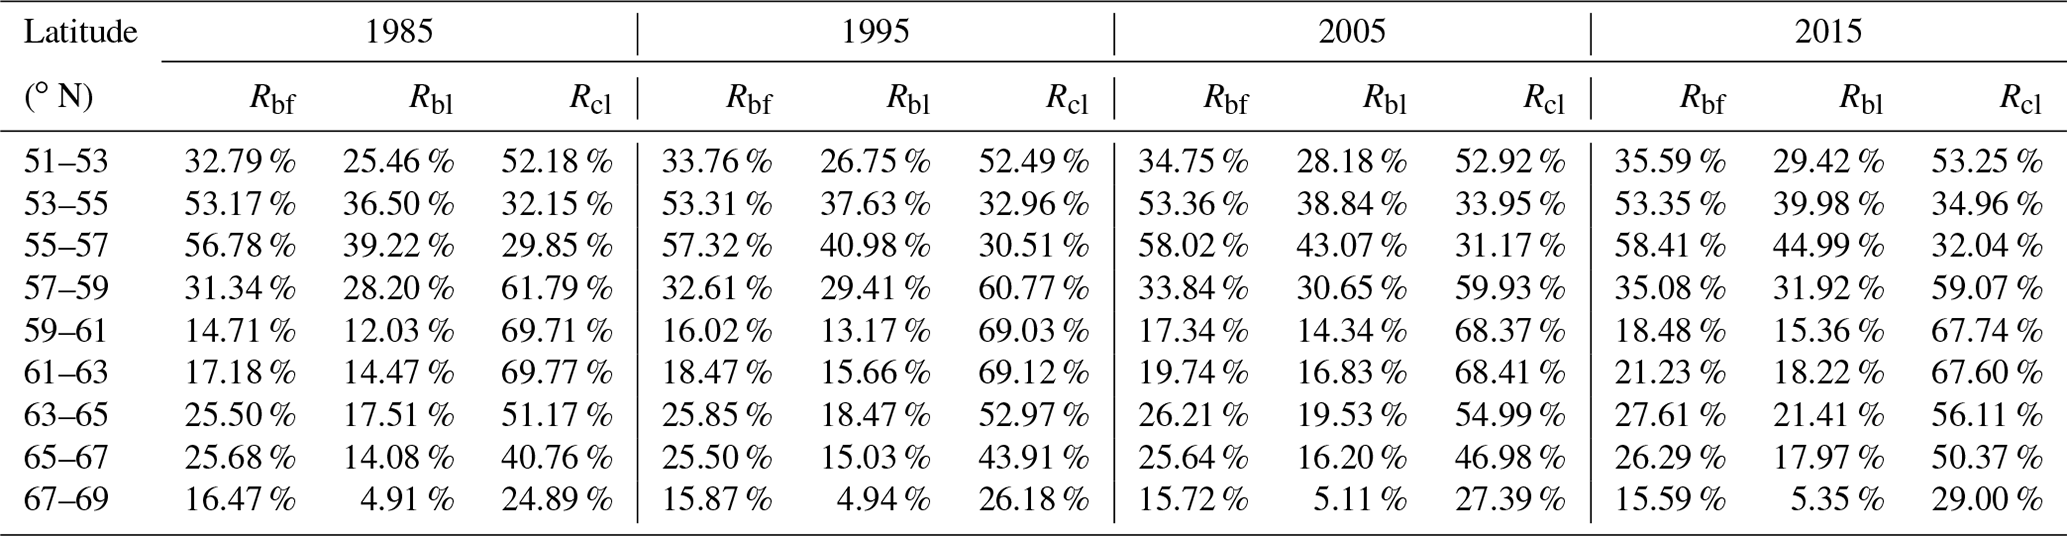
We also analyzed the spatiotemporal changes in the broad-leaved and coniferous forest coverage. Rbf was defined as the ratio of the broad-leaved forest area to the total forest area; the corresponding ratio for coniferous forest, Rcf, was then given by 1 – Rbf. Similarly, Rbl was used to represent the ratio of the broad-leaved forest area to the total land area; the corresponding measure for coniferous forest was denoted as Rcl. Quantitative information about the forest types coverage can be found in Table 3, and the differences between these ratios are shown in Fig. 6.
It can be seen from Fig. 6a that the region most suited to coniferous forest within the study area is the medium-latitude zone 57–63∘ N, which has a value of Rcl of about 70 %. In the northernmost zone (67–69∘ N), Rcl is still above 25 %, whereas Rbl is only about 5 %, which indicates that coniferous forest is more resistant to cold and that broad-leaved forest is essentially not found north of latitude 67∘ N in the studied region.
Broad-leaved forest cover is low in the north and high in the south; the highest Rbl value – over 40 % –occurs in the 53–57∘ N zone; however, this falls sharply to less than 20 % at latitudes above 57∘ N. In the 51–57∘ N zone, there may be some human activity that affects the forest coverage, which leads to the slightly lower values of Rbl and Rcl.
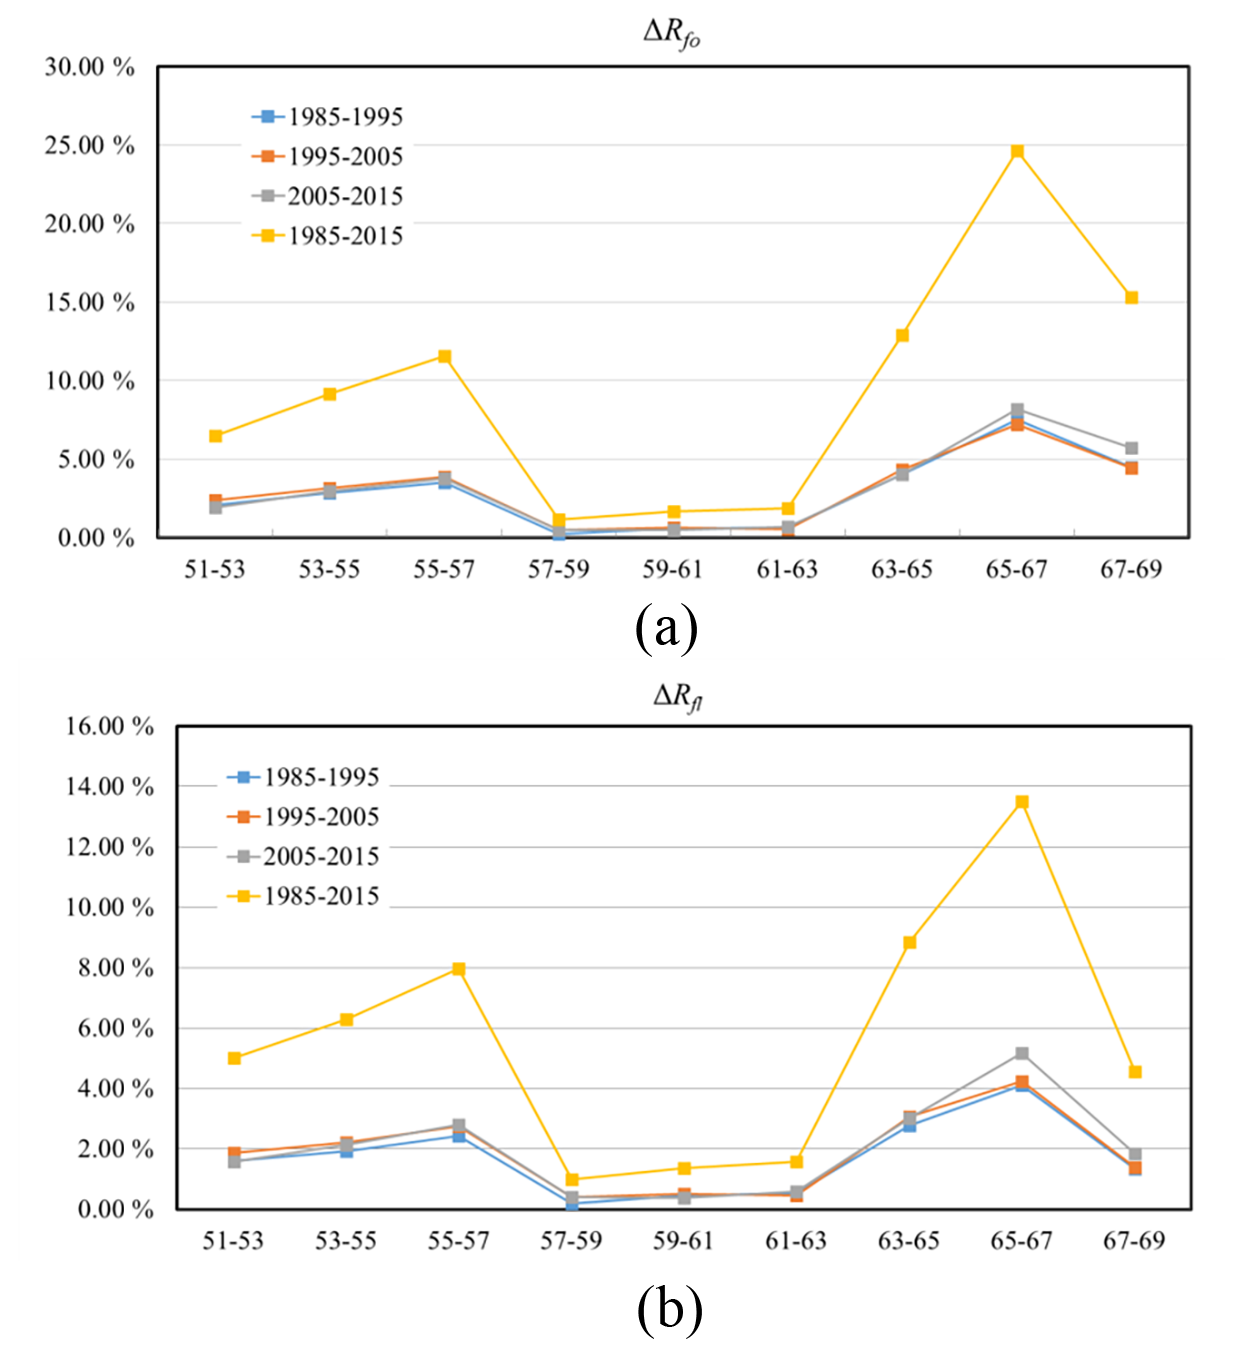
Figure 5Forest coverage changes in different latitude zones during different time intervals as measured by (a) ΔRfo and (b) ΔRfl.
Broad-leaved forest co-exists with coniferous forest across the whole study area, and the proportions of the two types of forest are similar in the 53–57∘ N zone (Fig. 6c). However, in the other zones, coniferous forest is the dominant species and Rcf is above 70 %.
Table 3Quantitative details of the coverage of different forest types.
4.2.2 Spatiotemporal characteristics of changes in forest types
The characteristics of the changes in forest types were also analyzed. The spatiotemporal characteristics of these changes for the time intervals 1985–1995, 1995–2005, 2005–2015 and 1985–2015 are shown in Figs. 7 and 8, and related quantitative information is shown in Table 4. We denoted ΔRbl and ΔRcl as representing the ratios of the change in broad-leaved and coniferous forest coverage to the total land area, respectively, meaning that these are measures of the absolute increase in these forest types. ΔRbf and ΔRcf denote the increase in the ratio of the area of broad-leaved forest and coniferous forest to the total area of forest, respectively, meaning that these are measures of the relative increase in the area of forest: .
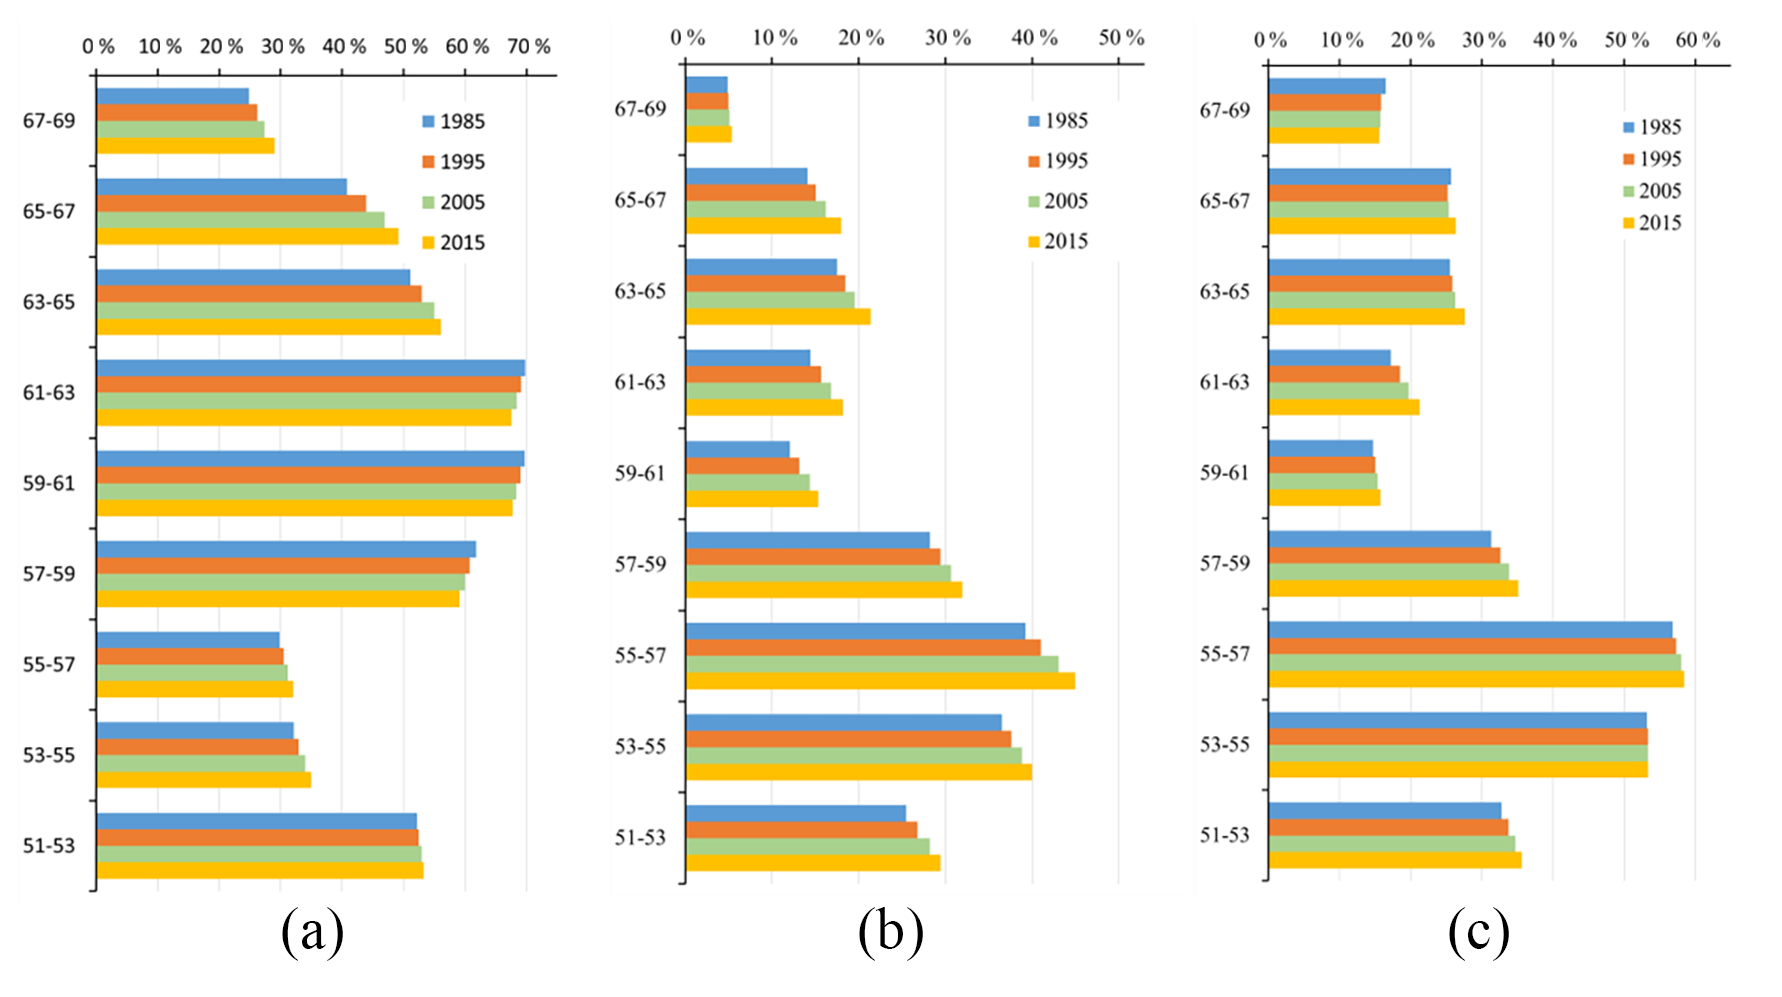
Figure 6Differences between the rates of broad-leaved and coniferous forest coverage as measured by (a) Rcl, (b) Rbl and (c) Rbf.
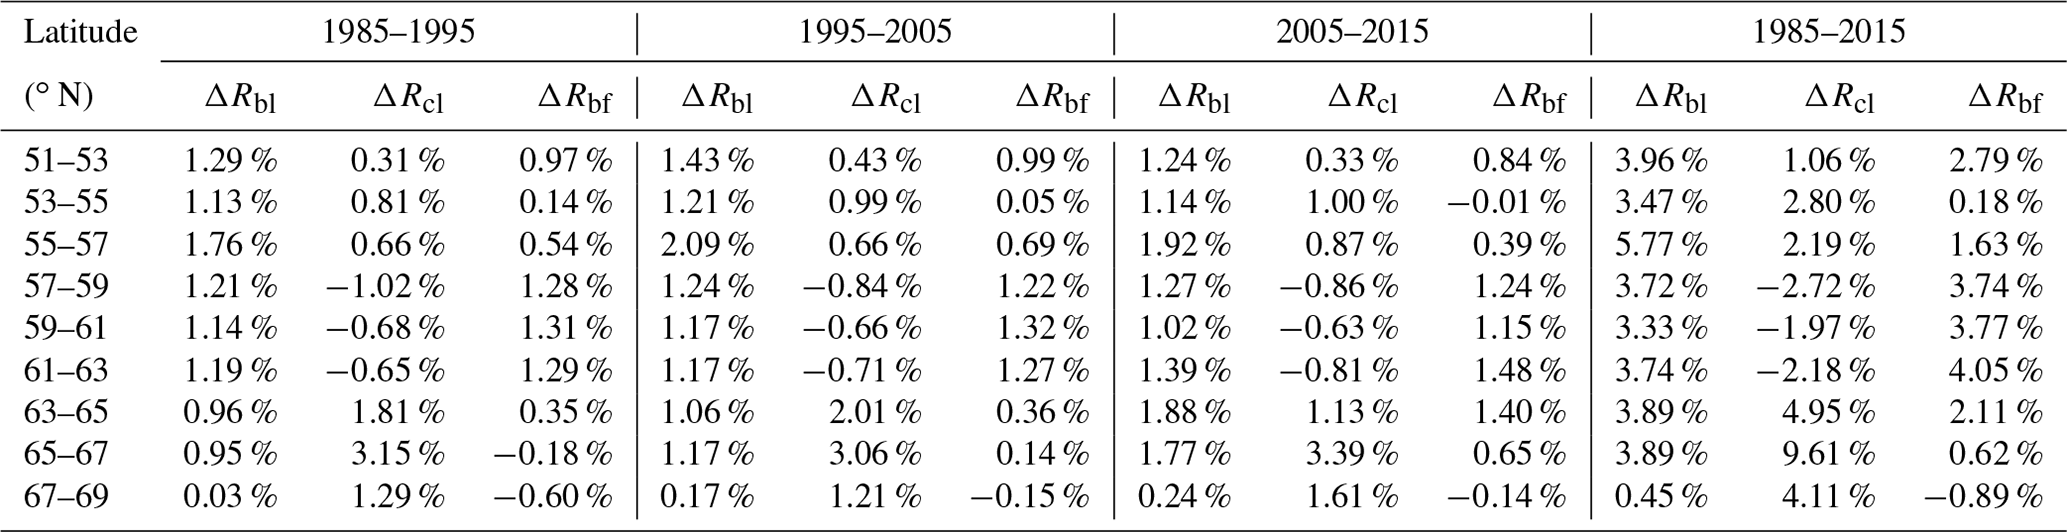
We analyzed the spatial characteristics of the changes in forest types, and details of the spatiotemporal changes in these types are shown in Fig. 9. Overall, it can be seen that the broad-leaved forest coverage increased in every latitude zone, which means that climate change that has been occurring may have promoted the growth of broad-leaved species across the study area during the 3 decades of the study. In the 51–67∘ N zone, the overall value of ΔRbl is above 3.3 %; however, the value of this measure declines rapidly to about 0.45 % north of 67∘ N, which can be considered equivalent to there being no change in Rbl in this area. The largest value of ΔRbl over the 3 decades of the study was 5.77 %, which occurred in the latitude zone 55–57∘ N; this is equivalent to an average annual increase of 0.19 % and indicates that the broad-leaved forest in this zone was the most sensitive to climate change and its area increased the fastest.
However, coniferous forest showed different change characteristics from those of broad-leaved forest. The latitude zones in the study area can clearly be divided into three parts according to the characteristics of the changes in the coniferous forest area. First, in the zone 51–57∘ N, the average value of ΔRcl is about 2.0 %. However, the area of coniferous forest in the medium-latitude zone 57–63∘ N declined slightly over the 3 decades of the study with a value of ΔRcl of about −2.3 %; in comparison, ΔRbl is about 3.9 %, which means that climate change may have had a negative impact on coniferous forest growth in this zone. The area of coniferous forest increased relatively rapidly in the northern zone between 63 and 69∘ N with an average ΔRcl greater than 4.0 %. The largest value of ΔRcl – 9.61 % – occurs in the latitude zone 65–67∘ N, which is equivalent to an average annual increase of 0.32 %; for comparison, this zone has a value of ΔRbl of 3.89 %.
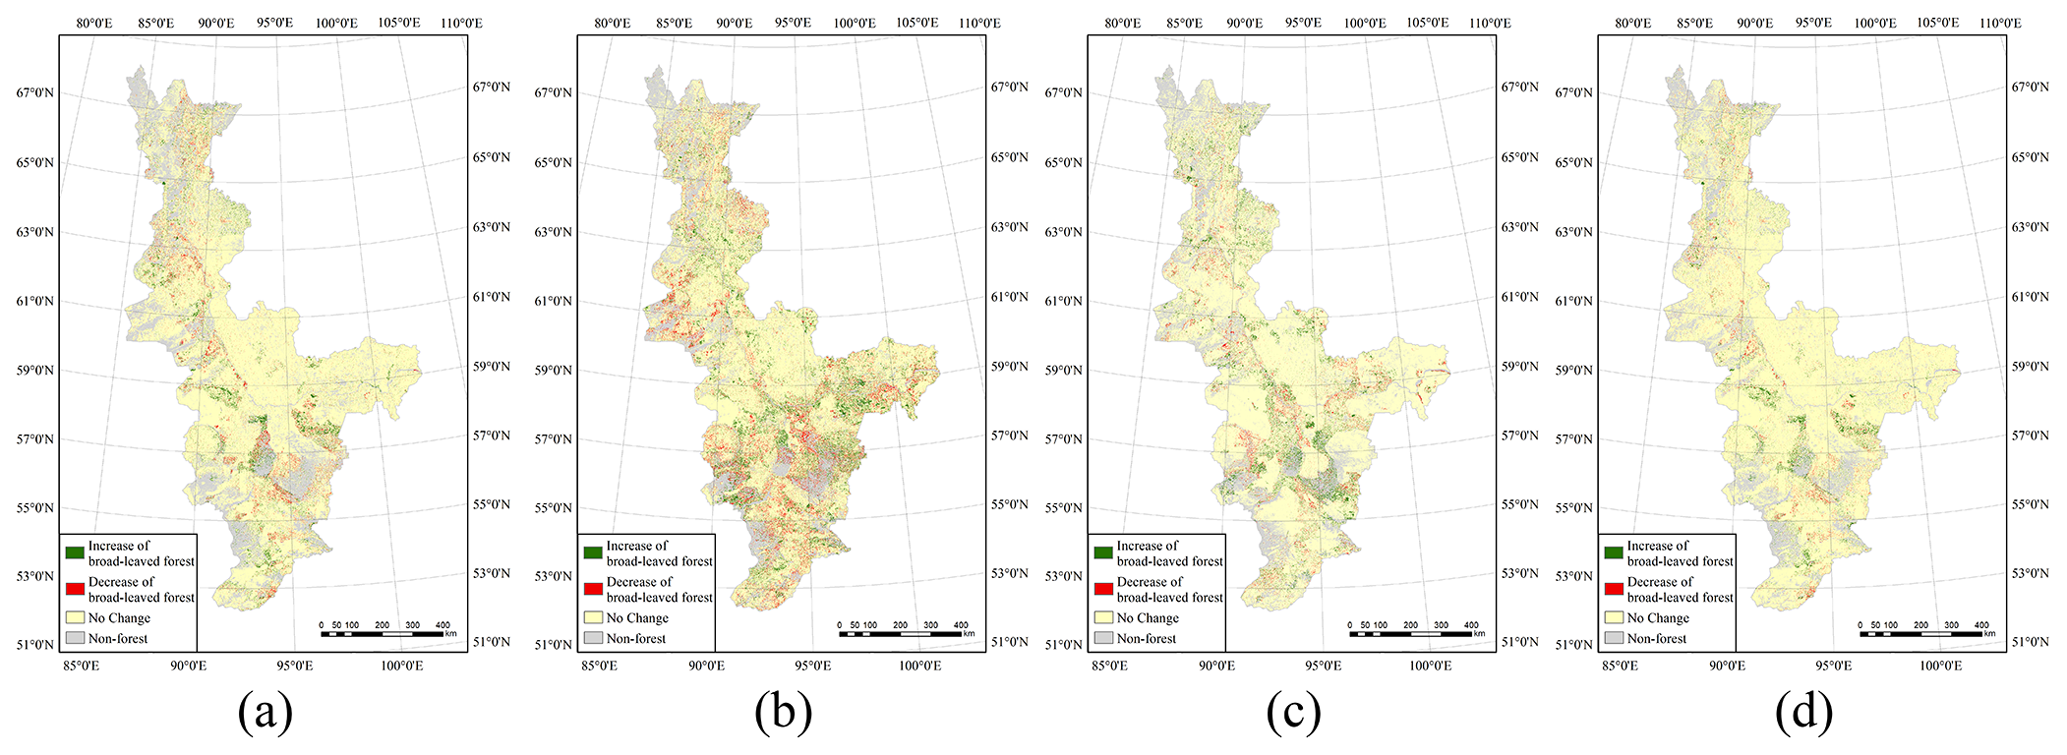
Figure 7Changes in broad-leaved forest area for (a) 1985–1995, (b) 1995–2005, (c) 2005–2015 and (d) 1985–2015.
It should be noted that ΔRbf is an important parameter for evaluating the relative proportions of the two forest types and can reflect the different characteristics of their responses to climate change. A positive ΔRbf indicates that the proportion of broad-leaved forest relative to the total forest area is increasing faster than that of coniferous forest and that broad-leaved forest is tending to become the dominant tree species. A variety of evidence points to complex connections (and changes) in the relationship between disturbance regimes and climate change in boreal forest (Kasischke and Turetsky, 2006; Balshi et al., 2009; de Groot et al., 2013). In particular, studies have found that warming and drying trends in Canada's boreal regions favor higher frequency of both fire and insect disturbance (Sulla-Menashe et al., 2018), while in Siberia, warming has led to an increase in the frequency and area of wildfires that have reached the Arctic Ocean shore, which is the most important factor in taiga dynamics. Furthermore, larch and Scots pine have evolved under conditions of periodic forest fires, thereby gaining a competitive advantage over non-fire-adapted species (Kharuk et al., 2021), which may affect forest cover and forest type change in the region. It can be seen from Fig. 9c that, in the zone 57–63∘ N, ΔRbf is above 3.8 %. Meanwhile, as discussed above, the absolute increase given by ΔRcl is negative, whereas ΔRbl is positive in this zone. Also, as Rbf had a value of 35.08 % in 2015 in the zone 57–59∘ N, at the current rate of change, broad-leaved forest will replace coniferous forest as the dominant tree species in this zone in about 120 years. In general, species will be more resilient at the centers of their present-day distributions, while changes in succession and species composition will be most rapid at the boundaries. Based on current knowledge, the boreal climate zones are expected to shift 5–10 times faster than the speed of natural range expansion achievable by most tree species (McLachlan et al., 2005; McKenney et al., 2007; Aitken et al., 2008; Loarie et al., 2009).
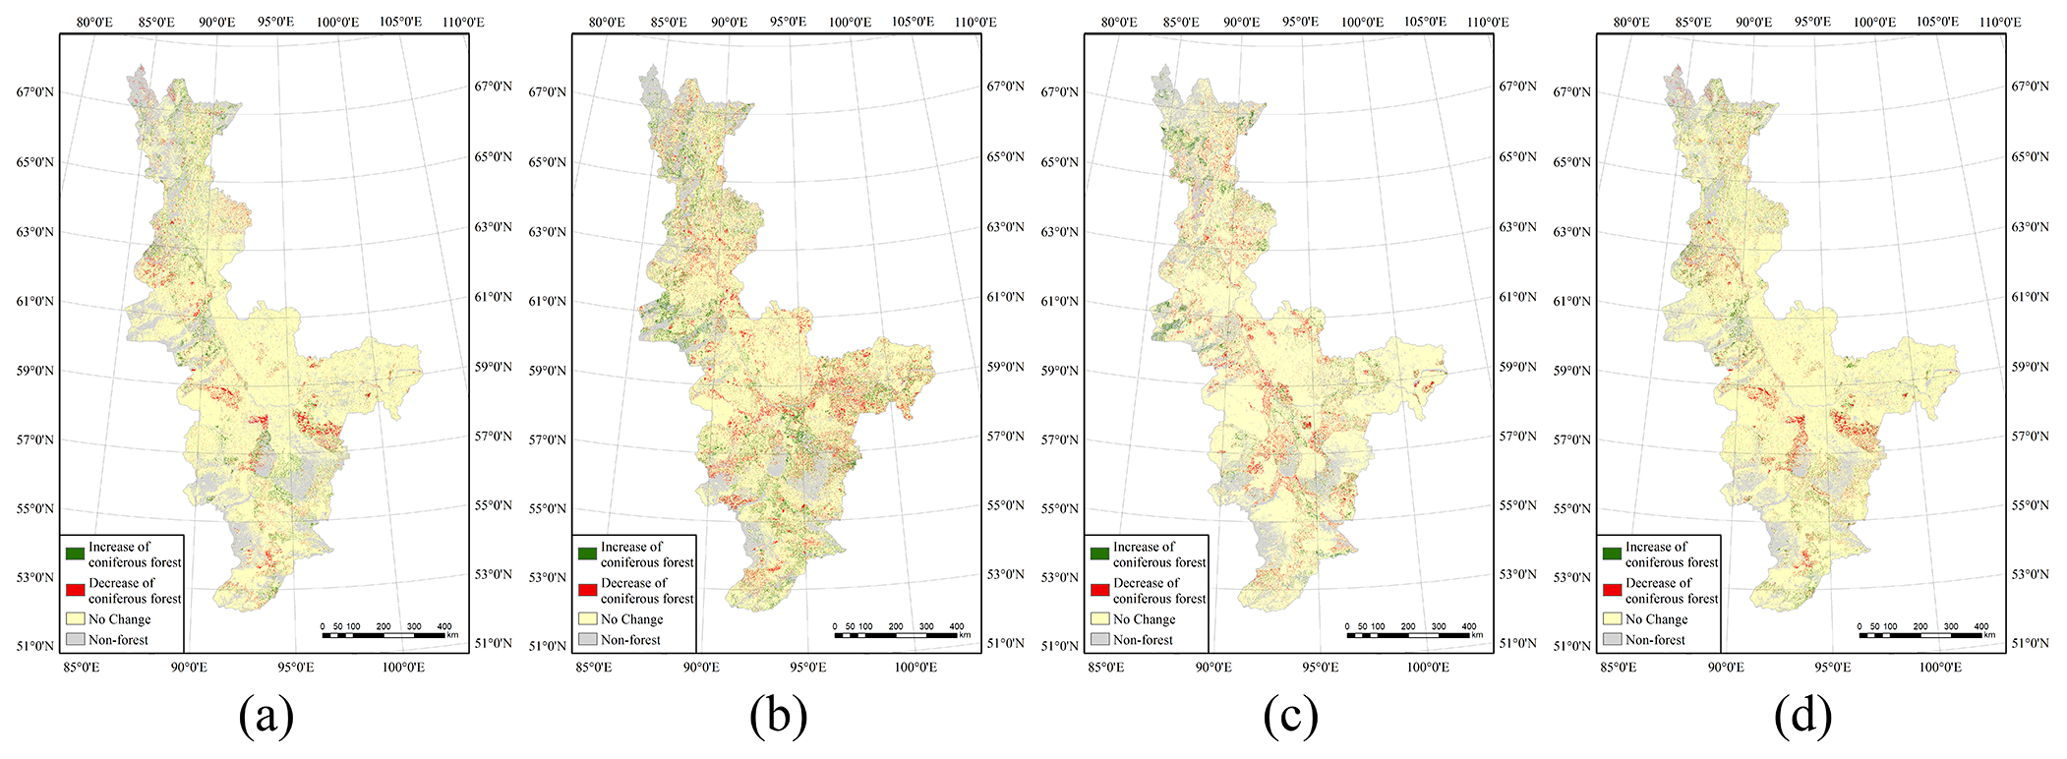
Figure 8Changes in coniferous forest area for (a) 1985–1995, (b) 1995–2005, (c) 2005–2015 and (d) 1985–2015.
The changes in the area of broad-leaved forest exhibit considerable variations with time, especially in the zone from 61–67∘ N, where the increase in the area of broad-leaved forest accelerated over the 3 decades of the study. It can be seen from Fig. 9a that, in the 65–67∘ N zone, ΔRbl reached 1.93 % in the period 2005–2015, whereas it was 1.17 % in 1995–2005 and 0.79 % in 1985–1995. The results for ΔRbf in this zone show similar trends, indicating that broad-leaved forest is highly sensitive to climate change and that the increase in its area has been accelerating. Previous studies have shown that early northward colonization of tundra ecozones may be dominated by black and white spruces, which are often already established at the treeline. Where soil conditions permit (or where they are improving as a result of warming and drying), airborne seeds from birch and aspen are likely to arrive and germinate successfully, gradually leading to a forest with significantly greater deciduous content (Price et al., 2013). However, in the 51–61∘ N and 67–69∘ N zones, the values of ΔRbl, ΔRcl and ΔRbf are relatively stable, which shows that the rate of increase in these forest types did not change much over the period studied. Therefore, the key to the validity of the response of boreal forests to climate change is to determine whether climate warming is driving significant expansion beyond the present-day forest extent or faster stand growth and replacement (Zhu et al., 2013).
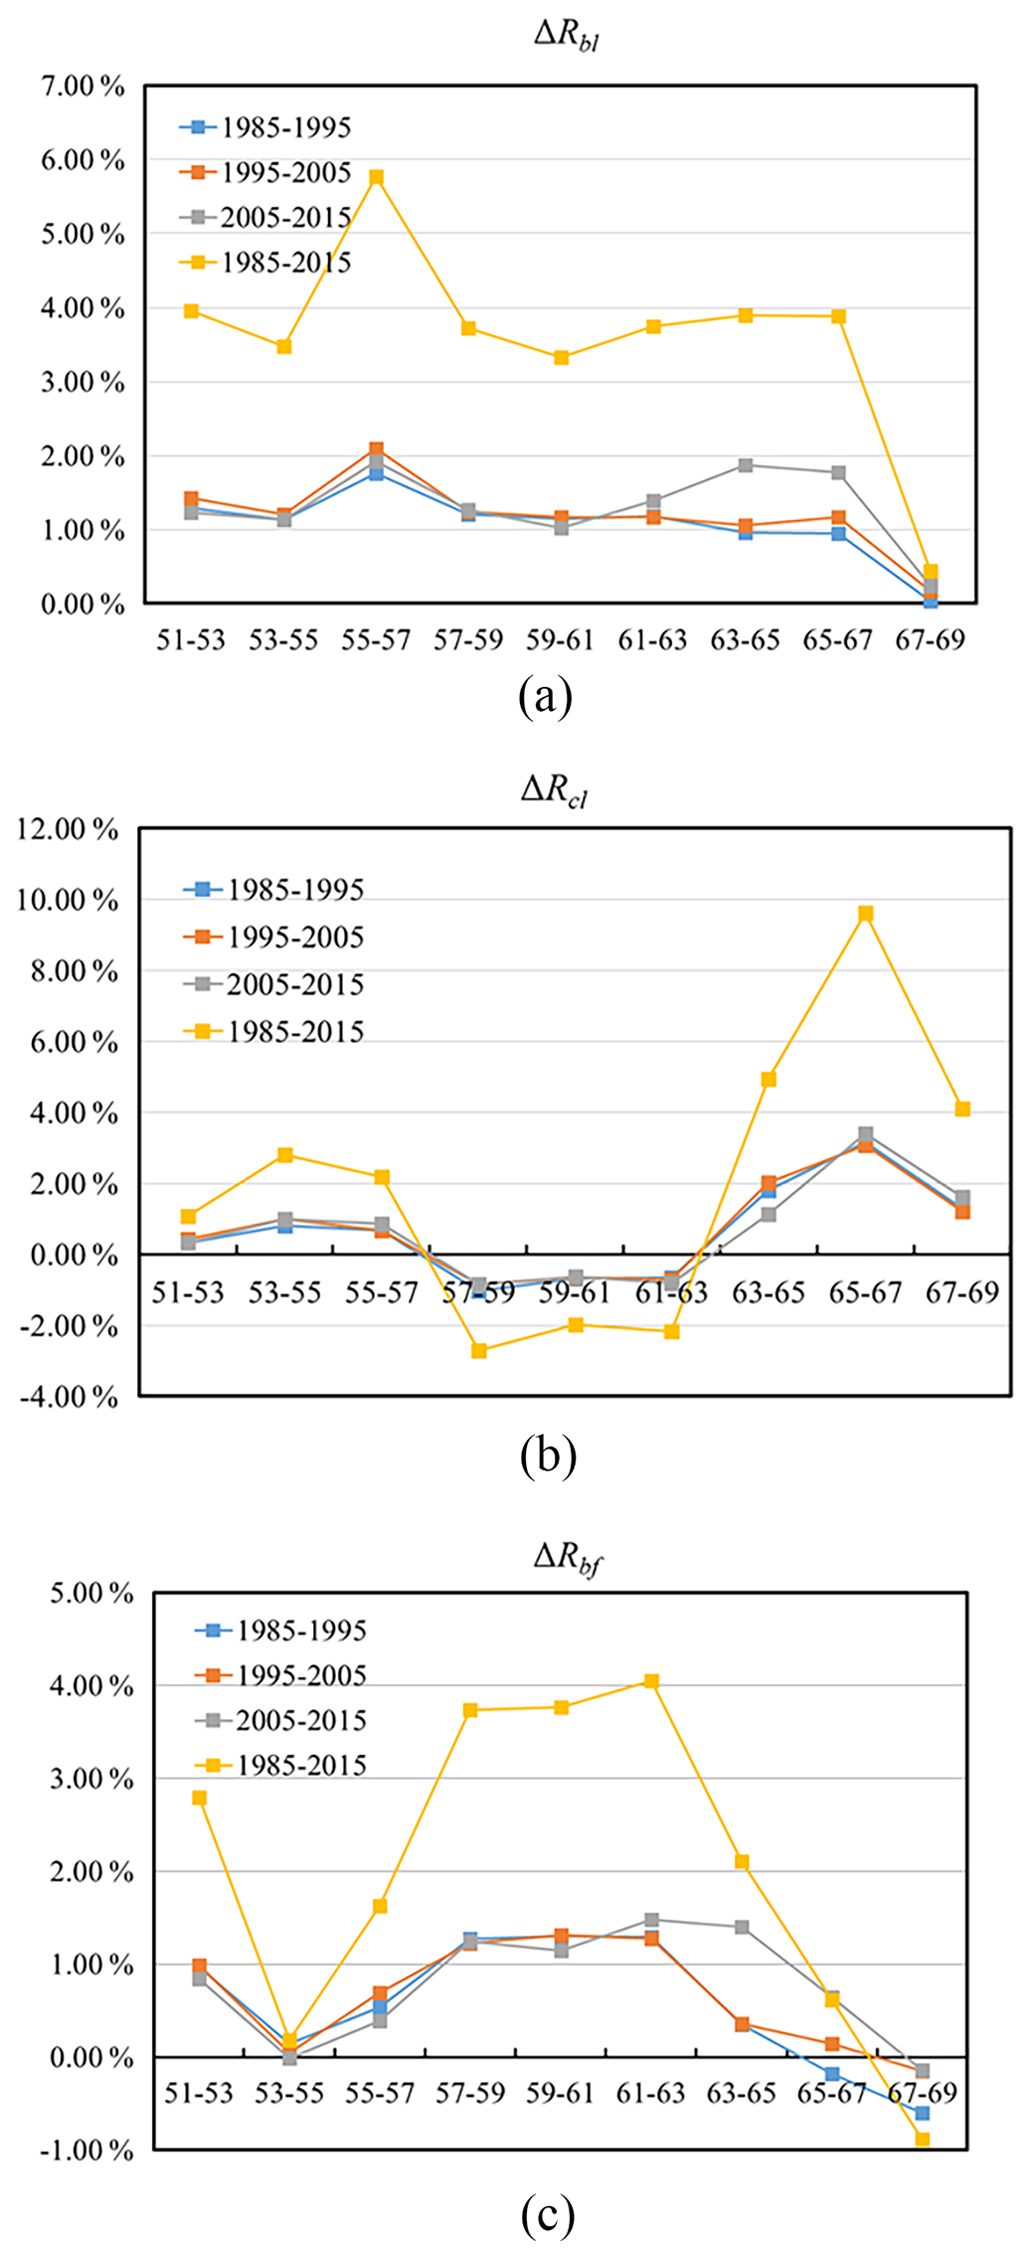
Figure 9Changes in different forest types in different latitude zones: (a) ΔRbl, (b) ΔRcl and (c) ΔRbf.
4.3 Analysis of the influences of climate factors on changes in the boreal forest
Given that the amount of human activity in the study area is limited, it is reasonable to assume that the changes in the forest may be driven mainly by climate variables. Two climate factors, temperature and precipitation, were analyzed to find what was the main driving factor behind these changes. The raster climate data were clipped and resampled. The average temperature and total precipitation for the year 2000 are shown in Fig. 10. It can be seen that, on the whole, both the temperature and precipitation were lower in the high-latitude zone than in the low-latitude zone.
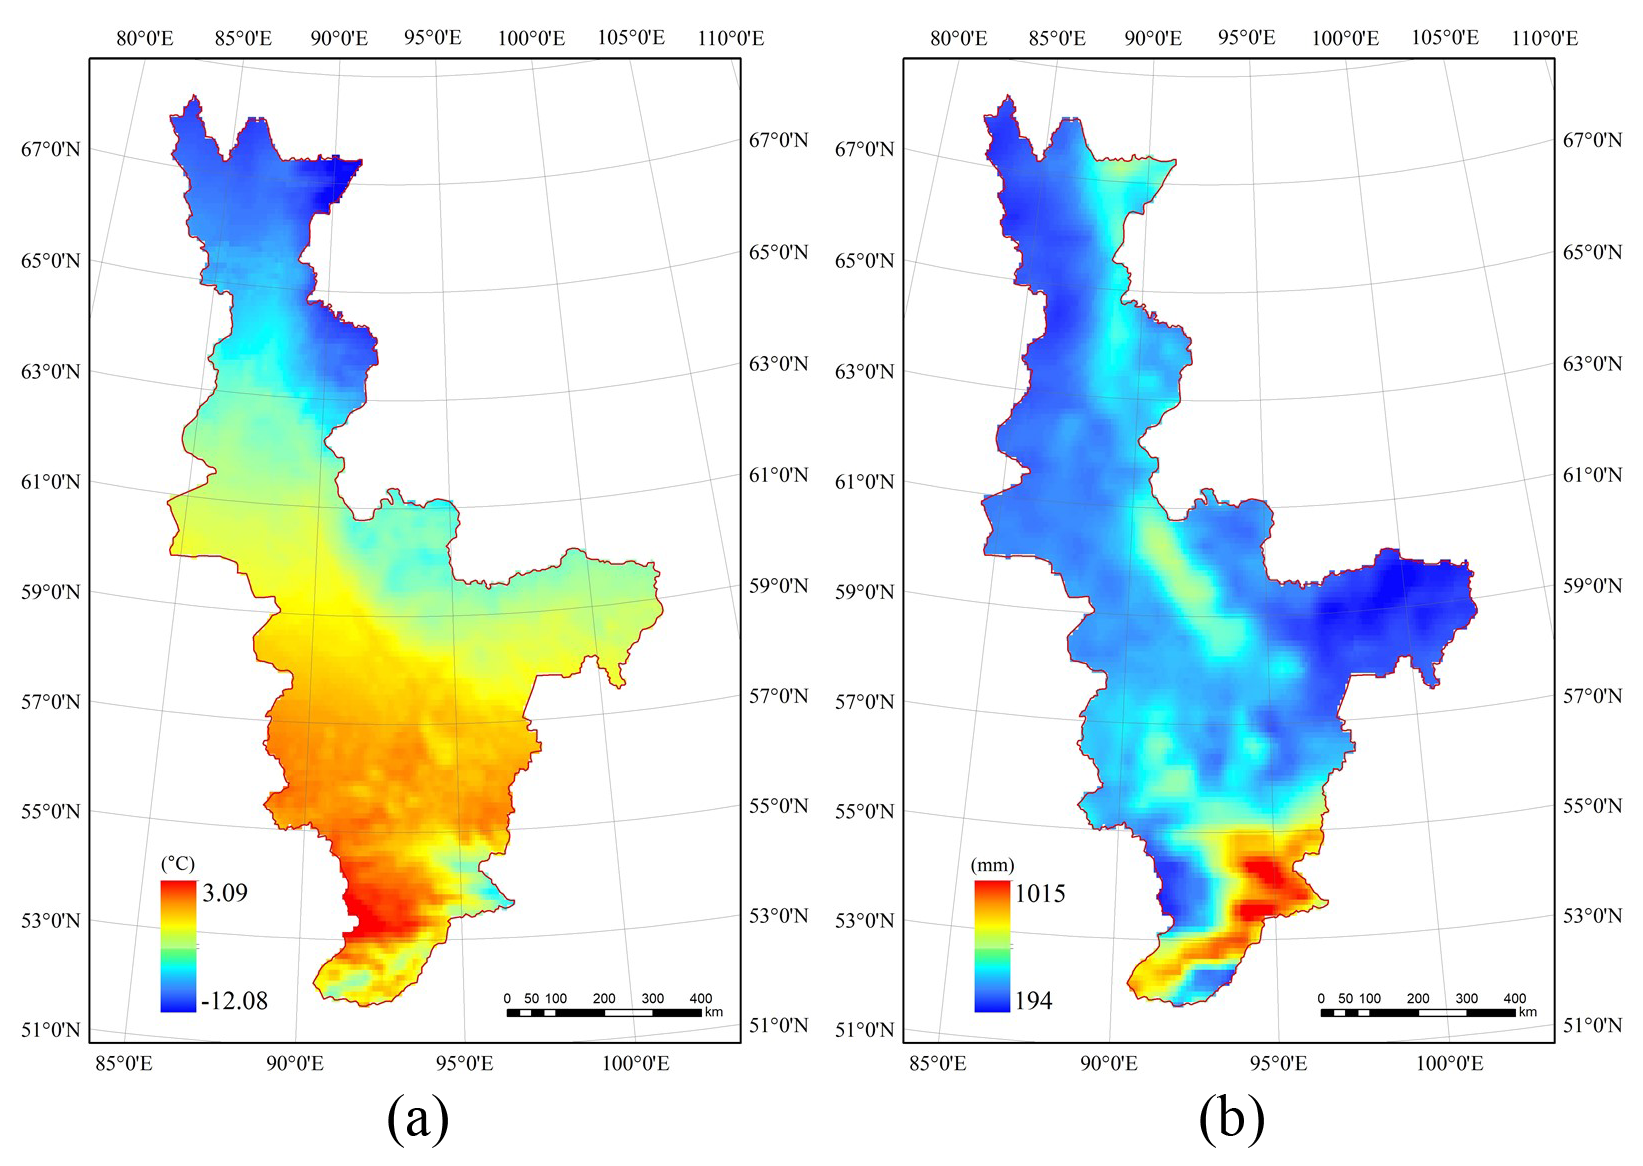
Figure 10(a) Average temperature and (b) total precipitation in the study area for the year 2000.

Figure 11Statistics of temperature and precipitation in study area from 1971 to 2015: (a) average minimum temperature during the growing season, (b) average maximum temperature during the growing season, (c) average temperature during the growing season, (d) average annual temperature, (e) total annual precipitation and (f) total precipitation during the growing season.
Considering the delayed response of the forest to climate change, climate data for the time intervals 5, 10 and 15 years before the forest change were chosen for the influence analysis to determine which the driving interval was. The climate variables used in this study included the average annual temperature (TEM_Year), the growing season temperature (TEM_Grow: the average temperature during the growing season – June to September), the average maximum temperature during the growing season (TEM_Growmax), the average minimum temperature during the growing season (TEM_Growmin), the total annual precipitation (PRE_Year) and the total precipitation during the growing season (PRE_Grow), which have also been used in some previous research (Hou et al., 2020; He, et al., 2020). The statistics of climate variables in the study area from 1971 to 2015 are shown in Fig. 11.
The partial least squares (PLS) regression method was adopted for analyzing the effect of the climate factors on forest cover and changes in forest types. The PLS method is a robust multivariate technique that combines features of principal component analysis and multiple regression (Abdi, 2010); this makes it more parsimonious and statistically robust than principal component regression (Smoliak et al., 2015). Moreover, since the selected climate variables in our study were to some extent interrelated, this could have led to multicollinearity, which occurs whenever an independent variable is highly linearly correlated with one or more other independent variables. PLS regression can effectively deal with the problem of overfitting that results from multicollinearity (Hou et al., 2020). Thus, PLS regression was particularly suitable for application in our case. In addition, the variable importance in projection (VIP) score was used to estimate the importance of each independent variable in the PLS regression – the VIP score represents the statistical contribution of each independent variable to the overall fitted PLS regression model across all latent vectors (Matthes et al., 2015). A higher VIP score for an independent variable indicates that the variable is more important in explaining the volatility of the dependent variable(s), and independent variables with a VIP score greater than 1 are considered significant (Chong and Jun, 2005). The cross-validated R2 value, which is the square of the correlation between the actual and predicted values, is often called Q2 in PLS regression analysis. A PLS component can be kept and is considered statistically significant in the regression model if its Q2 value is greater than or equal to 0.0975 (Abdi, 2010).
Using the PLS–VIP method, VIP scores were calculated for use in the interpretation of the contribution of each climate variable to changes in the forest cover and forest types in the study area. The VIP scores for the six climate variables were ranked in descending order. The independent variable with the highest VIP score was considered to be the most important variable (Hou et al., 2020). To clearly show the effect of each climate variable on the forest cover and forest types for each time interval (5, 10 or 15 years), we also calculated the standardized correlation coefficients (Table 5) and Q2 value for each PLS regression model. The Q2 values for the effect of the climate variables on the forest cover and forest types changes in the PLS regression models for the 5-, 10- and 15-year time intervals were 0.22, 0.21 and 0.20, respectively. This indicates that the climate variables for the 5-year intervals were slightly better correlated with the changes in forest cover and forest types and that they explain the changes in the boreal forest the best. Therefore, a 5-year time interval was selected for subsequent analysis of the response of the forest to climate change.
Table 5The VIP scores of climate variables for different time intervals and their corresponding standardized regression coefficients.

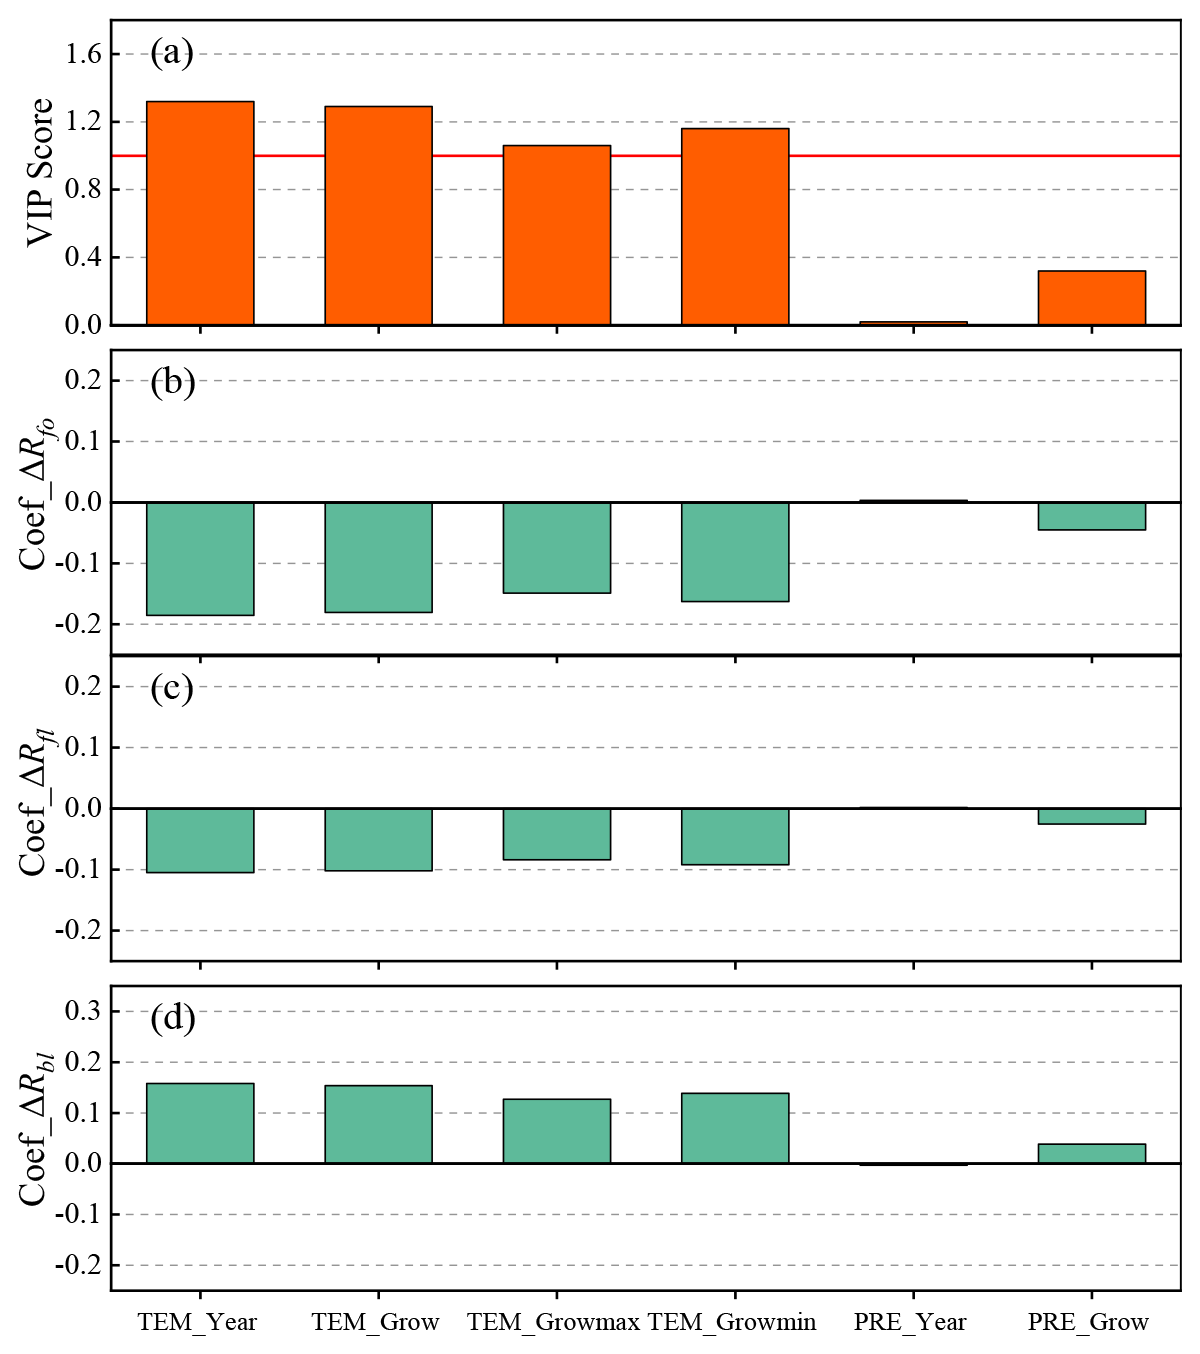
Figure 12Relationship between the forest cover and forest type changes and climate variables for 5-year intervals obtained using PLS regression models: (a) VIP scores; panels (b), (c) and (d) show the corresponding standardized regression coefficients.
Based on the PLS correlation results, we tried to identify the dominant climate variables causing changes in the boreal forest for 5-year intervals. As illustrated in Fig. 12a, TEM_Year is the most significant variable, followed by TEM_Grow, TEM_Growmax and TEM_Growmin. This indicates that temperature is the main climate factor influencing the boreal forest cover. This result is consistent with previous studies which have demonstrated that temperature is the key factor controlling vegetation growth in most areas of the Northern Hemisphere (Chen et al., 2018; Menzel et al., 2006; Wang et al., 2011). According to the regression coefficients, ΔRfo and ΔRfl have negative responses to all the temperature variables although the correlation coefficients vary (Fig. 12b and c). In other words, an increase in temperature leads to a decrease in the total forest coverage. Unexpectedly, precipitation was not found to be a significant variable in terms of boreal forest change (Fig. 12a). This may be because increasing temperatures affect the response of vegetation to other climate variables (e.g., precipitation). For example, since the mid-1990s, the absence of summer precipitation associated with rising temperatures has had a negative impact on the greenness of boreal forests in western central Eurasia (Buermann et al., 2014). It may also be the case that forest growth is not affected by the drought stress caused by insufficient precipitation – however, this depends on the ability of the forest to access soil water and local microsite conditions (Nicolai-Shaw et al., 2017).
In addition, it can be seen from Fig. 12d that ΔRbl responds positively to an increase in temperature, which indicates that broad-leaved forest is sensitive to warming and benefits from higher temperatures. Higher temperature-induced permafrost degradation has severely altered vegetation dynamics in boreal forest areas, notably across the vast areas of northern peatlands and taiga (Price et al., 2013). A warming climate provides more favorable conditions for the growth and regeneration of plants that previously experienced harsh conditions, thus allowing broad-leaved forest species to survive in the cold north of the study area where they were previously unable to grow (Park et al., 2015; Høgda et al., 2013; Salminen and Jalkanen, 2015). This pattern has also been observed in Finland (Kauppi et al., 2014). Moreover, it has been found that the distribution of many forest types is beginning to expand towards the poles, with temperate forests gradually shifting into areas previously covered by boreal forests; the southern parts of these temperate forests will be replaced by subtropical or tropical forests. The northern boundary of temperate forests is also shifting towards the poles (Hirota et al., 2010; Parmesan and Yohe, 2003). Similarly, the effect of precipitation on ΔRbl was found to be insignificant; however, the precipitation variables are not negligible in terms of the response of boreal forests to climate change as this response is a result of the effects of different interrelated climate variables (Hou et al., 2020). Furthermore, warming has a positive effect on ΔRbl, meaning that the observed increase in ΔRbl may be caused by a rise in temperatures. The increased area of broad-leaved forest may be due to broad-leaved forest growing in areas that were previously coniferous or non-forest land – further quantitative investigation into the details of these changes is still needed (Hermosilla et al., 2019). Finally, it can be seen from Fig. 12c and d that ΔRfl and ΔRbl have opposing responses to the climate factors that were investigated, which means that, where the expansion in the total forest cover is limited, the increase in boreal forest may be mainly due to changes in tree species within the forest (see Figs. 7d and 8d). Several recent studies in Canada have also indicated that the response of forest cover to climate warming varies by tree species (McManus et al., 2012; Weijers et al., 2018). Additionally, forest fires and climate are interrelated, and increasing temperatures and potential decreases in precipitation possibly increase the frequency of wildfires in Siberia, which will inevitably result in changes in forest cover and forest type dynamics (Kuaruk et al., 2021). Most importantly, given the projected rate of climate change in the Siberian boreal forest, continued research is necessary to more fully understand how future changes in temperature and precipitation regimes in the boreal region will affect coupled patterns of forest cover and forest type change in this vulnerable, geographically extensive biome.
In this study, changes in the area of the Siberian boreal forest and the forest types in Krasnoyarsk Krai, Russia, were quantified using remote sensing data covering the period 1985 to 2015. The results show that there are differences in the changes that were observed across the study area. Overall, the total forest area increased continuously over the 3 decades of the study, particularly in the high-latitude part of the study area, which may indicate that the boreal forest in this region is the most sensitive to climate change. It was also found that the changes in broad-leaved and coniferous forest differ according to latitude. In the medium-latitude zone between 57 and 63∘ N, the rate of increase in the area of broad-leaved forest was faster than that of coniferous forest, which means that there is a trend towards broad-leaved forest replacing coniferous forest as the dominant tree species in the future.
Overall, it was found that an increase in temperature tends to inhibit the expansion of the forest; however, an increase can promote the growth of broad-leaved forest. The effect of precipitation on the total forest area and types of forest species present was found to be negligible. In addition, the influence of anthropogenic factors may affect the response of the forest to climate change and, to some degree, reduce the effects of climate change. High-spatial-resolution data (e.g., WorldView, GF-2 data) have the potential to provide accurate information about vegetation at a fine scale; however, the use of such data may be limited by the low temporal resolution and the extent of cloud cover over Siberia.
All Landsat Thematic Mapper (TM) and Operational Land Imager (OLI) data for the study area are openly available from the United States Geological Survey (USGS) (http://glovis.usgs.gov/). The climate datasets from ERA5-Land are included in Hersbach et al. (2020) and at https://doi.org/10.1002/qj.3803. The climate datasets from ERA-20CM are included in Hersbach et al. (2015) and at https://doi.org/10.1002/qj.2528.
Conceptualization: WF and LT; methodology: WF and LT; software: LT and YT; validation: LT, YT; formal analysis: ML; writing – original draft preparation: WF and LT; writing – review and editing: WF and LT; funding acquisition: WF; supervision: HG.
The contact author has declared that neither of the authors has any competing interests.
Publisher's note: Copernicus Publications remains neutral with regard to jurisdictional claims in published maps and institutional affiliations.
We would like to thank the editors and anonymous reviewers for their valuable comments.
This work was supported by the Innovative Research Program of the International Research Center of Big Data for Sustainable Development Goals (No. CBAS2022IRP03); the Strategic Priority Research Program of the Chinese Academy of Sciences (XDA19070102); the National Natural Science Foundation of China (No. 61971417) and the Innovation Drive Development Special Project of Guangxi (GuikeAA20302022).
This paper was edited by Daniel Kirk-Davidoff and reviewed by two anonymous referees.
Abdi, H.: Partial least squares regression and projection on latent structure regression (PLS Regression), Wiley Interdiscip. Rev. Comput. Stat., 2, 97–106, https://doi.org/10.1002/wics.51, 2010.
Aitken, S. N., Yeaman, S., Holliday, J. A., Wang, T., and Curtis-McLane, S.: Adaptation, migration or extirpation: climate change outcomes for tree populations, Evol. Appl., 1, 95–111, https://doi.org/10.1111/j.1752-4571.2007.00013.x, 2008.
Alibakhshi, S., Naimi, B., Hovi, A., Crowther, T. W., and Rautiainen, M.: Quantitative analysis of the links between forest structure and land surface albedo on a global scale, Remote Sens. Environ., 246, 1–12, https://doi.org/10.1016/j.rse.2020.111854, 2020.
Allison, S. D. and Treseder, K. K.: Climate change feedbacks to microbial decomposition in boreal soils, Fungal. Ecol., 4, 362–374, https://doi.org/10.1016/j.funeco.2011.01.003, 2011.
Assiri, A.: Anomaly classification using genetic algorithm-based random forest model for network attack detection, Comput. Mater. Contin., 66, 769–778, https://doi.org/10.32604/cmc.2020.013813, 2021.
Balshi, M. S., Mcguire, A. D., Duffy, P., Flannigan, M., Kicklighter, D. W., and Melillo, J.: Vulnerability of carbon storage in North American boreal forests to wildfires during the 21st century, Global Change Biol., 15, 1491–510, https://doi.org/10.1111/j.1365-2486.2009.01877.x, 2009.
Barichivich, J., Briffa, K. R., Myneni, R. B., Osborn, T. J., Melvin, T. M., Ciais, P., Piao, S., and Tucker, C.: Large-scale variations in the vegetation growing season and annual cycle of atmospheric CO2 at high northern latitudes from 1950 to 2011, Global Change Biol., 19, 3167–3183, https://doi.org/10.1111/gcb.12283, 2013.
Brandt, J. P.: The extent of the North American boreal zone, Environ. Rev., 17, 101–161, https://doi.org/10.1139/A09-004, 2009.
Breiman, L.: Random forests, Mach. Learn., 45, 5–32, https://doi.org/10.1016/j.rse.2020.11185410.1023/A:1010933404324, 2001.
Buermann, W., Parida, B., Jung, M., MacDonald, G. M., Tucker, C. J., and Reichstein, M.: Recent shift in Eurasian boreal forest greening response may be associated with warmer and drier summers, Geophys. Res. Lett., 41, 1995–2002, https://doi.org/10.1002/2014GL059450, 2014.
Cha, Y., Ni, S. X., and Yang, S.: An Effective Approach to Automatically Extract Urban Land-use from TM Imagery, Natl. Remote Sens. Bull., 1, 37–40, https://doi.org/10.3321/j.issn:1007-4619.2003.01.007, 2003.
Chen, C., He, B., Guo, L., Zhang, Y., Xie, X., and Chen, Z.: Identifying critical climate periods for vegetation growth in the Northern Hemisphere, J. Geophys. Res.-Biogeo., 123, 2541–2552, https://doi.org/10.1029/2018JG004443, 2018.
Chen, J., Yuan, Z. Y., Peng, J., Chen, L., Huang, H. Z., Zhu, J. W., Liu, Y., and Li, H. F.: DASNet: Dual Attentive Fully Convolutional Siamese Networks for Change Detection in High-Resolution Satellite Images, IEEE J. Stars., 14, 1194–1206, https://doi.org/10.1109/JSTARS.2020.3037893, 2021.
Chong, I. G. and Jun, C. H.: Performance of some variable selection methods when multicollinearity is present, Chemometr. Intell. Lab., 78, 103–112, https://doi.org/10.1016/j.chemolab.2004.12.011, 2005.
Climent, F., Momparler, A., and Carmona, P.: Anticipating bank distress in the Eurozone: An Extreme Gradient Boosting approach, J. Bus. Res., 101, 885–896, https://doi.org/10.1016/j.jbusres.2018.11.015, 2019.
Coops, N. C., Wulder, M. A., Duro, D., Han, T., and Berry, S.: The development of a Canadian dynamic habitat index using multi-temporal satellite estimates of canopy light absorbance, Ecol. Indic., 8, 754–766, https://doi.org/10.1016/j.ecolind.2008.01.007, 2008.
Cutler, D. R., Edwards, J. T. C., Beard, K. H., Cutler, A., Hess, K. T., Gibson, J., and Lawler, J. J.: Random forest for classification in ecology, Ecology, 88, 2783–2792, https://doi.org/10.1890/07--0539.1, 2008.
de Groot, W. J., Flannigan, M. D., and Cantin, A. S.: Climate change impacts on future boreal fire regimes, Forest Ecol. Manage., 294, 35–44, https://doi.org/10.1016/j.foreco.2012.09.027, 2013.
Gong, P., Wang, J., Yu, L., Zhao, Y. C., Zhao, Y. Y., Liang, L., Niu, Z. G., Huang, X. M., Fu, H. H., and Liu, S.: Fine resolution observation and monitoring of global land cover: First mapping results with Landsat TM and ETM+ data, Int. J. Remote Sens., 34, 2607–2654, https://doi.org/10.1080/01431161.2012.748992, 2013.
Hadi, K. L., Hovi, A., Rönnholm, P., and Rautiainen, M.: The accuracy of large-area forest canopy cover estimation using Landsat in boreal region, Int. J. Appl. Earth Obs., 53, 118–127, https://doi.org/10.1016/j.jag.2016.08.009, 2016.
Hamann, A. and Wang, T.: Potential effects of climate change on ecosystem and tree species distribution in British Columbia, Ecology, 87, 2773–2786, https://doi.org/10.1890/0012-9658(2006)87[2773:PEOCCO]2.0.CO;2, 2006.
Harsch, M. A., Hulme, P. E., McGlone, M. S., and Duncan, R. P.: Are treelines advancing?, A global meta-analysis of treeline response to climate warming, Ecol. Lett., 12, 1040–1049, https://doi.org/10.1111/j.1461-0248.2009.01355.x, 2009.
He, Y., Yang, J., and Guo, X.: Green Vegetation Cover Dynamics in a Heterogeneous Grassland: Spectral Unmixing of Landsat Time Series from 1999 to 2014, Remote Sens., 12, 3826, https://https://doi.org/10.3390/rs12223826, 2020.
Heiskanen, J., Rautiainen, M., Stenberg, P., Mõttus, M., Vesanto, V.-H., Korhonen, L., and Majasalmi, T.: Seasonal variation in MODIS LAI for a boreal forest area in Finland, Remote Sens. Environ., 126, 104–115, https://doi.org/10.1016/j.rse.2012.08.001, 2012.
Hersbach, H., Peubey, C., Simmons, A., Berrisford, P., Poli, P., and Dee, D.: ERA-20CM: a twentieth-century atmospheric model ensemble, Q. J. Roy. Meteor. Soc., 141, 2350–2375, https://doi.org/10.1002/qj.2528, 2015.
Hersbach, H., Bell, B., Berrisford, P., Hirahara, S., Horányi, A., Muñoz-Sabater, J., Nicolas, J., Peubey, C., Radu, R., Schepers, D., et al.: The ERA5 global reanalysis, Q. J. Roy. Meteor. Soc., 146, 1999–2049, https://doi.org/10.1002/qj.3803, 2020.
Hermosilla, T., Wulder, M. A., White, J. C., and Coops, N. C.: Prevalence of multiple forest disturbances and impact on vegetation regrowth from interannual Landsat time series (1985–2015), Remote Sens. Environ., 223, 111403, https://doi.org/10.1016/j.rse.2019.111403, 2019.
Hervé, A.: Partial least squares regression and projection on latent structure regression (PLS Regression), Wiley Interdiscip. Rev. Comput. Stat., 2, 97–106, https://doi.org/10.1002/wics.51, 2010.
Hirota, M., Nobre, C., Oyama, M. D., and Bustamante, M. M.: The climatic sensitivity of the forest, savanna and forest-savanna transition in tropical South America, New Phytol., 187, 707–719, https://doi.org/10.2307/40792416, 2010.
Høgda, K. A., Tømmervik, H., and Karlsen, S. R.: Trends in the start of the growing season in Fennoscandia 1982–2011, Remote Sens., 5, 4304–4318, https://doi.org/10.3390/rs5094304, 2013.
Hou, M., Venäläinen, A. K., Wang, L., Pirinen, I. P., Gao, Y., Jin, S., Zhu, Y., Qin, F., and Hu, Y.: Spatio-temporal divergence in the responses of Finland's boreal forests to climate variables, Int. J. Appl. Earth Obs. Geoinfo., 92, 102186, https://doi.org/10.1016/j.jag.2020.102186, 2020.
Hovi, A., Raitio, P., and Rautiainen, M.: A spectral analysis of 25 boreal tree species, Silva Fenn., 51, 7753, https://doi.org/10.14214/sf.7753, 2017.
Jia, K., Liang, S., Zhang, L., Wei, X., Yao, Y., and Xie, X.: Forest cover classification using Landsat ETM+ data and time series MODIS NDVI data, Int. J. Appl. Earth Obs., 33, 32–38, https://doi.org/10.1016/j.jag.2014.04.015, 2014.
Kasischke, E. S. and Turetsky, M. R.: Recent changes in the fire regime across the North American boreal region – spatial and temporal patterns of burning across Canada and Alaska, Geophys. Res. Lett., 33, L09703, https://doi.org/10.1029/2006GL025677, 2006.
Kauppi, P. E., Posch, M., and Pirinen, P.: Large impacts of climatic warming on growth of boreal forests since 1960, Plos One, 9, 1–6, https://doi.org/10.1371/journal.pone.0111340, 2014.
Kharuk, V. I., Ponomarev, E. I., Ivanova, G. A., Dvinskaya, M. L., Coogan, S. C. P., and Flannigan, M. D.: Wildfires in the Siberian taiga, Ambio, 50, 1953–1974, https://doi.org/10.1007/s13280-020-01490-x, 2021.
Li, W., Li, Y., Chen, D., and Chan, J. C.: Thin cloud removal with residual symmetrical concatenation network, ISPRS J. Photogramm. Remote Sens., 153, 137–150, https://doi.org/10.1016/j.isprsjprs.2019.05.003, 2019.
Liu, Q., Gao, X., He, L., and Lu, W.: Haze removal for a single visible remote sensing image, Signal Process., 137, 33–43, https://doi.org/10.1016/j.sigpro.2017.01.036, 2017.
Lewis, M.: Spectral characterization of Australian arid zone plants, Can. J. Remote Sens., 28, 219–230, https://doi.org/10.5589/m02-023, 2002.
Loarie, S. R., Duffy, P. B., Hamilton, H., Asner, G. P., Field, C. B., and Ackerly, D. D.: The velocity of climate change, Nature, 462, 1052–1055, https://doi.org/10.1038/nature08649, 2009.
Ma, X. P., Bai, H. Y., Deng, C. H., and Wu, T.: Sensitivity of Vegetation on Alpine and Subalpine Timberline in Qinling Mountains to Temperature Change, Forests, 10, 1105, https://doi.org/10.3390/f10121105, 2019.
Matasci, G., Hermosill, T., Wulder, M. A., White, J. C., Coops, N. C., Hobart, G. W., and Zald, H. S. J.: Large-area mapping of Canadian boreal forest cover, height, biomass and other structural attributes using Landsat composites and lidar plots, Remote Sens. Environ., 209, 90–106, https://doi.org/10.1016/j.rse.2017.12.020, 2018.
Matthes, J. H., Knox, S. H., Sturtevant, C., Sonnentag, O., Verfaillie, J., and Baldocchi, D.: Predicting landscape-scale CO2 flux at a pasture and rice paddy with long-term hyperspectral canopy reflectance measurements, Biogeosciences, 12, 4577–4594, https://doi.org/10.5194/bg-12-4577-2015, 2015.
McKenney, D. W., Pedlar, J. H., Lawrence, K., Campbell, K., and Hutchinson, M. F.: Potential impacts of climate change on the distribution of North American trees, BioScience, 57, 939–948, https://doi.org/10.1641/B571106, 2007.
McLachlan, J. S., Clark, J. S., and Manos, P. S.: Molecular indicators of tree migration capacity under rapid climate change, Ecology, 86, 2088–2098, https://doi.org/10.1890/04-1036, 2005.
McManus, K. M., Morton, D. C., Masek, J. G., Wang, D., Sexton, J. O., Nagol, J. R., Ropars, P., and Boudreau, S.: Satellite-based evidence for shrub and graminoid tundra expansion in northern Quebec from 1986 to 2010, Global Change Biol., 18, 2313–2323, https://doi.org/10.1111/j.1365-2486.2012.02708.x, 2012.
Menzel, A., Sparks, T. H., Estrella, N., Koch, E., Aasa, A., Ahas, R., Alm-Kübler, K., Bissolli, P., Braslavská, O. G., Briede, A., Chmielewski, F. M., Crepinsek, Z., Curnel, Y., Dahl, Å., Defila, C., Donnelly, A., Filella, Y., Jatczak, K., Måge, F., Mestre, A., Nordli, Ø., Peñuelas, J., Pirinen, P., Remišová, V., Scheifinger, H., Striz, M., Susnik, A., Van Vliet, A. J. H., Wielgolaski, F.-E., Zach, S., and Zust, A.: European phenological response to climate change matches the warming pattern, Glob. Chang. Biol., 12, 1969–1970, https://doi.org/10.1111/j.1365-2486.2006.01193.x, 2006.
Michael, J. C., Brittany, G. J., Kristina, J. B., and Tara, W. H.: Forests of the future: Climate change impacts and implications for carbon storage in the Pacific Northwest, USA, Forest Ecol. Manag., 482, 118886, https://doi.org/10.1016/j.foreco.2020.118886, 2021.
Mitchell, T. D. and Jones, P. D. An improved method of constructing a database of monthly climate observations and associated high-resolution grids, Int. J. Climatol., 25, 693–712, https://doi.org/10.1002/joc.1181, 2005.
Nelson, T. A., Coops, N. C., Wulder, M. A., Perez, L., Fitterer, J., Powers, R., and Fontana, F.: Predicting climate change impacts to the Canadian boreal forest, Diversity, 6, 133–157, https://doi.org/10.3390/d6010133, 2014.
Nemani, R. R., Keeling, C. D., Hashimoto, H., Jolly, W. M., Piper, S. C., Tucker, C. J., Myneni, R. B., and Running, S. W.: Climate-driven increases in global terrestrial net primary production from 1982 to 1999, Science, 300, 1560–1563, https://doi.org/10.1126/science.1082750, 2003.
Nicolai-Shaw, N., Zscheischler, J., Hirschi, M., Gudmundsson, L., and Seneviratne, S. I.: A drought event composite analysis using satellite remote-sensing based soil moisture, Remote Sens. Environ., 203, 216–225, https://doi.org/10.1016/j.rse.2017.06.014, 2017.
Olson, D. M., Dinerstein, E., Wikramanayake, E. D., Burgess, N. D., Powell, G. V. N., and Underwood, E. C.: Terrestrial ecoregions of the world: a new map of life on Earth, BioScience, 51, 933–938, https://doi.org/10.1641/0006-3568(2001)051[0933:TEOTWA]2.0.CO;2, 2001.
Park, H., Jeong, S. J., Ho, C. H., Kim, J., Brown, M. E., and Schaepman, M. E.: Nonlinear response of vegetation green-up to local temperature variations in temperate and boreal forests in the northern hemisphere, Remote Sens. Environ., 165, 100–108, https://doi.org/10.1016/j.rse.2015.04.030, 2015.
Parmesan, C. and Yohe, G.: A globally coherent fingerprint of climate change impacts across natural systems, Nature, 421, 37–42, https://doi.org/10.1038/nature01286, 2003.
Piao, S., Ciais, P., Friedlingstein, P., Peylin P., Reichstein, M., Luyssaert, S., Margolis, H., Fang, J., Barr, A., Chen, A., Grelle, A., Hollinger, D., Laurila, T., Lindroth, A., Richardson, A., and Vesala, T.: Net carbon dioxide losses of northern ecosystems in response to autumn warming, Nature, 451, 49–52, https://doi.org/10.1038/nature06444, 2008.
Pontius, R. G. and Millones, M.: Death to Kappa: Birth of quantity disagreement and allocation disagreement for accuracy assessment, Int. J. Remote Sens., 32, 4407–4429, https://doi.org/10.1080/01431161.2011.552923, 2011.
Price, D. T., Alfaro, R. I., Brown, K. J., Flannigan, M., Fleming, R. A., Hogg, E. H., Girardin, M. P., Lakusta, T., Johnston, M., McKenney, D., Pedlar, J. H., Stratton, T., Sturrock, R. N., Thompson, I. D., Trofymow, J. A., and Venier, L.: Anticipating the consequences of climate change for Cananda's boreal forest ecosystems, Environ. Rev., 21, 322–365, https://doi.org/10.1139/er-2013-0042, 2013.
Qin, Y., Xiao, X., Dong, J., Zhang, G., Shimada, M., and Liu, J.: Forest cover maps of china in 2010 from multiple approaches and data sources: PALSAR, Landsat, MODIS, FRA, and NFI, ISPRS J. Photogramm. Remote Sens., 109, 1–16, https://doi.org/10.1016/j.isprsjprs.2015.08.010, 2015.
Ratcliffe, J. L., Creevy, A., Andersen, R., Zarov, E., Gaffney, P. P. J., Taggart, M. A., Mazei, Y., Tsyganov, A. N., Rowson, J. G., Lapshina, E. D., and Payne, R. J.: Ecological and environmental transition across the forested-to-open bog ecotone in a west Siberian peatland, Sci. Total Environ., 607, 816–828, https://doi.org/10.1016/j.scitotenv.2017.06.276, 2017.
Rodriguez-Galiano, V. F., Ghimire, B., Rogan, J., Chica-Olmo, M., and Rigol-Sanchez, J. P.: An assessment of the effectiveness of a random forest classifier for land-cover classification, ISPRS J. Photogramm. Remote Sens., 67, 93–104, https://doi.org/10.1016/j.isprsjprs.2011.11.002, 2012.
Salminen, H. and Jalkanen, R.: Modelling of bud break of Scots pine in northern Finland in 1908–2014, Front. Plant Sci., 6, 1–7, https://doi.org/10.3389/fpls.2015.00104, 2015.
Serreze, M. C., Walsh, J. E., Chapin, F. S., Osterkamp, T., Dyurgerov, M., Romanovsky, V., Oechel, W.C., Morison, J., Zhang, T., and Barry, R. G.: Observational evidence of recent change in the northern high-latitude environment, Clim. Change, 46, 159–207, https://doi.org/10.1023/A:1005504031923, 2000.
Shuman, J. K., Shugart, H. H., and O'Halloran, T. L.: Sensitivity of Siberian larch forests to climate change, Global Change Biol., 17, 2370–2384, https://doi.org/10.1111/j.1365-2486.2011.02417.x, 2011.
Smoliak, B. V., Wallace, J. M., Lin, P., and Fu, Q.: Dynamical adjustment of the northern hemisphere surface air temperature Field: methodology and application to observations, J. Climate, 28, 1613–1629, https://doi.org/10.1175/JCLI-D-14-00111.1, 2015.
Soja, A. J., Tchebakova, N. M., French, N. H. F., Flannigan, M. D., Shugart, H. H., Stocks, B. J., Sukhinin, A. I., Perfenova, E. I., Chapin, F. S., and Stackhouse, P. W.: Climate-induced boreal forest change: Predictions versus current observations, Global Planet. Change, 56, 274–296, https://doi.org/10.1016/j.gloplacha.2006.07.028, 2007.
Strobl, C., Boulesteix, A. L., Zeileis, A., and Hothorn, T.: Bias in random forest variable importance measures: Illustrations, sources and a solution, BMC Bioinform., 8, 25, https://doi.org/10.1186/1471-2105-8-25, 2007.
Sulla-Menashe, D., Woodcock, C., and Friedl, M.: Canadian boreal forest greening and browning trends: an analysis of biogeographic patterns and the relative roles of disturbance versus climate drivers, Environ. Res. Lett., 13, 014007, https://doi.org/10.1088/1748-9326/aa9b8, 2018.
Svetnik, V., Liaw, A., Tong, C., Culberson, J. C., Sheridan, R. P., and Feuston, B. P.: Random forest: A classification and regression tool for compound classification and QSAR modeling, J. Chem. Inf. Comput. Sci., 43, 1974–1958, https://doi.org/10.1021/ci034160g, 2003.
Tian, L. and Fu, W.: Bi-Temporal Analysis of Spatial Changes of Boreal Forest Cover and Species in Siberia for the Years 1985 and 2015, Remote Sens., 12, 4116, https://doi.org/10.3390/rs12244116, 2020.
Townshend, J. R., Masek, J. G., Huang, C. Q., Vermote, E. F., Gao, F., Channan, S., Sexton, J. O., Feng, M., Narasimhan, R., Kim, D., Song, K., Song, D. X., Song, X. P., Noojipady, P., Tan, B., Hansen, M. C., Li, M. X., and Wolfe, R. E.: Global characterization andmonitoring of forest cover using Landsat data: opportunities and challenges, Int. J. Digit. Earth, 5, 373–397, https://doi.org/10.1080/17538947.2012.713190, 2012.
Veraverbeke, S., Rogers, B., Goulden, M., Jandt, R., Miller, C., Wiggins, E., and Randerson, J.: Lightning as a major driver of recent large fire years in North American boreal forests, Nat. Clim. Change, 7, 529–534, https://doi.org/10.1038/nclimate3329, 2017.
Walther, G. R., Post, E., Convey, P., Menzel, A., Parmesan, C., Beebee, T. J. C., Fromentin, J.-M., Hoegh-Guldberg, O., and Bairlein, F.: Ecological responses to recent climate change, Nature, 416, 389–395, https://doi.org/10.1038/416389a, 2002.
Wang, X. H., Piao, S. L., Ciais, P., Li, J. S., Friedlingstein, P., Koven, C., and Chen, A. P.: Spring temperature change and its implication in the change of vegetation growth in North America from 1982 to 2006, P. Natl. Acad. Sci. USA, 108, 1240–1245, https://doi.org/10.1073/pnas.1014425108, 2011.
Weijers, S., Pape, R., Löffler, J., and Myers-Smith, I. H.: Contrasting shrub species respond to early summer temperatures leading to correspondence of shrub growth patterns, Environ. Res. Lett., 13, 1–11, https://doi.org/10.1088/1748-9326/aaa5b8, 2018.
White, J., Wulder, M., Hermosilla, T., Coops, N., and Hobart, G.: A nationwide annual characterization of 25 years of forest disturbance and recovery for Canada using Landsat time series, Remote Sens. Environ., 194, 303–321, https://doi.org/10.1016/j.rse.2017.03.035, 2017.
Zhang, Y., Guindon, B., and Cihlar, J.: An image transform to characterize and compensate for spatial variations in thin cloud contamination of Landsat images, Remote Sens. Environ., 82, 173–187, https://doi.org/10.1016/S0034-4257(02)00034-2, 2002.
Zhu, K., Woodall, C. W., and Clark, J. S.: Failure to migrate: lack of tree range expansion in response to climate change, Global Change Biol., 18, 1042–1052, https://doi.org/10.1111/j.1365-2486.2011.02571.x, 2012.
Zhu, K., Woodall, C. W., Ghosh, S., Gelfand, A. E., and Clark, J. S.: Dual impacts of climate change: forest migration and turnover through life history, Global Change Biol., 20, 251–264, https://doi.org/10.1111/gcb.12382, 2013.