the Creative Commons Attribution 4.0 License.
the Creative Commons Attribution 4.0 License.
 | 01 Apr 2022
Evaluation of convection-permitting extreme precipitation simulations for the south of France
Linh N. Luu
Robert Vautard
Pascal Yiou
Jean-Michel Soubeyroux
In the autumn, the French Mediterranean area is frequently exposed to heavy precipitation events whose daily accumulation can exceed 300 mm. One of the key processes contributing to these precipitation amounts is deep convection, which can be explicitly resolved by state-of-the-art convection-permitting models to reproduce heavy rainfall events that are comparable to observations. This approach has been tested and performed at climate scale in several studies in recent decades for different areas. In this research, we investigate the added value of using an ensemble of three climate simulations at convection-permitting resolution (approx. 3 km) to replicate extreme precipitation events at both daily and shorter timescales over the south of France. These three convection-permitting simulations are performed with the Weather Research and Forecasting (WRF) Model. They are forced by three EURO-CORDEX simulations, which are also run with WRF at the resolution of 0.11∘ (approx. 12 km). We found that a convection-permitting approach provides a more realistic representation of extreme daily and 3-hourly rainfall in comparison with EURO-CORDEX simulations. Their similarity to observations allows use for climate change studies and its impacts.
- Article
(11247 KB) - Full-text XML
-
Supplement
(3499 KB) - BibTeX
- EndNote


Deep convection is a key atmospheric process leading to heavy rainfall in a short duration that can generate floods and infrastructure destruction with a large impact on societies. This process has close interactions with other physical and microphysical processes as well as large-scale and local dynamics of the atmosphere. However, deep convection processes have been parameterized in simulations at climate scale (i.e. more than 10 years) for a long period of time. Parameterization methods based on statistical properties of convection processes within a grid box and their interactions with prognostic variables have been designed to represent this process at local scale (Kendon et al., 2012). This procedure brings large uncertainty to the results of climate models, including biases of rainfall characteristics such as the underestimation of short-duration extreme rainfall (Lenderink and Van Meijgaard, 2008; Hohenegger et al., 2008; Prein et al., 2013; Fosser et al., 2015; Kendon et al., 2019). Thanks to the rapid development of technology and computer power, a prominently emerging way that has been used in the recent 2 decades to explicitly resolve deep convection and avoid the application of convective parameterization schemes is to increase horizontal resolution to convection-permitting resolution (i.e. less than 4 km). Convection-permitting models hold promises of representing central processes in the climate system and could make a step change in climate projections as they better represent impactful precipitation extremes. There is also a hope that they could remove important biases if employed at global scale (Palmer and Stevens, 2019). However, this approach requires solving a trade-off between conducting several runs to generate large ensembles of simulations with a sufficient resolution (e.g. for the impact of an extreme event or attribution studies) and saving the expense of computing resources (Giorgi and Mearns, 1999; Trenberth, 2008).
Several simulations at convection-permitting resolutions were conducted for different regions and periods of time to examine the added value of this approach in reproducing precipitation (Prein et al., 2015). Regional models have been used to dynamically downscale the output of global models (e.g. CMIP5; Taylor et al., 2012) or reanalysis data (e.g. ERA-Interim; Dee et al., 2011) to these convection-permitting resolutions. Generally, the simulated rainfall from those models has better agreement with observations compared to those using convective parameterization schemes, especially in terms of temporal and spatial distributions of extreme rainfall events from sub-daily to daily timescales (Kendon et al., 2012; Prein et al., 2013; Chan et al., 2013, 2014; Ban et al., 2014; Fosser et al., 2015; Ban et al., 2020; Knist et al., 2018; Hodnebrog et al., 2019; Armon et al., 2020; Vergara-Temprado et al., 2021). Additionally, the diurnal cycle of precipitation is also better represented in this cloud-resolving model (Prein et al., 2013; Langhans et al., 2013; Ban et al., 2014; Fosser et al., 2015; Knist et al., 2018; Scaff et al., 2019). The increase in extreme hourly rainfall at a super adiabatic rate (e.g. around 14 % per ∘C) when scaling with temperature in observation analyses is also reproduced in convection-permitting simulations for a few areas (Ban et al., 2014; Knist et al., 2018). Convection-permitting models can also reduce the “drizzle problem” found in many lower-resolution simulations, which is characterized by frequent and persistent light rainfall events (Kendon et al., 2012; Fosser et al., 2015; Berthou et al., 2020; Lind et al., 2020). Scaff et al. (2019) additionally showed that the timing of the peak of convection was better recreated by such very high resolutions. Given the added value of convection-permitting models in reproducing extreme precipitation events, a few studies used this approach for future projection of this variable with more confidence, especially in short-duration events (Adinolfi et al., 2021; Vanden Broucke et al., 2019; Chan et al., 2020; Hodnebrog et al., 2019; Kendon et al., 2017, 2019; Pichelli et al., 2021).
The improvement in reproducing heavy precipitation events of the convection-permitting approach over parameterization methods comes from the higher resolution itself, the better representation of surface properties and complex topography (e.g. steep mountainous region), the explicit solving of convection processes at local scale and interaction with large-scale circulation, and better solving of atmospheric dynamics (Feng et al., 2018; Prein et al., 2013, 2015). Despite those enhancements, systematic errors are inevitable because of the use of other parameterization schemes and discrete numerical methods as well as the fact that convection (both deep and shallow) is not completely resolved at the grid spacing of 1 to 3 km (Vanden Broucke et al., 2019). For instance, a convection-permitting model could overestimate or underestimate heavy rainfall, prolong the duration of light rainfall, provide more extreme precipitation events than observations, and fail in simulating the location of the heaviest rainfall events (Chan et al., 2013, 2014; Fosser et al., 2015; Armon et al., 2020; Fumière et al., 2020; Vanden Broucke et al., 2019).
The coastal regions along the Mediterranean frequently undergo very heavy precipitation events (e.g. hundreds of millimetres per day) in the autumn, which subsequently lead to flash floods and landslides, causing massive losses and damage (Delrieu et al., 2005; Fresnay et al., 2012; Llasat et al., 2013; Nuissier et al., 2008; Ricard et al., 2012). In addition, this area is considered a hotspot of climate change that strongly responds to warming at global scale (Giorgi, 2006; Tuel and Eltahir, 2020). As a result, the Mediterranean has received increasing scientific interest in investigating the mechanisms leading to flood-inducing heavy precipitation as well as in improving model ability to predict and project those events in a complex changing climate that provides substantial support to adaptation and mitigation for society (Drobinski et al., 2014; Ducrocq et al., 2014). The convection-permitting approach has been recently used to reproduce and obtain insights into extreme precipitation events in this area. Armon et al. (2020) showed that the convection-permitting model can reproduce the structure and location of 95 % of 41 observed heavy precipitations events in the eastern Mediterranean and consequently suggested using this approach for a long simulation. Zittis et al. (2017) found that the convection-permitting model outperformed the convection parameterization approach for extreme rainfall events over the eastern Mediterranean. Fumière et al. (2020) used a convection-permitting model to downscale the ERA-Interim reanalysis and proved that this high resolution improved the simulations of intensity and location of daily and sub-daily extreme precipitation. These results were confirmed over the area in a longer climate-scale simulation by Caillaud et al. (2021). Berthou et al. (2020) also showed improvement of the convection-permitting model in reproducing daily heavy precipitation events in the autumn over the Mediterranean coasts at climate scale. Meredith et al. (2020) found that the convection-permitting model can improve sub-hourly intense precipitation. Coppola et al. (2020a) used, for the first time, a multi-model approach with convection-permitting resolution to simulate a few case studies of heavy rainfall events over the European Mediterranean areas. They showed that each convection-permitting model can reproduce the case studies. However, the results among models spread when the event was convective and less constrained by large-scale dynamics. This multi-model approach was then applied at climate scale with reanalysis forcing (Ban et al., 2021) and with CMIP5 forcing (Pichelli et al., 2021), which both found improvement in convective precipitation outcomes. These results highlighted the importance of using a multi-model approach to investigate convective precipitation events and stimulate the use of this approach in climate change impact studies.
The assessment of long convection-permitting simulations requires further attention, in particular for the dynamical downscaling of global climate models used for projections of future scenarios. This article is designed to evaluate the skills of a unique regional climate model with a convection-permitting set-up to simulate extreme hourly and daily precipitation in a region prone to such convective events in the Mediterranean area (Nuissier et al., 2008). The analysis made here is at a climate scale and is done by dynamically downscaling the climate information provided by the existing EURO-CORDEX experiments (Jacob et al., 2014; Kotlarski et al., 2014; Coppola et al., 2020b; Vautard et al., 2020). The assessment is not made at the event or process levels but uses long simulations to evaluate whether the statistical properties (intensity, duration) of events are comparable to observations. The area under consideration in this article is the Cévennes mountain range, a part of the Massif Central in the south of France (Fig. 1), where extreme precipitation events are most intense in France (Vautard et al., 2015). The experimental design of these runs, reference datasets, and evaluation methods are presented in Sect. 2. The evaluation and discussion are given in Sect. 3. The last section presents the conclusion. We also provide a Supplement in which a few simulations with convection-permitting configuration driven by ERA-Interim are tested to select an appropriate domain.
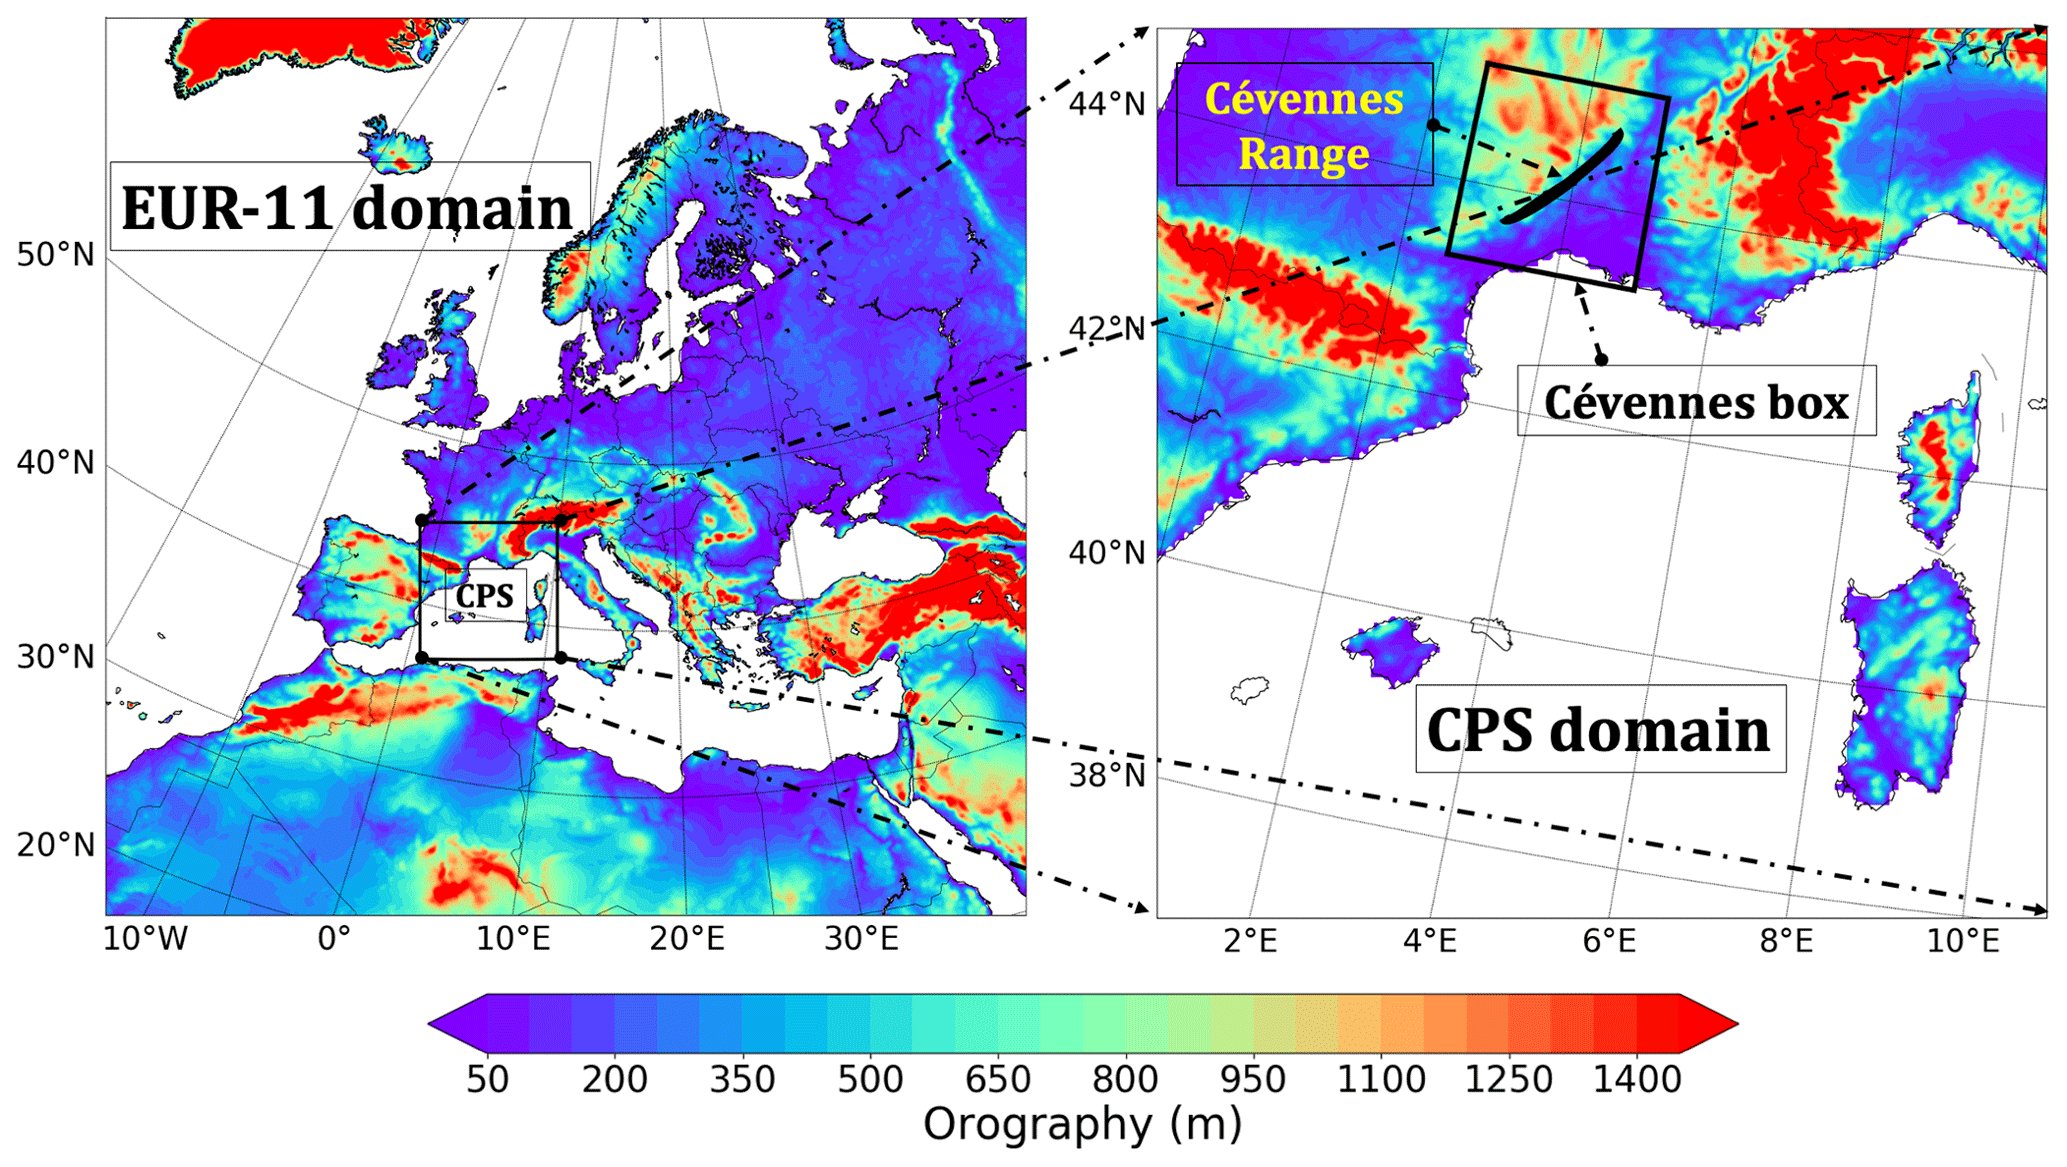
Figure 1The domains of EURO-CORDEX and convection-permitting simulations. The shading colours denote the surface height above mean sea level from WRF.
2.1 Experimental design
In this study, the Weather Research and Forecasting Model (WRF-ARW) version 3.8.1 is used to conduct several long simulations at convection-permitting resolution (0.0275∘, approx. 3 km) for the French Mediterranean region. These simulations are forced by the three different EURO-CORDEX (0.11∘, approx. 12 km, hereafter mentioned as EUR-11) simulations without nudging, for which outputs are available every 3 h. These EUR-11 simulations were also done with WRF-ARW version 3.8.1 and driven by three global climate models (GCMs) including IPSL-CM5A-MR, HADGEM2-ES, and NORESM1-M (see Vautard et al., 2020, for details about the new EURO-CORDEX ensemble). Each convection-permitting simulation (hereafter mentioned as CPS) is conducted for two different periods including 1951–1980 and 2001–2030 with the RCP8.5 scenario for the year after 2005. These two periods are chosen with a gap period (1981–2000) rather than a seamless one in order to perform an extreme event attribution study, which will be presented in another article and needs a maximal time distance between two periods (“current climate” and “past climate”).
The seasonal target of these downscaling experiments is the autumn when heavy rainfall events occur frequently over the Cévennes in the south of France. Hence, we initialize each autumn on 26 August and end the season on 1 December, as extreme precipitation events in the Mediterranean coastal areas do not generally occur outside this period and years can be considered independent from each other. Only a few days at the end of August are spent as spin-up time for the model to obtain physical consistency among prognosis variables after being interpolated from 12 to 3 km in the preparation step, given that EUR-11 and CPS share the same regional model (i.e. WRFv3.8.1). Another factor that could take a long spin-up time (up to 10 years) in climate simulation is soil moisture, especially the deep layer (Yang et al., 2011). Here, we facilitate our downscaling strategy (i.e. re-initializing the model every August) by interpolating the spun-up soil moisture (and temperature) in EUR-11 results for the initialization of each season run of the CPS. Even though the imbalance of soil moisture is inevitable by doing so, this procedure is expected to minimize, to some extent, the perturbation in the land surface model of WRF.
The spatial configuration contains 301×301 grid points covering the Cévennes mountain range, a large part of the French Mediterranean region including Corsica (Fig. 1). The size and position of the CPS domain are selected after evaluating four different configurations for simulations of the autumn 2014 driven by the ERA-Interim reanalysis (see the Supplement). We use the same number of hybrid sigma vertical levels of 32 as the EUR-11 boundary conditions. The time step of our simulations is 15 s, which is a fourth of the time step used in the EUR-11 (i.e. similar ratio as for resolutions). We adapt the same rotated map projection of EUR-11 simulations to these CPS experiments. A similar set of physics schemes as in EUR-11 simulations is used for these downscaling experiments. Those parameterization schemes incorporate the Thompson microphysics scheme (Thompson et al., 2008), the Rapid Radiative Transfer Model for GCMs (RRTMG) for longwave and shortwave radiation (Iacono et al., 2008), the Monin–Obukhov (Janjic eta) surface layer scheme (Janjic, 1996), the Unified Noah land surface model, and the MYNN scheme for the boundary layer (Nakanishi and Niino, 2006). We also update the sea surface temperature every day at midnight consistently with the EURO-CORDEX simulations (Vautard et al., 2020). The convection scheme is switched off in CPS simulations.
2.2 Evaluation methods
We use four indices to investigate the skills of CPS and EUR-11 simulations in reproducing extreme rainfall over the Cévennes mountain range. These indices consist of (i) comparing the autumn maximum rainfall (Rx), (ii) comparing the distribution of wet events, (iii) comparing the scaling of extreme precipitation and temperature at 2 m height, and (iv) determining the total moisture source from the surface to 700 hPa (i.e. water vapour is mainly concentrated at this low level of the atmosphere) that transports from the Mediterranean to the Cévennes.
The first index takes the average of autumn maximum rainfall values for the considered period. The second index compares the cumulative distributions of all rainfall values that are greater than or equal to 0.1 mm (defined as wet events) in the considered period. The third index determines the non-parametric scaling of extreme precipitation with the increase in surface temperature proposed by Lenderink and Van Meijgaard (2008). In particular, we pair the rainfall (daily or hourly) dataset with the corresponding daily mean 2 m temperature over the Cévennes. This pairing dataset is then sorted in the ascending order of temperature. Next, we divide this dataset into several bins whose width is 2 ∘C with 1 ∘C overlapping between the two consecutive bins and calculate the 99th percentile for rainfall and the mean temperature for each bin. We use a threshold of having at least 300 points of precipitation to take a bin into consideration. This is to avoid the undersampling effect on the final scaling results (Boessenkool et al., 2017). For making inferences for each bin, we use a non-parametric bootstrap by picking 1000 samples of paired temperature and rainfall with replacement from that original bin. Each sample size is the same as that of the sample of the original bin. We repeat calculation of the statistics for each bin and then estimate the 90 % confidence interval of each bin based on those 1000 samples. The first three comparisons are applied to both daily rainfall events and daily maximum of 3 h rainfall events, which creates six indices.
An important ingredient facilitating the mechanism of severe precipitation events over the Cévennes in the autumn is the abundance of moisture from the Mediterranean, which is enhanced by a warm sea surface being exposed to heat during the summer. This moisture is conveyed by unstable low-level southeastern flows produced by the usual development of a synoptic-scale trough to the west of the region during this season. This massive amount of moisture toward the Cévennes is then forced to lift up by high and steep orography that triggers a quasi-stationary mesoscale convective system over the area. The updraft in this system is frequently strengthened at the same location as long as the low-level moist flows are persistent and intensified (Ducrocq et al., 2008, 2014; Nuissier et al., 2008, 2011; Lee et al., 2018; Lebeaupin et al., 2006). Based on these features, we propose a fourth index to investigate the model ability to produce this low-level moisture transport impinging on the Cévennes mountain range using the method in Lélé et al. (2015).
In this equation, Q is the horizontal moisture transport vector (kg m−1 s−1), g is the standard gravitational acceleration at mean sea level (9.81 m s−2), q is water vapour content (kg kg−1), U is the zonal and meridional wind vector (m s−1), and ps and pu are the surface and upper pressure level, in this case 1000 and 700 hPa, respectively. This equation is used to estimate the moisture transport for the 12 heaviest daily rainfall events occurring over the Cévennes mountain range in 30 years for each simulation and for observations. Before selecting the events in each dataset, we first define the Cévennes box (see Fig. 1) by deriving the maxima and minima of the latitudes and longitudes of the 14 stations along the Cévennes used in Vautard et al. (2015). This box is roughly limited from 2.6 to 5∘ E and from 43.3 to 45.1∘ N. Next, we determine the 12 maximum rainfall values and their date of occurrence at any station within the box. We extract the maxima from all stations (i.e. not only considering the 14 stations) we have as long as those stations are located within the box. We eliminate a less heavy event between the two events occurring within 7 d that are both ranked among the top 12 heaviest events so that we can avoid considering the same large-scale dynamic and moisture characteristics leading to those heavy rainfall events twice. For each determined event, we take the average of a few time steps (every 3 h for simulations and every 6 h for the benchmark dataset) from 18:00 UTC of the previous day to 21:00 UTC of the day the event happened. Finally, we compute the mean moisture transport of the mean values of the 12 heaviest rainfall events over the Cévennes box.
2.3 Reference datasets
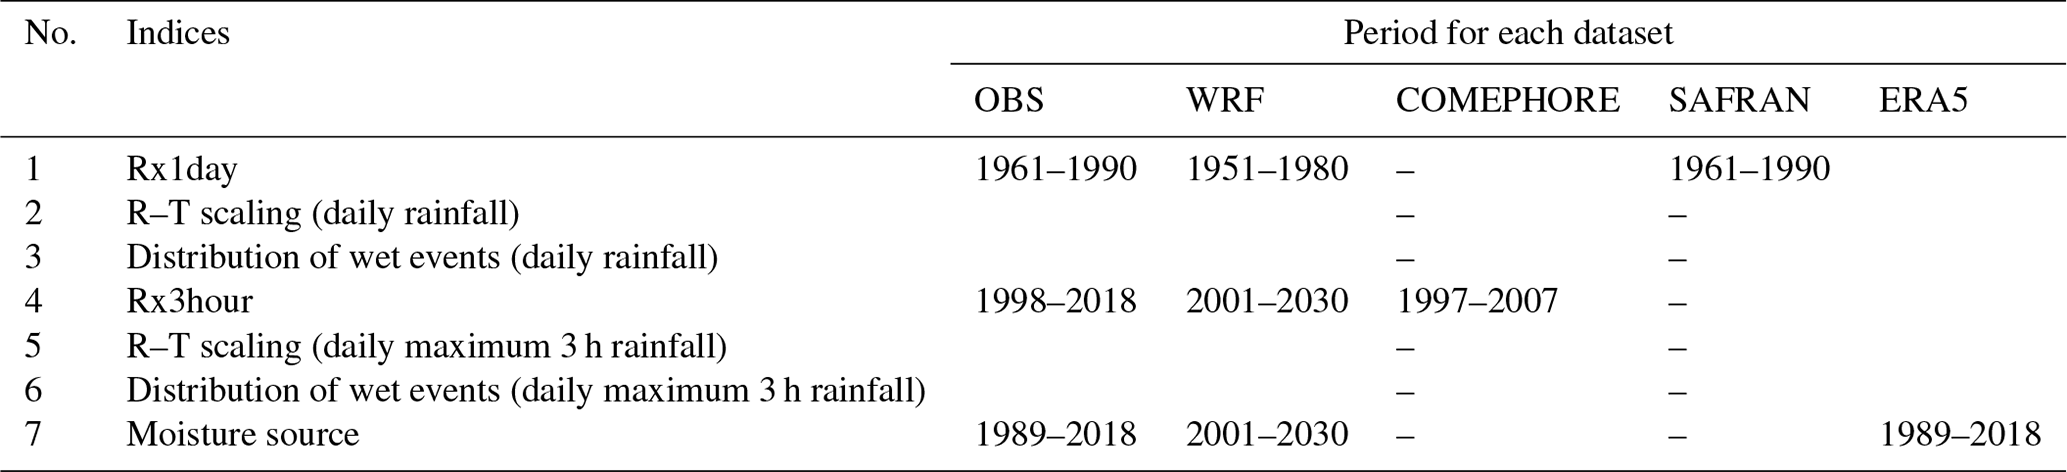
In this study, we use four reference datasets to evaluate the CPS and EUR-11 simulations. The first dataset includes in situ observations of daily and daily maximum 3 h rainfall. The daily rainfall data span 1961 to 2014. The sub-daily dataset is available from 1982 (a few stations start only from 1998) to 2018. The second reference dataset is the SAFRAN reanalysis (Quintana-Seguí et al., 2008; Vidal et al., 2010). SAFRAN is provided in an hourly interval with the horizontal resolution of 8 km and starts from 1958. We only use this dataset to evaluate the daily precipitation event because the hourly rainfall was interpolated from daily data that made its quality insufficient (Vidal et al., 2010). The third reference dataset is the COmbinaison en vue de la Meilleure Estimation de la Précipitation HOraiRE (COMEPHORE), which is a combined product of rain gauge and radar observations (Tabary et al., 2012). This dataset has high temporal (1 h) and spatial (1 km) resolutions as well as higher quality than any other gridded observations in France, especially over complex terrain regions (e.g. the Cévennes; Fumière et al., 2020). However, this dataset only covers 11 years from 1997 to 2007. The last dataset used for the evaluation is the ERA5 atmospheric reanalysis (Hersbach et al., 2020), which is a newly released dataset to replace the ERA-Interim operationally stopped in 2019. The ERA5 has a higher horizontal resolution (approx. 38 km) compared to its predecessor ERA-Interim and starts from 1979. We collect a few variables in pressure level such as the horizontal winds and specific humidity to serve the moisture transport investigation. Given that the time span of these reference datasets is different, we select different periods of simulations to be evaluated using different indices proposed at the beginning of this section. The selection of periods of simulations and reference datasets corresponding to each index is described in Table 1.
Table 1The selection of periods of simulations and reference datasets for evaluation of each index.
In this section, we analyse and discuss the performance of EUR-11 and CPS simulations following the indices proposed in Sect. 2.2. For Rx1day and Rx3hour, we upscale the CPSs and COMEPHORE data to the coarsest resolution (i.e. 0.11∘ of EUR-11) using a conservative remapping method (Jones, 1999) to broaden our discussion of the added value of the CPSs. Specifically, we evaluate the capability of CPSs to reproduce local features against in situ observations and the original COMEPHORE data, while we analyse the added value of CPSs by comparing the upscaled CPSs (denoted hereafter as CPS-11) and EUR-11 to SAFRAN and upscaled COMEPHORE datasets. For climate-impact-oriented indices such as the distribution of wet events and the scaling of extreme precipitation with temperature, we only compare model results to in situ observations. Given the fact that EUR-11 and CPS simulations share the same regional model (i.e. WRF-ARW version 3.8.1) and physics, we mention each simulation in short form by its resolution combined with the driving GCMs (e.g. EUR-11-IPSL-CM5A-MR).
3.1 Autumn maximum daily rainfall (Rx1day)
We first look at the spatial distribution of the mean autumn maximum daily rainfall (Rx1day) from all simulations and observations (Fig. 2). The results from the two reference datasets including SAFRAN (Fig. 2j) and the in situ observations (Fig. 2k) show that daily rainfall events occur along the Cévennes mountain range (i.e. the diagonal of the Cévennes box), especially over its northern part (i.e. above the latitude of 44∘ N). The maximum and mean of 14 stations (as used in Vautard et al., 2015) from the SAFRAN and observations are close to each other at 98 and 77 mm, respectively, for SAFRAN versus 97 and 81 mm for observations. This coherence comes from the fact that SAFRAN is an interpolation product from in situ observations.
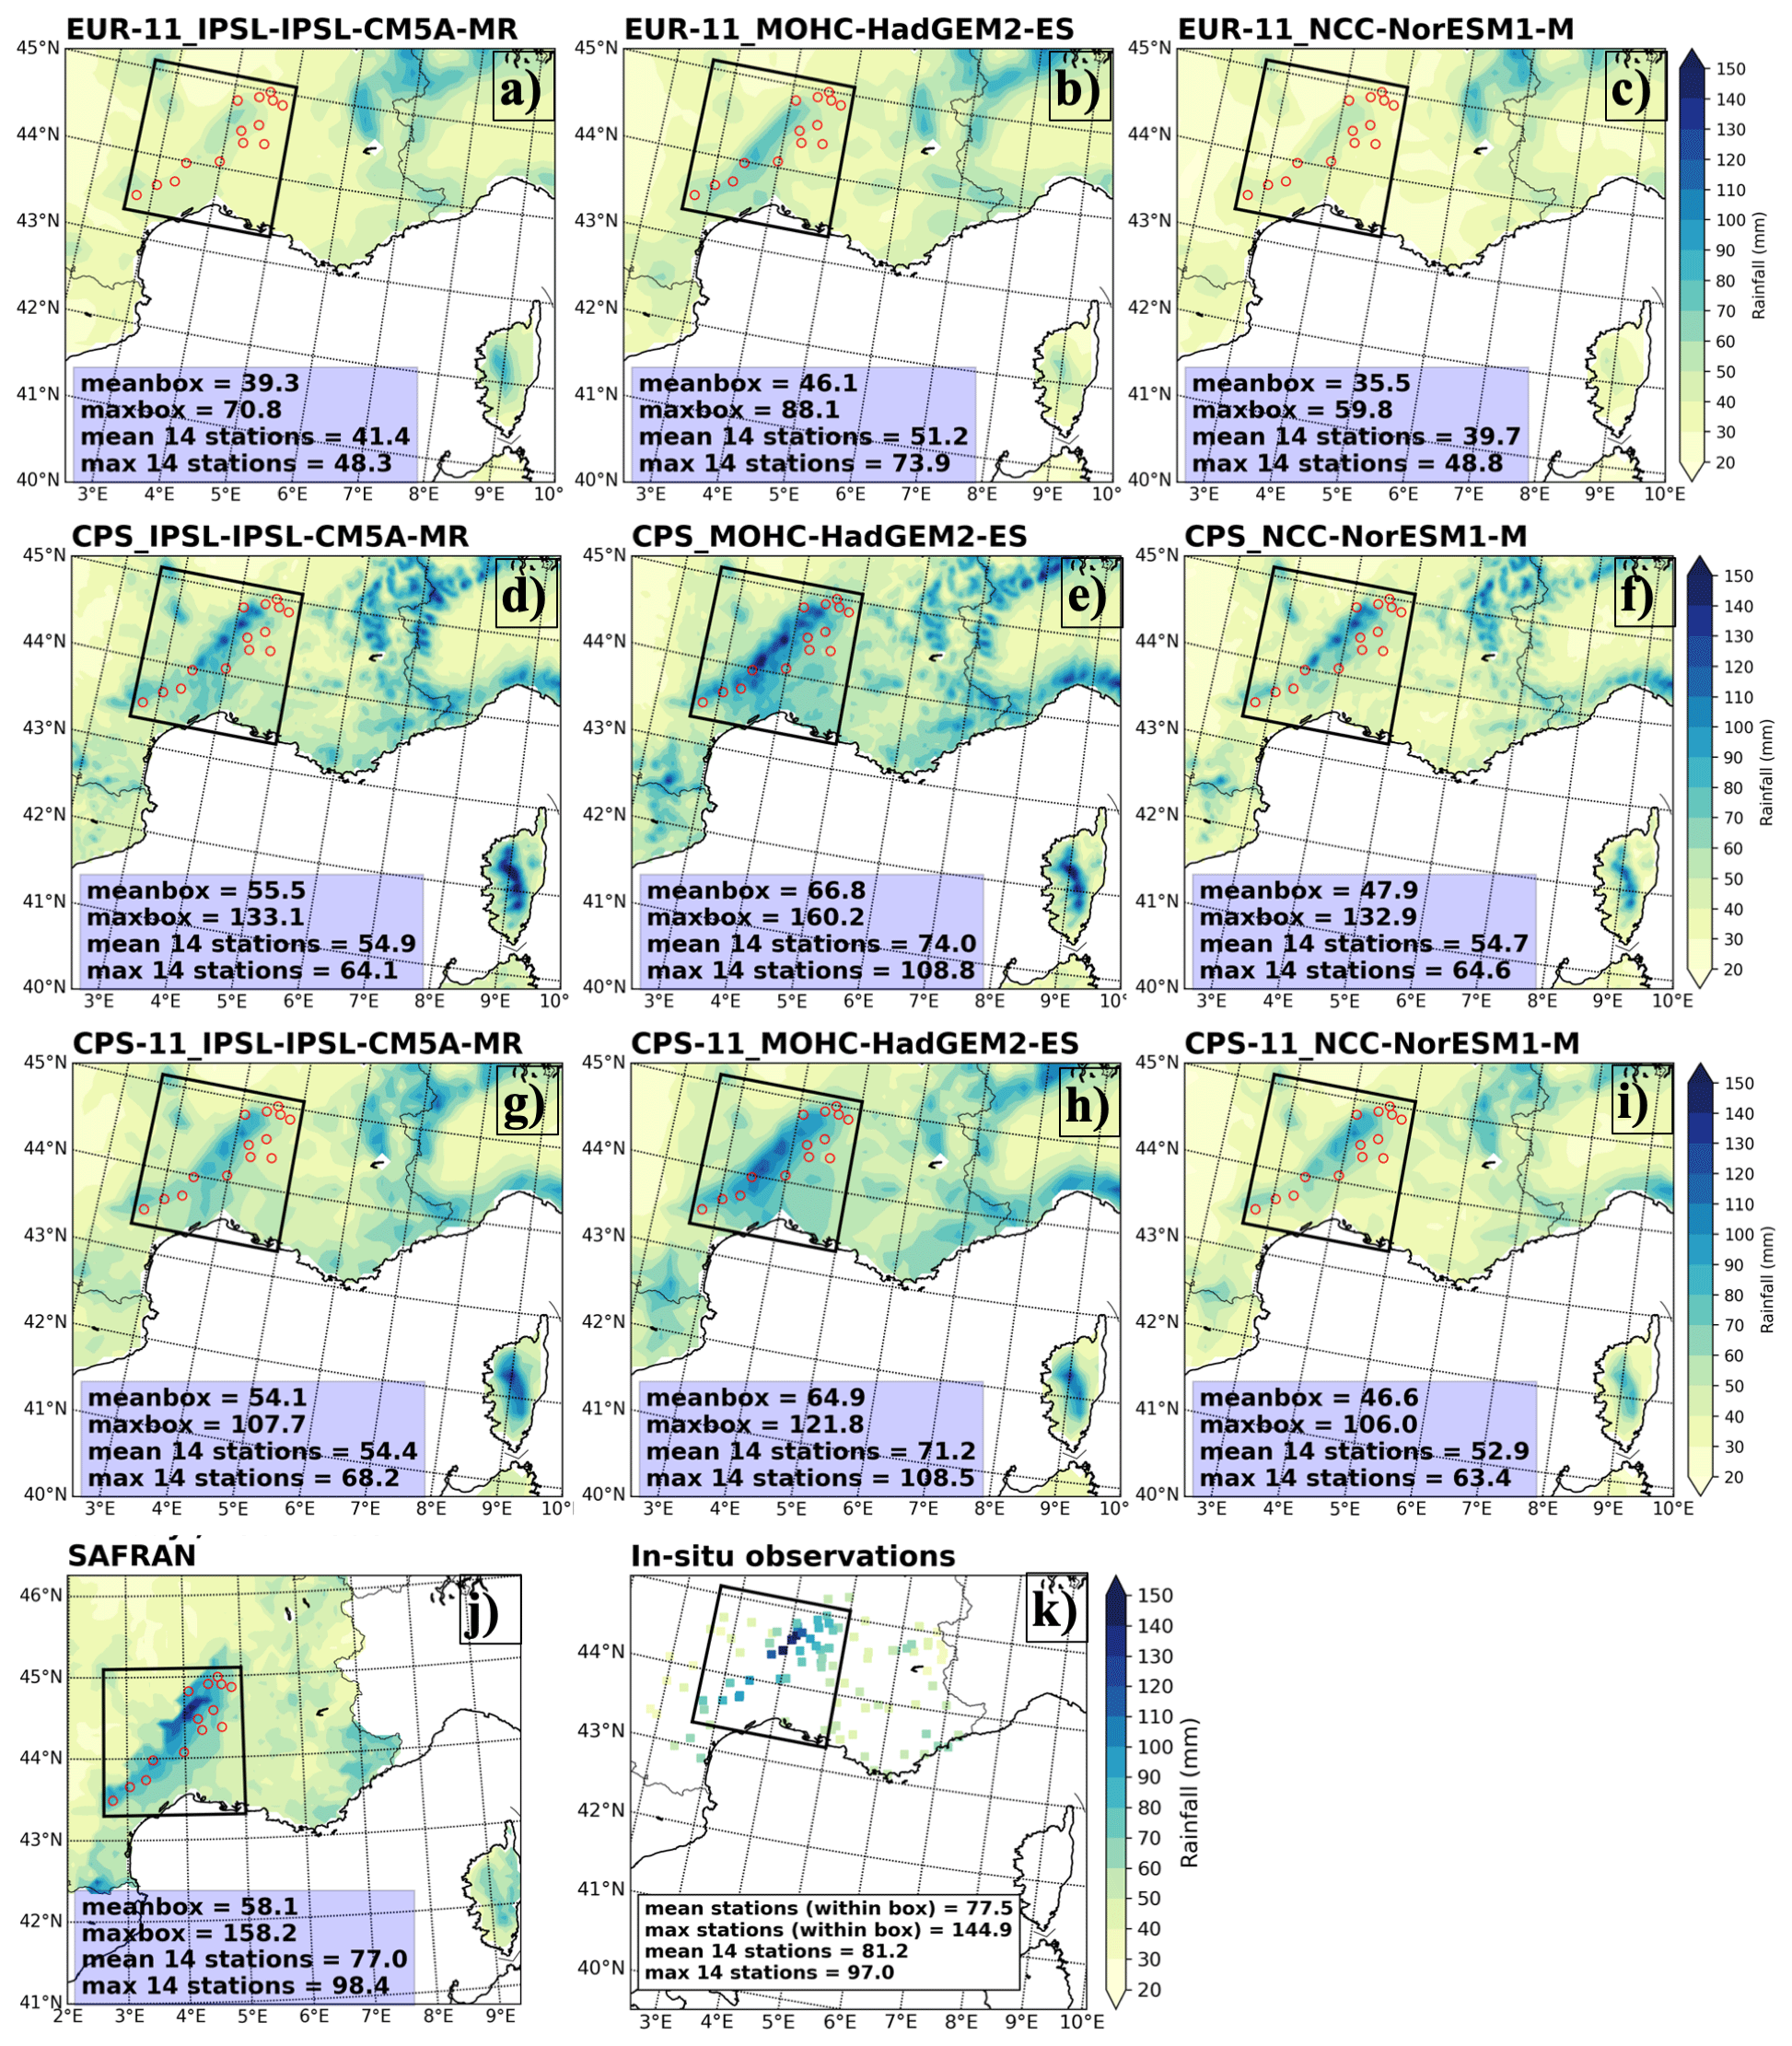
Figure 2The autumn maximum daily rainfall (Rx1day) from EUR-11 (a–c) simulations (1951–1980), CPS (d–f) simulations (1951–1980), CPS-11 (g–i), SAFRAN (j) (1961–1990), and in situ observations (k) (1961–1990); the red empty circles inside the Cévennes box from panels (a) to (j) denote 14 stations used in Vautard et al. (2015).
Generally, we observe agreement between all simulations and reference datasets that rainfall patterns are heavier along the Cévennes. However, the intensity of Rx1day from the CPSs (and CPS-11 simulations) and their driving EUR-11 are very different. The three EUR-11 simulations (Fig. 2a–c) show large dry biases over the Cévennes box. The mean dry biases over the box from those simulations range from 20 % (EUR-11-HadGEM2-ES) to 39 % (EUR-11-NorESM1-M) in comparison with SAFRAN. The two CPS-11 simulations slightly underestimate Rx1day over the Cévennes box with a dry bias ranging from 7 % (CPS-11-IPSL-CM5A-MR) to 20 % (CPS-11-NorESM1-M), while the CPS-11_HadGEM2-ES rather overestimates Rx1day by 12 % (Fig. 2g–i). For the CPS (Fig. 2d–f), all simulations underestimate Rx1day over the Cévennes box by −38 % to −14 % compared to in situ observations. In contrast, all simulations tend to show a wet bias in Rx1day over the French Alps. The wet biases in this area are more intensified by the CPSs. We find that the behaviour of CPSs depends on their driving EUR-11 simulations. EUR-11-HadGEM2-ES or CPS-HadGEM2-ES shows the best agreement with observations when comparing them with other simulations with the same resolution.
3.2 Autumn maximum of daily maximum 3 h rainfall (Rx3hour)
The convection-permitting model is expected to improve the representation of the deep convection process that leads to heavy precipitation at local scale in a short period of time (e.g. sub-daily timescale). In this section, we investigate the autumn maximum 3 h rainfall (Rx3hour) to clarify how much the CPSs could improve the short-duration rainfall in comparison with their driving EUR-11 simulations for the period of 2001–2030. We use the COMEPHORE (1997–2007), upscaled COMEPHORE, and rain gauge measurement (1998–2018) for this evaluation. We skip the SAFRAN dataset due to its insufficient quality of hourly rainfall, which was obtained by an interpolation process from daily data in combination with analysed hourly specific humidity and other factors (Vidal et al., 2010).
The spatial distributions of Rx3hour from simulations and observations are shown in Fig. 3. We find that heavier rainfall events are still observed along a northeast–southwest axis, as for Rx1day. In addition, this pattern is expanded to the plain area on the southeast of the Cévennes range in the 11-year mean of COMEPHORE (Fig. 3j) and 21-year means of in situ observations (Fig. 3l). The spatial maximum and mean Rx3hour of all 23 stations located within the Cévennes box from COMEPHORE are 81 mm and 45 mm. The mean value of those 23 stations is consistent with the mean values from in situ observations, but the maximum value is almost 30 % larger compared to those from rain gauge data. This discrepancy could be explained by either the method applied to combining radar and in situ observations or the uncertainty in radar information over a complex topography area despite the good coverage of the radar system.
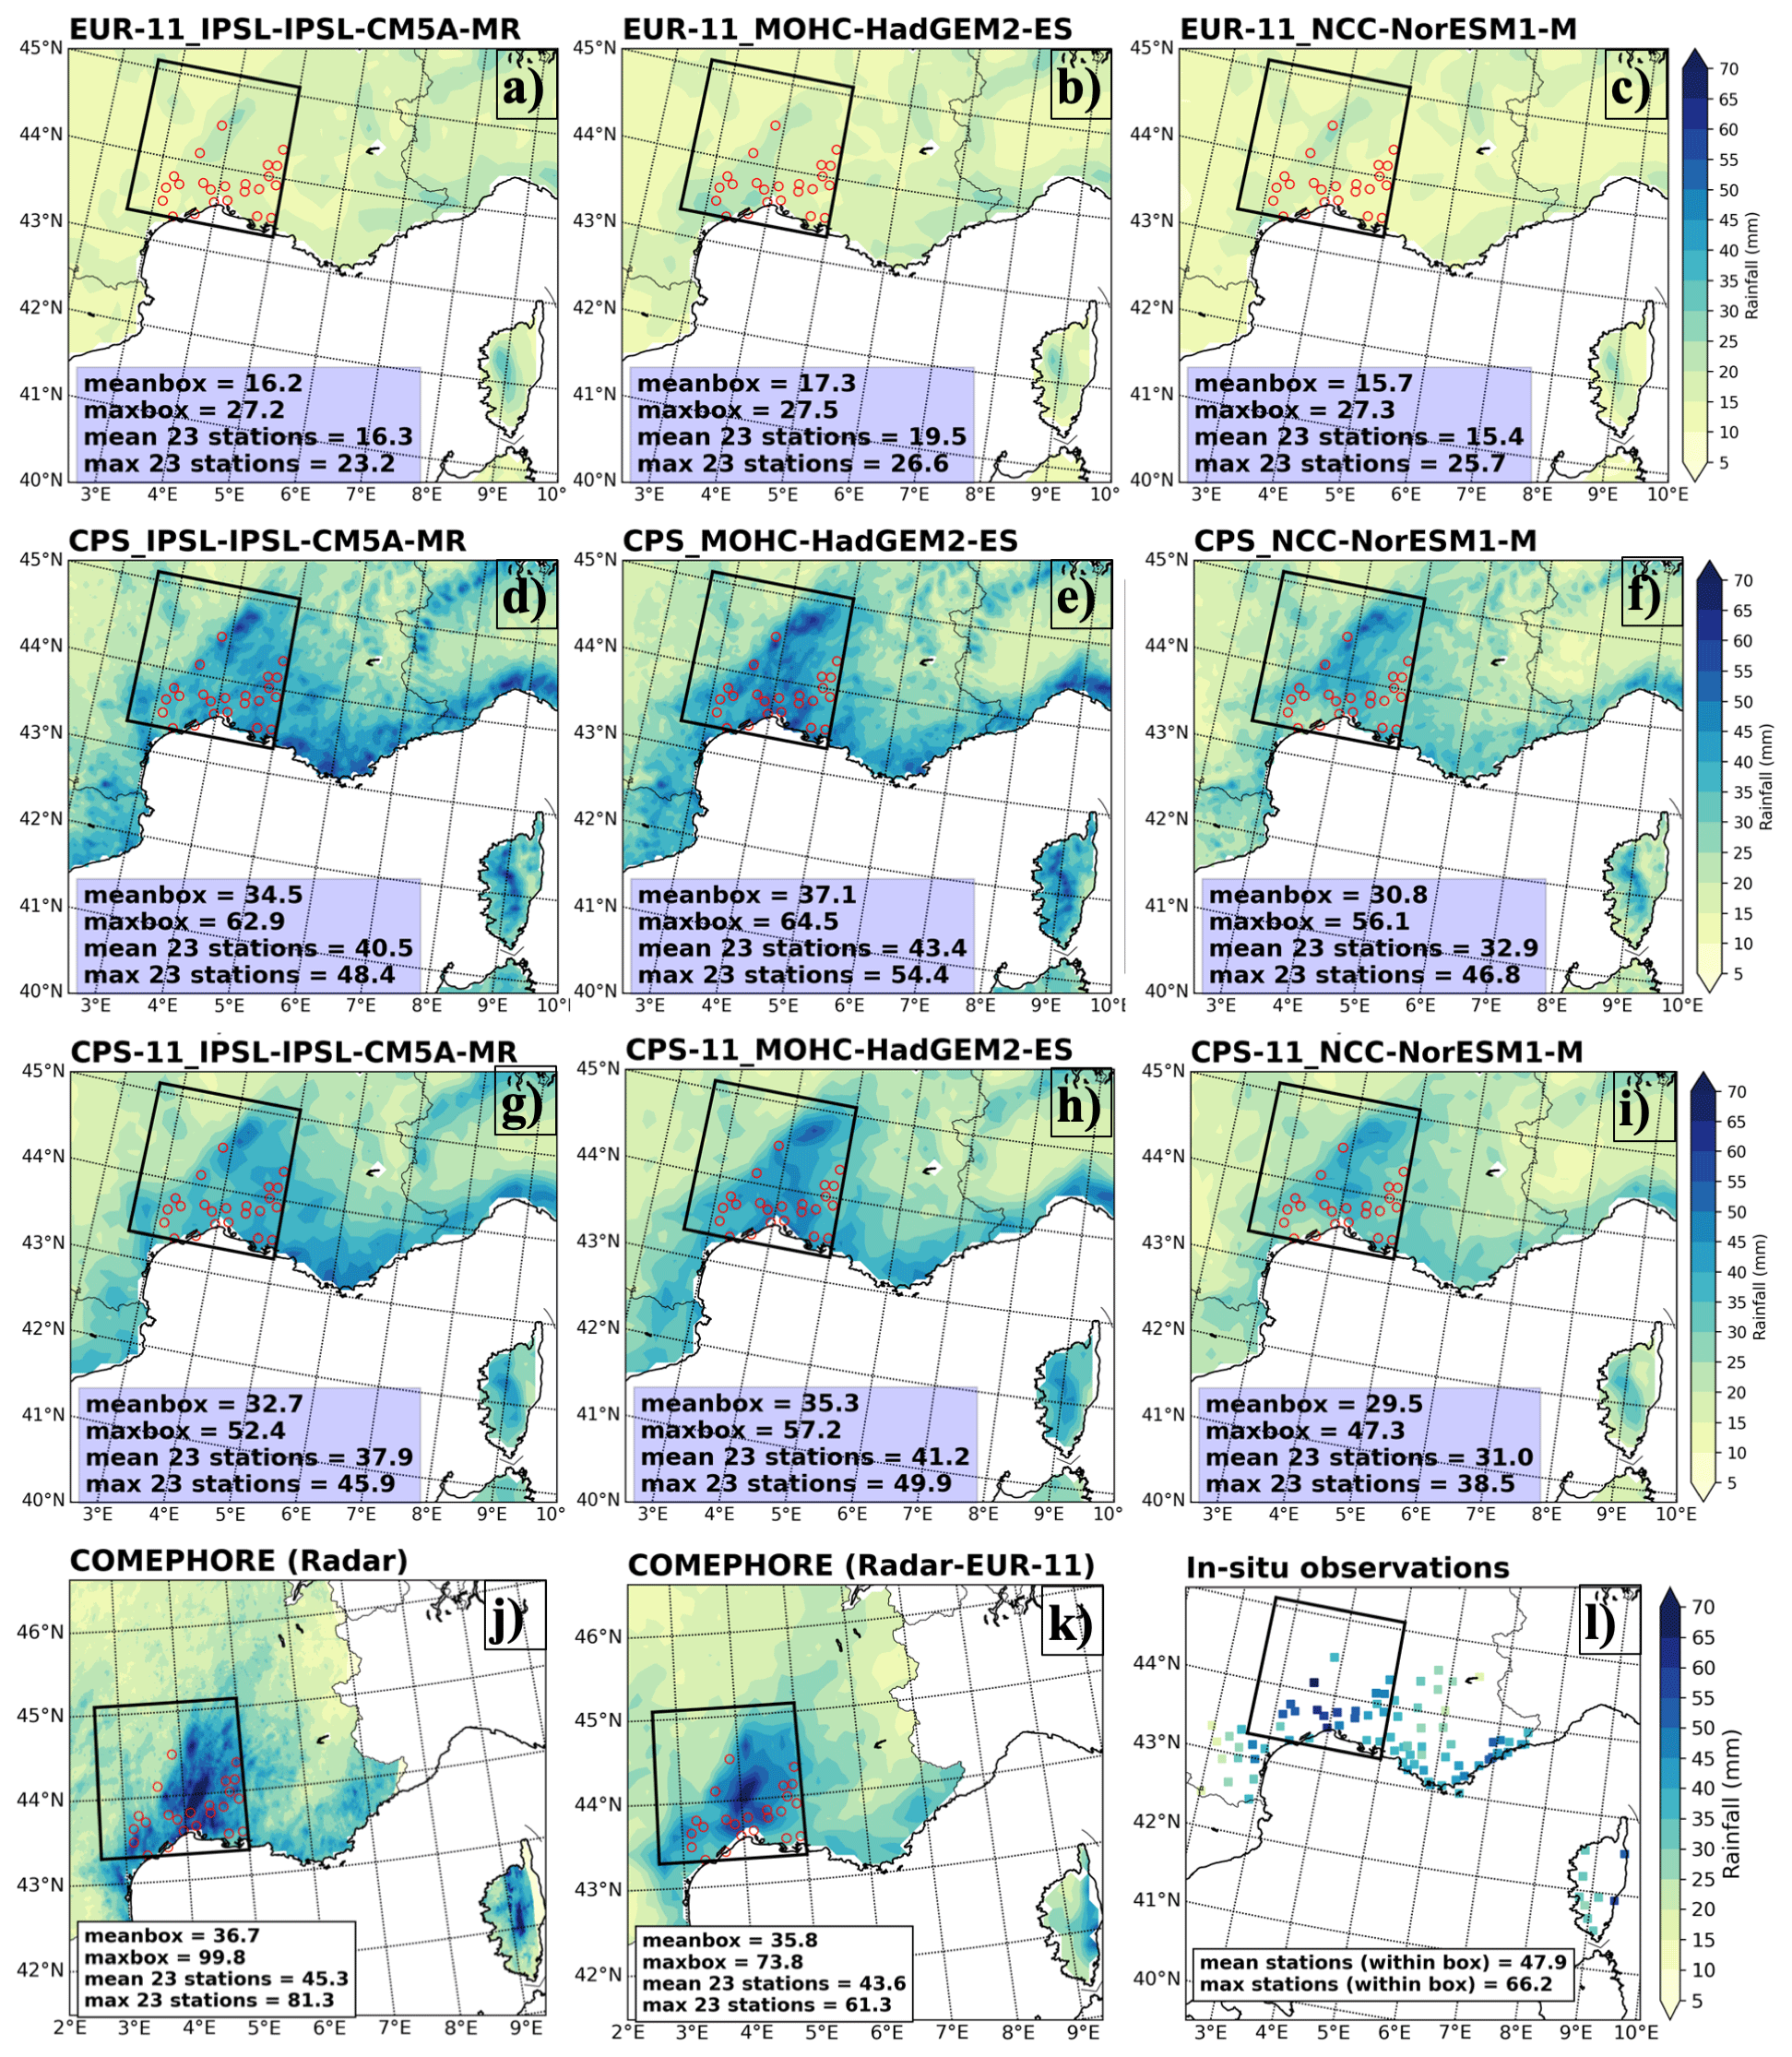
Figure 3The autumn maximum 3 h rainfall (Rx3hour) from EUR-11 (a–c) simulations (2001–2030), CPS (d–f) simulations (2001–2030), CPS-11 (g–i), the COMEPHORE (j) dataset (1997–2007), upscaling COMEPHORE (k), and in situ observations (l) (1998–2018); the red empty circles inside the Cévennes box from panels (a) to (k) denote 23 stations for which 3-hourly data are available.
All simulations reproduce this coverage pattern of Rx3hour well, despite the fact that the magnitudes of the event vary compared to the observations. This is consistent with what was found by the analyses of Fumière et al. (2020), who estimated the extreme tail percentile rather than the mean of daily and hourly rainfall from a convection-permitting model driven by reanalysis ERA-Interim data. As expected, the EUR-11 simulations underestimate 3 h extreme rainfall over the Cévennes box. The mean dry biases of Rx3hour over the Cévennes box from EUR-11-IPSL-CM5A-MR, EUR-11-HadGEM2-ES, and EUR-11-NorESM1-M against upscaled COMEPHORE are −55 %, −52 %, and −56 %, respectively (Fig. 3a–c). The results from CPS-11 simulations (Fig. 3g–i) also underestimate the extreme from upscaled COMEPHORE. Their spatial mean precipitation biases over the Cévennes box range from −18 % (CPS-11-NorESM1-M) to −1 % (CPS-11-HadGEM2-ES). These CPS-11 simulations also perform better than EUR-11 in reproducing heavy rainfall over the plain and coastal area to the east of the Cévennes mountain range and over the Alps. For the CPSs, we find dry biases of those simulations compared to in situ observations. The mean biases of 23 stations within the Cévennes box from the CPSs range from −23 % to −37 % (Fig. 3d–f). In summary, the convection-permitting model shows consistent skills and improves the reproduction of the spatial distribution of heavy rainfall from daily to sub-daily timescales. We also find coherence in the results in CPS and its driving EUR-11 simulations (e.g. the simulations from HadGEM2-ES experiments have better performance compared to others).
3.3 Distribution of wet events
In this section, we compare the station-pooling distributions of wet events (3-hourly or daily amount > = 0.1 mm) and the biases of the right tail (10 %) of distributions from all simulations including the upscaled CPS (i.e. CPS-11) against the in situ observations. The results from the CPS-11 are close to those from the CPS (around 5 % discrepancy, similar to what is shown in the previous sections) for both daily and 3-hourly rainfall. This enables us to find the advantage of CPSs in simulating extreme rainfall events compared to the EUR-11 simulations. The analysis for daily rainfall is shown in Fig. 4. In general, the tail of daily rainfall events is underestimated in all simulations. However, the CPS-11 simulations (and hence the CPSs) show better agreement with in situ observations. Their mean biases in the 10 % tail range from −45 % to −20 %. The dry mean biases of EUR-11 simulations range from −60 % to −50 % for the 10 % right tail of the distributions (Fig. 4b). The improvement in reproducing extreme events with CPSs compared to EUR-11 simulations is more obvious in the analysis of 3-hourly events (Fig. 5). The distributions of 3-hourly wet events from the CPS-11 simulations and CPSs are close to in situ observations (Fig. 5a). The mean biases in the right tail of these simulations range from −25 % to −10 %. The dry mean biases of EUR-11 simulations remain similar to their analysis of daily wet events (approx. −65 %) (Fig. 5b). For either daily or sub-daily wet events, we find that the downscaling experiments from HadGEM2-ES achieve the best skills in reproducing extreme rainfall events in comparison with other simulations with corresponding resolutions.

Figure 4Exceedance probability distribution (a) for daily rainfall in the autumn from in situ observations (1961–1990) and all simulations (1951–1980). The bias (b) of 10 % in the tail of the distribution from each simulation against in situ observations. The red dotted line in panel (a) denotes the exceedance probability of 0.1, above which the simulated rainfall values are used to estimate the bias of the distribution tail in panel (b).
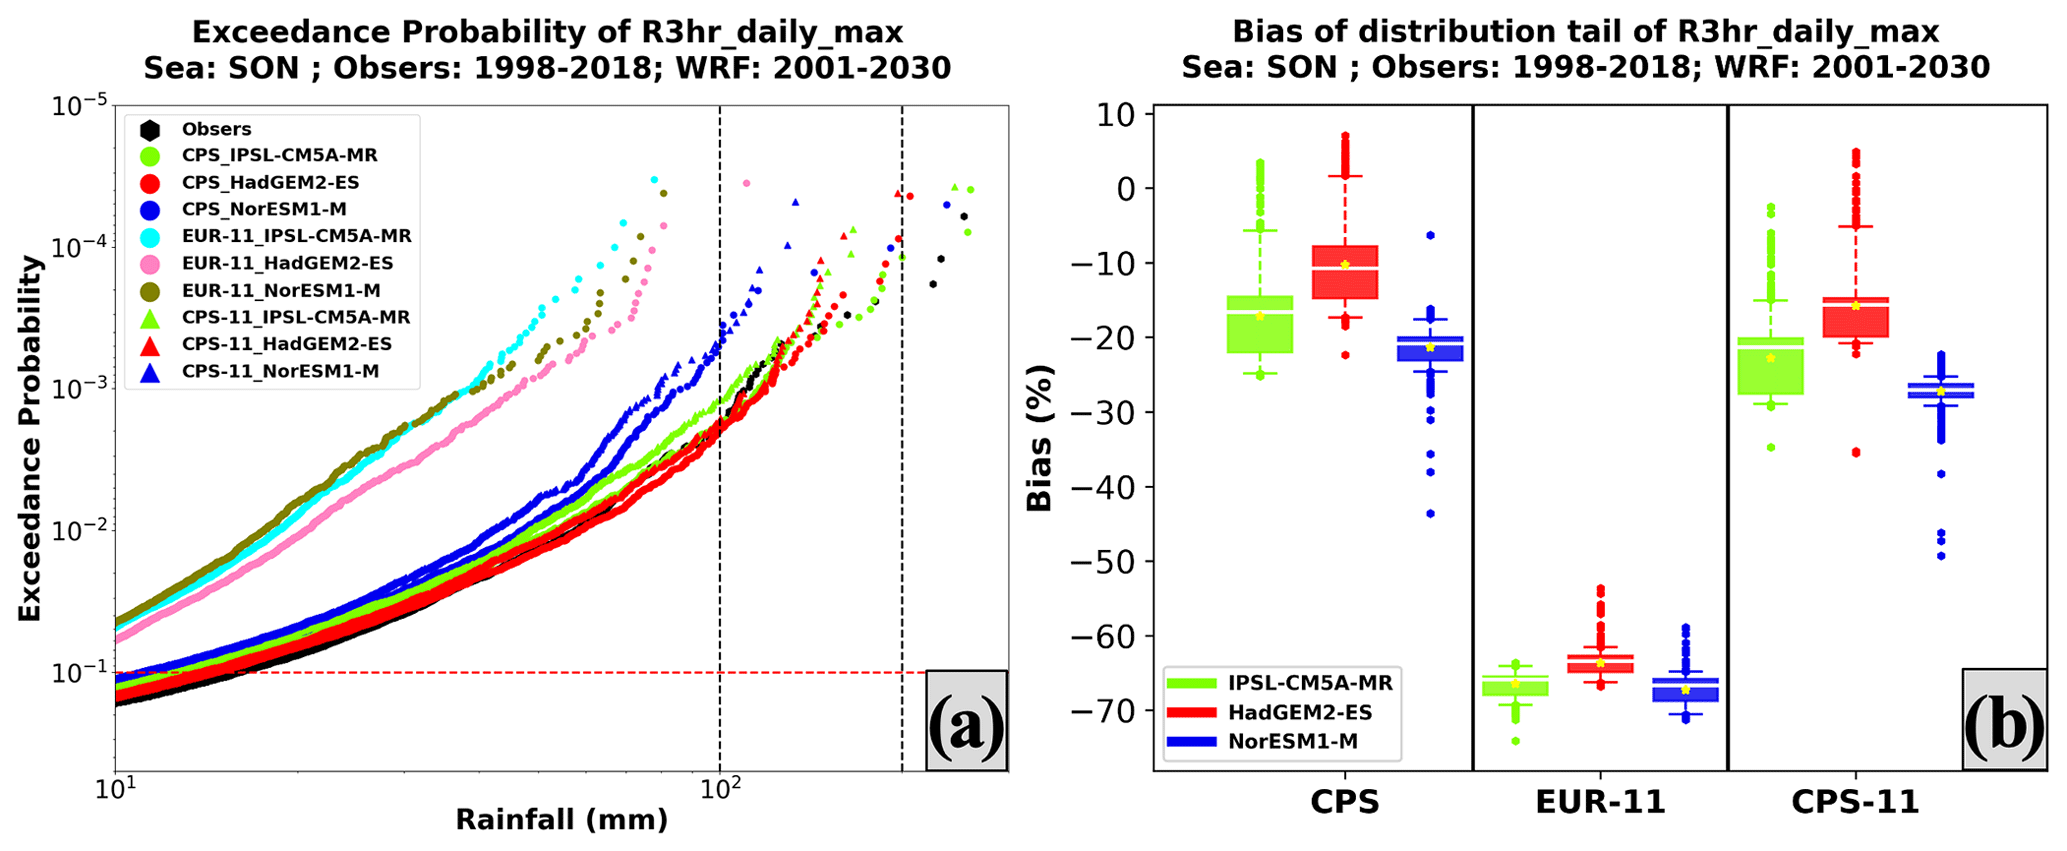
Figure 5Exceedance probability distribution (a) for daily maximum 3 h rainfall in the autumn from in situ observations (1998–2018) and all simulations (2001–2030). The bias (b) of 10 % in the tail of the distribution from each simulation against in situ observations. The red dotted line in panel (a) denotes the exceedance probability of 0.1, above which the simulated rainfall values are used to estimate the bias of the distribution tail in panel (b).
3.4 Scaling extreme rainfall with surface temperature
From the Clausius–Clapeyron relation, we can infer that when the atmospheric temperature increases by 1 K (or ∘C), the capacity of the atmosphere to hold water vapour accordingly increases by approximately 7 %. This means that given the absence of significant changes in relative humidity, the water vapour supplied for convection may increase following the Clausius–Clapeyron relation when the atmospheric temperature increases (Lenderink and Attema, 2015). This relationship links the increase at extreme daily and sub-daily timescales to regional and global warming (Pall et al., 2007; Westra et al., 2014; Lenderink et al., 2017). In this section, we model the relation between extreme precipitation and daily mean surface temperature, which is theoretically reflected by the Clausius–Clapeyron relation, by a simple non-parametric scaling method described in Sect. 2.2. We apply this method to EUR-11 and CPS simulations and then compare to the result obtained with in situ observations. We use 14 stations as in Vautard et al. (2015) and Luu et al. (2018) for the scaling of daily rainfall and 23 stations within the Cévennes box for the scaling of 3-hourly rainfall.
Figure 6a compares the scaling model of extreme daily precipitation (99th percentile) with daily mean surface temperature from all simulations against in situ observations. The analysis of observations (black line) over the Cévennes shows that the dependence of extreme rainfall on the increase in surface temperature closely follows the Clausius–Clapeyron (C–C) relation (black dotted lines in Fig. 6) for temperature above 2 ∘C and breaks once exceeding 13 ∘C. The scaling behaviour of each CPS replicates its driving EUR-11 simulation for the daily precipitation scaling analysis, but the rainfall intensity from CPSs is higher. Specifically, the two downscaling simulations of IPSL-CM5A-MR roughly reproduce the C–C relation in a range of 9 to 17 ∘C, while the two downscaling simulations of HadGEM2-ES follow the C–C relation in a range of 5 to 13 ∘C. The two simulations of NorESM1-M show similar behaviour that follows the C–C relation in a range of roughly 4 to 14 ∘C. The overall scaling rate from EUR-11 simulations is close to observations, while CPSs slightly overestimate this rate.
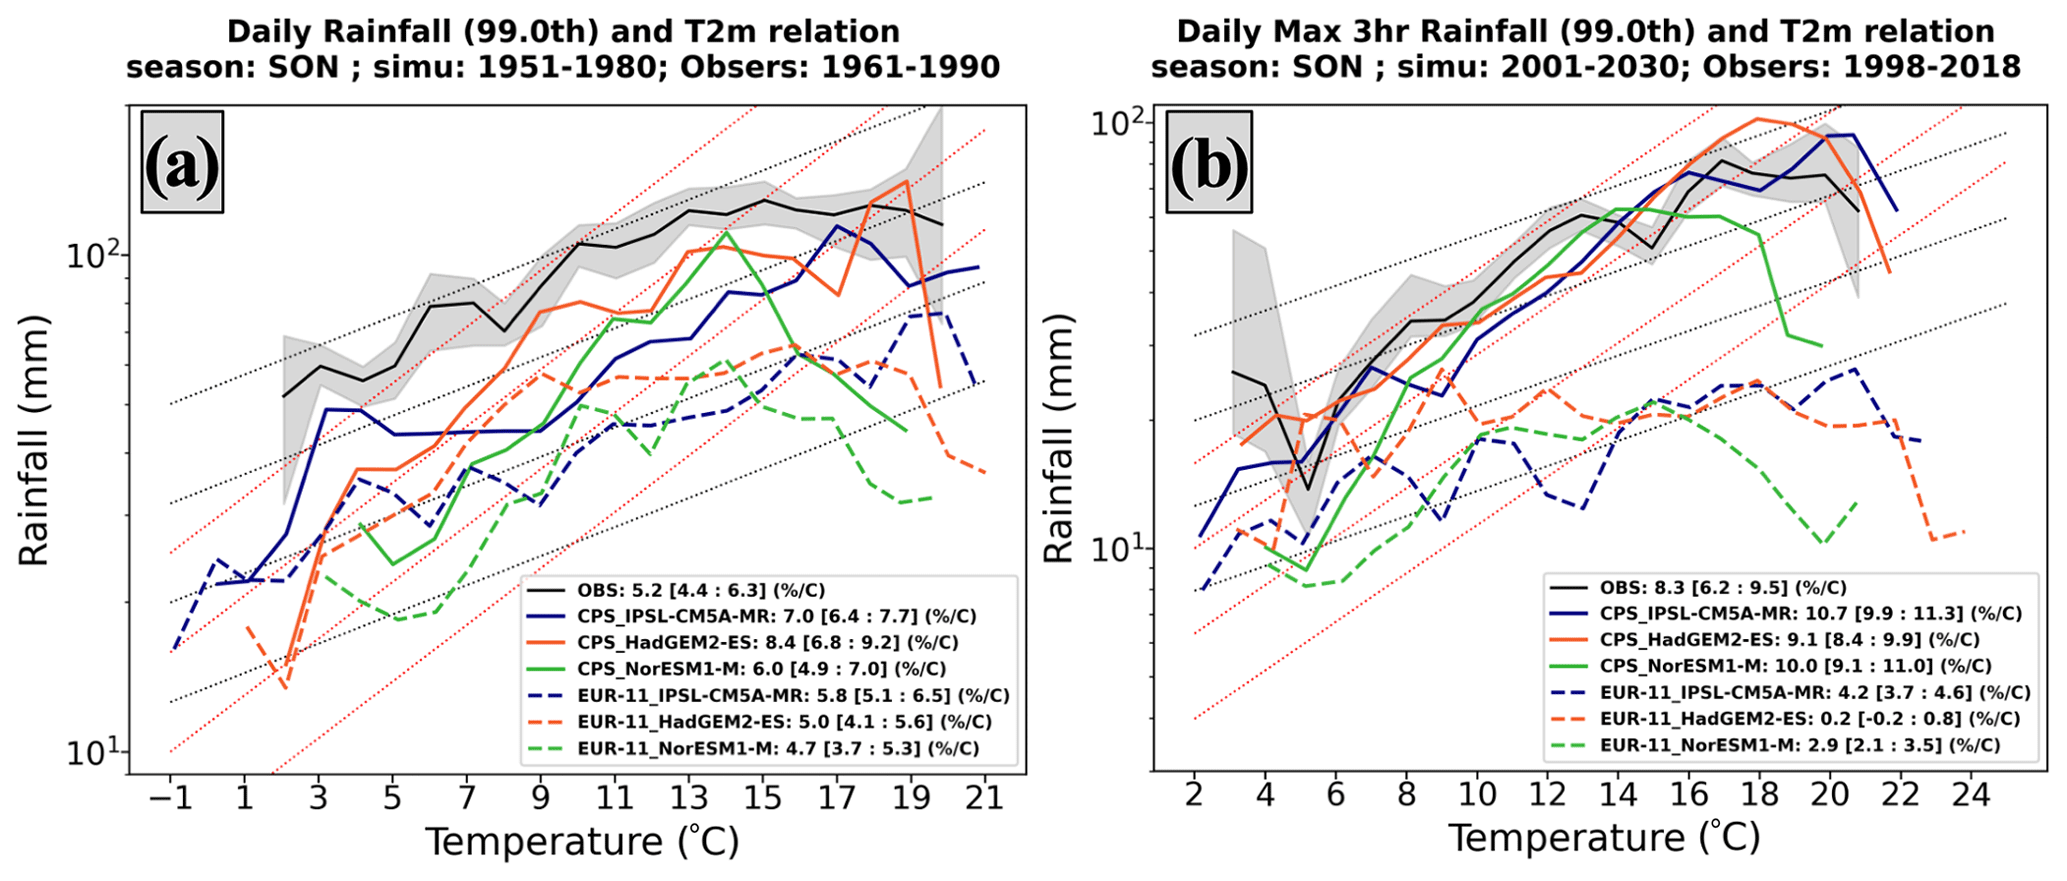
Figure 6Extreme (99th percentile) daily precipitation (a) and daily maximum 3-hourly rainfall (b) in scaling with daily temperature at 2 m from simulations (1951–1980 for daily rainfall and 2001–2030 for 3-hourly rainfall) and in situ observations (1961–1990 for daily rainfall and 1998–2018 for 3-hourly rainfall); the black dotted lines show the Clausius–Clapeyron relation, the red dotted lines show the super Clausius–Clapeyron relation, and the grey band denotes the 90 % confidence interval of observational scaling.
The analysis for scaling of extreme 3-hourly rainfall with daily mean surface temperature is presented in Fig. 6b. We show that the observation analysis follows the super C–C relation for the temperature range of 6 to 13 ∘C. This super relation can be directly explained by the latent heat released during the condensation period of water vapour enhancing the moisture convergence at a lower level and the cloud dynamics (Trenberth et al., 2003; Lenderink et al., 2017). However, this result is different from what was found in Drobinski et al. (2016). Their analysis showed that this scaling follows the Clausius–Clapeyron relation rather than the super Clausius–Clapeyron relation. This difference could come from the fact that Drobinski et al. (2016) used more than 200 stations, which cover a large area in the south of France (i.e. not only restricted to the Cévennes), and they did not focus only on the autumn. This leads to the mixture of different patterns of rainfall in different seasons and areas.
For the simulations, we find that CPSs can reproduce the super C–C relation similarly to observations (Fig. 6b). CPS_IPSL-CM5A-MR shows a super C–C scaling in the range of 9 to 17 ∘C. CPS_HadGEM2-ES and CPS_NorESM1-M follow super C–C in the range of 5∘C to 17 and 7 to 14 ∘C, respectively. These simulations also have better agreement with observations in terms of intensity. In contrast, the three EUR-11 simulations are unsuccessful in approximating the super scaling behaviour and especially the rainfall intensity. We explain this underestimation by the fact that the resolution of EUR-11 is insufficient to reproduce more localized extreme events and that the convection scheme used in EUR-11 oversimplified the cloud process by statistical distributions and imposing assumptions of quasi-equilibrium with large-scale forcing (from grid points), approximation of moist air entraining in the updraft, and representation of all single cloud elements by sole steady -state updraft of the whole cloud ensemble (Lenderink and Attema, 2015; de Rooy et al., 2013; Houze, 2004; Prein et al., 2013). In addition, we find a decreasing trend (i.e. the hook shape) of this scaling model in high temperature ranges for both daily and sub-daily precipitation. Because we use surface temperature as a proxy for condensation temperature (i.e. dew point), we overestimate the real saturation temperature (Drobinski et al., 2016). In other words, this hook shape results from the lack of sufficient water vapour in the atmosphere (Hardwick Jones et al., 2010), and therefore the condition of saturation is broken.
3.5 Moisture sources
In this section, we investigate the ability of the model to reproduce the mean moisture source brought by the southeastern flow impinging on the Cévennes. We use the method described in Sect. 2.2 to compare the mean moisture transport of the 12 heaviest Cévennes events in each simulation against the ERA5 reanalysis.
The comparison of the mean moisture transport of the 12 heaviest Cévennes rainfall events occurring over the Cévennes box is shown in Fig. 7. Because the size of the CPS domain is insufficient for this large-scale analysis, we visually embed each CPS domain inside its driving EUR-11 domain in each panel showing the results from CPSs (Fig. 7d–f). This means that we estimate the mean moisture transport of the 12 heaviest Cévennes events from each CPS simulation and the corresponding information from its driving EUR-11 to create those plots. Therefore, the information from EUR-11 simulations in those cases (Fig. 7d–f) may differ from the mean moisture transport investigations for the 12 heavy Cévennes events determined from EUR-11 simulations themselves (Fig. 7a–c). The result from the ERA5 reanalysis indicates a low-pressure system located around 50∘ N and 9∘ W in the north Atlantic with its trough expanding to the south (Fig. 7g). This large-scale system produces southerly to easterly flows that transport moisture from the warm Mediterranean, hitting the Cévennes. The mean moist flux covering the Cévennes box in this case is 265 kg m−1 s−1 and is larger than surrounding areas. All EUR-11 simulations (i.e. either the analyses themselves in Fig. 7a–c or complementing large-scale dynamics information for the CPS analyses in Fig. 7d–f) can reproduce these synoptic features well. The low-pressure systems are generally located between 45 and 50∘ N and between 5 and 10∘ W. These systems enable the low-level flows to bring larger water vapour content into the Cévennes box compared to nearby areas in all simulations in a way that is coherent with ERA-5 analysis. The bias of the mean moisture source in the Cévennes box from EUR-11 simulations is roughly 25 % lower than in ERA5. The CPS simulations can reproduce better agreement of the moisture source over the Cévennes box with ERA5, in spite of their restriction in domain size. The mean moisture of the 12 heaviest rainfall events over the Cévennes box from CPSs are underestimated by approximately 17 % compared to the ERA5. In summary, all simulations can reproduce the moisture source hitting the Cévennes, with a slightly better performance from CPSs. However, the CPSs show more added value in reproducing more realistic extreme precipitation events. This suggests that explicitly resolving convection, finer resolution, and more elaborated topography all play a role in this improvement.
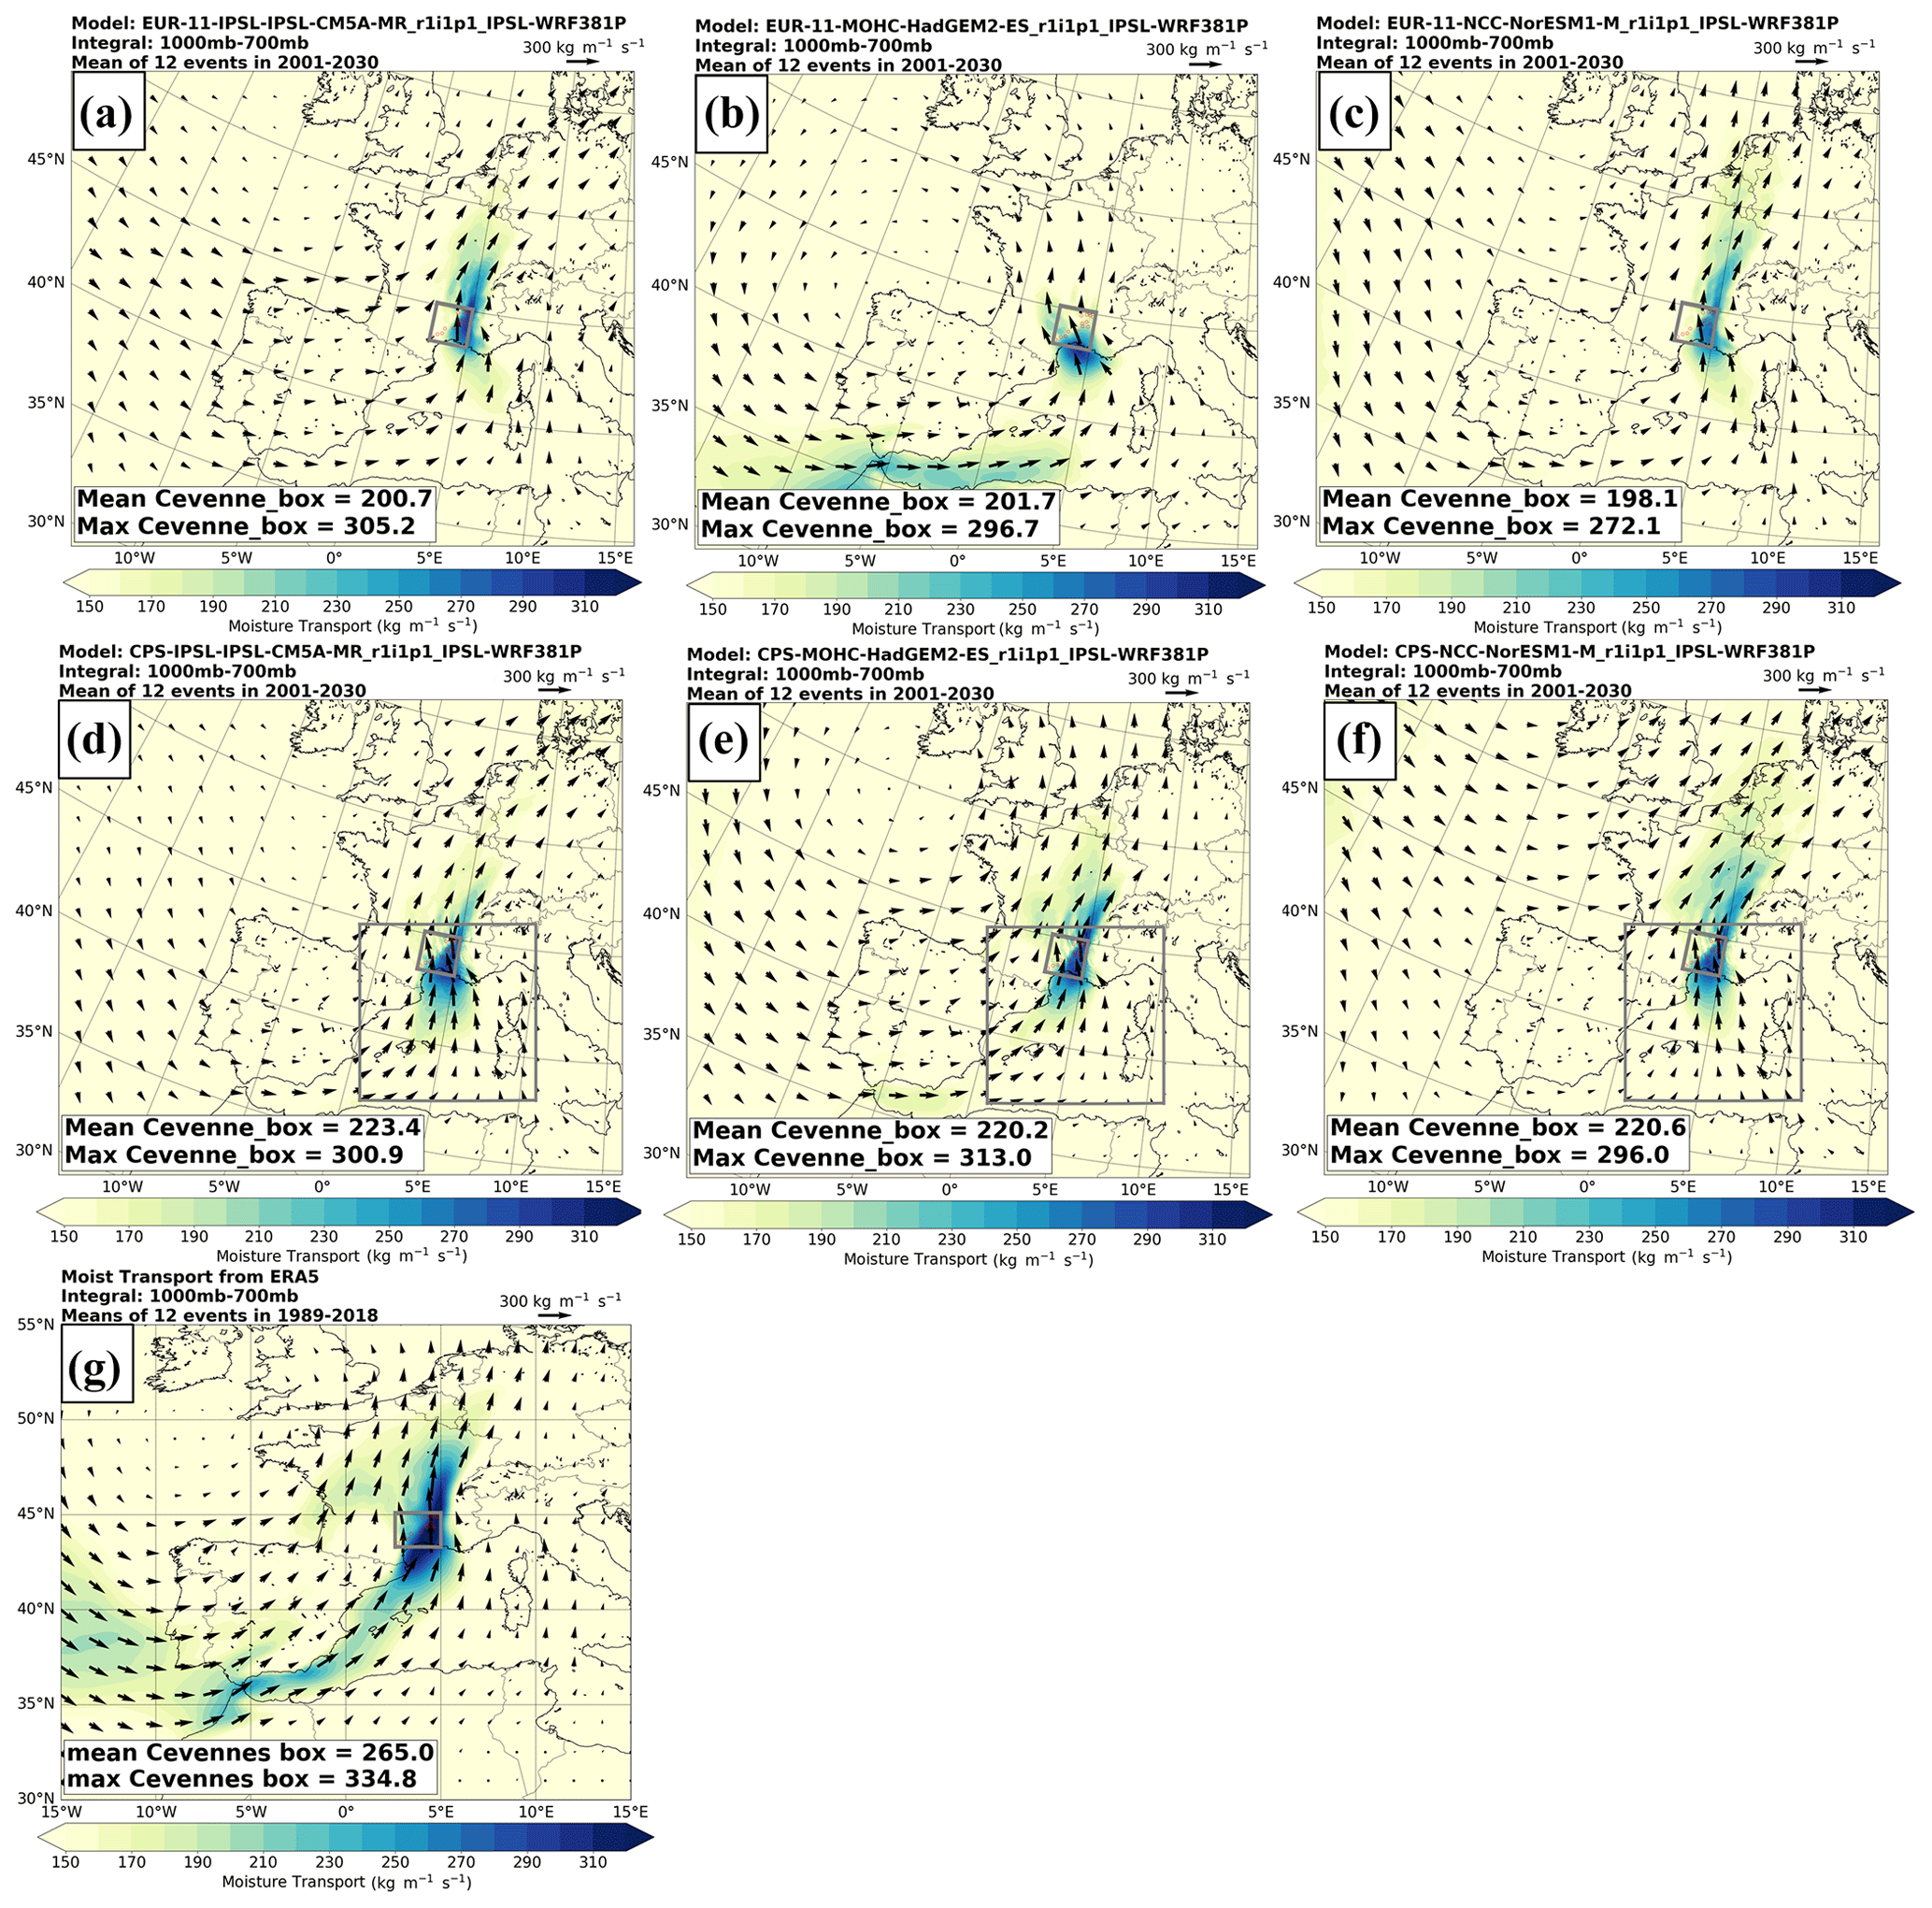
Figure 7Mean moisture transport of the 12 heaviest daily rainfall events from all simulations (2001–2030, from a to c for EUR-11 simulations and from d to f for CPSs) and ERA5 (1989–2018, panel g). Note that the domain of CPS is far smaller to meet the requirement of these analyses. Therefore, we embedded each CPS moisture transport inside its corresponding driving EUR-11 for the same 12 events of that CPS. This means that results from EUR-11 in these cases (d–f) may differ from those in panels (a)–(c).
In this study, we conducted three dynamical downscaling experiments from 12 to 3 km using the WRF-ARW version 3.8.1 for two different periods including 1951–1980 and 2001–2030. These simulations, following a few experiments of 3-month simulations driven by ERA-Interim for testing and selecting an appropriate configuration, are driven by the three EURO-CORDEX simulations using the same WRF-ARW version which downscaled three GCMs from CMIP5 including IPSL-CM5A-MR, HADGEM2-ES, and NORESM1-M. We simulate precipitation only for the autumn over the French Mediterranean with a focus on the south of France. This downscaling strategy benefits from time and energy efficiency that we can run simulations for different autumns and experiments at the same time.
We find that convection-permitting simulations (CPSs) can reproduce more realistic heavy precipitation events in terms of magnitude, spatial coverage, and statistical properties than EURO-CORDEX simulations. This improvement is more pronounced in 3-hourly rainfall analysis than in the daily one. These features are robust at both climate scale driven by EUR-11 simulations and the 3-month scale driven by the reanalysis (see the Supplement) to reproduce a few specific events occurring in autumn 2014. In addition, the CPSs at climate scale can reproduce a doubling of the rate of the Clausius–Clapeyron relation for the scaling of 3-hourly rainfall to surface temperature that is absent in the EUR-11 simulations with the convection parameterized method and reproduce the high extremes in plain areas. These findings are coherent with other studies with a convection-permitting approach forced by reanalysis data for autumn events over the French Mediterranean region (Berthou et al., 2020; Caillaud et al., 2021; Fumière et al., 2020; Lenderink et al., 2019) recently forced by CMIP5 models (Pichelli et al., 2021) and for other seasons and areas (Kendon et al., 2012; Armon et al., 2020; Ban et al., 2020; Knist et al., 2018; Ban et al., 2021). We also note that our findings remain similar when all results from the CPSs are upscaled to match the resolution of the EUR-11 that is usually applied in high-resolution model evaluation by several studies.
We also find that the behaviour of CPS simulations is modulated by their driving GCM simulations given that they share the same regional climate model (e.g. WRF). The biases of the driving GCMs can be conveyed into the EUR-11 simulations and hence to the CPS simulations. For example, the downscaling experiments of the HadGEM2-ES show the best performance compared to others at the same resolution, while those from NorESM1-M show larger dry biases compared to the rest. We have verified that the bias in sea surface temperature (SST) over the French Mediterranean region during the 12 heaviest precipitation events was underestimated by over 2 ∘C by NorESM1-M, while the others showed slight overestimation (figure not shown here). The decrease in SST weakens the convection, hence potentially affecting the extreme precipitation (Lebeaupin et al., 2006). This emphasizes the role of boundary conditions in the feedback of nested domains.
Both EUR-11 and CPS simulations can reproduce the moisture transport hitting the Cévennes with slightly better agreement of CPS with ERA5 in terms of the mean amount of moisture in the Cévennes box. Even though the moisture source is well presented in all simulations, with a slight enhancement in CPS simulations, only three CPS simulations are able to reproduce realistic sub-daily extreme precipitation over the Cévennes. It can be deduced that convection-permitting features, higher resolution, better representation of complex orography, and a better supply of moisture can all play a role in the added value of convection-permitting simulations.
One of the remaining inherent problems in evaluating long simulations at the hourly timescale is the uncertainty in observations (as mentioned in Ban et al., 2014, 2021). The 3-hourly observational dataset used in this research started at different times among stations. In addition, the coverage of stations, especially inside the Cévennes box, is limited only to the southeastern part of the area. A large part in the north of the Cévennes range, where a lot of heavy rainfall happened, is missing (as shown by COMEPHORE data). The COMEPHORE data, which are the combination of radar measurement and in situ observations, provide a better representation of the spatial distribution of heavy rainfall. Even though these data also contain a lot of uncertainty, which comes from poor observations and radar information over the complex topography, their quality over the Cévennes is sufficient (as discussed in Fumière et al., 2020). However, the length of this dataset is quite short, and its observation period is different from the simulations in this research.
We conclude that a convection-permitting approach with the WRF regional climate model appears to provide a fairly realistic representation of extreme daily and 3-hourly rainfall simulations. Their similarity to observations allows for use in climate change studies and their impacts. They should provide more reliable simulations than GCMs or even the high-resolution EURO-CORDEX simulations. However, we suggest using a multi-model approach to have a better consideration of the sensitivity of this variable to different model dynamics or microphysical schemes (Ban et al., 2021; Pichelli et al., 2021).
The ERA5 reanalysis data can be found at the Copernicus Climate Data Store, and the EURO-CORDEX simulations can be found at https://doi.org/10.24381/cds.adbb2d47 (Hersbach et al., 2018)..
The supplement related to this article is available online at: https://doi.org/10.5194/esd-13-687-2022-supplement.
LNL, RV, and PY conceived the study. LNL set up and ran the convection-permitting simulations, designed the article, analysed the data, produced all figures, and drafted the first version. JMS prepared and provided daily maximum 3-hourly precipitation data. All authors contributed to discussion, proofreading, and polishing the text as well as the revision process.
The contact author has declared that neither they nor their co-authors have any competing interests.
Publisher's note: Copernicus Publications remains neutral with regard to jurisdictional claims in published maps and institutional affiliations.
Linh N. Luu was supported by the Commissariat à l'Energie Atomique et aux eìnergies alternatives (CEA).
This research has been supported by ERC (grant no. 338965-A2C2) and the EUPHEME project, which is part of ERA4CS, an ERA-NET initiated by JPI Climate and co-funded by the European Union (grant no. 690462). This work is also part of the convention on financial support for climate services supported by the French Ministry for an Ecological and Solidary Transition.
This paper was edited by Christian Franzke and reviewed by three anonymous referees.
Adinolfi, M., Raffa, M., Reder, A., and Mercogliano, P.: Evaluation and Expected Changes of Summer Precipitation at Convection Permitting Scale with COSMO-CLM over Alpine Space, Atmosphere, 12, 54, https://doi.org/10.3390/atmos12010054, 2021.
Armon, M., Marra, F., Enzel, Y., Rostkier-Edelstein, D., and Morin, E.: Radar-based characterisation of heavy precipitation in the eastern Mediterranean and its representation in a convection-permitting model, Hydrol. Earth Syst. Sci., 24, 1227–1249, https://doi.org/10.5194/hess-24-1227-2020, 2020.
Ban, N., Schmidli, J., and Schär, C.: Evaluation of the convection-resolving regional climate modeling approach in decade-long simulations, J. Geophys. Res.-Atmos., 119, 7889–7907, 2014.
Ban, N., Rajczak, J., Schmidli, J., and Schär, C.: Analysis of Alpine precipitation extremes using generalized extreme value theory in convection-resolving climate simulations, Clim. Dynam., 55, 61–75, 2020.
Ban, N., Caillaud, C., Coppola, E., Pichelli, E., Sobolowski, S., Adinolfi, M., Ahrens, B., Alias, A., Anders, I., Bastin, S., Beluši ́c, D., Berthou, S., Brisson, E., Cardoso, R. M., Chan, S. C., Christensen, O. B., Fernández, J., Fita, L., Frisius, T., Gašparac, G., Giorgi, F., Goergen, K., Haugen, J. E., Øivind Hodnebrog, Kartsios, S., Katragkou, E., Kendon, E. J., Keuler, K., Lavin-Gullon, A., Lenderink, G., Leutwyler, D., Lorenz, T., Maraun, D., Mercogliano, P., Milovac, J., Panitz, H.-J., Raffa, M., Remedio, A. R., Schär, C., Soares, P. M. M., Srnec, L., Steensen, B. M., Stocchi, P., Tölle, M. H., Truhetz, H., Vergara-Temprado, J., de Vries, H., Warrach-Sagi, K., Wulfmeyer, V., and Zander, M. J.: The first multi-model ensemble of regional climate simulations at kilometer-scale resolution, part I: evaluation of precipitation, Clim. Dynam., 57, 275–302, https://doi.org/10.1007/s00382-021-05708-w, 2021.
Berthou, S., Kendon, E. J., Chan, S. C., Ban, N., Leutwyler, D., Schär, C., and Fosser, G.: Pan-European climate at convection-permitting scale: a model intercomparison study, Clim. Dynam., 55, 35–59, https://doi.org/10.1007/s00382-018-4114-6, 2020.
Boessenkool, B., Bürger, G., and Heistermann, M.: Effects of sample size on estimation of rainfall extremes at high temperatures, Nat. Hazards Earth Syst. Sci., 17, 1623–1629, https://doi.org/10.5194/nhess-17-1623-2017, 2017.
Caillaud, C., Somot, S., Alias, A., Bernard-Bouissières, I., Fumière, Q., Laurantin, O., Seity, Y., and Ducrocq, V.: Modelling Mediterranean heavy precipitation events at climate scale: an object-oriented evaluation of the CNRM-AROME convection-permitting regional climate model, Clim. Dynam., 56, 1717–1752, https://doi.org/10.1007/s00382-020-05558-y, 2021.
Chan, S. C., Kendon, E. J., Fowler, H. J., Blenkinsop, S., Ferro, C. A. T., and Stephenson, D. B.: Does increasing the spatial resolution of a regional climate model improve the simulated daily precipitation?, Clim. Dynam., 41, 1475–1495, 2013.
Chan, S. C., Kendon, E. J., Fowler, H. J., Blenkinsop, S., Roberts, N. M., and Ferro, C. A. T.: The value of high-resolution met office regional climate models in the simulation of multihourly precipitation extremes, J. Climate, 27, 6155–6174, 2014.
Chan, S. C., Kendon, E. J., Berthou, S., Fosser, G., Lewis, E., and Fowler, H. J.: Europe-wide precipitation projections at convection permitting scale with the Unified Model, Clim. Dynam., 55, 409–428, https://doi.org/10.1007/s00382-020-05192-8, 2020.
Coppola, E., Sobolowski, S., Pichelli, E., Raffaele, F., Ahrens, B., Anders, I., Ban, N., Bastin, S., Belda, M., and Belusic, D.: A first-of-its-kind multi-model convection permitting ensemble for investigating convective phenomena over Europe and the Mediterranean, Clim. Dynam., 55, 3–34, 2020.
Coppola, E., Nogherotto, R., Ciarlò, J. M., Giorgi, F., van Meijgaard, E., Iles, C., Kadygrov, N., Corre, M. S. L., Somot, S., Nabat, P., Vautard, R., Levavasseur, G., Schwingshackl, C., Sillmann, J., Kjellström, E., Nikulin, G., Aalbers, E., Lenderink, G., Christensen, O. B., Boberg, F., Sørland, S. L., Demory, M.-E., Bülow, K., and Teichmann, C.: Assessment of the European climate projections as simulated by the large EURO-CORDEX regional climate model ensemble, J. Geophys. Res., 2020b.
Dee, D. P., Uppala, S. M., Simmons, A. J., Berrisford, P., Poli, P., Kobayashi, S., Andrae, U., Balmaseda, M. A., Balsamo, G., Bauer, P., Bechtold, P., Beljaars, A. C. M., van de Berg, L., Bidlot, J., Bormann, N., Delsol, C., Dragani, R., Fuentes, M., Geer, A. J., Haim- berger, L., Healy, S. B., Hersbach, H., Hólm, E. V., Isaksen, L., Kållberg, P., Köhler, M., Matricardi, M., McNally, A. P., Monge-Sanz, B. M., Morcrette, J.-J., Park, B.-K., Peubey, C., de Rosnay, P., Tavolato, C., Thépaut, J.-N., and Vitart, F.: The ERA-Interim reanalysis: configuration and performance of the data assimilation system, Q. J. Roy. Meteor. Soc., 137, 553–597, https://doi.org/10.1002/qj.828, 2011.
Delrieu, G., Nicol, J., Yates, E., Kirstetter, P.-E., Creutin, J.-D., Anquetin, S., Obled, C., Saulnier, G.-M., Ducrocq, V., Gaume, E., Payrastre, O., Andrieu, H., Ayral, P.-A., Bouvier, C., Neppel, L., Livet, M., Lang, M., du Châtelet, J. P., Walpersdorf, A., and Wobrock, W.: The Catastrophic Flash-Flood Event of 8–9 September 2002 in the Gard Region, France: A First Case Study for the Cévennes–Vivarais Mediterranean Hydrometeorological Observatory, J. Hydrometeorol., 6, 34–52, https://doi.org/10.1175/jhm-400.1, 2005.
Drobinski, P., Ducrocq, V., Alpert, P., Anagnostou, E., Béranger, K., Borga, M., Braud, I., Chanzy, A., Davolio, S., Delrieu, G., Estournel, C., Boubrahmi, N. F., Font, J., Grubišić, V., Gualdi, S., Homar, V., Ivančan-Picek, B., Kottmeier, C., Kotroni, V., Lagouvardos, K., Lionello, P., Llasat, M. C., Ludwig, W., Lutoff, C., Mariotti, A., Richard, E., Romero, R., Rotunno, R., Roussot, O., Ruin, I., Somot, S., Taupier-Letage, I., Tintore, J., Uijlenhoet, R., and Wernli, H.: HyMeX: A 10-Year Multidisciplinary Program on the Mediterranean Water Cycle, B. Am. Meteorol. Soc., 95, 1063–1082, https://doi.org/10.1175/bams-d-12-00242.1, 2014.
Drobinski, P., Alonzo, B., Bastin, S., Silva, N. Da, and Muller, C.: Scaling of precipitation extremes with temperature in the French Mediterranean region: What explains the hook shape?, J. Geophys. Res.-Atmos., 121, 3100–3119, https://doi.org/10.1002/2015jd023497, 2016.
Ducrocq, V, Nuissier, O., Ricard, D., Lebeaupin, C., and Thouvenin, T.: A numerical study of three catastrophic precipitating events over southern France. II: Mesoscale triggering and stationarity factors, Q. J. Roy. Meteor. Soc., 134, 131–145, https://doi.org/10.1002/qj.199, 2008.
Ducrocq, V., Braud, I., Davolio, S., Ferretti, R., Flamant, C., Jansa, A., Kalthoff, N., Richard, E., Taupier-Letage, I., Ayral, P., Belamari, S., Berne, A., Borga, M., Boudevillain, B., Bock, O., Boichard, J., Bouin, M., Bousquet, O., Bouvier, C., Chiggiato, J., Cimini, D., Corsmeier, U., Coppola, L., Cocquerez, P., Defer, E., Delanoë, J., Di Girolamo, P., Doerenbecher, A., Drobinski, P., Dufournet, Y., Fourrié, N., Gourley, J. J., Labatut, L., Lambert, D., Le Coz, J., Marzano, F. S., Molinié, G., Montani, A., Nord, G., Nuret, M., Ramage, K., Rison, W., Roussot, O., Said, F., Schwarzenboeck, A., Testor, P., Van Baelen, J., Vincendon, B., Aran, M., and Tamayo, J.: HyMeX-SOP1: The Field Campaign Dedicated to Heavy Precipitation and Flash Flooding in the Northwestern Mediterranean, B. Am. Meteorol. Soc., 95, 1083–1100, https://doi.org/10.1175/bams-d-12-00244.1, 2014.
Feng, Z., Leung, L. R., Jr, R. A. H., Hagos, S., Hardin, J., Yang, Q., Han, B., and Fan, J.: Structure and Evolution of Mesoscale Convective Systems: Sensitivity to Cloud Microphysics in Convection-Permitting Simulations Over the United States, J. Adv. Model. Earth Sy., 10, 1470–1494, 2018.
Fosser, G., Khodayar, S., and Berg, P.: Benefit of convection permitting climate model simulations in the representation of convective precipitation, Clim. Dynam., 44, 45–60, 2015.
Fresnay, S., Hally, A., Garnaud, C., Richard, E., and Lambert, D.: Heavy precipitation events in the Mediterranean: sensitivity to cloud physics parameterisation uncertainties, Nat. Hazards Earth Syst. Sci., 12, 2671–2688, https://doi.org/10.5194/nhess-12-2671-2012, 2012.
Fumière, Q., Déqué, M., Nuissier, O., Somot, S., Alias, A., Caillaud, C., Laurantin, O., and Seity, Y.: Extreme rainfall in Mediterranean France during the fall: added value of the CNRM-AROME Convection-Permitting Regional Climate Model, Clim. Dynam., 55, 77–91, 2020.
Giorgi, F.: Climate change hot-spots, Geophys. Res. Lett., 33, L08707, https://doi.org/10.1029/2006gl025734, 2006.
Giorgi, F. and Mearns, L. O.: Introduction to special section: Regional climate modeling revisited, J. Geophys. Res.-Atmos., 104, 6335–6352, 1999.
Hardwick Jones, R., Westra, S., and Sharma, A.: Observed relationships between extreme sub-daily precipitation, surface temperature, and relative humidity, Geophys. Res. Lett., , 37, L22805, https://doi.org/10.1029/2010GL045081, 2010.
Hersbach, H., Bell, B., Berrisford, P., Biavati, G., Horányi, A., Muñoz Sabater, J., Nicolas, J., Peubey, C., Radu, R., Rozum, I., Schepers, D., Simmons, A., Soci, C., Dee, D., and Thépaut, J.-N.: ERA5 hourly data on single levels from 1979 to present, Copernicus Climate Change Service (C3S) Climate Data Store (CDS) [data set], https://doi.org/10.24381/cds.adbb2d47, 2018.
Hersbach, H., Bell, B., Berrisford, P., Hirahara, S., Horányi, A., Muñoz-Sabater, J., Nicolas, J., Peubey, C., Radu, R., Schepers, D., Simmons, A., Soci, C., Abdalla, S., Abellan, X., Balsamo, G., Bechtold, P., Biavati, G., Bidlot, J., Bonavita, M., Chiara, G. D., Dahlgren, P., Dee, D., Diamantakis, M., Dragani, R., Flemming, J., Forbes, R., Fuentes, M., Geer, A., Haimberger, L., Healy, S., Hogan, R. J., Hólm, E., Janisková, M., Keeley, S., Laloyaux, P., Lopez, P., Lupu, C., Radnoti, G., de Rosnay, P., Rozum, I., Vamborg, F., Vil- laume, S., and Thépaut, J.-N.: The ERA5 global reanalysis, Q. J. Roy. Meteor. Soc., 146, 1999–2049, https://doi.org/10.1002/qj.3803, 2020.
Hodnebrog, Ø, Marelle, L., Alterskjær, K., Wood, R. R., Ludwig, R., Fischer, E. M., Richardson, T. B., Forster, P. M., Sillmann, J., and Myhre, G.: Intensification of summer precipitation with shorter time-scales in Europe, Environ. Res. Lett., 14, 124050, https://doi.org/10.1088/1748-9326/ab549c, 2019.
Hohenegger, C., Brockhaus, P., and Schaer, C.: Towards climate simulations at cloud-resolving scales, Meteorol. Z., 17, 383–394, 2008.
Houze, R. A.: Mesoscale convective systems, Rev. Geophys., 42, 1–43, https://doi.org/10.1029/2004RG000150, 2004.
Iacono, M. J., Delamere, J. S., Mlawer, E. J., Shephard, M. W., Clough, S. A., and Collins, W. D.: Radiative forcing by long-lived greenhouse gases: Calculations with the AER radiative transfer models, J. Geophys. Res.-Atmos., 113, D13103, https://doi.org/10.1029/2008JD009944, 2008.
Jacob, D., Petersen, J., Eggert, B., Alias, A., Christensen, O. B., Bouwer, L. M., Braun, A., Colette, A., Déqué, M., Georgievski, G., Georgopoulou, E., Gobiet, A., Menut, L., Nikulin, G., Haensler, A., Hempelmann, N., Jones, C., Keuler, K., Kovats, S., Kröner, N., Kotlarski, S., Kriegsmann, A., Martin, E., van Meijgaard, E., Moseley, C., Pfeifer, S., Preuschmann, S., Radermacher, C., Radtke, K., Rechid, D., Rounsevell, M., Samuelsson, P., Somot, S., Soussana, J.-F., Teichmann, C., Valentini, R., Vautard, R., Weber, B., and Yiou, P.: EURO-CORDEX: new high-resolution climate change projections for European impact research, Reg. Environ. Change, 14, 563–578, https://doi.org/10.1007/s10113-013-0499-2, 2014.
Janjic, Z. I.: The Surface Layer Parameterization in the NCEP Eta Model, Research Activities in Atmospheric and Oceanic Modelling, WMO, Geneva, CAS/JSC WGNE, 4.16–4.17, 1996.
Jones, P. W.: First- and Second-Order Conservative Remapping Schemes for Grids in Spherical Coordinates, Mon. Weather Rev., 127, 2204–2210, https://doi.org/10.1175/1520-0493(1999)127<2204:FASOCR>2.0.CO;2, 1999.
Kendon, E. J., Roberts, N. M., Senior, C. A., and Roberts, M. J.: Realism of rainfall in a very high-resolution regional climate model, J. Climate, 25, 5791–5806, 2012.
Kendon, E. J., Ban, N., Roberts, N. M., Fowler, H. J., Roberts, M. J., Chan, S. C., Evans, J. P., Fosser, G., and Wilkinson, J. M.: Do convection-permitting regional climate models improve projections of future precipitation change?, B. Am. Meteorol. Soc., 98, 79–93, 2017.
Kendon, E. J., Stratton, R. A., Tucker, S., Marsham, J. H., Berthou, S., Rowell, D. P., and Senior, C. A.: Enhanced future changes in wet and dry extremes over Africa at convection-permitting scale, Nat. Commun., 10, 1794, https://doi.org/10.1038/s41467-019-09776-9, 2019.
Knist, S., Goergen, K., and Simmer, C.: Evaluation and projected changes of precipitation statistics in convection-permitting WRF climate simulations over Central Europe, Clim. Dynam., 55, 325–341, 2018.
Kotlarski, S., Keuler, K., Christensen, O. B., Colette, A., Déqué, M., Gobiet, A., Goergen, K., Jacob, D., Lüthi, D., van Meijgaard, E., Nikulin, G., Schär, C., Teichmann, C., Vautard, R., Warrach-Sagi, K., and Wulfmeyer, V.: Regional climate modeling on European scales: a joint standard evaluation of the EURO-CORDEX RCM ensemble, Geosci. Model Dev., 7, 1297–1333, https://doi.org/10.5194/gmd-7-1297-2014, 2014.
Langhans, W., Schmidli, J., Fuhrer, O., Bieri, S., and Schär, C.: Long-term simulations of thermally driven flows and orographic convection at convection-parameterizing and cloud-resolving resolutions, J. Appl. Meteorol. Clim., 52, 1490–1510, 2013.
Lebeaupin, C., Ducrocq, V., and Giordani, H.: Sensitivity of torrential rain events to the sea surface temperature based on high-resolution numerical forecasts, J. Geophys. Res.-Atmos., 111, D12110, https://doi.org/10.1029/2005JD006541, 2006.
Lee, K.-O., Flamant, C., Duffourg, F., Ducrocq, V., and Chaboureau, J.-P.: Impact of upstream moisture structure on a back-building convective precipitation system in south-eastern France during HyMeX IOP13, Atmos. Chem. Phys., 18, 16845–16862, https://doi.org/10.5194/acp-18-16845-2018, 2018.
Lélé, M. I., Leslie, L. M., and Lamb, P. J.: Analysis of Low-Level Atmospheric Moisture Transport Associated with the West African Monsoon, J. Climate, 28, 4414–4430, https://doi.org/10.1175/jcli-d-14-00746.1, 2015.
Lenderink, G. and Attema, J.: A simple scaling approach to produce climate scenarios of local precipitation extremes for the Netherlands, Environ. Res. Lett., 10, 85001, https://doi.org/10.1088/1748-9326/10/8/085001, 2015.
Lenderink, G. and Van Meijgaard, E.: Increase in hourly precipitation extremes beyond expectations from temperature changes, Nat. Geosci., 1, 511, https://doi.org/10.1038/ngeo262, 2008.
Lenderink, Barbero, R., Loriaux, J. M., and Fowler, H. J.: Super-Clausius–Clapeyron scaling of extreme hourly convective precipitation and its relation to large-scale atmospheric conditions, J. Climate, 30, 6037–6052, 2017.
Lenderink, G., Belušić, D., Fowler, H. J., Kjellström, E., Lind, P., van Meijgaard, E., van Ulft, B., and de Vries, H.: Systematic increases in the thermodynamic response of hourly precipitation extremes in an idealized warming experiment with a convection-permitting climate model, Environ. Res. Lett., 14, 74012, https://doi.org/10.1088/1748-9326/ab214a, 2019.
Lind, P., Beluši ́c, D., Christensen, O. B., Dobler, A., Kjellström, E., Landgren, O., Lindstedt, D., Matte, D., Pedersen, R. A., Toivonen, E., and Wang, F.: Benefits and added value of convection-permitting climate modeling over Fenno-Scandinavia, Clim. Dynam., 55, 1893–1912, https://doi.org/10.1007/s00382-020-05359-3, 2020.
Llasat, M. C., Llasat-Botija, M., Petrucci, O., Pasqua, A. A., Rosselló, J., Vinet, F., and Boissier, L.: Towards a database on societal impact of Mediterranean floods within the framework of the HYMEX project, Nat. Hazards Earth Syst. Sci., 13, 1337–1350, https://doi.org/10.5194/nhess-13-1337-2013, 2013.
Luu, L. N., Vautard, R., Yiou, P., van Oldenborgh, G. J., and Lenderink, G.: Attribution of Extreme Rainfall Events in the South of France Using EURO-CORDEX Simulations, Geophys. Res. Lett., 45, 6242–6250, https://doi.org/10.1029/2018GL077807, 2018.
Meredith, E. P., Ulbrich, U., and Rust, H. W.: Subhourly rainfall in a convection-permitting model, Environ. Res. Lett., 15, 34031, https://doi.org/10.1088/1748-9326/ab6787, 2020.
Nakanishi, M. and Niino, H.: An Improved Mellor–Yamada Level-3 Model: Its Numerical Stability and Application to a Regional Prediction of Advection Fog, Bound.-Lay. Meteorol., 119, 397–407, https://doi.org/10.1007/s10546-005-9030-8, 2006.
Nuissier, O., Ducrocq, V., Ricard, D., Lebeaupin, C., and Anquetin, S.: A numerical study of three catastrophic precipitating events over southern France. I: Numerical framework and synoptic ingredients, Q. J. Roy. Meteor. Soc., 134, 111–130, 2008.
Nuissier, O., Joly, B., Joly, A., Ducrocq, V., and Arbogast, P.: A statistical downscaling to identify the large-scale circulation patterns associated with heavy precipitation events over southern France, Q. J. Roy. Meteor. Soc., 137, 1812–1827, https://doi.org/10.1002/qj.866, 2011.
Pall, P., Allen, M. R., and Stone, D. A.: Testing the Clausius–Clapeyron constraint on changes in extreme precipitation under CO2 warming, Clim. Dynam., 28, 351–363, https://doi.org/10.1007/s00382-006-0180-2, 2007.
Palmer, T. and Stevens, B.: The scientific challenge of understanding and estimating climate change, P. Natl. Acad. Sci. USA, 116, 24390–24395, https://doi.org/10.1073/pnas.1906691116, 2019.
Pichelli, E., Coppola, E., Sobolowski, S., Ban, N., Giorgi, F., Stocchi, P., Alias, A., Beluši ́c, D., Berthou, S., Caillaud, C., Cardoso, R. M., Chan, S., Christensen, O. B., Dobler, A., de Vries, H., Goergen, K., Kendon, E. J., Keuler, K., Lenderink, G., Lorenz, T., Mishra, A. N., Panitz, H.-J., Schär, C., Soares, P. M. M., Truhetz, H., and Vergara-Temprado, J.: The first multi-model ensemble of regional climate simulations at kilometer-scale resolution part 2: historical and future simulations of precipitation, Clim. Dynam., 56, 3581–3602, https://doi.org/10.1007/s00382-021-05657-4, 2021.
Prein, A. F., Gobiet, A., Suklitsch, M., Truhetz, H., Awan, N. K., Keuler, K., and Georgievski, G.: Added value of convection permitting seasonal simulations, Clim. Dynam., 41, 2655–2677, https://doi.org/10.1007/s00382-013-1744-6, 2013.
Prein, A. F., Langhans, W., Fosser, G., Ferrone, A., Ban, N., Goergen, K., Keller, M., Tölle, M., Gutjahr, O., and Feser, F.: A review on regional convection-permitting climate modeling: Demonstrations, prospects, and challenges, Rev. Geophys., 53, 323–361, https://doi.org/10.1002/2014RG000475, 2015.
Quintana-Seguí, P., Moigne, P. L., Durand, Y., Martin, E., Habets, F., Baillon, M., Canellas, C., Franchisteguy, L., and Morel, S.: Analysis of Near-Surface Atmospheric Variables: Validation of the SAFRAN Analysis over France, J. Appl. Meteorol. Clim., 47, 92–107, https://doi.org/10.1175/2007jamc1636.1, 2008.
Ricard, D., Ducrocq, V., and Auger, L.: A Climatology of the Mesoscale Environment Associated with Heavily Precipitating Events over a Northwestern Mediterranean Area, J. Appl. Meteorol. Clim., 51, 468–488, https://doi.org/10.1175/JAMC-D-11-017.1, 2012.
de Rooy, W. C., Bechtold, P., Fröhlich, K., Hohenegger, C., Jonker, H., Mironov, D., Siebesma, A. P., Teixeira, J., and Yano, J.-I.: Entrainment and detrainment in cumulus convection: an overview, Q. J. Roy. Meteor. Soc., 139, 1–19, https://doi.org/10.1002/qj.1959, 2013.
Scaff, L., Prein, A. F., Li, Y., Liu, C., Rasmussen, R., and Ikeda, K.: Simulating the convective precipitation diurnal cycle in North America's current and future climate, Clim. Dynam., 55, 369–382, https://doi.org/10.1007/s00382-019-04754-9, 2019.
Tabary, P., Dupuy, P., L’Henaff, G., Gueguen, C., Moulin, L., Laurantin, O., Merlier, C., and Soubeyroux, J.-M.: A 10-year (1997–2006) reanalysis of quantitative precipitation estimation over France: methodology and first results, IAHS P., 351, 255–260, 2012.
Taylor, K. E., Stouffer, R. J., and Meehl, G. A.: An Overview of CMIP5 and the Experiment Design, B. Am. Meteorol. Soc., 93, 485–498, https://doi.org/10.1175/bams-d-11-00094.1, 2012.
Thompson, G., Field, P. R., Rasmussen, R. M., and Hall, W. D.: Explicit Forecasts of Winter Precipitation Using an Improved Bulk Microphysics Scheme. Part II: Implementation of a New Snow Parameterization, Mon. Weather Rev., 136, 5095–5115, https://doi.org/10.1175/2008mwr2387.1, 2008.
Trenberth, K. E.: Observational needs for climate prediction and adaptation, Bulletin of the World Meteorological Organization, 57, 17–21, 2008.
Trenberth, K. E., Dai, A., Rasmussen, R. M., and Parsons, D. B.: The Changing Character of Precipitation, B. Am. Meteorol. Soc., 84, 1205–1218, https://doi.org/10.1175/bams-84-9-1205, 2003.
Tuel, A. and Eltahir, E. A. B.: Why Is the Mediterranean a Climate Change Hot Spot?, J. Climate, 33, 5829–5843, https://doi.org/10.1175/JCLI-D-19-0910.1, 2020.
Vanden Broucke, S., Wouters, H., Demuzere, M., and van Lipzig, N. P. M.: The influence of convection-permitting regional climate modeling on future projections of extreme precipitation: dependency on topography and timescale, Clim. Dynam., 52, 5303–5324, https://doi.org/10.1007/s00382-018-4454-2, 2019
Vautard, R., Yiou, P., van Oldenborgh, G.-J., Lenderink, G., Thao, S., Ribes, A., Planton, S., Dubuisson, B., and Soubeyroux, J.-M.: Extreme fall 2014 precipitation in the Cévennes mountains, B. Am. Meteorol. Soc., 96, S56–S60, 2015.
Vautard, R., Kadygrov, N., Iles, C., Boberg, F., Buonomo, E., Bülow, K., Coppola, E., Corre, L., van Meijgaard, E., Nogherotto, R., Sandstad, M., Schwingshackl, C., Somot, S., Aalbers, E., Christensen, O. B., Ciarlo‘, J. M., Demory, M.-E., Giorgi, F., Jacob, D., Jones, R. G., Keuler, K., Kjellström, E., Lenderink, G., Levavasseur, G., Nikulin, G., Sillmann, J., Sørland, S. L., Solidoro, C., Steger, C., Teichmann, C., Warrach-Sagi, K., and Wulfmeyer, V.: Evaluation of the large EURO-CORDEX regional climate model ensemble, J. Geophys. Res., 2020.
Vergara-Temprado, J., Ban, N., and Schär, C.: Extreme Sub-Hourly Precipitation Intensities Scale Close to the Clausius-Clapeyron Rate Over Europe, Geophys. Res. Lett., 48, e2020GL089506, https://doi.org/10.1029/2020GL089506, 2021.
Vidal, J.-P., Martin, E., Franchistéguy, L., Baillon, M., and Soubeyroux, J.-M.: A 50-year high-resolution atmospheric reanalysis over France with the Safran system, Int. J. Climatol., 30, 1627–1644, https://doi.org/10.1002/joc.2003, 2010.
Westra, S., Fowler, H. J., Evans, J. P., Alexander, L. V., Berg, P., Johnson, F., Kendon, E. J., Lenderink, G., and Roberts, N. M.: Future changes to the intensity and frequency of short-duration extreme rainfall, Rev. Geophys., 52, 522–555, https://doi.org/10.1002/2014rg000464, 2014.
Yang, Y., Uddstrom, M., and Duncan, M.: Effects of short spin-up periods on soil moisture simulation and the causes over New Zealand, J. Geophys. Res.-Atmos., 116, D24108, https://doi.org/10.1029/2011jd016121, 2011.
Zittis, G., Bruggeman, A., Camera, C., Hadjinicolaou, P., and Lelieveld, J.: The added value of convection permitting simulations of extreme precipitation events over the eastern Mediterranean, Atmos. Res., 191, 20–33, 2017.