the Creative Commons Attribution 4.0 License.
the Creative Commons Attribution 4.0 License.
 | 21 Feb 2022
Spatiotemporal patterns and drivers of terrestrial dissolved organic carbon (DOC) leaching into the European river network
Céline Gommet
Ronny Lauerwald
Philippe Ciais
Bertrand Guenet
Haicheng Zhang
Pierre Regnier
Leaching of dissolved organic carbon (DOC) from soils into the river network is an important component of the land carbon (C) budget. At regional to global scales, its significance has been estimated through simple mass budgets, often using multi-year averages of observed fluvial DOC fluxes as a proxy of DOC leaching due to the limited availability of observations of the leaching flux itself. This procedure leads to a systematic underestimation of the leaching flux because of the decay of DOC during fluvial transport. Moreover, this procedure does not allow for revealing spatiotemporal variability in DOC leaching from soils, which is vital to better understand the drivers of DOC leaching and its impact on the local soil C budget. In this study, we use the land surface model (LSM) ORCHILEAK to simulate the terrestrial C budget, including leaching of DOC from the soil and its subsequent reactive transport through the river network of Europe. The model performance is evaluated not only against the sparse observations of the soil DOC leaching rate, but also against the more abundant observations of fluxes and reactivity of DOC in rivers, providing further evidence that our simulated DOC fluxes are realistic. The model is then used to simulate the spatiotemporal patterns of DOC leaching across Europe over the period 1972–2012, quantifying both the environmental drivers of these patterns and the impact of DOC leaching on the land C budget. Over the simulation period, we find that, on average, 14.3 Tg C yr−1 of DOC is leached from land into European rivers, which is about 0.6 % of the terrestrial net primary production (NPP), a fraction significantly lower than that reported for tropical river networks. On average, 12.3 Tg C yr−1 of the leached DOC is finally exported to the coast via the river network, and the rest is respired during transit. DOC leaching presents a large seasonal variability, with the maximum occurring in winter and the minimum in summer, except for most parts of northern Europe, where the maximum occurs in spring due to snowmelt. The DOC leaching rate is generally low in warm and dry regions, and high in the cold and wet regions of Europe. Furthermore, runoff and the ratio between runoff from shallower flow paths on one hand and deep drainage and groundwater flow on the other hand are the main drivers of the spatiotemporal variation of DOC leaching. Temperature, as a major control of DOC production and decomposition rates in the soils, plays only a secondary role.
- Article
(5520 KB) - Full-text XML
-
Supplement
(812 KB) - BibTeX
- EndNote


Terrestrial ecosystems are an important carbon (C) sink as they absorb about one-fourth of anthropogenic CO2 emissions and store this C in plant biomass and soil carbon pools (Friedlingstein et al., 2020). This terrestrial C sink mitigates the growth rate of atmospheric CO2 concentration and thus plays an important role in regulating climate change (Ciais et al., 2013). However, the efficiency of that sink is partly alleviated by the permanent, lateral leaching of C from soils, through the river network down into the ocean (Regnier et al., 2013). An accurate understanding of lateral C fluxes through the river network is thus necessary to better understand the global C cycling and to inform policies of climate change mitigation (Le Quéré et al., 2018).
The identification of riverine C transfers as a key component of the continental C budget constituted an important paradigm shift in our understanding of the global C cycle (Cole et al., 2007). More recently, riverine C cycling was also shown to be affected by anthropogenic perturbation and thus to be an element of the anthropogenic CO2 budget (Regnier et al., 2013; Le Quéré et al., 2015). Anthropogenic perturbations of riverine C fluxes are manifold and comprise direct impacts through changing C and nutrient inputs following land-use change and agricultural activities, wastewater discharge and hydraulic management (e.g., Tian et al., 2015; Lauerwald et al., 2020; Hastie et al., 2021; Maavara et al., 2017). There are also indirect impacts following climate change and changes in atmospheric composition. Together, these perturbations have accelerated the turnover of C along the terrestrial–inland water continuum. The terrestrial C sink, which is classically estimated without taking into account C exports through the river network, is thus generally overestimated (Regnier et al., 2013; Lauerwald et al., 2020).
The integration of riverine C transfers into the terrestrial C budget requires the quantification of the amount of C lost from soils to the river network. Due to the scarcity of observational data, this flux is not easy to estimate using empirical methods. At a global scale, this flux was constrained through budget closure based on estimates of riverine C exports to the coast and estimates of C losses to the atmosphere and aquatic sediments during transport. The existing global estimates of these soil C exports to the river network, as synthesized by Drake et al. (2018), range from 1.1 to 5.1 Pg C yr−1 – a huge uncertainty range reflecting the limitations of empirical estimation approaches and the paucity of underlying data. Over the past decade, a new generation of land surface models (LSMs) have been developed that represent the export of C from soils to the river network, and in some cases even the transport and cycling of these terrestrial C loads along the river network down to the coast (Smith et al. 2010; Kicklighter et al. 2013; Tian et al., 2015; Lauerwald et al., 2017; Nakhavali et al., 2018). With the exception of the study of Tian et al. (2015), these studies all focus on the lateral export of dissolved organic C (DOC), which is a product of the incomplete decomposition of plant litter and soil organic carbon (SOC). These mechanistically based models allow prediction of the leaching of DOC in unmonitored regions and assessment of spatial and temporal variability which, to date, can only be poorly resolved using empirical methods. Moreover, these approaches link the C exports from soils to the river network to the terrestrial C cycle, and thus allow for directly assessing the role of these C exports in the terrestrial C budget, its perturbation through changes in land use, climate and atmospheric chemistry and its impact on the terrestrial sink for anthropogenic CO2 emissions.
In this study, we use the LSM ORCHILEAK (Lauerwald et al., 2017), a branch of the IPSL-LSCE LSM ORCHIDEE (Krinner et al., 2005), to quantify the DOC leaching from soils and its effects on the terrestrial C budget in Europe. ORCHILEAK not only simulates the vertical C cycling between vegetation, soils and the atmosphere in response to the climate, atmospheric CO2 concentrations and land-use change, but also represents the lateral exports of DOC from soils to the river network, as well as the reactive transport of this DOC through the river network. To our knowledge, only one study (Kindler et al., 2011) has estimated soil DOC leaching flux based on runoff and direct observations of DOC concentrations in soil water for various locations across Europe. Thus, this empirical assessment will be used to evaluate the simulated DOC leaching fluxes in this study. Further, we evaluate simulated against observed riverine DOC fluxes, which are obtained from different water quality surveys and scientific publications. Assuming a realistic representation of DOC reactivity in the river network, which is to be evaluated against observations as well, this model–data comparison of riverine DOC fluxes represents a valuable and additional possibility to assess the validity of simulated soil DOC leaching.
So far, ORCHILEAK has been successfully tested and applied on large, near-natural river systems such as the Amazon (Lauerwald et al., 2017, 2020; Hastie et al., 2019), the Congo (Hastie et al. 2021) and the Lena rivers, with a version also including some specific permafrost-related mechanisms (Bowring et al., 2019, 2020). In this study, for the first time, ORCHILEAK is applied to, and evaluated for, the European river network, which is subject to direct impacts of agricultural land use in contrast to more natural river basins. For this reason, we devote special attention to manure application as an anthropogenic non-point source of DOC for the river network, while we assume that for the period of simulation (1979–2012), due to the quality of sewage water treatment, anthropogenic point sources of DOC are now negligible for most parts of Europe. Moreover, as shown for instance by Meybeck (1986), DOC from sewage is highly labile and only affects concentration within short distances downstream of water processing plants. Avoiding observational data from sites that are known to be directly impacted by sewage inputs, we are able to evaluate model performance with regard to fluvial transfers of soil-derived DOC, which is the focus of our study.
Making full use of the capabilities of the ORCHILEAK model, we study in detail the spatiotemporal patterns in DOC leaching and its quantitative contribution to the terrestrial C budget across Europe. We investigate how specific climate zones in Europe differ with regard to seasonality in DOC leaching fluxes, which are hypothesized to be controlled by hydrology, litter fall and temperature effects on litter and SOC decomposition. We will further try to quantify the effect of these controls in the different climate zones of Europe. Finally, we strive to find out in which climate zone DOC leaching affects the terrestrial C budget the most.
2.1 ORCHILEAK
2.1.1 Model overview
ORCHILEAK (Lauerwald et al., 2017) is a branch of the model ORCHIDEE (Organizing Carbon and Hydrology in Dynamic Ecosystems; Krinner et al., 2005), the land surface component of the Institut Pierre-Simon Laplace (IPSL) Earth system model (ESM). ORCHIDEE simulates energy, water and C fluxes between the atmosphere and the land at a global scale. This LSM is based on four sub-modules. The first one, SECHIBA, simulates the energy budget (energy, carbon and water) between the atmosphere and the biosphere, as well as hydrology, which in the default setup used here are both represented using a 30 min time step. The second sub-module, adapted from the LPJ model (Sitch et al., 2003), represents the dynamics of vegetation distribution on long timescales (1 year), while the third one (STOMATE) simulates the C dynamics in vegetation and soils at a daily to sub-daily step (Krinner et al., 2005). Finally, the fourth sub-module handles the routing of water that is lost via surface runoff and drainage from soils to the ocean through the global river network (Polcher, 2003; Guimberteau et al., 2012), for which a daily time step is used. All processes are simulated on a horizontal model grid, the resolution of which can be adapted to that of the meteorological forcing files. In this study, simulations are run at a spatial resolution of 0.5∘. Moreover, in the default setup, up to 13 plant function types (PFTs; bare soil, eight types of forest, two types of grassland and two types of cropland) can be distinguished for each cell, for which C budgets are simulated individually, while energy and water budgets are simulated at the grid-cell level.
ORCHIDEE represents the soil C dynamics distinguishing different pools of plant litter and soil organic C over a 2 m profile. A branch of ORCHIDEE, called ORCHIDEE-SOM (Camino-Serrano et al., 2018), added a vertical discretization of these carbon pools over 11 layers and included the representation of DOC production and cycling within the soil column (see Sect. 2.1.2 for more details). ORCHILEAK was built on this branch and accounts for the coupled reactive transport processes impacting the dissolved C inputs from soils to the river network, including both DOC leaching from soils and CO2 produced by soil respiration, into the hydrologic routing scheme. Besides advective transport of carbon with the water flow, ORCHILEAK simulates the decomposition of DOC during riverine transport, the gas exchange of CO2 at the interface between the inland water and the atmosphere and the exchange of C between water column and soil column in inundated floodplains. For the representation of in-river DOC decomposition, two pools with different decay rates are distinguished, a slow (refractory DOC) and a fast (labile DOC) pool. All of these fluxes are closely coupled to the model representation of hydrology that comprises interception of precipitation, throughfall, infiltration, percolation, surface runoff, drainage and the routing of discharge along the river–floodplain network.
2.1.2 Soil carbon module
The soil carbon module of ORCHILEAK (Fig. 1) is derived from the CENTURY soil carbon model of Parton et al. (1988). In the standard scheme (Krinner et al., 2005), C in the soil of each model grid cell, and of each PFT, is represented by four different litter pools and three different soil organic carbon (SOC) pools with different turnover rates. The four litter pools correspond to metabolic aboveground and belowground litter, and structural aboveground and belowground litter (Fig. 1). The SOC is subdivided into three pools, active, slow and passive, which have different default decomposition rates that are further modified at each time step according to the evolving soil moisture and soil temperature. In the CENTURY scheme, C from the decomposed structural litter enters the active and the slow pools with the fraction allocated to each pool depending on lignin content of the litter, while the entire metabolic litter pool and the remaining part of structural litter are allocated to the active SOC pool. The SOC pools then feed into each other, with the main C flux going from active to slow and to passive in order to represent microbial decomposition of detrital organic matter, and from a small return flux of slow and passive C back to the active pool in order to implicitly represent the C supply in the form of dead microbial biomass.
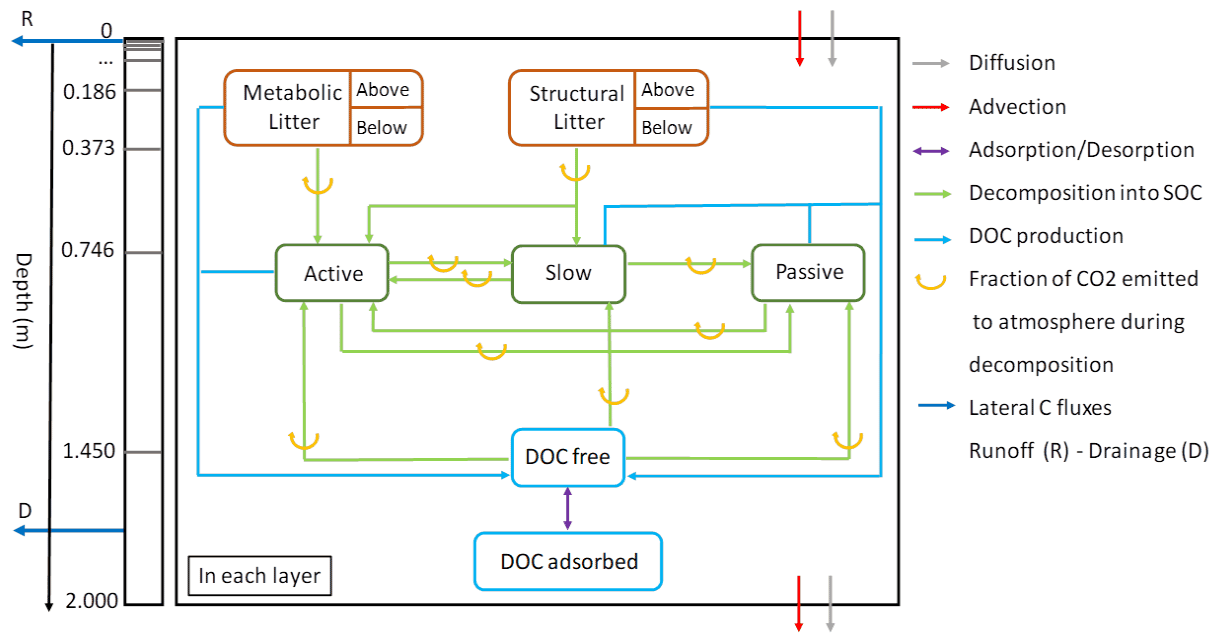
Figure 1The new version of the soil module of ORCHIDEE-SOM. The left box represents the discretization of the soil column and the transport processes between layers. The right box shows an overview of all the biogeochemical transformation processes that occur in each layer.
Camino-Serrano et al. (2018) updated this scheme with a vertical discretization of distinct SOC and litter pools over a 2 m soil profile represented by 11 layers, with geometrically increasing thickness from top to bottom (Fig. 1). Camino-Serrano et al. (2018) further developed the soil C module by including an explicit representation of the fate of DOC along this vertically discretized soil profile. Processes accounted for are DOC production from the decomposition of SOC and litter, decomposition of DOC within the soil, sorption/desorption of DOC onto/from mineral surfaces, vertical advection and diffusion of DOC through the soil column and lateral, advective leaching of DOC out of the soil profile, along with surface runoff (water flux from the topsoil surface) and drainage (water flux from the last layer soil at 2 m depth). In each soil layer, ORCHILEAK explicitly simulates the fresh litter input (depending on the simulated vertical root distribution), decomposition of each organic matter pool (including litter and SOC), C transformation between different organic matter pools (shown by the blue and green arrows between different pools in Fig. 1), C transport and diffusion between neighboring soil layers and the loss of DOC due to leaching. For a specific organic C pool at each time step, only a fraction of the decayed C is respired as CO2 to the atmosphere (orange arrows in Fig. 1), the remaining being transferred to other organic pools (to mimic microbial growth and mortality).
The DOC dynamics in the soil are simulated according to Eq. (1), which accounts for the dynamic interplay between production, decomposition, transport and sorption/desorption processes along the discretized 2 m soil column. All processes are simulated using a 30 min time step in following order: firstly, production and decomposition of DOC are calculated, and DOC stocks for each layer and pool are updated accordingly. Secondly, vertical exchange of DOC between soil layers is simulated in two steps: first for the process of DOC advection with the flow of water through the soil column, then for the diffusion of DOC. Lastly, the export of DOC through leaching from topsoil and bottom soil with runoff and drainage, respectively, is calculated.
In Eq. (1), i stands for the index of each layer. Each layer is connected to the adjacent layers by advective (FA) and diffusive (FD) fluxes. The total DOC transport flux is made of an advective component (Eq. 2) computed as the product of the water flux Q and the concentration of free DOC in the water solution of the ith layer and a diffusive component that follows Fick's first law (Eq. 3):
where i stands for the ith layer, z is the depth along the discretized soil profile and D stands for the molecular diffusion coefficient of DOC, which is assigned a value of m2 d−1 (Ota et al., 2013).
The advective export of DOC to the river network is proportional to the top (first five layers, 4.5 cm) and bottom (11th layer) DOC concentrations, corresponding to water loss fluxes associated with runoff (for the near surface) and drainage (for deep soil layer). Diffusion of DOC between adjacent soil layers is proportional to the gradient in DOC concentrations in the soil solution (Eq. 3), moving towards equilibrium. In addition, we apply Fickian-type transport to represent the effect of bioturbation on SOC profiles. In this case, the transport is represented similar to Eq. (3), but follows the gradient in SOC concentration relative to the volume of the soil layer. Representing bioturbation as a diffusion-like process is a common approach in LSMs with vertically discretized SOC scheme (Camino-Serrano et al., 2018). However, bioturbation is much slower than diffusion of DOC in the soil solution, with a diffusion coefficient m2 d−1 (Koven et al., 2013) compared to m2 d−1 (Ota et al., 2013). Therefore, bioturbation impacts the vertical SOC profile while it has only a marginal influence on the DOC dynamics. The right-hand side of Fig. 1 summarizes the set of production/decomposition processes that occur in each layer. During litter decomposition, a fraction of the C is directly emitted back to the atmosphere as CO2, while the remainder feeds the active and slow SOC pools:
where kL is the kinetic rate for the litter decomposition (dependent on soil moisture and temperature; Camino-Serrano et al., 2018) and ωL is the fraction of litter that is channeled into DOC production (as opposed to particulate SOC). This approach of relating DOC production directly to the decomposing litter is (following the ECOSSE model; Smith et al., 2010) inspired by Nakhavali et al. (2018), and is a major modification compared to the previous version of soil DOC and particulate organic carbon (POC) cycling of Camino-Serrano et al. (2018). In Eqs. (4) and (5), the partitioning between SOC production and respiration is defined by the carbon use efficiency (CUE).
In turn, active SOC is degraded into both slow and passive SOC and the respiration fluxes associated with these processes are also controlled by the CUE (Eqs. 6 and 7), with kSOC as the kinetic rate for SOC decomposition, which depends on soil moisture and soil temperature, and ωSOC as the fraction of decomposed SOC that is transformed into DOC):
The decomposition of the litter and SOC pools produces a small amount of DOC according to Eq. (8). The DOC pool is thus fed by seven contributing sources, one for each of the four decomposing litter pools and three from the decomposing SOC pools:
In ORCHIDEE-SOM (Camino-Serrano et al., 2018), all decomposed litter and SOC which are not respired as CO2 were first fed into the DOC pools, and only upon the decomposition of that DOC could the non-respired fraction of the decomposed DOC feed the other SOC pools. Such a formulation is in contrast to the adaption of the RothC SOC model in ECOSSE (Smith et al., 2010) and JULES (Nakhavali et al., 2018) that we followed here, where the major exchange of C is between the different litter and SOC pools, and the production of DOC is related to these SOC and litter pools by empirical rate constants, which were fitted to reproduce observed DOC turnover times (Kalbitz et al., 2003; Turgeon, 2008) and DOC concentrations in the soil. The much higher DOC production rates simulated by ORCHIDEE-SOM in its original configuration during preliminary tests over Europe led us to implement the new approach (Eqs. 4–7). While preserving the basic structure of ORCHIDEE-SOM, we thus adapted the model in a way that organic C exchange occurs mainly among the particulate litter and SOC pools, similar to the original CENTURY model, while preserving the basic structure of ORCHIDEE-SOM. The production of DOC is represented as a side product of this C exchange between the pools of litter and SOC, with production rates as used in ECOSSE. In the modified soil carbon module, we used the parameter ω (Eqs. 4–7) as a scaling factor that determines how much DOC is produced by the decomposition of litter and SOC. This parameter was calculated after Smith et al. (2010) as the ratio of the production of DOC from litter () and SOC pools () to the decomposition rates of litter (kL) and SOC (kSOC). The initial values for ω were 0.5 % and 3 % for the litter and SOC pools, respectively. Further optimization with regard to reproducing observed soil DOC concentrations led to ω values set at 0.2 % for the litter and 1.2 % for the SOC pools.
Once produced, the free DOC can then be adsorbed to soil mineral particles, and the adsorbed DOC can again be desorbed and return to the free DOC pool following a linear adsorption isotherm as described in Neff and Asner (2001) and Wu et al. (2014). We assume that equilibrium between the dissolved and absorbed phases is instantaneous. Moreover, the work by Kothawala et al. (2008) showed that this approach performed fairly well compared to the more complex approach of using Langmuir equations. The partitioning is controlled by KD, the so-called equilibrium partition coefficient (Eq. 9), considered to be constant at m3 water per kilogram of soil (Moore et al., 1992). All constants used here are listed in Table S1 in the Supplement.
Finally, the DOC pool is subject to decomposition according to Eq. (10) and then partly feeds into the SOC pools (Eq. 11), where kDOC is the DOC decay rate, which also depends on soil moisture and soil temperature.
2.1.3 Manure as an additional C source
In Europe, a large fraction of the landscape is dominated by agricultural and grazing activities, and manure application represents a significant additional C – in particular DOC – source for the soil in regions dominated by grasslands and croplands. Studies have shown an increase in riverine DOC concentration related to manure application, with frequency and intensity of storm events in spring directly after manure application exerting an important control on the amounts of additional DOC leached into the river network (e.g., Royer et al., 2006; Delpla et al., 2011; Singh et al., 2014; Humbert et al., 2020). The type of manure input can be very different from one region to another, and the physicochemical properties (e.g., C:N ratio and the ratio of dissolved and particulate organic matter) depend strongly on the specific type of manure input. However, current forcing data only provide the amount of total manure inputs, without information regarding specific composition and/or physicochemical properties of the manure. To constrain the C flux from manure infiltrating the soil, we used the gridded estimates of manure nitrogen (manure-N) applications produced by Zhang et al. (2017) as forcing file. Following the use of that data as forcing in the model branch ORCHIDEE-CNP developed by Sun et al. (2021), we assumed that 90 % of the total manure-N is in mineral form (i.e., or ) and the remaining 10 % is in organic form. To convert the organic manure-N into a manure-C flux, a C:N stoichiometric ratio of 13.7 was then applied (Vuichard et al., 2019). Finally, the particulate and dissolved organic manure-C were assumed to feed the litter and DOC pools, respectively (Fig. S1 in the Supplement). Consistent with ORCHIDEE-CNP (Goll et al., 2017), the fractions of particulate and dissolved manure-C were set to 0.9 and 0.1, respectively.
2.1.4 Hydrological processes
The representation of hydrological processes is handled in two distinct sub-modules. The first one, the hydrology sub-module, simulates the vertical exchange of water in the atmosphere–vegetation–soil system in each model grid cell, while the second one, the river routing module, simulates the horizontal transfers between grid cells. The hydrology is forced by several meteorological fields such as precipitation and air temperature. In the hydrology module, precipitation is divided into interception and throughfall, the latter being further subdivided into surface runoff and infiltration into the soil. The infiltration rate is controlled by the throughfall rate, the slope of the soil surface and the hydraulic conductivity of the soil which is a limiting factor for infiltration. The distribution of water within the soil is represented by the distribution of soil moisture over the discretized soil profile (de Rosnay et al., 2002; d'Orgeval et al., 2008). The water budget within the soil is thus determined by the infiltration rate and runoff from the topsoil, evaporation and transpiration from the soil and drainage at the bottom of the soil column. The infiltration rate and percolation through the soil profile are used to compute the advective flux of DOC (Eq. 2).
The second module deals with river routing and represents the horizontal transfers of water from the soil column to the aquatic system though surface runoff and drainage, and further through the river network and adjacent floodplains (Vörösmarty et al., 2000). Meybeck (1993a, b) found that soils were the major source of DOC for rivers, while autochthonous DOC was negligible at the global scale. Furthermore, autochthonous DOC has a short turnover time and is quickly recycled within the river (Farjalla et al., 2009; Fonte et al., 2013) and, therefore, does not contribute significantly to the net C budget of an entire river system. Since in this study the focus is on the role of fluvial DOC fluxes in the terrestrial C budget, autochthonous DOC is not accounted for. The representation of leaching processes in ORCHILEAK is simplified; the model represents flows of water from land to the stream network only through surface runoff and drainage from bottom soil. Leaching thus occurs either from the topsoil, which in our configuration represents the top 4.5 cm of the soil column, or from the bottom soil, i.e., the lowest 50 cm of the 2 m soil profile. DOC leaching from the topsoil is further limited by two reduction factors, a “general reduction factor” and a “reduction factor for export with runoff depending on the extents of saturated soils around headwaters”. The general reduction factor accounts for the fact that some of the runoff represents excess throughfall that never entered the soil and further corrects for the overestimated DOC concentration in the topsoil. The second reduction factor represents the connectivity between streams and their catchment through the extent of the water saturated riparian zone at sub-grid level, which varies with the amount of runoff and water stored in the “slow reservoir” of water, mimicking groundwater storage. Note that for larger river stretches (stream order 4 and higher), ORCHILEAK simulates the occasional inundation of the river's floodplains, where DOC production from the decomposition of litter and SOC in the topsoil, although reduced under inundated conditions, feeds directly into the DOC pool of the water column. For a detailed description of these features, please see Lauerwald et al. (2017).
2.2 Simulations
2.2.1 Model setup
Model domain, land cover and forcing data
The simulated model domain extends over the area (4.1×10⁶ km2) between 35 and 70∘ N and 10∘ W and 30∘ E (Fig. 2). This domain includes 5600 model grid cells at 0.5×0.5∘ resolution and encompasses six broad climate zones according to the Köppen–Geiger classification from Peel et al. (2017; Fig. 2a). The dominant PFTs within Europe include croplands (20 %, mainly C3), grasslands (31 %, of which 24 % are C3), and forests (39 %, of which 16 % and 9 % are needle-leaved evergreen and broadleaved summer-green boreal forests, respectively, while temperate broadleaved summer-green, needle-leaved and broadleaved evergreen forests comprise 8 %, 3 %, and 3 %, respectively; Fig. 2b). The spatial distribution of manure application on grasslands and croplands is shown in Fig. 2c. Finally, Fig. 2d illustrates the actual river network derived from the HydroSHEDS DEM data (Lehner et al., 2008) and the one corresponding to our river routing scheme at 0.5∘ resolution, highlighting that the representation of the river network is not optimal due to the coarse spatial resolution of our model. This coarse resolution limits the possibility of model validation to the downstream parts of larger river networks. It is worth noting that the mouth of the Rhine is more than 100 km too far east, which further limits model validation for that river.
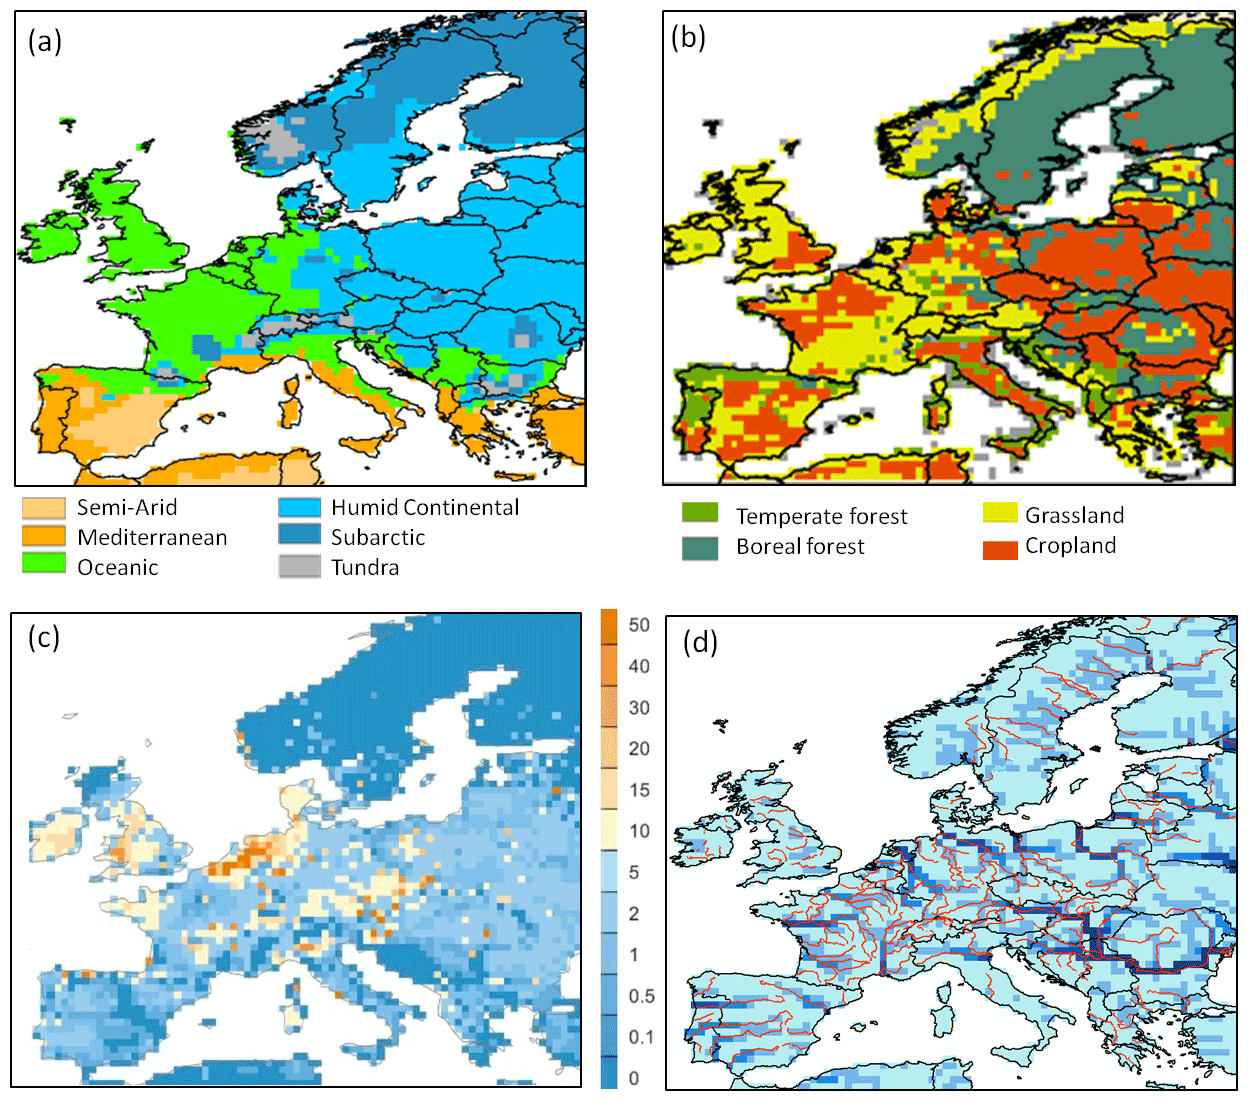
Figure 2Spatial distribution for each 0.5∘ grid cell of the continental European domain of (a) climate zones (according to the Köppen–Geiger classification); (b) dominant plant functional types (PFT); (c) manure application (in g C m−2 yr−1); (d) the routing network of ORCHILEAK (in blue). The real river network extracted from the European Environment Agency (https://www.eea.europa.eu/legal/copyright, last access: 3 March 2021) is also shown.
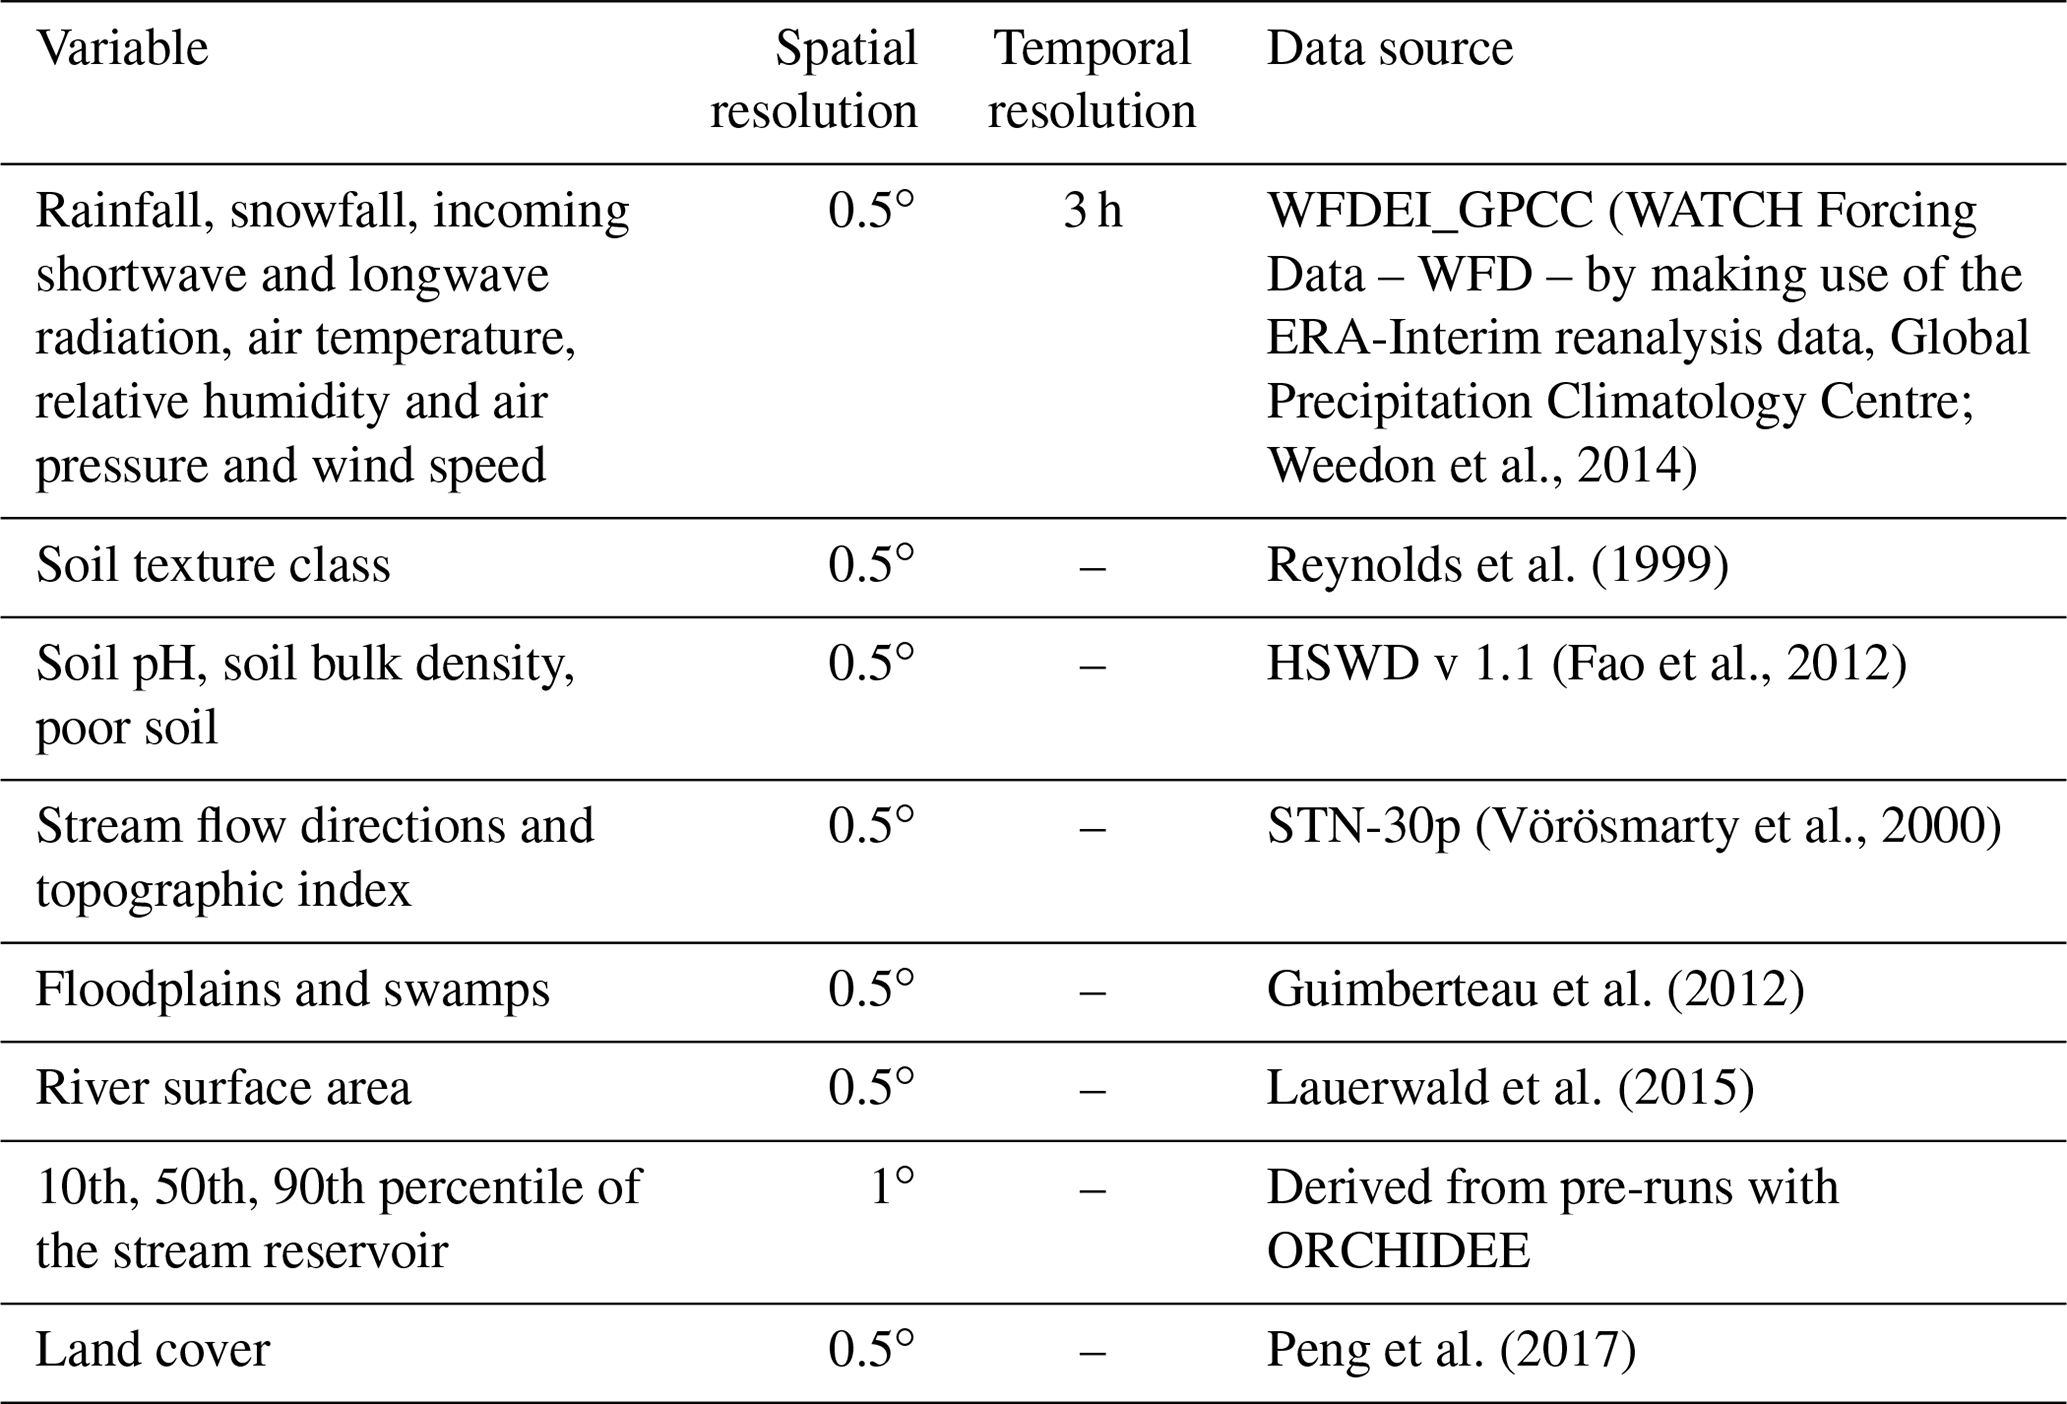
The forcing data applied in our study are listed in Table 1. They are the same as those used in Lauerwald et al. (2017) except for the meteorological forcing data and the land cover. The WFDEI meteorological forcing dataset used in this study was derived by applying the methodology originally used to create the WATCH Forcing Data (WFD) from the ERA-Interim reanalysis data (Weedon et al., 2014). The dataset has a 0.5∘ spatial resolution and a 3-hourly time step covering from 1978 to 2014. The land cover forcing data set, which gives the areal proportion of the 13 PFTs within each 0.5∘ grid cell, was taken from Peng et al. (2017). Note that the soil hydrology model in ORCHIDEE, which we adopted for ORCHILEAK, was developed and calibrated to work with the soil classes used in Reynolds et al. (1999). We thus kept this data source, while additional soil properties such as pH, and specific soil classes that we defined as “poor soils” (Histosols, Podzols) possessing lower C turnover times and DOC filtering, were taken from HWSD v1.1. A topographic index, which in ORCHIDEE controls the flow velocity in the river network of each cell, is taken from Vörösmarty et al. (2000). “Floodplains”, defined as the maximum areal proportion of a grid cell that can be flooded when the river exceeds its bankfull flow, and “Swamps”, representing groundwater-fed wetlands in the floodplain, were adopted from the Global Lake and Wetland database (Lehner and Döll, 2004). Depending on the areal extent of these swamps, a proportion of stream flow is simulated to feed into the soil moisture storage of the grid cell considered. Both parameters have an effect on the simulated river discharge and soil hydrology in the floodplains. For details, see Lauerwald et al. (2017).
Table 1List of the forcing files used for our simulations, along with their spatiotemporal resolution.
Parametrization of hydrological processes
ORCHILEAK was previously parametrized and validated for the Amazon (Lauerwald et al., 2017, 2020; Hastie et al., 2019), Congo (Hastie et al., 2021) and Lena (Bowring et al., 2020) basins. In our study of the European river network, we updated ORCHILEAK with the more recent hydrology scheme of the recent standard version of ORCHIDEE (svn 5091). This hydrology scheme has been calibrated against observed runoff at a global scale (Ringeval et al., 2012; Yang et al., 2015). Furthermore, MacBean et al. (2020) has evaluated the model performance for simulating soil moisture in temperate ecosystems. This new hydrology scheme features a dynamic surface roughness of the vegetation, which decreases the aerodynamic resistance near the surface when vegetation cover is low, leading to lower ground temperatures and thus lower evaporation rates. This adjustment was deemed necessary in order to better capture the observed mean and seasonal variability of the discharge along the European river network. The two reduction factors controlling DOC leaching from the topsoil to the headwater streams were also adjusted (see Sect. 2.1.4).
Spin-up
Before the model can be used to simulate C dynamics over the past decades, a spin up is needed to reach an assumed steady state for the C fluxes during the pre-industrial period. This steady state is achieved by spinning up ORCHILEAK for 15 000 years. The spin up was realized by recursively looping over 4 years of climate forcing using the WFDEI forcing dataset over the 1979–1982 period (because the first year of the forcing, 1978, is incomplete) and constant land cover and atmospheric CO2 concentration of 286 ppm (Guimberteau et al., 2018) corresponding to year 1861. After the end of the spin-up, the soil C stock across the entire European continent changed by less than 1 % over 1 century of simulation, which we considered close enough to steady state.
Transient runs
Using the steady-state outputs as initial condition, the first part of the transient simulation (1861–1978) was carried out with increasing atmospheric CO2 concentration, changing land use and land cover and with river routing activated while still looping over 27 years (1979–2006) of the WFDEI forcing dataset. From 1979 onwards, the WFDEI atmospheric forcing data were applied over the entire period covered by this product with the changing land cover map and atmospheric CO2 values applied for each year of simulation.
2.2.2 Model evaluation
Firstly, the simulated discharges were compared to times series of daily stream flow recorded at 11 gauging stations from “The Global Runoff Data Center (GRDC), 56068 Koblenz, Germany” dataset. For comparison, both the observed and simulated discharges were aggregated at the monthly temporal resolution over the years 1980 to 2006. Note that the river network in ORCHILEAK does not always match the real river network. The selected gauging stations were assigned to the cell best representing the parts of the river network to which the sampling location corresponds. However, important correction had to be performed for the most upstream stations in the Rhine and the Elbe river network. The period 1980 to 2006 was chosen based on the GRDC data coverage.
Model performance was further evaluated with respect to several variables of the terrestrial C cycle. Firstly, simulated net primary production (NPP) was compared to two different data products. The first one, the CARbon DAta MOdel fraMework (CARDAMOM; Bloom and Williams, 2015), was built from model data fusion analysis at 1∘ resolution. The second one is the Global Inventory Modeling and Mapping Studies (GIMMS) at 0.5∘ resolution based on AVHRR and MODIS sensors. GIMMS uses several atmospheric forcing data sets to derive NPP. These are CRUNCEP version 4 P1 and P2 (rainfall, cloudiness, relative humidity and temperature taken from the Climate Research Unit, CRU; the other fields, such as air pressure, longwave radiation and wind speed are directly derived from National Center for Atmospheric Research, NCEP), the European Centre for Medium-Range Weather Forecasts (ECMWF), the Modern-Era Retrospective analysis for Research and Applications, Version 2 (MERRA2) and NCEPR2 (Reanalysis 2; https://www.esrl.noaa.gov/psd/, last access: 22 August 2019). For our comparison, we calculated the average of the NPP obtained with these five atmospheric forcing files. The NPP values from ORCHILEAK and GIMMS were averaged over the period 1982–2006 while CARDAMOM only covers a shorter time period, between 2001 and 2010. Modeled NPP was then compared to the NPP data products at the European scale and at the scale of five large European basins for which we also evaluated the simulated river discharge and DOC fluxes, which, taken together, represent 19 % of the model domain (Fig. 3): the Danube, Rhine, Elbe, Rhône and Seine. All five basins are located in an oceanic or humid continental climate (Fig. 2a), although the Rhône Basin extends further into the Mediterranean climate zone. The basin characteristics according to land cover types are as follows: the Danube and the Elbe basins have both a high proportion of croplands (around 40 %), the remainder being mostly covered by grasslands and boreal forests. Of the Rhône Basin, 50 % is covered by grasslands, while in the Seine Basin, croplands reach 50 %. The Rhine has a more diverse land cover, with a substantial proportion, about 30 %, comprised of boreal (10 %) and temperate (20 %) forests, 35 % of grasslands and 25 % of croplands. See Table S2 for further details.
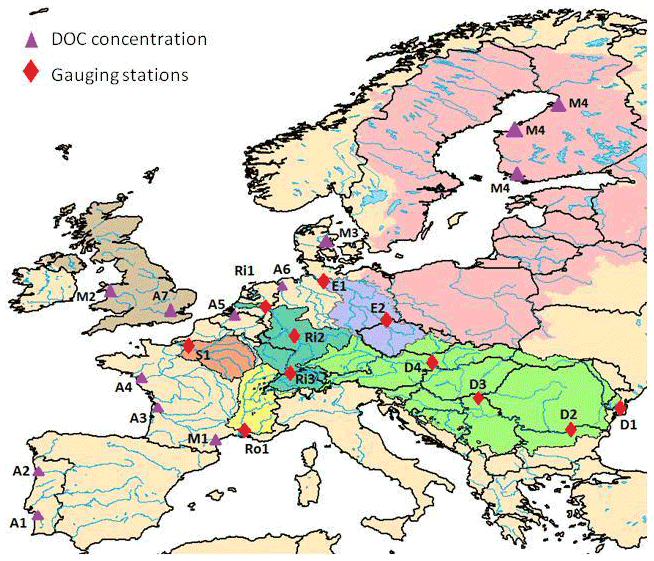
Figure 3Map of continental Europe delineating the (group of) catchments of focus in this study and the location of observed discharge and DOC concentrations. Catchments, from west to east, are All UK (light brown), Seine (orange), Rhône (yellow), Rhine (dark green), Elbe (violet), All Baltic (pink) and Danube (light green). Observations include the GRDC stations (red diamonds) in the Seine (S1 – Poses), Rhône (Ro1 – Beaucaire), Rhine (Ri1 – Lobith, Ri2 – Main in Frankfurt, Ri3 – Basel), Elbe (E1 – Neu Darchau, E2 – Dresden) and Danube (D1 – Ceatal Izmail, D2 – Svistov, D3 – Tisza in Senta, D4 – Bratislava) catchments and the river stations where DOC concentrations were measured (purple triangles): A1 – Douro, A2 – Sado, A3 – Gironde, A4 – Loire, A5 – Scheldt, A6 – Ems, A7 – Wales, A8 – Thames, M1 – Tech, M2 – Wales, M3 – Denmark and M4 – Finland (Abril et al., 2002; Mattsson et al., 2009).
The soil temperature is compared to the soil temperature generated using data from the ECMWF Reanalysis v5 (ERA5) dataset (Muñoz-Sabater et al., 2021). The soil heterotrophic respiration (SHR) is compared against the data-driven global SHR dataset published by Yao et al. (2021). The global SHR data set was produced using a random forest algorithm, upscaling from 455 data points from the global Soil Respiration Database (SRDB 4.0) based on gridded fields of climatic, edaphic and productivity-related variables as predictors (Yao et al., 2021). We compared the results of ORCHILEAK with the average, minimum and maximum values of SHR estimated by Yao et al. (2021). SOC from the Harmonized World Soil Database (HWSD) was used to evaluate the simulated SOC stocks. HWSD is a global soil database that contains up-to-date information on a large range of soil properties. For instance, this dataset reports the organic carbon content in the soil as well as the soil bulk density. The bulk density in HWSD was calculated in two different ways. The first one follows the method described in Saxton et al. (1986) where the bulk density is related to the soil texture – an approach tending to overestimate density in high porosity soils or in OC-rich soils. The second method uses the SOTWIS database in which the bulk density is calculated as a function of soil type and depth. In this database, all variables are reported for the topsoil (0–30 cm) and the sub-soil (30–100 cm) horizons. For comparison purposes, our simulated SOC stocks were thus integrated over the same depth intervals. We further assessed the extent to which our model can reproduce the main features in the observed soil DOC profiles. To that end, we compared our simulated DOC profile averaged over the entire European forest biome against the one established by Camino-Serrano et al. (2014) on the basis of a synthesis of local measurements. Although there are many studies on DOC concentrations in the soil, we selected that of Camino-Serrano et al. (2014) because it provides a synthesis at the pan-European scale, and is thus ideal for extracting “representative” concentration profiles over a sufficiently large domain, compatible with the regional scope of our study. Unfortunately, similar synthetic profiles based on observations have not been constructed for croplands and grasslands.
The key variables of interest in our study are the DOC leaching flux from the soil and the DOC export flux to the coast. These fluxes require accurate simulation of the water discharge fed by runoff and drainage, as well as of DOC concentrations in the leaching flux and in the riverine flux. For the leaching flux, our simulation results were compared to measured fluxes reported by Kindler et al. (2011) across different locations in Europe. Because the observed DOC leaching fluxes from both topsoil and bottom soil reported by Kindler et al. (2011) are based on local measurements that are not easily comparable to simulated fluxes at the coarse spatial resolution of our model (0.5∘ or about 2×10³ km2 at the corresponding latitude), we consider the comparison against measured river DOC fluxes to be more relevant for our purposes, as rivers are good integrators of mean, larger-scale catchment properties. For the riverine export fluxes, we assessed the modeled discharges and DOC concentrations separately. For evaluation of stream DOC concentrations, DOC data were extracted from the GLObal RIver CHemistry database (GLORICH, Hartmann et al., 2014) for the Rhine and Elbe basins and from the “Eau de France” database for the Seine and Rhône basins. These data were complemented by river DOC concentrations reported by Abril et al. (2002) for 9 river mouths (Sado, Thames, Ems, Scheldt, Gironde, Douro, Loire, Elbe and Rhine), and by Mattsson et al. (2009) for several river basins located in Finland, Denmark, Wales and France.
3.1 Model evaluation at pan-European and catchment scales
3.1.1 Discharge
Figure 4 compares the simulated discharge against observations for selected stream gauging stations (Sect. 2). Those stations are located near the mouth of large rivers (Danube, Rhine, Rhône, Elbe and Seine) but also include a few locations further upstream the same rivers or at major tributaries (Fig. 3). The comparison is performed for the period 1990–2000, except for the Rhône at Beaucaire and the Danube at Svistov, for which the observed stream gauge data cover only a shorter period. Overall, the model reproduces the observations well, both in terms of amplitude and seasonality, except for the Elbe at Neu Darchau, for which the temporal variability is well captured but the absolute discharge is overestimated.
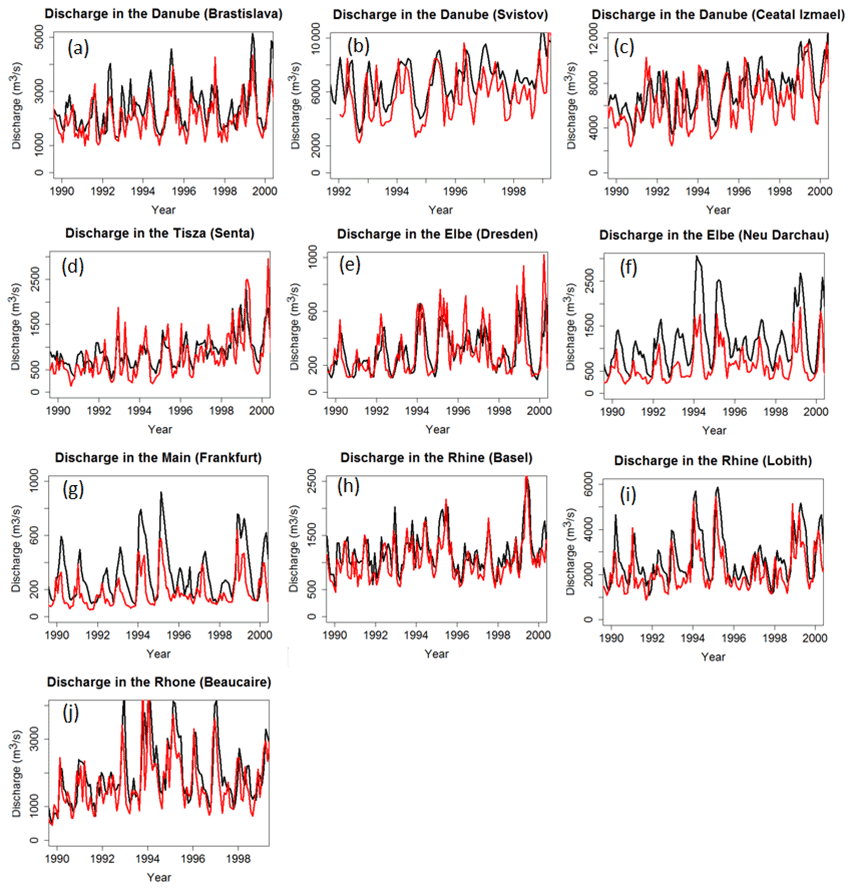
Figure 4Modeled (black) and observed (red) time series of discharge at the GRDC gauging stations on the Danube (a–c) and its tributaries (d), the Elbe (e, f), the Rhine (h, i) and its tributaries (g) and the Rhône (j). Note the different time periods of measurements. See Fig. 3 for exact locations.
Note that the simulated catchment area often diverges (by −25 % to +30 %) from the observed value due to the coarse resolution () of ORCHILEAK (Table S3). As a result of the model resolution, smaller tributaries are not represented individually and each grid cell was fully assigned to one larger river basin. The effect of the resolution is also shown in Fig. 2d, which compares the observed and modeled river network. Discrepancies between model and real world catchment area will translate into proportional biases in discharge simulation. Furthermore the 0.5∘ resolution is too coarse to be able to perfectly represent the pathways of the river. Our model tends more often to underestimate the catchment area, while its yearly mean discharge is overestimated, except at the Beaucaire station along the Rhône River. The bias can be significant and cannot be explained by the model resolution alone.
To evaluate model performance for discharge, we used the Pearson's coefficient of determination (R2) and the Nash–Sutcliffe modeling efficiency (NSE, Nash and Sutcliffe, 1970). The R2 only accounts for the correlation with regard to the temporal variability. With R2 values comprised between 0.43 and 0.62 for all stations, we conclude that the observed seasonality of the discharge along large European rivers is reasonably well reproduced by the model. The NSE not only accounts for the correlation between observed and simulated temporal signals, but also for the model's ability to reproduce absolute discharges. The statistics confirm our previous observation that the model generally overestimates discharges (low NSEs) except for stations Elbe in Dresden, Rhône in Beaucaire, Rhine in Basel and Danube in Bratislava where both the mean and temporality are well captured. Two stations have negative NSE values, which means that the error variance estimated by the model is significantly larger than the variance of the observations; in others words, the difference between model and observations is significant. The mean error (%), that is, the weighted difference between the average from the model and the one from observation, confirms that low NSEs are mostly due to overestimated discharges, which is further demonstrated by high mean errors. More results for other European catchments can be found in Table S3.
3.1.2 NPP, SHR, soil temperature, biomass and soil organic C stocks
We briefly compare simulated NPP with the gridded observation-based products GIMMS and CARDAMON (Sect. 2.2.2) as C fixation by the vegetation exerts an important control on DOC stocks in the soil and thus on DOC leaching. We first perform our comparison over a large domain comprising 35 to 70∘ N and 10∘ W to 30∘ E – covering the area from Ireland to the western Black Sea (where the Danube flows into) and from the south of Spain to the north of Scandinavia. Over this area (referred to as “Europe” from here onwards), the modeled yearly averaged NPP amounts to 445 g C m−2 yr−1, a value in remarkable agreement with both GIMMS and CARDAMOM estimates of 430 and 460 g C m−2 yr−1, respectively. These two datasets entail an uncertainty that we assume to be similar to that reported for the MODIS dataset, i.e., 20 % (Turner et al., 2006). The total living biomass in Europe is simulated at 15.5 PgĊ or 2.3 kg C m−2. This value is in good agreement with a recent estimate by Avitabile and Camia (2018), who report a biomass stock of around 16 Pg C. We estimate that the total soil carbon stock amounts to 58 Pg C. Averaged over the first meter of the soil horizon, this corresponds to a value of 9.5 kg C m−2, which is comparable to that of HWSD (6 kg C m−2) when using the SOTWIS method to compute the bulk density, but significantly lower when applying Saxton's method (22 kg C m−2), plausibly because the latter overestimates the bulk density in OC-rich soils (Köchy et al., 2015). The results for the catchment scale are described in the Supplement.
Figure 5a shows the comparison of simulated and data-driven estimates of soil temperature. Soil temperature is overall well represented with a simulated mean temperature of 8.4 ∘C against 9.3 ∘C after ERA5. The overall slight underestimation is due to a substantial underestimation of soil temperatures in the northern regions. Furthermore, this underestimation is more important in the winter (January, February and March) with a difference relative to ERA5 values reaching 3.5 ∘C, while in summer (July, August and September) this difference amounts to only 0.5 ∘C. This underestimation is due to the poor representation of the isolating effect of snow cover in ORCHIDEE (Wang et al., 2013).
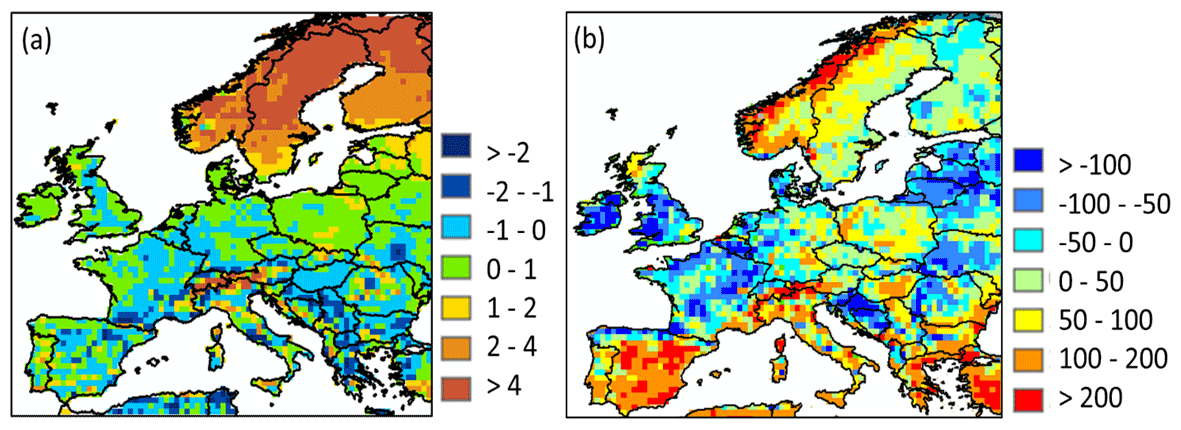
Figure 5Difference in (a) simulated soil temperature (in ∘C) against values reported by ERA5; (b) simulated soil heterotrophic respiration (in g C m−2,yr−1) against values reported by Yao et al. (2021).
A comparison of simulated SHR against the Yao et al. (2021) estimates is shown in Fig. 5b. Over Europe, ORCHILEAK underestimates the SHR compared to the Yao et al. (2021) estimates by about 14 %, with a simulated average of 312 g C m−2 yr−1 against an average of 363 g C m−2 yr−1 (range from 317 to 417 g C m−2 yr−1) estimated by the latter for the period 1985–2013. Looking at specific climatic regions, some regions are well represented in ORCHILEAK, as the Mediterranean and humid continental regions show a mean SHR of 371 and 363 g C m−2 yr−1, against 385 and 354 g C m−2 yr−1 by Yao et al. (2021), respectively. SHR in semi-arid and tundra regions are conversely around 50 % lower than the Yao et al. (2021) estimate. For the tundra region, the underestimation in SHR is consistent with an underestimation of the NPP (see Table S4).
3.1.3 Soil DOC stocks
Comparison between observed and modeled DOC stocks and fluxes is more difficult than for biomass and SOC because the former have not been assessed at large spatial scales. Nevertheless, representative soil DOC concentration profiles for coniferous and broadleaved forests of Europe have been compiled by Camino-Serrano et al. (2014). These profiles were used to evaluate our model. Overall, we found that ORCHILEAK slightly overestimates DOC concentrations, especially in the very top soil layers with modeled values of around 100 mg L−1 against 40–60 mg L−1 in the observations (Fig. 6). We also simulated higher concentrations in broadleaved forests than in coniferous forests, while Camino-Serrano et al. (2014) obtained the opposite. When integrated over the first meter of the soil horizon of forested ecosystems (28 % of the European land area), the modeled and observed DOC stocks amount to 22.2 and 11.3 g C m−2, respectively. Above, we have shown that over Europe, SOC stocks were underestimated, while the average DOC concentrations in the soil over all European forests are overestimated here. One explanation for the underestimation of SOC stocks and the likely overestimation of DOC stocks is thus that SOC decomposition rates in the new soil carbon module may be slightly too high. It is however difficult to generalize this conclusion because of the lack of synthesis data for other land cover types, especially croplands and grasslands, which together represent about 50 % of the total European land area. Modeled DOC stocks averaged over broad climate regions reveal the highest values for the oceanic climate, with 32 g C m−2, and the Mediterranean climate, with 26 g C m−2. Semi-arid and humid continental climates have similar stock densities of, respectively, 17.5 and 20 g C m−2, and it is in the coldest climates (subarctic and tundra) that we find the lowest DOC stock densities, around 8 g C m−2.
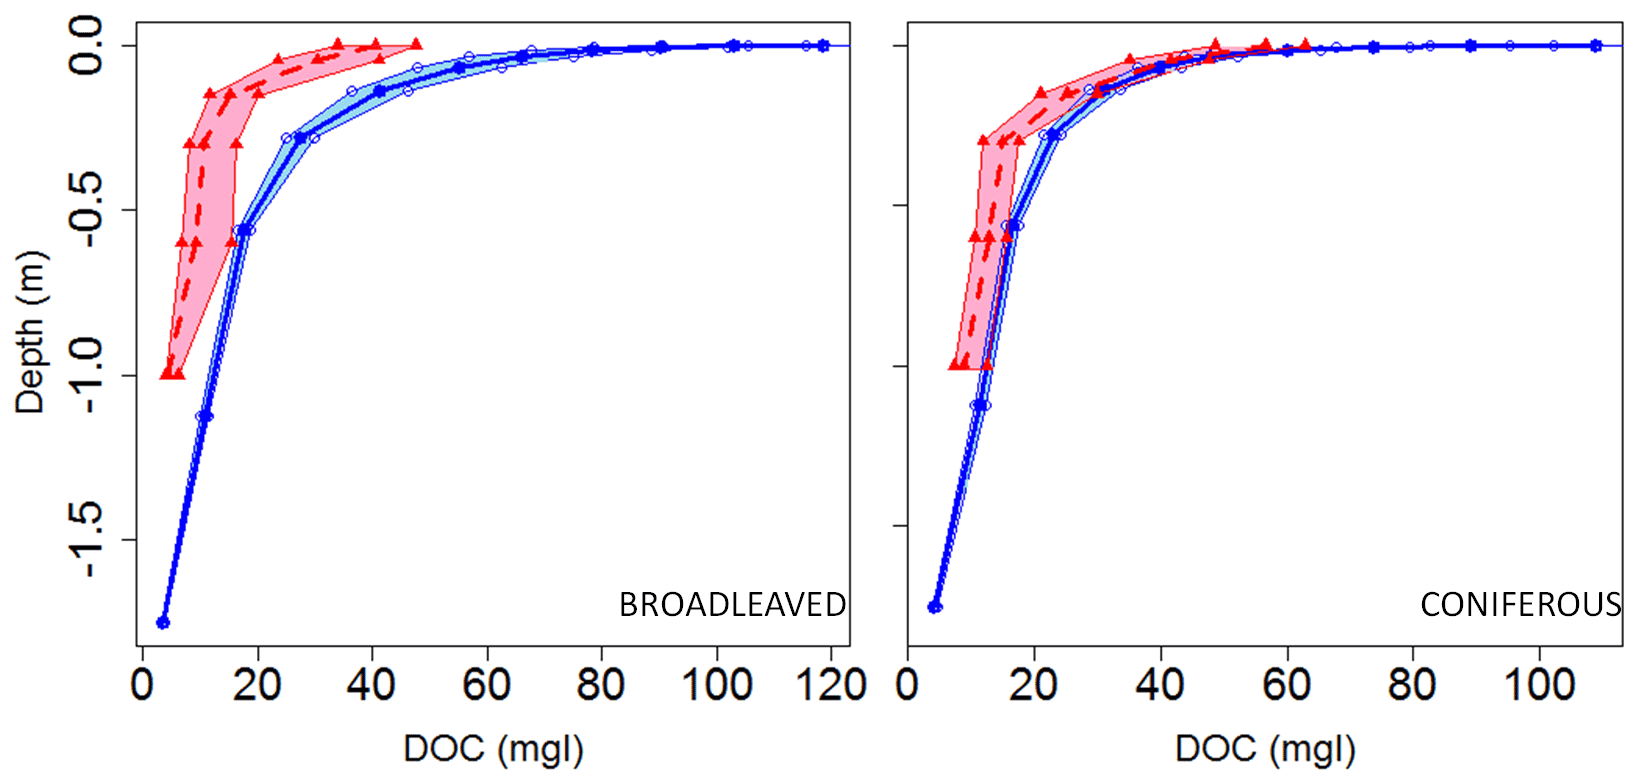
Figure 6Modeled (blue) versus observed (red dashed) DOC concentration profiles averaged over the soils of the European coniferous and broadleaved forest biome. Data are from Camino-Serrano et al. (2014). The shaded area represents the 95 % bootstrap confidence interval for model and observations.
3.1.4 DOC leaching fluxes
The model simulates a yearly mean DOC leaching flux over Europe of 14.3 (±10) Tg C yr−1 (Fig. 7), the standard deviation being here coarsely approximated by spatial variability. The average area specific flux rate amounts to 2.6 (±2.5) g C m−2 yr−1. We compared DOC leaching fluxes with site level observations from Kindler et al. (2011), across 17 local measurements, each sampled fortnightly during the period October 2006 to March 2008. Comparing model results at 0.5∘ resolution to point measurement is complicated, and thus in this section, we compare only our model-averaged result against the 17-site average from Kindler et al. (2011). Our modeled average of 2.6 (±2.5) g C m−2 yr−1 is of the same order of magnitude as that observed (4.2 g C m−2 yr−1). Although the modeled mean is about 38 % lower than the one measured, the standard deviation representing the spatial variability in simulated DOC leaching fluxes over all our model grid cells encapsulates the observational mean, highlighting a significant heterogeneity that is difficult to capture with local measurements alone. This comparison must be taken cautiously because of the limited number of observations and the resolution of our model. Furthermore, the DOC leaching flux at the coast is generally not well represented. The reason is that DOC leaching fluxes are normalized by the area of the whole cell. The area normalized flux at the coast is thus often lower.
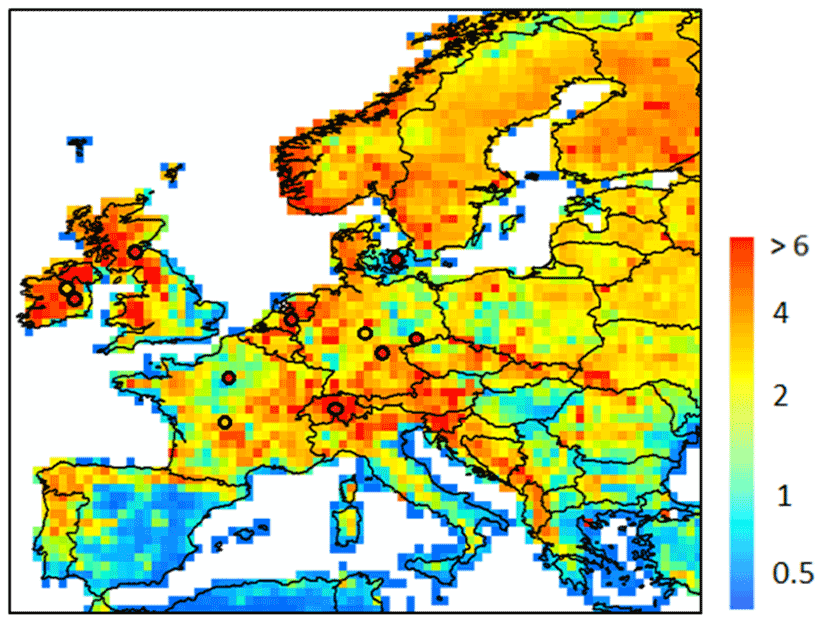
Figure 7Modeled yearly mean terrestrial DOC leaching flux (period 1979–2006) to the river European river network (in g C m−2 yr−1). The local observations from Kindler et al. (2011) are also reported, using the same scale. Note that the local observations cover a much shorter time period and may not be representative of the whole year.
The seasonal distribution of the DOC leaching flux is shown in Fig. 8. On average, the leaching flux per season averaged over Europe amounts to 1.6, 1.3, 0.5 and 1.4 Tg C per month in winter, spring, summer and autumn, respectively. If we exclude the high-latitude and high-altitude regions (Scandinavia, the Alps), a clear seasonality is observed, with the lowest fluxes in summer and spring and the highest fluxes in winter and autumn. In the high-latitude and high-altitude regions, the pattern is different, with the highest fluxes in spring, which extends to the summer in the Alps and corresponds to the snowmelt period. The highest fluxes per unit area are simulated in Scandinavia during the spring season, even though peatlands are not represented in the model. Some regions are leaching hotspots such as the Alps throughout the year, the western Balkans during autumn and the western flank of the UK in autumn and winter.
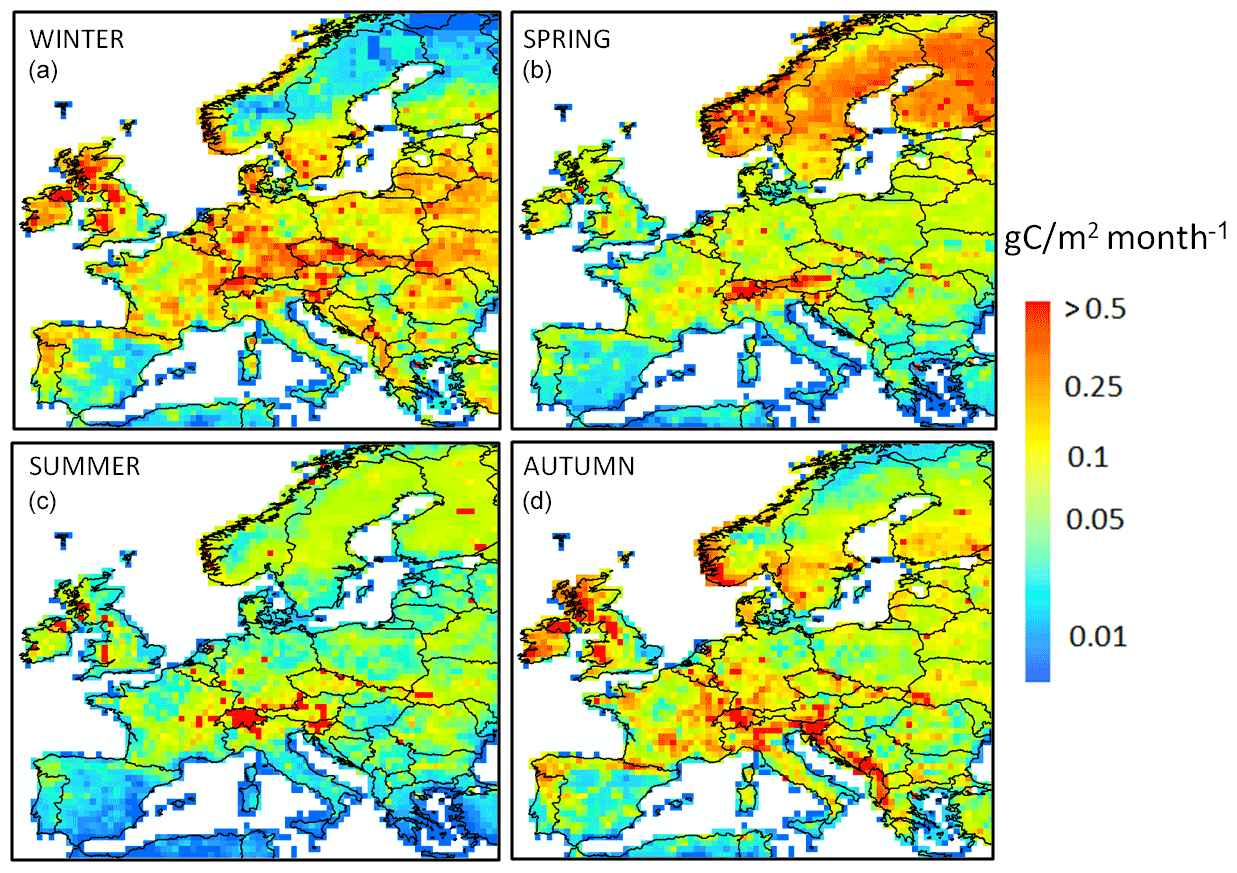
Figure 8Seasonal distribution of the terrestrial DOC leaching flux (g C m−2 per month) for (a) winter, (b) spring, (c) summer and (d) autumn, averaged over the period 1979–2006. A logarithmic scale is used to better highlight the spatiotemporal gradients.
3.1.5 Fluvial DOC decomposition and export fluxes
The export of DOC from the European river network to the coast is arguably the best monitored variable against which our model can be evaluated. Using this flux to build confidence in our estimate of the terrestrial DOC leaching requires an assessment of the DOC degradation within rivers, a process that is controlled by the hydrology and the half-lives of reactive DOC compounds. In the model, the first-order decomposition rates at a given temperature of 28 ∘C are equal to 0.3 and 0.01 d−1 for the labile and refractory DOC pools, respectively. Based on those values and the simulated distribution of labile and refractory DOC, the estimated bulk decomposition rate constant averaged over the entire model domain is equal to 0.05 d−1, which corresponds to a half-life for riverine DOC of about 14 d (Table 2). This rate constant varies across Europe but always remains within the same order of magnitude, with half-lives ranging from 6 to 20 d (0.035–0.122 d−1). These decomposition rates are in good agreement with the average rate reported by Berggren and Al-Kharusi (2020) of 0.037 d−1, based on field experiments carried out at multiple river sampling locations across Europe. We thus conclude that DOC decomposition rates used in ORCHILEAK are reasonable, and fluvial DOC fluxes are a valid proxy to evaluate simulated DOC leaching fluxes.
Table 2Estimated river DOC decay rates applied in ORCHILEAK. Values are reported for four large river basin and for the six dominant climate zones.
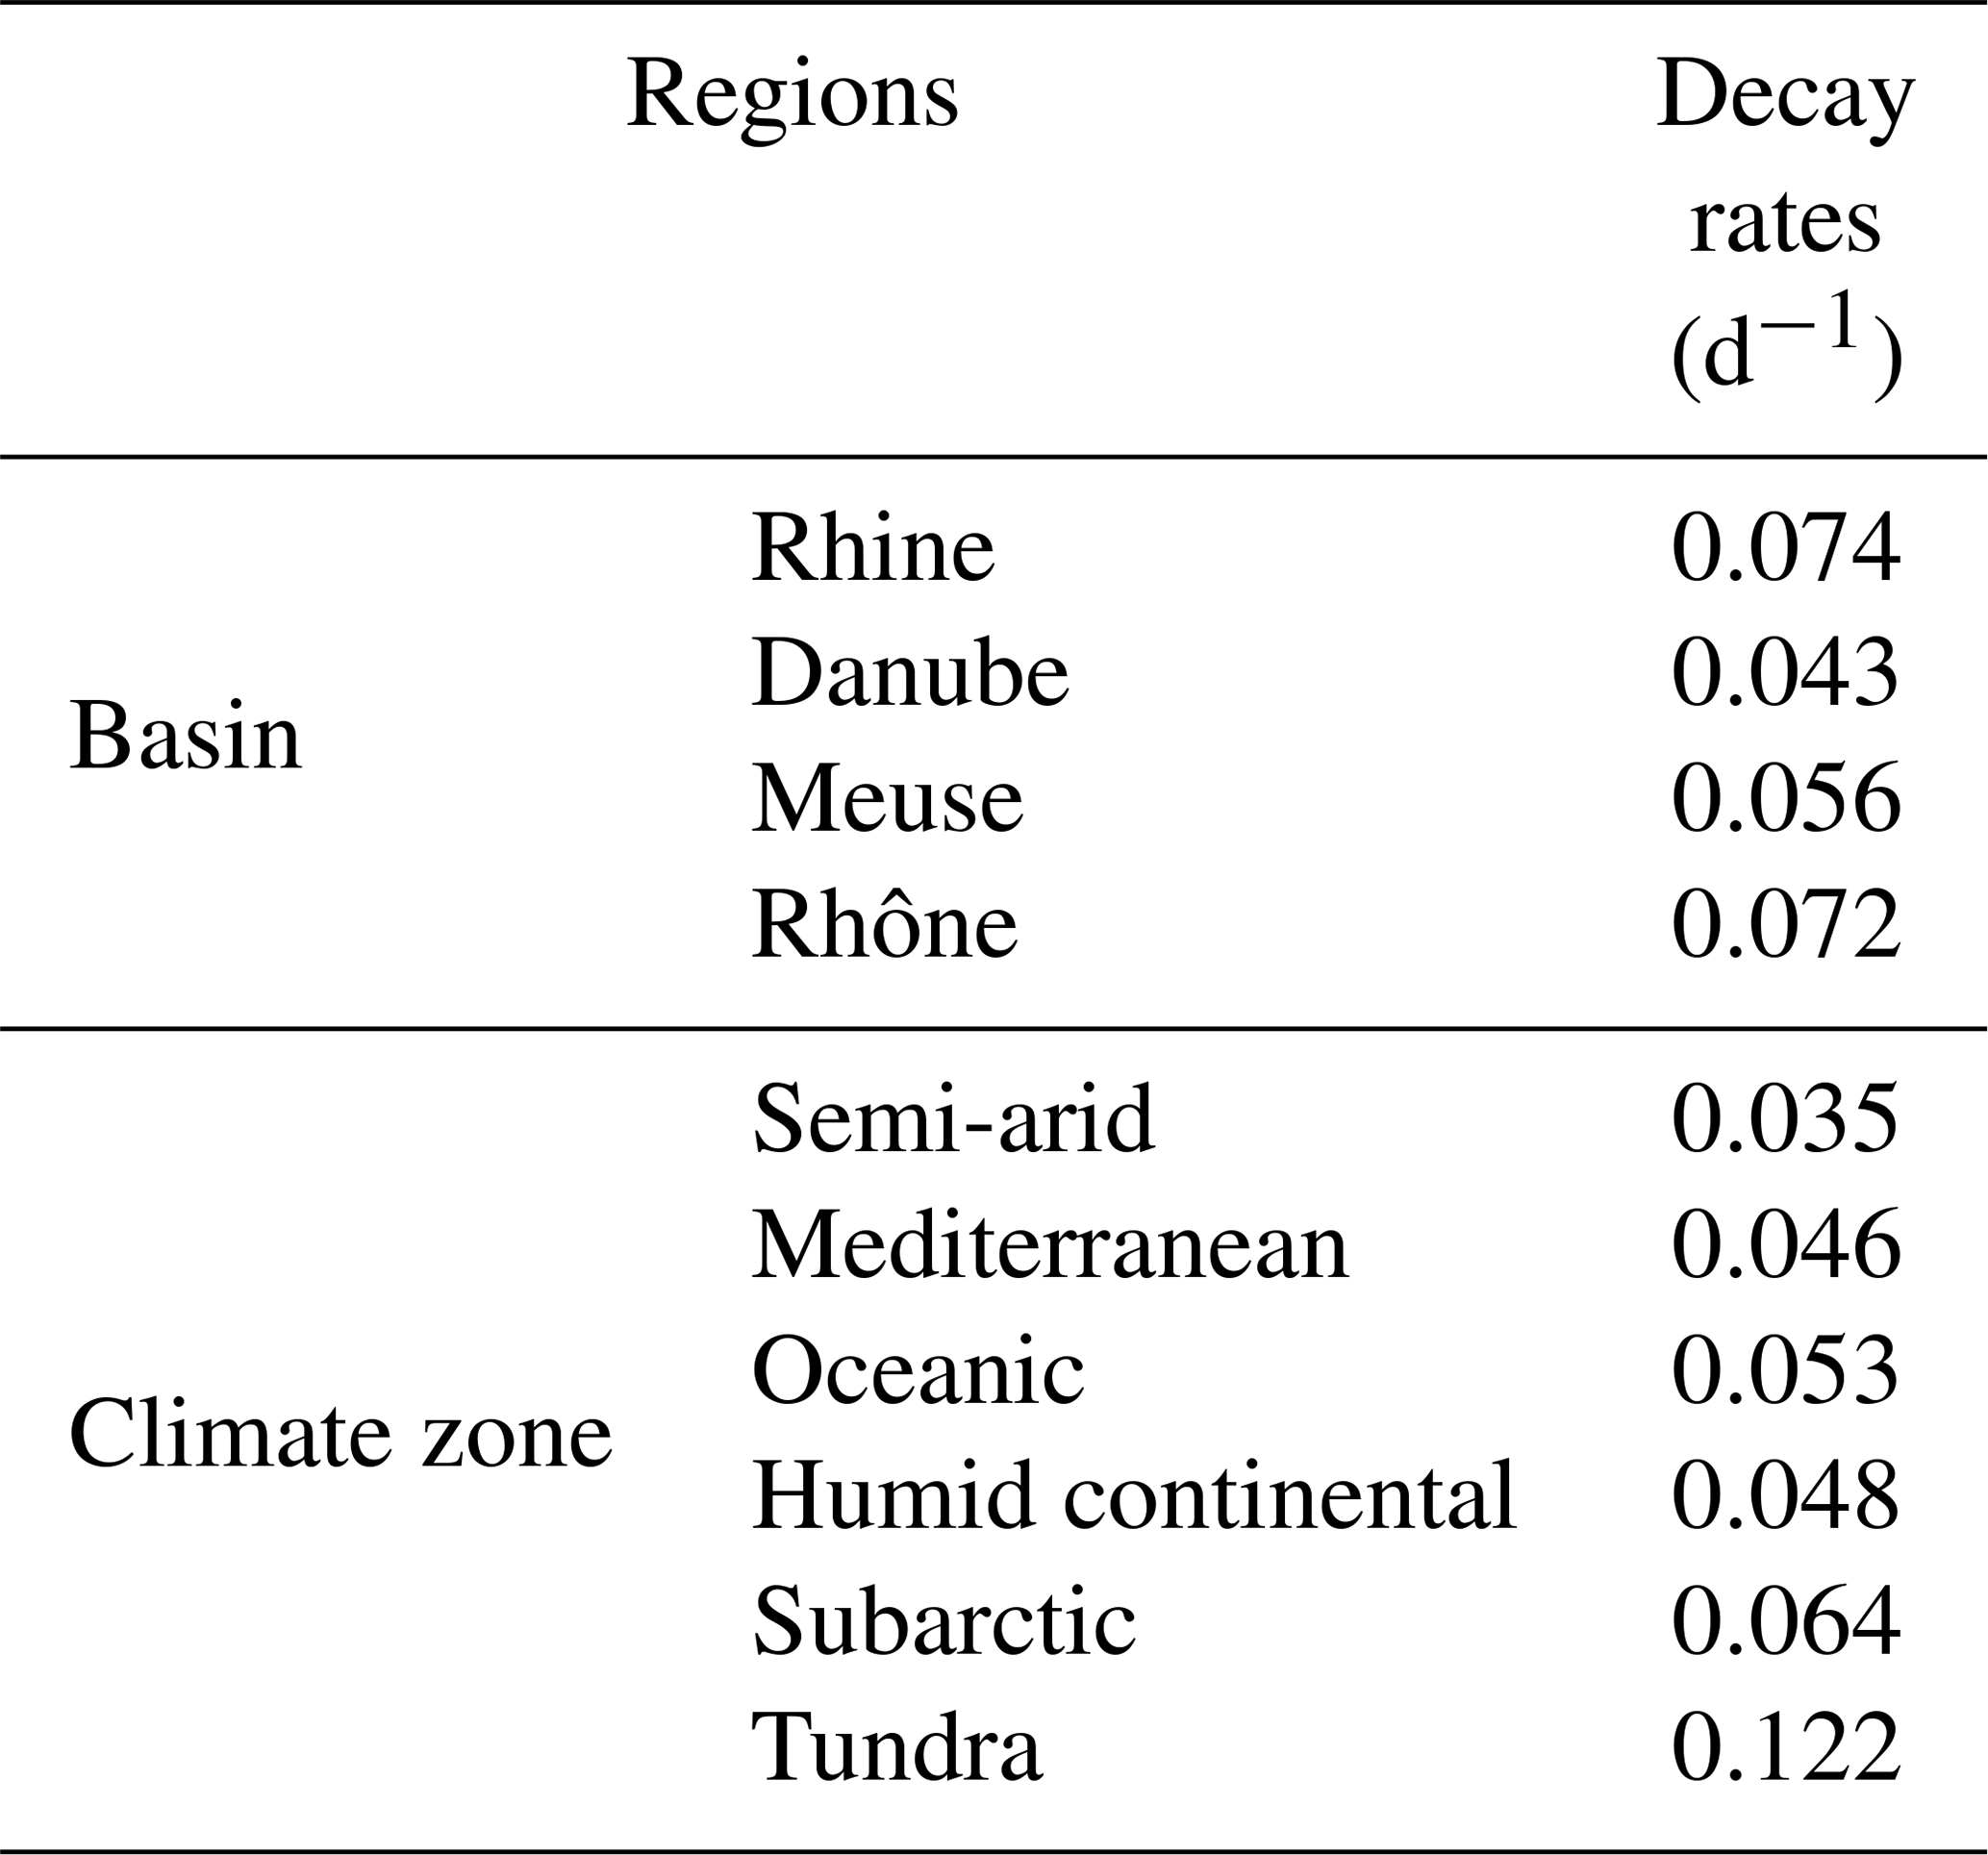
Figure 9 compares modeled versus observed multi-annual mean riverine DOC concentrations at specific locations or within a group of small river catchments. Local DOC measurements include data near the mouth of the Rhine, Elbe, Rhône and Seine rivers (discharge, DOC concentration and fluxes for the Rhine and Seine in Fig. 10). In addition, Abril et al. (2002) report DOC concentrations measured at nine river mouths discharging along the Atlantic façade and the North Sea, three of which – Rhine (NL), Scheldt (BE) and Gironde (F) – resolve the seasonality, while the other six – Elbe (GE), Ems (GE), Thames (UK), Loire (FR), Sado (P) and Douro (P) – only rely on a single measurement per year. Both GLORICH and Abril et al. (2002) report DOC concentrations at the mouth of the Rhine and the Elbe, but their values diverge because, in addition to analytical uncertainties, the sampling period and data density are not the same. The measured values are equal to 4.3 and 2.9 mg C L−1 for the Rhine and 4.6 and 6.1 mg C L−1 for the Elbe, highlighting the inherent variability in observational data. To complement these local samplings, we also compared our simulated DOC concentrations with those of Mattsson et al. (2009) for several groups of catchments in Finland (9 spread over the whole country), Denmark (10 draining into Horsens Fjord), the UK (10 draining into the River Conwy) and France (5 draining into the River Tech). All measured DOC concentrations ranged from 2.5 to 10 mg C L−1, except in two regions in the north (Finland and basins flowing into the Baltic sea), where concentrations exceeded 10 mg C L−1. For most of the data, the model slightly overestimated the river DOC concentrations. The model results also suggest that DOC concentrations broadly increase with latitude, with the higher values found in humid continental and subarctic climate and the lower ones in the Mediterranean climate, a result in agreement with the observations from Mattsson et al. (2009). Such a pattern possibly results from the decreasing mean annual air temperature and runoff in northern Europe that favor incomplete decomposition of litter and soil DOC, thus favoring DOC production in the soil, while at the same time, DOC turnover rates in the soils decreased. The increased abundance of forests, in particular coniferous forests, is also a valid explanation for higher DOC leaching (Lauerwald et al., 2012). However, it is important to keep in mind that we are not representing peatlands, suggesting that we could lack part of the DOC leaching in subarctic and tundra regions, leading to even higher DOC fluxes further north. Finally, the comparison reveals that model performance tends to improve with catchment size, likely reflecting the difficulty of capturing the DOC dynamics at a small scale with the current resolution of ORCHILEAK. However, overall, our model is capable of reproducing observed yearly mean DOC concentrations for a wide range of river basins spread between Finland and Portugal.
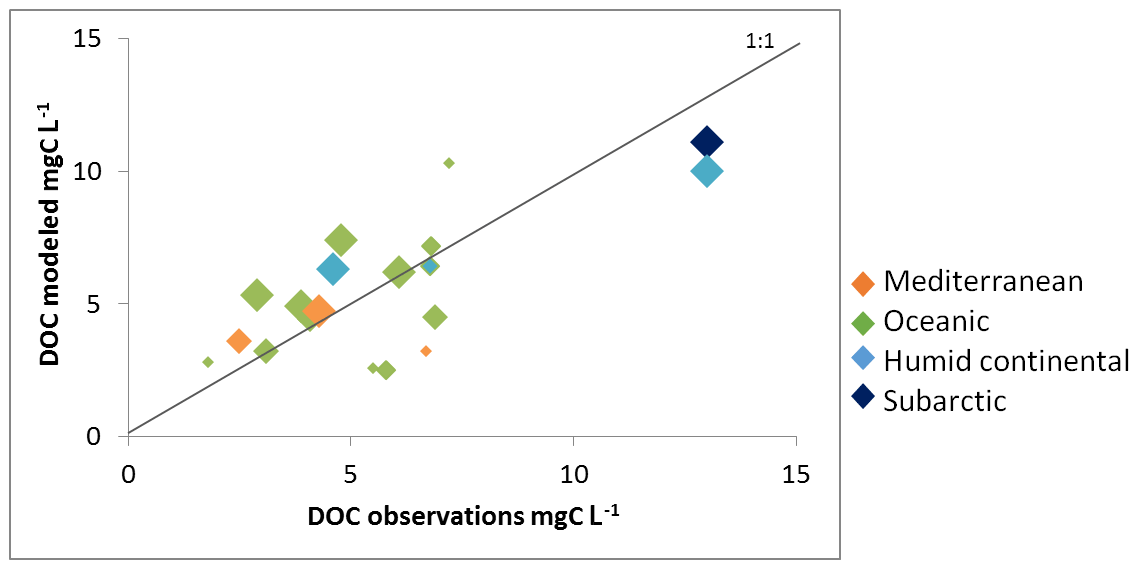
Figure 9Modeled river DOC concentration against observed values. The color code indicates the dominant climate zone for each catchment while the size of the diamond is proportional to the catchment area according to the following classes: <10 000, <50 000, <100 000 and >100 000 km2. See Table S4 for further details.
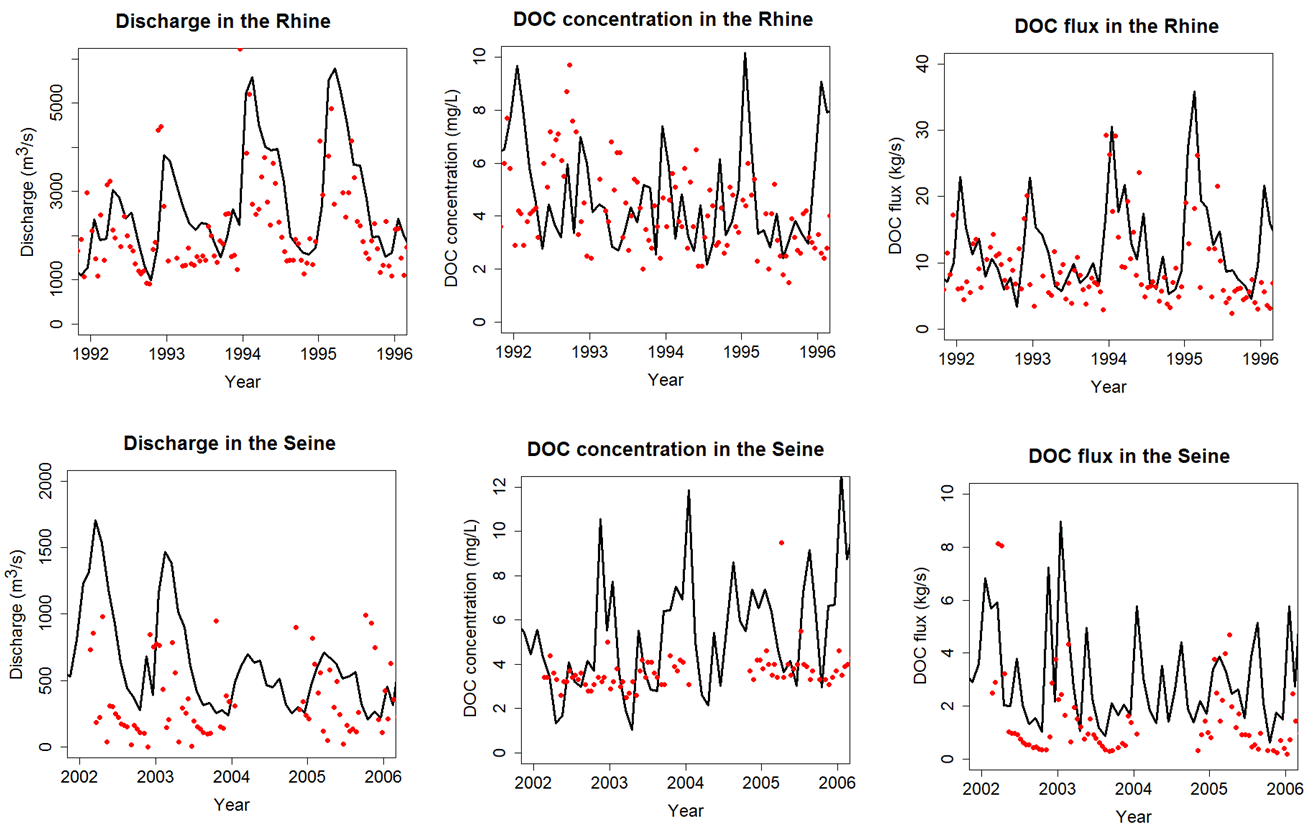
Figure 10Time series of discharge (a, d), DOC concentration (b, e) and DOC fluxes (c, f) in the Rhine at Lobith (a–c, period 1992–1996) and in the Seine at Poses (d–f, period 2002–2006. See Fig. 3 for location of stations. Black lines are for ORCHILEAK and red dots for observations.
The temporal evolution of observed river DOC fluxes is only available at four stations (Rhine, Elbe, Rhône and Seine) where DOC time series have been recorded over multi-annual periods (Rhine and Seine illustrated in Fig. 10). In terms of interannual variability (IAV), riverine DOC fluxes present the highest variability with a coefficient of variance (COV) of 0.62 for the Seine and 0.57 for the Rhine. For comparison, IAV of discharge and riverine DOC concentration shows COVs of 0.60 and 0.51 for the Seine and 0.40 and 0.45 for the Rhine, respectively. The higher IAV for the flux is due to the tendency for higher concentrations to coincide with higher discharge, which is due to the flushing effect, where higher discharges follow higher amounts of runoff from topsoils rich in DOC. The multi-year mean modeled DOC fluxes are estimated for the Rhine, Elbe, Rhône and Seine at 11.9, 7.2, 8.8 and 3.2 kg s−1, respectively. The observations amount, respectively, to 7.9, 3.6, 4.6, 1.6 kg s−1. For all stations, the model thus slightly overestimates fluvial DOC fluxes, which is not surprising since the model tends to overestimate the discharge. At these four stations, ORCHILEAK also slightly overestimates river DOC concentrations except for the Seine, where concentrations are largely underestimated and discharge largely overestimated. In terms of temporal correlation, the simulated DOC flux for the Rhône compared to that observed yields an R2 of 0.6 and a mean error of 92 % (results for the Seine, Elbe and Rhine are reported in Table S6). In Fig. 9, we clearly see a large overestimation of the temporal variability in DOC concentrations and this could lead to an overestimation in DOC fluxes since there is a positive relationship between concentrations and discharge. The overestimation of DOC concentrations and consequently of DOC fluxes could be due to high DOC leaching.
The overestimation of DOC fluxes can also be due to the fact we choose to not recalibrate the hydrology scheme but instead we optimized the model for the discharge by adjusting the surface roughness of the vegetation (Sect. 2.2.1). Since those four stations are all located in the same region with the same type of land cover (western Europe), two other locations have been selected: the UK and the Baltic Sea. For those two locations, there are no time series data for DOC flux but some studies have measured DOC concentrations/fluxes. Worrall et al. (2012) estimated DOC concentration across the UK and Fransner et al. (2016) reported modeled DOC concentrations for all the catchments flowing into the Baltic Sea.
Finally, although the model–data comparison points to a slight overestimation of the river DOC export flux, our pan-European estimate amounts to 12.3 Tg C yr−1. This estimate is in fact about 35 % lower than that reported in another model study (Li et al., 2019) based on TRIPLEX-HYDRA, a process-based model for which the DOC export flux reaches 19.3 Tg C yr−1. Li et al. (2019) applied the model at the global scale, and simulation results were primarily evaluated against observations for the world's largest rivers and here Europe only included the Volga River. Li et al. (2019) then applied the model for multiple rivers in Europe, such as the Danube, the Po and the Elbe. Despite these different scales of analysis, the export fluxes predicted by both models fall within the same order of magnitude.
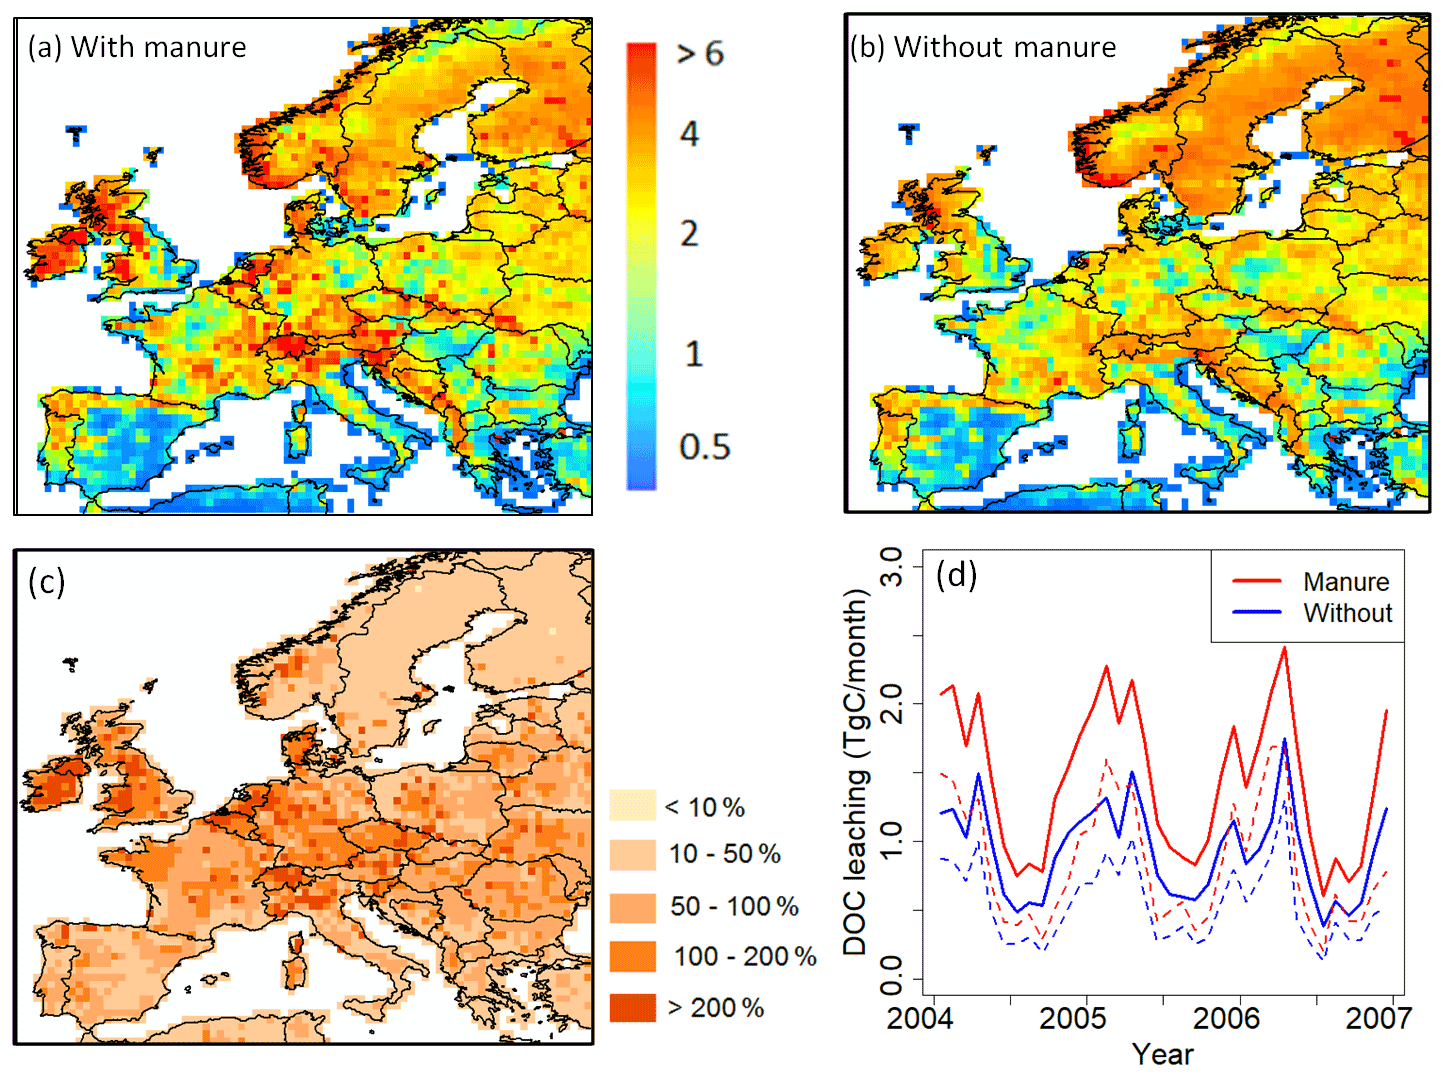
Figure 11Comparison of modeled yearly mean terrestrial DOC leaching flux (period 1979–2006) into the European river network (in g C m−2 yr−1), with (a) and without (b) the representation of manure application. (c) Increase of DOC leaching in percentage compared to DOC leaching without manure implementation. (d) Comparison of total DOC leaching (solid line) and DOC leaching through runoff only (dashed line) throughout Europe with and without manure application (period 2004–2006).
3.1.6 Manure implementation
The implementation of manure significantly affects DOC leaching from grasslands and croplands (Fig. 11), which cover more than half of the studied region. The average annual input rate of manure into the soil is around 2.5 g C m−2 yr−1 (Fig. 2c). With manure implementation, the DOC leaching rate increases drastically (an average of +72 % compared to DOC leaching without manure), in particular in the oceanic and humid continental climate regions, where the average DOC leaching rate changes from 1.6 to 2.7 g C m−2 yr−1 and from 1.7 to 2.5 g C m−2 yr−1, respectively. For the whole of Europe, manure implementation leads to an increase of total DOC leaching into the river network from 9.8 to 14.3 Tg C yr−1 (Fig. 11a and b). Figure 11d shows that the application of manure increases DOC leaching in particular in winter (January, February and March) while in summer (July, August and September) the increase is relatively low. In ORCHILEAK, the manure-derived DOC first enters the topsoil. There, a part of it is decomposed, and the rest is transported to deeper soil layers with percolating water. Finally, a variable part of the DOC derived from manure is flushed out of the soil column with the surface runoff and belowground drainage. As the manure first enters the topsoil, one could expect that it would mainly increase the DOC leaching from the topsoil. However, our results show that the application of manure does not influence the ratio of DOC leaching through surface runoff to belowground drainage. Over Europe, the average increase in topsoil DOC leaching due to manure is equal to half of the total increase, the rest of the increase being contributed by the drainage.
3.2 European-scale DOC leaching dynamics
3.2.1 Drivers of DOC leaching
Here, we analyze what controls the spatial distribution and temporal variability in DOC leaching. While the grid cell and the basin scales were the most relevant for the model evaluation, when searching for potential drivers of soil DOC leaching, such as temperature, runoff and drainage (driven by precipitation), a climatologic segmentation of the European domain can help to better explain the impact of these drivers. Figure 12 shows seasonal variability of DOC leaching and total runoff (surface runoff plus drainage) in different climate zones of Europe, revealing a clear and consistent relationship between those two fluxes. The seasonal peak in DOC leaching consistently occurs in winter, while minimum values are found during summer. These results suggest that both spatial and temporal variability in leaching are correlated to total runoff.
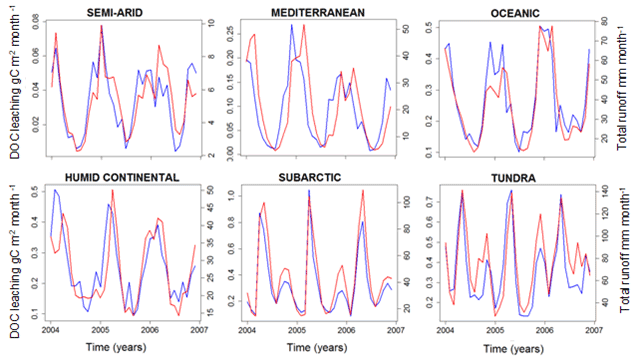
Figure 12Simulated DOC leaching flux (g C m−2 per month; blue) and total runoff (mm per month; red) for the six largest climate zones in Europe (period 2004–2006).
To further explore the environmental controls of DOC leaching, we calculate the partial correlation factor for surface runoff, drainage, temperature and NPP, and they are, respectively, 0.43, 0.54, −0.17 and 0.18, highlighting that surface runoff and drainage can explain most of the spatiotemporal variability in DOC leaching fluxes, with temperature and NPP only playing a subordinate role. We decided to express DOC leaching as fraction of the annual terrestrial NPP (Fig. 13). In doing so, we assume that NPP, which is undoubtedly the ultimate C source for DOC production (since litter and SOC stocks, the sources of DOC, are fed by NPP), also acts as an important control of the DOC leaching flux. Moreover, in normalizing DOC leaching by NPP, we strive to show the possible influence of other controls, allowing for a more in-depth analysis of the effect of hydrology and climate on the DOC leaching flux. Figure 13 reveals that the fraction of terrestrial NPP lost to DOC leaching increases, as expected, with total runoff. Moreover, this fraction increases with the contribution of surface runoff to total water loss from surface runoff plus drainage (Fig. 13b). This can be explained by the general decrease in soil DOC concentrations with depth (Fig. 6), leading to higher DOC concentrations in surface runoff than in drainage. In fact, according to our simulations, 97 % of the leached DOC is concentrated in the surface runoff. Note that higher total runoff is often associated with a higher contribution of surface runoff, which leads to a “flushing effect”, where high runoff events contribute a disproportionately high amount to the long-term DOC leaching (Idir et al., 1999; Raymond and Saiers, 2010). Finally, we found higher ratios of leaching to NPP at lower temperatures (Fig. 13a), suggesting that lower temperatures lead to longer turnover times of DOC in the soil, and thus higher concentrations in the leaching flux (Sect. 2.1.2).
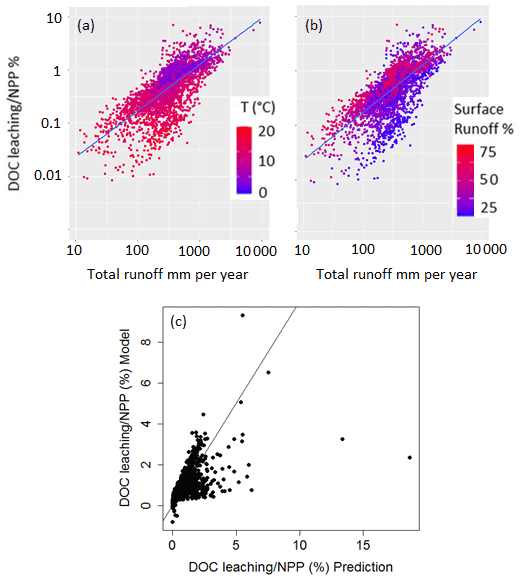
Figure 13Fraction (%) of terrestrial NPP that is leached as DOC into the river network as a function of total runoff. Each point represents the grid-cell average of both metrics for the entire simulation period (1979–2006). In panel (a) the color scale represents the grid-cell average temperature (∘C) while in panel (b), the color scale represents the ratio of surface runoff to total runoff in percentage. Panel (c) shows the normalized predicted ratio of DOC leaching flux to NPP (Eq. 13) against the normalized simulated values.
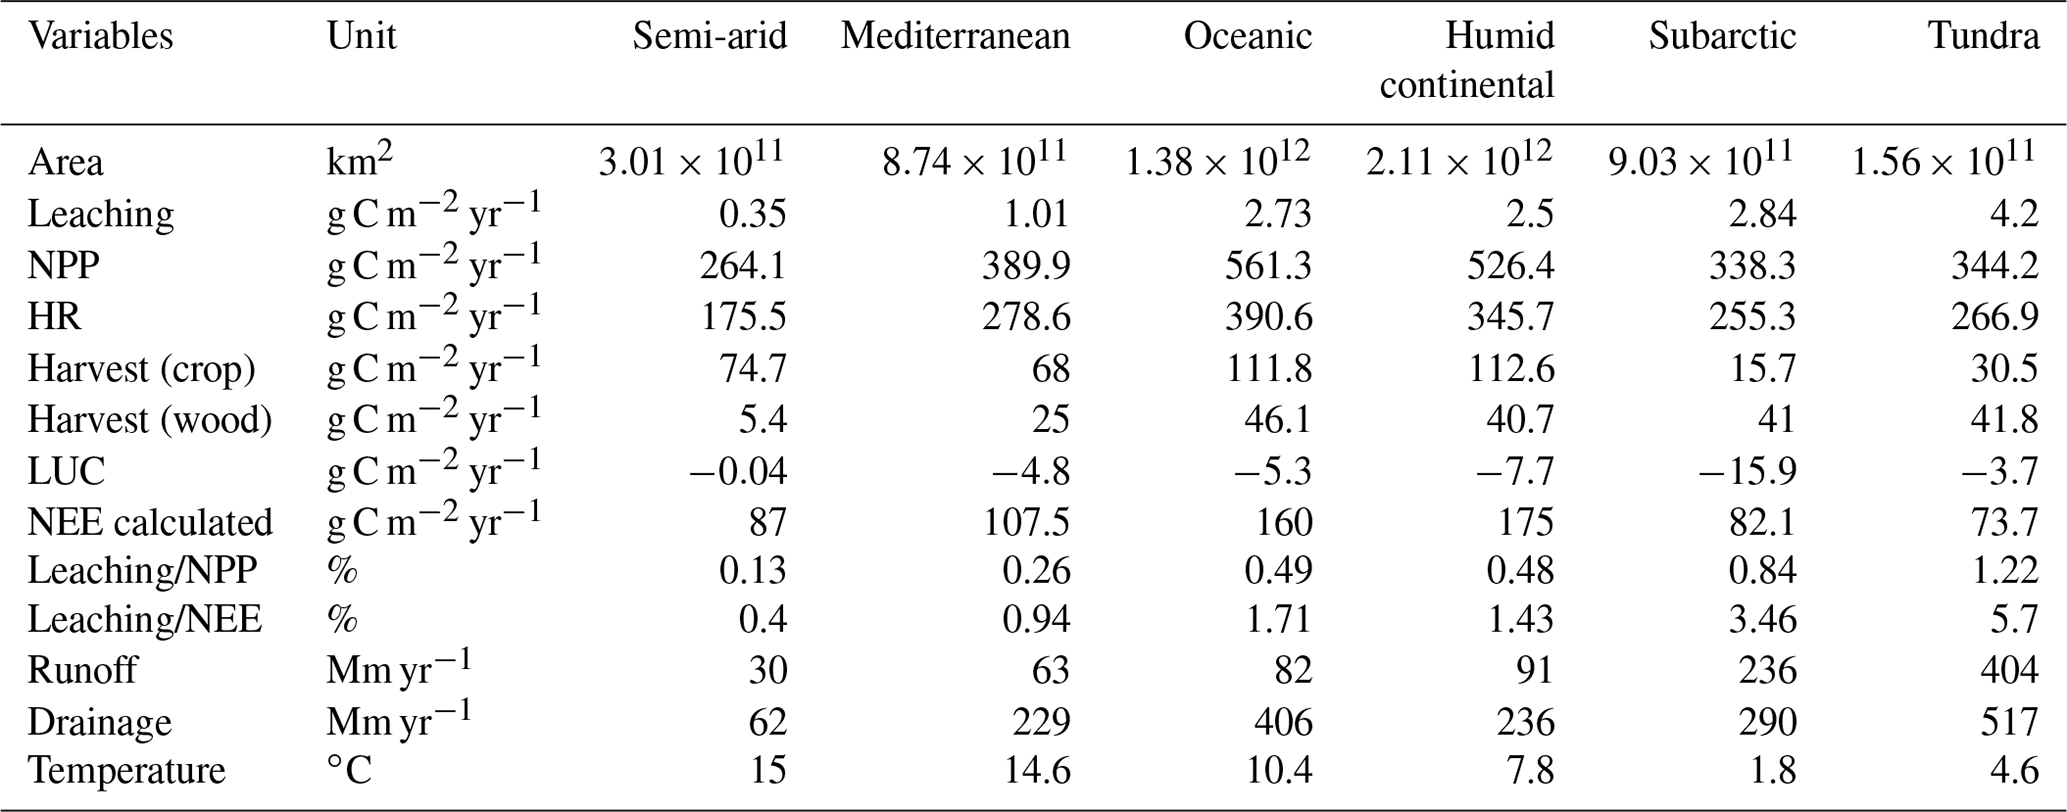
Table 3Key physical and biogeochemical characteristics of the six dominant climate zones of the European domain.
To better quantify the effects of all these drivers on DOC leaching, we fitted a multi-linear regression model to predict the ratio of DOC leaching to NPP as a function of surface runoff, drainage and temperature at all grid points and for each month over the simulation period (Eq. 13). The idea behind this rationale is to highlight that once normalized to the terrestrial NPP, we can directly analyze which physical drivers impact the fraction of NPP that is lost to leaching from terrestrial ecosystems. To compare the importance of each predictor for the spatiotemporal patterns of DOC leaching, we normalized all variables, Vs, of Eq. (13) according to Eq. (14), where i is the cell index.
(p value < except for temperature, where p value = )
To rule out any significant multi-collinearity in the regression model, for each predictor we calculated the variance inflation factor (VIF). The VIF evaluates the correlations among all predictors which could impact the robustness of the regression model (James et al., 2017). The closer the VIF is to 1, the more robust is the model. In our regression, the VIFs of the runoff, drainage and temperature are, respectively, 1.13, 1.13 and 1.01, confirming that our prediction is robust and not biased by high multicollinearity.
In Fig. 13c, the DOC leaching simulated by ORCHILEAK is compared with the one predicted by Eq. (13). Our simple regression model is able to reproduce the simulations with a residual standard error of 0.68 % and an R2 of 0.45. The coefficients of our regression model reveal that spatiotemporal variability in DOC leaching is mainly driven by surface runoff (KR) and drainage (KD). Air temperature, as a third control of DOC leaching, is of subordinate importance, as reflected by its low predictor coefficient (KT).
Table 3 summarizes, for each climate zone in Europe, the DOC leaching fluxes (in absolute value and normalized by the NPP) as well as other important components of the terrestrial C budget. Since runoff and temperature were identified as the controlling factors of the DOC leaching flux, normalized DOC leaching fluxes are expected to be significantly different among climate zones. Indeed, the fraction of NPP lost to the river network as DOC is the lowest in the semi-arid region (0.13 %), where annual precipitation is low (total runoff around 92 mm yr−1) and temperatures are high.
The highest fraction of NPP exported to rivers as DOC is found in the tundra climate, reaching 1.22 %. This can be explained by high runoff and drainage (reaching 920 mm yr−1) in this climate zone, but also by low temperatures lowering the fraction of DOC already decomposed within the soil column. The subarctic climate also presents a similarly high ratio of DOC leaching to NPP, with a value of 0.84 %. The Mediterranean, oceanic and humid continental climate zones present ratios of intermediate DOC leaching to NPP of, respectively, 0.26 %, 0.48 % and 0.49 %. Averaged over the whole of the EU-27, the DOC leaching flux normalized to the NPP amounts to 0.60 %.
3.2.2 Comparison with previous assessments of DOC leaching
In one of the first studies on the terrestrial C budget of Europe (Janssens et al., 2003) an imbalance (missing sink) between atmospheric CO2 inversions and bottom-up C stock change accounting was partly attributed to the loss of carbon from land to rivers in the form of DOC of around 4 g C m−2 yr−1. Our results, 2.6±2.5 g C m−2 yr−1, support this hypothesis although we suggest a DOC leaching rate slightly lower than this early study. Our lower value may come from the fact that we did not simulate peatlands and organic soils, which are known hotspots of DOC leaching (Leifeld and Menichetti, 2018), in particular in areas such as the northern UK and Scandinavia. Uncertainties in the processes included or omitted in the model could also explain some of the discrepancy. In terms of temporal variability, we found the highest DOC leaching in winter averaged over the continent (8.9 Tg C in total for the 6 months of winter October to March) and the lowest in summer (5.4 Tg C over the period April to September), consistent with the findings of Kindler et al. (2011). In terms of drivers of the DOC leaching fluxes, our results are in line with empirical findings by Gielen et al. (2011) that identified hydrology as the main driver of the inter- and intra-annual variability in DOC leaching. Similar conclusions have also been drawn by other empirical studies (Michalzik et al., 2001; Neff and Asner, 2001; Worrall and Burt, 2007).
It is also interesting to compare our results with recent global and regional model studies of DOC leaching in tropical and boreal ecosystems. For the Amazon and Congo basins, Hastie et al. (2019, 2021) found that, respectively, 12 % and 4 % of the NPP are exported each year to inland waters in the form of DOC and CO2 – much higher than we report for Europe (0.6 %), but this value only accounts for DOC. Note that for these tropical lowland river basins, extensive riparian wetlands are an important source of DOC, which are of minor importance in Europe. For the Lena River basin located in the boreal region, Bowring et al. (2020) found a ratio of DOC leaching to NPP of about 1.5 %. In our model assessment, this ratio reaches a very similar value of 1.2 % for the boreal portion of Europe. For the temperate zone, a ratio of 0.35 % for the East Coast of the USA can be calculated when dividing the average DOC leaching flux of 2.7 g C m−2 yr−1 simulated by Tian et al. (2015) by the average NPP of 780 g C m−2 yr−1 estimated by Zhao et al. (2005). Further, our value is quite similar to the one extracted from the global study by Nakhavali et al. (2021), which amounts to 0.5 % for the European domain only. Overall, this comparison highlights that in Europe, the fraction of NPP lost as DOC to the river network is significantly smaller than in other regions of the world. The lower value is likely due to the lower connectivity between terrestrial and aquatic systems due to the lack of extensive wetlands, which have been reduced by major regulation of the European river network.
3.2.3 Implications for the terrestrial carbon budget of Europe
The terrestrial carbon budget is controlled by NPP, heterotrophic respiration, crop and wood harvesting and land-use change. Here we look at the net ecosystem exchange (NEE), which is the net C exchange between land and atmosphere (Kramer et al., 2002). However, this view neglects the leakiness of terrestrial ecosystems that permanently removes a fraction of the land C and export it to the river network. Moreover, we can argue that DOC leaching represents a fraction of NEE, while the remainder of NEE can be attributed to harvest, land-use change and changes in biomass and soil C stocks. From 1979 to 2012, the average NEE in Europe was 860 Tg C yr−1 (123 g C m−2 yr−1), equalling about 28 % of the total NPP (Fig. 14b). The ratio of DOC leaching to NEE shows drastic spatial variation, varying from an average value of 0.4 % in the semi-arid region to a value of 5.7 % in the tundra region. For the whole Europe, the DOC leaching is about 3 % of the NEE.
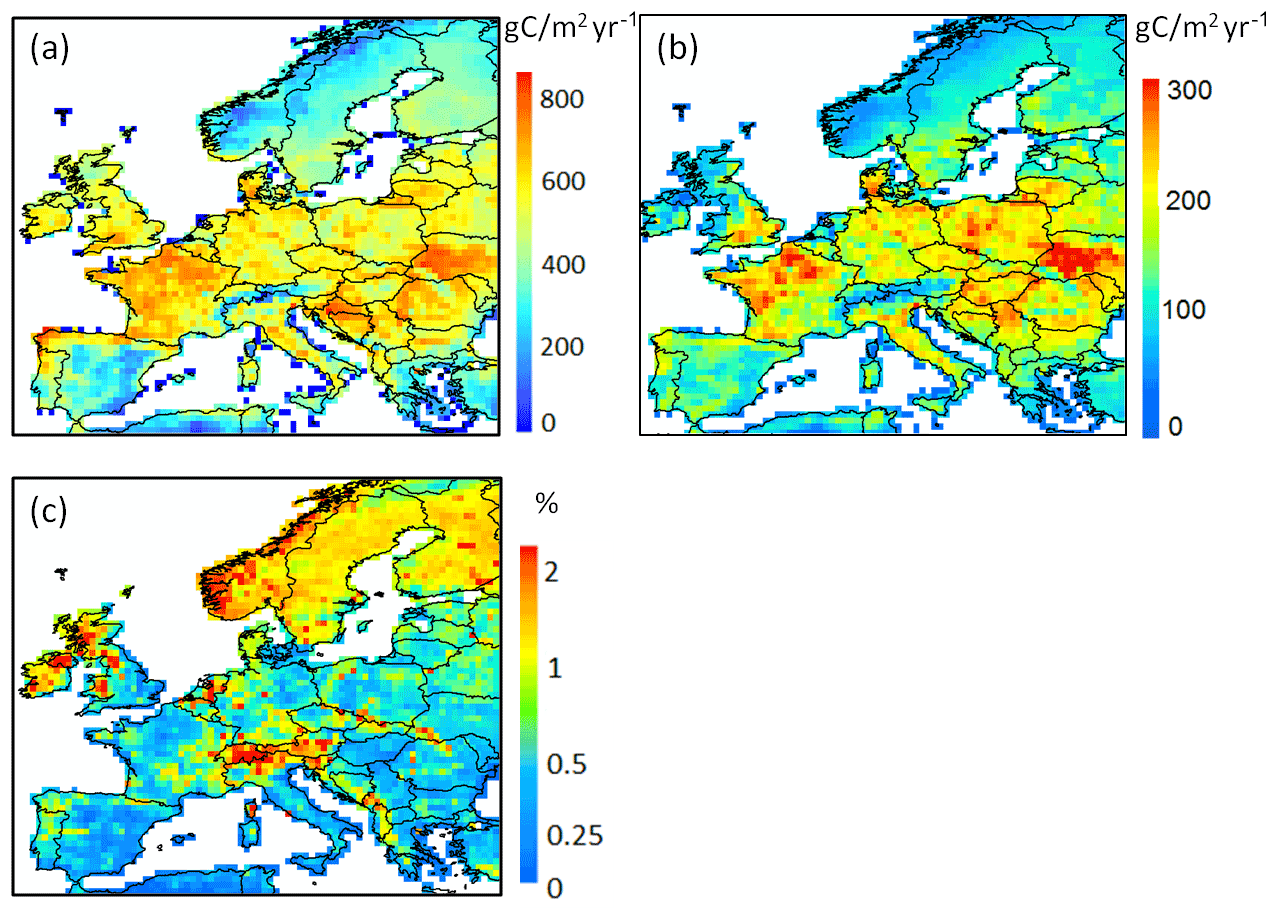
Figure 14Grid-cell average of (a) net primary production (NPP), (b) net ecosystem exchange (NEE) and (c) fraction of NPP leached into the river network as DOC (%) for the period 1979–2006.
3.3 Model limitations
ORCHILEAK is an LSM that simulates the impact of riverine DOC transfers on the terrestrial C budget, but it still suffers from several limitations. In fact, ORCHILEAK cannot represent all biogeochemical transformation processes affecting DOC in the soil column and the river network (Lauerwald et al., 2017). For instance, environmental controls such as soil pH and ionic strength have been demonstrated to have an impact on DOC solubility in soils (Monteith et al., 2007) and thus affect DOC leaching into streams. Unfortunately, these processes are not represented in our model, as there are still no reliable methods and forcing data to simulate the dynamics of soil pH and ionic strength in the soil solution at a large scale.
As mentioned before, peatlands are not included in the model, yet they cover a large part of northern Europe. Peatlands are known to play an important role in the C cycle, and are an important source of DOC for the river network. One of the major next steps would thus be to merge ORCHILEAK with ORCHIDEE-PEAT, a new branch of the LSM ORCHIDEE that simulates the development and C balance of peatlands (Qiu et al., 2019).
Another source of DOC originates from wastewater treatments plants, which are not included in the model due to the lack of forcing data related to sewage water treatment. It has been shown that DOC concentrations in sewage are important (Griffith et al., 2009). However, Meybeck (1986) showed that DOC from sewage is very labile and only affects concentrations within short distances downstream of water processing plants. Having avoided observational data from sites known to be impacted by sewage effluents directly, we assume that our model–data evaluation was not impacted by this potential DOC source. To assess the role of soil DOC leaching in the terrestrial C budget, sewage is not a contribution of direct interest.
While riparian zones are a major source of DOC for the river network (Inamdar and Mitchell, 2006; Grabs et al., 2012), the impact of riparian zones on DOC leaching through runoff into the river network is only implicitly represented in the model (as described in Lauerwald et al., 2017). Due to the coarse resolution of the model, riparian zones around small streams (order 1 to 3) cannot be explicitly included in the model. It is assumed that the extent of the riparian zones, from which most of the DOC stems, scales linearly to the surface area of these small streams, both in time as well as in space (i.e., between different grid cells of our model grid). While the surface area of these small streams is not directly represented, Lauerwald et al. (2017) assumed that the spatial and temporal variations in this stream surface area scale to the square root of the discharge that is flowing through these streams, roughly in line with empirical scaling laws (e.g., Raymond et al., 2012). For the larger rivers, for which the surface area is explicitly represented in the model, it is assumed that the inundated riparian zone can temporally comprise up to 10 % of the river water surface area, depending on the temporal variability of discharge. Here, DOC produced from decomposition of litter and SOC is directly injected into the river water body.
ORCHILEAK could further be improved through the implementation of lakes and reservoirs. It has been shown that dams have a direct impact on C retention efficiency in the inland water river network (Maavara et al., 2017). So far, ORCHILEAK does not represent lateral transport of POC at the continental scale, yet its non-negligible role in the terrestrial C budget has been demonstrated (Zhang et al., 2018, 2020; Naipal et al., 2018). Finally, the effect of nutrient limitation on the C cycle is not yet accounted for in ORCHILEAK. It has been demonstrated that the implementation of nitrogen (N) and phosphorus (P) could reduce the simulated land C sink (Goll et al., 2012; Sun et al., 2021). It can be assumed that nutrient limitation would similarly affect DOC leaching, and it could dampen its increase with the rising atmospheric CO2 levels predicted by previous studies with ORCHILEAK (Lauerwald et al., 2020; Hastie et al., 2021).
We reconstructed the terrestrial and riverine C fluxes in Europe during the period 1979–2012 using the ORCHILEAK LSM. The total C leaching from soils into European rivers is 14.3 Tg C yr−1 on average, about 0.6 % of the estimated NPP and 3 % of the terrestrial net uptake of atmospheric C. This flux shows large spatial and temporal variations. In specific, DOC leaching overall increases from warm and dry regions to cold and wet regions. However, since the model does not represent peatlands yet, the simulation results for subarctic and tundra regions in northern Europe could be biased. For the whole of Europe, the DOC leaching rate is the highest in winter and lowest during the summer, mainly controlled by the seasonal variation of runoff. The implementation of manure leads to a significant increase in DOC leaching over the oceanic and humid continental region, where croplands and grasslands are dominant. Our results contribute to a better assessment of the land–ocean C fluxes in Europe and to a better understanding of the effects of lateral C transfer on the terrestrial C budget. Combined with recent large-scale studies in tropical and boreal biomes, as well as along the East Coast of the USA, an emergent view regarding the global role of DOC leaching in the terrestrial C balance, and its underlying drivers, is progressively emerging.
The model code used in this study is available at DOI: https://doi.org/10.14768/75AC2F47-4691-46AF-9B12-B1A9629CBC56 (Gommet et al., 2021).
All forcing data set are listed in Table 1. The data of observed discharges used in this study are available from the Global Runoff Data Center (GRDC) at https://www.bafg.de/GRDC/EN/Home/homepage_node.html (BAfG, 2021). The data of the observed DOC concentrations for France are provided by eau de France, available at http://www.data.eaufrance.fr/ (eaufrance, 2021).
The supplement related to this article is available online at: https://doi.org/10.5194/esd-13-393-2022-supplement.
CG, RL, PR and PC designed the study. CG performed the calibration and evaluation of the model, ran the simulations and wrote the initial manuscript. RL updated the model code of ORCHILEAK to improve the representation of soil hydrology and DOC cycling. HZ implemented the representation of manure impacts on soil DOC dynamics into the model code. All co-authors contributed to the interpretation of the model results and the improvement of the manuscript.
The contact author has declared that neither they nor their co-authors have any competing interests.
Publisher's note: Copernicus Publications remains neutral with regard to jurisdictional claims in published maps and institutional affiliations.
This article is part of the special issue “Modelling inland waters in a changing climate (GMD/ESD/TC inter-journal SI)”. It is a result of the 6th Workshop on Parameterization of lakes in Numerical Weather Prediction and Climate Modelling, Toulouse, France, 22–24 October 2019.
Ronny Lauerwald, Philippe Ciais and Bertrand Guenet acknowledge funding from French state aid, managed by ANR under the “Investissements d'avenir” programme [ANR-16-CONV-0003]. Haicheng Zhang, Pierre Regnier and Ronny Lauerwald acknowledge the “Lateral-CNP” project (No. 34823748) supported by the Fonds de la Recherche Scientifique – FNRS. Céline Gommet and Pierre Regnier acknowledge funding from the European Union's Horizon 2020 research and innovation programme under grant agreement nos. 776810 (project VERIFY) and 101003536 (ESM 2025).
This paper was edited by Karsten Rinke and reviewed by two anonymous referees.
Abril G., Nogueira, M., Etcheber, H., Cabeçadas, G., Lemaire, E., and Brogueira, M.: Behaviour of organic carbon in nine contrasting European estuaries, Estuar. Coast. Shelf Sci., 54, 241–262, 2002.
Avitabile, V. and Camia, A.: An assessment of forest biomass maps in Europe using harmonized national statistics and inventory plots, Forest Ecol. Manage., 409, 489–498, 2018.
BAfG – Bundesanstalt für Gewässerkunde: Global Runoff Data Centre, https://www.bafg.de/GRDC/EN/ Home/homepage_node.html, last access: 15 April 2021.
Berggren, M. and Al-Kharusi, E. S. Decreasing organic carbon bioreactivity in European rivers, Freshwater Biol., 65, 1128–1138, https://doi.org/10.1111/fwb.13498, 2020.
Bloom, A. and Williams, M.: CARDAMOM 2001–2010 global carbon Model-Data Fusion (MDF) analysis, 2001–2010, School of GeoSciences, University of Edinburgh [data set], https://doi.org/10.7488/ds/316, 2015.
Bowring, S. P. K., Lauerwald, R., Guenet, B., Zhu, D., Guimberteau, M., Tootchi, A., Ducharne, A., and Ciais, P: ORCHIDEE MICT-LEAK (r5459), a global model for the production, transport, and transformation of dissolved organic carbon from Arctic permafrost regions – Part 1: Rationale, model description, and simulation protocol, Geosci. Model Dev., 12, 3503–3521, https://doi.org/10.5194/gmd-12-3503-2019, 2019.
Bowring, S. P. K., Lauerwald, R., Guenet, B., Zhu, D., Guimberteau, M., Regnier, P., Tootchi, A., Ducharne, A., and Ciais, P.: ORCHIDEE MICT-LEAK (r5459), a global model for the production, transport, and transformation of dissolved organic carbon from Arctic permafrost regions – Part 2: Model evaluation over the Lena River basin, Geosci. Model Dev., 13, 507–520, https://doi.org/10.5194/gmd-13-507-2020, 2020.
Camino-Serrano, M., Gielen, B., Luyssaert, S., Ciais, P., Vicca, S., Guenet, B., De Vos, B., Cools, N., Ahrens, B., Altaf Arain, M., Borken, W., Clarke, N., Clarkson, B., Cummins, T., Don, A., Pannatier, E. G., Laudon, H., Moore, T., Nieminen, T. M., Nilsson, M. B., Peichl, M., Schwendenmann, L., Siemens, J., and Janssens, I.: Linking variability in soil solution dissolved organic carbon to climate, soil type, and vegetation type, Global Biogeochem. Cy., 28, GB004726, https://doi.org/10.1002/2013gb004726, 2014.
Camino-Serrano, M., Guenet, B., Luyssaert, S., Ciais, P., Bastrikov, V., De Vos, B., Gielen, B., Gleixner, G., Jornet-Puig, A., Kaiser, K., Kothawala, D., Lauerwald, R., Peñuelas, J., Schrumpf, M., Vicca, S., Vuichard, N., Walmsley, D., and Janssens, I. A.: ORCHIDEE-SOM: modeling soil organic carbon (SOC) and dissolved organic carbon (DOC) dynamics along vertical soil profiles in Europe, Geosci. Model Dev., 11, 937–957, https://doi.org/10.5194/gmd-11-937-2018, 2018.
Ciais, P., Sabine, C., Bala, G., Bopp, L., Brovkin, V., Canadell, J., Chhabra, A., DeFries, R., Galloway, J., Heimann, M., Jones, C., Le Quéré, C., Myneni, R. B., Piao, S., and Thornton, P.: Carbon and Other Biogeochemical Cycles Supplementary Material, in: Climate Change 2013: The Physical Science Basis, Contribution of Working Group I to the Fifth Assessment Report of the Intergovernmental Panel on Climate Change, edited by: Stocker, T. F., Qin, D., Plattner, G.-K., Tignor, M., Allen, S. K., Boschung, J., Nauels, A., Xia, Y., Bex, V., and Midgley, P. M., http://www.climatechange2013.org/ (last access: 17 February 2022), 2013.
Cole, J. J., Prairie, Y. T., Caraco, N. F., McDowell, W. H., Tranvik, L. J., Striegl, R. G., Duarte, C. M., Kortelainen, P., Downing, J. A., Middelburg, J. J., and Melack, J.: Plumbing the global carbon cycle: integrating inland waters into the terrestrial carbon budget, Ecosystems, 10, 171–184, 2007.
Delpla, I., Baures, E., Jung, A. V., Thomas, O.: Impacts of rainfall events on runoff water quality in an agricultural environment in temperate areas, Sci. Total Environ., 409, 1683–1688, https://doi.org/10.1016/j.scitotenv.2011.01.033, 2011.
de Rosnay, P., Polcher, J., Bruen, M., and Laval, K.: Impact of a physically based soil water flow and soil-plant interaction representation for modeling large-scale land surface processes, J. Geophys. Res.-Atmos., 107, 4118, https://doi.org/10.1029/2001JD000634, 2002.
d'Orgeval, T., Polcher, J., and de Rosnay, P. Sensitivity of the West African hydrological cycle in ORCHIDEE to infiltration processes, Hydrol. Earth Syst. Sci., 12, 1387–1401, https://doi.org/10.5194/hess-12-1387-2008, 2008.
Drake, T. W., Raymond, P. A., and Spencer, R. G. M.: Terrestrial carbon inputs to inland waters: a current synthesis of estimates and uncertainty, Limnol. Oceanogr. Lett., 3, 132–142, https://doi.org/10.1002/lol2.1005 https://doi.org/10.1002/lol2.10055, 2018.
eaufrance: Répertoire de données publiques sur l'eau, http://www.data.eaufrance.fr/, last access: 15 April 2021.
FAO/IIASA/ISRIC/ISS-CAS/JRC: Harmonized World Soil Database (version 1.2), FAO, Rome, Italy and IIASA, Laxenburg, Austria, https://www.fao.org/soils-portal/data-hub/soil-maps-and-databases/harmonized-world-soil-database-v12/en (last access: 15 February 2021), 2012.
Farjalla, V. F., Marinho, C. C., Faria, B. M., Amado, A. M., Esteves, F. A., Bozelli, R. L., and Giroldo, D.: Synergy of fresh and accumulated organic matter to bacterial growth, Microb. Ecol., 57, 657–666, https://doi.org/10.1007/s00248-008-9466-8, 2009.
Fonte, E. S., Amado, A. M., Meirelles-Pereira, F., Esteves, F. A., Rosado, A. S., and Farjalla, V. F.: The combination of different carbon sources enhances bacterial growth efficiency in aquatic ecosystems, Microb. Ecol., 66, 871–878, https://doi.org/10.1007/s00248-013-0277-1, 2013.
Fransner, F., Nycander, J., Mörth, C.-M., Humborg, C., Markus Meier, H. E., Hordoir, R., Gustafsson, E., and Deutsch, B.: Tracing terrestrial DOC in the Baltic Sea – a 3-D model study, Global Biogeochem. Cy., 30, 134–148, https://doi.org/10.1002/2014GB005078, 2016.
Friedlingstein, P., O'Sullivan, M., Jones, M. W., Andrew, R. M., Hauck, J., Olsen, A., Peters, G. P., Peters, W., Pongratz, J., Sitch, S., Le Quéré, C., Canadell, J. G., Ciais, P., Jackson, R. B., Alin, S., Aragão, L. E. O. C., Arneth, A., Arora, V., Bates, N. R., Becker, M., Benoit-Cattin, A., Bittig, H. C., Bopp, L., Bultan, S., Chandra, N., Chevallier, F., Chini, L. P., Evans, W., Florentie, L., Forster, P. M., Gasser, T., Gehlen, M., Gilfillan, D., Gkritzalis, T., Gregor, L., Gruber, N., Harris, I., Hartung, K., Haverd, V., Houghton, R. A., Ilyina, T., Jain, A. K., Joetzjer, E., Kadono, K., Kato, E., Kitidis, V., Korsbakken, J. I., Landschützer, P., Lefèvre, N., Lenton, A., Lienert, S., Liu, Z., Lombardozzi, D., Marland, G., Metzl, N., Munro, D. R., Nabel, J. E. M. S., Nakaoka, S.-I., Niwa, Y., O'Brien, K., Ono, T., Palmer, P. I., Pierrot, D., Poulter, B., Resplandy, L., Robertson, E., Rödenbeck, C., Schwinger, J., Séférian, R., Skjelvan, I., Smith, A. J. P., Sutton, A. J., Tanhua, T., Tans, P. P., Tian, H., Tilbrook, B., van der Werf, G., Vuichard, N., Walker, A. P., Wanninkhof, R., Watson, A. J., Willis, D., Wiltshire, A. J., Yuan, W., Yue, X., and Zaehle, S.: Global Carbon Budget 2020, Earth Syst. Sci. Data, 12, 3269–3340, https://doi.org/10.5194/essd-12-3269-2020, 2020.
Gielen, B., Neirynck, J., Luyssaert, S., and Janssens, I. A.: The importance of dissolved organic carbon fluxes for the carbon balance of a temperate Scots pine forest, Agr. Forest Meteorol., 151, 270–278, https://doi.org/10.1016/j.agrformet.2010.10.012, 2011.
Goll, D. S., Brovkin, V., Parida, B. R., Reick, C. H., Kattge, J., Reich, P. B., van Bodegom, P. M., and Niinemets, Ü.: Nutrient limitation reduces land carbon uptake in simulations with a model of combined carbon, nitrogen and phosphorus cycling, Biogeosciences, 9, 3547–3569, https://doi.org/10.5194/bg-9-3547-2012, 2012.
Goll, D. S., Vuichard, N., Maignan, F., Jornet-Puig, A., Sardans, J., Violette, A., Peng, S., Sun, Y., Kvakic, M., Guimberteau, M., Guenet, B., Zaehle, S., Penuelas, J., Janssens, I., and Ciais, P.: A representation of the phosphorus cycle for ORCHIDEE (revision 4520), Geosci. Model Dev., 10, 3745–3770, https://doi.org/10.5194/gmd-10-3745-2017, 2017.
Gommet, C., Lauerwald, R. Ciais, P., Guenet, B., Zhang, H., and Regnier, P.: Model code of ORCHILEAK, IPSL Data Catalogue, Intitut Pierre-Simon Laplace [code], https://doi.org/10.14768/75AC2F47-4691-46AF-9B12-B1A9629CBC56, 2021.
Grabs, T., Bishop, K., Laudon, H., Lyon, S. W., and Seibert, J.: Riparian zone hydrology and soil water total organic carbon (TOC): implications for spatial variability and upscaling of lateral riparian TOC exports, Biogeosciences, 9, 3901–3916, https://doi.org/10.5194/bg-9-3901-2012, 2012.
Griffith, D. R., Barnes, R. T., and Raymond, P. A.: Inputs of fossil carbon from wastewater treatment plants to US rivers and oceans, Environ. Sci. Technol., 43, 5647–5651, 2009.
Guimberteau, M., Drapeau, G., Ronchail, J., Sultan, B., Polcher, J., Martinez, J.-M., Prigent, C., Guyot, J.-L., Cochonneau, G., Espinoza, J. C., Filizola, N., Fraizy, P., Lavado, W., De Oliveira, E., Pombosa, R., Noriega, L., and Vauchel, P.: Discharge simulation in the sub-basins of the Amazon using ORCHIDEE forced by new datasets, Hydrol. Earth Syst. Sci., 16, 911–935, https://doi.org/10.5194/hess-16-911-2012, 2012.
Guimberteau, M., Zhu, D., Maignan, F., Huang,Y.,Yue, C., Dantec-Nédélec, S., Ottlé, C., Jornet-Puig, A., Bastos, A., Laurent, P., Goll, D., Bowring, S., Chang, J., Guenet, B., Tifafi, M., Peng, S., Krinner, G., Ducharne, A., Wang, F., Wang, T., Wang, X., Wang, Y., Yin, Z., Lauerwald, R., Joetzjer, E., Qiu, C., Kim, H., and Ciais, P.: ORCHIDEE-MICT (v8.4.1), a land surface model for the high latitudes: model description and validation, Geosci. Model Dev., 11, 121–163, https://doi.org/10.5194/gmd-11-121-2018, 2018.
Hartmann, J., Lauerwald, R., and Moosdorf, N.: A brief overview of the GLObal RIver CHemistry Database, GLORICH, Procedia, Earth Planet. Sci., 10, 23–27, 2014.
Hastie, A., Lauerwald, R., Ciais, P., and Regnier, P.: Aquatic carbon fluxes dampen the overall variation of net ecosystem productivity in the Amazon basin: An analysis of the interannual variability in the boundless carbon cycle, Global Change Biol., 25, 2094–2111, https://doi.org/10.1111/gcb.14620, 2019.
Hastie, A., Lauerwald, R., Ciais, P., Papa, F., and Regnier, P.: Historical and future contributions of inland waters to the Congo basin carbon balance, Earth Syst. Dynam., 12, 37–62, https://doi.org/10.5194/esd-12-37-2021, 2021.
Humbert, G., Parr, T. B., Jeanneau, L., Dupas, R., Petitjean, P., Akkal-Corfini, N., Viaud, V., Pierson-Wickmann, A.-C., Denis, M., Inamdar, S., Gruau, G., Durand, P., and Jaffrézic, A.: Agricultural Practices and Hydrologic Conditions Shape the Temporal Pattern of Soil and Stream Water Dissolved Organic Matter, Ecosystems, 23, 1325–1343, https://doi.org/10.1007/s10021-019-00471-w, 2020.
Idir, S., Probst, A., Viville, D., and Probst, J. L.: Contribution of saturated areas and hillslopes to the water and element fluxes exported during a storm event: Tracing with dissolved organic carbon and silica. The Strengbach catchment case study (Vosges, France), C. R. Acad. Sci. Ser. II, 328, 89–96, https://doi.org/10.1016/s1251-8050(99)80003-2, 1999.
Inamdar, S. P. and Mitchell, M. J.: Hydrologic and topographic controls on storm-event exports of dissolved organic carbon (DOC) and nitrate across catchment scales, Water Resour. Res., 42, W03421, https://doi.org/10.1029/2005WR004212, 2006.
James, G., Witten, D., Hastie, T., and Tibshirani, R.: An Introduction to Statistical Learning, 8th Edn., Springer Science + Business Media, New York, ISBN 978-1-4614-7138-7, 2017.
Janssens, I. A., Freibauer, A., Ciais, P., Smith, P., Nabuurs, G. J., Folberth, G., Schlamadinger, B., Hutjes, R. W. A., Ceulemans, R., Schulze, E. D., Valentini, R., and Dolman, A. J.: Europe's terrestrial biosphere absorbs 7 to 12 % ofeuropean anthropogenic CO2 emissions, Science, 300, 1538–1542, 2003.
Kalbitz, K., Schmerwitz, J., Schwesig, D., and Matzner, E.: Biodegradation of soil-derived dissolved organic matter as related to its properties, Geoderma, 113, 273–291, 2003.
Kicklighter, D. W., Hayes, D. J., McClelland, J. W., Peterson, B. J., McGuire, A. D., and Melillo, J. M.: Insights and issues with simulating terrestrial DOC loading of Arctic river networks, Ecol. Appl., 23, 1817–1836, https://doi.org/10.1890/11-1050.1, 2013.
Kindler, R., Siemens, J., Kaiser, K., Walmsley, D. C., Bernhofer, C., Buchmann, N., Cellier, P., Eugster, W., Gleixner, G., Grunwald, T., Heim, A., Ibrom, A., Jones, S. K., Jones, M., Klumpp, K., Kutsch, W., Larsen, K. S., Lehuger, S., Loubet, B., Mckenzie, R., Moors, E., Osborne, B., Pilegaard, K., Rebmann, C., Saunders, M., Schmidt, M. W. I., Schrumpf, M., Seyfferth, J., Skiba, U., Soussana, J.-F., Sutton, M. A., Tefs, C., Vowinckel, B., Zeeman, M. J., and Kaupenjohann, M.: Dissolved carbon leaching from soil is a crucial component of the net ecosystem carbon balance, Global Change Biol., 17, 1167–1185, https://doi.org/10.1111/j.1365-2486.2010.02282.x, 2011.
Köchy, M., Hiederer, R., and Freibauer, A.: Global distribution of soil organic carbon – Part 1: Masses and frequency distributions of SOC stocks for the tropics, permafrost regions, wetlands, and the world, Soil, 1, 351–365, https://doi.org/10.5194/soil-1-351-2015, 2015.
Kothawala, D. N., Moore, T. R., and Hendershot, W. H.: Adsorption of dissolved organic carbon to mineral soils: A comparison of four isotherm approaches, Geoderma, 148, 43–50, https://doi.org/10.1016/j.geoderma.2008.09.004, 2008.
Koven, C. D., Riley, W. J., Subin, Z. M., Tang, J. Y., Torn, M. S., Collins, W. D., Bonan, G. B., Lawrence, D. M., and Swenson, S. C.: The effect of vertically resolved soil biogeochemistry and alternate soil C and N models on C dynamics of CLM4, Biogeosciences, 10, 7109–7131, https://doi.org/10.5194/bg-10-7109-2013, 2013.
Kramer, K., Leinonen, I., Bartelink, H. H., Berbigier, P., Borghetti, M., Bernhofer, C., Cienciala, E., Dolman, A. J., Froer, O., Gracia, C. A., Granier, A., Grünwald, T., Hari, P., Jans, W., Kellomäki, S., Loustau, D., Magnani, F., Markkanen, T., Matteucci, G., Mohren, G. M. J., Moors, E., Nissinen, A., Peltola, H., Sabaté, S., Sanchez, A., Sontag, M., Valentini, R., and Vesala, T.: Evaluation of six process-based forest growth models using eddy-covariance measurements of CO2 and H2O fluxes at six forest sites in Europe, Global Change Biol., 8, 213–230, 2002.
Krinner, G., Viovy, N., de Noblet-Decoudré, N., Ogée, J., Polcher, J., Friedlingstein, P., Ciais, P., Sitch, S., and Prentice, C.: A dynamic global vegetation model for studies of the coupled atmosphere-biosphere system, Global Biogeochem. Cy., 19, 1–33, 2005.
Lauerwald, R., Hartmann, J., Ludwig, W., and Moosdorf, N.: Assessing the nonconservative fluvial fluxes of dissolved organic carbon in North America, J. Geophys. Res., 117, G01027, https://doi.org/10.1029/2011JG001820,, 2012.
Lauerwald, R., Laruelle, G. G., Hartmann, J., Ciais, P., and Regnier, P. A. G.: Spatial patterns in CO2 evasion from the global river network, Global Biogeochem. Cy., 29, 534–554, https://doi.org/10.1002/2014GB004941, 2015.
Lauerwald, R., Regnier, P., Camino-Serrano, M., Guenet, B., Guimberteau, M., Ducharne, A., Polcher, J., and Ciais, P.: ORCHILEAK (revision 3875): a new model branch to simulate carbon transfers along the terrestrial–aquatic continuum of the Amazon basin, Geosci. Model Dev., 10, 3821–3859, https://doi.org/10.5194/gmd-10-3821-2017, 2017.
Lauerwald, R., Regnier, P., Guenet, B., Friedlingstein, P., and Ciais, P.: How simulations of the land carbon sink are biased by ignoring fluvial carbon transfers – A case study for the Amazon basin, One Earth, 3, 226–236, https://doi.org/10.1016/j.oneear.2020.07.009, 2020.
Lehner, B. and Döll, P.. Development and validation of a global database of lakes, reservoirs and wetlands, J. Hydrol., 296, 1–22, https://doi.org/10.1016/j.jhydrol.2004.03.028, 2004.
Lehner, B., Verdin, K., and Jarvis, A.: New global hydrography derived from spaceborne elevation data, EOS Trans. Am. Geophys. Union, 89, 93–104, 2008.
Leifeld, J. and Menichetti, L.: The underappreciated potential of peatlands in global climate change mitigation strategies, Nat. Commun., 9, 1071, https://doi.org/10.1038/s41467-018-03406-6, 2018.
Le Quéré, C., Moriarty, R., Andrew, R. M., Peters, G. P., Ciais, P., Friedlingstein, P., Jones, S. D., Sitch, S., Tans, P., Arneth, A., Boden, T. A., Bopp, L., Bozec, Y., Canadell, J. G., Chini, L. P., Chevallier, F., Cosca, C. E., Harris, I., Hoppema, M., Houghton, R. A., House, J. I., Jain, A. K., Johannessen, T., Kato, E., Keel- ing, R. F., Kitidis, V., Klein Goldewijk, K., Koven, C., Landa, C. S., Landschützer, P., Lenton, A., Lima, I. D., Marland, G., Mathis, J. T., Metzl, N., Nojiri, Y., Olsen, A., Ono, T., Peng, S., Peters,W., Pfeil, B., Poulter, B., Raupach, M. R., Regnier, P., Rö- denbeck, C., Saito, S., Salisbury, J. E., Schuster, U., Schwinger, J., Séférian, R., Segschneider, J., Steinhoff, T., Stocker, B. D., Sutton, A. J., Takahashi, T., Tilbrook, B., van der Werf, G. R., Viovy, N., Wang, Y.-P., Wanninkhof, R., Wiltshire, A., and Zeng, N.: Global carbon budget 2014, Earth Syst. Sci. Data, 7, 47–85, https://doi.org/10.5194/essd-7-47-2015, 2015.
Le Quéré, C., Andrew, R. M., Friedlingstein, P., Sitch, S., Pongratz, J., Manning, A. C., Korsbakken, J. I., Peters, G. P., Canadell, J. G., Jackson, R. B., Boden, T. A., Tans, P. P., Andrews, O. D., Arora, V. K., Bakker, D. C. E., Barbero, L., Becker, M., Betts, R. A., Bopp, L., Chevallier, F., Chini, L. P., Ciais, P., Cosca, C. E., Cross, J., Currie, K., Gasser, T., Harris, I., Hauck, J., Haverd, V., Houghton, R. A., Hunt, C. W., Hurtt, G., Ilyina, T., Jain, A. K., Kato, E., Kautz, M., Keeling, R. F., Klein Goldewijk, K., Körtzinger, A., Landschützer, P., Lefèvre, N., Lenton, A., Lienert, S., Lima, I., Lombardozzi, D., Metzl, N., Millero, F., Monteiro, P. M. S., Munro, D. R., Nabel, J. E. M. S., Nakaoka, S., Nojiri, Y., Padin, X. A., Peregon, A., Pfeil, B., Pierrot, D., Poulter, B., Rehder, G., Reimer, J., Rödenbeck, C., Schwinger, J., Séférian, R., Skjelvan, I., Stocker, B. D., Tian, H., Tilbrook, B., Tubiello, F. N., van der Laan-Luijkx, I. T., van der Werf, G. R., van Heuven, S., Viovy, N., Vuichard, N., Walker, A. P., Watson, A. J., Wiltshire, A. J., Zaehle, S., and Zhu, D.: Global Carbon Budget 2017, Earth Syst. Sci. Data, 10, 405–448, https://doi.org/10.5194/essd-10-405-2018, 2018.
Li, M., Peng, C., Zhou, X., Yang, Y., Guo, Y., Shi, G., and Zhu, Q.: Modeling global riverine DOC flux dynamics from 1951 to 2015, J. Adv. Model. Earth Syst., 11, 514–530, https://doi.org/10.1029/2018MS001363, 2019.
Maavara, T., Lauerwald, R., Regnier, P., and Van Cappellen, P.: Global perturbation of organic carbon cycling by river damming, Nat. Commun., 8, 1–10, https://doi.org/10.1038/ncomms15347, 2017.
MacBean, N., Scott, R. L., Biederman, J. A., Ottlé, C., Vuichard, N., Ducharne, A., Kolb, T., Dore, S., Litvak, M., and Moore, D. J. P.: Testing water fluxes and storage from two hydrology configurations within the ORCHIDEE land surface model across US semi-arid sites, Hydrol. Earth Syst. Sci., 24, 5203–5230, https://doi.org/10.5194/hess-24-5203-2020, 2020.
Mattsson, T., Kortelainen, P., Laubel, A., Evans, D., Pujo-Pay, M., Raeike, A., and Conan, P.: Export of dissolved organic matter in relation to land use along a European climatic gradient, Sci. Total Environ., 407, 1967–1976, 2009.
Meybeck, M.: Composition chimique des ruisseaux non pollués en France, Chemical composition of headwater streams in France, in: Sciences Géologiques, Bulletin, tome 39, no. 1, Erosion, Transport par les cours d'eau, 3–77, https://doi.org/10.3406/sgeol.1986.1719, 1986.
Meybeck, M.: Riverine transport of atmospheric carbon: sources, global typology and budget, Water Air Soil Pollut., 70, 443–463, 1993a.
Meybeck, M.: C, N, P and S in rivers: from sources to global inputs, in: Interactions of C, N, P and S Biogeochemical cycles and global change, NATO ASI Series 14, edited by: Wollast, R., Mackenzie, F. T., and Chou, L., Springer-Verlag, Berlin, 163–191, https://doi.org/10.1007/978-3-642-76064-8_6, 1993b.
Michalzik, B., Kalbitz, K., Park, J. H., and Matzner, E.: Fluxes and concentrations of dissolved organic carbon and nitrogen – a synthesis for temperate forests, Biogeochemistry, 52, 173–205, 2001.
Moore, T. R., de Souza, W., and Koprivnjak, J.-F.: Controls on the sorption of dissolved organic carbon by soils, Soil Sci., 154, 120–129, 1992.
Monteith, D. T., Stoddard, J. L., Evans, C. D., De Wit, H. A., Forsius, M., Høgåsen, T., Wilander, A., Skjelkvåle, B. L., Jeffries, D. S., Vuorenmaa, J., Keller, B., Kopácek, J., and Vesely, J.: Dissolved organic carbon trends resulting from changes in atmospheric deposition chemistry, Nature, 450, 537–540, https://doi.org/10.1038/nature06316, 2007.
Muñoz-SabaterJ., Dutra, E., Agustí-Panareda, A., Albergel, C., Arduini, G., Balsamo, G., Boussetta, S., Choulga, M., Harrigan, S., Hersbach, H., Martens, B., Miralles, D. G., Piles, M., Rodríguez-Fernández, N. J., Zsoter, E., Buontempo, C., and Thépaut, J.-N.: ERA5-Land: A state-of-the-art global reanalysis dataset for land applications, Earth Syst. Sci. Data, 13, 4349–4383, https://doi.org/10.5194/essd-13-4349-2021, 2021.
Naipal, V., Ciais, P., Wang, Y., Lauerwald, R., Guenet, B., and Van Oost, K.: Global soil organic carbon removal by water erosion under climate change and land use change during AD 1850–2005, Biogeosciences, 15, 4459–4480, https://doi.org/10.5194/bg-15-4459-2018, 2018.
Nakhavali, M., Friedlingstein, P., Lauerwald, R., Tang, J., Chadburn, S., Camino-Serrano, M., Guenet, B., Harper, A., Walmsley, D., Peichl, M., and Gielen, B.: Representation of dissolved organic carbon in the JULES land surface model (vn4.4_JULES-DOCM), Geosci. Model Dev., 11, 593–609, https://doi.org/10.5194/gmd-11-593-2018, 2018.
Nakhavali, M., Lauerwald, R., Regnier, P., Guenet, B., Chadburn, S., and Friedlingstein, P.: Leaching of dissolved organic carbon from mineral soils plays a significant role in the terrestrial carbon balance, Global Change Biol., 27, 1083–1096, https://doi.org/10.1111/gcb.15460, 2021.
Nash, J. E. and Sutcliffe, J. V.: River flow forecasting through con-ceptual models, Part I – A discussion of principles, J. Hydrol., 10, 282–290, 1970.
Neff, J. C. and Asner, G. P.: Dissolved organic carbon in terrestrial ecosystems: a synthesis and a model, Ecosystems, 4, 29–48, 2001.
Ota, M., Nagai, H., and Koarashi, J.: Root and dissolved organic carbon controls on subsurface soil carbon dynamics: A model approach, J. Geophys. Res.-Biogeo., 118, 1646–1659, https://doi.org/10.1002/2013JG002379, 2013.
Parton, W. J., Stewart, J. W., and Cole, C. V.: Dynamics of C, N, P and S in grassland soils: a model, Biogeochemistry, 5, 109–131, https://doi.org/10.1007/bf02180320, 1988.
Peel, M. C., Finlayson, B. L., and McMahon, T. A.: Updated world map of the Köppen-Geiger climate classification, Hydrol. Earth Syst. Sci., 11, 1633–1644, https://doi.org/10.5194/hess-11-1633-2007, 2007.
Peng, S., Ciais, P., Maignan, F., Li, W., Chang, J., Wang, T., and Yue, C.: Sensitivity of land use change emission estimates to historical land use and land cover mapping, Global Biogeochem. Cy., 31, 626–643, https://doi.org/10.1002/2015GB005360, 2017.
Polcher, J.: Les processus de surface à l'échelle globale et leurs interactions avec l'atmosphère, Habilitation à diriger des recherches, University Pierre et Marie Curie, Paris, France, https://www.lmd.jussieu.fr/~polcher/hdpres.pdf (last access: 17 February 2022), 2003.
Qiu, C., Zhu, D., Ciais, P., Guenet, B., Peng, S., Krinner, G., Tootchi, A., Ducharne, A., and Hastie, A.: Modelling northern peatland area and carbon dynamics since the Holocene with the ORCHIDEE-PEAT land surface model (SVN r5488), Geosci. Model Dev., 12, 2961–2982, https://doi.org/10.5194/gmd-12-2961-2019, 2019.
Raymond, P. A. and Saiers, J. E.: Event controlled DOC export from forested watersheds, Biogeochemistry, 100, 197–209, 2010.
Raymond, P, A., Zappa, C. J., Butman, D., Bott, T. L., Potter, J., Mulholland, P., Laursen, A. E., McDowell, W. H., and Newbold, D.: Scaling the gas transfer velocity and hydraulic geometry in streams and small rivers, Limnol. Oceanogr., 2, 41–53, https://doi.org/10.1215/21573689-1597669, 2012.
Regnier, P., Friedlingstein, P., Ciais, P., Mackenzie, F. T., Gruber, N., Janssens, I. A., Laruelle, G. G., Lauerwald, R., Luyssaert, S., Andersson, A. J., Arndt, S., Arnosti, C., Borges, A. V., Dale, A. W., Gallego-Sala, A., Goddéris, Y., Goossens, N., Hartmann, J., Heinze, C., Ilyina, T., Joos, F., Larowe, D. E., Leifeld, J., Meysman, F. J. R., Munhoven, G., Raymond, P. A., Spahni, R., Suntharalingam, P., and Thullner, M.: Anthropogenic perturbation of the carbon fluxes from land to ocean, Nat. Geosci., 6, 597–607, https://doi.org/10.1038/ngeo1830, 2013.
Reynolds, C., Jackson, T., and Rawls, W.: Estimating available water content by linking 424 the FAO soil map of the world with global soil profile databases and pedo-transfer 425 functions, Am. Geophys. Union Fall Meet. EOS Trans. Spring Meet. Suppl. 80, S132-426, https://doi.org/10.1029/2000WR900130, 1999.
Ringeval, B., Decharme, B., Piao, S. L., Ciais, P., Papa, F., de Noblet-Ducoudre, N., Prigent, C., Friedlingstein, P., Gouttevin, I., Koven, C. D., and Ducharne, A. Modelling sub-grid wetland in the ORCHIDEE global land surface model: evaluation against river discharges and remotely sensed data, Geosci. Model Dev., 5, 941–962, https://doi.org/10.5194/gmd-5-941-2012, 2012.
Royer, I., Angers, D. A., Chantigny, M. H., Simard, R. R., and Cluis, D.: Dissolved organic carbon in runoff and tile-drain water under corn and forage fertilized with hog manure, J. Environ. Qual., 36, 855–863, https://doi.org/10.2134/jeq2006.0355, 2006.
Saxton, K. E., Rawls, W. J., Romberger, S. J., and Papendick, R. I.: Estimating generalized soil-water characteristics from texture, Soil Sci. Soc. Am. J., 50, 1031–1036, 1986.
Singh, S., Dutta, S., and Inamdar, S.: Land application of poultry manure and its influence on spectrofluorometric characteristics of dissolved organic matter, Agr. Ecosyst. Environ., 193, 25–36, https://doi.org/10.1016/j.agee.2014.04.019, 2014.
Sitch, S., Smith, B., Prentice, I. C., Arneth, A., Bondeau, A., Cramer, W., Kaplan, J. O., Levis, S., Lucht, W., Sykes, M. T., Thonicke, K., and Venevsky, S.: Evaluation of ecosystem dynamics, plant geography and terrestrial carbon cycling in the LPJ dynamic global vegetation model, Global Change Biol., 9, 161–185, https://doi.org/10.1046/j.1365-2486.2003.00569.x, 2003.
Smith, J., Gottschalk, P., Bellarby, J., Chapman, S., Lilly, A., Towers, W., Bell, J., Coleman, K., Nayak, D., Richards, M., Hillier, J., Flynn, H., Wattenbach, M., Aitkenhead, M., Yeluripurti, J., Farmer, J., Milne, R., Thomson, A., Evans, C., and Smith, P.: Estimating changes in national soil carbon stocks using ECOSSE – a new model that includes upland organic soils. Part II. Application in Scotland, Clim. Res., 45, 193–205, https://doi.org/10.3354/cr00902, 2010.
Sun, Y., Goll, D. S., Chang, J., Ciais, P., Guenet, B., Helfenstein, J., Huang, Y., Lauerwald, R., Maignan, F., Naipal, V., Wang, Y., Yang, H., and Zhang, H.: Global evaluation of the nutrient-enabled version of the land surface model ORCHIDEE-CNP v1.2 (r5986), Geosci. Model Dev., 14, 1987–2010, https://doi.org/10.5194/gmd-14-1987-2021, 2021.
Tian, H., Yang, Q., Najjar, R. G., Ren, W., Friedrichs, M. A. M., Hopkinson, C. S., and Pan, S.: Anthropogenic and climatic influences on carbon fluxes from eastern North America to the Atlantic Ocean: A process-based modeling study, J. Geophys. Res.-Biogeo., 120, 752–772, https://doi.org/10.1002/2014JG002760, 2015.
Turgeon, J.: Production and biodegradation of dissolved carbon, nitrogen and phosphorus from Canadian forest floors, McGill University, https://escholarship.mcgill.ca/downloads/w0892g17c (last acces: 17 February 2022), 2008.
Turner, D. P., Ritts, W. D., Cohen, W. B., Gower, S. T., Running, S. W., Zhao, M., Costa, M. H., Kirschbaum, A. A., Ham, J. M., Saleska, S. R., and Ahl, D. E.: Evaluation of MODIS NPP and GPP products across multiple biomes, Remote Sens. Environ., 102, 282–292, https://doi.org/10.1016/j.rse.2006.02.017, 2006.
Vörösmarty, C. J., Fekete, B. M., Meybeck, M., and Lammers, R. B.: Geomorphometric attributes of the global system of rivers at 30-minute spatial resolution, J. Hydrol., 237, 17–39, 2000.
Vuichard, N., Messina, P., Luyssaert, S., Guenet, B., Zaehle, S., Ghattas, J., Bastrikov, V., and Peylin, P.: Accounting for carbon and nitrogen interactions in the global terrestrial ecosystem model ORCHIDEE (trunk version, rev 4999): multi-scale evaluation of gross primary production, Geosci. Model Dev., 12, 4751–4779, https://doi.org/10.5194/gmd-12-4751-2019, 2019.
Wang, T., Ottle, C., Boone, A., Ciais, P., Brun, E., Morin, S., Krinner, G., Piao, S., and Peng, S.: Evaluation of an improved intermediate complexity snow scheme in the ORCHIDEE land surface model, J. Geophys. Res.-Atmos., 118, 6064–6079, 2013.
Weedon, G. P., Balsamo, G., Bellouin, N., Gomes, S., Best, M. J., and Viterbo, P.: The WFDEI meteorological forcing data set: WATCH Forcing Data methodology applied to ERA-Interim reanalysis data, Water Resour. Res., 50, 7505–7514, https://doi.org/10.1002/2014WR015638, 2014.
Worrall, F. and Burt, T. P.: Flux of dissolved organic carbon from U.K. rivers, Global Biogeochem. Cy., 21, GB1013, https://doi.org/10.1029/2006GB002709, 2007.
Worrall, F., Davies, H., Bhogal, A., Lilly, A., Evans, M. G., Turner, K., Burt, T. P., Barraclough, D., Smith, P., and Merrington, G.: The flux of DOC from the UK – predicting the role of soils, land use and in-stream losses, J. Hydrol., 448–449, 149–160, 2012.
Wu, H., Peng, C., Moore, T. R., Hua, D., Li, C., Zhu, Q., Peichl, M., Arain, M. A., and Guo, Z.: Modeling dissolved organic carbon in temperate forest soils: TRIPLEX-DOC model development and validation, Geosci. Model Dev., 7, 867–881, https://doi.org/10.5194/gmd-7-867-2014, 2014.
Yang, H., Piao, S., Zeng, Z., Ciais, P., Yin, Y., Friedlingstein, P., Sitch, S., Ahlström, A., Guimberteau, M., Huntingford, C., Levis, S., Levy, P. E., Huang, M., Li, Y., Li, X., Lomas, M. R., Peylin, P., Poulter, B., Viovy, N., Zaehle, S., Zeng, N., Zhao, F., and Wang, L. Multicriteria evaluation of discharge simulation in Dynamic Global Vegetation Models, J. Geophys. Res.-Atmos., 120, 7488–7505, https://doi.org/10.1002/2015JD023129, 2015.
Yao, Y., Ciais, P., Viovy, N., Li, W., Cresto-Aleina, F., Yang, H., Joetzjer, E., and Bond‐Lamberty, B.: A data-driven global soil heterotrophic respiration dataset and the drivers of its inter-annual variability, Global Biogeochem. Cy., 35, 2020 GB006918, https://doi.org/10.1029/2020GB006918, 2021.
Zhang, B., Tian, H., Lu, C., Dangal, S. R. S., Yang, J., and Pan, S.: Global manure nitrogen production and application in cropland during 1860–2014: a 5 arcmin gridded global dataset for Earth system modeling, Earth Syst. Sci. Data, 9, 667–678, https://doi.org/10.5194/essd-9-667-2017, 2017.
Zhang, H., Goll, D. S., Manzoni, S., Ciais, P., Guenet, B., and Huang, Y.: Modeling the effects of litter stoichiometry and soil mineral N availability on soil organic matter formation using CENTURY-CUE (v1.0), Geosci. Model Dev., 11, 4779–4796, https://doi.org/10.5194/gmd-11-4779-2018, 2018.
Zhang, H., Lauerwald, R., Regnier, P., Ciais, P., Yuan, W., Naipal, V., Guenet, B., Van Oost, K., and Camino-Serrano, M.: Simulating erosion-induced soil and carbon delivery from uplands to rivers in a global land surface model, J. Adv. Model. Earth Syst., 12, e2020MS002121, https://doi.org/10.1029/2020MS002121, 2020.
Zhao, M., Heinsch, F. A., Nemani, R. R., and Running, S. W.: Improvements of the MODIS terrestrial gross and net primary production global data set, Remote Sens. Environ., 95, 164–176, https://doi.org/10.1016/j.rse.2004.12.011, 2005.