the Creative Commons Attribution 4.0 License.
the Creative Commons Attribution 4.0 License.
 | 14 Feb 2022
Impact of urbanization on the thermal environment of the Chengdu–Chongqing urban agglomeration under complex terrain
Si Chen
Jinbo Xie
Bin Liu
Binghao Jia
Peihua Qin
Longhuan Wang
Ruichao Li
Located in the mountainous area of southwest China, the Chengdu–Chongqing urban agglomeration (CCUA) has been rapidly urbanized in the last 4 decades, which has led to a 3-fold urban area expansion, thereby affecting the weather and climate. To investigate the urbanization effects on the thermal environment in the CCUA under complex terrain, we conducted simulations using the advanced Weather Research and Forecasting (WRF V4.1.5) model together with combined land use scenarios and terrain conditions. We observed that the WRF model reproduces the general synoptic summer weather pattern, particularly for the thermal environment. It was shown that the expansion of the urban area changed the underlying surface's thermal properties, leading to the urban heat island effect, enhanced further by the complex terrain. The simulation with the future scenario shows that the implementation of idealized measures including returning farmland to forests and expanding rivers and lakes can reduce the urban heat island effect and regulate the urban ecosystem. Therefore, urban planning policy has the potential to provide feasible suggestions to best manage the thermal environment of the future city toward improving the livelihood of the people in the environment.
- Article
(21267 KB) - Full-text XML
- BibTeX
- EndNote


With urban area expansion, the lower surface of the Chengdu–Chongqing urban agglomeration (CCUA) has changed compared with the natural land surface, leading to the heat island effect, which is also an important factor in global warming (Kalnay and Cai, 2003; Kawashima, 1975; Ning et al., 2019). As one of the most dramatic land use changes, urbanization alters land surface physical properties, including albedo, emissivity, heat conductivity and morphology, making urban areas exhibit greater heat capacity, Bowen ratio and roughness (Robaa, 2011). The impermeability of urban land surface reduces water vapor evaporation and increases sensible surface heat. The multiple reflection and absorption of radiation in the urban canopy make the energy absorbed by a city in the daytime more difficult to dissipate in the form of long-wave radiation at night. These changes in land surface characteristics significantly affect the surface energy budget, planetary boundary layer height (PBLH), thermal structure, and local/regional atmospheric circulation (Kawashima, 1975; Oke, 1995; Berling-Wolff et al., 2004; Hamdi et al., 2010). Therefore, it is imperative to assess the changes in urbanization and develop adaptation strategies.
Numerical simulation has been used to investigate the urban heat island effects on cities, such as Tokyo, Phoenix Metropolitan, Beijing and Hangzhou (Berling-Wolff et al., 2004; Chen et al., 2014; Saitoh et al., 1996; Wang et al., 2020). Urbanization also changes a city's precipitation by enhancing the spatial heterogeneity of the rainfall or making it extreme (Yang et al., 2019). Urbanization of cities in the arid and semi-arid areas can cause pronounced urban drying (Robaa, 2011). For cities under complex terrain conditions, their weather and climate are often exacerbated by the interaction of complex terrain with urbanization (Ning et al., 2018; Yang et al., 2019). On the other hand, cities will face severe water and heat stress (Zhao et al., 2021). Therefore, the demand for a suitable plan to alleviate stress is exigent.
In this study, we investigated the interaction of complex terrain and urbanization on the thermal environment of the urban agglomeration for CCUA, located in the mountainous area of southwest China. We further researched the effects of land use planning policies on the heat stress of the urban area. This research (1) clarifies the urban warming pattern caused by the urban expansion of the CCUA in the past, (2) measures the combined impact of complex terrain and urbanization on the summer urban thermal environment, and (3) reveals the potential of implementing the measures of returning farmland to forest and grassland and expanding the area of rivers and lakes to alleviate heat stress in the CCUA.
2.1 Weather Research and Forecasting (WRF) configuration and study area
We used a numerical model WRF-ARW v4.1.5 (Skamarock and Klemp, 2008), coupled with a single-layer urban canopy model (SLUCM) and the Noah land surface model (Noah LSM, Niu et al., 2011; Yang et al., 2011), to study the impact of urbanization on the regional thermal environment. We chose CCUA as the study area, set up three one-way nested domains in the horizontal direction (Fig. 1a), with resolutions of 1, 5 and 25 km, respectively, and divided the atmosphere into 32 vertical layers. July, the hottest month in 2018, was selected as the simulation period, and the first 48 h of the simulation results was discarded as the spin-up time of the model. The forced initial field data simulated in the model were the re-analyzed data of operational global analysis and forecast data, which are on 0.25×0.25∘ grids, prepared operationally every 6 h, from the National Centers for Environmental Prediction (National Centers for Environmental Prediction/National Weather Service/NOAA/U.S. Department of Commerce, 2015). The main physical schemes for the model selection are the following: the Thompson Scheme is used as the microphysics scheme (Thompson et al., 2008), the RRTM scheme (Mlawer et al., 1997) as the long-wave radiation scheme, the Dudhia scheme (Dudhia, 1989) as the shortwave radiation scheme, the Revised MM5 surface layer scheme (Monin and Obukhov, 1954) as the near-ground layer and boundary layer schemes, the Noah Land Surface Model as the land surface scheme, and the BouLac PBL (Hong et al., 2006) as the planetary boundary layer. As for how to select the parameterization schemes above the WRF model, we refer to the previous research on the cooling efficiency of the adaptation strategy in the Chengdu Chongqing metropolitan region. The scheme adopted in the study of Liu et al. (2018) verified the good adaptability of SLUCM and other physical parameterization schemes.
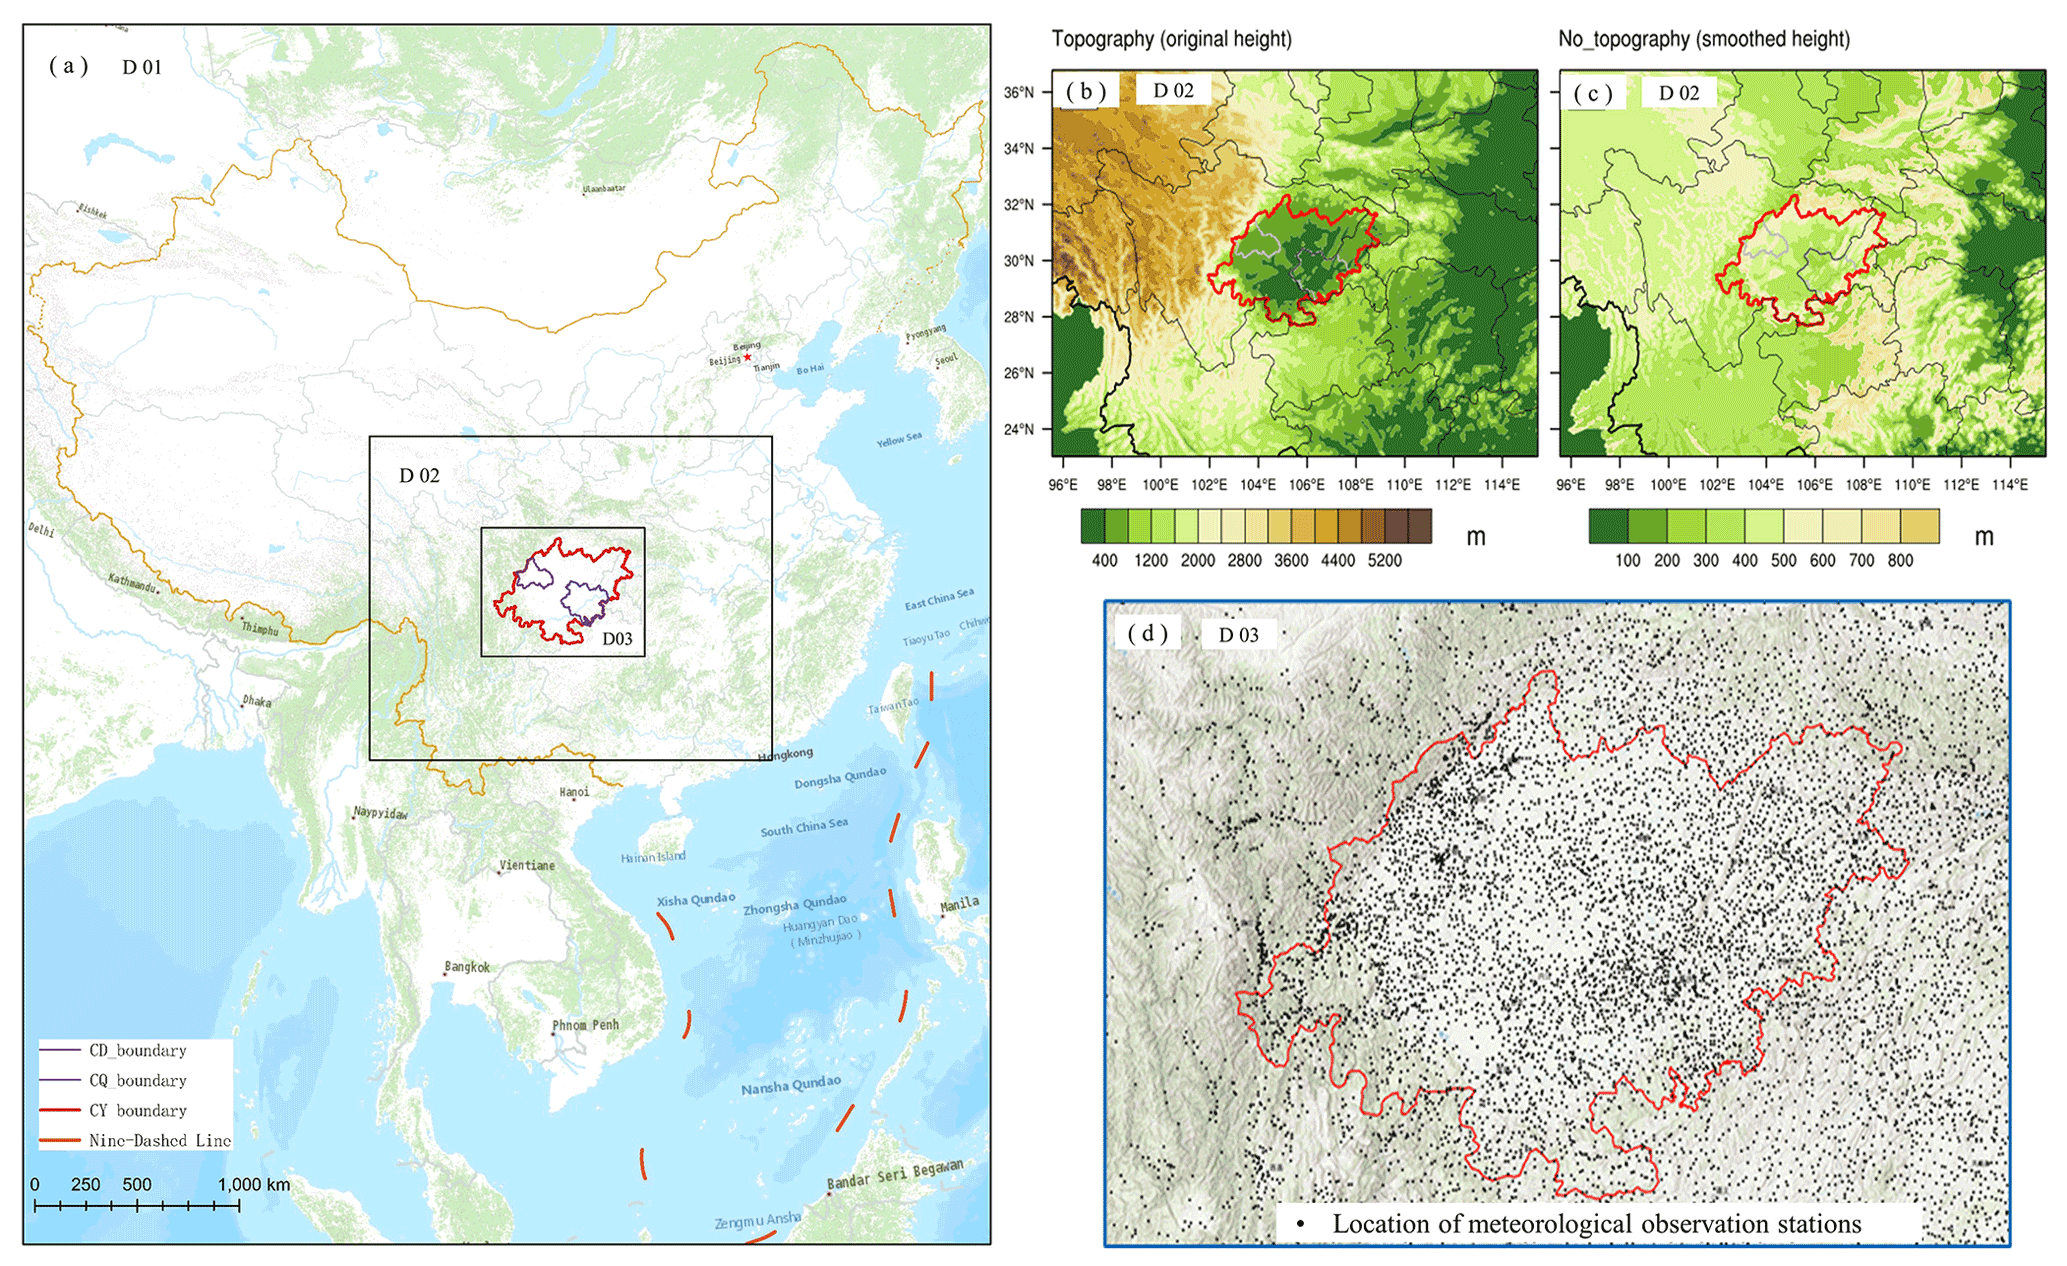
Figure 1(a) Configuration of the three nested domains for WRF simulation. (b) The original terrain in the simulated area (m) and (c) after smoothing the terrain. (d) Location of meteorological observation stations. (The basic elevation and topographic shadow maps of Fig. 1a and d are derived from the ArcGIS Online of ESRI.)
The urban environmental conditions of CCUA are similar, depending on the same comprehensive transportation network, with two megacities (Chengdu (CD) and Chongqing (CQ)) as the core city and the other 14 smaller cities distributed between them, thus forming a large urban agglomeration (Wang et al., 2015). The CCUA is located in the Sichuan Basin in the central southern Asian continent (between latitudes 28′′10′ and 32.25′), surrounded by the Qinghai–Tibet Plateau, Daba Mountains, Huaying Mountain and Yungui Plateau (Wang et al., 2015). The surrounding mountains are primarily between 1000 and 3000 m above sea level. Compared with plateaus and plains, the topography is very complicated. The Sichuan Basin is relatively humid, situated in the mid-subtropical zone, and it also has marine climate characteristics (Richardson et al., 2008). In winter, the temperature in this area is the highest at that latitude. This is due to the occlusion of the terrain, and the rich cold air is blocked by the surrounding plateaus and mountains (Yuan and Xie, 2012). The annual precipitation in the Sichuan Basin is 1000 to 1300 mm (Shao et al., 2005). The mountain areas on the western edge of the basin have higher annual precipitations (1500–1800 mm) and are a prominent rainy area in China (Yuan et al., 2012).
2.2 Land use change and land cover datasets
The underlying surface influences factors such as soil thermal conductivity, vegetation impedance, reflectivity, roughness and thermal inertia. The thermal inertia, in turn, affects the boundary layer structure and the land surface process. Therefore, more refined underlying surface information will improve the model simulation effect significantly.
WRF has two default land use dataset types: the Advanced Very High-Resolution Radiometers from the US Geological Survey (USGS) and the Moderate-Resolution Imaging Spectroradiometer (MODIS). The acquisition time of USGS data was from April 1992 to March 1993, while MODIS's latest land cover data were from 2010. The default data accuracy is low, and the timeliness is not enough, restricting the simulation accuracy of the model. Therefore, we replaced the WRF default data with the more accurate land use data. We get the 30 m spatial resolution fusion land cover data for the two periods (viz. 1980, the “historical scenario” in Fig. 2a, and 2018, the “urban scenario” in Fig. 2b) from the Institute of Geographic Sciences and Natural Resources of the CAS (Resource and Environment Science and Data Center https://www.resdc.cn/data.aspx?DATAID=264/, last access: 20 April 2020). They were developed and verified in detail from medium-resolution satellite images. We reclassified the land use and land cover data (LUCs) into 24 categories according to the International Geosphere-Biosphere Project classification scheme of the USGS to meet the classification standard in the WRF model. The impervious surfaces of towns, industrial and mining lands, and roads were integrated as urban land use types. The methods and criteria for reclassification are shown in Table 1.
Table 1Rules for converting the classification standard of LUCs from IGSNRR to USGS.
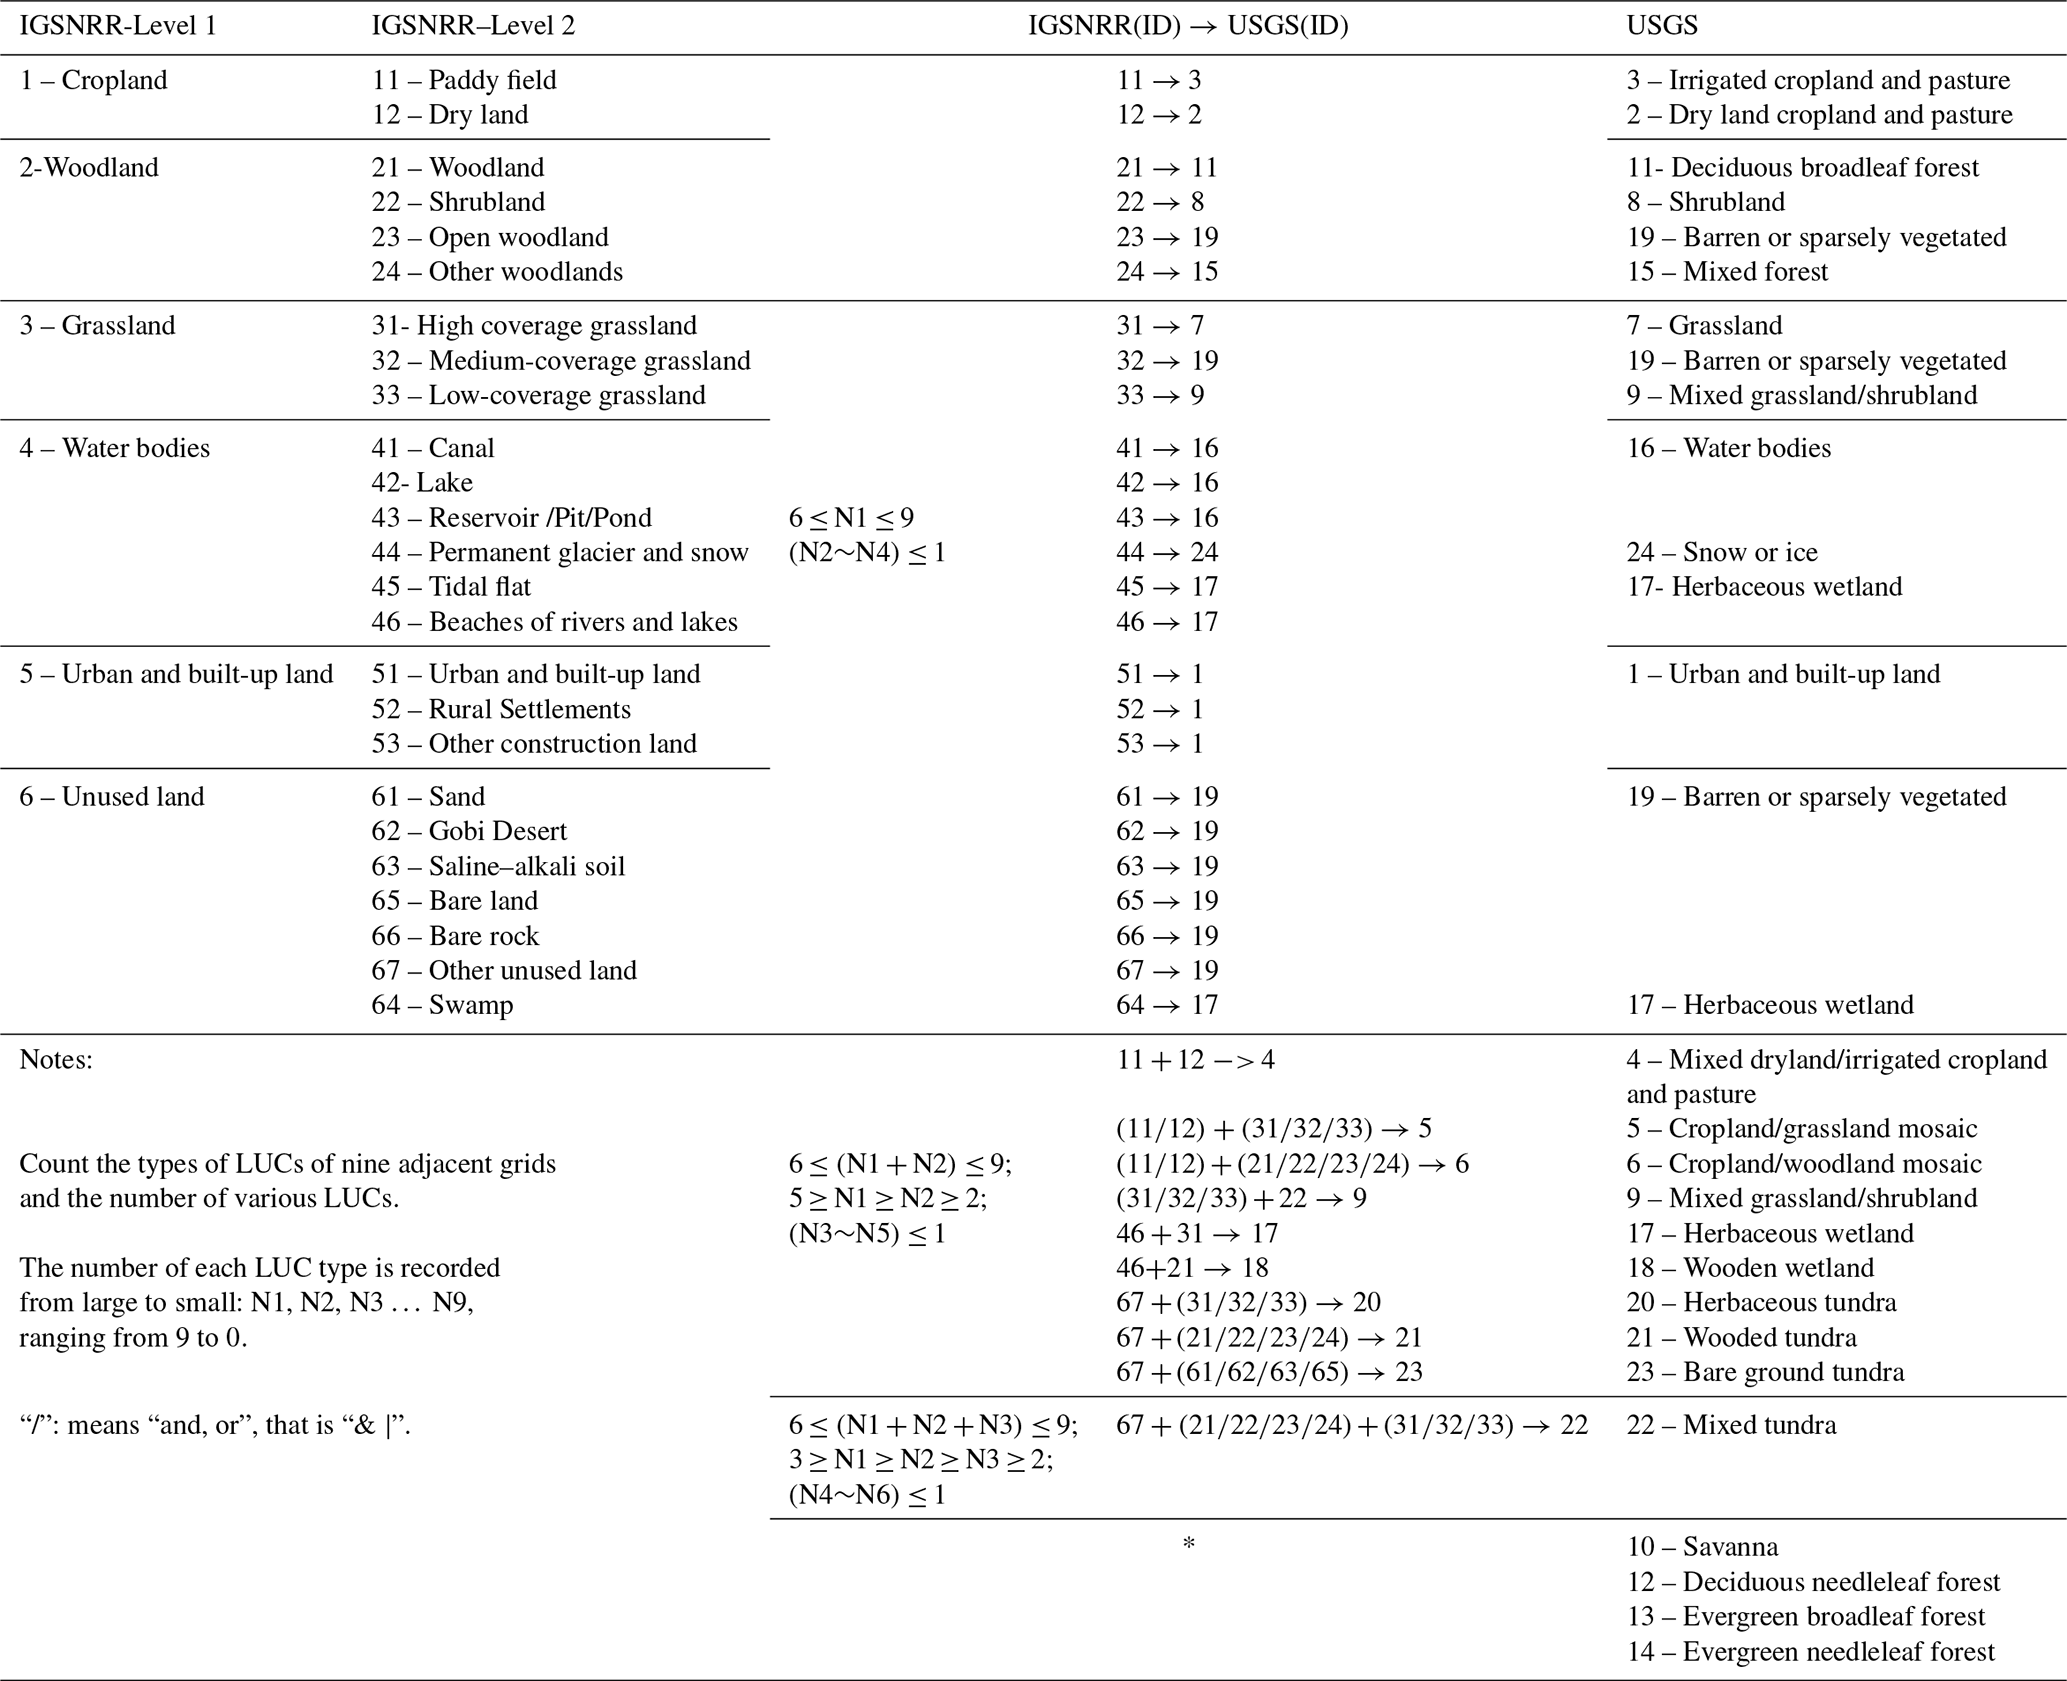
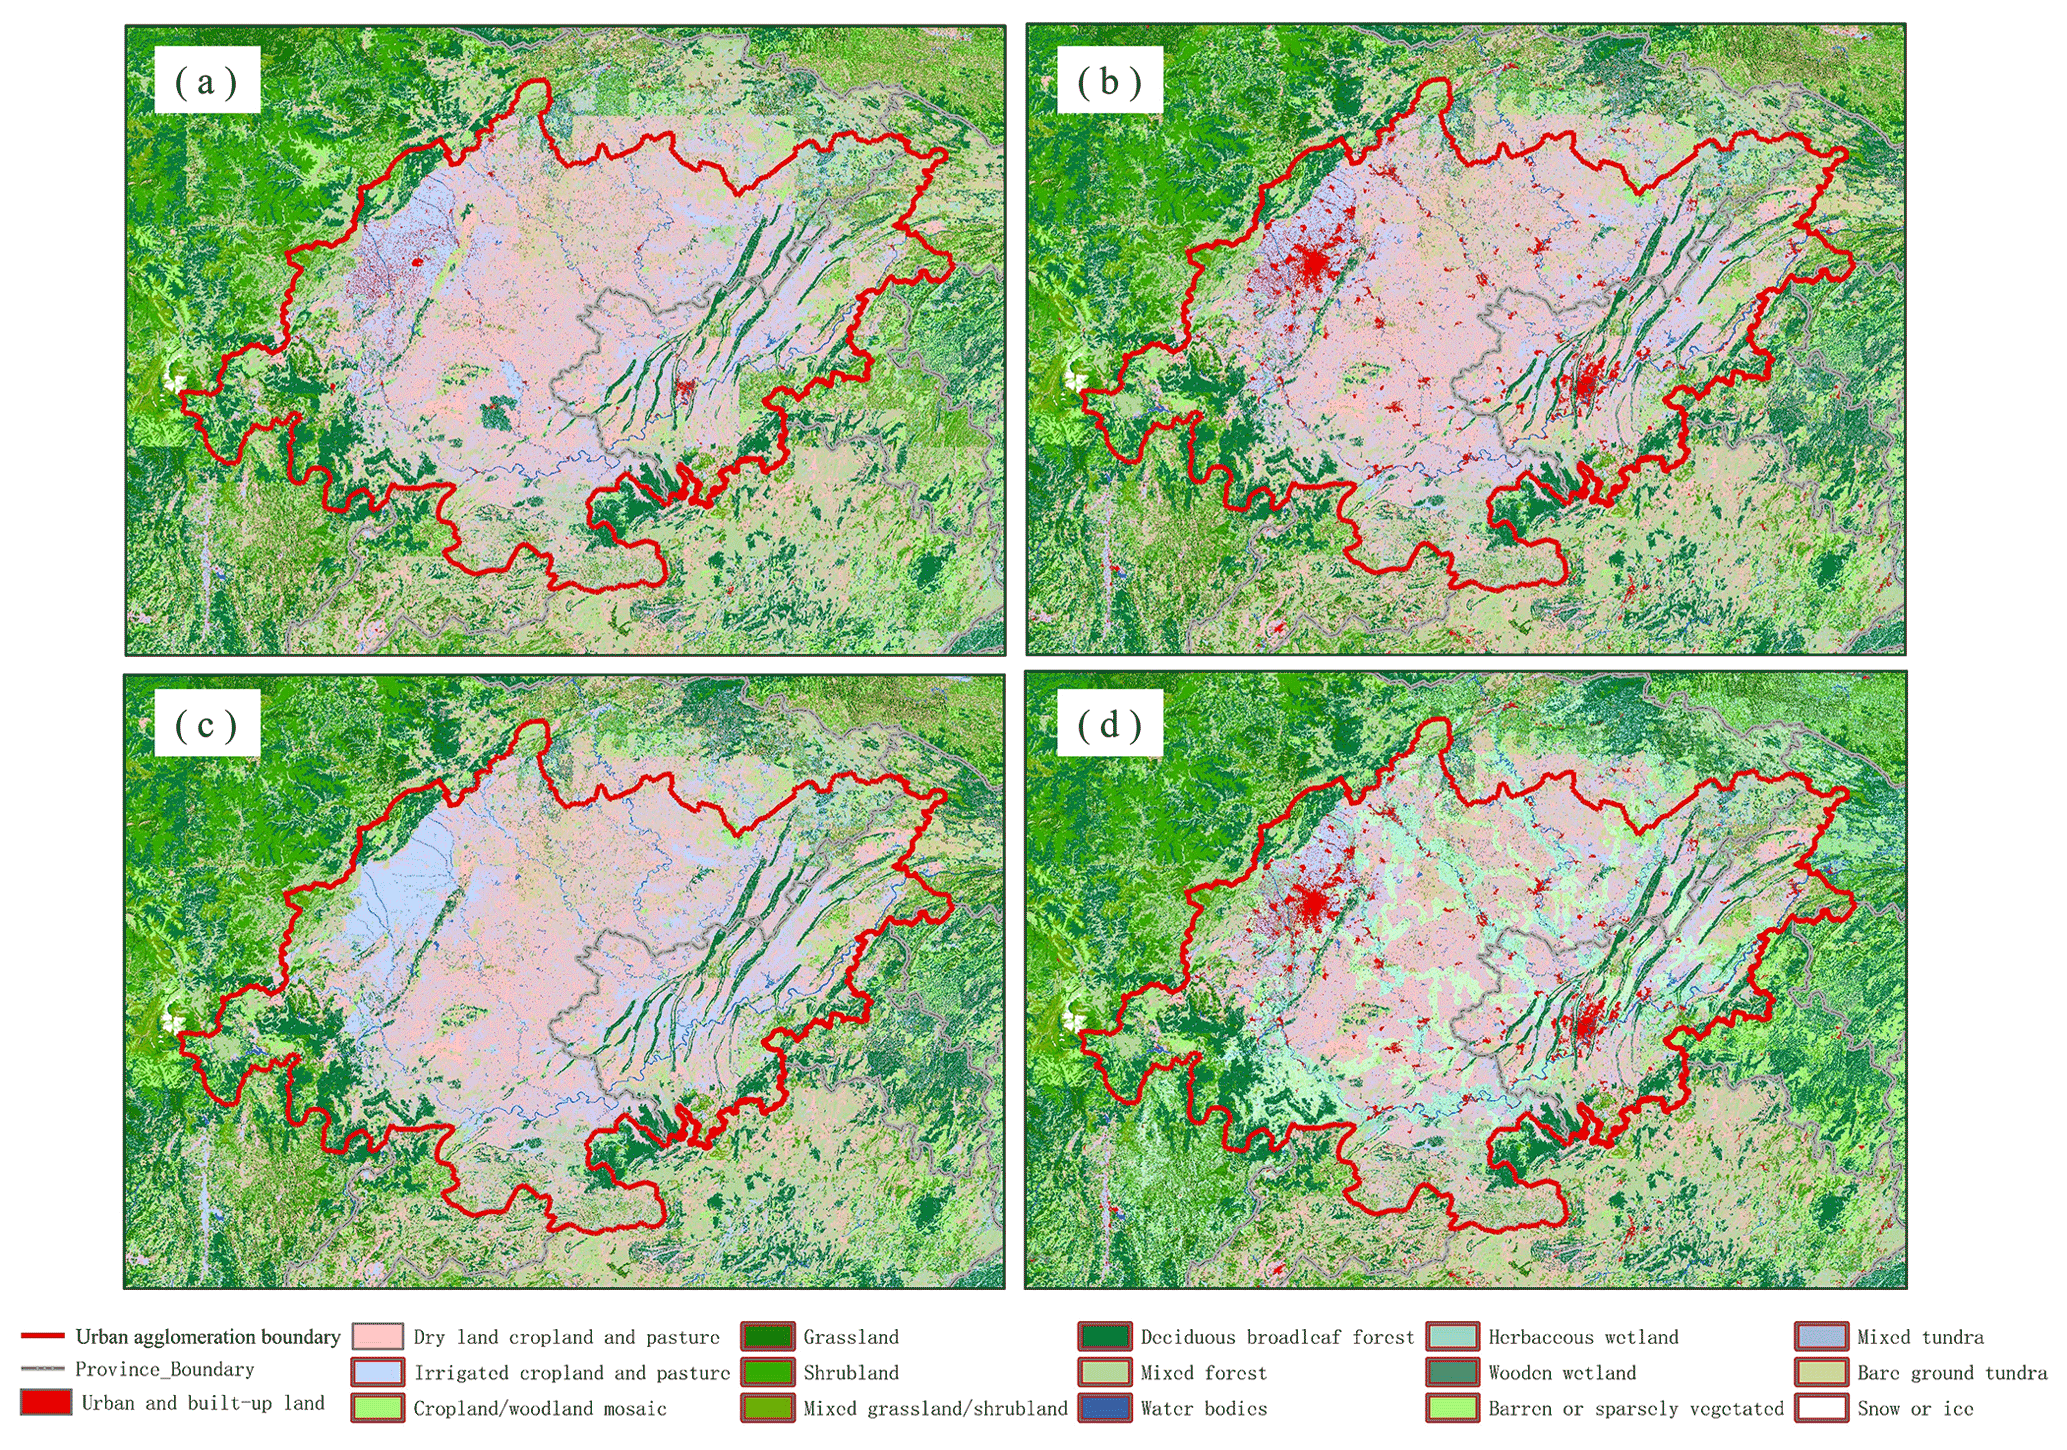
Figure 2Land use/land cover in CCUA: (a) 1980; (b) 2018; (c) non-urban based on 2018 data; (d) planned future land use based on 2018 data.
After statistically calculating the land cover, it is found that from 1980 to 2018, the growth of urban land use types in the CCUA increased to nearly 9000 km2, which shrank the area of dry land, paddy field and water wetland. According to the more accurate land use data from 1980 and 2018, the urban land use type is larger and can better reflect the actual situation of the underlying surface of the CCUA.
To explore the impact of urbanization on the thermal environment of the CCUA based on the 2018 land use and land cover dataset, we replaced the urban land type with the nearest natural land use type of the area. Here, we term the land dataset without city type the “non-urban scenario (Fig. 2c)”.
In addition to the three land use scenario data, we also planned and designed a “future scenario” land use of the urban agglomeration landscape to explore the mitigation effect of landscape planning on the thermal environment stress of urban agglomeration. Urban agglomerations are brand-new regional units that have emerged from industrialization and urbanization to a higher stage (Bruinsma and Rietveld, 1993; Kawashima, 1975). The CCUA is the most dynamic region with a high potential for economic development in southwest China (Wang et al., 2015). However, the urban agglomeration is an extremely sensitive area where a series of ecological and environmental problems are highly concentrated and intensified (Bruinsma and Rietveld, 1993). For such ecological environment pressure, we can design and plan ecological corridors and ecological barriers in landscape ecology according to the natural geography, vegetation ecology, water system and topography of the urban agglomeration. It is expected that these ecological corridors and barriers can alleviate the urban heat stress caused by urbanization, meeting the growing cultural demands of people. Based on the land use dataset of the urban scenario (Fig. 2b), we designed the ideal land use and land cover scenario in the future: the future scenario (Fig. 2d). The specific method is to return farmland to forest and grassland in the five ecological protection areas around the urban agglomeration. Eight land ecological corridors and seven water system corridors were designed according to the hills, mountains and water systems in the urban agglomeration. In the corridor, the farmland should be returned to grassland to expand the river lake wetland. We plan the land use of the future urban agglomeration according to the government's planning documents (see Sect. 2.3 for details).
All the four land use datasets with a 30 m resolution were resampled for 1 km as the underlying surface data of the model in the simulated area.
2.3 Planning and designing the future scenario of CCUA
In this subsection, we will present how to plan and design the future scenario of CCUA in Fig. 2d mentioned above. We first divided the scope of ecological protection areas and ecological protection barriers in future land use planning (Fig. 3). The designing and planning of the future scenario is based on two planning documents issued by the government: the “Chengdu Chongqing Urban Agglomeration Development Plan, 2014–2020”, which was issued by the Development and Reform Commission of The People's Republic of China (PRC), Ministry of Housing and Urban-Rural Development of the PRC (https://www.ndrc.gov.cn/fzggw/jgsj/ghs/sjdt/201605/W020191010642895842500.pdf, National Development and Reform Commission of PRC, Ministry of Housing and Urban-Rural Development of PRC, 2016), and the “Guidelines for Ecological Protection and Restoration Project of Mountains, Rivers, Forests, Fields, Lakes and Grasse, 2020 (trial version)”, which was issued by three other government departments, i.e., the Ministry of Natural Resources of the PRC, the Ministry of Ecological Environment of the PRC, and the Ministry of Finance of the PRC (2020, https://www.cgs.gov.cn/tzgg/tzgg/202009/W020200921635208145062.pdf, last access: 17 December 2020). These two planning documents point out a series of ecological and environmental protection measures such as returning farmland to forests and grassland and expanding lake water system wetlands.
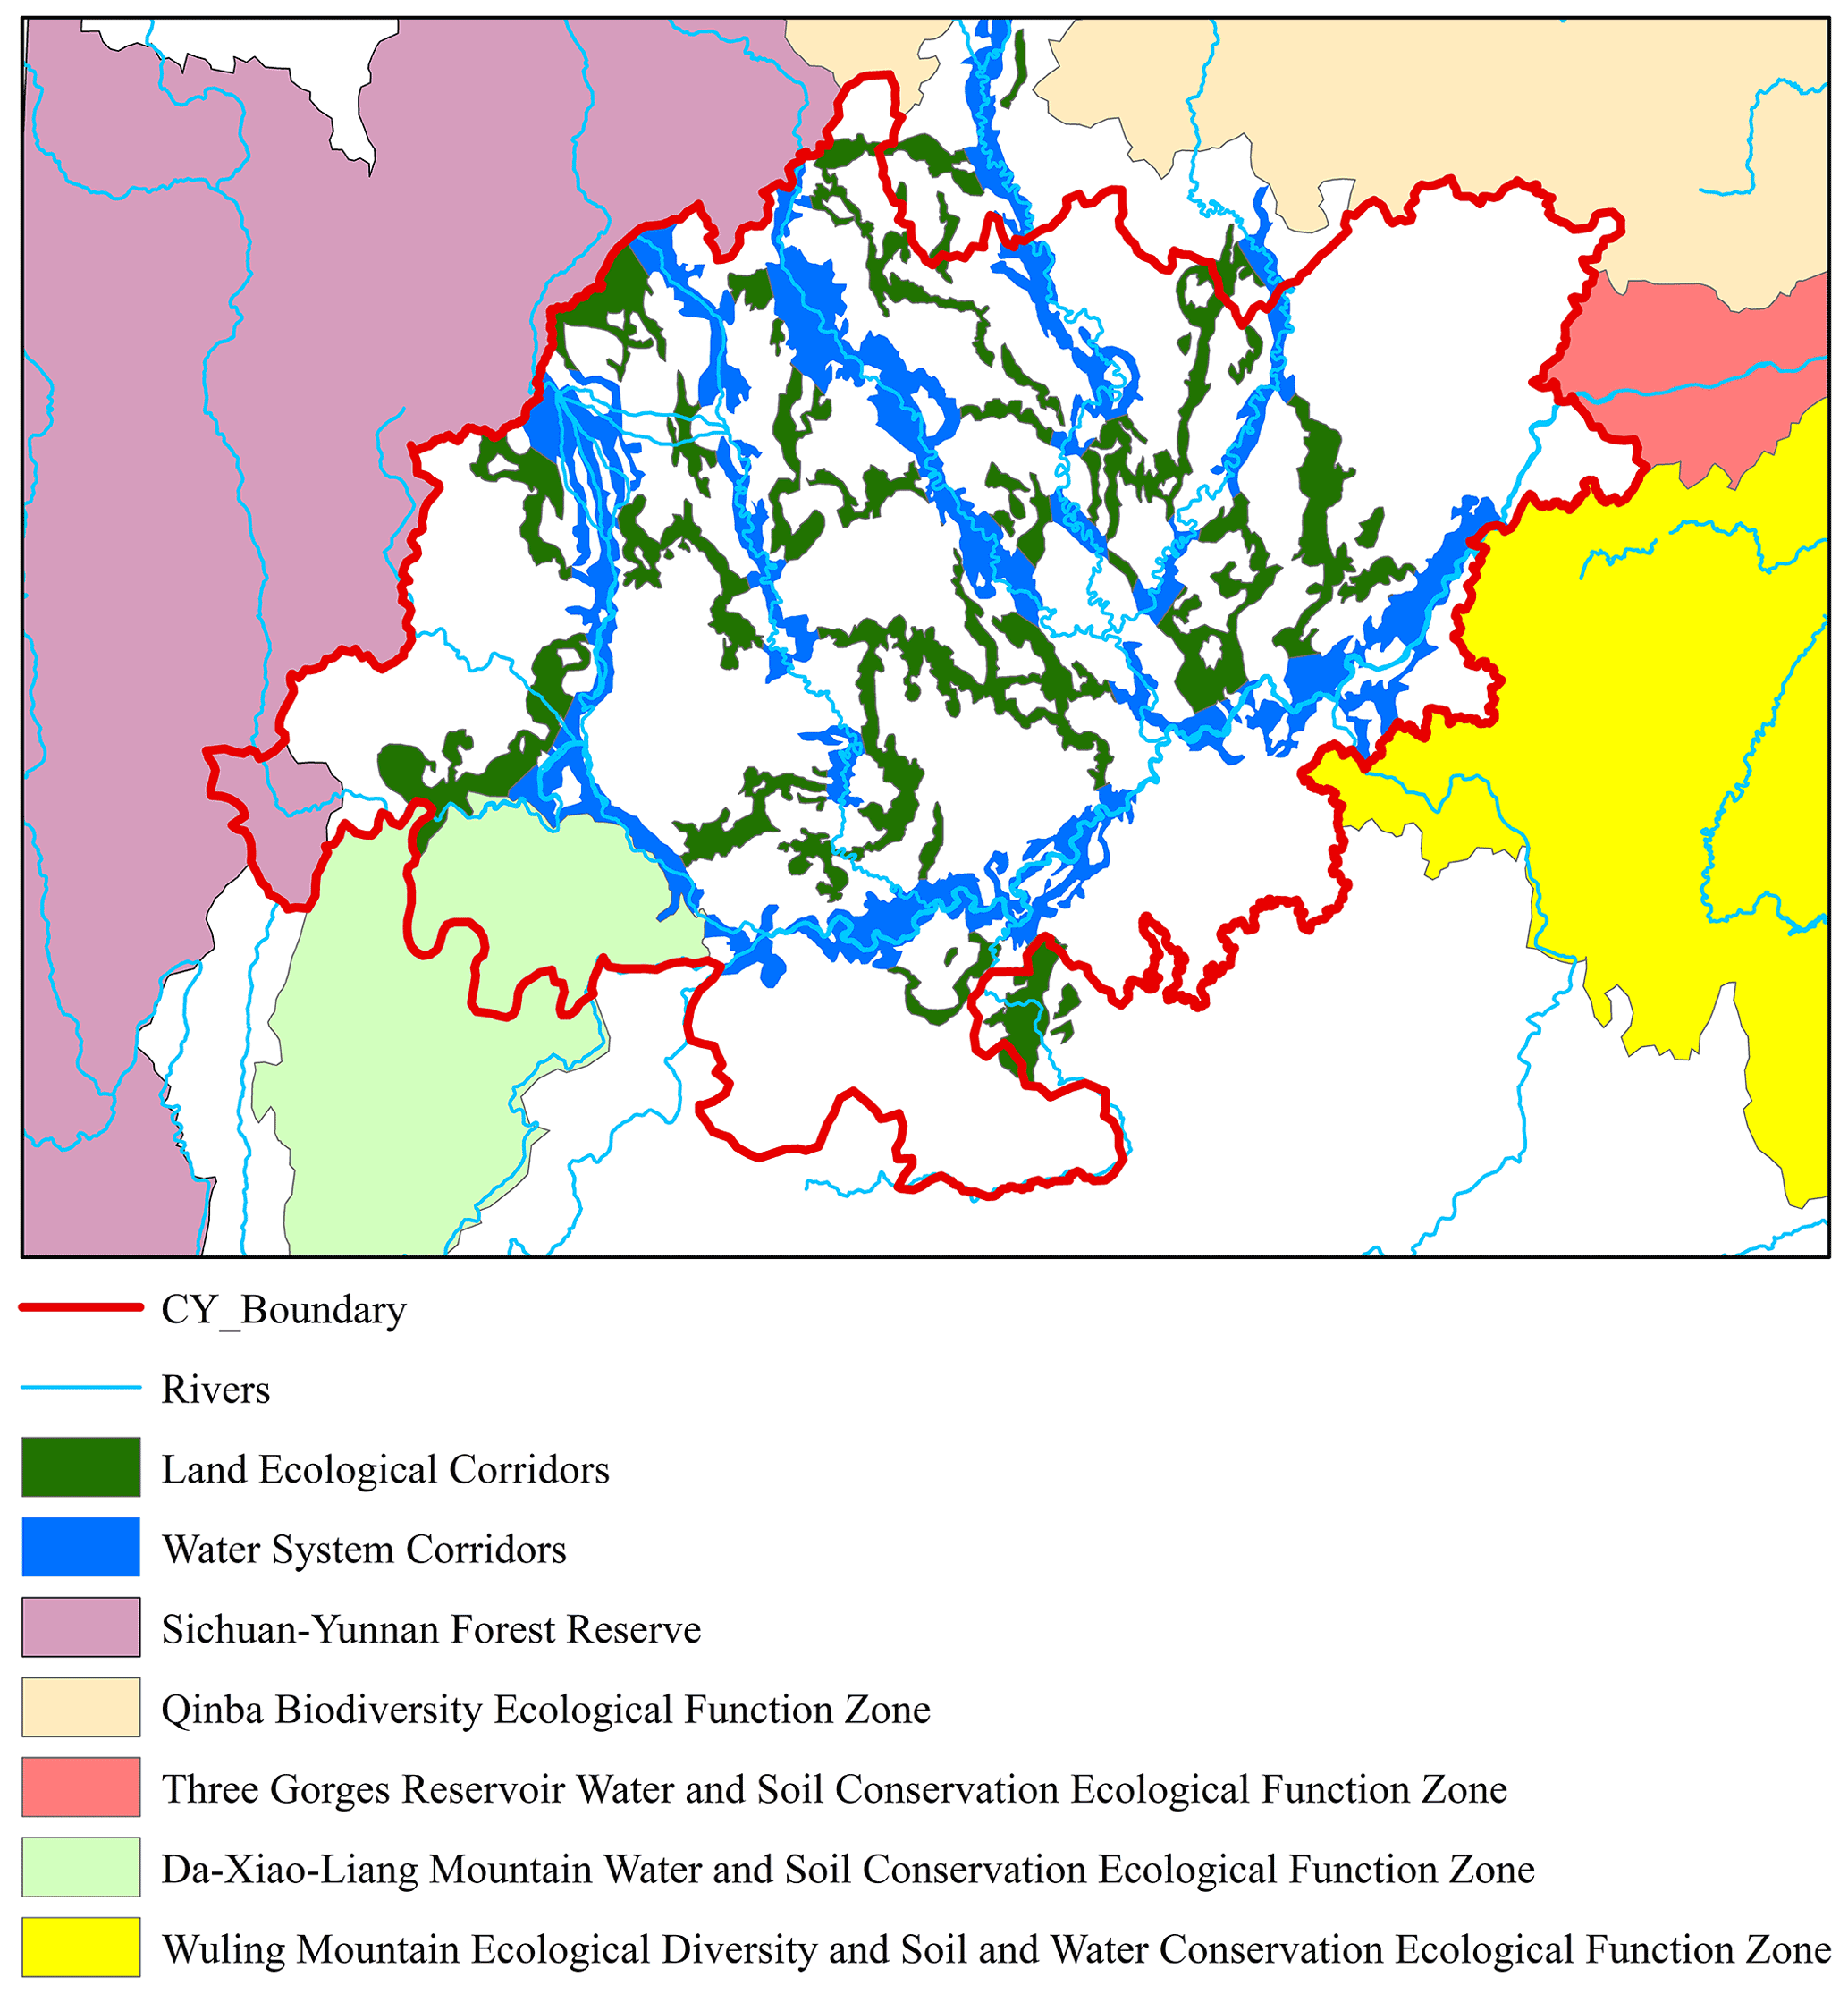
Figure 3Scope of future land use scenarios planned through government policy documents.
According to the “Chengdu Chongqing Urban Agglomeration Development Plan, 2014–2020”, we define the location of the ecological protection areas of the urban agglomeration according to the guidance of the government, including five nature reserves (the Sichuan–Yunnan Forest Reserve, the Qinba Biodiversity Ecological Function Zone, the Da–Xiao–Liang Mountain Water and Soil Conservation Ecological Function Zone, the Wuling Mountain Ecological Diversity and Soil and Water Conservation Ecological Function Zone, and the Three Gorges Reservoir Water and Soil Conservation Ecological Function Zone) around the urban agglomeration and the land ecological corridor and water ecological corridor within the urban agglomeration. According to the document “Guidelines for Ecological Protection and Restoration of Mountains, Rivers, Forests, Fields, Lakes and Grasses, 2020 (trial version)”, we replace 75 % of farmland in five nature reserves with mixed grassland/shrubland. In the land ecological corridor, we replace 60 % of the farmland with a cropland/woodland mosaic, and in the water ecological corridor, we replace the farmland within 1 km along the river with wetland.
Table 2WRF experimental design; exp.: experiment.
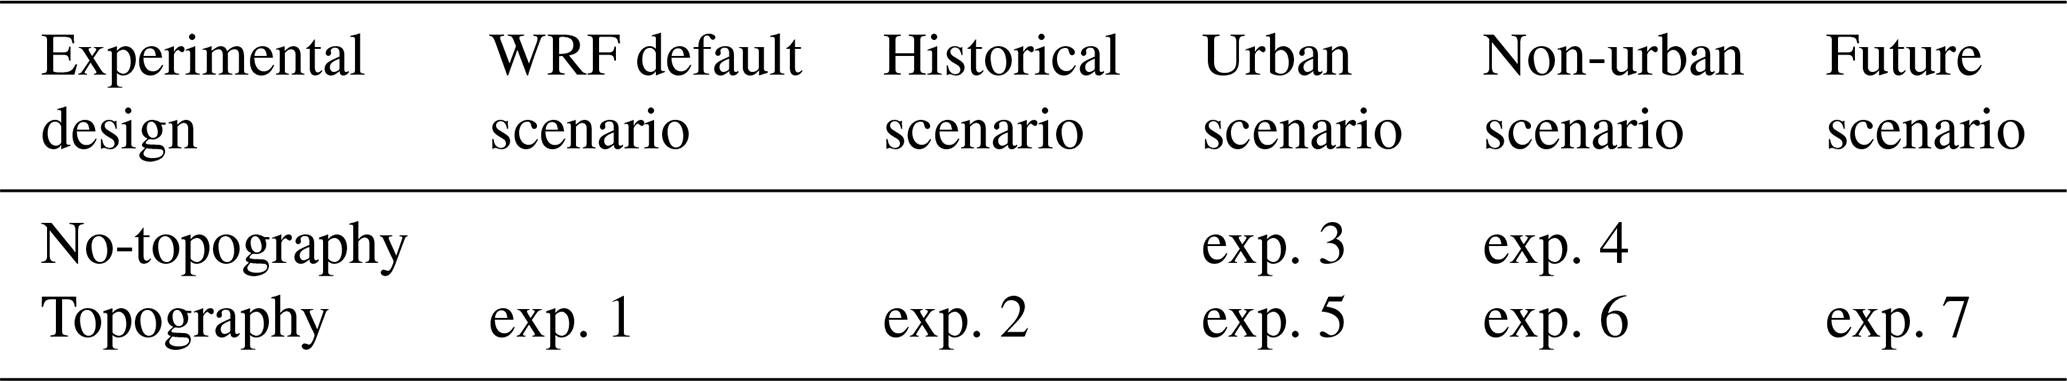
Urban effect: exp. 3 − exp. 4. Topography effect: exp. 6 − exp. 4. Urban and topography interaction: exp. 5 − (exp. 3 + exp. 6) + exp. 4. Historical changes: exp. 5 − exp. 2. Mitigation of future planning: exp. 7 − exp. 5.
By comparing the future scenario's land use and the urban scenario's land use, we expect that the planned landscapes will improve the thermal environment of urban agglomerations in the summer, enhancing the living comfort in the urban agglomerations.
2.4 Experimental design
To study the impact of urbanization on the surrounding environmental and meteorological elements under complex terrain, seven experiments were designed as described in Table 2: five types of land use scenarios (“WRF default scenario”, historical scenario, urban scenario, non-urban scenario and future scenario) and two types of terrain conditions (“Topography” (Fig. 1b), the current situation of the original complex terrain of the CCUA; “no-topography” (Fig. 1c), which is smoothing the mountainous terrain around the CCUA). The high-altitude mountains around CCUA have been removed through multiplying the altitude of the high-altitude area in the study area by a certain proportion of the scaling factor which makes the terrain of the whole simulation area smoother. The physical parameterization schemes and simulation time periods, as well as the study area, were the same as those mentioned in the previous section, except for the underlying surface land use datasets and terrain changes. Figure 1d is the distribution of more than 2000 meteorological observations stations from the China Meteorological Administration.
First, to verify the results of urban scenario and topography (exp. 5), the land-use-data-driven model can reproduce the weather conditions in July 2018 more accurately than the WRF default scenario (2010 MODIS) vs. topography (exp. 1). We compared the experimental results of exp. 5 and exp. 1 with the observation data of the National Meteorological Information Center of China Meteorological Administration. Secondly, by subtracting the results of the non-urban scenario and no-topography (exp. 4) from the urban scenario and no-topography (exp. 3), we compared the influence of the single urbanization factor on the thermal environment of urban agglomeration. Then, the result of exp. 5 minus exp. 3 was taken as a single terrain factor affecting the thermal environment.
Topography directly affects the local atmospheric circulation. Here is our research question: will topography interact with urbanization to jointly affect the thermal environment of urban agglomerations? We refer to Yang's method to explore the interaction between this terrain and urbanization before we quantified the impact of urbanization on the thermal environment of urban agglomeration under complex terrain; i.e., [exp. 5 – (exp. 3 + exp. 6) + exp. 4 ] (Yang et al., 2019). By comparing exp. 5 and exp. 2, we quantified the impact of urbanization on the thermal environment under complex terrain. Finally, by comparing the land use of future scenarios after planning (exp. 7) with the current situation (exp. 5), we can explore whether landscape planning inside and outside the urban agglomeration can alleviate urban heat stress.
3.1 Model verification
To verify the model performance, we compared the simulated monthly and daily mean spatial temperature models in July 2018 with the WRF default land use dataset and with observations of the meteorological stations (Fig. 4a, c and e). The correlation coefficient matrix of the 2018 land use simulation results has a high spatial correlation coefficient (p≤0.05) over the whole of the CCUA region (Fig. 5). The correlation coefficient of 10 variables was calculated, such as the surface skin temperature (TSK), 2 m air temperature (T2), ground heat flux (GRDFLX), upward heat flux at the surface (HFX), latent heat flux at the surface (LH), downward latent heat flux at the surface (LW_dw), upward latent heat flux at the surface (LW_up), shortwave (SW) radiation and PBLH, net radiation (Rn). The rationality of the correlation coefficient matrix shows that the configuration of the model is reasonable. However, the simulation underestimated the surface 2 m air temperature by 0.75–2.5 ∘C compared with observation (Fig. 4b). Previous studies had reported similar bias, characteristic of the WRF model (Wang et al., 2013, 2020), with most overestimations occurring in the urban areas of the respective study areas.

Figure 4The 2 m temperature space distribution of (a) observation data from Cimiss (China Integrated Meteorological Information Service System), (b) simulation results with 2018 land use data from IGSNRR, (c) simulation results with land use data from the WRF default USGS 2010 dataset, (d) simulation of IGSNRR minus observation temperature, (e) root mean square error of 2 m temperature between observation and IGSNRR simulation results, and (f) correlation coefficient of 2 m temperature between observation and simulation.
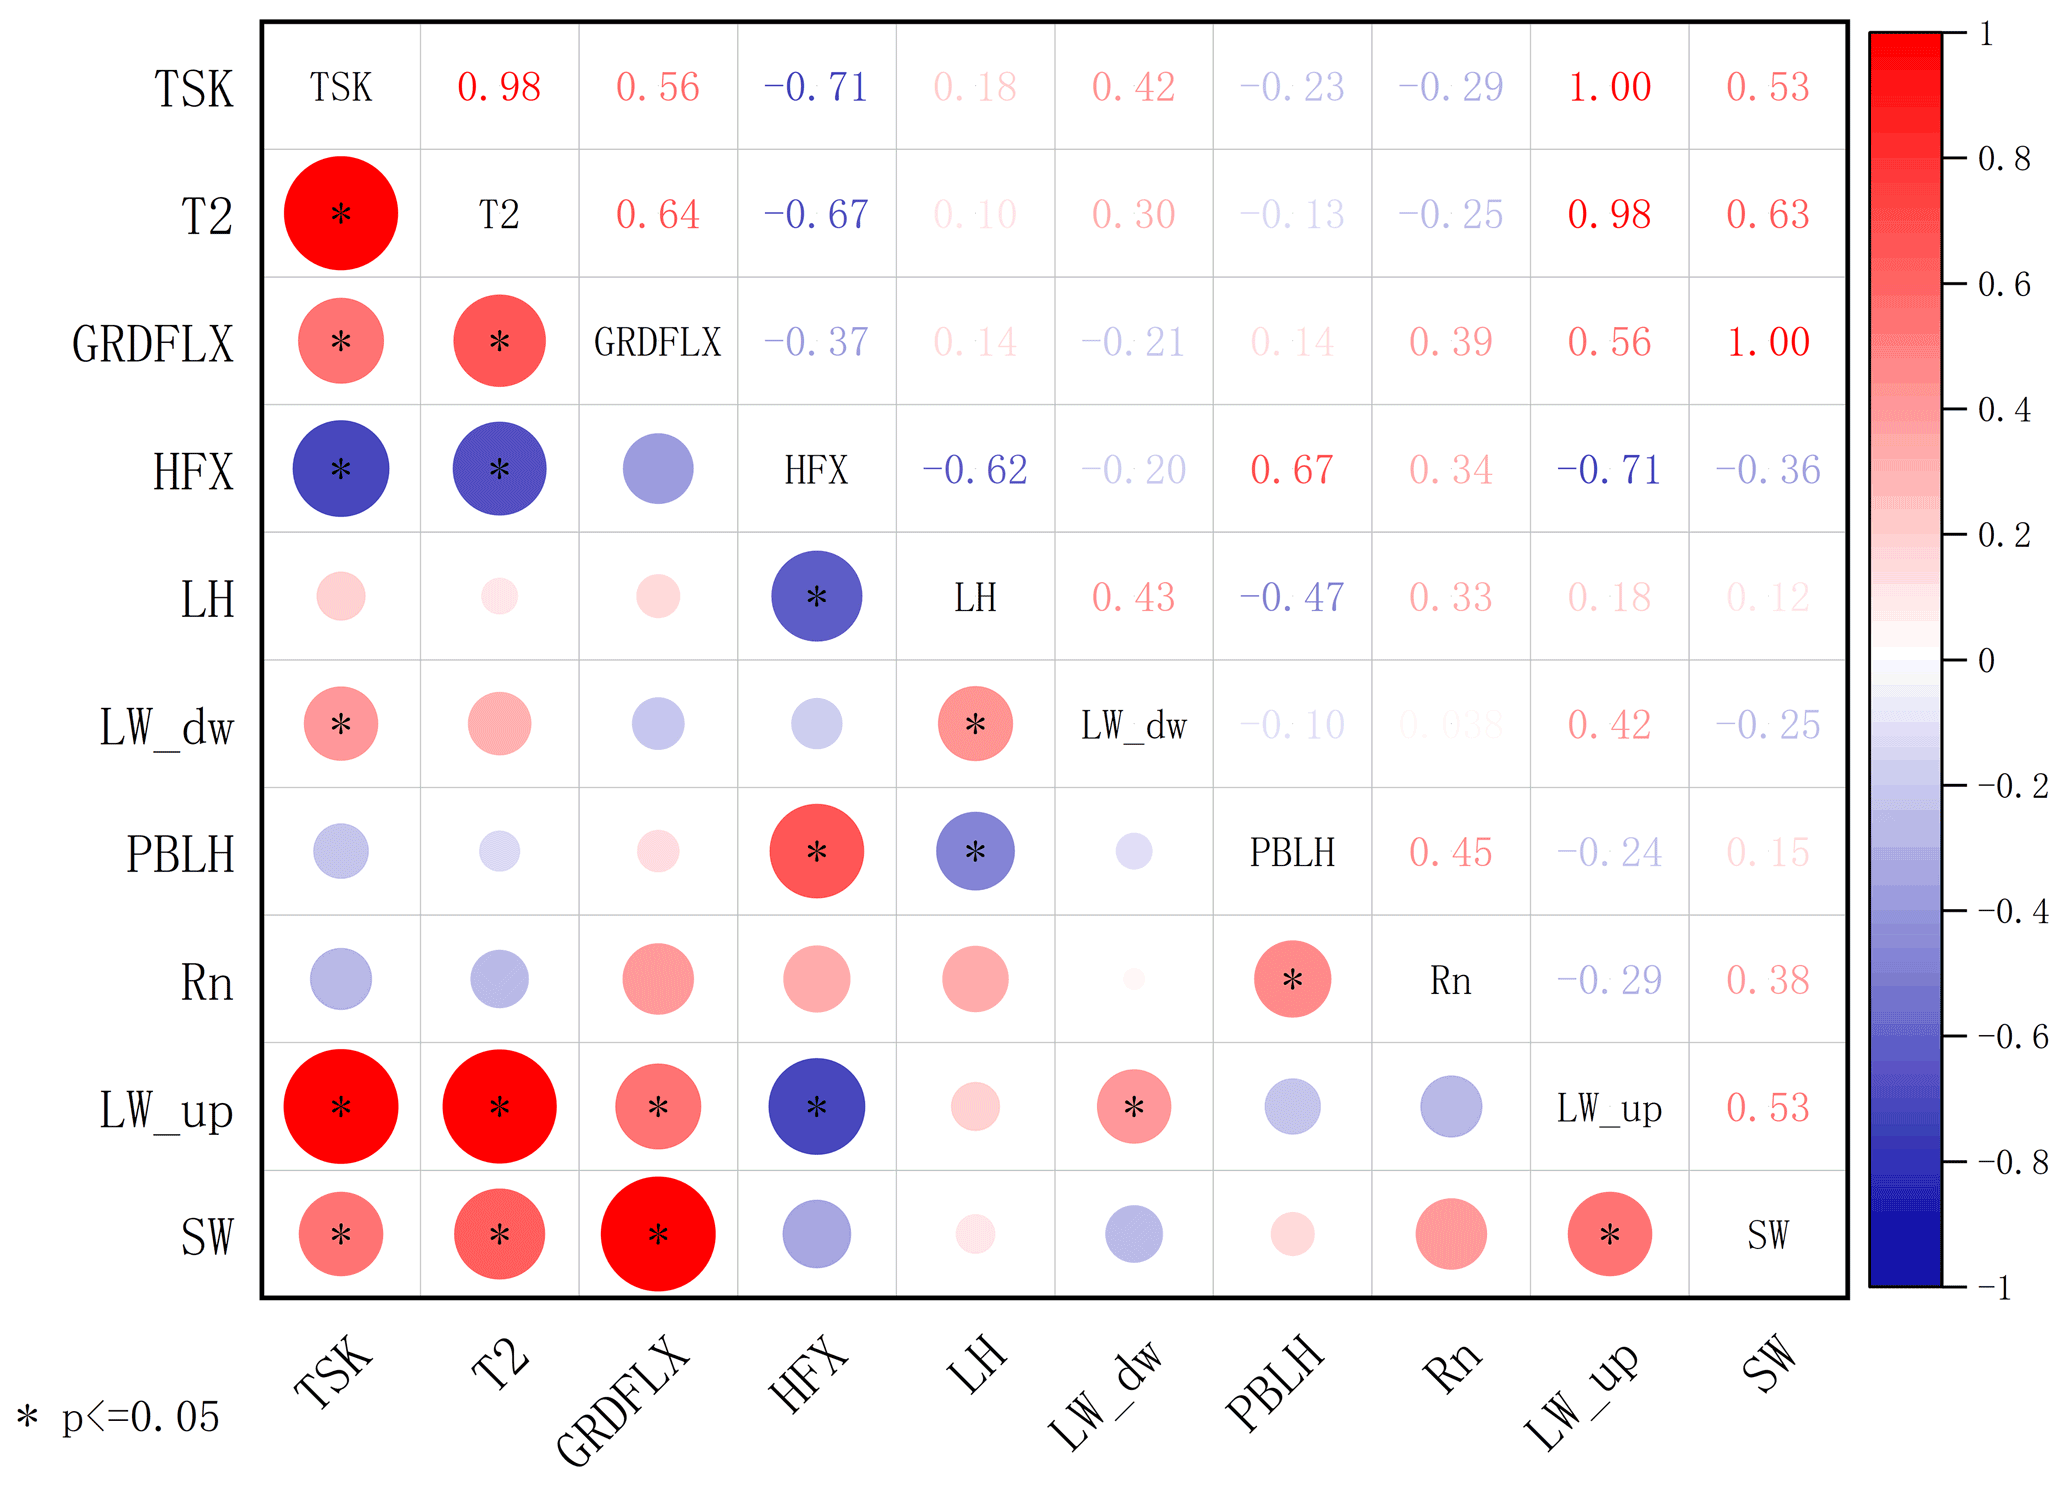
Figure 5Pearson correlation coefficient between 10 variables of simulation results by WRF with 2018 land use dataset in CCUA. The asterisk indicates the variables that were judged to be significant after inspection (p≤0.05).
Furthermore, the model exhibited a large negative deviation in the mountainous area around the CCUA (Fig. 4b) due to the systematic error of underestimating wind speed and temperature in the area. The root mean square error between the observed and exp. 5 (urban scenario and Topography) simulation results was about −2–4 ∘C (Fig. 4d). The spatial distribution of the correlation coefficient between the observation and the monthly mean 2 m temperature simulated by exp. 5 is shown in Fig. 4f. It has a high correlation in the whole urban agglomeration. Since we are concerned with the air temperature changes caused by the land cover and terrain interaction of different underlying surfaces, some systematic deviations can be offset by the sensitivity experiments rather than the accurate reproduction of the absolute temperature in the study area.
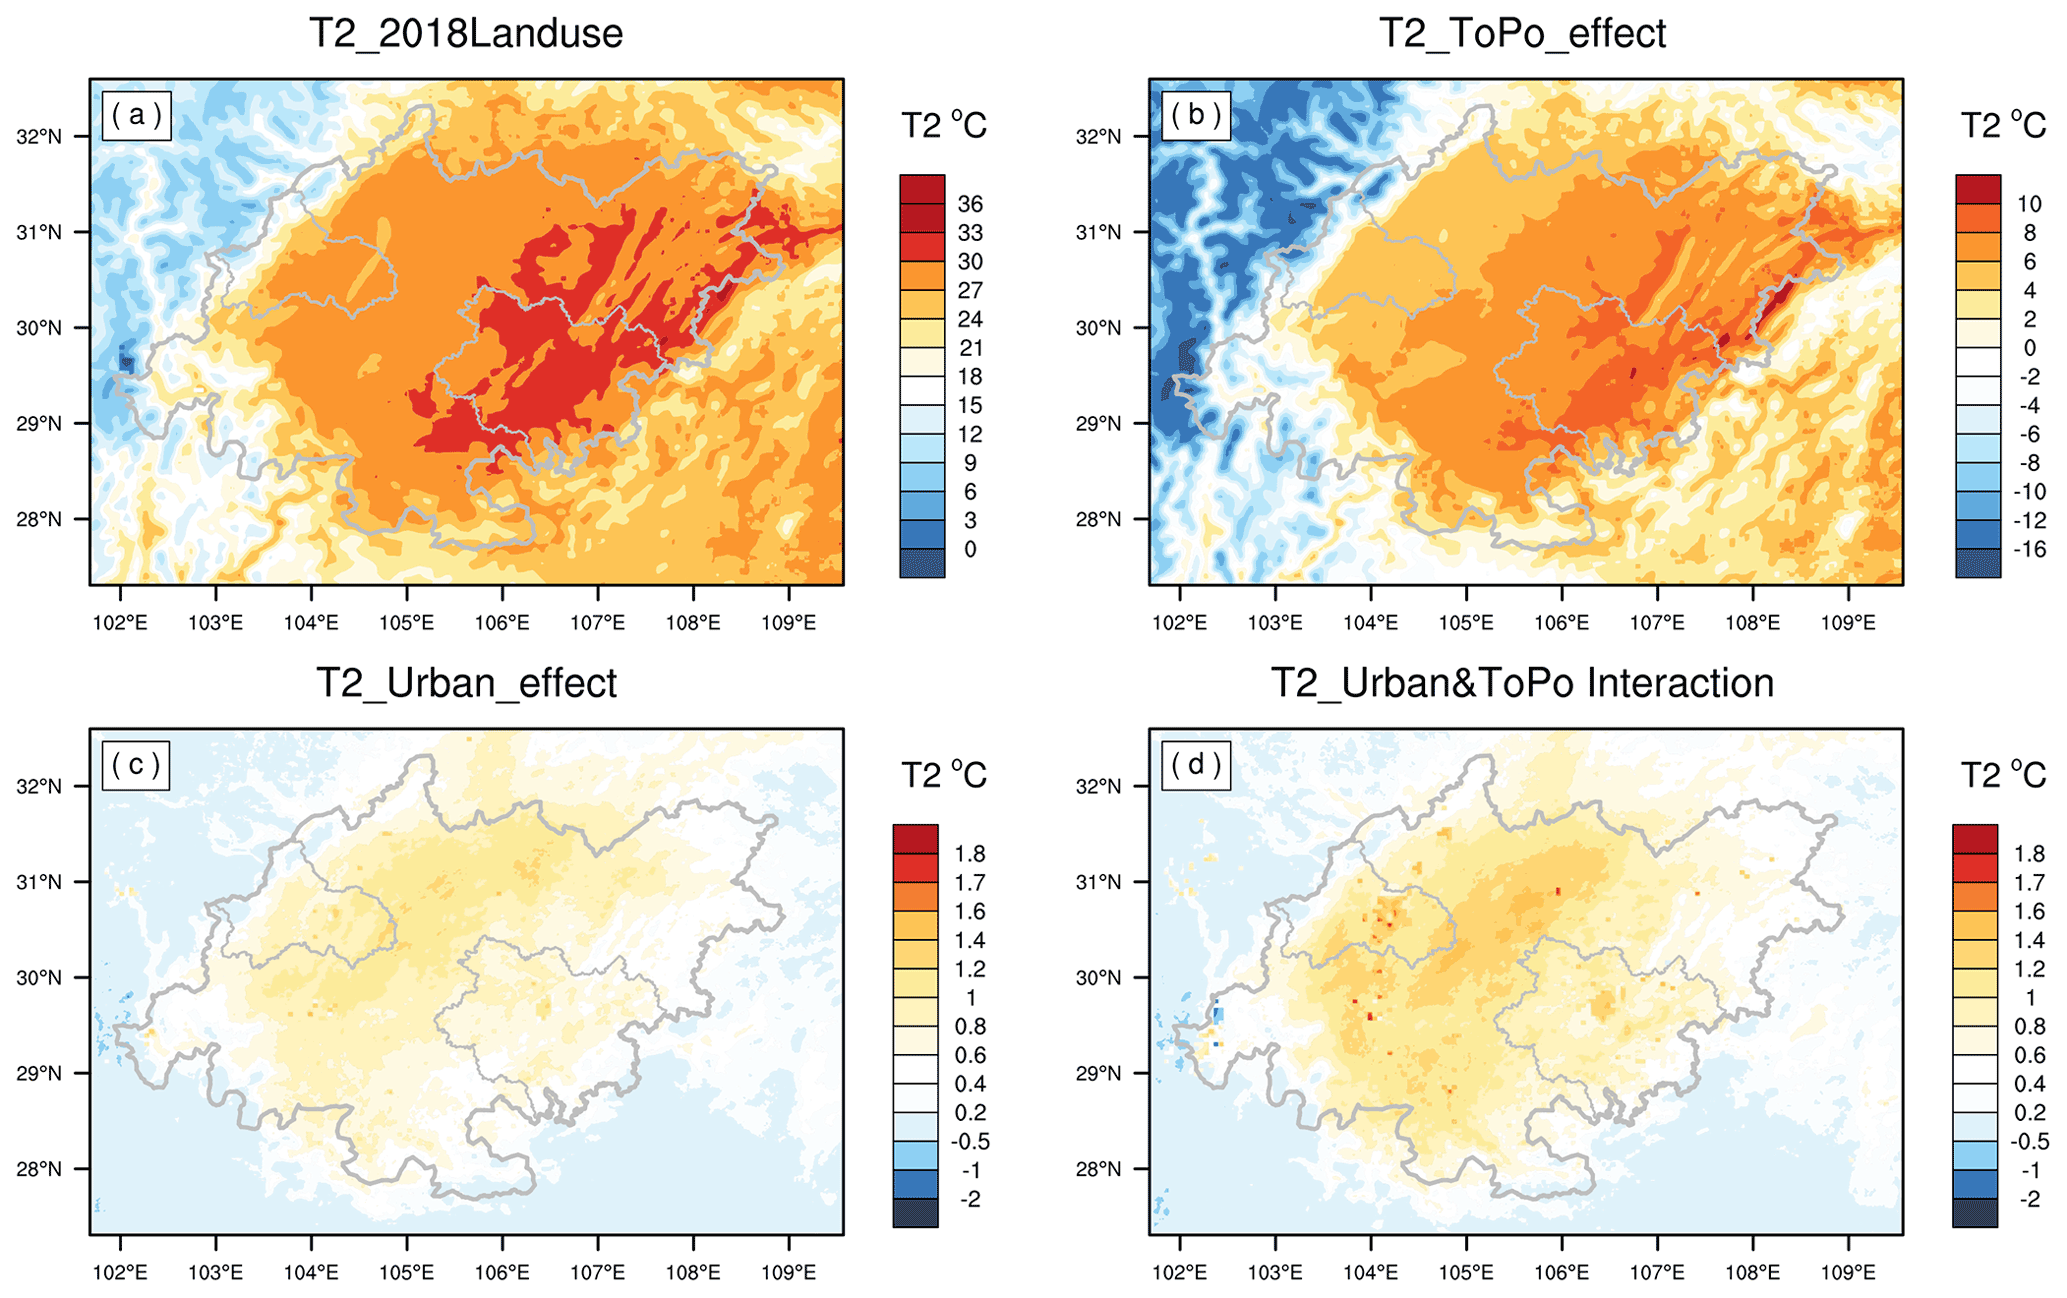
Figure 6Effects of urbanization on 2 m temperature: (a) 2 m average temperature distribution with 2018 land use; (b) topography effect; (c) urban effect; (d) urban–topography interaction.
3.2 The interaction of complex terrain and urban expansion
3.2.1 Topography effect
To explore the impact of terrain on the thermal environment of urban agglomerations in the summer, we made the land use of the CCUA constant (non-urban scenario), compared the results under the two different terrain scenarios: original complex terrain (topography) and smoothed topography (no-topography). Comparing Fig. 6a with Fig. 6b, we can see that the influence of terrain on the temperature pattern is basically consistent with the current distribution pattern of summer monthly average temperature, and terrain is the main factor determining the temperature pattern. In Fig. 6b, the temperature inside the CCUA (compared with flat terrain) increases by about 10 ∘C when there is complex terrain. Simultaneously, the temperature in the plateau and mountainous areas around the CCUA decreases by more than 10 ∘C. The complex terrain would form a lower temperature plateau mountain climate than the smooth plain terrain.
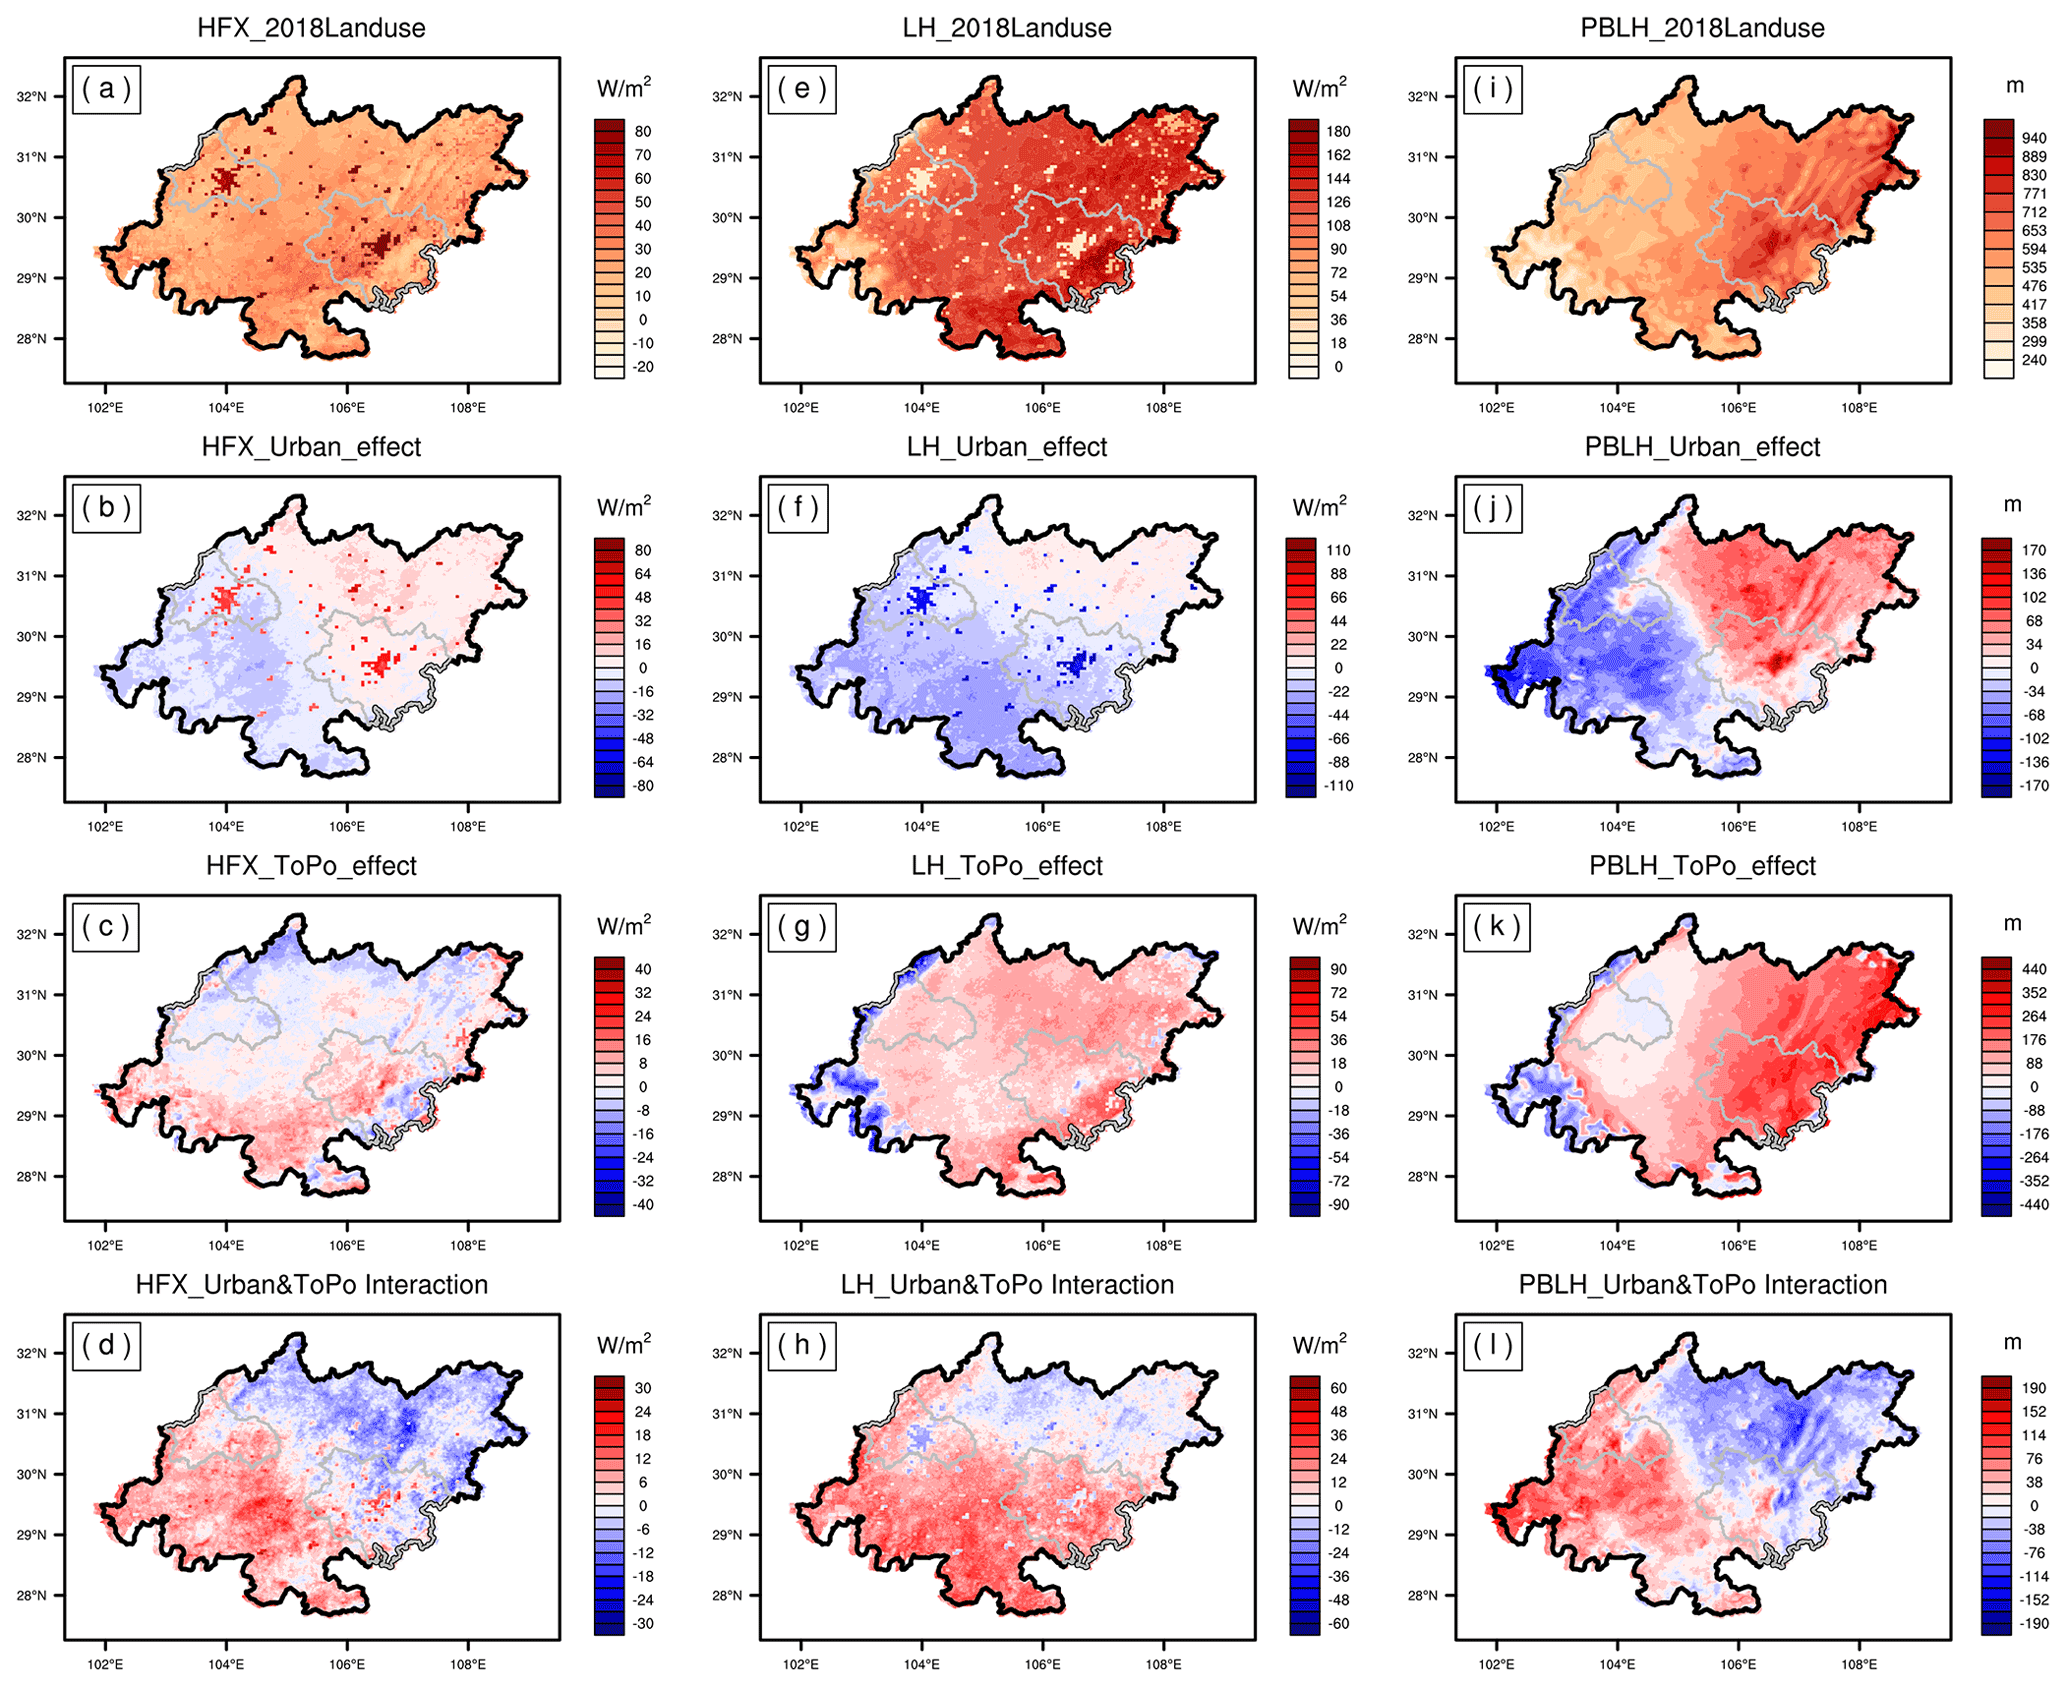
Figure 7Influence of urbanization on urban heat flux and PBLH: (a) 2018 land use HFX; (b) influence of urbanization on urban effect HFX; (c) influence of urbanization on urban topography effect HFX; (d) influence of urbanization on the urban and topography interaction effect HFX; (e–h) influence of urbanization on urban LH; (i–l) influence of urbanization on urban PBLH.
Sichuan Basin, where the CCUA is located, has a concave landform. The closed topography leads to low wind speed in Sichuan Basin, making the heat in the basin difficult to dissipate. Therefore, the thermal environment here is more severe than that in the flat terrain. In Fig. 7c, g and k, we observed that the complex terrain would increase the HFX and LH of the urban agglomeration. At the same time, due to the high altitude around the basin itself, it will significantly raise the atmospheric boundary layer of the urban agglomeration. These are the crucial attributions for the temperature rise caused by the complex terrain.
The many rivers in Sichuan Basin make the southeast monsoon convey large quantities of water vapor, blocked by the mountains around Sichuan Basin. The southeast of the mountainous area is low, which is favorable for receiving water vapor. On the contrary, the northwest mountainous area is of relatively high altitude, thereby conducive to water vapor loss, causing increased air humidity. Therefore, the topography is pertinent to forming a humid and hot climate in summer in the CCUA.
3.2.2 Urban effect
To determine the summer warming caused by a single urban land expansion factor, we conducted two groups of experiments: exp. 3 and exp. 4. Both groups of experiments smoothed the terrain to eliminate the influence of complex terrain. We observed that the urban expansion would cause the temperature of the whole urban agglomeration region to increase by ≈ 0.8 ∘C (Fig. 6c). Especially in the core areas of urban agglomeration (CD and CQ), the temperature increased significantly, nearing 1.0 ∘C increase in the main urban area. The temperature inside the urban agglomeration was considerably higher than on the outside, attesting to the “heat island effect”.
Urbanization will significantly change the surface albedo, heat capacity and thermal conductivity of the underlying urban surface. The change in surface heat flow caused by urbanization is shown in Fig. 7c. The urban impervious surface absorbs more downward shortwave radiation, and the GRDFLX is stored more in the daytime and released more at night. Daytime surface temperature is mainly due to the increase in urban surface HFX, with a maximum increase of 90 W m−2 in the core urban area of CD and CQ (Fig. 7b). The HFX rise directly elevates the near-surface temperature. Due to the impervious city surface, the city's evapotranspiration was lower than that of the suburb, and the LH during the day was significantly reduced; the maximum reduction can reach 110 W m−2 (Fig. 7f). The warming effect caused by urbanization enhances the turbulence and increases the PBLH (Lin et al., 2008). Also, the variation area and high-value area of the PBLH (Fig. 7i, j) are the temperature variation area, concentrated in the core urban area. Here, the urban PBLH increased by 40–170 m. Therefore, under the same external meteorological conditions, the HFX of urban construction land was higher, the LH was lower and the Bowen ratio was higher when compared to the vegetation coverage area around the city. The HFX and Bowen ratio of the urban surface were significantly higher than those of the surrounding vegetation. This occurrence increases the heating of the urban surface into the lower atmosphere, an important mechanism of the urban heat island effect.
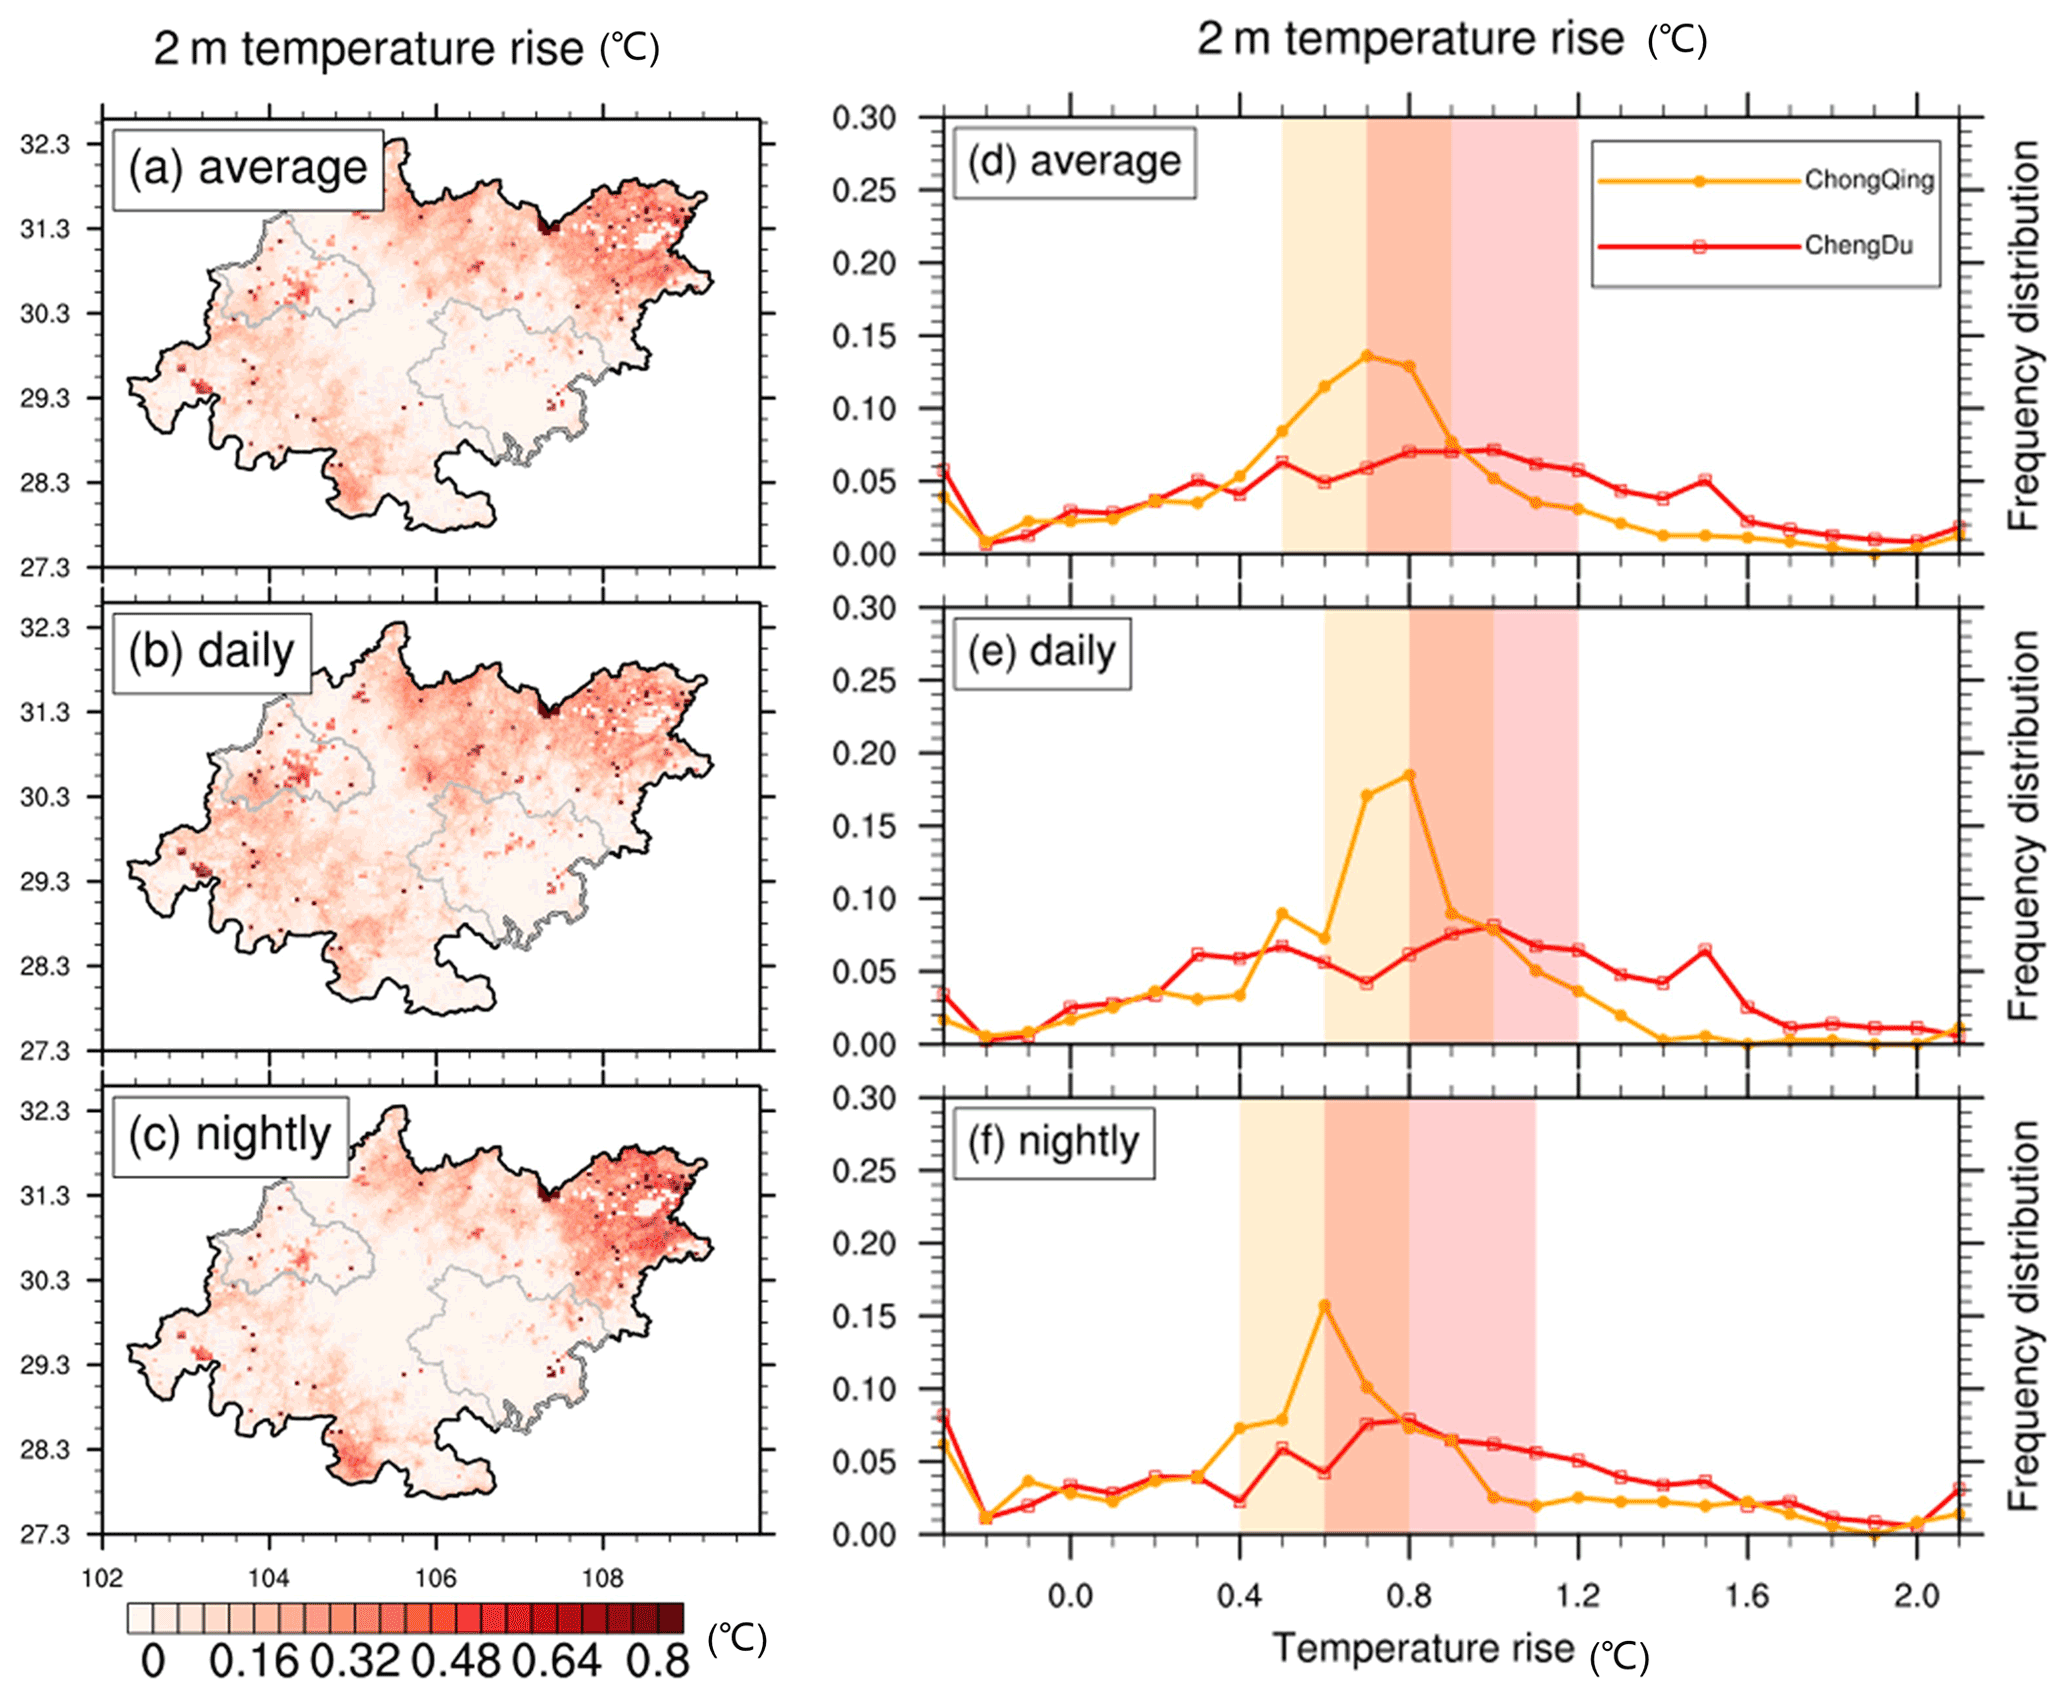
Figure 8The spatial distribution of 2 m temperature rise due to the urbanization: (a) average, (b) daily and (c) nightly. The temperature rise frequency distribution: (d) average, (e) daily and (f) nightly. (“Daily” means the average variable during the daytime, and “nightly” means the average variable during the nighttime. This description also applies to Fig. 10 below.)
3.2.3 Urban–topography interaction
By comparing the results of exp. 3, exp. 4, exp. 5 and exp. 6, we conclude that terrain is the most crucial factor in forming local weather and climate patterns. In the case of complex terrain and urbanization, the terrain would affect the weather and climate simultaneously, causing climate change (Figs. 6d, 7d, h and i). Compared with the urban warming effect (caused by a single urbanization factor), the warming effect of the urban core area is more evident after the complex terrain is added. The warming areas are more concentrated in the urban core area. The average temperature in the core areas of CD and CQ increases by more than 1.5 ∘C.
Due to the joint influence of topography and urban expansion, the HFX increased by about 30 W m−2. The LH increased by 30–60 W m−2, extensively in the southwest of the CCUA, while the LH in the northeast of CCUA decreased by 20 W m−2. The boundary layer of the city has been raised significantly, especially in the main urban areas of CD and CQ, with the highest elevation of 180 m.
Considering the heat flux, temperature, boundary layer and other factors mentioned above, we think that the topography further enhances the heat island effect in the CCUA and the urban core area of CD and CQ.
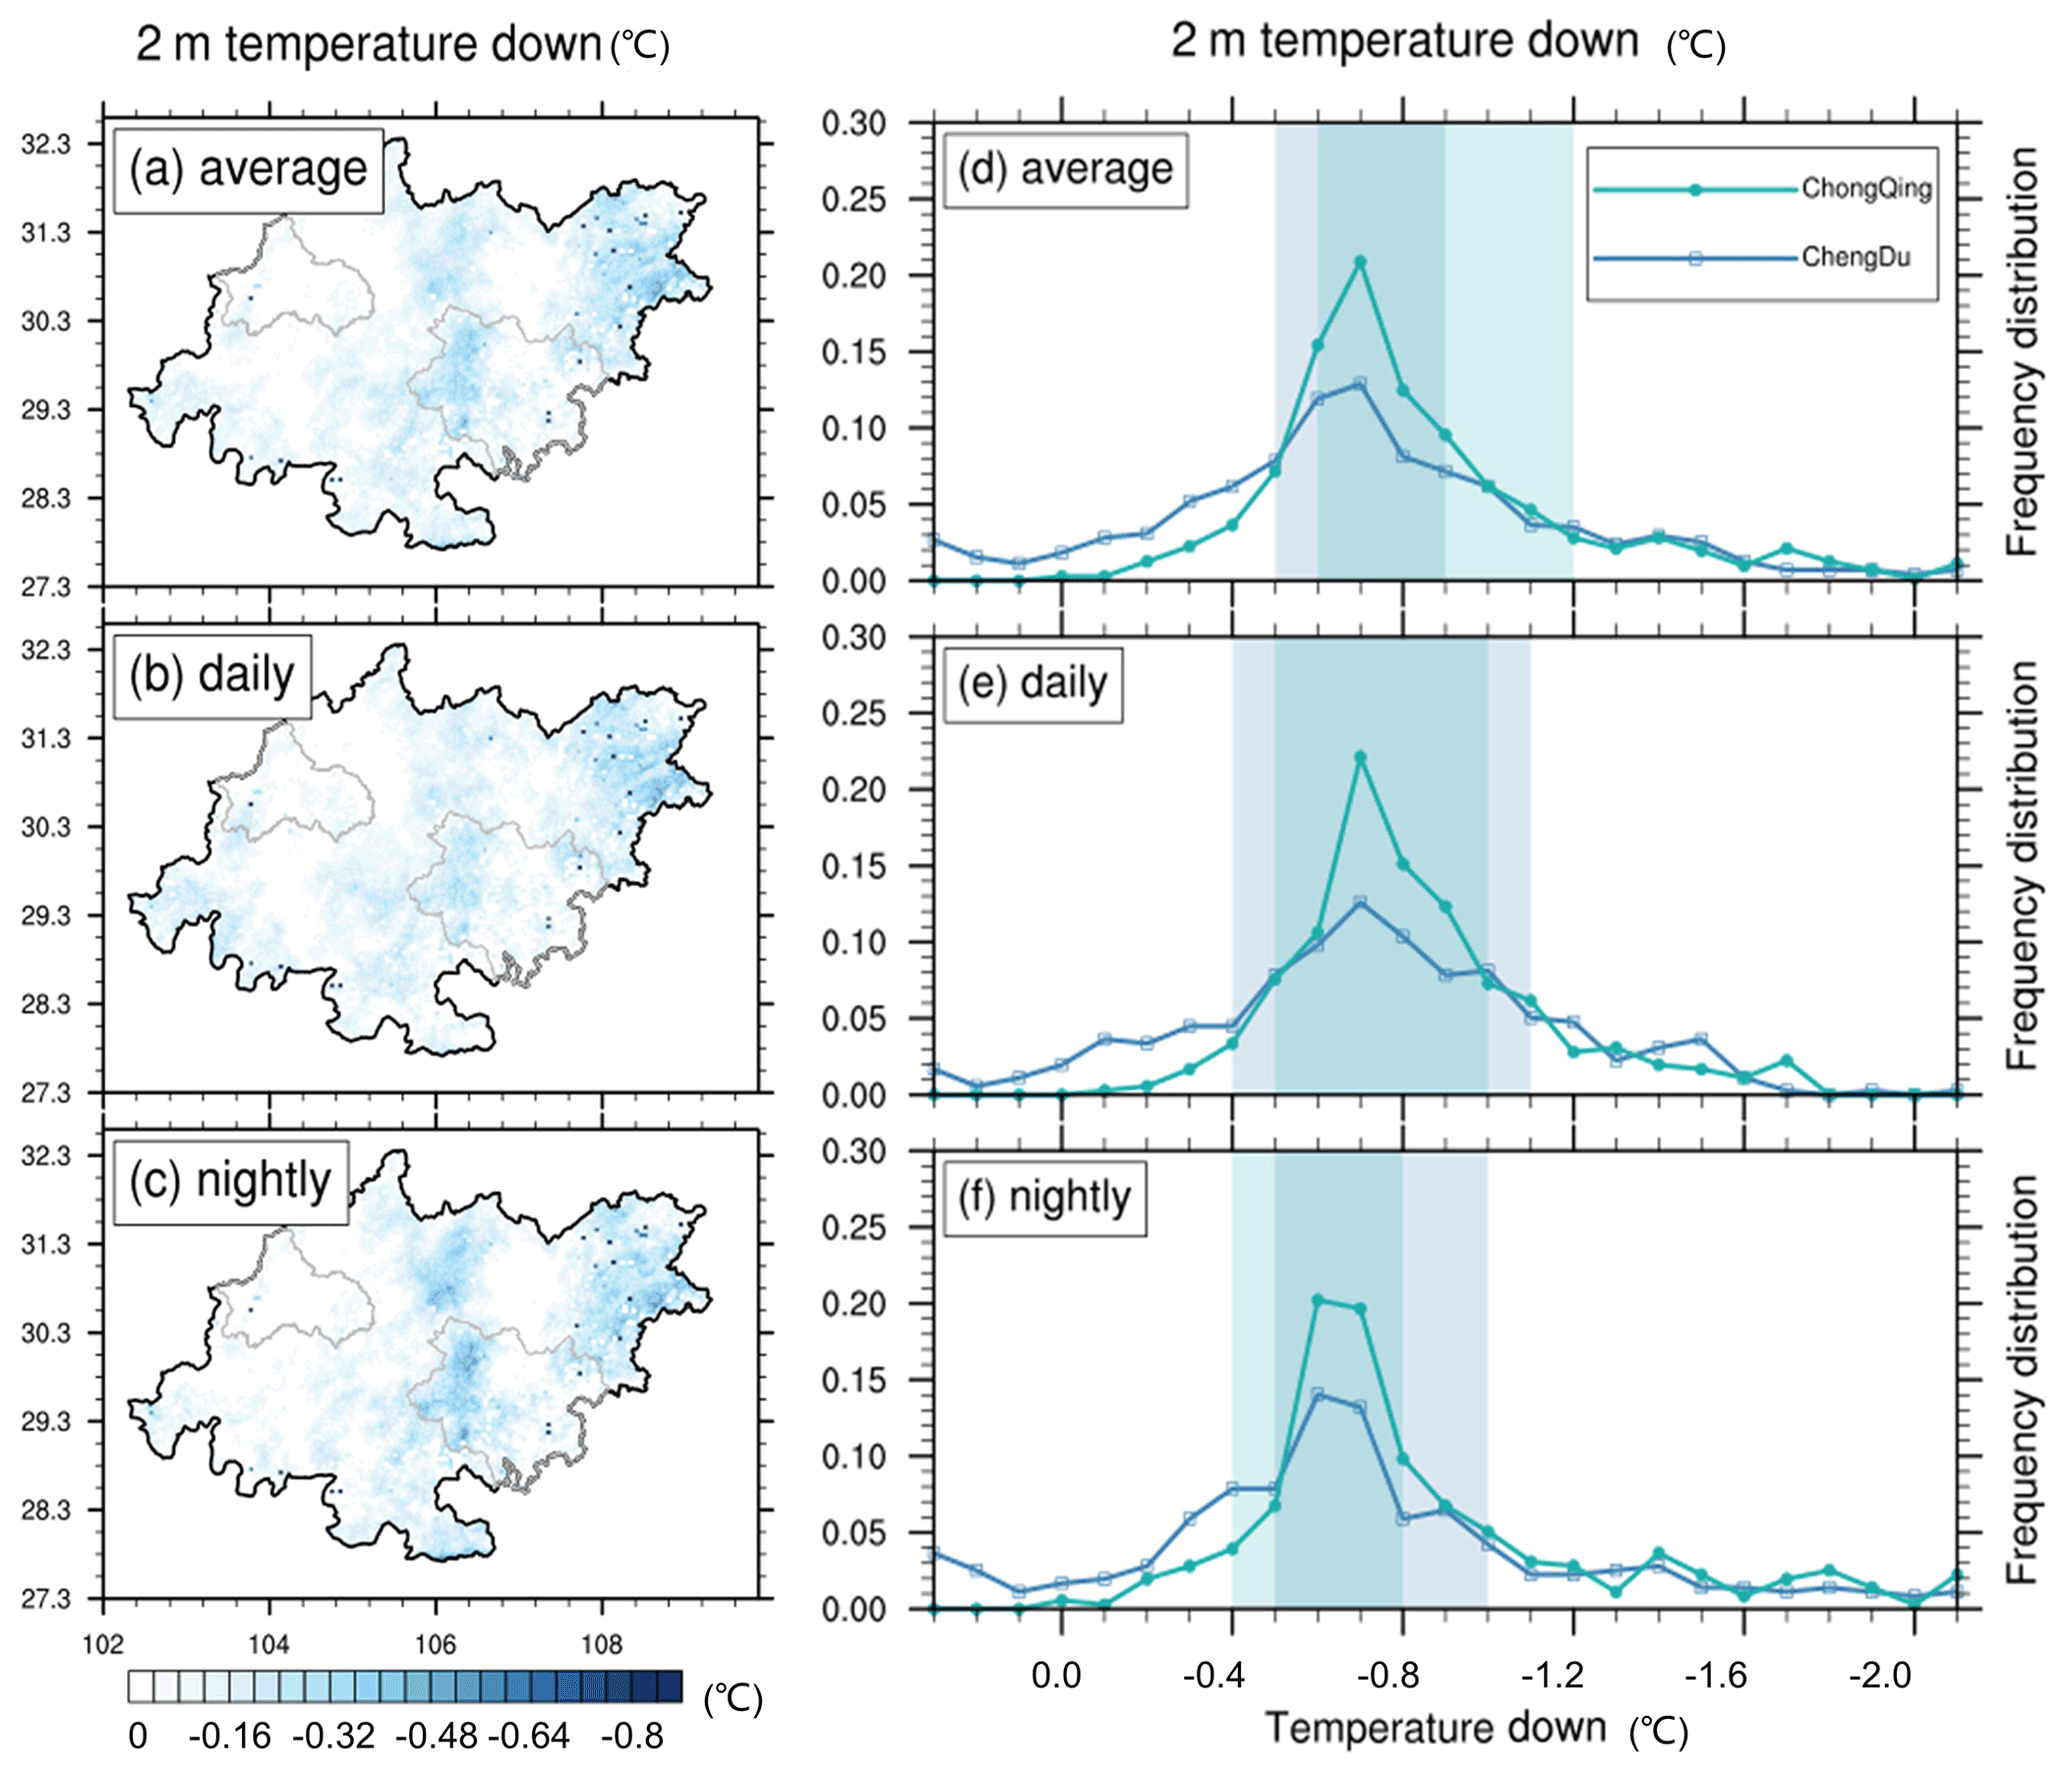
Figure 9The spatial distribution of 2 m temperature cooling because of the future planning scenario: (a) average, (b) daily and (c) nightly. The cooling frequency distribution: (d) average, (e) daily and (f) nightly.
3.3 Historical warming of urban agglomerations
Above (Sect. 3.2), we quantitatively studied the influence of different factors on the urban thermal environment, such as a single urban factor, a single topography factor, and the combined influence of urban and topography factors. The results reveal in detail the mechanism of how these factors affect the urban thermal environment.
To determine the summer warming caused by historical urban land expansion, we calculated the simulated 2 m air temperature difference between the urbanized land use in 2018 and the historical land use before urbanization in 1980 (Fig. 8a–c) by the exp. 1 and exp. 5. The whole region experienced some warming, with notable ones occurring in areas consistent with the location of the urban grid in 2018. At the same time, the northeast part of the urban agglomerations was warmed, probably resulting from the urban agglomerations effect or terrain hindering heat dissipation. The monthly average temperature of 2 m air in July of 2018 was 0.75 ∘C higher than that of 1980. The most significant temperature increase occurred in the main urban area of CD and CQ. The maximum temperature rise reached 0.8 ∘C. Note that the anthropogenic heat was not considered in the simulation process of this study. Therefore, the simulated warming is attributed to the increase in urban land only. Figure 8d–f show the frequency distribution of the heating amplitude of all grid points of CCUA; the warming range of the CD urban area is between 0.5 and 1.1 ∘C, while that of CQ urban area is between 0.4 and 0.8 ∘C.
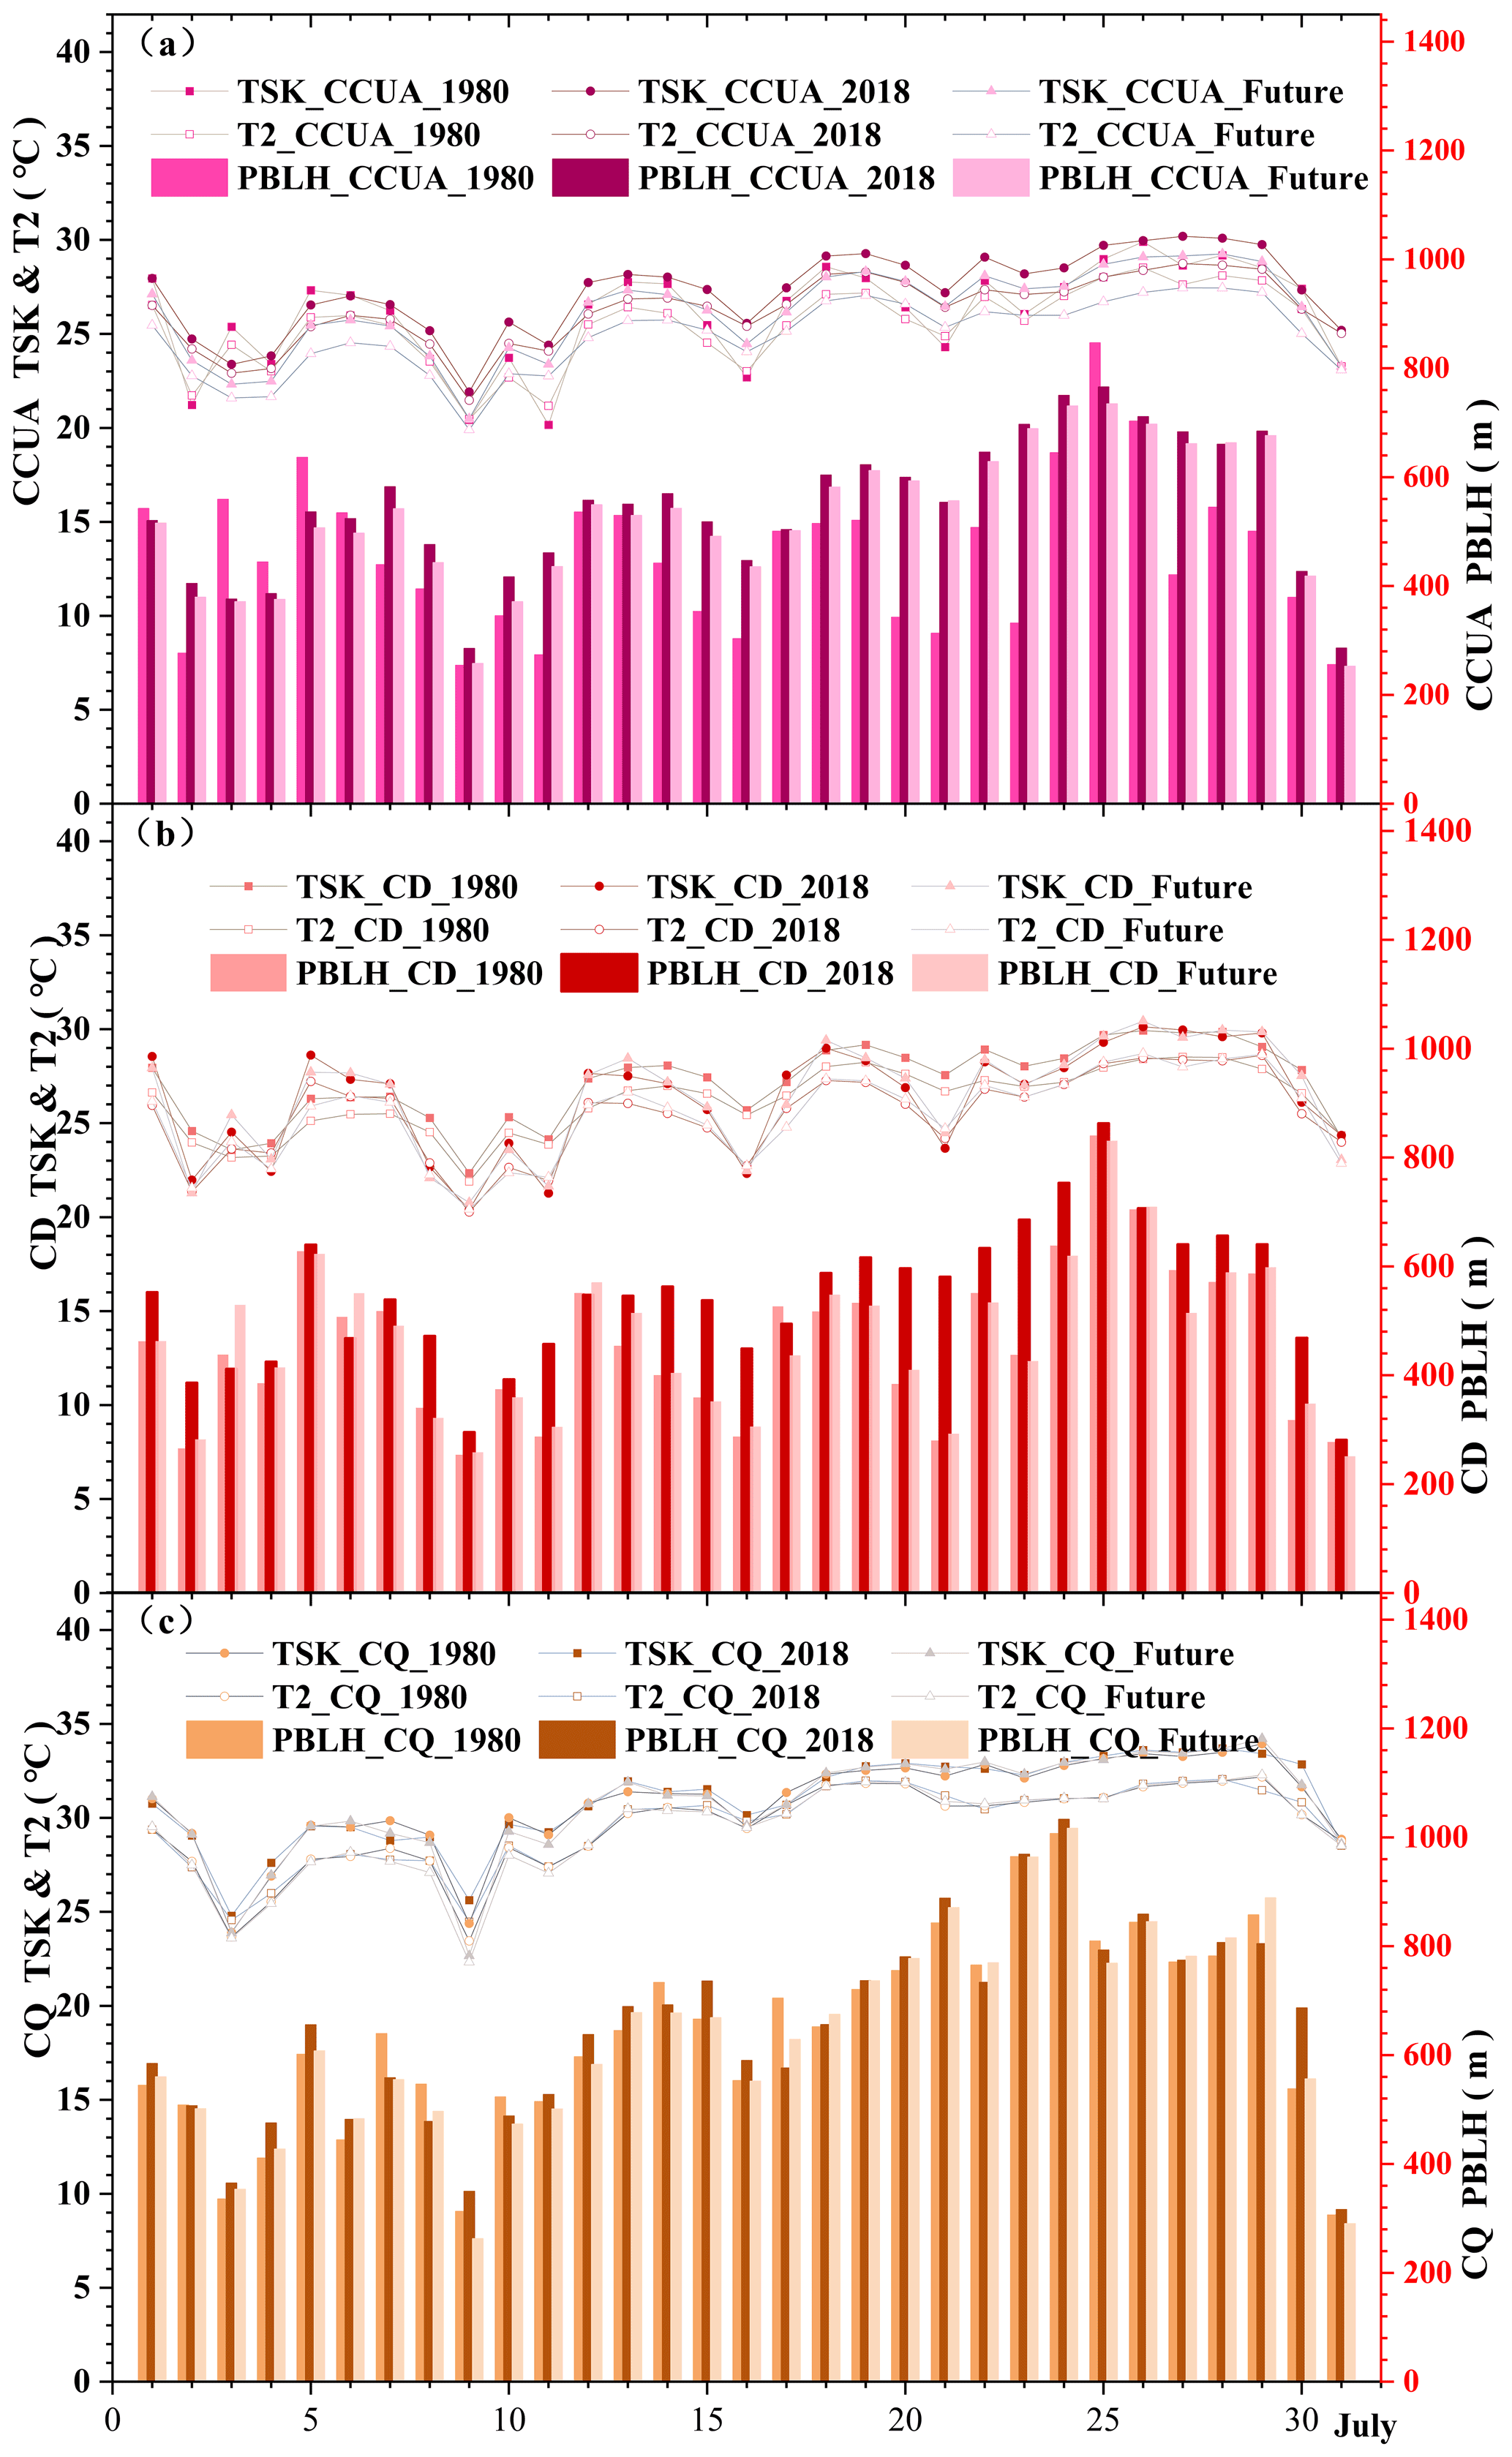
Figure 10(a) The TSK and T2 trends and PBLH distribution over the Chengdu–Chongqing urban agglomeration. (b) The TSK and T2 trends and PBLH distribution over Chengdu. (c) The TSK and T2 trends and PBLH distribution over Chongqing. (“Trends” means the daily average change in TSK, T and PBLH. The unit of TSK and T is degrees Celsius; the coordinate axis is on the left. The unit of PBLH is meter (m), and the coordinate axis is on the right.)
Figure 10a, b and c show the diurnal variation in surface temperature, 2 m air temperature and PBLH in the summer of the CCUA, CD and CQ in 1980 and 2018, respectively. Here, regardless of the CCUA, CD or CQ, the daily average surface temperature and the temperature of 2 m air simulated by the 2018 urbanization scenario were significantly higher than those of the 1980 historical scenario, and the daily average atmospheric boundary layer represented by the histogram is also increased by 50–100 m.
Compared with Fig. 11a and b, the change in surface radiation balance caused by urbanization was evident. The impervious surface layer of the CCUA absorbed more downward shortwave radiation, and the GRDFLX storage was larger during the day, while the GRDFLX released was larger at night. The increase in HFX has become the main component of surface energy flux, heating the air temperature of the city and promoting the formation of the urban heat island. The HFX reduction directly elevates near-surface temperature. Due to the decrease in soil evapotranspiration, the LH decreased significantly. From 1980 to 2018, large cities exhibited reduced soil moisture and near-surface wind speed, resulting in a lowered evaporation. The higher the surface temperature, the more intense was the long-wave radiation and the higher the net radiation energy lost in the daytime. Similar scenarios ensued for the main urban areas of CD and CQ because the proportion of impervious surface was higher. Changes in the surface heat flux became more apparent (Fig. 11c, d, e and f).
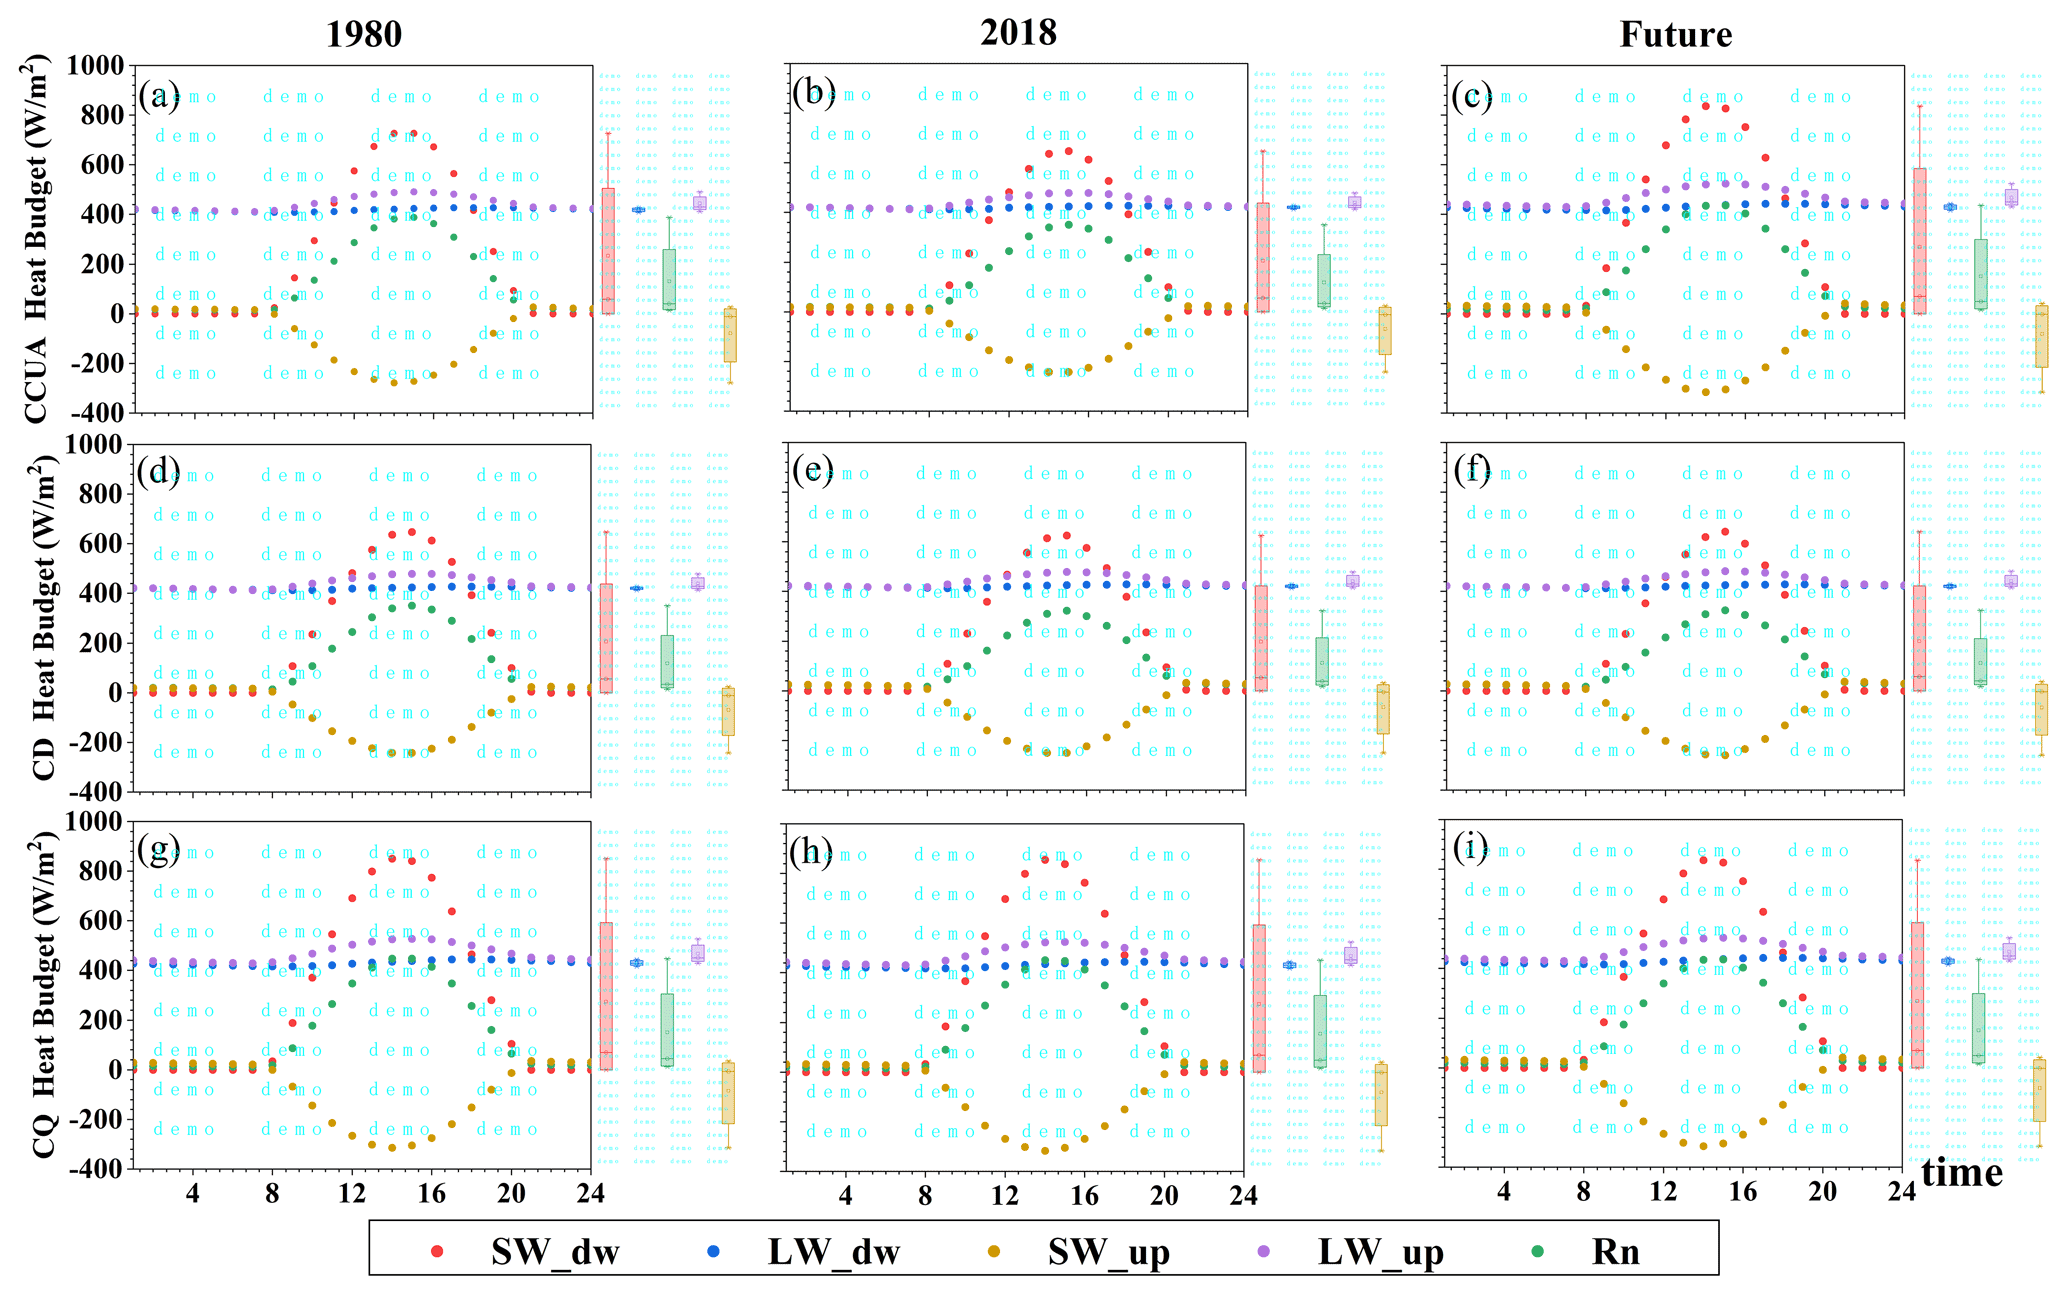
Figure 11The diurnal variations in the changes in surface energy budget over the land use grids of 1980, 2018 and future runs of the Chengdu–Chongqing urban agglomeration: (a) 1980, (b) 2018 and (c) future. The diurnal variations in the changes in surface energy budget over the land use grids of 1980, 2018 and future runs of Chengdu: (d) 1980, (e) 2018 and (f) future. The diurnal variations in the changes in surface energy budget over the land use grids of 1980, 2018 and future runs of Chongqing: (g) 1980, (h) 2018 and (i) future.
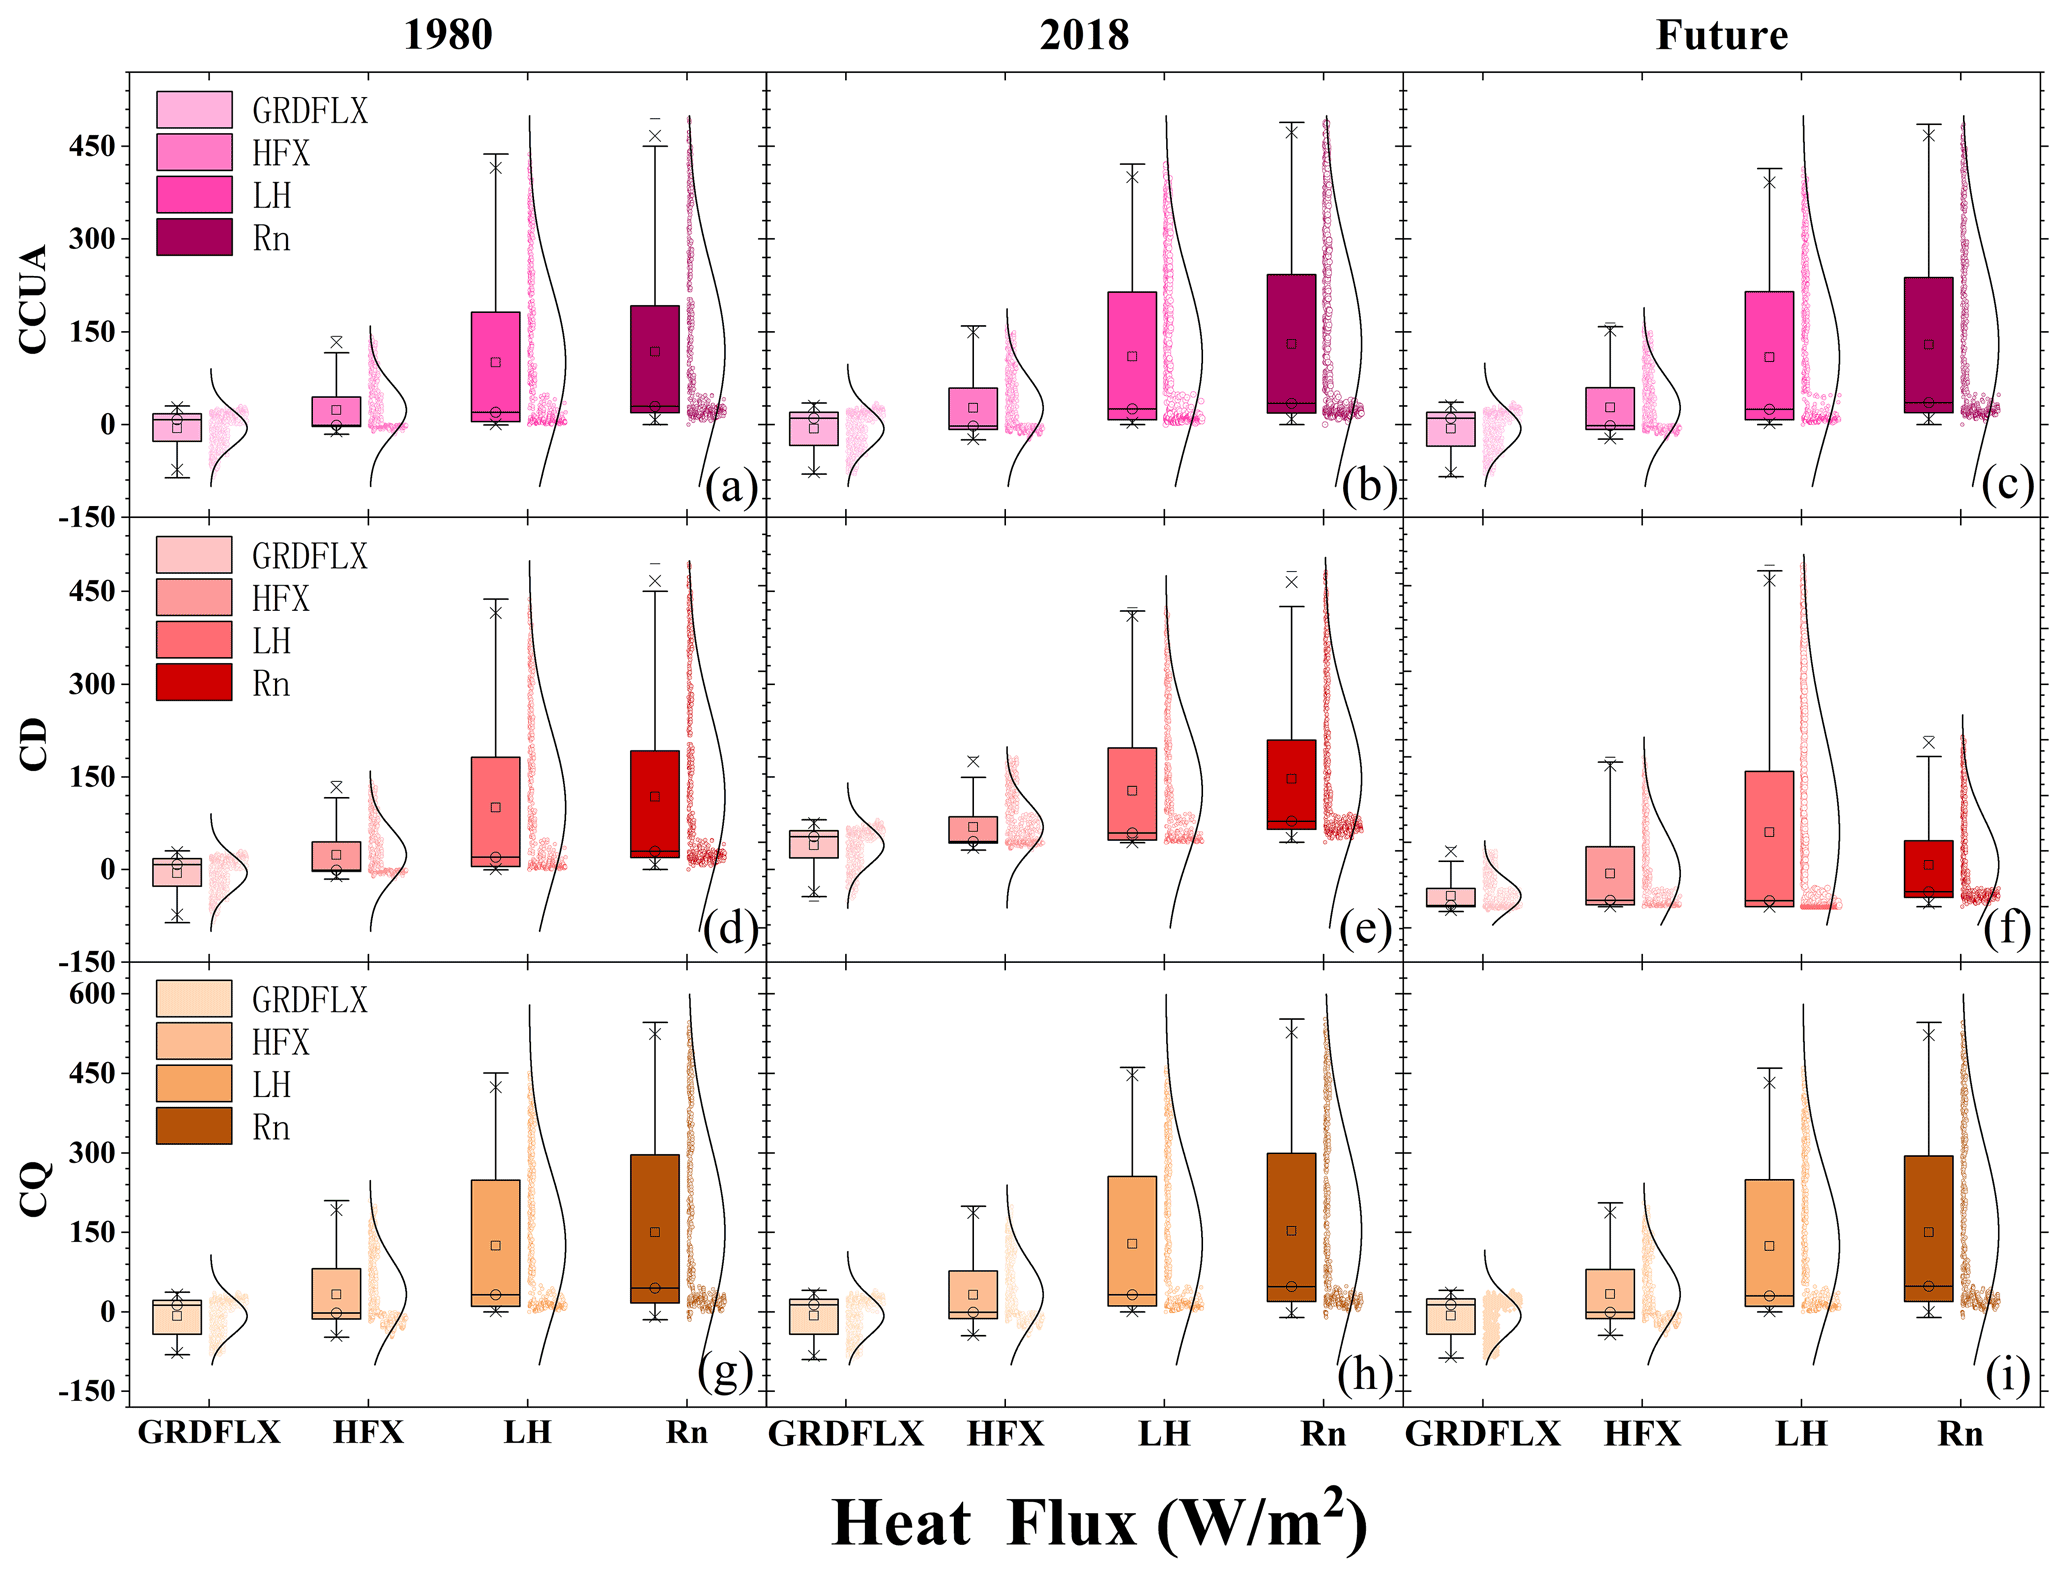
Figure 12The heat flux distribution changes in surface heat flux over the land use grids of (a) 1980, (b) 2018 and (c) future of the Chengdu–Chongqing urban agglomeration. The heat flux distribution changes in surface heat flux over the land use grids of (d) 1980, (e) 2018 and (f) future of Chengdu. The heat flux distribution changes in surface heat flux over the land use grids of (g) 1980, (h) 2018 and (i) future of Chongqing.
The two columns on the left side of Fig. 12a–b, d–e and g–h show the components of surface heat flux during the simulation period caused by urbanization. The upper and lower endpoints of the box graph represent the maximum and minimum values of the heat flux, while the middle, upper and lower side represent the average and the first and third quantiles, respectively. The four boxes from left to right in each panel represent the ground heat flux, HFX, LH and Rn. The scatter points and curves on the right side of the box represent the distribution of surface heat flux values. Thus, it is easy to affirm that the mean and maximum values of HFX and Rn increased from 1980 to 2018. Similarly, in CD and CQ, the impervious surface area was higher, increasing significantly.
Therefore, we suggest that urbanization will inevitably produce a heat island effect in urban agglomerations, especially under a complex terrain. Consequently, some effective and ideal measures could be adopted to alleviate the heat island effect caused by urbanization.
3.4 Mitigation of future heat stress
Due to the significant urban heat island effect associated with urbanization, to explore reasonable measures to alleviate the urban heat island effect and improve the living comfort of urban residents, we designed the future land use scenarios. To explore the extent to which the urban heat island effect can be alleviated by returning farmland to forest and grassland and expanding the river lake wetland area of urban agglomeration, we compared the future scenario with the current urban scenario (Fig. 9). In the central part of the CCUA, the average temperature dropped by about 0.5 ∘C in summer in July and decreased at night and during the day. The primary cooling interval was ≈ 0.4–1 ∘C, and the cooling rate in CQ was higher than that in CD. This situation occurred because the planned land use is closer to the urban area of CQ than to the urban area of CD. Therefore, the response of CQ to this measure was more obvious in landscape planning.
Comparing the future scenario (Fig. 10) with the 2018 urban scenario, it was obvious that planning measures could reduce the air temperature and ground temperature 2 m above the CCUA area, CQ area and CD area. After the planning, the overall average temperature dropped by 0.2–0.67 ∘C, while the daily average PBLH of CCUA, CD, CQ and other cities dropped 50–150 m in July. Most of the days, the decline was > 100 m.
Comparing the two columns on the right side of Fig. 12b, c, e, f, h and i, the city's heat flux changed after the urban agglomeration planning. With the urbanization scenario in 2018, the average GRDFLX decreased by about 30 W m−2, the maximum HFX decreased by 38 W m−2, the LH increased by 47 W m−2, and the average Rn increased by 14 W m−2.
There is a significant difference between the urban heat budget and the natural underlay surface. From the results, we observed that the planning measures have significantly improved the thermal environment of the city because the planned land use increases the natural underlay surface of the vegetation and water system. The urban impervious surface and building surface evinced a higher surface temperature, which was decisive in the HFX, whereas the natural underlay surface dominated the LH, caused by transpiration and evaporation of vegetation and wetland. Because the surface temperature was lower than the impervious surface of the city, planning policy can reduce the urban heat island effect and improve the comfort of human settlements.
In this study, we investigated the CCUA summer urban warming effect and its adaptation strategies under the complex terrain in southwest China through conducting seven simulations using the WRF/SLUCM model with the combined five land use scenarios, including WRF default, historical, urban, non-urban and future planning scenarios, and two kinds of terrain (original complex terrain and smoothed terrain). It was found that urban land use types of the CCUA increased to nearly 9000 km2. The simulations using 2018 land use data and original complex terrain showed that the WRF model reproduces a general pattern of summer weather against the observed temperature. In the past 40 years, the changed underlying surface led to the urban heat island effect, increasing the urban temperature by 0.75 ∘C. The impervious surface absorbed more Rn and stored the energy in the buildings and pavement. The remainder transmitted the HFX to the air through the turbulence exchange, and the HFX rose by > 90 W m−2, raising the boundary layer. In addition, the transpiration and evaporation from the urban underlay surface decreased, leading to lowering LH by ≈ 110 W m−2. These energy balance changes eventually led to temperature rise and finally to the urban heat island effect. Moreover, the mountainous area around Sichuan Basin is complex in topography, making it difficult for heat to diffuse. This scenario further strengthened the urban heat island effect, enhancing it by ≈ 30 %.
The simulation for the future planning scenario shows that the implementation of idealized measures (such as returning farmland to forest and river lake expansion) can reduce the urban heat island effect. Likewise, it can regulate the urban ecosystem; for example, the average 2 m temperature in summer of an urban agglomeration decreased by ≈ 0.2–0.67 ∘C. Also, the average net radiation on the surface was reduced by 17 W m−2. Finally, we anticipate that urban planning policy can provide effective suggestions for future urban thermal environment management and improve living comfort.
This study focuses on exploring the impact of urbanization in a complex terrain environment on local geothermal environment using the WRF model with the USGS data of WRF's default data and the Institute of Geographic Sciences and Natural Resources Research (IGSNRR) land use data that are more timely and more suitable for CCUA in the local research area. We may also discuss simulation uncertainties from other land use and land cover data in future.
Most of the statistical treatments were done using the Origin software (https://www.originlab.com/2021b, OriginLab, 2021), and the drawing language is the NCL language. The map drawing software is ArcGIS pro.
The initial and boundary field data in this work are available for download via the Research Data Archive of NCAR: https://doi.org/10.5065/D65Q4T4Z (National Centers for Environmental Prediction/National Weather Service/NOAA/U.S. Department of Commerce, 2015). The land use and land cover datasets in this work are available for download via the Resource and Environment Science and Data Center: https://doi.org/10.12078/2018070201 (IGSNRR, 2018).
The scientific framing of this paper was developed by SC, ZX, BJ and PQ. The WRF model was initiated by SC and BL. The WRF model runs were set up, performed and extracted through a joint effort by the team of SC, BL and JX. Analyses and scientific post-processing were performed by LW, YW and RL. All authors discussed the results and contributed to the writing of the paper.
The contact author has declared that neither they nor their co-authors have any competing interests.
Publisher's note: Copernicus Publications remains neutral with regard to jurisdictional claims in published maps and institutional affiliations.
This work was supported by the Strategic Priority Research Program of the Chinese Academy of Sciences (grant number: XDA23090102), the National Natural Science Foundation of China (NSFC) project (grant number: 41830967), and the National Meteorological Information Center, China Meteorological Administration for data support. We also thank the editor, Gabriele Messori, and the reviewer, Hideki Takebayashi, and the three anonymous reviewers for their kind comments on the paper.
This work was supported by the Strategic Priority Research Program of the Chinese Academy of Sciences (grant no. XDA23090102) and the National Natural Science Foundation of China (NSFC) project (grant no. 41830967).
This paper was edited by Gabriele Messori and reviewed by Hideki Takebayashi and three anonymous referees.
Berling-Wolff, S. and Jianguo, W. U.: Modeling urban landscape dynamics: a case study in phoenix, USA, Urban Ecosyst., 7, 215–240, https://doi.org/10.1023/B:UECO.0000044037.23965.45, 2004.
Bruinsma, F. and Rietveld, P.: Urban Agglomerations in European Infrastructure Networks, Urban Stud., 30, 919–934, https://doi.org/10.1080/00420989320080861, 1993.
Chen, F., Yang, X., and Zhu, W.: WRF simulations of urban heat island under hot-weather synoptic conditions: The case study of Hangzhou City, China, Atmos. Res., 138, 364–377, https://doi.org/10.1016/j.atmosres.2013.12.005, 2014.
Dudhia, J.: Numerical study of convection observed during the winter monsoon experiment using a mesoscale two-dimensional model, J. Atmos., 46, 3077–3107, 1989.
Hamdi, R. and Schayes, G.: Sensitivity study of the urban heat island intensity to urban characteristics, Int. J. Climatol., 7, 973–982, https://doi.org/10.1002/joc.1598, 2010.
Hong, S. Y., Hong, Y., and Dudhia, N. J.: A new vertical diffusion package with an explicit treatment of entrainment processes, Mon. Weather Rev., 134, 2318–2341, 2006.
IGSNRR: CNLUCC/China’s Multi-Period Land Use Land Cover Remote Sensing Monitoring [data set], https://doi.org/10.12078/2018070201, 2018.
Kalnay, E. and Cai, M.: Impact of urbanization and land-use change on climate, Nature, 425, 102–102, https://doi.org/10.1038/nature01952, 2003.
Kawashima T.: Urban agglomeration economies in manufacturing industries, Blackwell Publishing Ltd, 34, 157–172, https://doi.org/10.1007/BF01941317, 1975.
Liu, X. J., Tian, G. J., and Feng, J. M.: Assessing summertime urban warming and the cooling efficacy of adaptation strategy in the Chengdu-Chongqing metropolitan region of China, Sci. Total Environ., 610–611, 1092–1102, https://doi.org/10.1016/j.scitotenv.2017.08.082, 2018.
Lin, C. Y., Fei, C., Huang, J. C., Chen, W. C., Liou, Y. A.,Chen, W. N., and Liu, S. C.: Urban heat island effect and its impact on boundary layer development and land–sea circulation over northern Taiwan, Atmos. Environ., 42, 5635–5649, 2008.
Ministry of Natural Resources of PRC, Ministry of Ecological Environment of PRC, and Ministry of Finance of PRC: Guidelines for Ecological Protection and Restoration Project of Mountains, Rivers, Forests, Fields, Lakes and Grasse, available at: https://www.cgs.gov.cn/tzgg/tzgg/202009/W020200921635208145062.pdf, 2020.
Mlawer, E. J., Taubman, S. T., Brown, P. D., Iacono, M. J., and Clough, S. A.: Radiative transfer for inhomogeneous atmospheres: RRTM, a validated correlated-k model for the longwave, J. Geophys. Res.-Atmos., 102, 16663–16682, https://doi.org/10.1029/97JD00237, 1997.
Monin, A. S. and Obukhov, A. M.: Basic laws of turbulent mixing in the atmosphere near the ground, Tr. Geofiz. Inst., Akad. Nauk SSSR 24, 163–187, 1954.
National Centers for Environmental Prediction/National Weather Service/NOAA/U.S. Department of Commerce: Research Data Archive at the National Center for Atmospheric Research, Computational and Information Systems Laboratory, NCEP GDAS/FNL 0.25 Degree Global Tropospheric Analyses and Forecast Grids, Research Data Archive at the National Center for Atmospheric Research, Computational and Information Systems Laboratory, https://doi.org/10.5065/D65Q4T4Z, 2015.
National Development and Reform Commission of PRC, Ministry of Housing and Urban-Rural Development of PRC: Chengdu-Chongqing Urban Agglomeration Development Plan, 2014–2020, available at: https://www.ndrc.gov.cn/fzggw/jgsj/ghs/sjdt/201605/W020191010642895842500.pdf (last access: 17 August 2019), 2016.
Ning, G., Wang, S., Yim, S. H. L., Li, J., Hu, Y., Shang, Z., Wang, J., and Wang, J.: Impact of low-pressure systems on winter heavy air pollution in the northwest Sichuan Basin, China, Atmos. Chem. Phys., 18, 13601–13615, https://doi.org/10.5194/acp-18-13601-2018, 2018.
Ning, G., Yim, S. H. L., Wang, S., Duan, B., Nie, C., and Yang, X.: Synergistic effects of synoptic weather patterns and topography on air quality: a case of the Sichuan Basin of China, Clim. Dynam., 11, 6729–6744, https://doi.org/10.1007/s00382-019-04954-3, 2019.
Niu, G. Y., Yang, Z. L., Mitchell, K. E., Chen, F., Ek, M. B., and Barlage, M.: The community noah land surface model with multiparameterization options (noah-mp): 1. model description and evaluation with local-scale measurements, J. Geophys. Res.-Atmos., 116, D12110, https://doi.org/10.1029/2010JD015140, 2011.
Oke, T. R.: The Heat Island of the Urban Boundary Layer: Characteristics, Causes and Effects, NATO Advanced Study Institute on Wind Climate in Cities, 277, 81–107, https://doi.org/10.1007/978-94-017-3686-2_5, 1995.
OriginLab: https://www.originlab.com/2021b, last access: 1 May 2021.
Richardson, N. J., Densmore, A. L., Seward, D., Fowler, A., Wipf, M., Ellis, M. A., Yong, L., and Zhang, Y.: Extraordinary denudation in the Sichuan Basin: Insights from low-temperature thermochronology adjacent to the eastern margin of the Tibetan Plateau, J. Geophys. Res.-Sol. Ea., 113, B04409, https://doi.org/10.1029/2006JB004739, 2008.
Robaa, E.: Effect of Urbanization and Industrialization Processes on Outdoor Thermal Human Comfort in Egypt, Atmospheric and Climate Sciences, 3, 100–112, https://doi.org/10.4236/acs.2011.13012, 2011.
Saitoh, T. S., Shimada, T., and Hoshi, H.: Modeling and simulation of the Tokyo urban heat island, Atmos. Environ., 30, 3431–3442, https://doi.org/10.1016/1352-2310(95)00489-0, 1996.
Shao, Y. K., Shen, T. L., You, Y., and Kang, L.: Precipitation features of Sichuan Basin in the recent 40 decades, J. Southwest Agricultural University, 27, 749–752, https://doi.org/10.11821/xb201105005, 2005.
Skamarock, W. C. and Klemp, J. B.: A time-split nonhydrostatic atmospheric model for weather research and forecasting applications, J. Comput. Phys., 227, 3465–3485, 2008,
Thompson, G., Field, P. R., Rasmussen, R. M., and Hall, W. D.: Explicit forecasts of winter precipitation using an improved bulk microphysics scheme. Part II: Implementation of a new snow parameterization, Mon. Weather Rev., 136, 5095–5115, https://doi.org/10.1175/2008MWR2387.1, 2008.
Wang, J., Feng, J., Yan, Z., and Zha, J.: Urbanization Impact on Regional Wind Stilling: A Modeling Study in the Beijing-Tianjin-Hebei Region of China, J. Geophys. Res.-Atmos., 125, e2020JD033132, https://doi.org/10.1029/2020JD033132, 2020.
Wang, X. R., Hui, E. C.-M., Choguill, C., and Jia, S.-H.: The new urbanization policy in China: Which way forward?, Habitat Int., 47, 279–284, 2015.
Yang, Z. L., Niu, G. Y., Mitchell, K. E., Chen, F., Ek, M. B., Barlage, M., Longuevergne, L., Manning, K., Niyogi, D., Tewari, M., and Xia, X.: The community noah land surface model with multiparameterization options (noah-mp): 2. evaluation over global river basins, J. Geophys. Res., 116, D12110, https://doi.org/10.1029/2010JD015140, 2011.
Yang, L., Smith, J., and Niyogi, D.: Urban Impacts on Extreme Monsoon Rainfall and Flooding in Complex Terrain, Geophys. Res. Lett., 46, 5918–59274, https://doi.org/10.1029/2019GL083363, 2019.
Yuan, C. and Xie, S.: Temporal and spatial visibility trends in the Sichuan Basin, China, 1973 to 2010, Atmos. Res., 112, 25–34, https://doi.org/10.1016/j.atmosres.2012.04.009, 2012.
Zhao, L., Oleson, K., Bou-Zeid, E., Krayenhoff, E. S., and Oppenheimer, M.: Global multi-model projections of local urban climates, Nat. Clim. Change, 11, 152–157, doi.org/10.1038/s41558-020-00958-8, 2021.