the Creative Commons Attribution 4.0 License.
the Creative Commons Attribution 4.0 License.
 | 31 Jan 2022
Weakened impact of the Atlantic Niño on the future equatorial Atlantic and Guinea Coast rainfall
Hugues Goosse
Thierry Fichefet
Fred Kucharski
The Guinea Coast is the southern part of the West African continent. Its summer rainfall variability mostly occurs on interannual timescales and is highly influenced by the sea surface temperature (SST) variability in the eastern equatorial Atlantic, which is the centre of action of the Atlantic Niño mode. Using both historical and scenario (SSP5–8.5) simulations from 31 general circulation models (GCMs) participating in the sixth phase of the Coupled Model Intercomparison Project (CMIP6), we first show that these models present a wet bias during boreal summer. This bias is associated with overly high mean boreal summer SSTs in the eastern equatorial and south Atlantic regions. Next, we analyse the near-term, mid-term and long-term changes of the Atlantic Niño relative to the present-day situation, in a climate with a high anthropogenic emission of greenhouse gases. We find a gradual decrease in the equatorial Atlantic SST anomalies associated with the Atlantic Niño in the future. This result reflects a possible reduction of the Atlantic Niño variability in the future due to a weakening of the Bjerknes feedback over the equatorial Atlantic. In a warmer climate, an anomalous higher sea level pressure in the western equatorial Atlantic relative to the eastern equatorial Atlantic weakens the climatological trade winds over the equatorial Atlantic. As a result, the eastern equatorial Atlantic thermocline is deeper and responds less to the Atlantic Niño events. Among the models that simulate a realistic rainfall pattern associated with the Atlantic Niño in the present-day climate, there are 12 GCMs which project a long-term decrease in the Guinea Coast rainfall response related to the Atlantic Niño. In these models, the zonal 850 hPa wind response to the Atlantic Niño over the equatorial Atlantic is strongly attenuated in the future climate. We also find that 12 other GCMs show no robust change in the patterns associated with the Atlantic Niño. There is a higher confidence in the mid-term and long-term reduction of the rainfall associated with the Atlantic Niño over the Atlantic Ocean than over the Guinea Coast. We also found a projected decrease in the convection associated with the Atlantic Niño in the majority of the models.
- Article
(12091 KB) - Full-text XML
-
Supplement
(20550 KB) - BibTeX
- EndNote


The West African Monsoon (WAM) generally begins in mid-June and is characterized by a rapid shift of the rain band from the coastal areas to the Sahel region (Hansen, 2002; Sultan et al., 2005). In July and August, the development of the Atlantic cold tongue is at its maximum (due to upwelling over the eastern equatorial Atlantic), which leads to higher pressure over the Gulf of Guinea and the coastal regions of West Africa. As a consequence, during July and August, the atmospheric circulation above the Guinea Coast is characterized by a downward flow at upper levels. This leads to the so-called “little dry season” (Adejuwon and Odekunle, 2006; Fink et al., 2017; Wainwright et al., 2019), during which the Guinea coast rainfall decreases in magnitude compared to its mean over the April–May–June season. Over the 20th century, the interannual variability of the Guinea Coast rainfall was strongly influenced by the sea surface temperature (SST) fluctuations in the eastern equatorial Atlantic (Giannini, 2003; Polo et al., 2008; Suárez-Moreno et al., 2018). This oceanic area corresponds to the centre of action of the leading oceanic mode of variability in the tropical Atlantic (Zebiak, 1993). Several terms are used to define this oceanic mode of variability, namely, Atlantic equatorial mode (hereafter referred to as AEM), Atlantic Niño and Atlantic zonal mode (Servain et al., 2000; Murtugudde et al., 2001; Ruiz-Barradas et al., 2000). We will use both the Atlantic Niño and AEM terms interchangeably in this study, without any difference between them. In positive phases of the AEM, the eastern equatorial Atlantic is warmer than in a normal situation and the anomaly is amplified through the Bjerknes feedback (Bjerknes, 1969; Keenlyside and Latif, 2007; Lübbecke et al., 2018). The positive SST anomalies lower the surface pressure gradient over the equatorial Atlantic and thus weaken the equatorial trade winds. This leads to westerly anomalies to the west of the abnormal warm surface area, which in turn deepens the thermocline to the east. In consequence, the cooling due to the oceanic upwelling is reduced, which reinforces the initial warming. Moreover, another mechanism involving the southward advection of warm seawater from the subtropical North Atlantic can lead to the development of some AEM events (Richter et al., 2012). Other theories suggest an important contribution of the equatorial oceanic Rossby and Kelvin waves (Foltz and McPhaden, 2010a, b; Burmeister et al., 2016) and thermodynamic processes (Nnamchi et al., 2015) to the AEM variability. In order to quantify the relative contributions of the different processes driving the AEM variability, Jouanno et al. (2017) highlighted the dominant role of the dynamical forcing (i.e. the Bjerknes feedback) relative to the thermodynamic processes (i.e. air–sea heat flux exchanges). They argued that biases in the atmospheric components of most of the GCMs participating in the CMIP project lead to the underestimation of the dynamic part of the Atlantic Niño forcings.
The general response of the atmosphere to Atlantic Niño positive phases is a modification of the Walker circulation, characterized by rising motion and upper-level divergence in the Atlantic region. In the central Pacific, a compensating upper-level convergence and sinking motion also triggers a Gill-type response in vorticity (Gill, 1980). The Gill-type response is characterized by a pair of upper-level anticyclones to the west and a pair of upper-level cyclones to the east of the abnormal warm oceanic regions. These upper-level divergence and vorticity responses are related to each other by Sverdrup balance (Kucharski et al., 2009; Losada et al., 2010b; Hamouda and Kucharski, 2019). The divergence and vorticity responses are generally baroclinic and are of opposite sign at low levels, meaning in the Indian region a low-level anticyclone is present, which leads to reduced Indian Monsoon rainfall (Kucharski et al., 2007, 2008, 2009). On the other hand, the sinking motion in the central Pacific can lead to easterly surface winds in the central-western Pacific, which could in turn potentially induce a La Niña event (Rodríguez-Fonseca et al., 2009). Finally, the development of a La Niña event due to a warm phase of the Atlantic Niño would favour positive rainfall anomalies over the Indian Peninsula, which would counteract the negative rainfall anomalies associated with the Atlantic Niño (Ding et al., 2012).
Conversely, Tokinaga et al. (2019) found that the multi-year La Niña conditions could trigger a positive Atlantic Niño. Considering the tropical basins separately, an anomalous warming of the eastern equatorial Atlantic induces a dipolar rainfall response over West Africa in boreal summer: a decrease in the rainfall in the Sahel region and an increase in the rainfall over the Guinea Coast (Losada et al., 2010a). However, below-normal sea surface temperatures in the eastern tropical Pacific lead to an increase in the rainfall in the Sahel. After the 1970s, the coupling between the eastern equatorial Atlantic and the eastern tropical Pacific has strengthened, and the two basins are characterized by an opposite phase relationship. Therefore, a positive phase of the Atlantic Niño is associated with negative SST anomalies in the eastern tropical Pacific. This results in rainfall anomalies of opposite signs over the Sahel, which damps the West African dipolar rainfall response associated with the Atlantic Niño (Losada et al., 2012). By contrast, statistical analyses have demonstrated that the relation between SST changes in the eastern equatorial Atlantic and the rainfall in the Guinea Coast during the boreal summer is stationary (Diatta and Fink, 2014; Rodrïguez-Fonseca et al., 2015; Worou et al., 2020).
Results from the general circulation models (GCMs) participating in the Coupled Model Intercomparison Project (CMIP) show that from the fifth phase (CMIP5) to the sixth phase (CMIP6), the surface temperature biases have been reduced over the tropical Atlantic, as pointed out by Richter and Tokinaga (2020) in an analysis of the pre-industrial control experiment performed with 33 models. Nevertheless, they found that in many models a warm bias remains in the east of the basin and along the western coast of Africa (Gulf of Benguela, western boundaries of West Africa), while cold biases exist in the west of the basin. Despite the presence of these biases, the models have improved their representation of the spatial patterns of the Atlantic Niño mode. Several years earlier, Kucharski and Joshi (2017) showed that the South Atlantic Ocean Dipole (SAOD) was already well represented in CMIP5 models, and the new analyses thus confirm this good performance. The SAOD involves the SST variability in the eastern equatorial Atlantic and in the southwestern Atlantic, off the Argentina–Uruguay–Brazil coast (Nnamchi and Li, 2011; Nnamchi et al., 2011).
Tokinaga and Xie (2011) have revealed a weakening of the AEM variability during recent decades. They argued that this decrease over the period 1950–2009 was caused by the anthropogenic aerosol forcing, whose cooling effect in the northern Atlantic was greater than in the southern Atlantic. As a result, the SST meridional gradient over the tropical Atlantic weakened and led to a relaxation of the equatorial trade winds and a deepened thermocline to the east. It was followed by a reduction of the upwelling of cold water from the deepest levels, which reinforces the positive SST trend and reduces the AEM variability. On the other hand, the exchange of the turbulent latent heat flux between the surface and the atmosphere represents an important negative feedback in the growing of the SST anomalies during the AEM events. Prigent et al. (2020) attributed the decreased variability of the AEM since 2000 to a weakening of the Bjerknes feedback in the equatorial Atlantic (like Tokinaga and Xie, 2011) and also to an increased cooling of the sea surface due to an increased latent heat flux release to the atmosphere. These authors found a reduced sensitivity of winds to the AEM in the western equatorial Atlantic basin, potentially due to a northward migration of the mean intertropical convergence zone (ITCZ), and a westward migration of the Walker circulation rising branch in the tropical Atlantic. In the eastern equatorial Atlantic, they found a reduced coupling between the surface and the thermocline.
Rainfall changes over the Guinea Coast during recent decades follow the observed decrease in the AEM variability (Tokinaga and Xie, 2011; Worou et al., 2020), underlying the strength of the AEM impact on the rainfall activity in this area (Nnamchi et al., 2021a). Thus, the question arises whether the Atlantic Niño will change in the future and what the implications for the tropical hydroclimate will be, particularly over the Guinea Coast. Mohino and Losada (2015) have shown an eastward displacement of the positive rainfall anomalies induced by the Atlantic Niño in the tropical Atlantic under a warmer climate. Another study has revealed a weakening of the relation between Atlantic Niño and El Niño events in a warmer climate, due to a faster warming of the mid-troposphere relative to the low levels, leading to a more stabilized atmosphere and a reduced convection (Jia et al., 2019).
In the present study, we provide a more detailed analysis of the future changes in the Atlantic Niño and their impact on the rainfall over the tropical Atlantic and land masses in the Guinea Coast by using results of GCMs obtained within CMIP6. The near-term, mid-term and long-term changes are analysed separately. In Sect. 2, we describe the data and analysis strategy used in our study. Section 3 focuses on the performance of the models in simulating the Guinea Coast rainfall and the SST in the eastern equatorial Atlantic regions, as well as the SST pattern associated with the Atlantic Niño. In Sect. 4, we evaluate the rainfall patterns associated with the Atlantic Niño in the CMIP6 models over the last 30 years of the historical simulations conducted with these models. We highlight the group of models that simulate a realistic rainfall pattern associated with AEM over the Guinea Coast. Section 5 discusses the modelled future changes of the Atlantic Niño and their impact on the rainfall over the tropical Atlantic and Guinea Coast, as well as the associated mechanisms. In the last section, we draw the main conclusions.
2.1 CMIP6 data
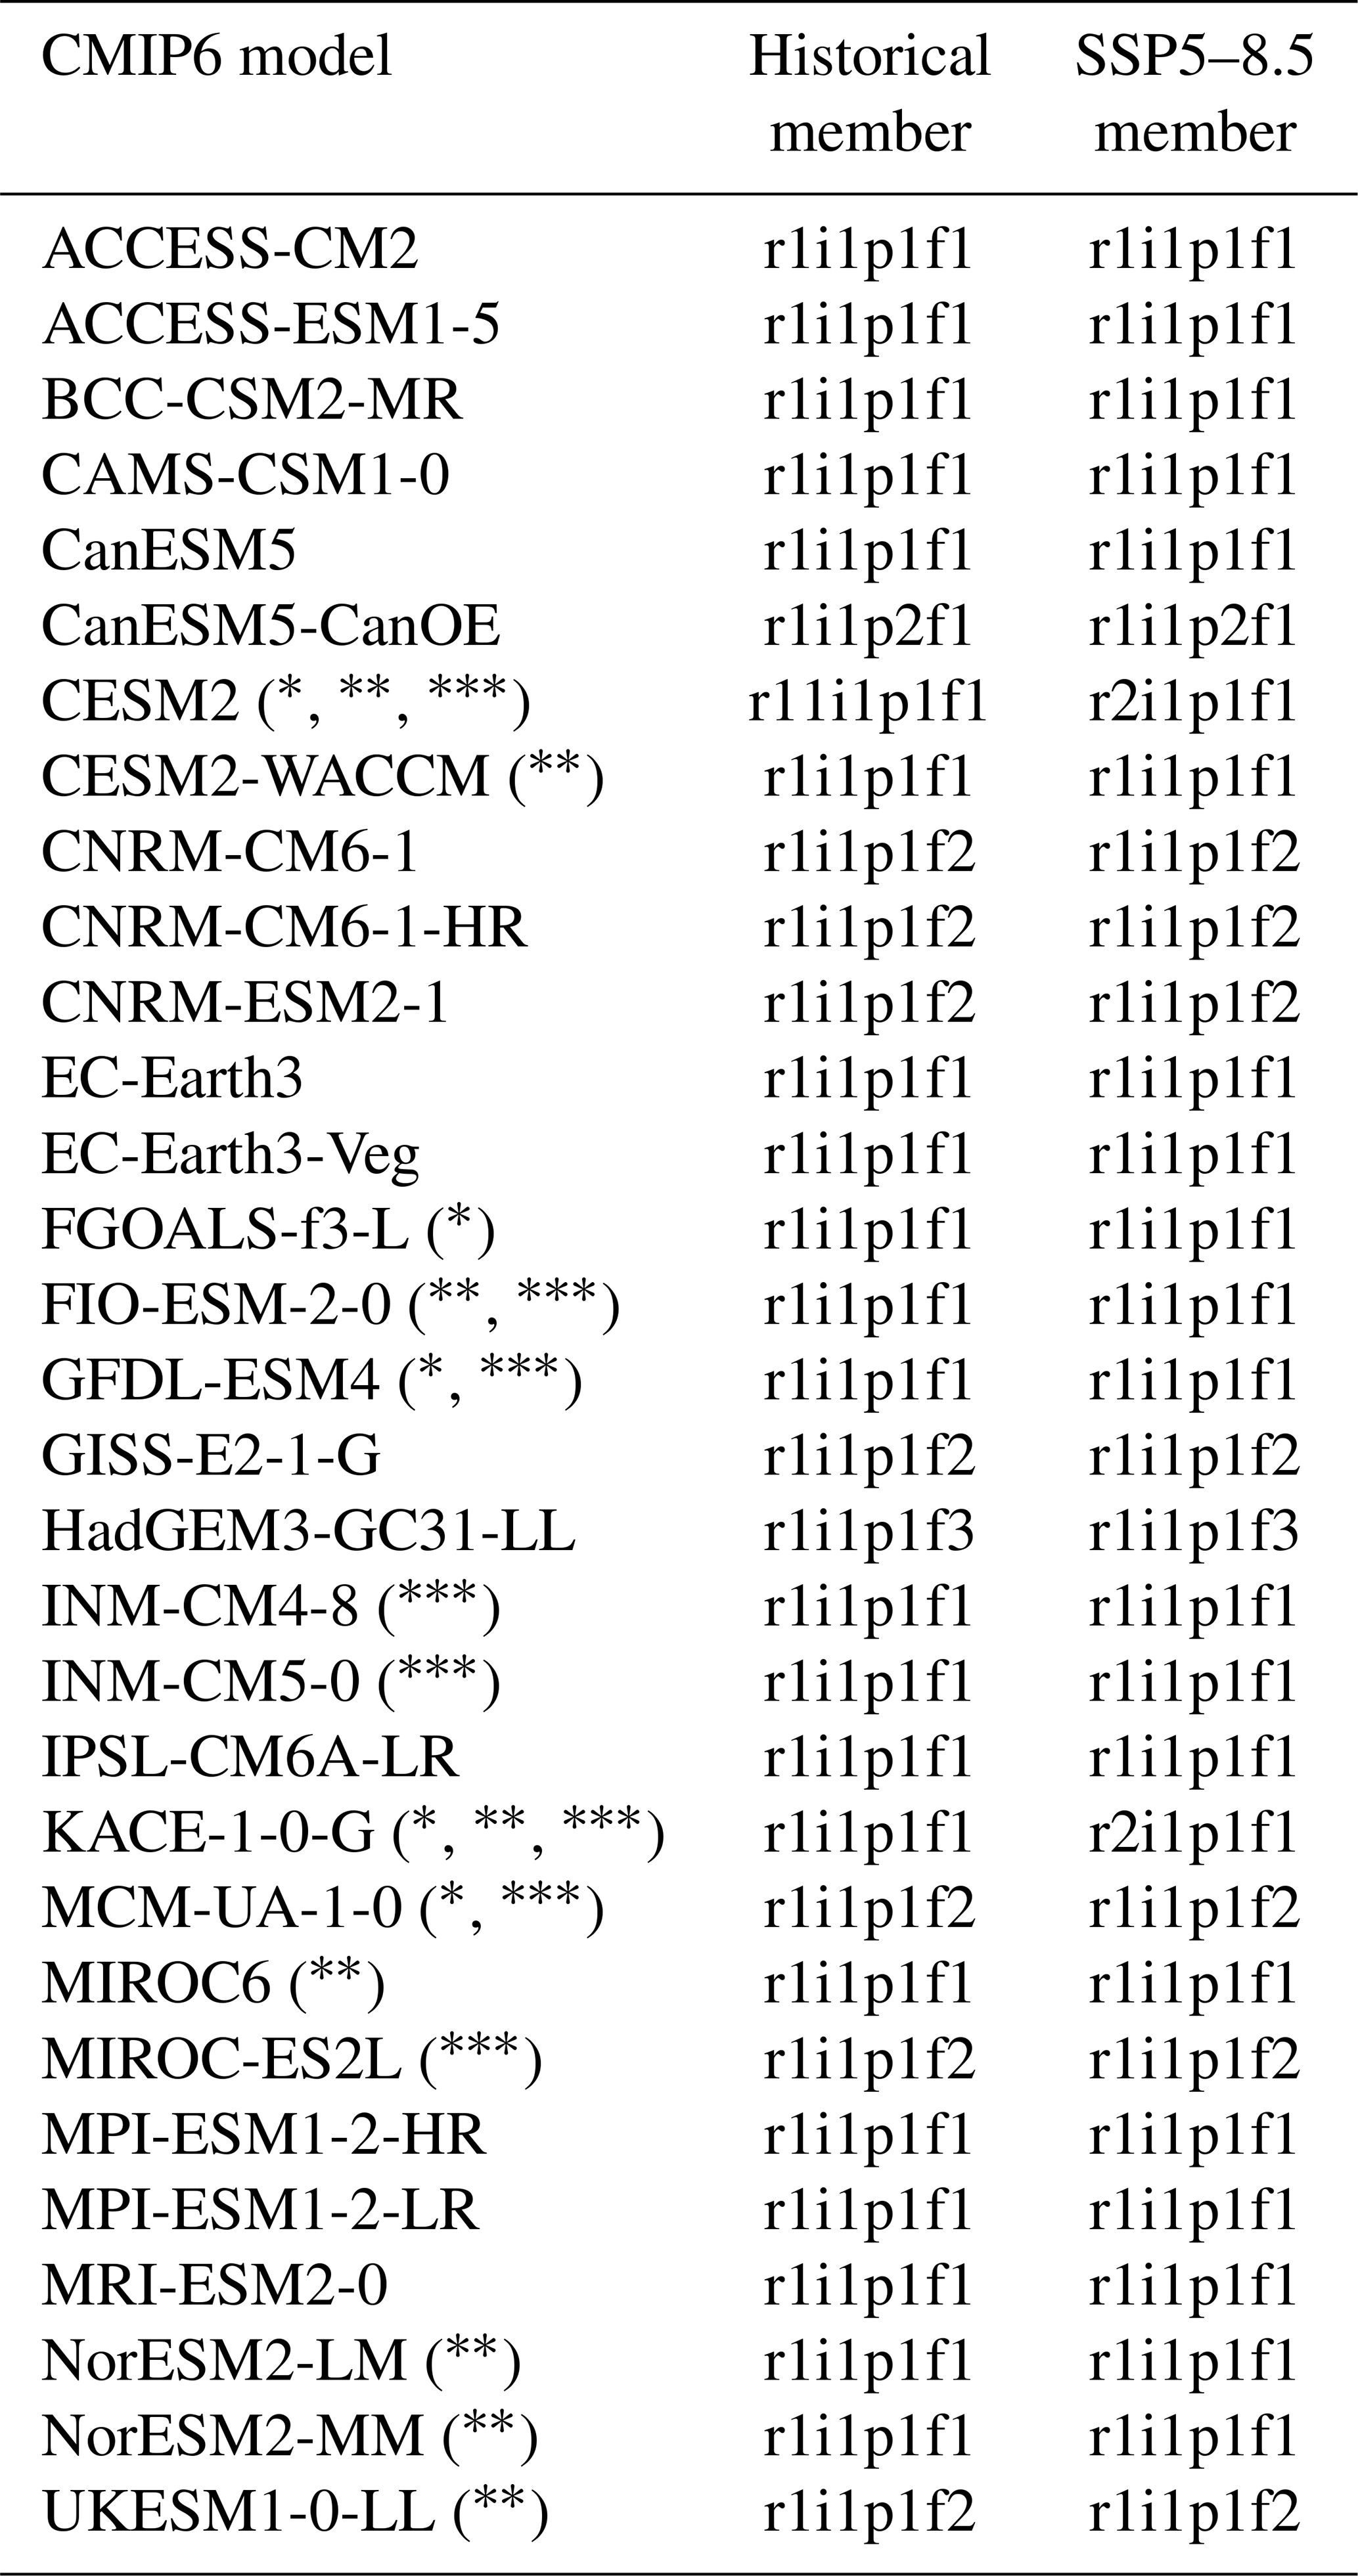
This study focusses on the July–August–September (JAS) season, during which the rainfall variability over the Guinea Coast and all of West Africa peaks (Nnamchi et al., 2021a). Outputs from 31 GCMs participating in CMIP6 are analysed. Two kinds of simulations are considered: historical and high-emission scenario climate experiments. The historical climate simulations cover the 1850–2014 period, with observed natural and anthropogenic forcings. The climate projections are based on the Shared Socioeconomic Pathway 5, with a global radiative anthropogenic forcing that reaches 8.5 W m−2 at the end of the 21st century (SSP5–8.5). The SSP5–8.5 simulations start in 2015 and assume a world with an intense industrial activity based on fossil fuels and high economic growth (O'Neill et al., 2016). Only one member of each model is considered for each period. The description of the data is available in Table 1. The CMIP6 data are available on the Earth System Grid Federation (ESGF) portals (e.g. https://esgf-node.llnl.gov/search/cmip6/, last access: 18 March 2021).
Table 1CMIP6 models and members of historical and SSP5–8.5 simulations. An asterisk (*) indicates models for which the sea surface height variable was not yet available at the time of this study. Models for which, on the one hand, the sea level pressure and the 10 m horizontal wind variables, and, on the other, the mixed layer depth variable were not used for the mean state change analyses are indicated by two asterisks () and three asterisks (), respectively. The other variables used are rainfall, sea surface temperature, 850 hPa specific humidity, and 850 and 200 hPa horizontal wind components.
2.2 Reanalysis data
The ERA5 dataset, a reanalysis product from the European Centre for Medium-Range Weather Forecasts (ECMWF, Hersbach et al., 2020), is used as a reference to evaluate the performance of the CMIP6 models in simulating the surface and atmospheric fields under present-day conditions. ERA5 has replaced ERA-Interim (Dee et al., 2011), which has been widely used to study the characteristics of the West African climate (Manzanas et al., 2014; Lavaysse et al., 2015; Kebe et al., 2016; Raj et al., 2018; Maranan et al., 2018; Diakhaté et al., 2019, 2020; Wainwright et al., 2019). ERA5, for instance, shows an improvement of the rainfall representation over Burkina Faso (Tall et al., 2019), which is a part of the Sahelian region. ERA5 atmospheric and oceanic variables can be retrieved from the Copernicus Climate Data Store (https://cds.climate.copernicus.eu/cdsapp#!/home, last access: 30 July 2020). We also use the monthly sea surface height (SSH) data from the Ocean ReAnalysis System 5 (ORAS5, ECMWF, Zuo et al., 2019). These SSH data can be retrieved from the Integrated Climate Data Center (ICDC) at the University of Hamburg (https://icdc.cen.uni-hamburg.de/thredds/catalog/ftpthredds/EASYInit/oras5/catalog.html, last access: 10 May 2021).
2.3 Analysis strategy
The evaluation of the present-day climate simulations is based on the last 30 years of the historical climate experiments (1985–2014). Three different periods are considered for the future climate analyses: the near-term (2015–2039), mid-term (2040–2069) and long-term (2070–2099) periods. Prior to any diagnostic over each period, the data are interpolated to the same grid of 1∘ resolution. Except for the analysis of the annual cycles and the seasonal means of the various surface and atmospheric fields, the climatological monthly mean is first removed from each dataset, for each considered period. The resulting anomalies are then linearly detrended and averaged over 3 months, July–August–September (JAS). We also found that there is no substantial difference between the residuals of the SST and rainfall indices, when the linear or the quadratic trends are removed (Figs. S1–S4 in the Supplement). Therefore, for simplicity, we considered detrending the different datasets linearly. The choice of the JAS season is based on the fact that in the CMIP6 models, the Guinea Coast rainfall response to the June–July–August or July–August–September SST variability in the eastern equatorial Atlantic is at its maximum over JAS (Fig. S5). Much of the statistics in this paper are based on linear regressions onto the standardized JAS SST index of the Atlantic Niño. This index is defined as an average of SST anomalies over the ATL3 region (Table 2, Zebiak, 1993). The GISS-E2-1-G model is discarded from the analyses. This model shows no significant rainfall response to the Atlantic Niño over the tropical Atlantic and the West Africa, in contrast to ERA5.
The difference of the wind divergence between 200 and 850 hPa levels (DIV) is used to evaluate the direction and intensity of the vertical air motion (Gómara et al., 2017; Diakhaté et al., 2019). Positive values of this difference (upper level minus low level) mean that there is a low-level convergence of the wind, an ascent and a divergence at high level. The spread of the 30 GCMs is evaluated with the interquartile range (IQR) metric. Similar to Jia et al. (2019), a sign-dependent average (SDA) of the rainfall regression pattern is utilized to select the models, based on their robust rainfall response to the Atlantic Niño over the Guinea Coast. This technique is described in three steps. First, the JAS rainfall anomalies are regressed onto the standardized JAS ATL3 SST index. Secondly, the rainfall regression coefficients that are significant at 95 % confidence level (two-sided Student test) are averaged over the Guinea Coast. This gives a whole average coefficient. Thirdly, over the Guinea Coast, only significant regression coefficients that have the sign of the whole average coefficient are averaged. This gives the sign-dependent average coefficient. The sign-dependent average is set to zero if there is no significant regression coefficient.
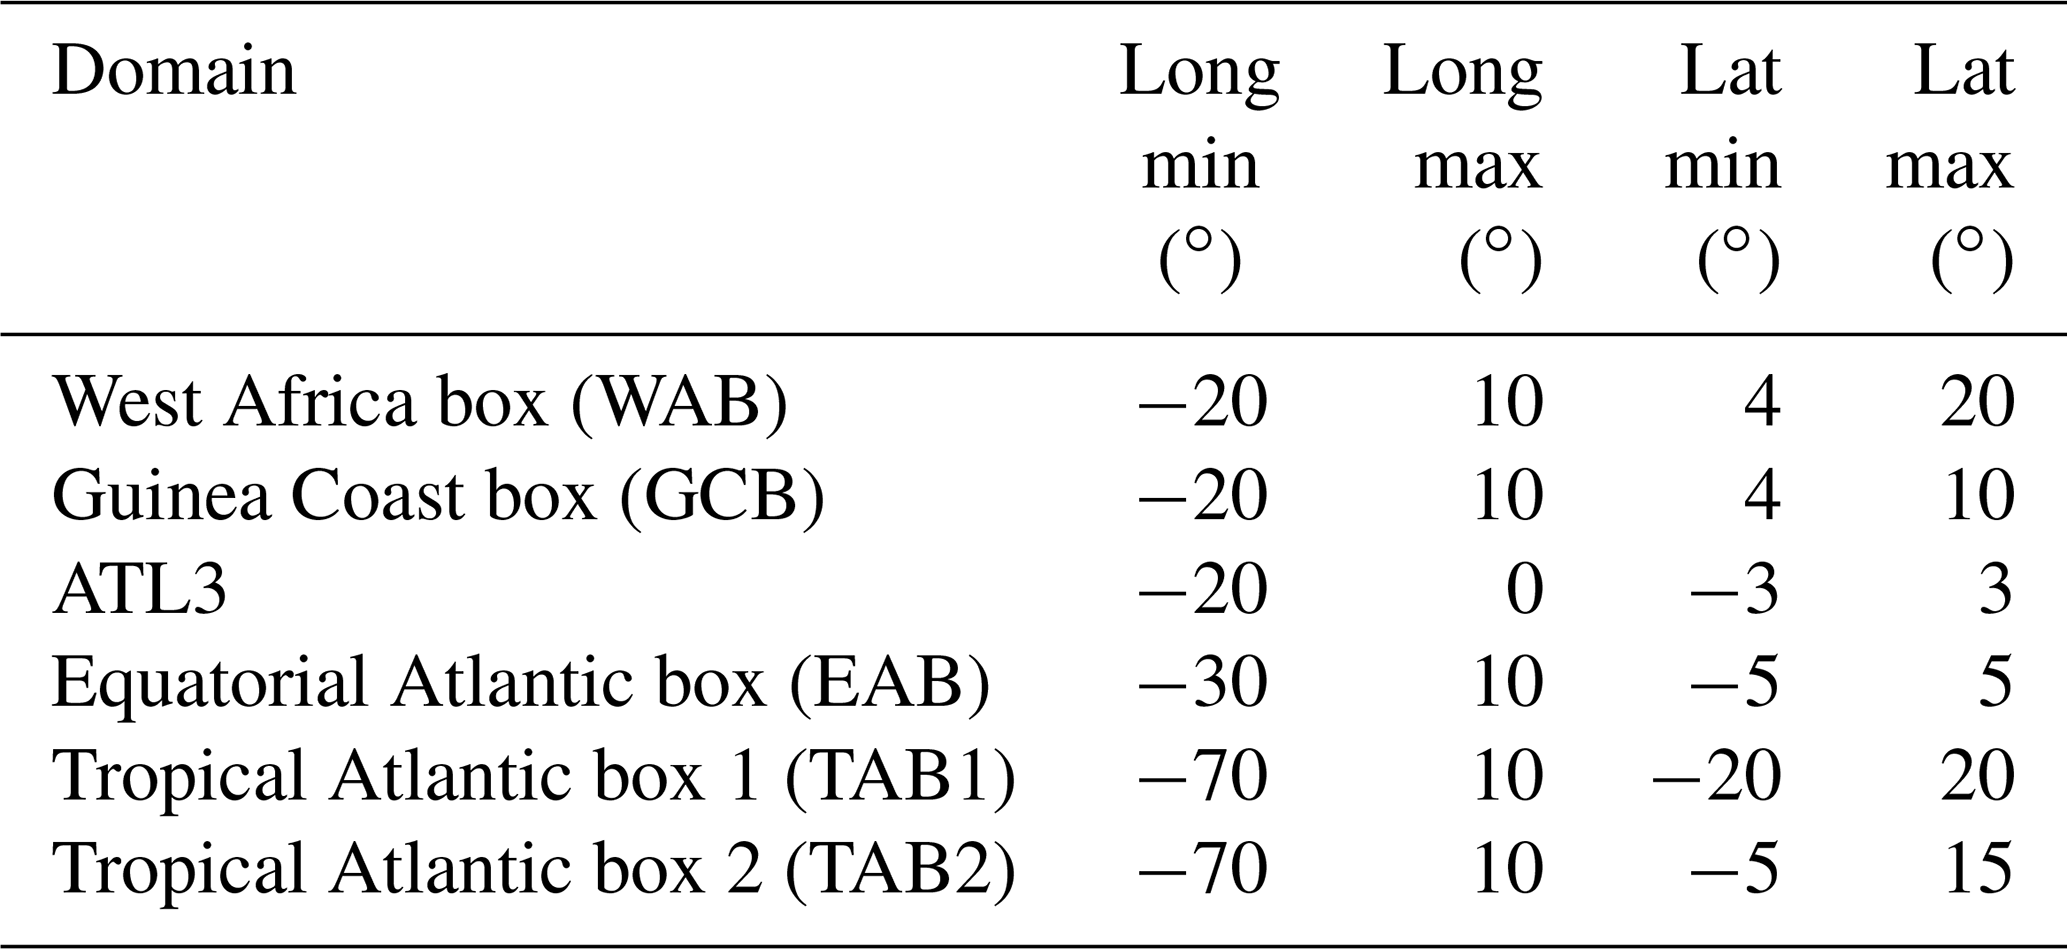
For a given period, when the regression patterns are averaged over some subsets of models, we determine the robustness of the result by adapting the method of Tebaldi et al. (2011). The signal in areas where at least 50 % of the models show a significant regression (two-sided Student test at 95 % confidence level) and where at least 80 % of the models agree on the sign of the mean is considered as robust. When we consider the change between two periods, the sign of the change averaged over a subset of models is considered as robust if at least two-thirds of the models agree on the sign of the multimodel mean (Rehfeld et al., 2020), and at least the change of the multimodel mean is significant at 95 % confidence level according to a two-sided Welch t test. Moreover, the percentage of change of the ATL3 SST index standard deviation between two periods is computed as , where σhis is the standard deviation of the JAS ATL3 SST index in the 1985–2014 period, and σfut the standard deviation of the JAS ATL3 SST index in a future period (the near-term, mid-term and long-term periods). Finally, coordinates of different geographic areas used in the present study are defined in Table 2. In particular, the tropical Atlantic box 1 (TAB1) and 2 (TAB2) are large areas over which we validate the SST and rainfall patterns related to the Atlantic Niño.
Moreover, we define different groups of models based on their rainfall SDA over a region. We aim to understand if different groups of models simulate the rainfall pattern related to the Atlantic Niño over the equatorial Atlantic and the Guinea Coast in different ways and in particular if a different simulation of the current state has some implications on the simulated future changes in rainfall patterns. We also aim to highlight the differences in the key physical mechanisms between the groups. Focusing on the Guinea Coast for example, we first identify the climate models which are able to realistically simulate the observed rainfall pattern related to the Atlantic Niño in the Guinea Coast over the past decades (the group GC+). In observations, a positive rainfall anomaly over the Guinea Coast is related to a warm phase of the Atlantic Niño (and vice versa). The group GC− indicates models which present a negative rainfall pattern associated with a warm phase of the Atlantic Niño. For the future changes in the AEM-related rainfall pattern over the Guinea Coast, we separated models which present an enhancement of the positive rainfall pattern (GC) from models which present a weakening of the rainfall pattern (GC). Then we tried to understand the reasons for these changes and the differences between the different categories. A similar argument is applied to the ocean.
3.1 Rainfall in the Guinea Coast
The observed Guinea Coast rainfall annual cycle is characterized by a bimodal structure with two maxima in June and September respectively. Many of the CMIP6 models overestimate the magnitude of the rainfall and rainfall standard deviation in this region during the boreal summer (Fig. S6). Unlike ERA5, the CMIP6 ensemble mean (EnsMean) depicts a plateau of 9 mm d−1 in July and August, when much of the wet biases occur. Over the Guinea Coast, the positive JAS mean rainfall bias is present in 19 GCMs. More specifically, there are 24 models with a wet bias between 10∘ W and 0∘ E, compared to 14 models in the western (−20 to −10∘ W) and eastern (0–10∘ E) Guinea Coast (not shown).
The CMIP5 models are also known to overestimate the rainfall in coastal areas of West Africa during the “little dry season” (Sow et al., 2020). Wainwright et al. (2019) have demonstrated that the misrepresentation of the July–August Guinea Coast rainfall in these models comes from the positive SST biases in the Atlantic Ocean, which strengthen the rising motions over the Guinea Coast and increase the rainfall. Consistently, the CMIP6 ensemble mean exhibits a positive (negative) mean SST bias in the eastern (western) part of the tropical Atlantic, as depicted in Fig. 1. This figure also shows low-level anomalous northerlies that reinforce the convergence over the Guinea Coast. Analysis of the 10 m wind biases shows anomalous westerlies to the west of the warm bias area (Fig. S7). This result is consistent with the conclusions obtained from Richter and Tokinaga (2020), who analysed the CMIP6 pre-industrial control simulations.
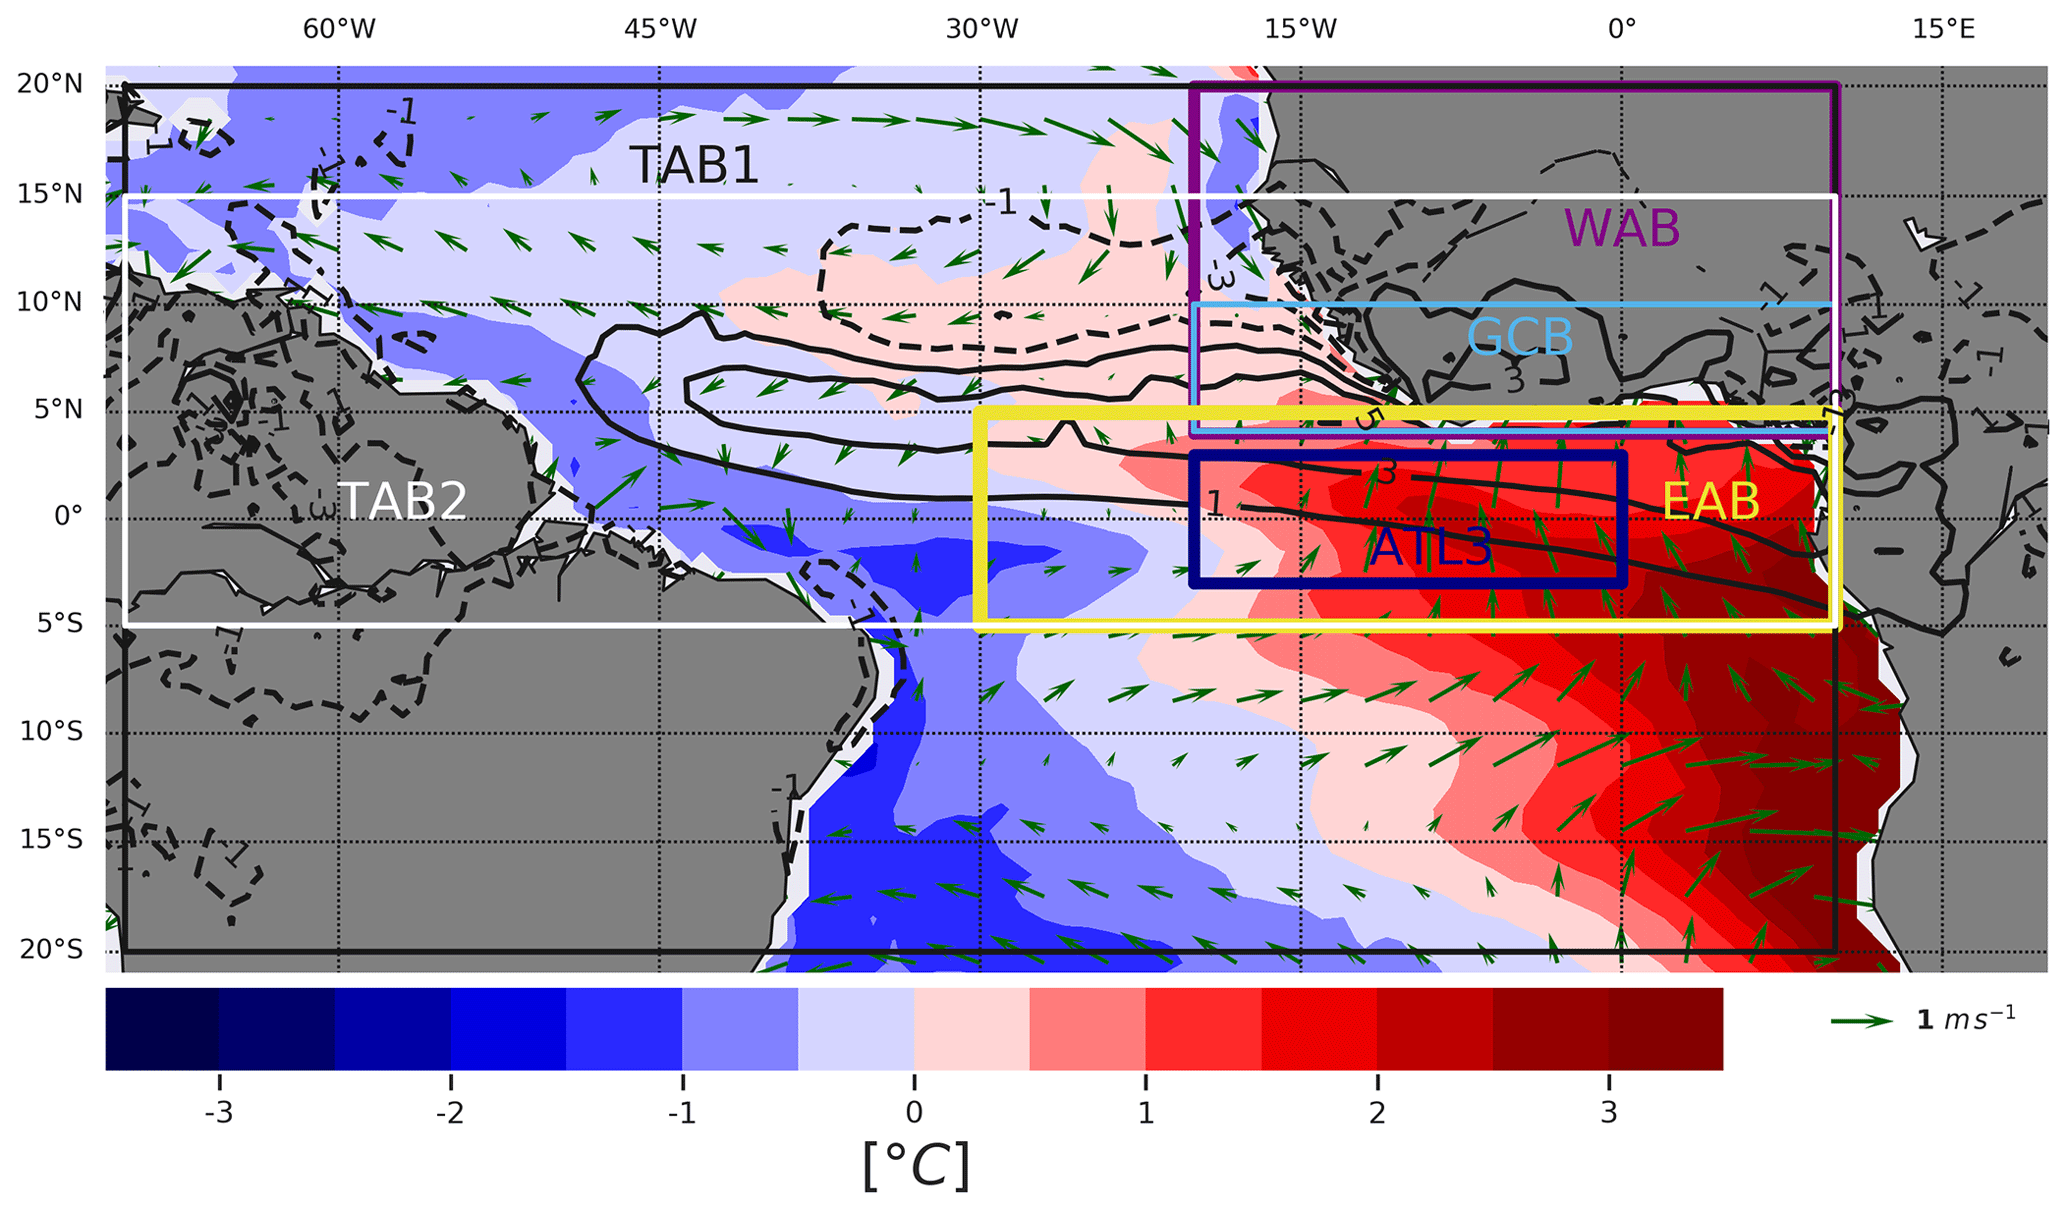
Figure 1Mean biases (relative to ERA5) of the ensemble mean of the 30 GCMs for the JAS SST (in colours), rainfall (in black contours) and 850 hPa wind (arrows) over 1985–2014. Boxes in black, white, yellow, blue, cyan and magenta correspond to the TAB1, TAB2, EAB, ATL3, GCB and WAB regions, respectively.
In general, the JAS spatial structure of the West African rainfall is well reproduced by the models (Fig. S8a). The spatial correlation between the mean JAS rainfall in the 30 GCMs and that of ERA5 lies between 0.68 and 0.96 (Fig. S8b). The multimodel ensemble mean of the JAS rainfall also shows a good performance, with a correlation of 0.92 with ERA5. Moreover, the standard deviation of the JAS West African rainfall ranges between 2.79 and 5.75 mm d−1 for the 30 GCMs. The corresponding value for the multimodel ensemble mean is 3.76 mm d−1, which corresponds to 93 % of the spatial rainfall variability in ERA5.
3.2 SST in the eastern equatorial Atlantic
In ERA5, the annual cycle of the SST in the ATL3 area (Fig. S9a) shows a cold tongue which develops from April when the mean SST over the ATL3 region is about 29 ∘C and reaches its lowest value in August, around 24 ∘C. The CMIP6 EnsMean overestimates the SST annual cycle in this region, with a pronounced warm bias in June–September (Fig. 1). The correlation between the annual cycle values in each model with ERA5 ranges from 0.88 to 0.99 (Fig. S9c). This result indicates that the phasing of the SST in the ATL3 region is relatively well simulated by the models. Moreover, the CMIP6 ensemble mean of the monthly variability of the ATL3 SST index peaks in June–July–August and is delayed 1 month relative to ERA5 (Fig. S9b). There is a second peak in November, corresponding to the winter Atlantic Niño which may have impacted the ENSO events and the rainfall in South America, mainly during a few decades in the mid-20th century (Okumura and Xie, 2006; Hounsou-Gbo et al., 2020). Throughout the year, the monthly SST standard deviation in the models covers a wide range of values, with different phasings (Fig. S9d).
3.3 JAS SST pattern associated with the Atlantic Niño
The spatial SST pattern characteristic of the summer Atlantic Niño is derived by regressing the JAS SST anomalies onto the standardized JAS ATL3 SST index (Fig. 2). The SST pattern in ERA5 shows positive anomalies along the Equator and off coastal areas in the southeastern Atlantic Ocean. Most of the positive SST anomalies vary between 0.1 and 0.4 ∘C.
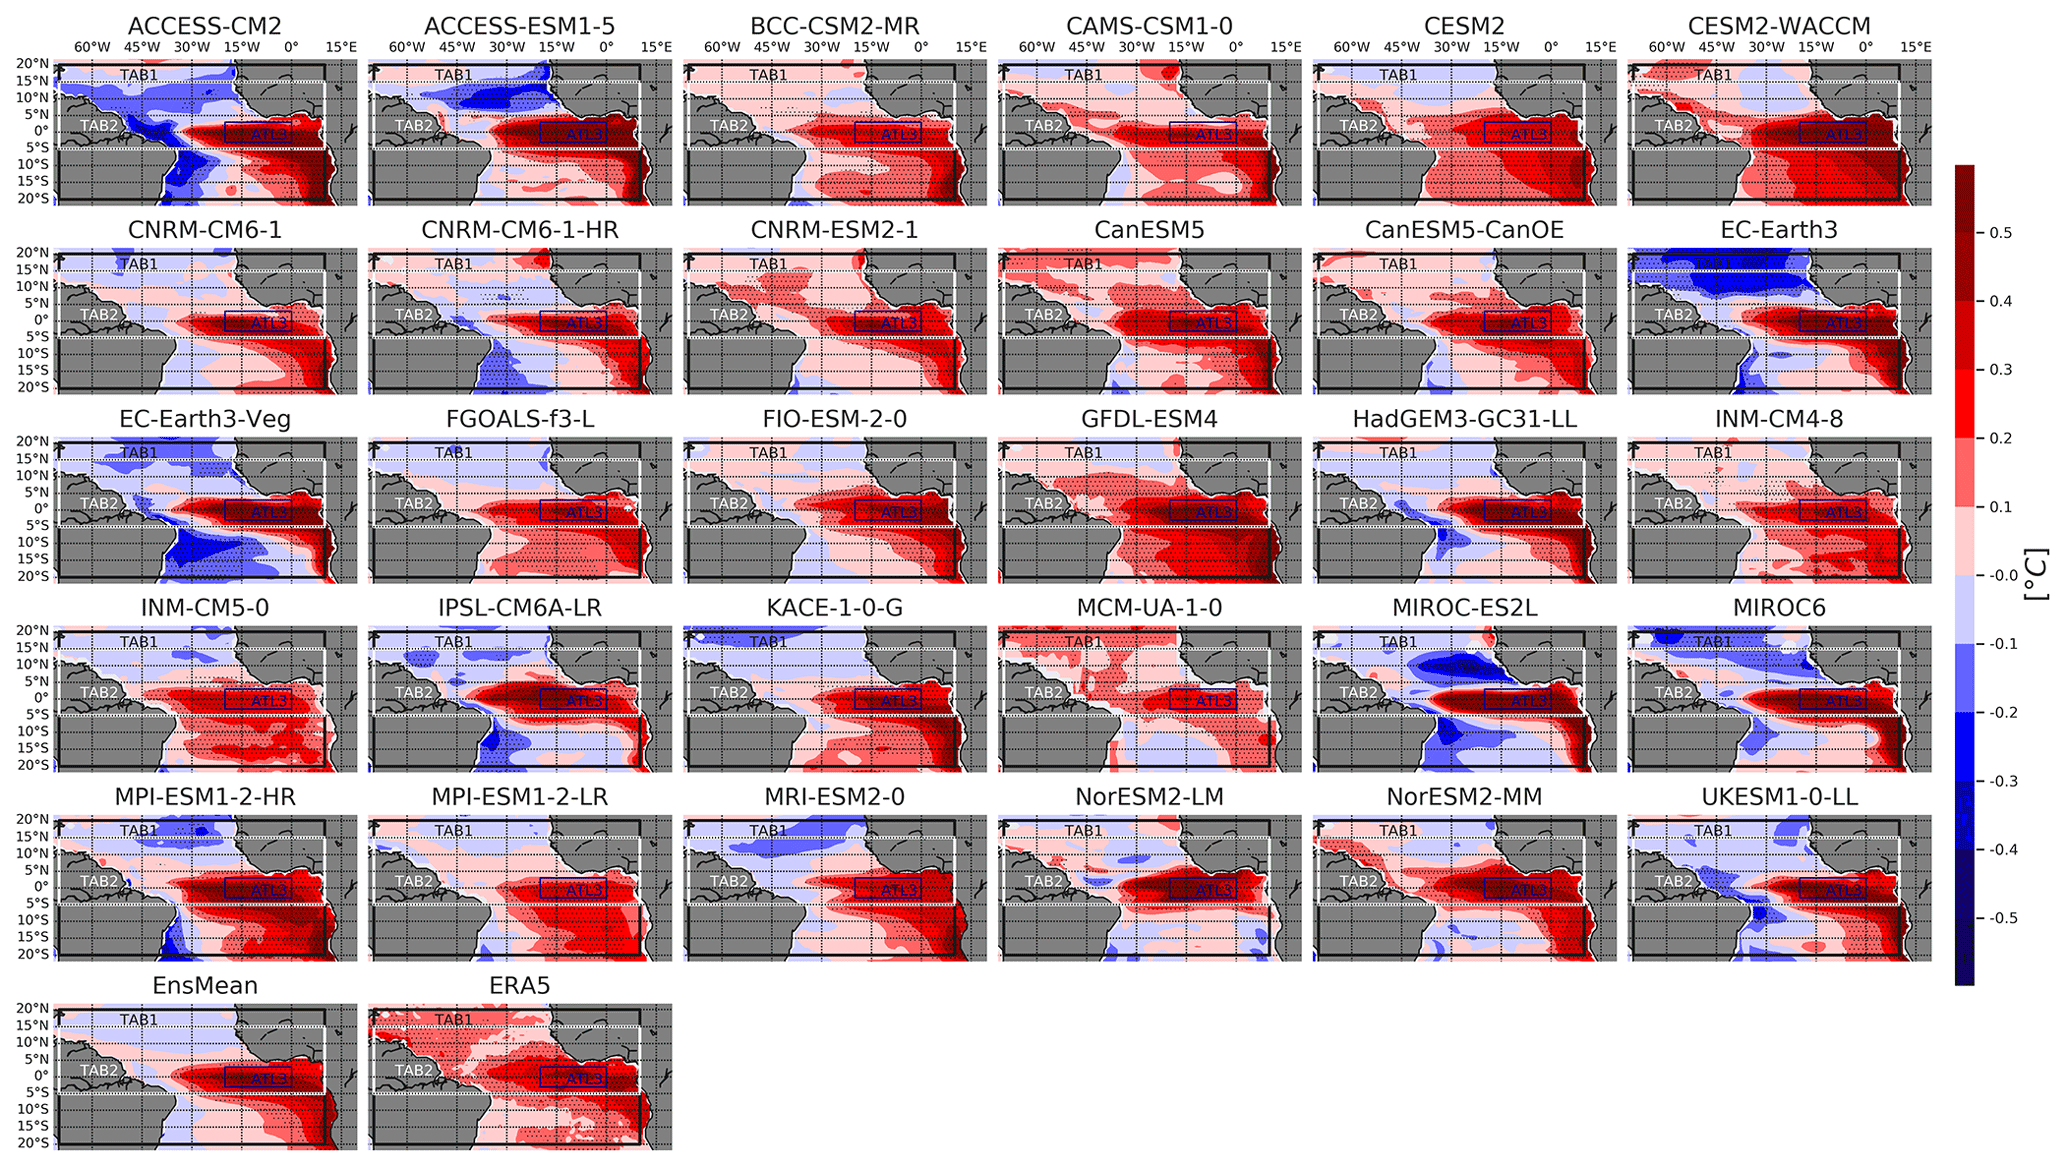
Figure 2Regression maps of the JAS SST anomalies onto the standardized JAS ATL3 SST index. Stippling in the EnsMean indicates grid points where more than 50 % of the models show significant regression at 95 % confidence level and more than 80 % of the models agree on the sign of the regression coefficient. Stippling in each model and ERA5 indicates significant regression coefficients at 95 % level.
The CMIP6 models exhibit various SST imprints related to the Atlantic Niño over the tropical Atlantic (the TAB1 region; see Table 2). Some models display a uniform sign of the significant SST anomalies over TAB1 (e.g. CAMS-CSM1-0, CESM2, FIO-ESM-2-0). In addition to the warming in the equatorial Atlantic, other models present negative SST anomalies in the tropical north Atlantic (e.g. ACCESS-ESM1-5), southwest Atlantic (e.g. HadGEM3-GC31-LL), or both north and southwest Atlantic (e.g. ACCESS-CM2, EC-Earth3, MIROC-ES2L). Overall, the performance of the models in representing the AEM SST pattern is relatively good (Fig. 3). The EnsMean SST pattern is highly correlated with the SST pattern in ERA5, with a correlation value of 0.8. Except for GISS-E2-1-G (not shown), the spatial correlation between the AEM SST pattern in each model and ERA5 over the TAB1 region ranges from 0.5 to 0.9. The standard deviation of the spatial SST anomalies related to the AEM in the TAB1 region amounts 0.1 ∘C in ERA5. In 29 models, this spatial variability of the anomalous SST pattern is 0.01 to 0.2 ∘C higher than that in ERA5. In contrast, the spatial variability of the AEM-SST pattern in MCM-UA-1-0 is 0.02 ∘C lower than that in ERA5.
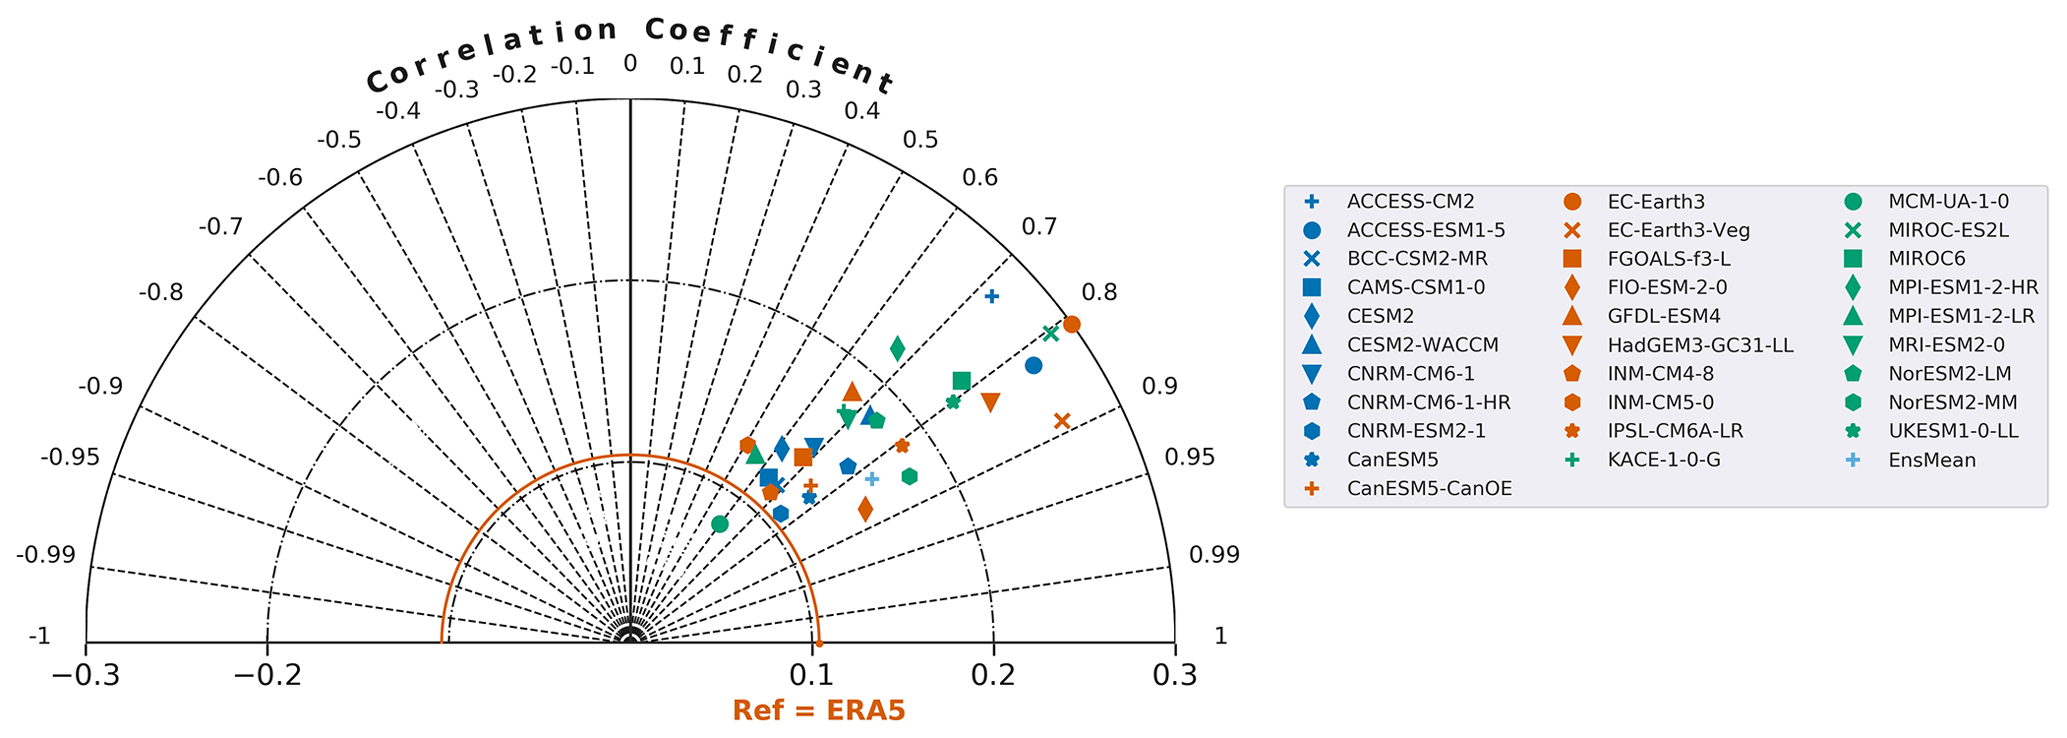
Figure 4 displays the regression maps of the JAS rainfall anomalies onto the standardized JAS ATL3 SST index, computed for the 1985–2014 period. In the reanalysis ERA5, the Atlantic Niño positive phases limit the northward progression of the West African Monsoon flow, which leads to an anomalous increase in the rainfall over the Guinea Coast. The positive rainfall pattern associated with the Atlantic Niño extends to the ocean, from the Equator up to 10∘ N and from the West African coast to 45∘ W. Moreover, while the rainfall anomalies in ERA5 are generally positive over the ocean in the TAB2 area (see Table 2), a majority of the models depict a dipolar structure of the rainfall pattern, consistent with Mohino and Losada (2015), among others. In these models, negative rainfall anomalies are present north of the band of positive values, between 5 and 15∘ N.
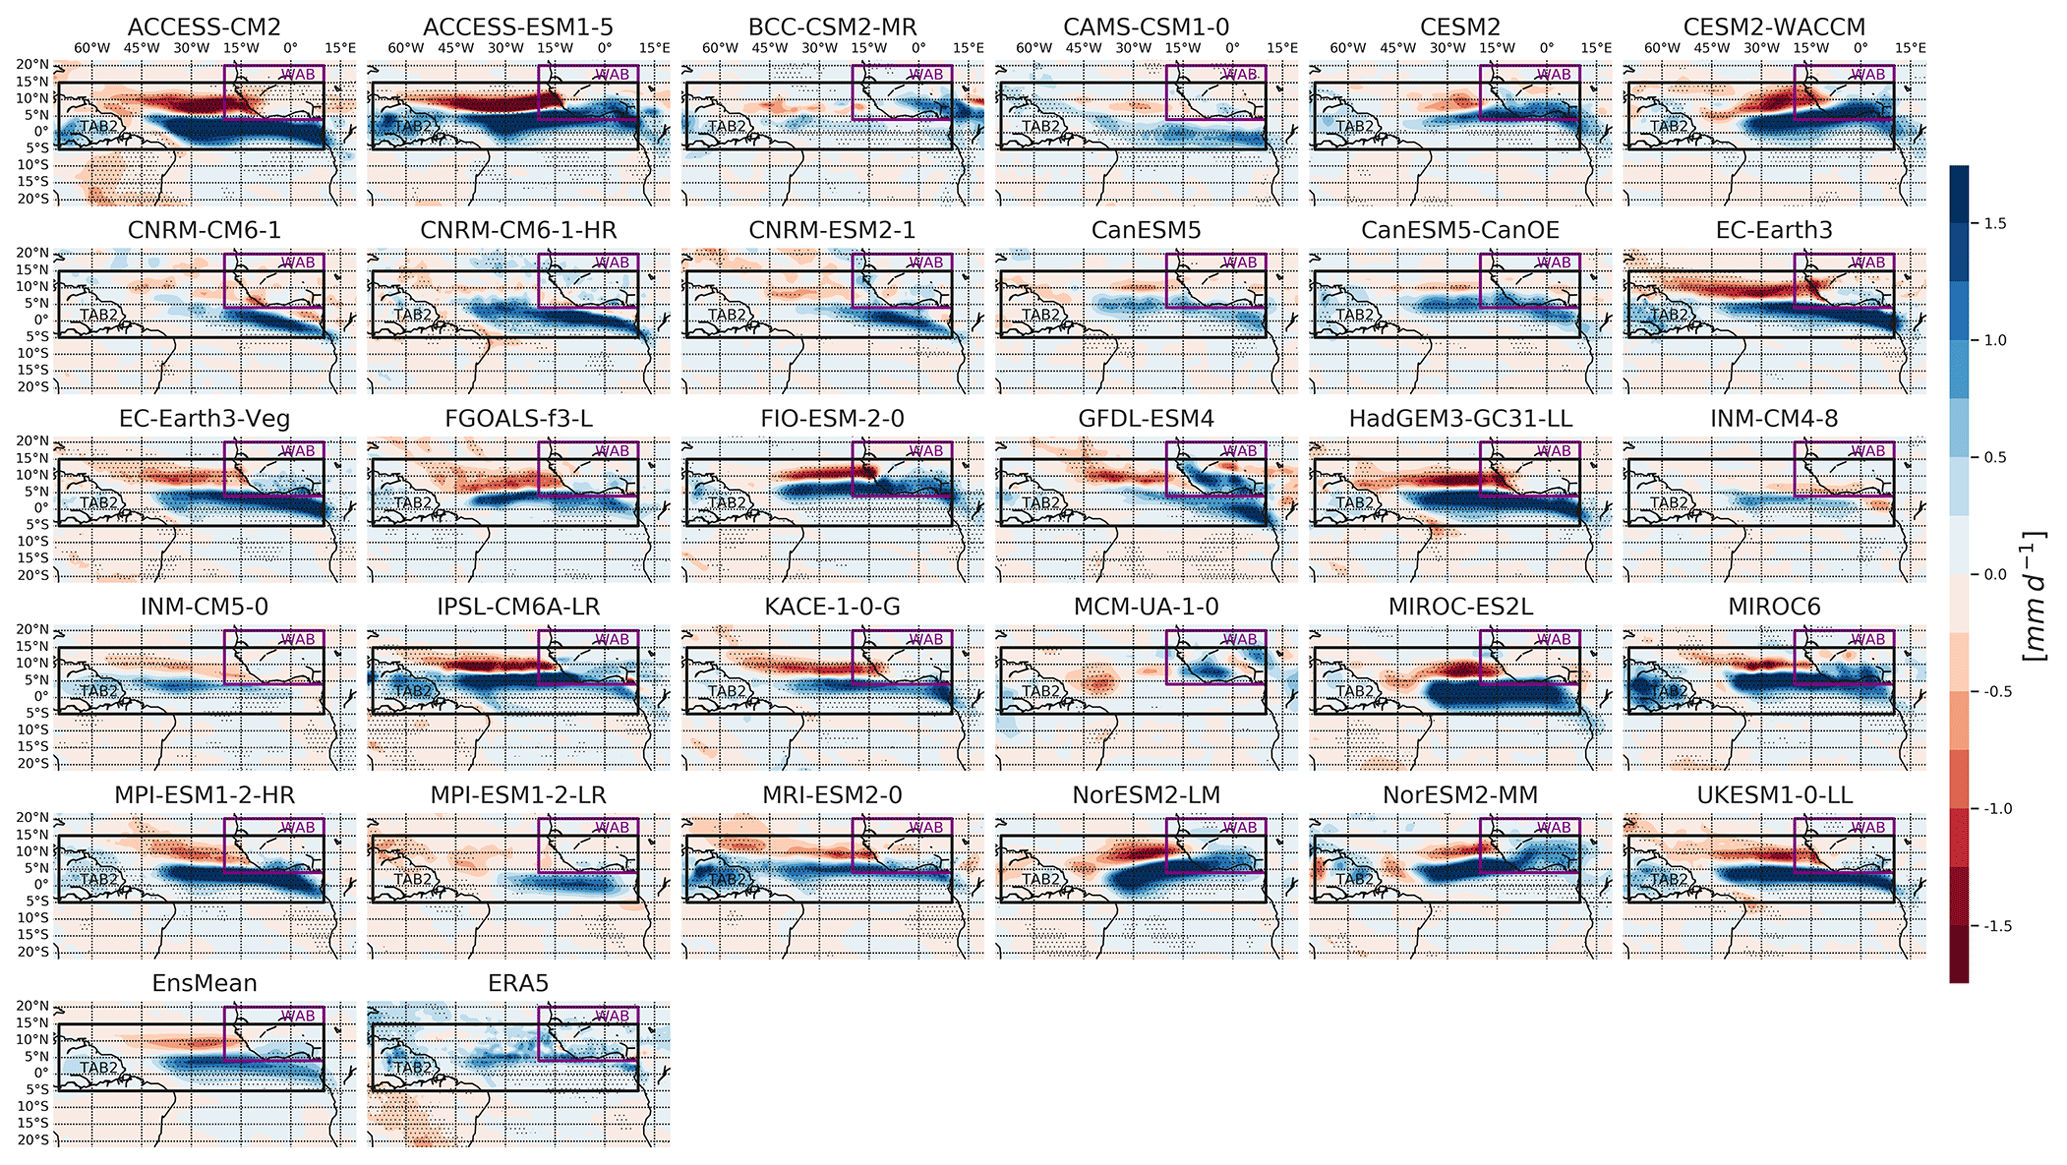
Figure 4Regression maps of the JAS rainfall anomalies onto the standardized JAS ATL3 SST index over 1985–2014. Stippling in the EnsMean indicates grid points where more than 50 % of the models show significant coefficients at 95 % level and more than 80 % of the models agree on the sign of the regression coefficient. Stippling in each model and ERA5 indicates significant regression coefficients at 95 % level.
Over the West African region, the latitudinal position of the maximum of the rainfall anomalies related to the AEM and averaged between 20∘ W and 10∘ E is 6.5∘ N in ERA5 (Fig. S10). In the CMIP6 EnsMean, this position is relatively good and is located at 4.5∘ N. Over West Africa (the WAB; see Table 2), the performance of the GCMs is poor to modest (Fig. 5a). The spatial correlation with ERA5 lies between −0.5 and 0.5 (0.5 for the EnsMean). Over the oceanic area (the TAB2), the position of the maximum of the AEM-related rainfall anomalies averaged between 70∘ W and 10∘ E in the CMIP6 EnsMean is located at 3.5∘ N, which is 2∘ below the position in ERA5. Figure 5b indicates that the models show a poor to modest spatial correlation with ERA5, which ranges from −0.3 to 0.5 (0.3 for the EnsMean).

The sign-dependent average of the 1985–2014 rainfall anomalies related to the AEM over the Guinea Coast box is positive in the reanalysis ERA5 (Fig. S11a). Two groups of GCMs are considered, according to their sign-dependent average over the GCB. The first group is termed GC+ and defines models with a positive sign-dependent average. It includes 24 models which are able to reproduce an increased rainfall associated with the Atlantic Niño positive phases (Fig. 6a). In contrast, there are six models in the second group, termed GC−, which show negative correlations between the rainfall over the Guinea Coast and the Atlantic Niño (Fig. 6b). The GC− ensemble mean rainfall response over the GCB is weak in magnitude, with less model agreement compared to the GC+ ensemble mean. In both groups, the dipolar structure of the AEM rainfall pattern is similar over the tropical Atlantic (the TAB2 area). However, this dipolar structure is not present in ERA5 (Fig. 6d).

Figure 6Regression maps of the JAS rainfall (a–d), SST (e–h), 850 hPa zonal moisture flux (i–l), 850 hPa meridional moisture flux (m–p), horizontal wind divergence difference between 200 and 850 hPa (q–t), and sea surface height (u–x) anomalies associated with the standardized JAS ATL3 SST index over the 1985–2014 period. Results for the GC+, GC− and EnsMean categories are displayed, and the number of models in each category is indicated in parentheses. GC+ (GC−) is a group of models with a positive (negative) sign-dependent average of the rainfall associated with the Atlantic Niño over the Guinea Coast (green boxes in a and b). Results for the reanalyses are displayed in the rightmost column, and stippling represents significant regressions at 95 % level. Stippling in the other maps indicates areas where the regression coefficients are significant at 95 % confidence level for at least 50 % of the models in each group, and where more than 80 % of the models agree on the sign of the regression coefficient. In (u)–(x), the JAS 850 hPa horizontal wind related to the standardized JAS ATL3 SST index is superimposed on the SSH pattern, and contours represent areas where at least the zonal or the meridional component of the wind is significant.
During positive phases of the Atlantic Niño, a warmer-than-normal sea surface temperature in the eastern equatorial Atlantic weakens the zonal surface pressure gradient over the equatorial Atlantic. This in turn weakens the prevailing trade winds. The regression of the low-level zonal component of the wind onto the ATL3 SST index is used to evaluate the first component of the Bjerknes feedback, which is the forcing of the surface wind in the western basin of the Atlantic Ocean by SST in the eastern basin (Keenlyside and Latif, 2007). Next, these anomalous westerlies increase the surface convergence above the warm waters in the east, which leads to a rising of the sea surface height, an increased heat content and a deepening of the thermocline. This is the second component of the Bjerknes feedback. Hence, the deepening of the eastern equatorial Atlantic thermocline reduces the influence of the upwelling of cold subsurface water on the surface temperature, which then reinforces the initial surface warming. This is the third component of the Bjerknes feedback. The regression of the sea surface height anomalies, a proxy for the thermocline depth, onto the ATL3 SST index is a measure of the third component of the Bjerknes feedback. This diagnostic is also influenced by the second component, but this point is not explicitly analysed in this study.
The JAS sea surface temperature and sea surface height imprints related to the standardized JAS ATL3 SST index are similar in the GC+ and GC− ensemble means (Fig. 6e, f and u–v). In the eastern equatorial Atlantic, the core of the anomalous warming is relatively well represented in both GC+ and GC−, compared to ERA5 (Fig. 6h). Contrastingly, the positive SSH anomalies in GC+ and GC− are stronger than in ORAS5 (Fig. 6x). In the western boundaries of the basin and along the 5–10∘ N band, the negative SSH anomalies are higher in GC+ and GC− than in ORAS5. In association with the AEM, there is a stronger zonal moisture flux from the equatorial Atlantic toward the Guinea Coast in GC+ than in GC−. This could partially explain the rainfall response difference between the two groups (Fig. 6i and j). The northward extension of the positive zonal moisture flux is limited to 10∘ N in GC+ and 5∘ N in GC−, while it reaches 15∘ N in ERA5 (Fig. 6l). The positive anomalous zonal moisture flux is limited to the oceanic area in GC−, whereas it extends to the Guinea Coast in GC+ and covers both the Guinea Coast and part of the Sahelian region in ERA5. Off the Guinea Coast, the meridional component of the moisture flux is also slightly greater in GC+ than in GC−, but the difference is lower than that in the zonal component (Fig. 6m and n). However, the positive meridional moisture flux over the equatorial and South Atlantic is weaker in both GC+ and GC−, compared to ERA5 (Fig. 6p).
Finally, during positive phases of the Atlantic Niño, over the Guinea Coast and the equatorial Atlantic, the atmospheric convection is more enhanced in the GC+ group than in GC−. This is indicated by the more pronounced wind divergence difference between the 200 and 850 hPa levels in Fig. 6q and r. Moreover, in GC+ and GC−, the oceanic areas where the atmosphere is destabilized are located 5∘ S of their positions in ERA5 (Fig. 6t). This explains why the positive rainfall anomalies associated with the positive phases of the Atlantic Niño in the GCMs are located south of the obtained position in ERA5. In conclusion, the combination of a large moisture flux from the equatorial Atlantic toward the Guinea Coast and a more destabilized atmosphere over the Guinea Coast leads to an enhanced rainfall response to AEM in the GC+ models compared to GC− models. Moreover, according to Nnamchi et al. (2021b), the rainfall response to the AEM is maximum at the location of the mean intertropical convergence zone (ITCZ). The CMIP6 models present a spurious southward position of the mean ITCZ position relative to the observations during the boreal summer. This induces an enhancement of the coupling between the atmosphere and the ocean during the growing phase of the Atlantic Niño in the models, which is located south of the maximum rainfall response in ERA5. Note that the aspects of the 30 GCMs EnsMean patterns are very close to the ones of the GC+ (Fig. 6c, g, k, o, s and w).

Figure 7(a) Standard deviation of the JAS Atlantic Niño index over the 1985–2014, 2015–2039, 2040–2069 and 2070–2099 periods for the 30 GCMs. The result for ERA5 is also shown for the 1985–2014 period. (b) Near-term (2015–2039), mid-term (2040–2069) and long-term (2070–2099) changes of the JAS Atlantic Niño standard deviation relative to the present-day period (1985–2014) for each of the 30 GCMs.
5.1 Overview of the near-term, mid-term and long-term Atlantic Niño changes
In this section, the impact of the Atlantic Niño on the tropical Atlantic and Guinea Coast is evaluated in a climate with a high anthropogenic emission of greenhouse gases. The standard deviation of the Atlantic Niño index in the present-day climate simulations varies between 0.24 and 0.65∘ C (Fig. 7a), compared to 0.38∘ C in ERA5. Relative to the 1985–2014 period, the standard deviation of the Atlantic Niño index shows a change that ranges from −44 % to 48 % for the near-term period, −41 % to 16 % for the mid-term period and −49 % to 11 % for the long-term period (Fig. 7b). The average of the relative changes in the 30 GCMs amounts to −6 %, −13 % and −22 % for the near-term, mid-term and long-term periods, respectively. Among the 30 GCMs considered, 18, 23 and 27 agree on the reduction of the Atlantic Niño variability for the near-term, mid-term and long-term periods, respectively. Interestingly, these results are opposite to the findings of Brierley and Wainer (2018), who evaluated the change of the AEM variability in a quadrupled CO2 experiment with CMIP5 models. They found that 3 (12) GCMs out of 15 depict a decrease (an increase) in the Atlantic Niño variability. Among other reasons, we can postulate on the differences in the models between the CMIP5 and CMIP6 to explain the differences between the two results. Brierley and Wainer (2018) compared a 1 % per year quadrupled CO2 experiment to a pre-industrial control simulation of CMIP5, which is different from the simulations compared in our analysis (historical and SSP5–8.5 simulations). A more direct comparison between the two studies could be performed by analysing the AEM variability changes between CMIP6 1pctCO2 and the CMIP6 pre-industrial simulations.
In the present-day climate, the multimodel mean of the JAS SST anomalies associated with the JAS ATL3 SST index and averaged over the equatorial Atlantic (the EAB region) is 0.33∘ C (Fig. 8a). This value is consistent with the reanalysis ERA5. For the periods 2015–2039, 2040–2069 and 2070–2099, the EnsMean value is reduced to 0.30, 0.28 and 0.27∘ C, respectively. This result indicates that, relative to the present-day climate, the multimodel mean of the SST response to the Atlantic Niño has gradually decreased, with a percentage of change equal to −7 %, −13 % and −18 % for the near-term, mid-term and long-term periods, respectively (Fig. 8a). There are 73 % and 87 % of the 30 GCMs which agree on the sign of the change in the mid-term and long-term periods, compared to 50 % in the near-term period. In addition, the consistency of the equatorial Atlantic SST response to AEM among the GCMs increases with time, as highlighted by the shrinking of the interquartile range of the models' SST anomalies, from a value of 0.14∘ C in 1985–2014, to 0.09∘ C in 2070–2099. These results are in line with the changes of the standard deviation of the ATL3 SST index.

Figure 8Boxplots of the JAS regression coefficients of (a) SST, (b) rainfall, (d) 850 hPa zonal wind, (e) sea surface height and (f) horizontal wind divergence difference between 200 and 850 hPa (DIV) anomalies averaged over the equatorial Atlantic box. Boxplot of the regression coefficients of the rainfall anomalies averaged over the Guinea Coast (c). The variables from each of the 30 models are regressed onto the standardized JAS ATL3 SST index, for four different periods: 1985–2014, 2015–2039, 2040–2069 and 2070–2099. Each boxplot represents the distribution of the 30 regression coefficients averaged over the specified area in the different models. Vertical lines represent the corresponding regression values in ERA5 (ORAS5) for the 1985–2014 period.
Over the period 1985–2014, the JAS CMIP6 EnsMean rainfall anomalies related to 1 standard deviation of the JAS ATL3 SST index and averaged over the EAB is 0.62 mm d−1, which is greater than the observed value (0.21 mm d−1 in ERA5). Subsequent to the weakening of the equatorial SST anomalies in the future, the rainfall associated with the Atlantic Niño over the EAB area decreases (Fig. 8b). The CMIP6 EnsMean of the anomalous EAB rainfall values for the three consecutive future periods are 0.54, 0.46 and 0.40 mm d−1, respectively. The corresponding EnsMean rainfall change relative to the present-day period is about −12 %, −25 % and −36 %, with an agreement of 63 %, 83 % and 80 % of the models on the sign of the change in the near-term, mid-term and long-term periods, respectively. Figure S12a and c indicate that, over the Atlantic Ocean, in the four periods of the study, the EnsMean position of the maximum rainfall anomalies associated with AEM remains close to 4∘ N, but with a linear decrease in the rainfall intensity with time. North of 5∘ N, an upper level subsidence produces negative rainfall anomalies in the tropical North Atlantic, which gradually weaken in the future periods. Over the EAB region, the decrease in the rainfall interquartile range in the CMIP6 models for the mid-term and long-term periods indicates an increased consistency of the rainfall response among the models. For the present-day, the near-term, the mid-term and the long-term periods, the IQR values are 0.47, 0.47, 0.40 and 0.34 mm d−1, respectively.
Regarding the AEM-induced rainfall over the Guinea Coast, an overall reduction of the multimodel mean is projected (Figs. 8c and S12b, d). The CMIP6 EnsMean rainfall averaged over the Guinea Coast (the GCB area) decreases from a value of 0.37 mm d−1 in the period 1985–2014 to 0.24 mm d−1 at the end of the 21st century. The corresponding values for the near-term and mid-term periods are 0.32 and 0.26 mm d−1, respectively. The amount of the GCB EnsMean rainfall reduction reaches thus 14 %, 30 % and 35 % in the near-term, mid-term and long-term periods, respectively. The percentages of the models that agree on a reduction of the rainfall magnitude associated with AEM over GCB for the three periods are 73 %, 73 % and 63 %, respectively. This means that there is a lesser agreement on the projected mid-term and long-term AEM-rainfall changes over the Guinea Coast than over the equatorial Atlantic. Moreover, there is a slight increase in the inter-model consistency in the projected long-term AEM-rainfall over the Guinea Coast.
The positive loop of the Bjerknes feedback requires first the forcing of the eastern equatorial Atlantic SST on the surface winds in the western basin. A warming in the eastern equatorial Atlantic gives rise to anomalous westerlies in the western basin. In turn, these weaker trade winds induce a deepening of the eastern equatorial Atlantic thermocline, which can be measured by a rising of the sea surface height. This is the second element of the Bjerknes feedback. The increased thermocline depth in the eastern equatorial Atlantic reduces the upwelling of cold water in that area and strengthens the initial warming. This third component of the Bjerknes is characterized by a positive correlation between the SST and SSH in the eastern equatorial Atlantic. In the future climate, following the SSP5–8.5 scenario, the variability of the trade winds associated with the Atlantic Niño decreases, as shown in Figs. 8d and S12e, where the 850 hPa zonal winds are regressed onto the standardized ATL3 SST index and averaged over the equatorial Atlantic (the EAB region). The CMIP6 EnsMean of the 850 hPa zonal wind anomalies corresponding to 1 standard deviation of the ATL3 SST index and averaged over the EAB amounts to 0.24 m s−1 in the 1985–2014 period, which is close to the value derived from ERA5 (0.2 m s−1). For the near-term, mid-term and long-term future, this value decreases to 0.16, 0.11 and 0.05 m s−1, respectively. This reduction corresponds to 34 %, 53 % and 79 % of the value obtained in the present-day climate, respectively, with a high agreement among the 30 CMIP6 models (77 % for the near-term, 80 % for the mid-term periods and 87 % for the long-term period). This result suggests a weakening of the first component of the Bjerknes feedback, which links anomalous westerlies to the abnormal warming in the eastern equatorial Atlantic.
In response to weakened trade winds during a positive AEM phase, the upwelling of seawater in the east is reduced, leading to an anomalous rising of the SSH in the east, and an SSH fall in the west (Figs. 8e and S12f). The weakening of the anomalous westerlies associated with 1 standard deviation of the ATL3 SST index in the future reduces the positive (negative) SSH anomalies in the eastern (western) equatorial Atlantic, which in turn reduces the SST anomalies over the ATL3 area. The CMIP6 EnsMean average of the SSH anomalies related to the standardized ATL3 SST index over the EAB region for the four consecutive periods is 0.87, 0.78, 0.69 and 0.67 cm, respectively. The corresponding reduction of the SSH EnsMean in the EAB for the three consecutive future periods is 10 %, 21 % and 23 %. The CMIP6 models' agreement on the sign of this change is between 68 % and 76 % in the three cases. This result demonstrates a weakening of the third element of the Bjerknes feedback. In addition, the spread of the models is also reduced at the end of the 21st century, highlighting the increased consistency of the models for the SSH responses to the Atlantic Niño.
Part of the weakening of the equatorial Atlantic rainfall variability associated with the Atlantic Niño in a warmer climate has been attributed to a faster warming of the mid-tropical Atlantic troposphere compared to the surface, as pointed out by Jia et al. (2019). This implies that the troposphere above the equatorial Atlantic becomes more stable and limits the convection. This is in agreement with Fig. 8f, which shows, over the equatorial Atlantic, a gradual decrease in the strength of the rising motion associated with the Atlantic Niño warm phases, during the near-term, mid-term and long-term periods. For the three successive future periods, the relative change (and the agreement between models) of the CMIP6 EnsMean DIV averaged over the EAB area is −15 % (57 %), −35 % (67 %) and −50 % (77 %), respectively. The consistency of the DIV200/850 anomalous response in the CMIP6 models is significantly enhanced in the mid-term and long-term periods.
Moreover, as the rainfall patterns related to the Atlantic Niño could be a mix from local and remote SST drivers, the monthly Niño3 indices (average of SST anomalies over 5∘ S–5∘ N, 150–90∘ W) are regressed onto the standardized JAS ATL3 SST index for the models and ERA5 (Fig. S13). In ERA5, the JAS ATL3 SST index is negatively correlated with the Niño3 index from April to December. This opposite phase relationship is stronger in November and December. From January to March, an in-phase relationship is observed. The CMIP6 models' ensemble mean response shows an anticorrelation between the JAS ATL3 SST index and the Niño3 index for all the months during 1985–2014. Thus, the effect of SST in both basins would lead to rainfall anomalies of the same sign over the Guinea Coast. In the future, a general decrease in the Niño3–ATL3 relationship is obtained in the 2015–2039 and 2040–2069 period. However, the sign of the correlation between both indices is reversed in the long-term period (2070–2099). This means that in the 2070–2099 period, two rainfall anomalies with opposite signs will interact over the Guinea Coast, and this might reduce the rainfall amplitude associated with the Atlantic Niño. For the 1985–2014, 2015–2039, 2040–2069 and 2070–2099 periods, there are, respectively, 9, 7, 9 and 7 models which show a significant correlation between the JAS Niño3 and ATL3 SST indices (Fig. S14).
5.2 Change of the Atlantic Niño impact on the rainfall in the Guinea Coast
Throughout this section, we investigate the JAS rainfall, SST, 850 hPa zonal wind and moisture flux associated with the standardized JAS ATL3 SST index. To highlight the impact of some specific differences between the models in their way of representing the spatial characteristics related to AEM in response to climate change, six different subsets of the CMIP6 models are considered. They are also based on the sign-dependent average of the AEM-related rainfall pattern over, on the one hand, the Guinea Coast (the GCB area) and, on the other hand, the equatorial Atlantic region (the EAB area). First, the GC+ group (the 24 models in Sect. 4 which simulate a realistic JAS GCB rainfall associated with 1 standard deviation of the JAS ATL3 SST index) is split into two groups. One group, termed GC, projects a decrease in the GCB rainfall intensity associated with the Atlantic Niño. The other group, termed GC, projects an increase in the GCB rainfall magnitude associated with the Atlantic Niño (see Fig. S11a for the values of the sign-dependent average). These two different signals are considered because we do not know exactly the realistic AEM-rainfall pattern in the future. The six models that simulate weak or negative JAS AEM-rainfall anomalies over the GCB during the 1985–2014 period are similarly divided into two groups, GC and GC, which contain models projecting a strengthened and a decreased (or inverted) rainfall intensity related to 1 JAS ATL3 SST index standard deviation, respectively.
Next, the 30 CMIP6 models are able to simulate a positive rainfall anomaly over the Atlantic Ocean in the area between the Equator and 5∘ N. The same sign-dependent average analysis performed over the equatorial Atlantic region (the EAB area, Fig. S11b) conduces to the OC and OC groups (Fig. S15). The GC and OC groups show an overall decrease in the rainfall magnitude related to AEM in the future, which is associated with a weakened Bjerknes feedback. By contrast, in GC and OC groups, weak changes of the zonal wind and sea surface height anomalies indicate that the Bjerknes feedback acts similarly in the present and future climates. Moreover, the spatial characteristics of the changes are similar for the near-term, mid-term and long-term periods, with an enhancement of the pattern of change with time (as summarized in Fig. S12). Therefore, we will focus the next discussion on the 2070–2099 changes relative to the 1985–2014 period, as these changes are the most amplified. The detailed lists of the models in the different categories for the three future periods are available in Tables S2–S4.
Among the 24 models in the GC+ group, 12 (12) project a decrease (an increase) of the rainfall magnitude associated with AEM (Fig. 9a and b). The long-term projection of the AEM-rainfall signal in the GC group is limited to the Atlantic Ocean and is hardly robust over the Guinea Coast (Fig. S17). However, relative to the period 1985–2014, models in the GC group show an eastward and northward shift of the anomalous positive rainfall belt over the Atlantic Ocean at the end of the 21st century. This results in an enhancement of the rainfall teleconnection pattern over the Guinea Coast, mainly over the Cameroon mountains and Guinean highlands.
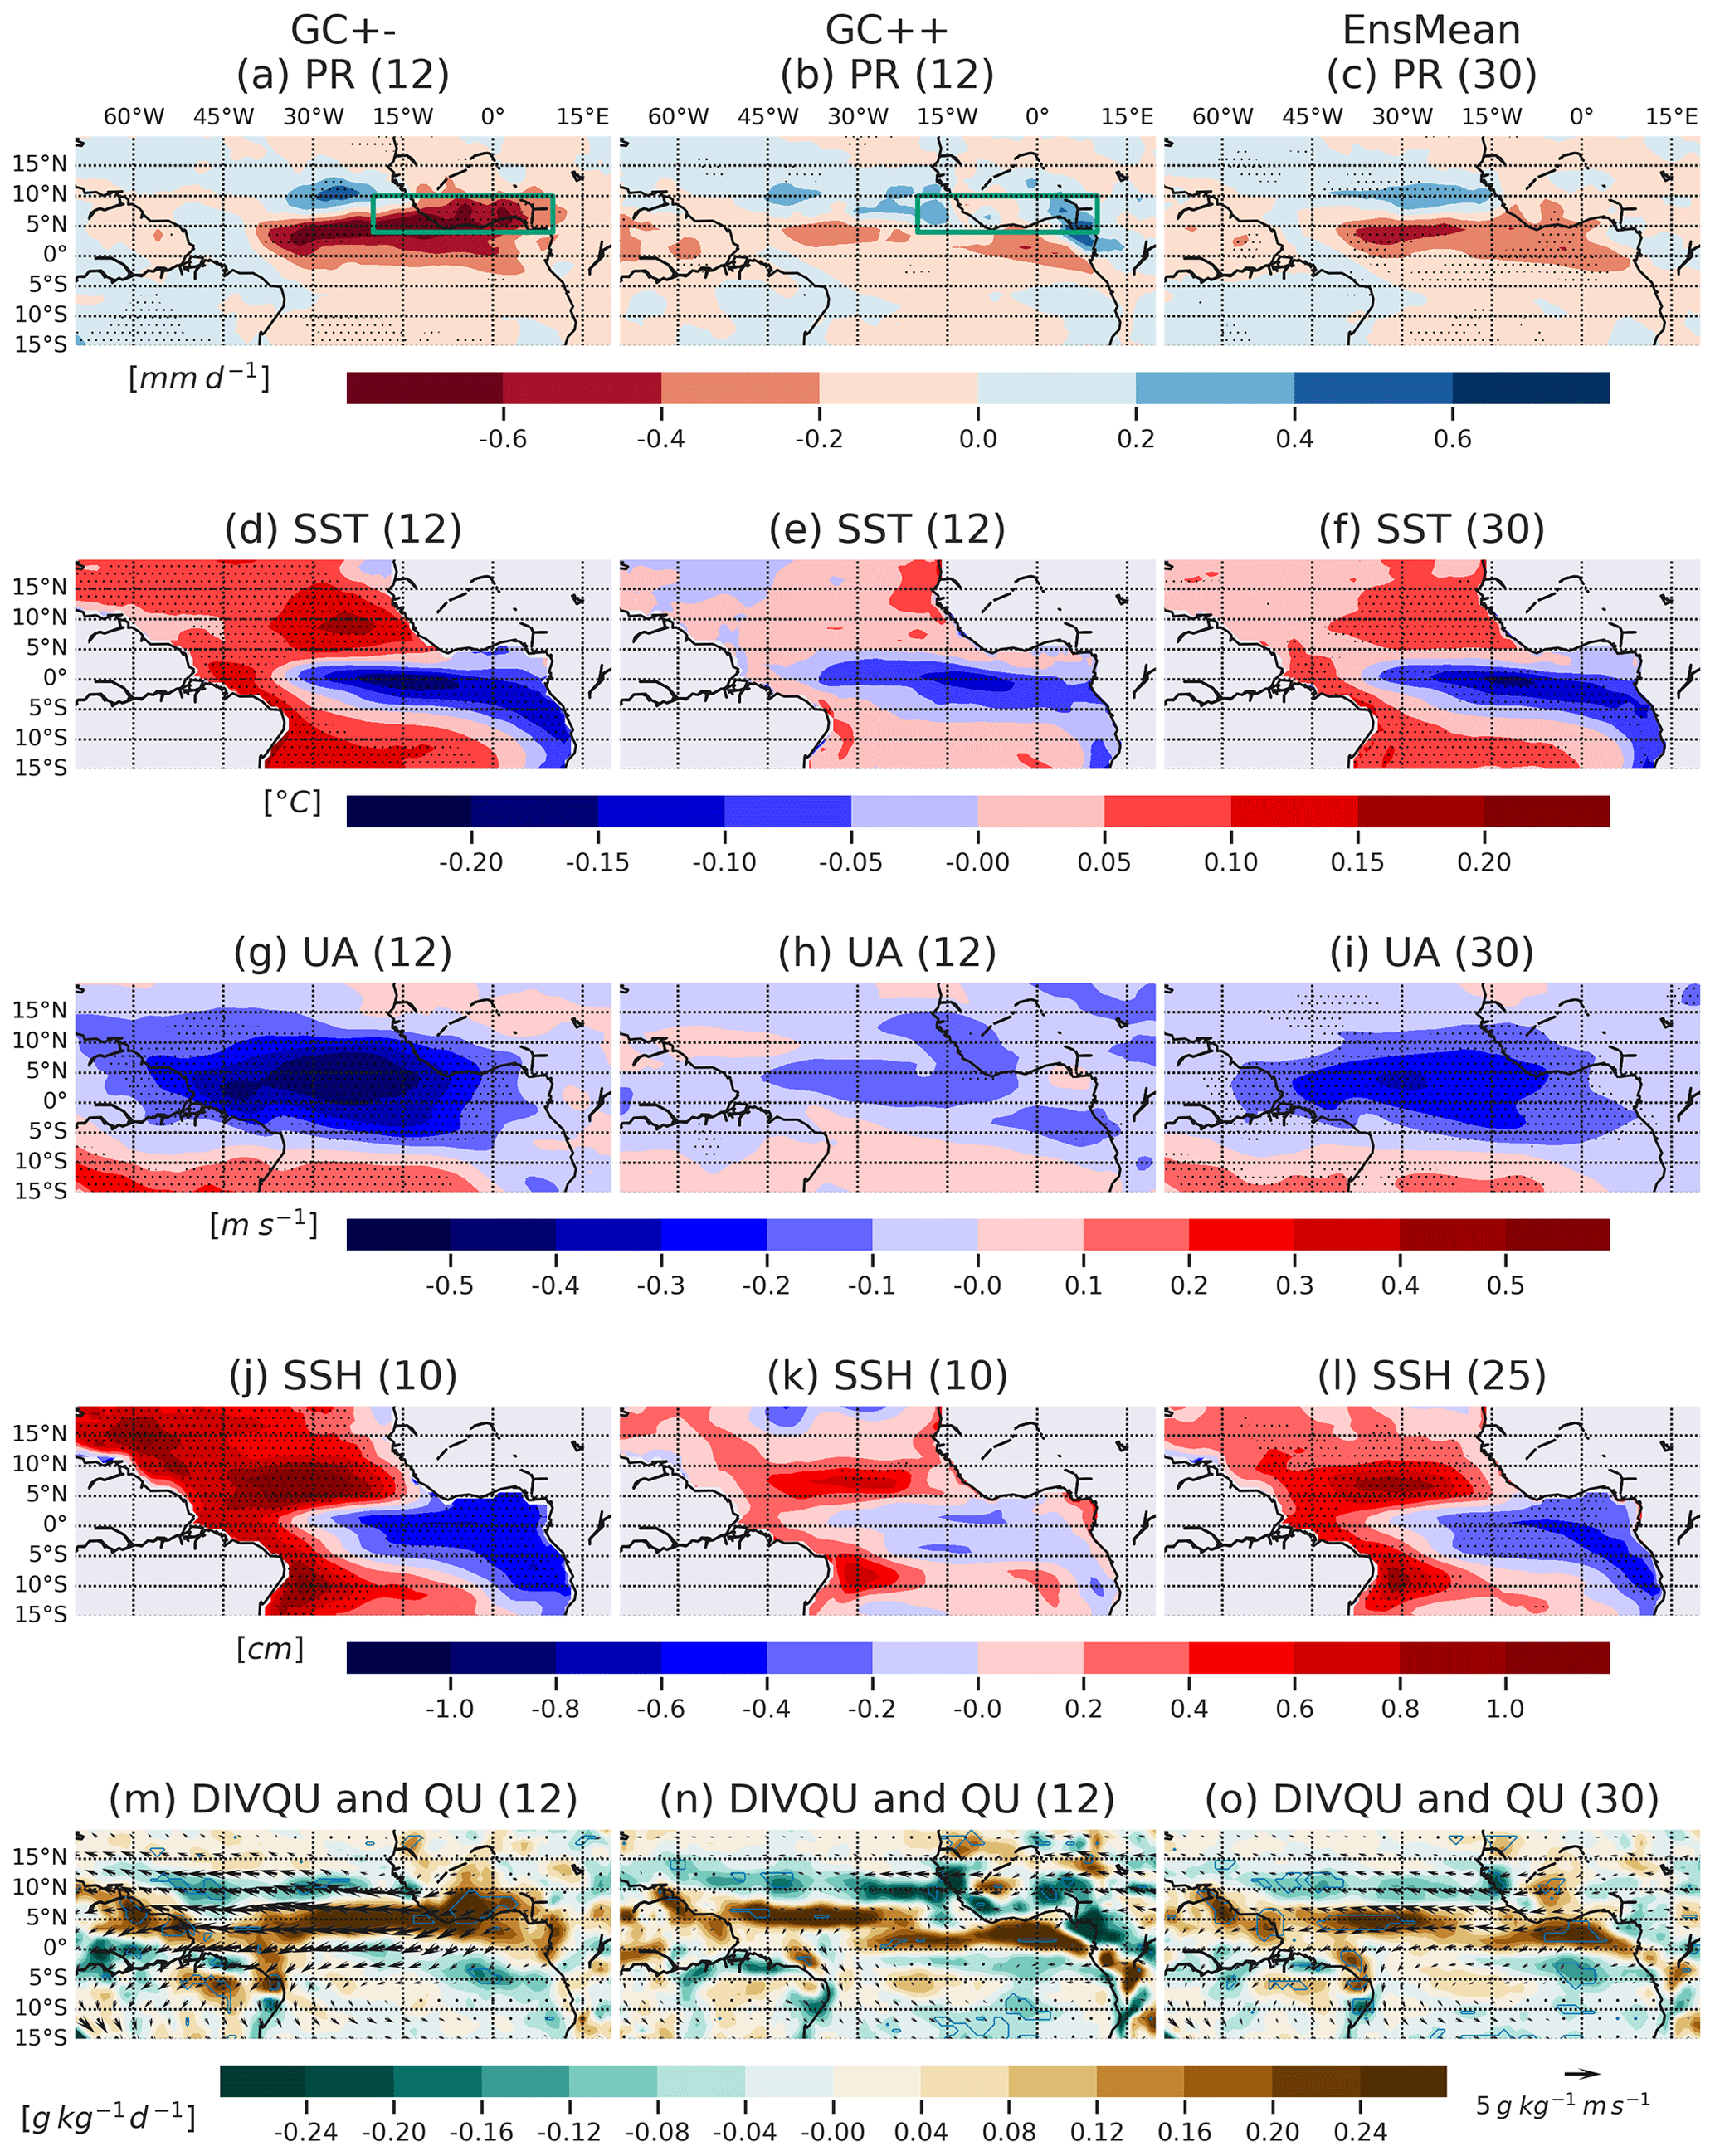
Figure 9Long-term changes of the JAS rainfall (a–c), SST (d–f), 850 hPa zonal wind (g–i), sea surface height (j–l), 850 hPa moisture flux (vectors) and moisture flux divergence (in colours) (m–o) regression patterns associated with the standardized JAS ATL3 SST index, relative to the present-day climate (2070–2099 minus 1985–2014). Stippling in (a)–(l) and contours in (m)–(o) indicate areas where the mean change (in colours) is significant at 95 % level according to a two-sided Welch t test and where at least two-thirds of the models agree on the sign of the change. The number of models in each group is indicated in parentheses.
Regarding the SST patterns related to the Atlantic Niño, the projected changes display a decrease in SST over the equatorial Atlantic and off the Angola–Benguela Coast in both GC and GC (Fig. 9d and e). However, the SST patterns of change in GC and GC are different in the north and south of the 5∘ N–5∘ S band. Compared to the 1985–2014 period, there is a poleward and westward extension of the anomalous warming associated with AEM in GC, which directly results in decreased zonal and meridional surface pressure gradients over the Atlantic Ocean, and a reduced surface convergence over the equatorial Atlantic (Fig. 9m). Regarding the 850 hPa zonal wind anomalies, their magnitude associated with AEM in the GC group is projected to decrease in the future (Fig. 9g), while this change is very weak and unrobust in GC group (Fig. 9h). As a consequence, in the GC group, the projected equatorial Atlantic zonal moisture flux and moisture flux convergence related to AEM are weaker, and their contribution to intensification of the Guinea Coast rainfall is limited (Fig. 9m).
The SSH response to AEM in GC is also projected to weaken in the future, compared to the present-day situation (Fig. 9j). Together with the important change of the low-level zonal wind, these results evidence a weakened Bjerknes feedback over the equatorial Atlantic in a warmer climate. In the GC group, there is no substantial difference between the 1985–2014 and 2070–2099 SSH patterns related to the Atlantic Niño (Fig. 9k). This means that the intensity of the Bjerknes feedback remains quite similar in the GC models over the two periods. Furthermore, compared to the present-day situation, in GC, the surface moisture convergence related to the Atlantic Niño is displaced eastward and northward over the equatorial Atlantic and Guinea Coast in the future (Fig. 9n). This is consistent with the projected AEM-rainfall increase over the Guinea Coast in GC, in agreement with Mohino and Losada (2015). Besides, over the equatorial Atlantic, there is an overall decrease in the convection associated with AEM in both GC and GC models (Figs. S16 and S17).
From the six models in the GC− group, four (the GC group) project an eastward shift of the positive AEM-rainfall anomalies over the tropical Atlantic, leading to an increased rainfall intensity over the Guinea Coast (Fig. S18). In addition, the negative AEM rainfall located north of the positive AEM-rainfall band weakens in these models. This future response is, however, unrobust over the Guinea Coast. In the other two models (the GC group), over the tropical Atlantic, the dipolar rainfall response to the AEM remains present in the future period. Moreover, the band of negative rainfall anomalies which extends from the ocean to the westernmost region of the Guinea Coast is shifted equatorward. Overall, the patterns of change of the OC group (Fig. S15) and the 30 CMIP6 EnsMean (Fig. 9c, f, i, l and o) are similar to those in the GC group. Table S1 in the Supplement summarizes the main results for the GC and GC categories and the EnsMean.
In a warmer climate, over the equatorial Atlantic, the models project an increase in the mean JAS sea level pressure which is greater in the western basin than in the eastern area. This zonal surface pressure gradient drives anomalous westerlies over the equatorial Atlantic (Fig. S19). As a consequence, the weakened trade winds cause a deeper mean thermocline in the eastern equatorial Atlantic. This is indicated by the increased oceanic mixed layer depth, here used as a proxy for the top of the thermocline depth. As the thermocline becomes deeper, it responds less to the SST changes at the surface during the Atlantic Niño phases and leads to a weakened Bjerknes feedback.
In this study, the JAS Atlantic Niño impact on the JAS rainfall in the Guinea Coast and over the tropical Atlantic has been evaluated. First, the 1985–2014 period of the historical simulations has been considered. The spatial patterns of the JAS SST anomalies related to the standardized JAS ATL3 SST index in the GCMs show good correlations with the pattern in ERA5. However, the maximum rainfall position associated with the Atlantic Niño in the 30 GCMs' ensemble mean is displaced south of the observed position over the tropical Atlantic. All the models manifest an increased rainfall associated with positive AEM phases over the equatorial Atlantic. In the case of the Guinea Coast region, 24 models exhibit a realistic increased rainfall related to a warm phase of the Atlantic Niño, compared to 6 models which show a negative or weak rainfall response. In connection with the AEM, there is a weaker zonal wind response and a weaker zonal moisture flux toward the Guinea Coast, as well as a weaker deep convection in these 6 models (the GC− group), relative to the 24 models (the GC+ group).
Secondly, the change of the Atlantic Niño and its impact on the rainfall over the equatorial Atlantic and the Guinea Coast in a climate with a high anthropogenic emission of greenhouse gases has been evaluated. Analyses of the Shared Socioeconomic Pathway 5–8.5 simulations demonstrate a gradual decrease in the SST anomalies associated with 1 standard deviation of the Atlantic Niño index for the near-term, mid-term and long-term periods, relative to the present-day climate. The ensemble mean change of the standard deviation of the ATL3 SST index relative to the present-day period is −6 %, −13 % and −22 % for those three periods, respectively. Among the 30 GCMs, 18, 23 and 27 agree on the sign of the ATL3 SST index standard deviation change, for the three future periods respectively. Many of the models also indicate a gradual weakening with time of the rainfall magnitude related to the Atlantic Niño over the Guinea Coast and the equatorial Atlantic in the future.
More specifically, focusing on the Guinea Coast, among the 24 models which present a relatively good AEM-rainfall signal in the 1985–2014 period, there are 12 GCMs (the GC group) which project a relative decreased rainfall related to AEM in the 2070–2099 period. Analyses of the JAS SST, 850 hPa zonal wind and SSH anomalies indicate that the magnitude of their variations associated with 1 standard deviation of the Atlantic Niño decreases, suggesting a weakening of the Bjerknes feedback in a warmer climate. By contrast, 12 other models show weak differences in the patterns associated with the Atlantic Niño, and a little increase in the rainfall pattern over elevated areas in the Guinea Coast (the GC group). While the GC group exhibits an important decrease in the zonal wind variability associated with the Atlantic Niño in the future, this variability remains similar in the GC group. In these models, we argue that the Bjerknes feedback should be of the same intensity in the present-day and at the end of the 21st century. As well as this, there is a projected westward and a poleward extension of the anomalous warm water associated with the Atlantic Niño in the GC group. This contributes to the reduction of the equatorial Atlantic surface convergence associated with AEM.
In the GC group, the equatorial Atlantic convection associated with the Atlantic Niño is projected to decrease, as indicated by the weakened wind divergence difference between 200 and 850 hPa. This decrease is weaker in the GC group. This result adds support to Jia et al. (2019), who found a more stabilized troposphere over the tropical Atlantic in the future, which in turn reduces the convection during the positive phases of the Atlantic Niño. Their analysis was focused on the link between the Atlantic Niño and La Niña, while our analysis is focused on the Atlantic Niño teleconnection with the tropical Atlantic and Guinea Coast.
In the last part of this study, we linked the background JAS mean state change to the change of the Atlantic Niño variability. In a warmer climate, we found that over the equatorial Atlantic, the mean sea level pressure change is positive and presents an east–west gradient. This contributes to decreasing the intensity of the mean easterlies, thus limiting the equatorial upwelling. Subsequently, the thermocline becomes deeper along the Equator, and the deepening is more important in the eastern equatorial Atlantic. For this reason, the influence of the eastern equatorial Atlantic thermocline on the surface during the Atlantic Niño phases is weakened in the future. This explains the projected decreased variability of the Atlantic Niño in the SSP5–8.5 emission scenario.
Future studies are needed to assess the impact of the warm biases in the eastern equatorial Atlantic on the teleconnection patterns of the Atlantic Niño and could help to increase the reliability of the projected changes. Moreover, the reduction of these biases is crucial for the rainfall projections over West Africa. Further analyses are also needed to understand the multidecadal modulation of the Guinea Coast rainfall and extreme rainfall by oceanic internal modes of variability in climate models for both present-day and future climate conditions.
The code for the Taylor diagrams in this article is publicly available at https://github.com/PeterRochford/SkillMetrics (Rochford, 2020). The code for the other diagnostics is written in Python and is available from the corresponding author upon request.
The CMIP6 data are available on the Earth System Grid Federation (ESGF) portals (e.g. https://esgf-node.llnl.gov/search/cmip6/, WCRP, 2021). The ERA5 data are publicly available through the Copernicus Climate Data Store (https://cds.climate.copernicus.eu/cdsapp#!/home, CDS, 2020). The SSH data can be retrieved from the Integrated Climate Data Center (ICDC) at the University of Hamburg (https://icdc.cen.uni-hamburg.de/thredds/catalog/ftpthredds/EASYInit/oras5/catalog.html, ICDC, 2021).
The content of the Appendix in the preprint was moved to the Supplement in the final revised paper. The supplement related to this article is available online at: https://doi.org/10.5194/esd-13-231-2022-supplement.
KW, HG and TF conceptualized the paper. KW performed the analyses and prepared the figures. FK participated in the discussions. KW, HG, TF and FK wrote the paper. All the co-authors provided scientific inputs and commented on the final draft.
The contact author has declared that neither they nor their co-authors have any competing interests.
Publisher's note: Copernicus Publications remains neutral with regard to jurisdictional claims in published maps and institutional affiliations.
The authors would also like to thank the editor, Govindasamy Bala, and the five anonymous reviewers for their thoughtful and constructive comments. Koffi Worou would like to thank François Massonnet and Léandro Ponsoni for the useful discussions they had. Many thanks to Pierre-Yves Barriat and to the Copernicus Publications Editorial Support. We acknowledge the World Climate Research Programme, which, through its Working Group on Coupled Modelling, coordinated and promoted CMIP6. We thank the climate modelling groups for producing and making available their model output, the Earth System Grid Federation (ESGF) for archiving the data and providing access, and the multiple funding agencies who support CMIP6 and ESGF.
This paper was edited by Govindasamy Bala and reviewed by five anonymous referees.
Adejuwon, J. O. and Odekunle, T. O.: Variability and the Severity of the “Little Dry Season” in Southwestern Nigeria, J. Climate, 19, 483–493, https://doi.org/10.1175/jcli3642.1, 2006. a
Bjerknes, J.: Atmospheric teleconnections from the equatorial Pacific, Mon. Weather Rev., 97, 163–172, https://doi.org/10.1175/1520-0493(1969)097<0163:atftep>2.3.co;2, 1969. a
Brierley, C. and Wainer, I.: Inter-annual variability in the tropical Atlantic from the Last Glacial Maximum into future climate projections simulated by CMIP5/PMIP3, Clim. Past, 14, 1377–1390, https://doi.org/10.5194/cp-14-1377-2018, 2018. a, b
Burmeister, K., Brandt, P., and Lübbecke, J. F.: Revisiting the cause of the eastern equatorial Atlantic cold event in 2009, J. Geophys. Res.-Oceans, 121, 4777–4789, https://doi.org/10.1002/2016jc011719, 2016. a
CDS: Welcome to the Climate Data Store, available at: https://cds.climate.copernicus.eu/cdsapp#!/home, last access: 30 August 2020. a
Dee, D. P., Uppala, S. M., Simmons, A. J., Berrisford, P., Poli, P., Kobayashi, S., Andrae, U., Balmaseda, M. A., Balsamo, G., Bauer, P., Bechtold, P., Beljaars, A. C. M., van de Berg, L., Bidlot, J., Bormann, N., Delsol, C., Dragani, R., Fuentes, M., Geer, A. J., Haimberger, L., Healy, S. B., Hersbach, H., Hólm, E. V., Isaksen, L., Kållberg, P., Köhler, M., Matricardi, M., McNally, A. P., Monge-Sanz, B. M., Morcrette, J.-J., Park, B.-K., Peubey, C., de Rosnay, P., Tavolato, C., Thépaut, J.-N., and Vitart, F.: The ERA-Interim reanalysis: configuration and performance of the data assimilation system, Q. J. Roy. Meteorol. Soc., 137, 553–597, https://doi.org/10.1002/qj.828, 2011. a
Diakhaté, M., Rodríguez-Fonseca, B., Gómara, I., Mohino, E., Dieng, A. L., and Gaye, A. T.: Oceanic Forcing on Interannual Variability of Sahel Heavy and Moderate Daily Rainfall, J. Hydrometeorol., 20, 397–410, https://doi.org/10.1175/jhm-d-18-0035.1, 2019. a, b
Diakhaté, M., Suárez-Moreno, R., Gómara, I., and Mohino, E.: Statistical-Observational Analysis of Skillful Oceanic Predictors of Heavy Daily Precipitation Events in the Sahel, Atmosphere, 11, 584, https://doi.org/10.3390/atmos11060584, 2020. a
Diatta, S. and Fink, A. H.: Statistical relationship between remote climate indices and West African monsoon variability, Int. J. Climatol., 34, 3348–3367, https://doi.org/10.1002/joc.3912, 2014. a
Ding, H., Keenlyside, N. S., and Latif, M.: Impact of the Equatorial Atlantic on the El Niño Southern Oscillation, Clim. Dynam., 38, 1965–1972, https://doi.org/10.1007/s00382-011-1097-y, 2012. a
Fink, A. H., Engel, T., Ermert, V., van der Linden, R., Schneidewind, M., Redl, R., Afiesimama, E., Thiaw, W. M., Yorke, C., Evans, M., and Janicot, S.: Mean Climate and Seasonal Cycle, in: Meteorology of Tropical West Africa, John Wiley & Sons, Ltd, 1–39, https://doi.org/10.1002/9781118391297.ch1, 2017. a
Foltz, G. R. and McPhaden, M. J.: Interaction between the Atlantic meridional and Niño modes, Geophys. Res. Lett., 37, L18604, https://doi.org/10.1029/2010gl044001, 2010a. a
Foltz, G. R. and McPhaden, M. J.: Abrupt equatorial wave-induced cooling of the Atlantic cold tongue in 2009, Geophys. Res. Lett., 37, L24605, https://doi.org/10.1029/2010gl045522, 2010b. a
Giannini, A.: Oceanic Forcing of Sahel Rainfall on Interannual to Interdecadal Time Scales, Science, 302, 1027–1030, https://doi.org/10.1126/science.1089357, 2003. a
Gill, A. E.: Some simple solutions for heat-induced tropical circulation, Q. J. Roy. Meteorol. Soc., 106, 447–462, https://doi.org/10.1002/qj.49710644905, 1980. a
Gómara, I., Mohino, E., Losada, T., Domínguez, M., Suárez-Moreno, R., and Rodríguez-Fonseca, B.: Impact of dynamical regionalization on precipitation biases and teleconnections over West Africa, Clim. Dynam., 50, 4481–4506, https://doi.org/10.1007/s00382-017-3886-4, 2017. a
Hamouda, M. E. and Kucharski, F.: Ekman pumping mechanism driving precipitation anomalies in response to equatorial heating, Clim. Dynam., 52, 697–711, https://doi.org/10.1007/s00382-018-4169-4, 2019. a
Hansen, J. W.: Realizing the potential benefits of climate prediction to agriculture: issues, approaches, challenges, Agricult. Syst., 74, 309–330, https://doi.org/10.1016/s0308-521x(02)00043-4, 2002. a
Hersbach, H., Bell, B., Berrisford, P., Hirahara, S., Horányi, A., Muñoz-Sabater, J., Nicolas, J., Peubey, C., Radu, R., Schepers, D., Simmons, A., Soci, C., Abdalla, S., Abellan, X., Balsamo, G., Bechtold, P., Biavati, G., Bidlot, J., Bonavita, M., Chiara, G., Dahlgren, P., Dee, D., Diamantakis, M., Dragani, R., Flemming, J., Forbes, R., Fuentes, M., Geer, A., Haimberger, L., Healy, S., Hogan, R. J., Hólm, E., Janisková, M., Keeley, S., Laloyaux, P., Lopez, P., Lupu, C., Radnoti, G., Rosnay, P., Rozum, I., Vamborg, F., Villaume, S., and Thépaut, J.-N.: The ERA5 global reanalysis, Q. J. Roy. Meteorol. Soc., 146, 1999–2049, https://doi.org/10.1002/qj.3803, 2020. a
Hounsou-Gbo, A., Servain, J., das Chagas Vasconcelos Junior, F., Martins, E. S. P. R., and Araújo, M.: Summer and winter Atlantic Niño: connections with ENSO and implications, Clim. Dynam., 55, 2939–2956, https://doi.org/10.1007/s00382-020-05424-x, 2020. a
ICDC: TDSCatalog, available at: https://icdc.cen.uni-hamburg.de/thredds/catalog/ftpthredds/EASYInit/oras5/catalog.html, last access: 10 May 2021. a
Jia, F., Cai, W., Wu, L., Gan, B., Wang, G., Kucharski, F., Chang, P., and Keenlyside, N.: Weakening Atlantic Niño–Pacific connection under greenhouse warming, Sci. Adv., 5, eaax4111, https://doi.org/10.1126/sciadv.aax4111, 2019. a, b, c, d
Jouanno, J., Hernandez, O., and Sanchez-Gomez, E.: Equatorial Atlantic interannual variability and its relation to dynamic and thermodynamic processes, Earth Syst. Dynam., 8, 1061–1069, https://doi.org/10.5194/esd-8-1061-2017, 2017. a
Kebe, I., Sylla, M. B., Omotosho, J. A., Nikiema, P. M., Gibba, P., and Giorgi, F.: Impact of GCM boundary forcing on regional climate modeling of West African summer monsoon precipitation and circulation features, Clim. Dynam., 48, 1503–1516, https://doi.org/10.1007/s00382-016-3156-x, 2016. a
Keenlyside, N. S. and Latif, M.: Understanding Equatorial Atlantic Interannual Variability, J. Climate, 20, 131–142, https://doi.org/10.1175/jcli3992.1, 2007. a, b
Kucharski, F. and Joshi, M. K.: Influence of tropical South Atlantic sea-surface temperatures on the Indian summer monsoon in CMIP5 models, Q. J. Roy. Meteorol. Soc., 143, 1351–1363, https://doi.org/10.1002/qj.3009, 2017. a
Kucharski, F., Bracco, A., Yoo, J. H., and Molteni, F.: Low-Frequency Variability of the Indian Monsoon–ENSO Relationship and the Tropical Atlantic: The “Weakening” of the 1980s and 1990s, J. Climate, 20, 4255–4266, https://doi.org/10.1175/jcli4254.1, 2007. a
Kucharski, F., Bracco, A., Yoo, J. H., and Molteni, F.: Atlantic forced component of the Indian monsoon interannual variability, Geophys. Res. Lett., 35, L04706, https://doi.org/10.1029/2007gl033037, 2008. a
Kucharski, F., Bracco, A., Yoo, J. H., Tompkins, A. M., Feudale, L., Ruti, P., and Dell-Aquila, A.: A Gill-Matsuno-type mechanism explains the tropical Atlantic influence on African and Indian monsoon rainfall, Q. J. Roy. Meteorol. Soc., 135, 569–579, https://doi.org/10.1002/qj.406, 2009. a, b
Lavaysse, C., Flamant, C., Evan, A., Janicot, S., and Gaetani, M.: Recent climatological trend of the Saharan heat low and its impact on the West African climate, Clim. Dynam., 47, 3479–3498, https://doi.org/10.1007/s00382-015-2847-z, 2015. a
Losada, T., Rodríguez-Fonseca, B., Janicot, S., Gervois, S., Chauvin, F., and Ruti, P.: A multi-model approach to the Atlantic Equatorial mode: impact on the West African monsoon, Clim. Dynam., 35, 29–43, https://doi.org/10.1007/s00382-009-0625-5, 2010a. a
Losada, T., Rodríguez-Fonseca, B., Polo, I., Janicot, S., Gervois, S., Chauvin, F., and Ruti, P.: Tropical response to the Atlantic Equatorial mode: AGCM multimodel approach, Clim. Dynam., 35, 45–52, https://doi.org/10.1007/s00382-009-0624-6, 2010b. a
Losada, T., Rodriguez-Fonseca, B., Mohino, E., Bader, J., Janicot, S., and Mechoso, C. R.: Tropical SST and Sahel rainfall: A non-stationary relationship, Geophys. Res. Lett., 39, L12705, https://doi.org/10.1029/2012GL052423, 2012. a
Lübbecke, J. F., Rodríguez-Fonseca, B., Richter, I., Martín-Rey, M., Losada, T., Polo, I., and Keenlyside, N. S.: Equatorial Atlantic variability-Modes, mechanisms, and global teleconnections, Wiley Interdisciplin. Rev.: Clim. Change, 9, e527, https://doi.org/10.1002/wcc.527, 2018. a
Manzanas, R., Amekudzi, L. K., Preko, K., Herrera, S., and Gutiérrez, J. M.: Precipitation variability and trends in Ghana: An intercomparison of observational and reanalysis products, Climatic Change, 124, 805–819, https://doi.org/10.1007/s10584-014-1100-9, 2014. a
Maranan, M., Fink, A. H., and Knippertz, P.: Rainfall types over southern West Africa: Objective identification, climatology and synoptic environment, Q. J. Roy. Meteorol. Soc., 144, 1628–1648, https://doi.org/10.1002/qj.3345, 2018. a
Mohino, E. and Losada, T.: Impacts of the Atlantic Equatorial Mode in a warmer climate, Clim. Dynam., 45, 2255–2271, https://doi.org/10.1007/s00382-015-2471-y, 2015. a, b, c
Murtugudde, R. G., Ballabrera-Poy, J., Beauchamp, J., and Busalacchi, A. J.: Relationship between zonal and meridional modes in the tropical Atlantic, Geophys. Res. Lett., 28, 4463–4466, https://doi.org/10.1029/2001gl013407, 2001. a
Nnamchi, H. C. and Li, J.: Influence of the South Atlantic Ocean Dipole on West African Summer Precipitation, J. Climate, 24, 1184–1197, https://doi.org/10.1175/2010JCLI3668.1, 2011. a
Nnamchi, H. C., Li, J., and Anyadike, R. N. C.: Does a dipole mode really exist in the South Atlantic Ocean?, J. Geophys. Res., 116, D15104, https://doi.org/10.1029/2010jd015579, 2011. a
Nnamchi, H. C., Li, J., Kucharski, F., Kang, I.-S., Keenlyside, N. S., Chang, P., and Farneti, R.: Thermodynamic controls of the Atlantic Niño, Nat. Commun., 6, 8895, https://doi.org/10.1038/ncomms9895, 2015. a
Nnamchi, H. C., Dike, V. N., Akinsanola, A. A., and Okoro, U. K.: Leading patterns of the satellite-era summer precipitation over West Africa and associated global teleconnections, Atmos. Res., 259, 105677, https://doi.org/10.1016/j.atmosres.2021.105677, 2021a. a, b
Nnamchi, H. C., Latif, M., Keenlyside, N. S., Kjellsson, J., and Richter, I.: Diabatic heating governs the seasonality of the Atlantic Niño, Nat. Commun., 12, 376, https://doi.org/10.1038/s41467-020-20452-1, 2021b. a
Okumura, Y. and Xie, S.-P.: Some Overlooked Features of Tropical Atlantic Climate Leading to a New Niño-Like Phenomenon, J. Climate, 19, 5859–5874, https://doi.org/10.1175/JCLI3928.1, 2006. a
O'Neill, B. C., Tebaldi, C., van Vuuren, D. P., Eyring, V., Friedlingstein, P., Hurtt, G., Knutti, R., Kriegler, E., Lamarque, J.-F., Lowe, J., Meehl, G. A., Moss, R., Riahi, K., and Sanderson, B. M.: The Scenario Model Intercomparison Project (ScenarioMIP) for CMIP6, Geosci. Model Dev., 9, 3461–3482, https://doi.org/10.5194/gmd-9-3461-2016, 2016. a
Polo, I., Rodríguez-Fonseca, B., Losada, T., and García-Serrano, J.: Tropical Atlantic Variability Modes (1979–2002). Part I: Time-Evolving SST Modes Related to West African Rainfall, J. Climate, 21, 6457–6475, https://doi.org/10.1175/2008JCLI2607.1, 2008. a
Prigent, A., Lübbecke, J. F., Bayr, T., Latif, M., and Wengel, C.: Weakened SST variability in the tropical Atlantic Ocean since 2000, Clim. Dynam., 54, 2731–2744, https://doi.org/10.1007/s00382-020-05138-0, 2020. a
Raj, J., Bangalath, H. K., and Stenchikov, G.: West African Monsoon: current state and future projections in a high-resolution AGCM, Clim. Dynam., 52, 6441–6461, https://doi.org/10.1007/s00382-018-4522-7, 2018. a
Rehfeld, K., Hébert, R., Lora, J. M., Lofverstrom, M., and Brierley, C. M.: Variability of surface climate in simulations of past and future, Earth Syst. Dynam., 11, 447–468, https://doi.org/10.5194/esd-11-447-2020, 2020. a
Richter, I. and Tokinaga, H.: An overview of the performance of CMIP6 models in the tropical Atlantic: mean state, variability, and remote impacts, Clim. Dynam., 55, 2579–2601, https://doi.org/10.1007/s00382-020-05409-w, 2020. a, b
Richter, I., Behera, S. K., Masumoto, Y., Taguchi, B., Sasaki, H., and Yamagata, T.: Multiple causes of interannual sea surface temperature variability in the equatorial Atlantic Ocean, Nat. Geosci., 6, 43–47, https://doi.org/10.1038/ngeo1660, 2012. a
Rochford, P.: SkillMetrics, GitHub [code], https://github.com/PeterRochford/SkillMetrics, last access: 23 Octobr 2020. a
Rodríguez-Fonseca, B., Polo, I., García-Serrano, J., Losada, T., Mohino, E., Mechoso, C. R., and Kucharski, F.: Are Atlantic Niños enhancing Pacific ENSO events in recent decades?, Geophys. Res. Lett., 36, L20705, https://doi.org/10.1029/2009gl040048, 2009. a
Rodríguez-Fonseca, B., Mohino, E., Mechoso, C. R., Caminade, C., Biasutti, M., Gaetani, M., Garcia-Serrano, J., Vizy, E. K., Cook, K., Xue, Y., Polo, I., Losada, T., Druyan, L., Fontaine, B., Bader, J., Doblas-Reyes, F. J., Goddard, L., Janicot, S., Arribas, A., Lau, W., Colman, A., Vellinga, M., Rowell, D. P., Kucharski, F., and Voldoire, A.: Variability and Predictability of West African Droughts: A Review on the Role of Sea Surface Temperature Anomalies, J. Climate, 28, 4034–4060, https://doi.org/10.1175/JCLI-D-14-00130.1, 2015. a
Ruiz-Barradas, A., Carton, J. A., and Nigam, S.: Structure of Interannual-to-Decadal Climate Variability in the Tropical Atlantic Sector, J. Climate, 13, 3285–3297, https://doi.org/10.1175/1520-0442(2000)013<3285:soitdc>2.0.co;2, 2000. a
Servain, J., Wainer, I., Ludos Ayina, H., and Roquet, H.: The relationship between the simulated climatic variability modes of the tropical Atlantic, Int. J. Climatol., 20, 939–953, https://doi.org/10.1002/1097-0088(200007)20:9<939::AID-JOC511>3.0.CO;2-V, 2000. a
Sow, M., Diakhaté, M., Dixon, R. D., Guichard, F., Dieng, D., and Gaye, A. T.: Uncertainties in the Annual Cycle of Rainfall Characteristics over West Africa in CMIP5 Models, Atmosphere, 11, 216, https://doi.org/10.3390/atmos11020216, 2020. a
Suárez-Moreno, R., Rodríguez-Fonseca, B., Barroso, J. A., and Fink, A. H.: Interdecadal Changes in the Leading Ocean Forcing of Sahelian Rainfall Interannual Variability: Atmospheric Dynamics and Role of Multidecadal SST Background, J. Climate, 31, 6687–6710, https://doi.org/10.1175/jcli-d-17-0367.1, 2018. a
Sultan, B., Baron, C., Dingkuhn, M., Sarr, B., and Janicot, S.: Agricultural impacts of large-scale variability of the West African monsoon, Agr. Forest Meteorol., 128, 93–110, https://doi.org/10.1016/j.agrformet.2004.08.005, 2005. a
Tall, M., Albergel, C., Bonan, B., Zheng, Y., Guichard, F., Dramé, M., Gaye, A., Sintondji, L., Hountondji, F., Nikiema, P., and Calvet, J.-C.: Towards a Long-Term Reanalysis of Land Surface Variables over Western Africa: LDAS-Monde Applied over Burkina Faso from 2001 to 2018, Remote Sens., 11, 735, https://doi.org/10.3390/rs11060735, 2019. a
Tebaldi, C., Arblaster, J. M., and Knutti, R.: Mapping model agreement on future climate projections, Geophys. Res. Lett., 38, L23701, https://doi.org/10.1029/2011gl049863, 2011. a
Tokinaga, H. and Xie, S.-P.: Weakening of the equatorial Atlantic cold tongue over the past six decades, Nat. Geosci., 4, 222–226, https://doi.org/10.1038/ngeo1078, 2011. a, b, c
Tokinaga, H., Richter, I., and Kosaka, Y.: ENSO Influence on the Atlantic Niño, Revisited: Multi-Year versus Single-Year ENSO Events, J. Climate, 32, 4585–4600, https://doi.org/10.1175/jcli-d-18-0683.1, 2019. a
Wainwright, C. M., Hirons, L. C., Klingaman, N. P., Allan, R. P., Black, E., and Turner, A. G.: The impact of air–sea coupling and ocean biases on the seasonal cycle of southern West African precipitation, Clim. Dynam., 53, 7027–7044, https://doi.org/10.1007/s00382-019-04973-0, 2019. a, b, c
WCRP: CMIP6, available at: https://esgf-node.llnl.gov/search/cmip6/, last access: 18 March 2021. a
Worou, K., Goosse, H., Fichefet, T., Guichard, F., and Diakhate, M.: Interannual variability of rainfall in the Guinean Coast region and its links with sea surface temperature changes over the twentieth century for the different seasons, Clim. Dynam., 55, 449–470, https://doi.org/10.1007/s00382-020-05276-5, 2020. a, b
Zebiak, S. E.: Air–Sea Interaction in the Equatorial Atlantic Region, J. Climate, 6, 1567–1586, https://doi.org/10.1175/1520-0442(1993)006<1567:AIITEA>2.0.CO;2, 1993. a, b
Zuo, H., Balmaseda, M. A., Tietsche, S., Mogensen, K., and Mayer, M.: The ECMWF operational ensemble reanalysis–analysis system for ocean and sea ice: a description of the system and assessment, Ocean Sci., 15, 779–808, https://doi.org/10.5194/os-15-779-2019, 2019. a
- Abstract
- Introduction
- Data and methods
- Evaluation of the performance of the GCMs in simulating the rainfall in the Guinea Coast, SST in ATL3 region and JAS SST pattern related to the Atlantic Niño
- Evaluation of the performance of the GCMs in simulating the JAS rainfall pattern related to the Atlantic Niño
- Future impact of the Atlantic Niño on the rainfall over the tropical Atlantic and Guinea Coast
- Discussion and conclusion
- Code availability
- Data availability
- Author contributions
- Competing interests
- Disclaimer
- Acknowledgements
- Review statement
- References
- Supplement