the Creative Commons Attribution 4.0 License.
the Creative Commons Attribution 4.0 License.
 | 24 Jan 2022
Sensitivity of land–atmosphere coupling strength to changing atmospheric temperature and moisture over Europe
Thomas Schwitalla
Oliver Branch
Kirsten Warrach-Sagi
Volker Wulfmeyer
The quantification of land–atmosphere coupling strength is still challenging, particularly in the atmospheric segment of the local coupling process chain. This is in part caused by a lack of spatially comprehensive observations of atmospheric temperature and specific humidity which form the verification basis for the common process-based coupling metrics. In this study, we aim at investigating where uncertainty in the atmospheric temperature and moisture affects the land–atmosphere coupling strength over Europe, and how changes in the mean temperature and moisture, as well as their vertical gradients, influence the coupling. For this purpose, we implemented systematic a posteriori modifications to the temperature and moisture fields from a regional climate simulation to create a spread in the atmospheric conditions. Afterwards, the process-based coupling metric convective triggering potential – low-level humidity index framework was applied to each modification case.
Comparing all modification cases to the unmodified control case revealed that a strong coupling hotspot region in northeastern Europe was insensitive to temperature and moisture changes, although the number of potential coupling days varied by up to 20 d per summer season. The predominance of positive feedbacks remained unchanged in the northern part of the hotspot, and none of the modifications changed the frequent inhibition of feedbacks due to dry conditions in the atmosphere over the Mediterranean and the Iberian Peninsula. However, in the southern hotspot region in the north of the Black Sea, the dominant coupling class frequently switched between wet soil advantage and transition zone. Thus, both the coupling strength and the predominant sign of feedbacks were sensitive to changes in temperature and moisture in this region. This implies not only uncertainty in the quantification of land–atmosphere coupling strength but also the potential that climate-change-induced temperature and moisture changes considerably impact the climate there, because they also change the predominant atmospheric response to land surface wetness.
- Article
(20869 KB) - Full-text XML
-
Supplement
(568 KB) - BibTeX
- EndNote


Land–atmosphere (L–A) coupling describes the covariability between the land and atmospheric states, and plays a key role for understanding states in the climate system such as the evolution of the atmospheric boundary layer (ABL) temperatures and humidities. It shapes, e.g., the atmospheric water and energy cycles, and through this influences the intensity and duration of extreme events such as heat waves (Ukkola et al., 2018; Jaeger and Seneviratne, 2011; van Heerwaarden and Teuling, 2014; Schumacher et al., 2019), drought periods (Miralles et al., 2019) or the occurrence of heavy rainfall events. Furthermore, the feedback processes influence the climate response to land surface modifications (Hirsch et al., 2014; Laguë et al., 2019) suggesting the importance of the processes' accurate representation in climate models to improve projections.
The local coupling (LoCo) process chain outlines the connection between soil moisture and precipitation through the turbulent surface fluxes modifying the evolution of the ABL, and finally, leading to different conditions for cloud and precipitation formation (Santanello et al., 2009, 2011). Various coupling metrics have been developed to investigate the nature and intensity of this and other relationships in the climate system (Santanello et al., 2018). Individual processes in the chain exhibit different intensities and the feedback sign can diverge in dependence of the region (e.g., Findell et al., 2011; Findell and Eltahir, 2003a, b; Knist et al., 2017; Koster et al., 2004) and the period of time investigated. Coupling hotspots mainly occur in transition regions between dry and wet climates (e.g., Gentine et al., 2013; Koster et al., 2004; Taylor et al., 2012). Temporal variability is apparent at interannual scales (Guo and Dirmeyer, 2013; Lorenz et al., 2015) and in trends of the coupling strength (Dirmeyer et al., 2012, 2013; Seneviratne et al., 2006).
Uncertainty remains in the accurate quantification of the coupling strength along the LoCo process chain, especially in the atmospheric segment. From the physical perspective, the strength is influenced by both the prevailing land surface and the atmospheric state. Jach et al. (2020) showed that extreme afforestation led to weaker coupling between surface moisture and convection triggering, and a less pronounced favor for convection triggering over wet soils in the European summer. The conversion of current vegetation to grassland had the opposite effect. However, Davin et al. (2020) showed that the same land use and land cover change scenarios as used in Jach et al. (2020) initiated different responses in near-surface temperature within the ensemble of regional climate models from the flagship pilot study “Land-Use and Climate Across Scales” (LUCAS) due to deficiencies in the computation of evapotranspiration. Understanding potential implications of these uncertainties for impacts of land use and land cover changes on L–A coupling strength and climate variability was one motivation of our study.
From the technical perspective, the coupling strength is influenced by the choice of the dataset used for the investigation (Dirmeyer et al., 2018; Ferguson and Wood, 2011) and, in the case of models, their configuration such as parameterization schemes (Chen et al., 2017; Milovac et al., 2016; Pitman et al., 2009), initialization (Santanello et al., 2019) or model resolution (Hohenegger et al., 2009; Knist et al., 2020; Sun and Pritchard, 2016, 2018; Taylor et al., 2013). Studies on the regional scale over Europe often use a single model (Baur et al., 2018; Jach et al., 2020; Lorenz et al., 2012) or target only the terrestrial segment (soil moisture–surface flux coupling) of the local coupling process chain (Knist et al., 2017). Coordinated model intercomparison studies such as the Global Land–Atmosphere Coupling Experiment (GLACE) initiative apply general circulation or earth system models (Guo et al., 2006; Koster et al., 2006, 2011; Comer and Best, 2012). On the one hand, this circumvents the need to use lateral boundary layer forcing. On the other hand, the horizontal resolution of these model runs is usually on the order of 1 to 2∘ grid spacing. This reduces the models' ability to represent detailed surface characteristics. These, in turn, play a key role for triggering convection, e.g., due to differential heating.
The “convective triggering potential – low-level humidity index” (CTP-HIlow) framework (Findell and Eltahir, 2003a, b) is a commonly used process-based coupling metric to investigate the link between surface moisture and convection triggering. It is based on the hypothesis that the structure of the early morning ABL (atmospheric pre-conditioning) gives an indication about the likelihood for locally triggered afternoon precipitation over differently wet soils. Later works added soil moisture (Roundy et al., 2013) or the evaporative fraction (Findell et al., 2011; Berg et al., 2013) as a third dimension. Efforts have been made to test the global applicability of the framework, which made use of climatologies of the metrics (Ferguson and Wood, 2011; Wakefield et al., 2019).
Analyzing the atmospheric segment on a process-based level requires information about the vertical structure of the atmosphere. The data requirements for studying the atmospheric segment of L–A coupling on the process level and in a spatially explicit way can be summarized as follows: vertical temperature and moisture profiles are needed (1) with a sufficiently long data record (period of at least 12 summers for metrics targeting convection triggering), to comply to the data length requirements for robust results (Findell et al., 2015), (2) with a high-enough temporal resolution to be able to extract the time step close to the local sunrise and (3) increasing vertical resolutions improve the estimate (Wakefield et al., 2021). These high requirements limit the datasets available for a study on the continental scale for Europe. Observations of early morning vertical temperature and moisture profiles are rare and usually point measurements. The typical radiosonde launch times (00:00 and 12:00 UTC) do not cover the early morning hours over Europe. Other observational products such as satellite-based profile data have been successfully used to apply the CTP-HIlow framework on Roundy and Santanello (2017), although they often have coarse vertical resolutions (Wulfmeyer et al., 2015). The lack of suitable observations challenges the validation of results, which provides the incentive for building up a network of coordinated measurement sites like the Land-Atmosphere Feedback Observatory (LAFO) of the University of Hohenheim (Wulfmeyer et al., 2020; Späth et al., 2019).
To study how sensitive the atmospheric segment of L–A coupling strength responds to differences in the atmospheric pre-conditioning, we developed an approach with which the temperature and moisture output fields from a regional climate model run were modified after the simulation and before applying the CTP-HIlow framework. The modifications are expected to change the pre-conditioning and thus potentially the coupling classification. First of all, frequent changes in the classification show that it lies at the boundaries of different classes. However, assuming that the classification framework is accurate enough, frequent changes also reveal that the expectable coupling signal remains uncertain. This is shown as changes in the atmospheric conditions in a presumably realistic range for the current climate could initiate different atmospheric responses such as triggering deep, shallow or no convection in different cases in the same region. Furthermore, it indicates a sensitivity of the coupling to changes in the atmosphere, e.g., arising from climate change or changes at the land surface.
The approach is based on our hypothesis that the temperature and moisture fields can diverge in their mean, as well as their vertical, temporal and horizontal distributions, and the framework only recognizes the differences regardless of their origin. Hence, besides identifying regions with a high sensitivity to differences in the atmospheric conditions, we are able to approximate a range in coupling strength of the atmospheric segment. Here, we focus on the impacts of differences in the mean states and the vertical gradients of temperature and specific humidity in the posterior modification cases compared to the CTRL. For this purpose, we have set up two sets of cases: one targeting the analysis of differences in the mean state and one the analysis of differences in the vertical gradients. Temperature modifications at the surface range between ±2 K, which is derived from an acceptable range of near-surface temperature biases occurring in climate simulations as defined by Kotlarski et al. (2014), and decrease over height. The a posteriori modifications of moisture were implemented under consideration of the close relationship between temperature and water vapor in the atmosphere, thus taking into account the respective temperature modification (e.g., Willett et al., 2010; Bastin et al., 2019).
With this approach we focus on two research questions:
-
How sensitive is the L–A coupling strength to modification of temperature and moisture profiles during the European summer months (JJA)?
-
Where can we identify reliable L–A coupling hotspots over Europe?
The paper is structured as follows: Sect. 2 describes the dataset analysis methods applied. This is followed by the analysis of the impacts of temperature and moisture modifications on estimates of L–A coupling strength over Europe in Sect. 3. The discussion of the results follows in Sect. 4, and finally, in Sect. 5, we summarize our findings and provide potential implications and an outlook on future research.
2.1 Data
2.1.1 Model data
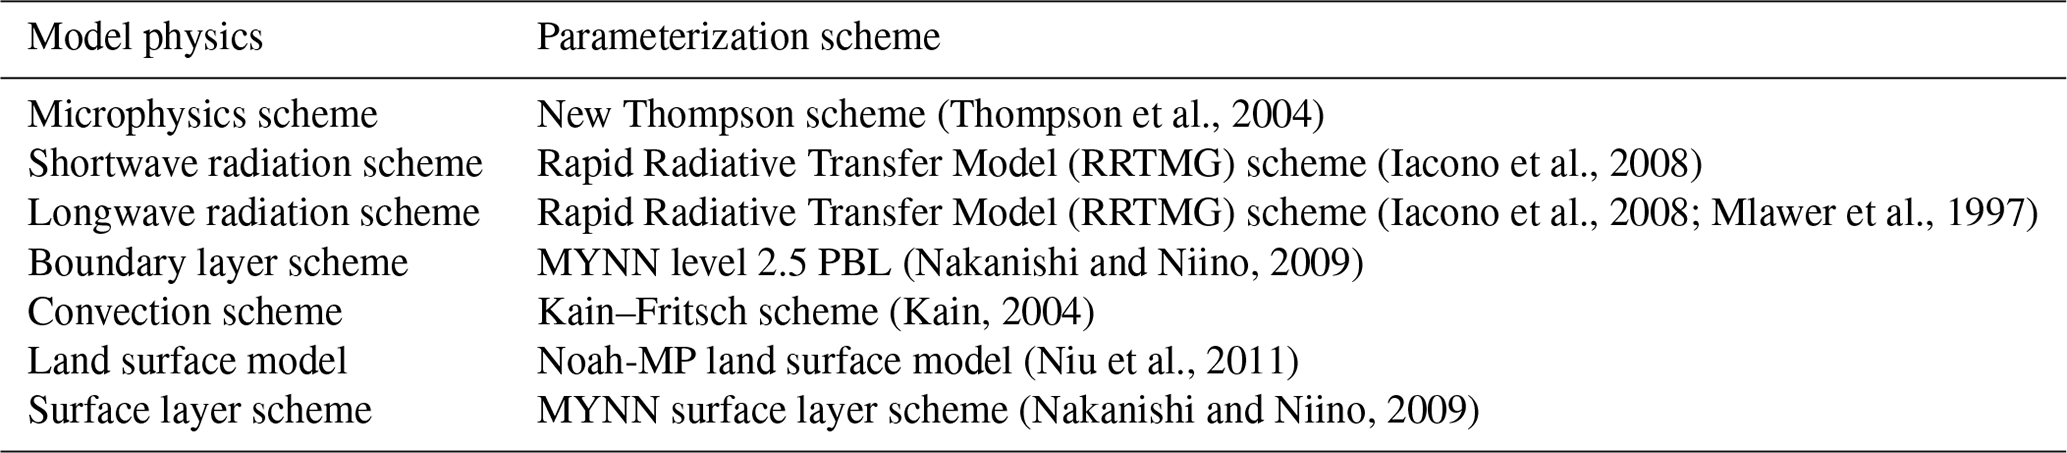
The database for the following analysis is a model simulation of Jach et al. (2020) hereafter named CTRL. It is a regional climate simulation on a 0.44∘ grid increment conducted with the Weather Research and Forecasting (WRF) model version 3.8.1 (Skamarock et al., 2008; Powers et al., 2017) coupled to the Noah-MP land surface model (Niu et al., 2011). The applied parameterizations are summarized in Table 1. The simulation was forced with ERA-Interim reanalysis data from the European Centre for Medium-Range Weather Forecasts (ECMWF) (Dee et al., 2011) for the period 1986–2015 over the EURO-CORDEX domain (Jacob et al., 2020). The vegetation map is based on the CORINE land cover classification from 2006 (European Environmental Agency, 2013), and the soil texture was derived from the Harmonized World Soil Database at 30 arcsec grid spacing (Milovac et al., 2014). The simulation is part of the model ensemble of the regional model intercomparison project LUCAS. LUCAS investigates impacts of the implementation of land use and land cover changes in regional climate simulations.
Table 1Applied parameterizations of the simulations from Jach et al. (2020).
2.2 CTP-HIlow framework
The coupling metric CTP-HIlow framework (Findell and Eltahir, 2003a, b) was used to estimate the coupling strength between land surface moisture and convection triggering. It utilizes vertical temperature and moisture profiles around sunrise to calculate an atmospheric stability (CTP) and humidity deficit (HIlow) measures.
CTP depicts the divergence of the temperature profile from the moist adiabatic lapse rate integrated between 100 and 300 hPa a.g.l. (above ground level) and is given in the unit J kg−1. Its calculation is analogous to that of CAPE for the predefined layer using modeled air temperature. Analyzing this specific layer follows the hypothesis that the ABL top is almost always incorporated, and hence differences in the atmospheric structure may reveal differences in the likelihood for convection triggering. The pressure height estimates are valid for Europe but may limit the investigation of pre-conditioning in hot and arid regions, where the ABL usually grows to higher altitudes throughout the day. However, the variables CTP and HIlow have been used in combination with wind shear before within arid regions with good predictive skill for convection initiation triggered by differential surface heating (e.g., Branch and Wulfmeyer, 2019). Large CTP values denote strong divergence of the temperature profiles from the moist adiabat and hence greater instability. Small but positive values indicate temperature profiles that are close to the moist adiabat, i.e., conditionally unstable, and negative CTP values indicate a temperature inversion in the layer between 100 and 300 hPa above ground, which would inhibit deep convection and the formation of precipitation throughout the subsequent day.
The HIlow measures the dew-point depression at 50 and 150 hPa a.g.l. and has the unit ∘C:
where is the temperature at 50 hPa a.g.l. and the dew-point temperature at 50 hPa a.g.l. Equivalently, and are the temperature and dew-point temperature, respectively, at 150 hPa a.g.l.
CTP and HIlow form the basis for categorizing early morning ABL conditions on a daily basis in (1) prone-to-triggering convection over wet or (2) dry soils, (3) a transition zone between wet and dry advantages, or (4) conditions inhibiting a contribution of the land surface to the triggering of deep convection. In the latter case, the occurrence of precipitation is purely atmospherically controlled (AC). This can have three causes: either the ABL is very humid (HIlow<5 ∘C) and rainfall is just as likely to occur over any surface, or the ABL is very dry (HIlow>15 ∘C) and moist convection and precipitation rarely occur in general. Finally, when the ABL is stable (CTP < 0 J kg−1), deep convection is inhibited by an inversion. Only shallow clouds can occur. The first three defined classes (1–3) are jointly considered as non-atmospherically controlled (nAC). These indicate the percentage of days within the study period with high potential for feedbacks of any kind. Triggering convection over wet soils (1) follows the hydrological pathway meaning positive soil moisture–evapotranspiration–precipitation feedbacks. Hence, greater soil moisture leads to a moistening of the ABL through evapotranspiration and more precipitation. Conversely, triggering convection over dry soils (2) occurs along the thermal triggering pathway during which a high sensible heat flux leads to boundary layer growth and upward mixing of moist air to heights where condensation and formation of rainfall can occur (Dirmeyer et al., 2014). In the transition zone, convection can be triggered over wet or dry soils, though no convection is the most likely outcome. Here, we apply the original threshold values from Findell and Eltahir (2003a), which are shown in Fig. 1a.
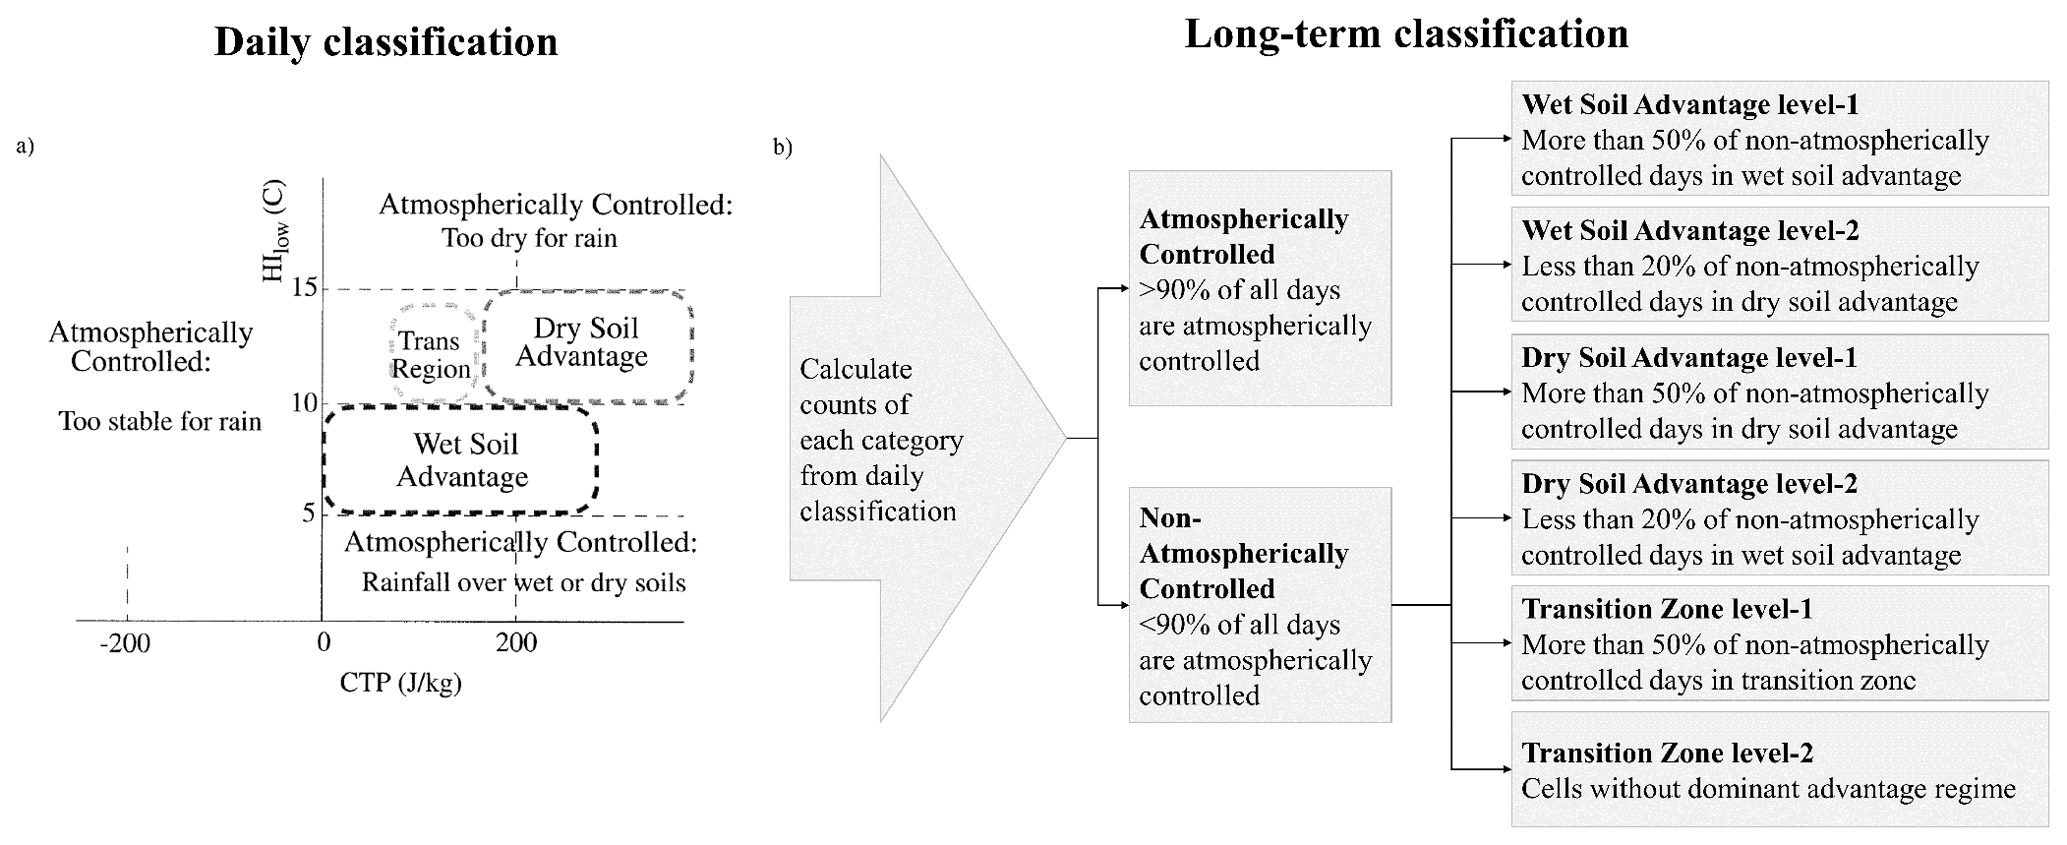
Figure 1Schematic depicting the coupling strength classification with the convective triggering potential – low-level humidity (CTP-HIlow) framework by Findell and Eltahir (2003a, b) (adopted from Jach et al., 2020). Panel (a) shows the threshold values from Findell and Eltahir (2003a); their Fig. 15. Panel (b) summarizes the approach for the long-term classification as explained in Findell and Eltahir (2003b).
The daily coupling classes are then used to derive a long-term coupling regime for each grid cell, based on the relative occurrence of each class during the study period (Fig. 1b). At first, a cell with more than 90 % of the days in the study period under atmospheric control is defined as AC. If this is not the case, the partitioning of the nAC days in wet and dry soil advantage, as well as transition zone days, is used to determine the dominant coupling class. A level-1 coupling regime denotes that >50 % of the nAC days in the cell are in the respective coupling class. Level-2 wet or dry soil advantage means that less than 20 % of the respective other class occurs in the cell during the study period, while level-2 transition zone covers all cells remaining unlabeled.
2.3 Modification approach
Early morning profiles of temperature and moisture are required to compute the CTP-HIlow framework investigating the pre-conditioning for convection triggering during the day. Due to the large expansion of the domain covering several time zones, the ABL evolution on the eastern edge of the domain is in a different stage as that of the western edge at the same UTC time step, which can lead to substantial differences in the results of the coupling metric (Wakefield et al., 2021). Hence, the accurate UTC time step to depict the pre-convective ABL for the coupling assessment cannot be unified throughout the domain. To ensure this comparability between eastern and western Europe, we determined the sunrise hour in the model using shortwave downward radiation. The profiles were extracted for the UTC time step in which shortwave downward radiation exceeded a value of zero the first time for each day and cell. The profiles from model output around local time sunrise of each day serve as the basis for the sensitivity analysis. In the following section, we describe how the profiles were modified. The approach is based on our hypothesis that the temperature and moisture fields can vary in terms of their mean, and their horizontal, vertical and temporal distributions. In this study, we investigate the impact of modifying the mean and the vertical distribution. The temporal and horizontal distributions were not modified, although, e.g., warming is known to widen and flatten the distribution of temperature over time and therefore slightly change the shape of the distribution. The processes and mechanisms leading to a change in the temporal distribution are complex and non-linear, meaning that they cannot be reproduced easily by the modifications. Differences in the spatial distribution (such as warmer conditions in France with colder conditions over eastern Europe) were not specifically depicted. The CTP-HIlow framework utilizes single columns and does not recognize horizontal connections.
2.3.1 Temperature modifications
The temperature profiles were modified by adding a constant temperature (T) factor in Kelvin to the daily profiles. The factor is fixed in time, homogeneous over the domain and decreases with altitude. Decreasing the impact over height follows the hypothesis that a surface temperature change does not propagate evenly throughout the atmospheric column. The T factor for each atmospheric layer was derived using a simple linear regression model and calculating the mean coefficient of determination for each atmospheric layer. Therefore, it corresponds to the fraction of variance in temperature for each atmospheric layer explainable by the temperature variance at the surface.
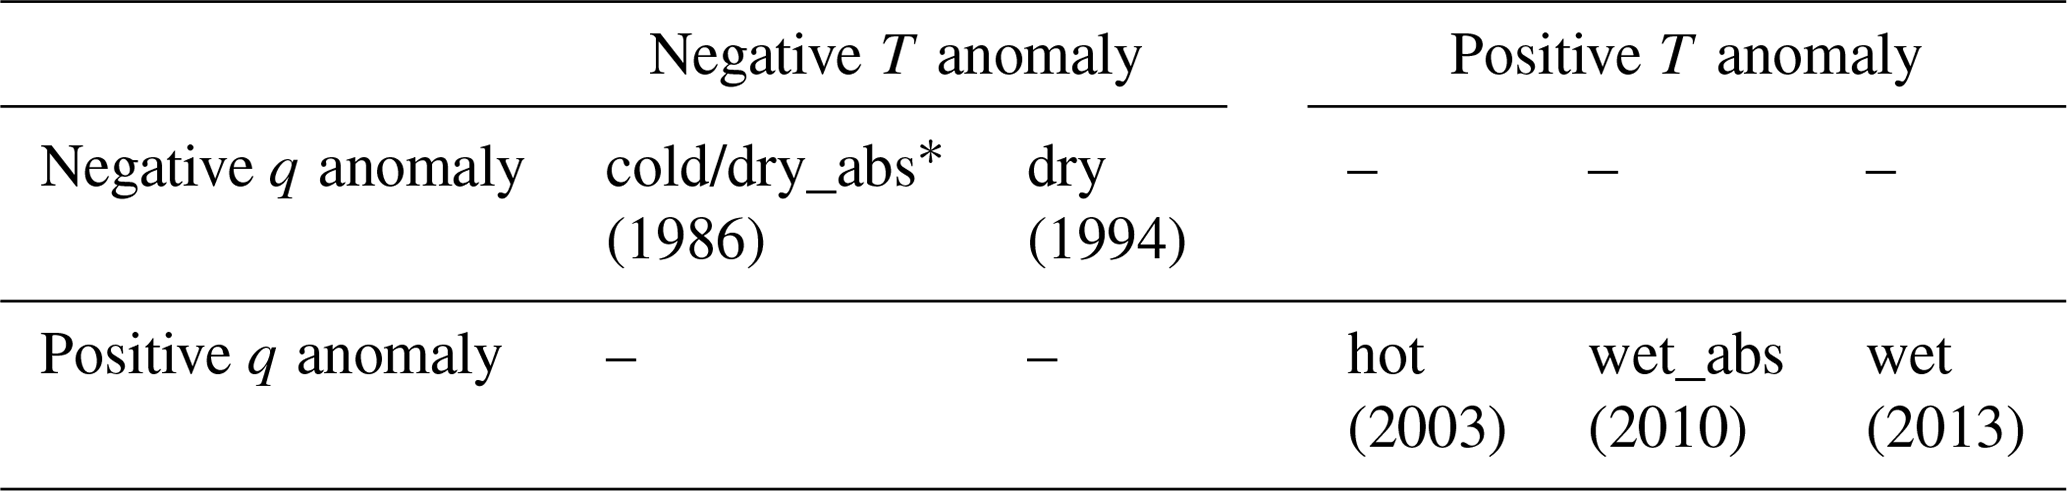
The first set of temperature modifications (hereafter called the core set) captures differences in the mean air temperature near the surface and in the vertical by applying the temperature factor. In this case, the modification amounts to ±2 K at the surface ( factor). This range was derived from the acceptable range of biases in temperatures in Kotlarski et al. (2014). Plots with stronger modifications of ±5 K covering the full range of the model bias of this particular run are provided in the Supplement. A second set of modifications served to investigate the effect of differences in the shape of the profiles (e.g., greater or smaller inversions) leading to differences in the gradients. For this purpose, we determined the divergence of the mean temperature profiles of summers with the highest near-surface temperature or near-surface moisture anomalies from the mean temperature profile of all 30 years to produce five divergence T factors. Chosen were the summers with (1) minimum (cold) and (2) maximum (hot) near-surface temperature, as well as the summers with the (3) minimum (dry) and (4) maximum (wet) near-surface relative humidity, as well as (5) maximum near-surface specific humidity (wet_abs). The year with the minimum near-surface specific humidity corresponds to the cold summer. Table 2 summarizes the years chosen for the divergence T factors and the sign of their surface temperature and moisture anomalies, respectively. These were added to the temperature profiles from the CTRL run on a daily basis. In a second step, the divergence cases were further modified by adding the same factor used for the core set in order to investigate the effect of differences in the gradient with additional surface warming or cooling on the coupling strength. Larger modification factors up to ±5 K led to similar patterns of differences and diverged in the magnitude of the impact in most cases.
Table 2Anomalies from the JJA mean of the CTRL run in temperature and moisture in years chosen as basis for the alternative factors; * indicates that the cold and dry_abs are the same year.
2.3.2 Moisture modifications
Besides the temperature, also the moisture content in the atmosphere is expected to have an impact on the coupling strength. Willett et al. (2010) investigated the scaling of concurrent temperature and moisture changes for different regions around the globe based on observations and models. For the Northern Hemisphere, they found that temperature and moisture are strongly positively correlated and that 1 K temperature changes corresponds to on average 8.81 % change in moisture. The factors for northern (9.66 % K−1) and southern (7.74 % K−1) Europe slightly deviate. Under the assumption that the scaling is valid through the entire atmospheric column, the Northern Hemisphere factor was used for the moisture modifications. Hence, the magnitude of the change is dependent on the respective temperature modification and the moisture present in the atmosphere in the CTRL. This ensures two things: first, the relation of temperature and moisture is maintained, and second, the higher atmospheric layers do not experience unrealistic increases in moisture, which could have occurred using fixed factors. As for the temperature modifications, the mean moisture and the shape of the profiles were modified but the temporal and spatial variances were not.
To further prevent the development of unrealistically high moisture content in the atmosphere in humid regions, the saturation vapor pressure was determined for the temperature after modification and used to cap the moisture increase. Negative moisture content was prevented by setting a lower boundary of 0 g kg−1. Thus, the relative humidity (in terms of specific humidity divided by saturation specific humidity) is designed to remain between 0 % and 100 % in all atmospheric layers.
2.4 Statistical sensitivity assessment
A sensitivity index was used to achieve a grid wise estimate whether temperature modifications or moisture modifications have a higher impact on the corresponding variable. The index compares the magnitude of differences in a variable x caused by modifying moisture or temperature only from the CTRL. The approach is described using the following formula:
where xref is the value of the unmodified case, is the value of the modification case of isolated decrease in moisture, is the case with an isolated increase in moisture, is the case with an isolated decrease in temperature, and is the case with an isolated increase in temperature, respectively. Thus, the modification cases with isolated temperature or moisture modifications were used for this analysis. The index was then normalized to a value between −1 and 1 by dividing the squared sum of differences induced by moisture changes minus the squared sum of differences induced by temperature changes by the total squared sum of differences from the CTRL in all cases. A sensitivity index close to −1 indicates a strong temperature control on the variable, while a sensitivity index close to 1 indicates a strong moisture control. With a sensitivity index around 0, moisture and temperature variations have an equal impact on changes in x.
In this study, we used the temperature modification of ±2 K, and the cases with the corresponding moisture modifications of % K−1, from the core modifications set to estimate the relative importance of temperature versus moisture changes for CTP, HIlow and the occurrence of nAC days, wet and dry soil advantage as well as transition zone days. We limited the analysis to regions where on average at least 2 d per summer (∼2.5 % of the summer days) are in the respective category.
2.5 Uncertainty of hotspot location and feedback sign
Two measures were used to depict the sensitivity of the long-term coupling regimes in the modification cases. The first metric Ifeed measures the degree of agreement of the long-term classification based on the CTP-HIlow framework among the modification cases with that of the CTRL case. A value close to 1 indicates that nearly all modifications had the same long-term coupling regime no matter which modification factors were applied. A value close to 0 indicates an overall disagreement in the long-term coupling regimes with the CTRL case indicating that the classification is sensitive to differences in the temperature and moisture profiles.
with denoting the sum of modification cases in which the long-term coupling regimes disagree with that of the CTRL case, and n being the number of all modification cases tested. A second metric Icat was used to quantify the share of modification cases in which each of the coupling classes occurred. It was determined for nAC days, and days in wet soil advantage, dry soil advantage or transition zone. Level-1 and level-2 cells of the coupling classes were grouped together before deriving the metric.
with ncat being the number of modification cases in the respective regime. A value of 0 denotes that the class was never dominant and a value of 1 denotes that the class was always dominant.
3.1 Comparison model and reanalysis
This section provides a statistical comparison of the mean and temporal distribution of near-surface temperature and specific humidity from the CTRL run with an ERA5-based bias-corrected reanalysis dataset (C3S, 2020) to quantify uncertainty originating from climatological inconsistencies of the model as compared to the reanalysis data. The statistical analyses comprise of the bias and two measures to compare the temporal distributions: a statistical z test and the probability density function (PDF) skill score after Perkins et al. (2007).
The model has a dry bias over the Mediterranean, France and the British Isles, and the z test showed that the temperature distribution is shifted towards warmer conditions (Fig. 2a and b). Over the eastern part of the domain, the model has a cold bias and overestimates the frequency of cooler days. The z value, which remained consistently below 2 throughout the domain, indicated that the differences in the temporal distribution are statistically insignificant. The PDF skill score drew a similar picture (Fig. 2c). The distributions strongly resemble with values > 0.8 over most of central and eastern Europe as well as over the high latitudes. The skill is weaker in the southern part of the domain. The model particularly misrepresents the temperature distribution over the Alpine region, in the south of the Black Sea and the northern African desert.
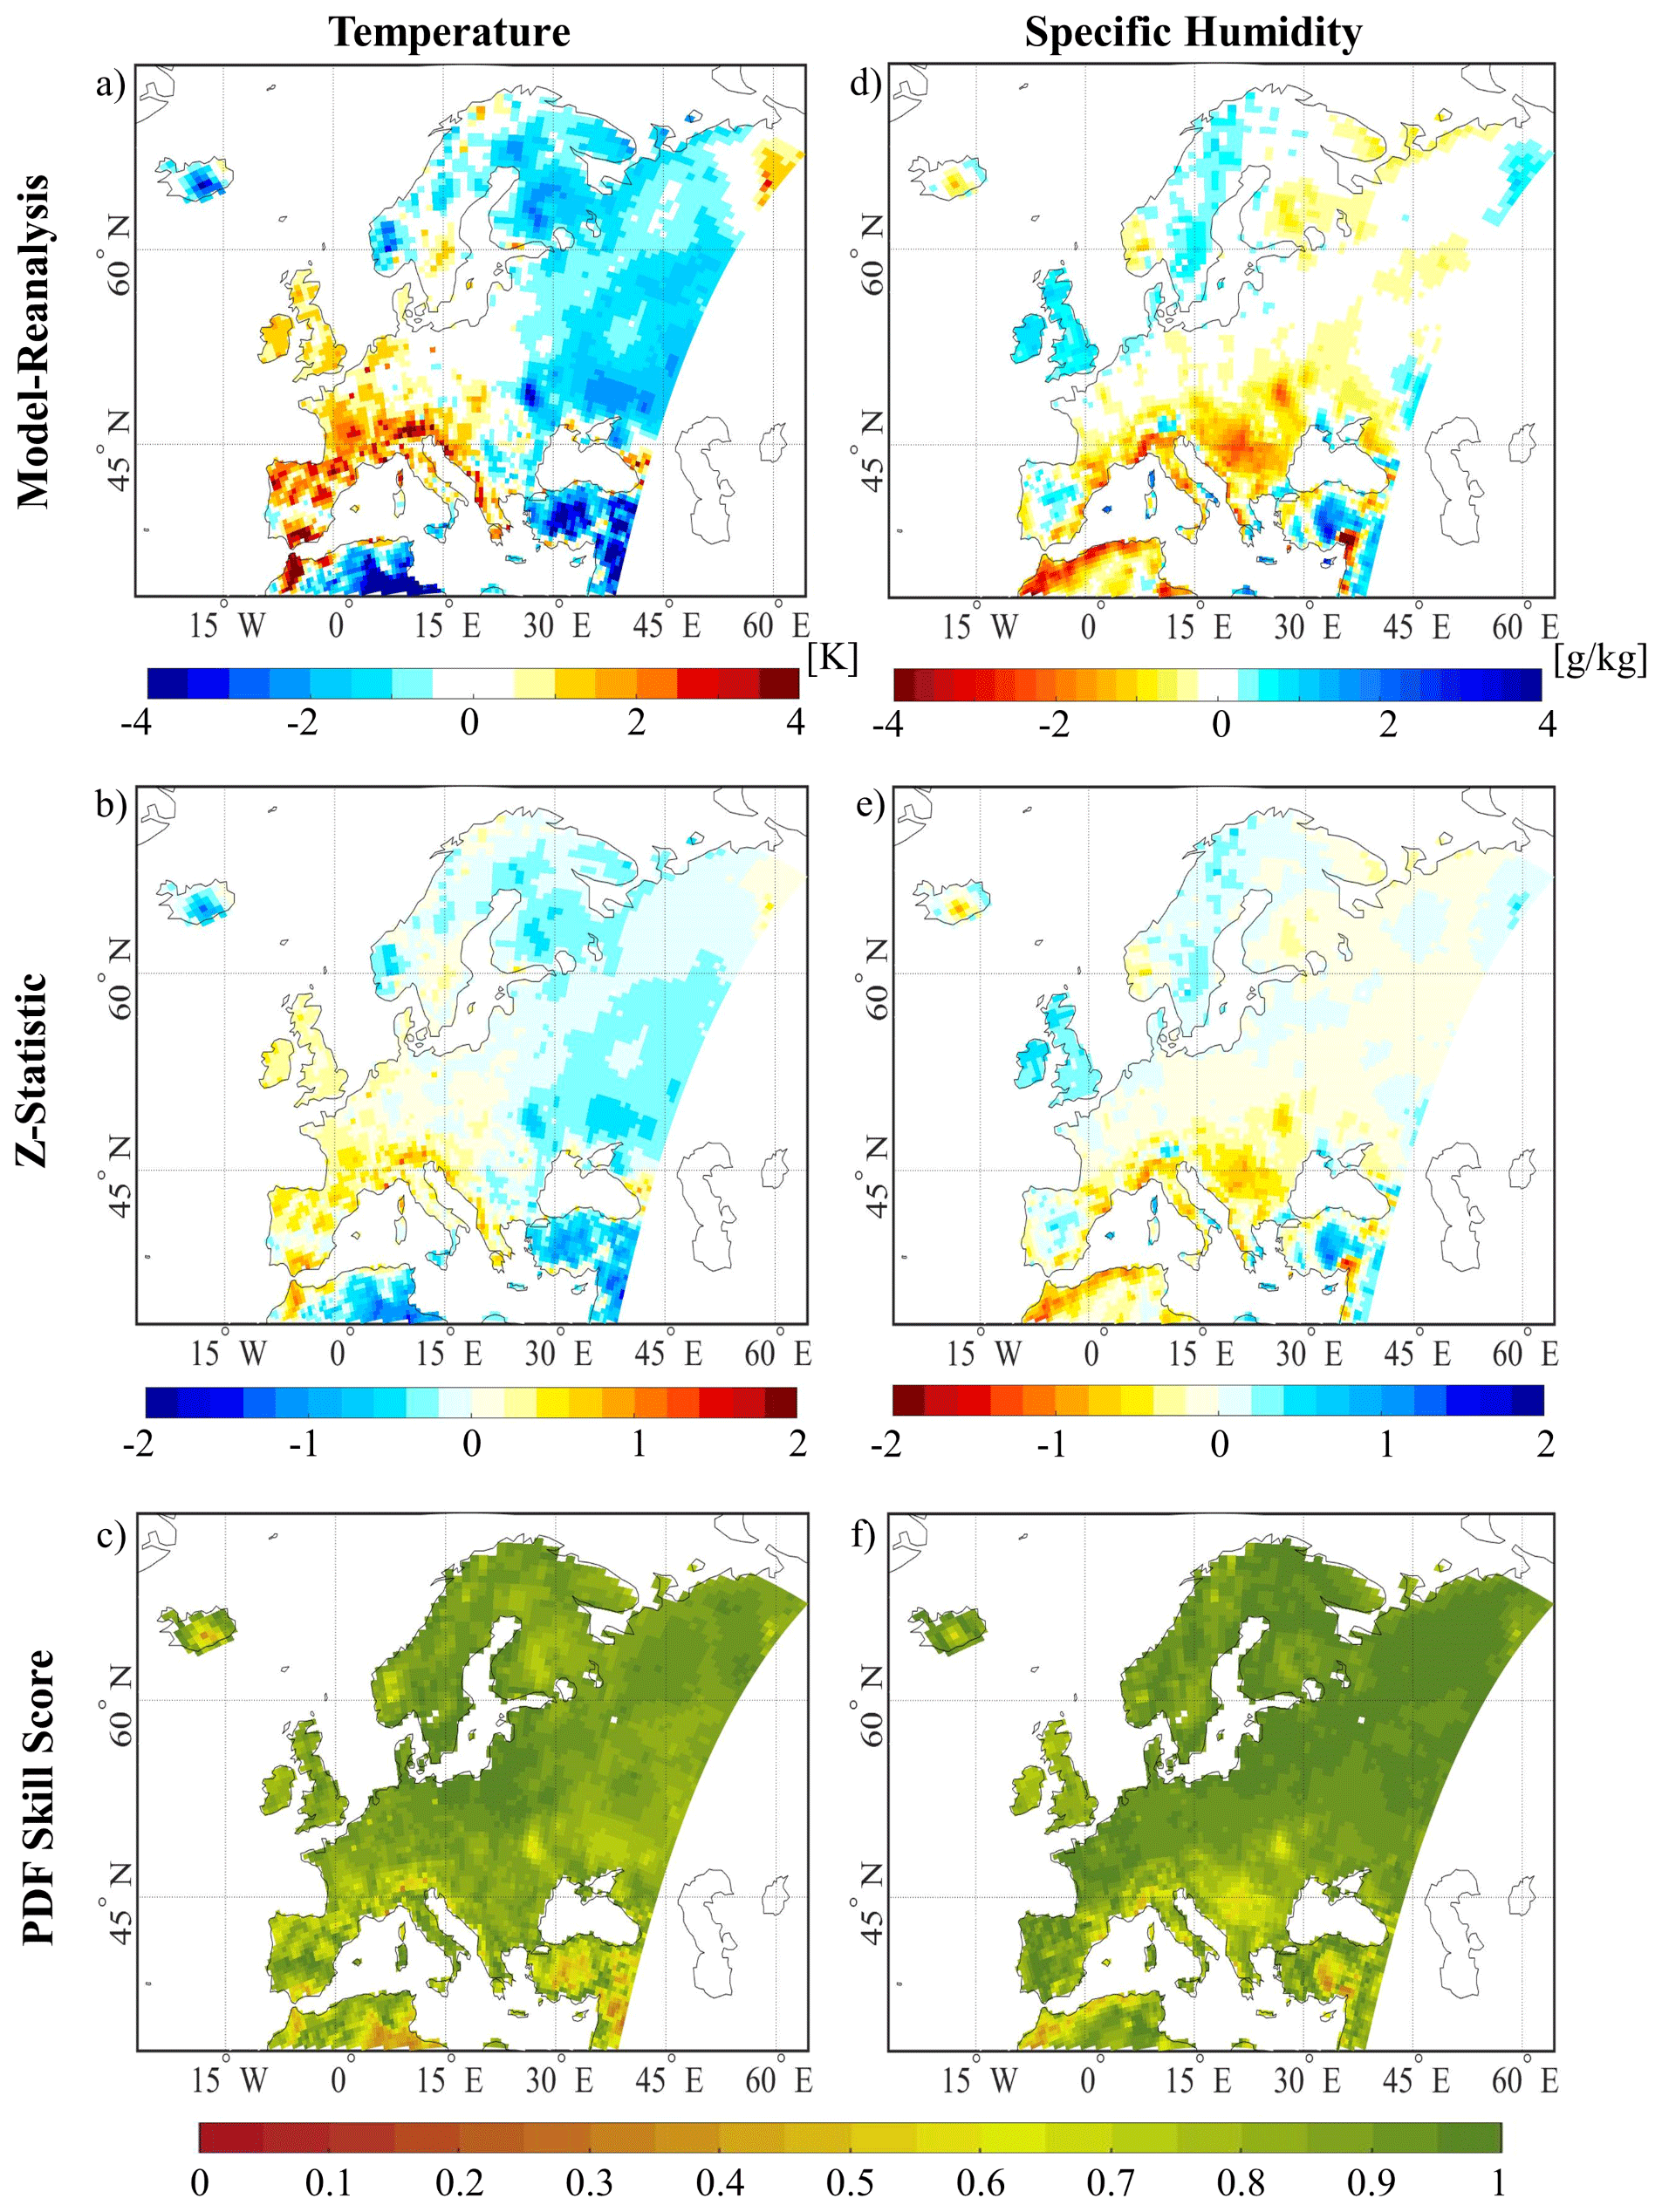
Figure 2Statistical metrics for comparison of modeled temperature and specific humidity from CTRL with bias-corrected ERA5 reanalysis data (C3S, 2020). Panel (a) shows the value of a Z statistic comparing the temporal distribution of modeled temperature with reanalysis; panel (b) shows the PDF skill score as a second measure to compare the temporal distribution of modeled temperature with reanalysis. Panels (c, d) are the same as (a, b) but for specific humidity.
The moisture bias is presented in terms of the specific humidity. The model has a dry bias of up to −2 g kg−1 over the Mediterranean and southeastern Europe (Fig. 2d), which corresponds to maximally 20 % difference from the climatological mean of the reanalysis data in summer. The specific humidity is slightly overestimated by up to 0.5 g kg−1 over Scandinavia and the British Isles and slightly underestimated in central and eastern Europe in the same range. The differences in specific humidity correspond to less than 10 % difference from the climatological mean (not shown). The z statistic showed that the temporal distribution of specific humidity was shifted to dryer or more humid conditions correspondingly (Fig. 2e). However, the z value remained consistently below 1, indicating that the differences in the temporal distributions between model and reanalysis data are insignificant. Again, the PDF skill score matched the findings from the z statistic (Fig. 2e and f). The skill of the model to represent the distribution of specific humidity is particularly high over the East European Plain and central Europe with scores mostly >0.9. The skill is lower over the Mediterranean, dropping to a range between 0.4–0.6.
3.2 Sensitivity analysis
In this section, we describe how differences in the mean temperature and moisture profiles impact the frequency of favorable conditions for local land-surface-triggered deep convection, how the likelihood for convection triggered over wet versus dry soils changes and how these influences are represented in classifications of long-term coupling regimes with the CTP-HIlow framework.
3.2.1 Regional differences introduced by modifications
In the core set, the modifications reach to approximately 500 hPa a.g.l. The cases cover a range of different combinations of temperature and moisture modifications to estimate (1) modifications with the same sign that represent changes following the observed positive correlations between T and q in Europe. Additionally, examining (2) the isolated effects of temperature and moisture allows for the disentanglement of their impacts on the coupling strength as well as (3) modifications with opposing signs. The core set aimed at covering four possible combinations of differences in the climate conditions, namely, cooler and moister conditions, cooler and dryer conditions, warmer and moister conditions, as well as warmer and dryer conditions.
Previous observational and global model studies suggested that temperature and moisture are considerably positively correlated in most regions around the globe and trends lie around 7 % change in moisture per Kelvin change in temperature, reflecting the Clausius–Clapeyron rate for increases in moisture, which maintains a quasi-constant relative humidity (Bastin et al., 2019; Willett et al., 2010). In Europe, the scaling of moisture to temperature was slightly higher (Sect. 2.3.2). In addition to the rates described before, a rate of 5 % K−1 was tested to represent a change in moisture per Kelvin change in temperature below the Clausius–Clapeyron rate. Figure 3 depicts the divergence in frequency of nAC days from the CTRL run with 2 K warmer and cooler conditions for all land points. Impacts on the coupling strength and the pre-conditioning for the different coupling regimes have the same sign for each tested rate. A higher scaling of moisture with temperature – as observed in northern Europe – enhanced the effects on the coupling.
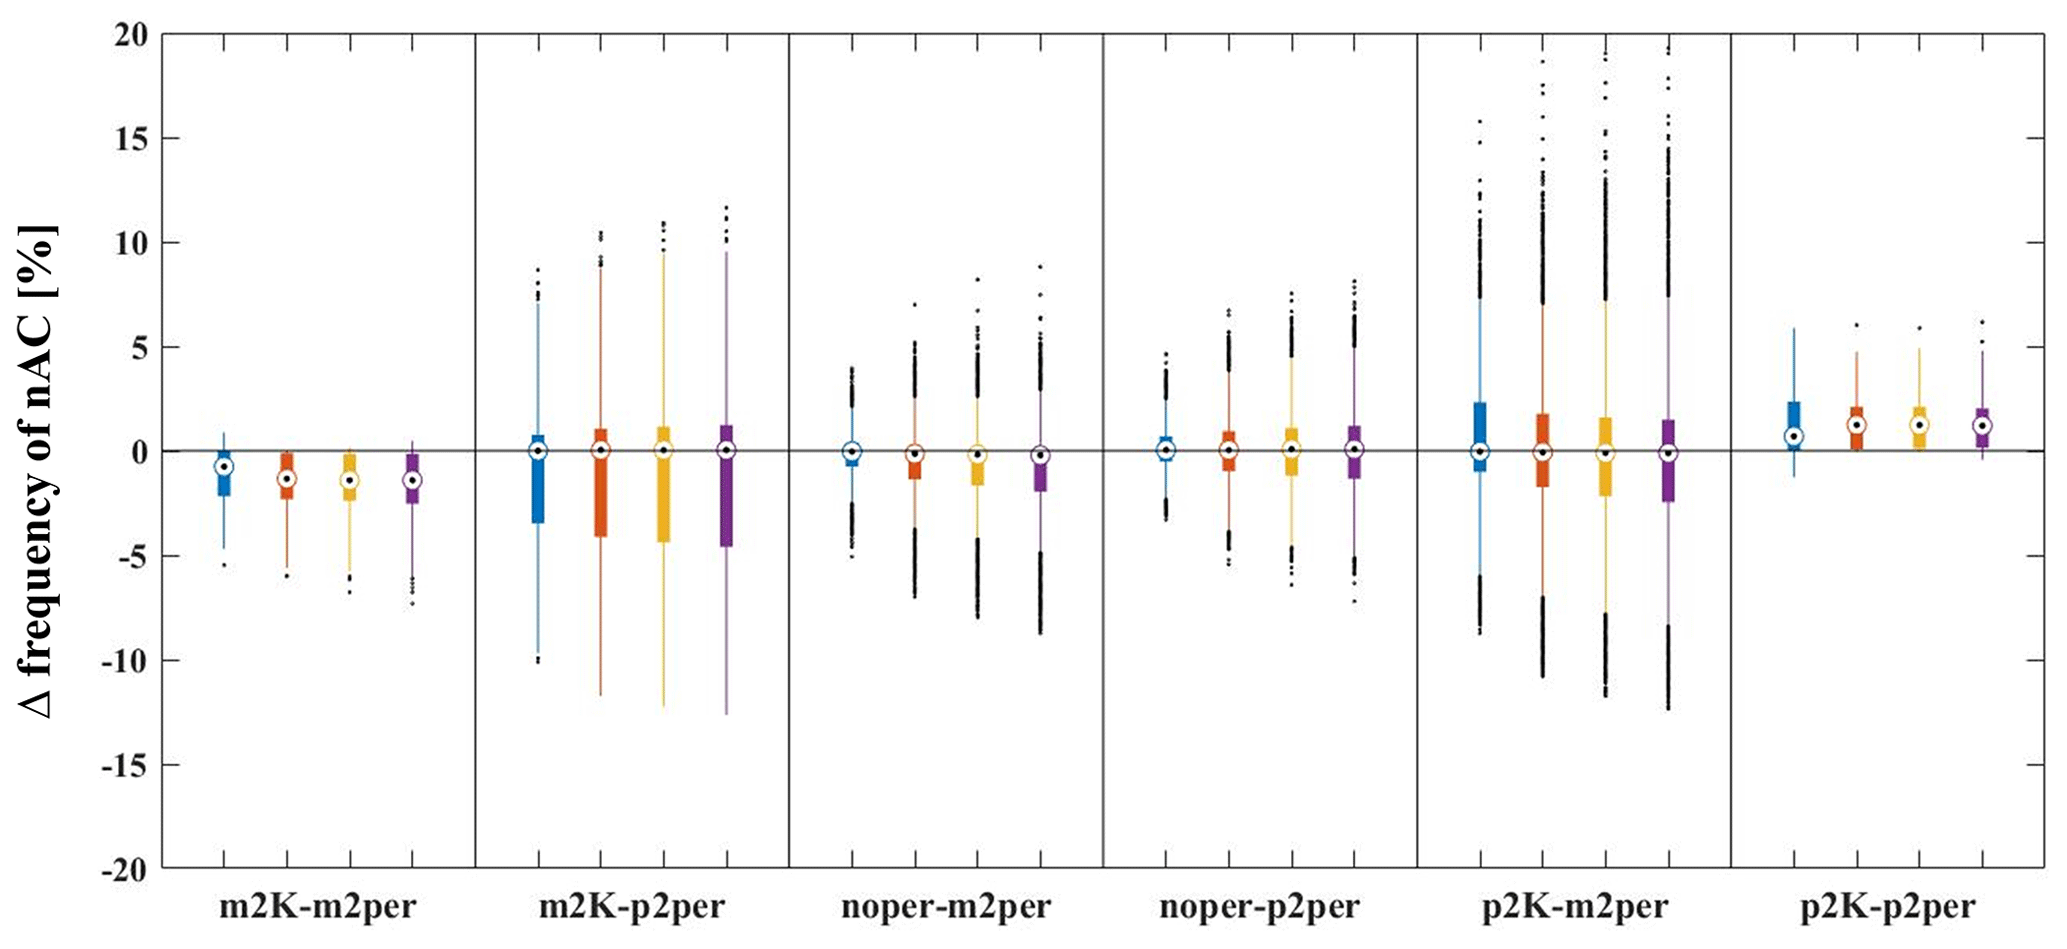
Figure 3Changes in frequency of non-atmospherically controlled (nAC) days in response to different combinations of temperature and moisture changes in the core modification set. m2K denotes a cooling by 2 K at the surface, p2K a warming of 2 K at the surface, m2per denotes a drying of 2 times the scaling factor, and p2per denotes a moistening of 2 times the respective scaling factor in the domain for different T−q scaling factors. Blue: 5 % K−1, orange: 7.74 % K−1, yellow: 8.81 % K−1, purple: 9.66 % K−1.
For the following analysis, we combined the rate of the Northern Hemisphere (8.81 % K−1) with 2 K temperature changes at the land surface. Figure 4 shows the coefficient of determination used as basis for the modification over height as well as the temperature and dew-point temperature profiles after modification. CTP and HIlow changes were uniform throughout the domain. Their spatial patterns were largely maintained from the CTRL run, which were considered reasonable (Jach et al., 2020). When temperature and moisture modifications had the same sign (e.g., warmer and moister), the sign of differences in nAC days was uniform throughout the domain (Fig. 5a and i). Cooler and dryer conditions reduced potential coupling days by about 5 %, whereas warmer and moister conditions increased the frequency of nAC days by 3 %–5 %.
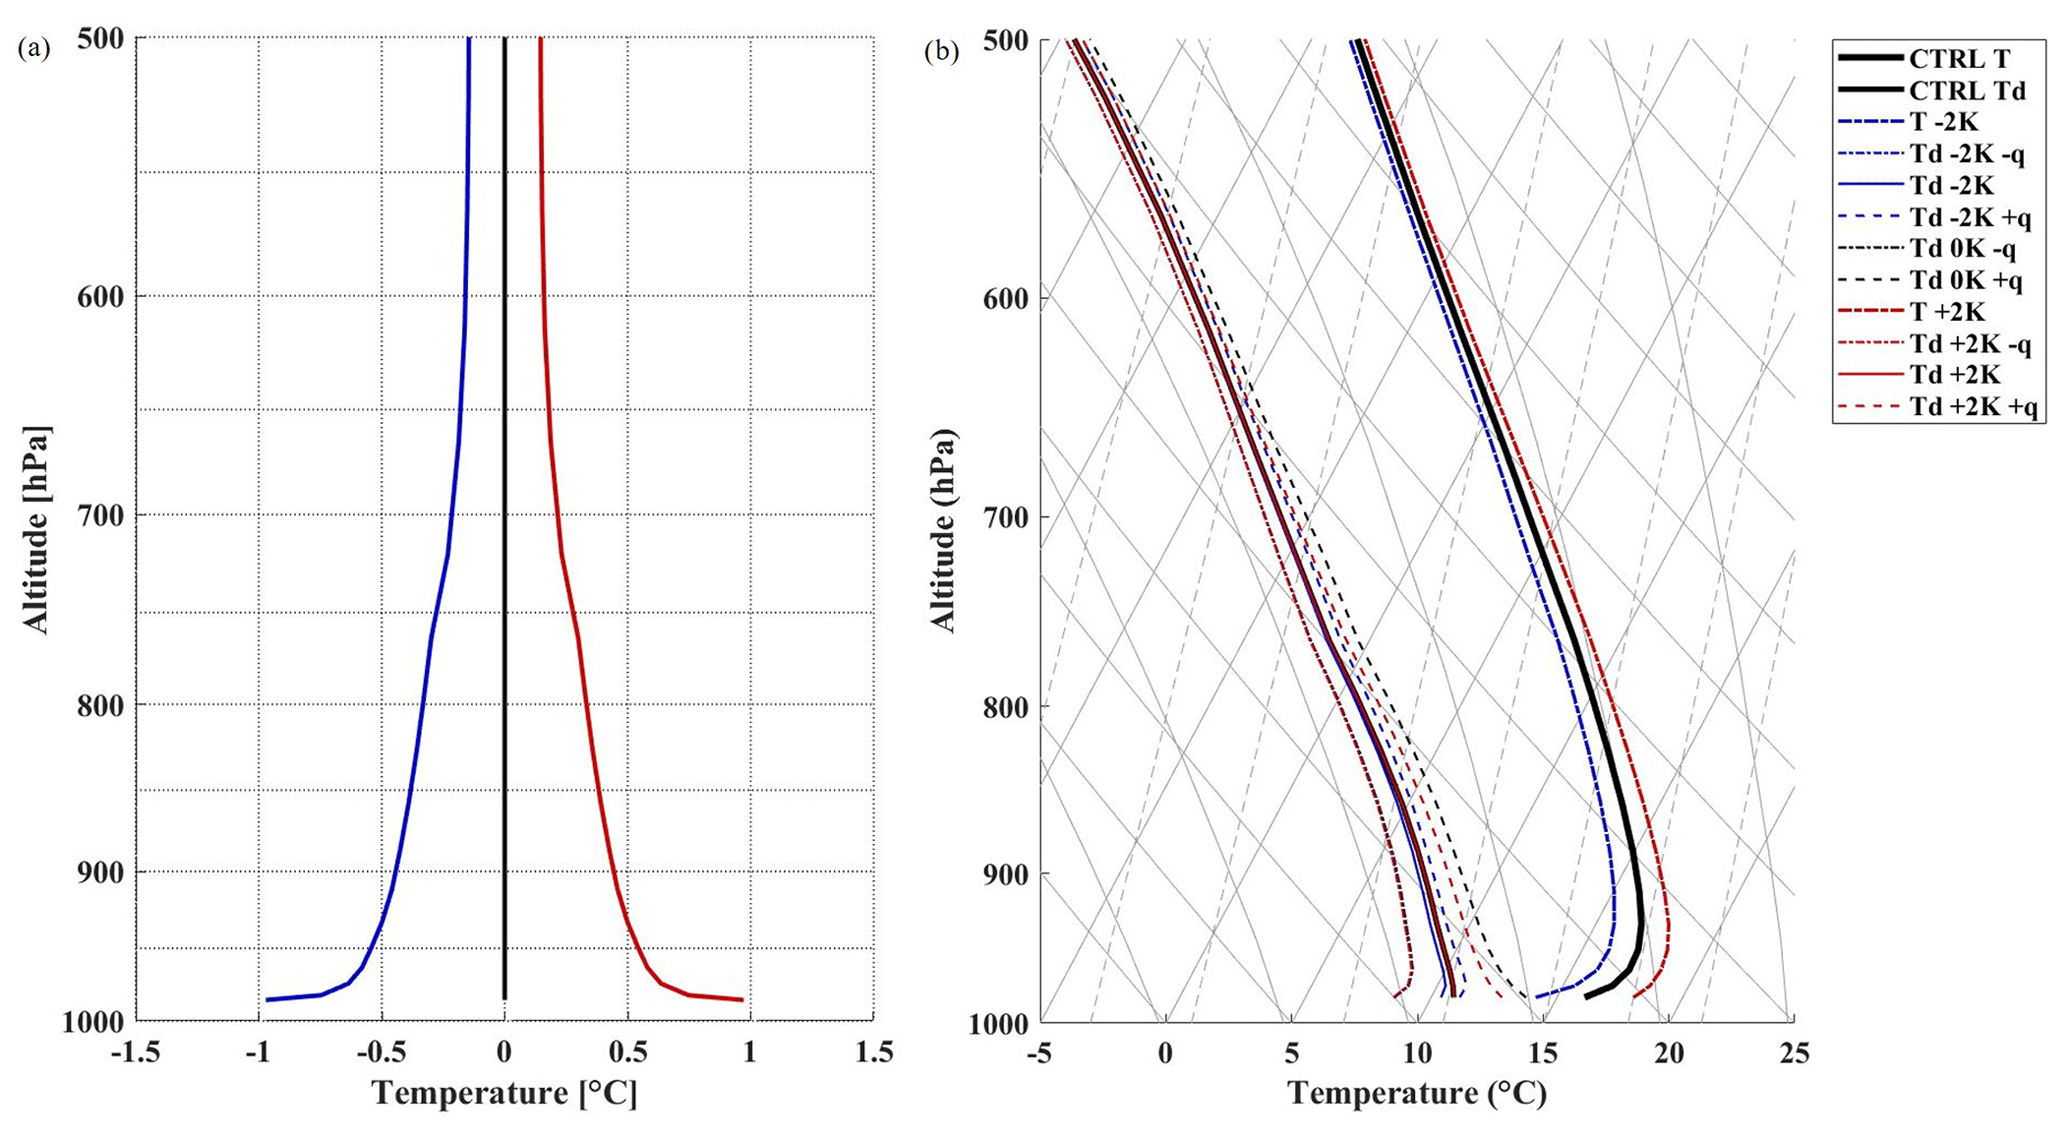
Figure 4Temperature modification factor derived using a simple linear regression model and extracting the coefficient of determination for each atmospheric layer (a). Profiles of temperature (T) and dew-point temperature (Td) after modification (b). Red indicates warmer temperature and blue cooler temperatures, and unchanged temperature is denoted in black. Dash-dotted lines indicate a reduction in moisture, solid lines unchanged moisture and dashed lines an increase in moisture.
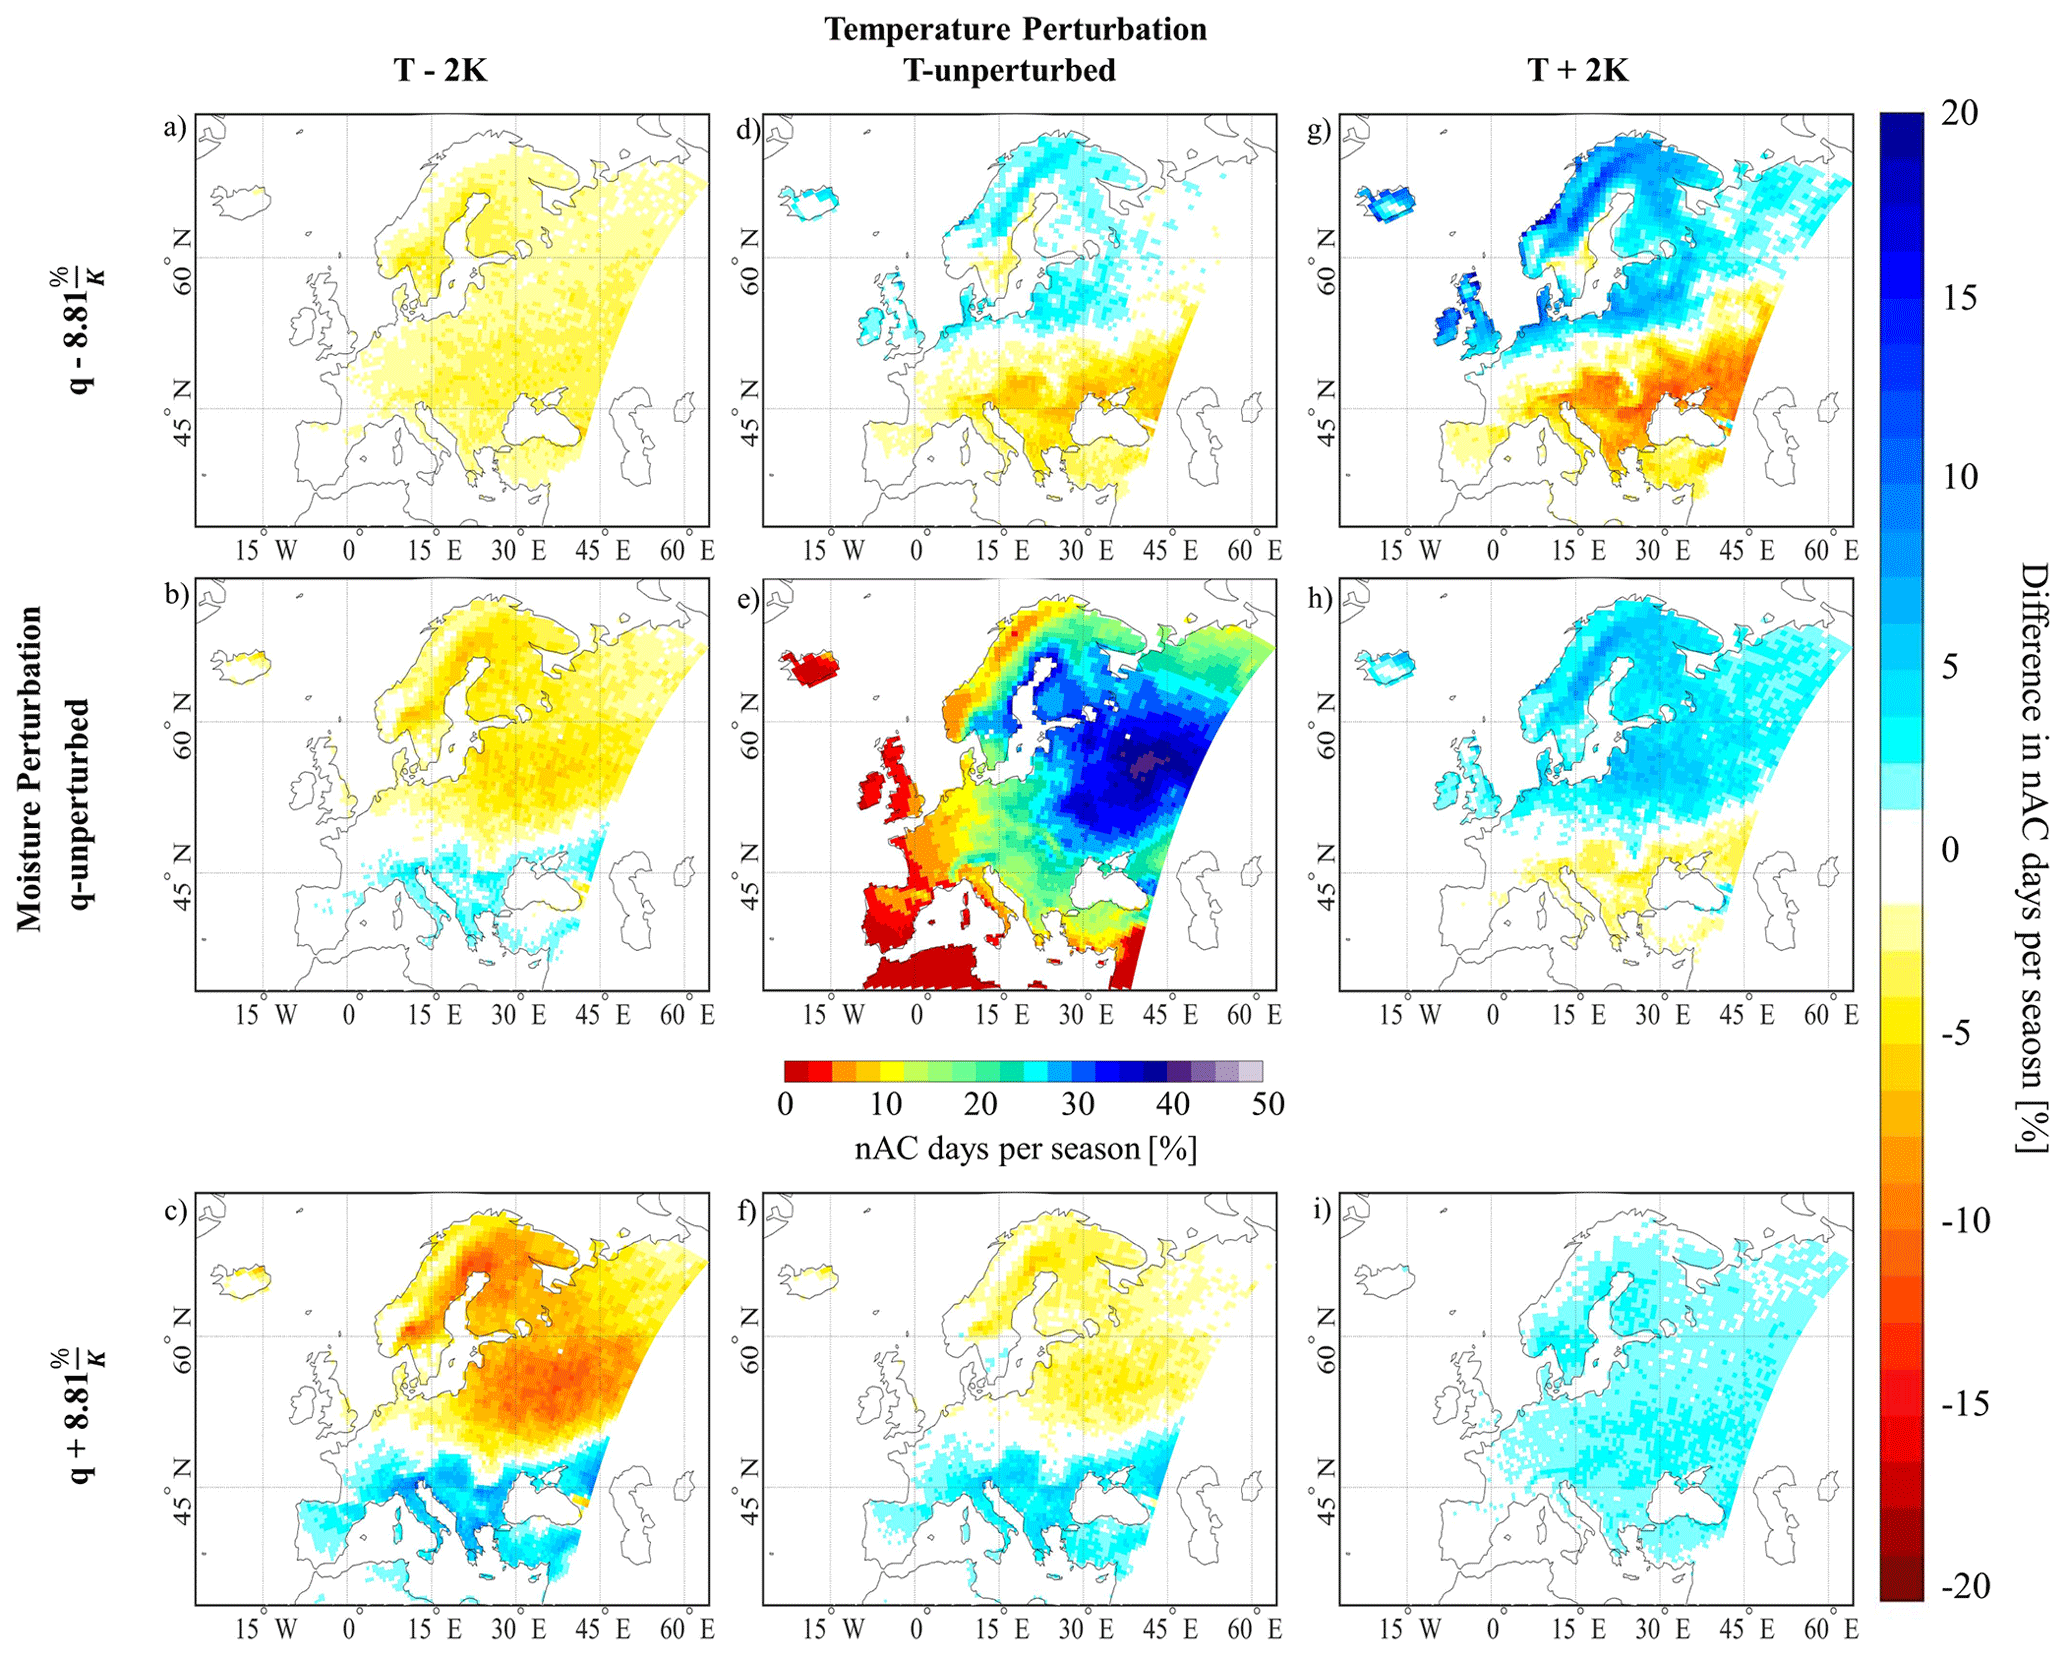
Figure 5Difference in the seasonal share of non-atmospherically controlled (nAC) days [%] from CTRL for each modification case of the core set. The center image is the CTRL case modified after Jach et al. (2020) (their Fig. 4g). The columns denote the temperature change and the rows the relative change in moisture.
Analyzing the cases with individual modifications in temperature and moisture was used to disentangle their respective impacts on different coupling variables. Isolated temperature changes primarily influenced the coupling strength in northern Europe, where lower temperatures weaken the coupling over energy-limited regions – such as Scandinavia and over the East European Plain. This happened as a consequence of more early morning profiles showing stable conditions. Conversely, a warming initiated a strengthening of the coupling (Fig. 5h). The impact was smaller in southern Europe, and it switched sign. Lower temperatures reduced the humidity deficit, and thus decreased the amount of days during which a low atmospheric moisture content inhibited convective precipitation. Moisture modifications had a larger impact in the south of the domain. While dryer conditions were favorable for the occurrence of coupling days in the north, moister conditions were favorable in the south. The same spatial patterns occurred when the implemented modifications differed in sign (Fig. 5c and g). Spatial patterns of impacts on the coupling variables were similar, and therefore differences added up, leading to relatively high differences in the frequency of nAC days (Fig. 5c and g) and their partitioning in wet and dry advantages (Fig. 6). Differences in the frequency of nAC days reached up to 10 % of the summer days. Nevertheless, following the argument that moisture scales positively with temperature, real-world temperature and moisture impacts are expected to counteract each other, leading to weak net effects.
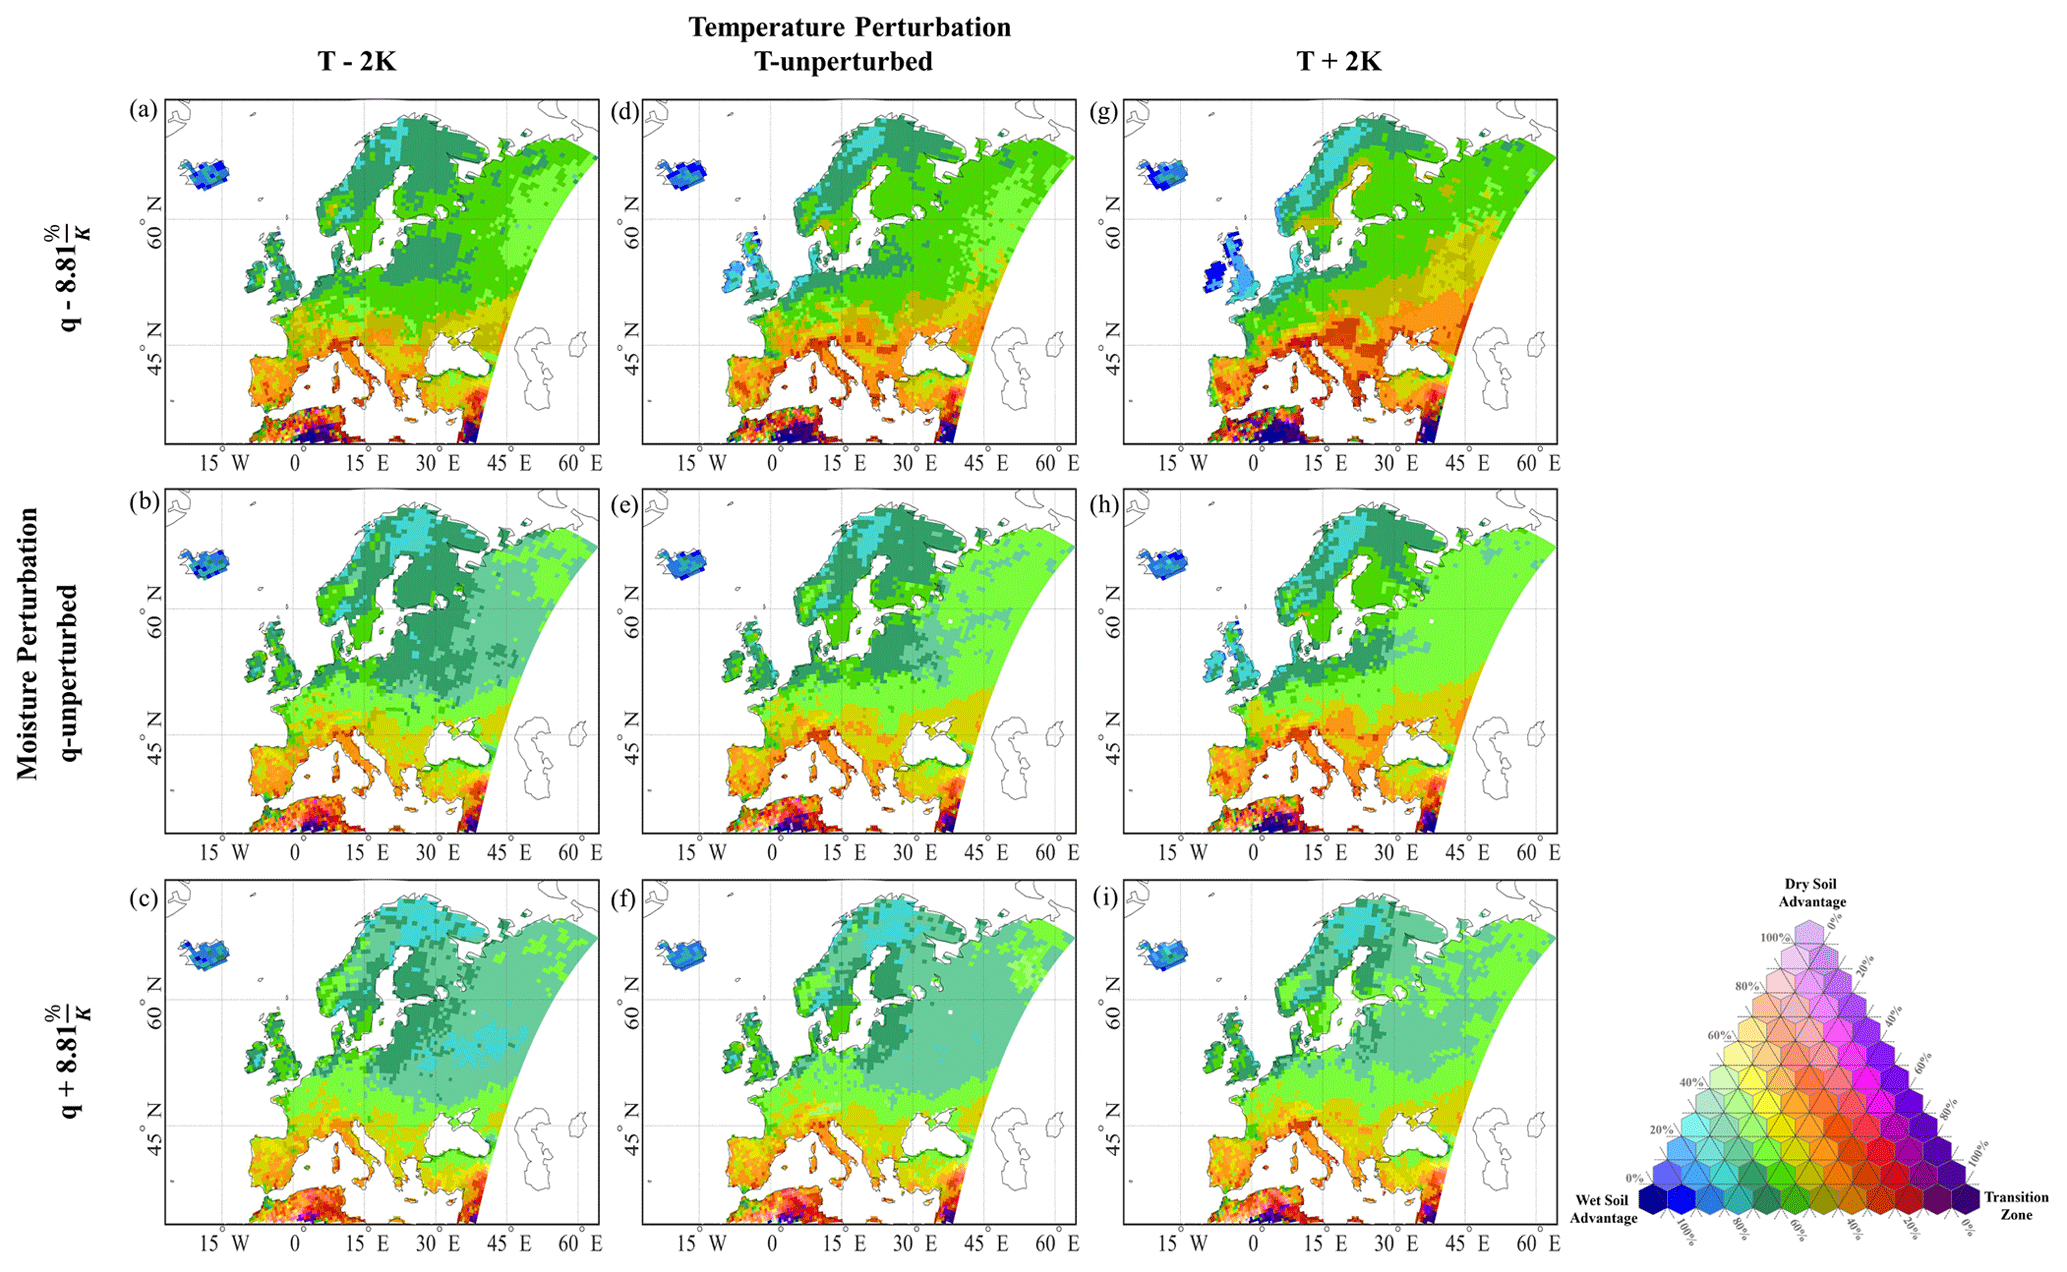
Figure 6Composition of the non-atmospherically controlled days comprising wet soil advantage, dry soil advantage and transition zone days for all core modification cases. The columns denote the temperature change and the rows the relative change in moisture.
The partitioning of nAC days experienced some small shifts of up to ±10 % between the categories (Fig. 6). The predominance of the wet soil advantage in the north and of the transition zone around the Black Sea remained unaffected. The spatial patterns of changes in wet soil advantage days closely followed that in nAC days in most modification cases. A change in the partitioning predominantly occurred between wet soil advantage and transition zone days. Dryer and warmer conditions increased the frequency of transition zone days relative to the CTRL case, vice versa for moister and cooler conditions. Any modification case initiated a dominant dry soil advantage.
The impact on the long-term classification of coupling regimes did not reflect the changes in nAC days and their partitioning in wet and dry advantages for convection (Fig. 7). Differences to the CTRL case mainly occurred over eastern Europe at the edges of the coupling region, and the predominance for positive feedbacks remained unchanged also in the cases with strong changes in relative humidity. The modifications initiated changes between wet soil advantage levels 1 and 2, as well as transition zone levels 1 and 2. None of the modification cases experienced a considerable shift in location or a change in the predominant sign of feedbacks compared to the CTRL (Figs. 6 and 7).

Figure 7Long-term classification of coupling regimes for the core set modification cases. The columns denote a temperature change and the rows a change in moisture. The center image is the CTRL case and modified after Jach et al. (2020) (their Fig. 3a). The columns denote the temperature change and the rows the relative change in moisture.
3.2.2 Sensitivity of the coupling to separated changes in temperature and moisture
This section further examines the relative importance of temperature versus moisture modifications for the variables CTP, HIlow, as well as the share of nAC days, wet soil advantage, transition zone and dry soil advantage days in Europe. The sensitivity index as described in Sect. 2.4 was used to estimate the magnitude of the control of temperature and moisture relative to each other for each variable throughout the domain.
The temperature and moisture modifications changed CTP and HIlow linearly. Differences in CTP, the stability of the atmospheric layering, were almost solely controlled by modifications of the temperature, as indicated by a sensitivity index of −1 throughout the domain (not shown). In the case of HIlow, the impacts of temperature and moisture modifications were of similar magnitude, though, moisture had a slightly higher impact, indicated by small but positive values. The magnitude of temperature and moisture controls on HIlow became more equal in mountainous regions.
The sensitivity index for the share of nAC days in summer showed a clear dipole pattern (Fig. 8a). In northern Europe, the coupling is rather impacted by temperature variations. Temperature controls the coupling by determining the stability of the atmosphere.
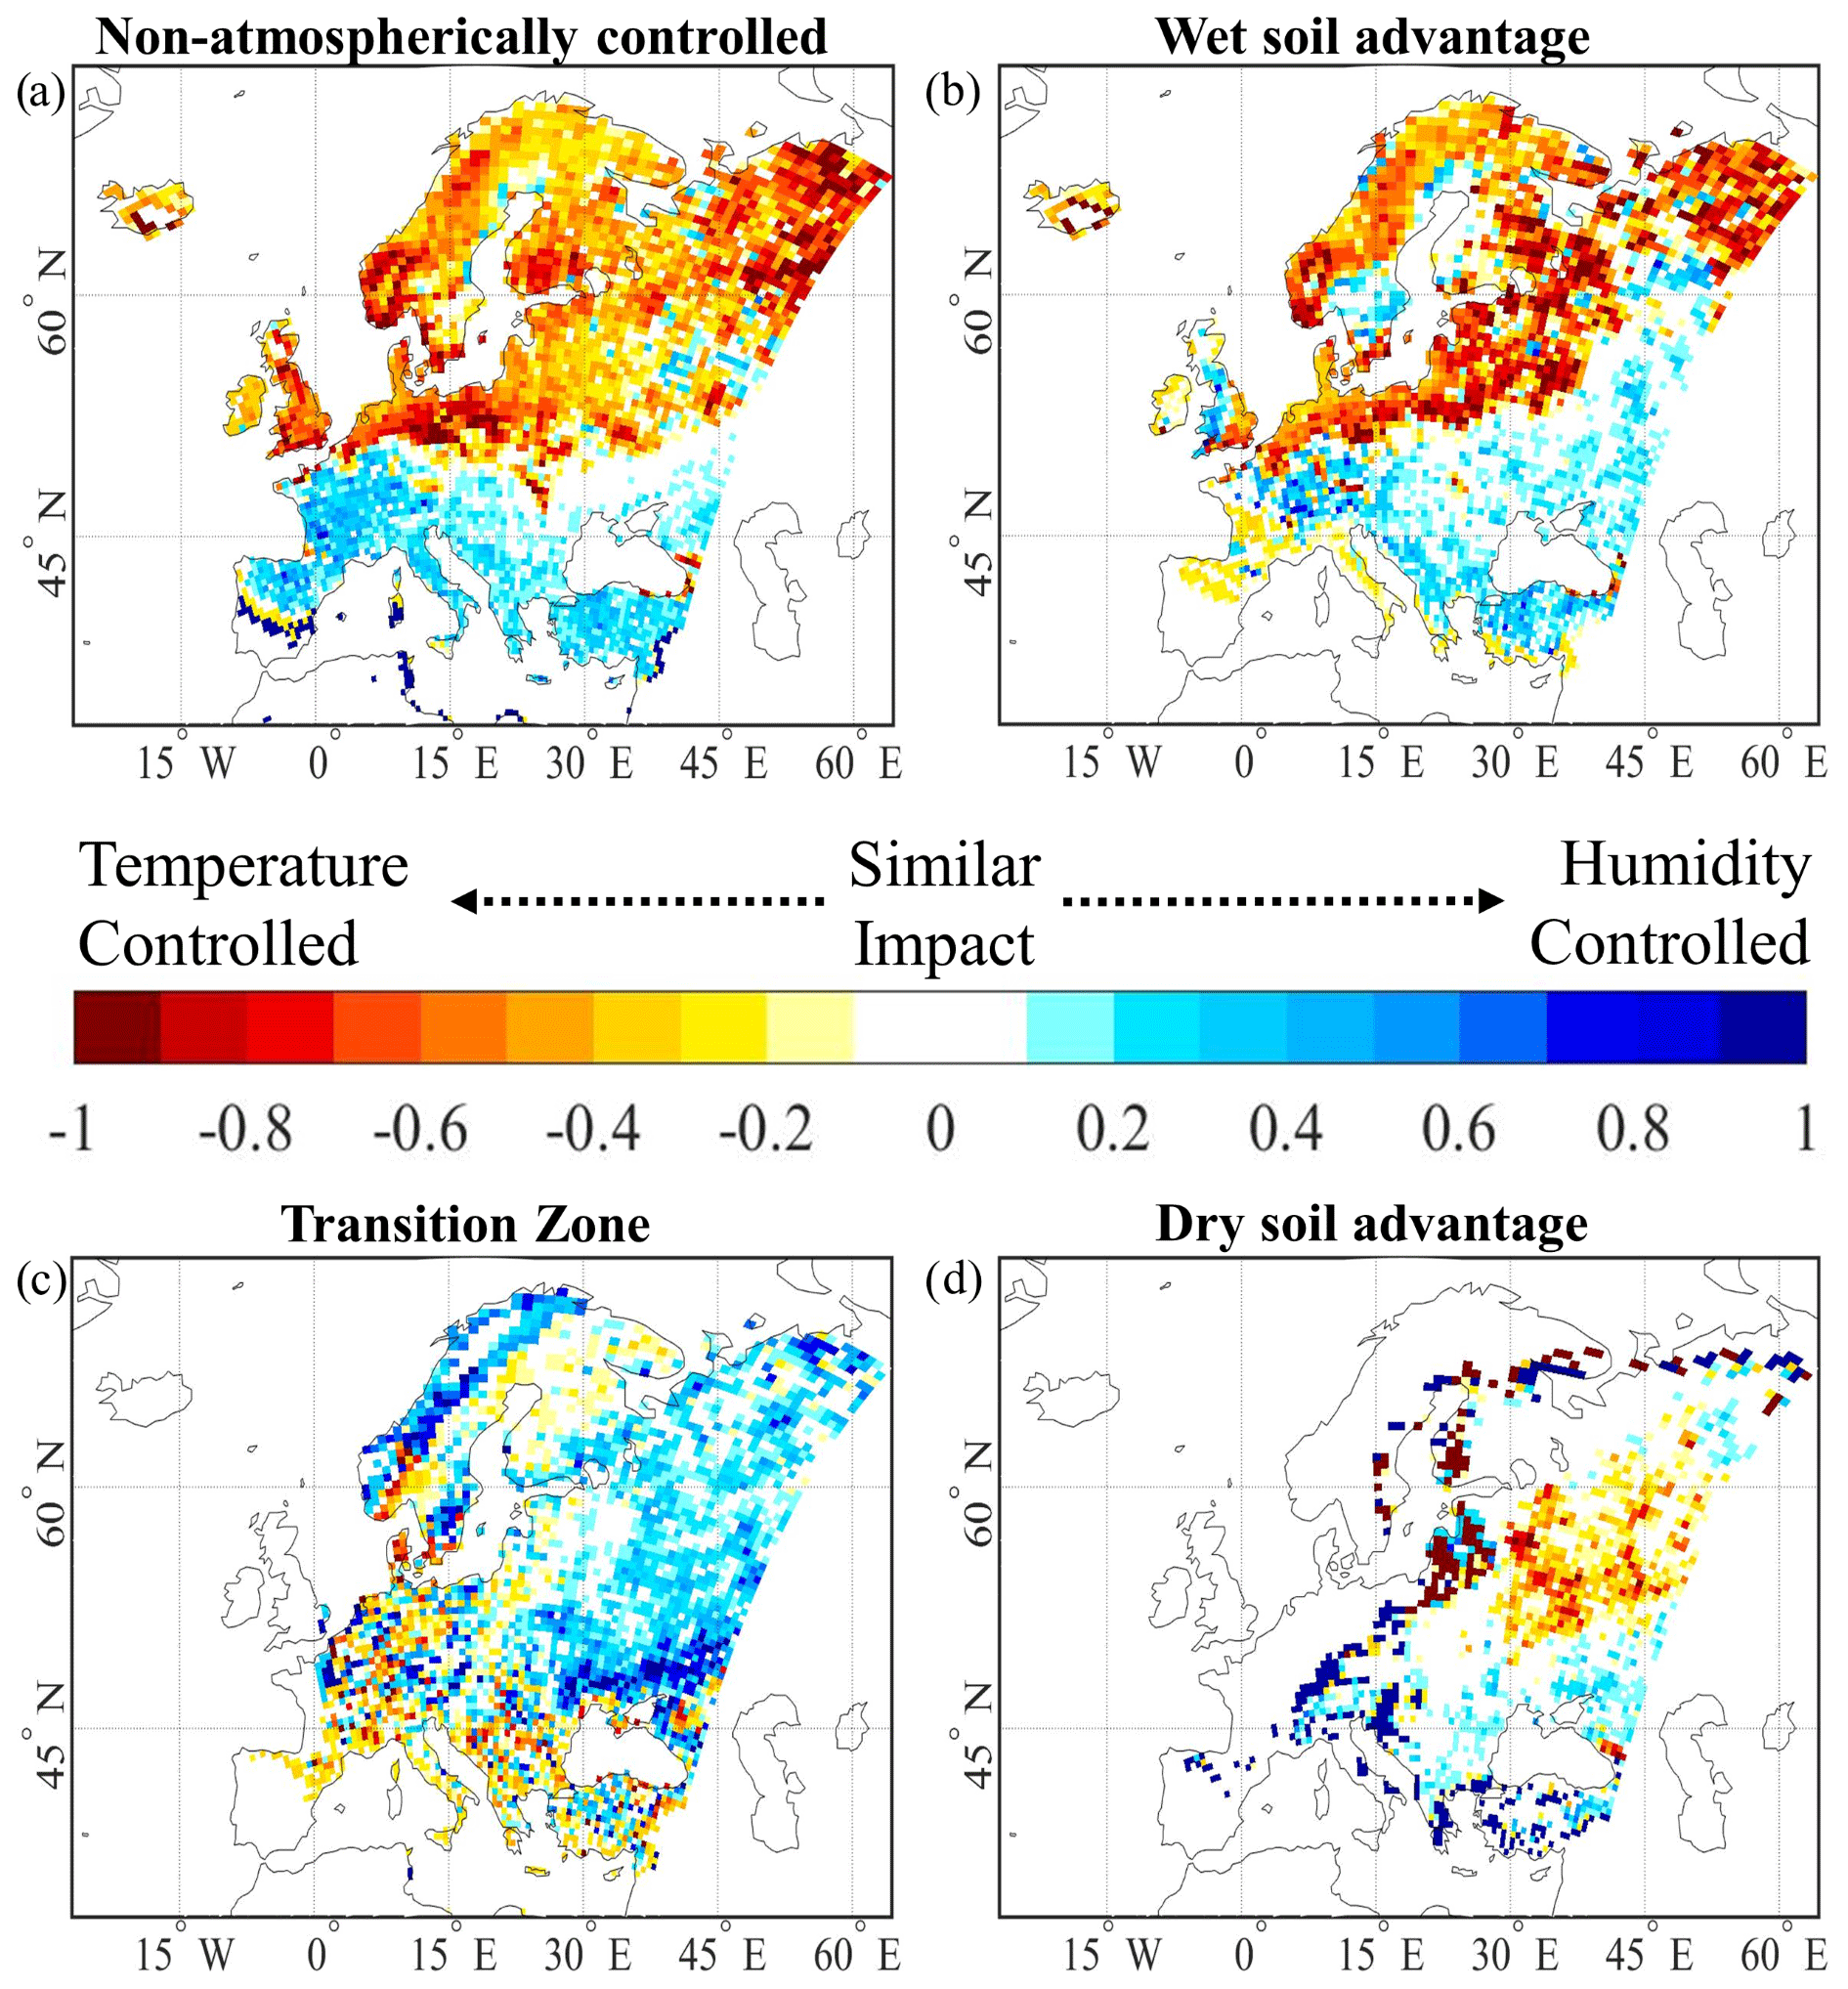
Figure 8Sensitivity score of (a) non-atmospherically controlled days per summer season, (b) wet soil advantage days per summer season, (c) transition zone days per summer season and (d) dry soil advantage days per summer season to changes individual modifications in the air temperature profile (−1 indicates totally temperature controlled) and specific humidity profiles (1 indicates totally humidity controlled).
In southern Europe, moisture was the controlling factor, and little relative humidity in the low-level ABL limits the occurrence of feedbacks in consequence of limited moisture availability for deep moist convection. The sensitivity index computed for the wet soil advantage showed a similar pattern. Hence, sensitivity of the coupling exhibited a regional dependency to temperature and moisture changes, which hints at humidity- and energy-limited regimes controlling the coupling. The dry soil advantage rarely occurred, but its occurrence is rather controlled by temperature variations in northeastern Europe (Fig. 8d) and by moisture in southeastern Europe. The sensitivity of the transition zone shows a complete different pattern. The moisture modifications caused higher differences in the occurrence of transition zone days in the coupling hotspot, while temperature modifications only had a higher impact towards the southwest (Fig. 8c).
3.2.3 Effects of changing temperature and moisture gradients
The following section deals with the analysis of how changes to steeper or less steep temperature and moisture gradients can influence the coupling classification and to compare how such differences can impact the result of the coupling metric. Figure 9 shows the divergence factors for each case which were derived from the temperature difference of the corresponding summer (Table 2) from the climatological mean temperature averaged over the domain. The other subplots show the resulting temperature and dew-point temperature profiles in the lower ABL. For the cases chosen because of their moisture anomaly – namely the dry and the wet cases – the moisture factor was derived by multiplying the T factor with −1 to derive moister conditions in the wet and dryer conditions in the dry case. This was done to circumvent that, in the dry case, a higher temperature would be associated with an increase in moisture (thus a moistening) of the ABL with positive temperature–moisture relationship. As CTP is almost entirely controlled by the air temperature, this practice only affected HIlow.
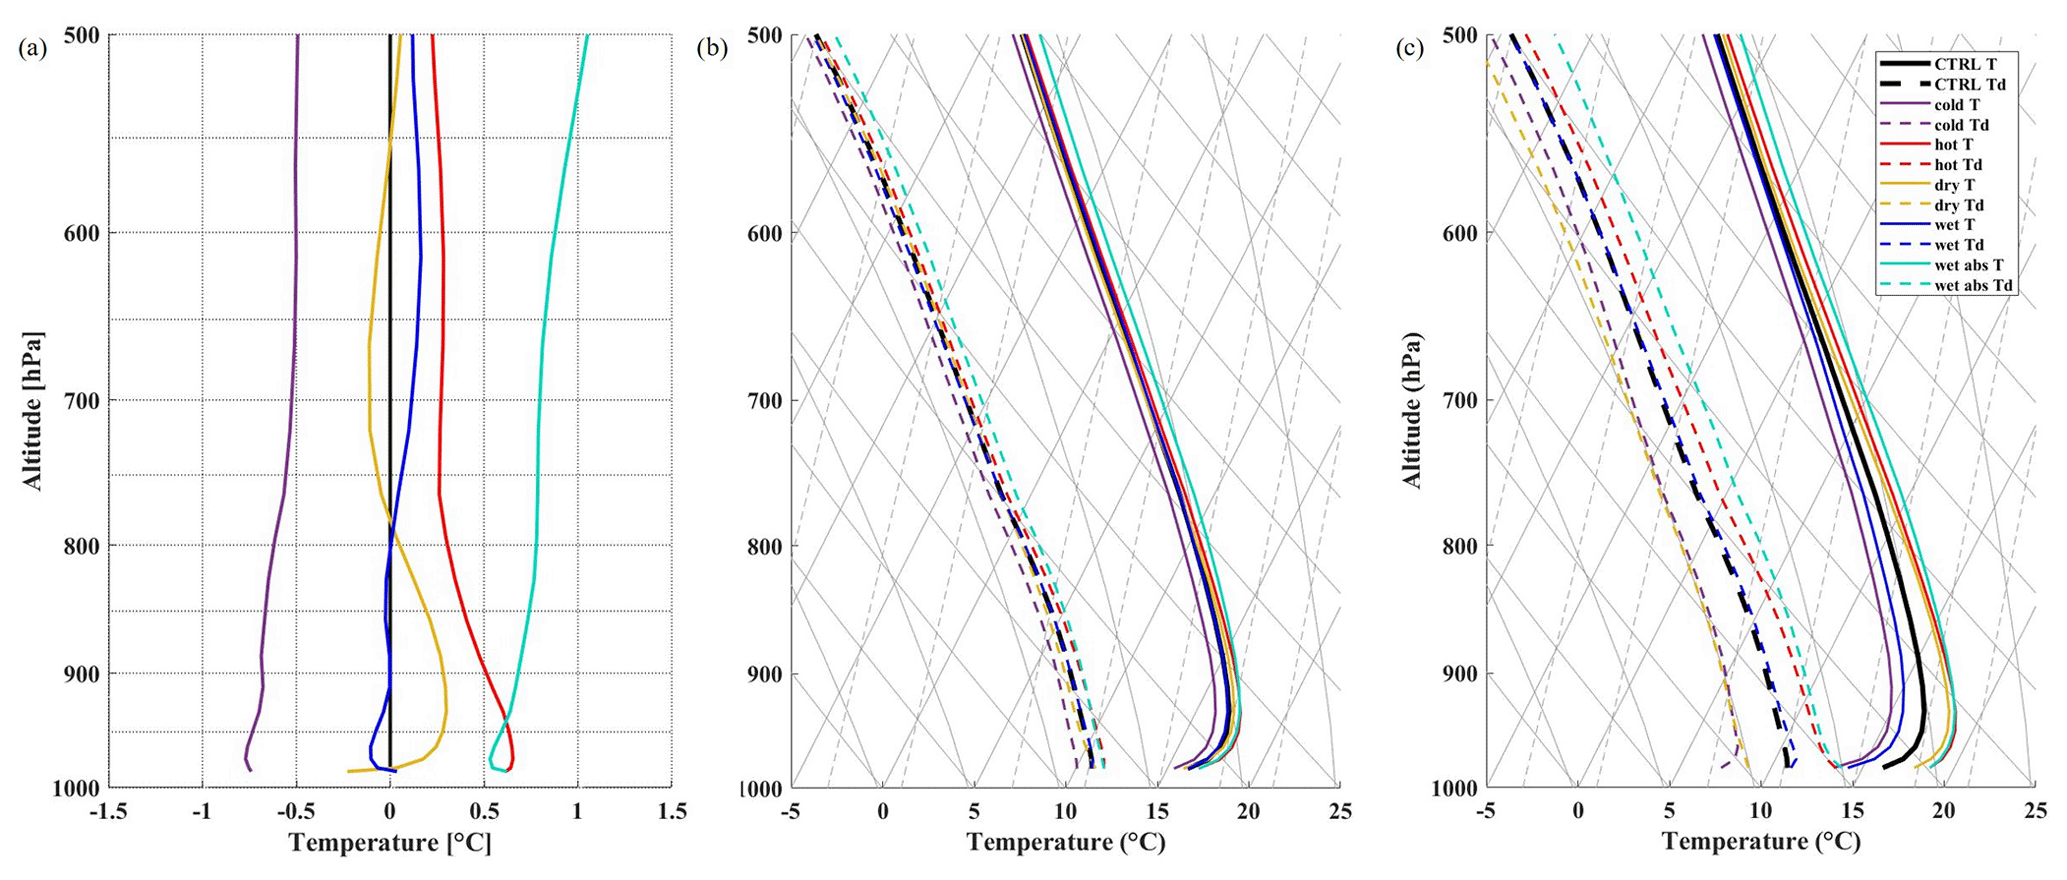
Figure 9(a) Divergence temperature (T) factors derived from differences of the domain average temperature profiles of the corresponding summers to the 30-year mean (Table 2) which were used to modify daily model output, (b) domain average of T and Td profiles for the divergence T factors, and (c) their additional modifications with the core T factor. Purple: cold, red: hot, yellow: dry, blue: wet, turquoise: wet abs; solid lines represent temperature and dashed lines represent dew-point temperature.
We first investigated the impact of shifting the temperature and moisture gradients from the CTRL case using the divergence factors of the extreme years (see Sect. 2.3.1). The main impact concerned changes in CTP, since this is an integrated variable. Changes in the temperature gradient moved the lapse rate more toward the dry or moist adiabats, and hence influence the atmospheric stability. The hot and the dry divergence factors increased the early morning temperature gradients between 100–300 hPa above ground, shifting them closer to the dry adiabat, but also enhanced the surface inversion (Fig. 9). This caused an increase in CTP, while the enhancement of the surface inversion, which is likely resulting in a higher convective inhibition, is not accounted for in the framework. In the other three cases (cold, wet, wet_abs), the temperature gradient was decreased between 100–300 hPa a.g.l., consequently decreasing CTP (Fig. 10). The cases diverge in the mean temperature change among each other. Likewise, the temperature inversion decreased in the lower atmospheric layers (Fig. 9). Differences in HIlow resulted from both temperature and moisture changes. However, HIlow changes were small in most cases (Fig. 10), because temperature and moisture change simultaneously, which led to small changes in relative humidity. The only considerable exception was the dry case, where the T factor was multiplied by −1. In this case, HIlow increased by about 1 ∘C.

Figure 10Changes in convective triggering potential (CTP) and low-level humidity index (HIlow) due to the divergence factors.
The combination of temperature and moisture changes in each case determines the difference for the share of nAC days (Fig. 11a). The effects are summarized in the following points:
-
In the hot case, a higher temperature and temperature gradient between 100–300 hPa a.g.l. was caused with corresponding changes in moisture. These led to greater instability with a constant humidity deficit, which increased the expansion of the hotspot and the fraction of nAC days within the L–A coupling hotspot.
-
The dry case involved a larger temperature gradient but less moisture in the atmosphere. A greater instability was combined with a higher humidity deficit, which jointly caused an increase in the fraction of nAC days in summer in the hotspot, but the area of the domain included in the hotspot remained unchanged. Higher humidity deficits reduced the coupling of land surface and convection around the Black Sea but increased the likelihood for convection triggering over wet soils in the north.
-
The cold case resulted in a combination of lower temperature, a decrease in the temperature gradient between 100–300 hPa a.g.l. and moisture changes corresponding to 8.81 % K−1, which led to a reduction in the expansion of the hotspot region in the study area and a loss of nAC days.
-
The wet_abs and wet cases showed temperature increases but shallower temperature gradients with corresponding changes in moisture, which resulted in minor impacts on the coupling.
Further examination of the differences in the share of the coupling categories shows that the area in wet soil advantage shrinks in all divergence cases (Fig. 11b). Warmer temperatures strengthened the frequency of the wet soil advantage in the hotspot and cooling weakened it. Days in the transition zone experienced the opposite effect (Fig. 11c). However, all combinations of changes in the gradients led to an expansion of the transition-zone-labeled region over land. Though the dry soil advantage never became dominant, which can be seen in the unchanged expansion over land (Fig. 11d), temperature changes still influenced the frequency of days during which negative feedbacks could occur. Similar to the wet soil advantage, higher temperatures increased the frequency of days in dry soil advantage during summer.
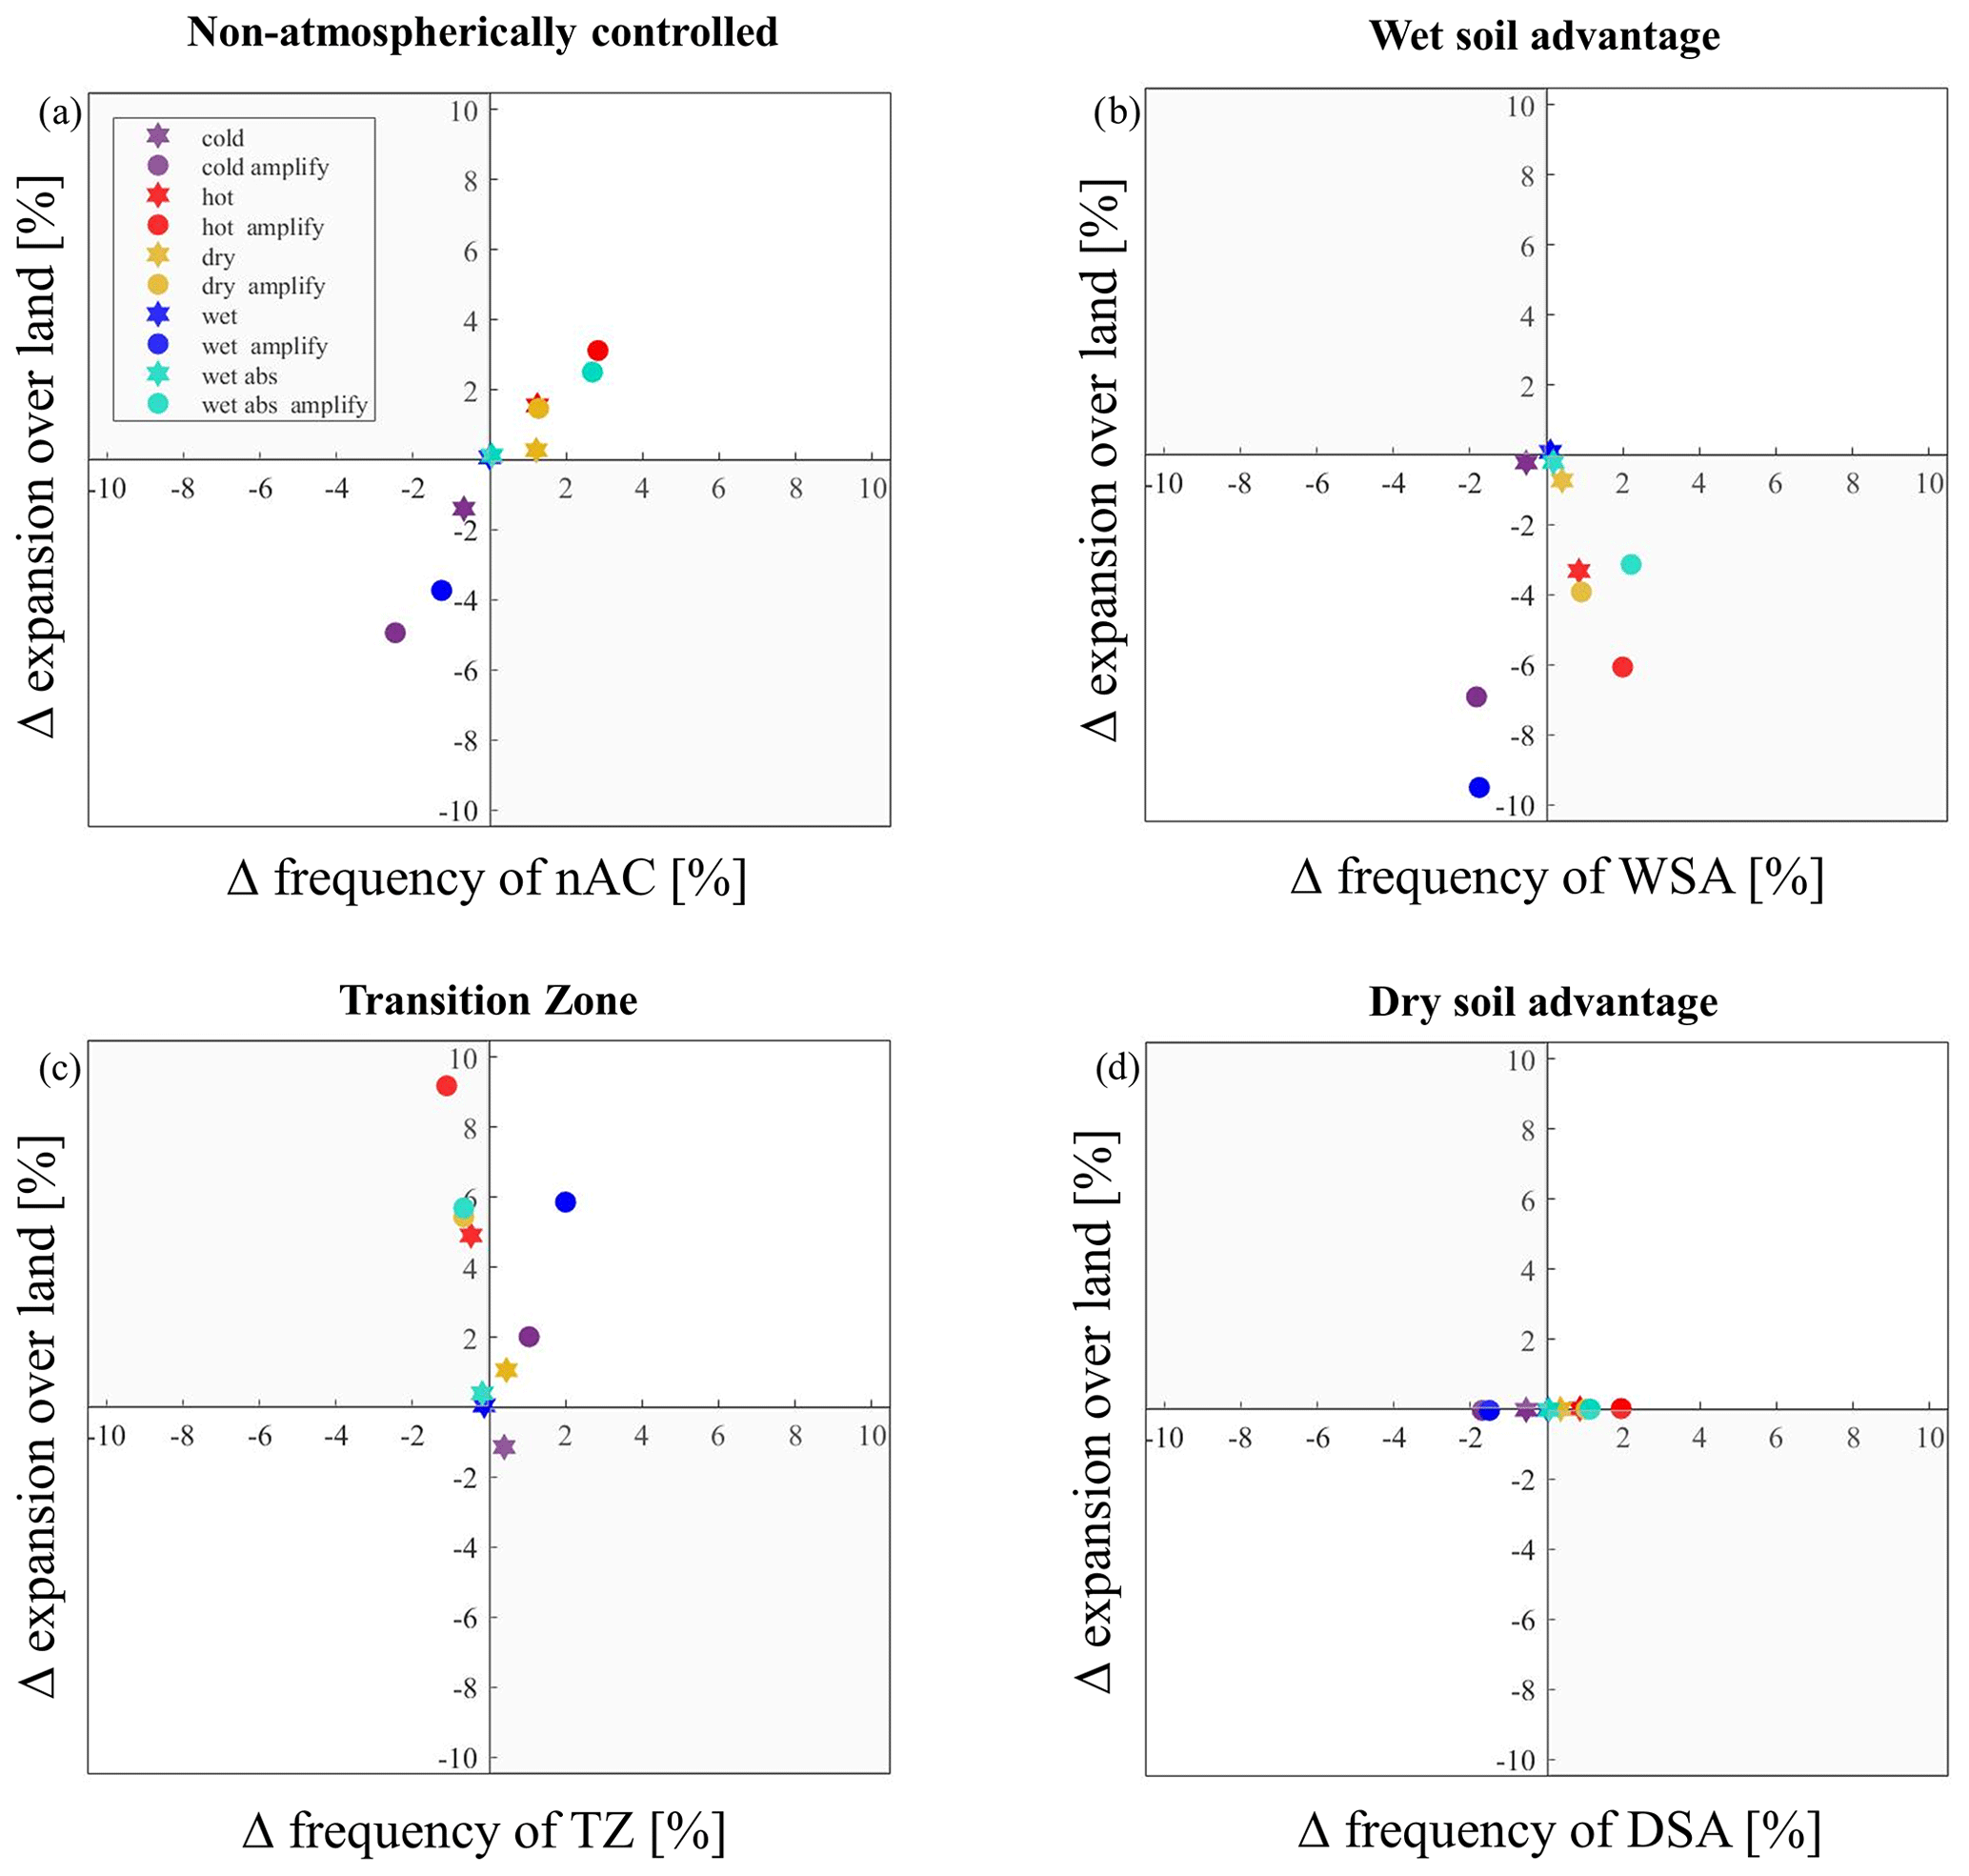
Figure 11Impacts of the divergence cases on the spatial expansion and the occurrence of the coupling classes in summer for (a) non-atmospherically controlled (nAC) days, (b) wet soil advantage (WSA), (c) transition zone (TZ) and (d) dry soil advantage (DSA). The x axis depicts the changes in the average frequency of occurrence during summer and the y axis shows changes in the fraction of land area covered by the respective coupling regime.
3.3 Uncertainty of the coupling regimes
Here, we examine changes in the occurrence of the coupling classes during summer which is based on the daily classification (comp. Fig. 1a), and to which extent the long-term classification, indicating the dominance of a coupling class in a cell, reflects these changes. Under the assumption that the modification cases cover a reasonable spread in atmospheric temperature and moisture for the prevailing climate, it aims at understanding how sensitively the coupling strength and the pre-dominant coupling class respond to temperature and moisture differences within this spread. For this purpose, we first looked at the sensitivity of the long-term regime classification by determining the share of modification cases in which the coupling classification coincided with that of the CTRL case (Fig. 12). A high share as assessed with Eq. (3) indicated high agreement in the classified coupling regimes of the modification cases (red areas), and therefore low sensitivity, while green-to-blue colors indicate weak or no agreement of the modified coupling regimes with that of the CTRL case and therefore high sensitivity. Please note that no agreement also involves changes between a coupling regime in level 1 and level 2. We further quantified the frequency of occurrence of each coupling regime in the modification cases using Eq. (4) to explore which coupling regimes occurred in the different cases. The Iberian Peninsula, northern Africa and the northeast of Europe showed high agreement in the regime classification of all modification cases and thus low sensitivity to temperature and moisture changes. Over the Iberian Peninsula and over northern Africa, the dry atmospheric controlled regime reliably predominated in all cases, whereas over northeastern Europe, it was reliably classified in one of the nAC coupling regimes (Fig. 13a). In the transition between these two regions there was a belt, where the coupling regime changed on a regular basis. Thus, it appeared to be sensitive to temperature and moisture changes. The absence of several coupling regimes suggests that over Scandinavia, the British Isles and central Europe, the question is whether or not feedbacks occur. When feedbacks occurred, wet soils were in favor (Fig. 13a and b). In southeastern Europe, from the Alps to around the Black Sea, summers were reliably in non-atmospherical control (Fig. 13a), but the dominant coupling regime switched between wet soil advantage and transition zone (Fig. 13b and c). Some cells had an equal share of modification cases in wet soil advantage and transition zone. A dominant dry soil advantage occurred only in single cells and cases over Turkey.
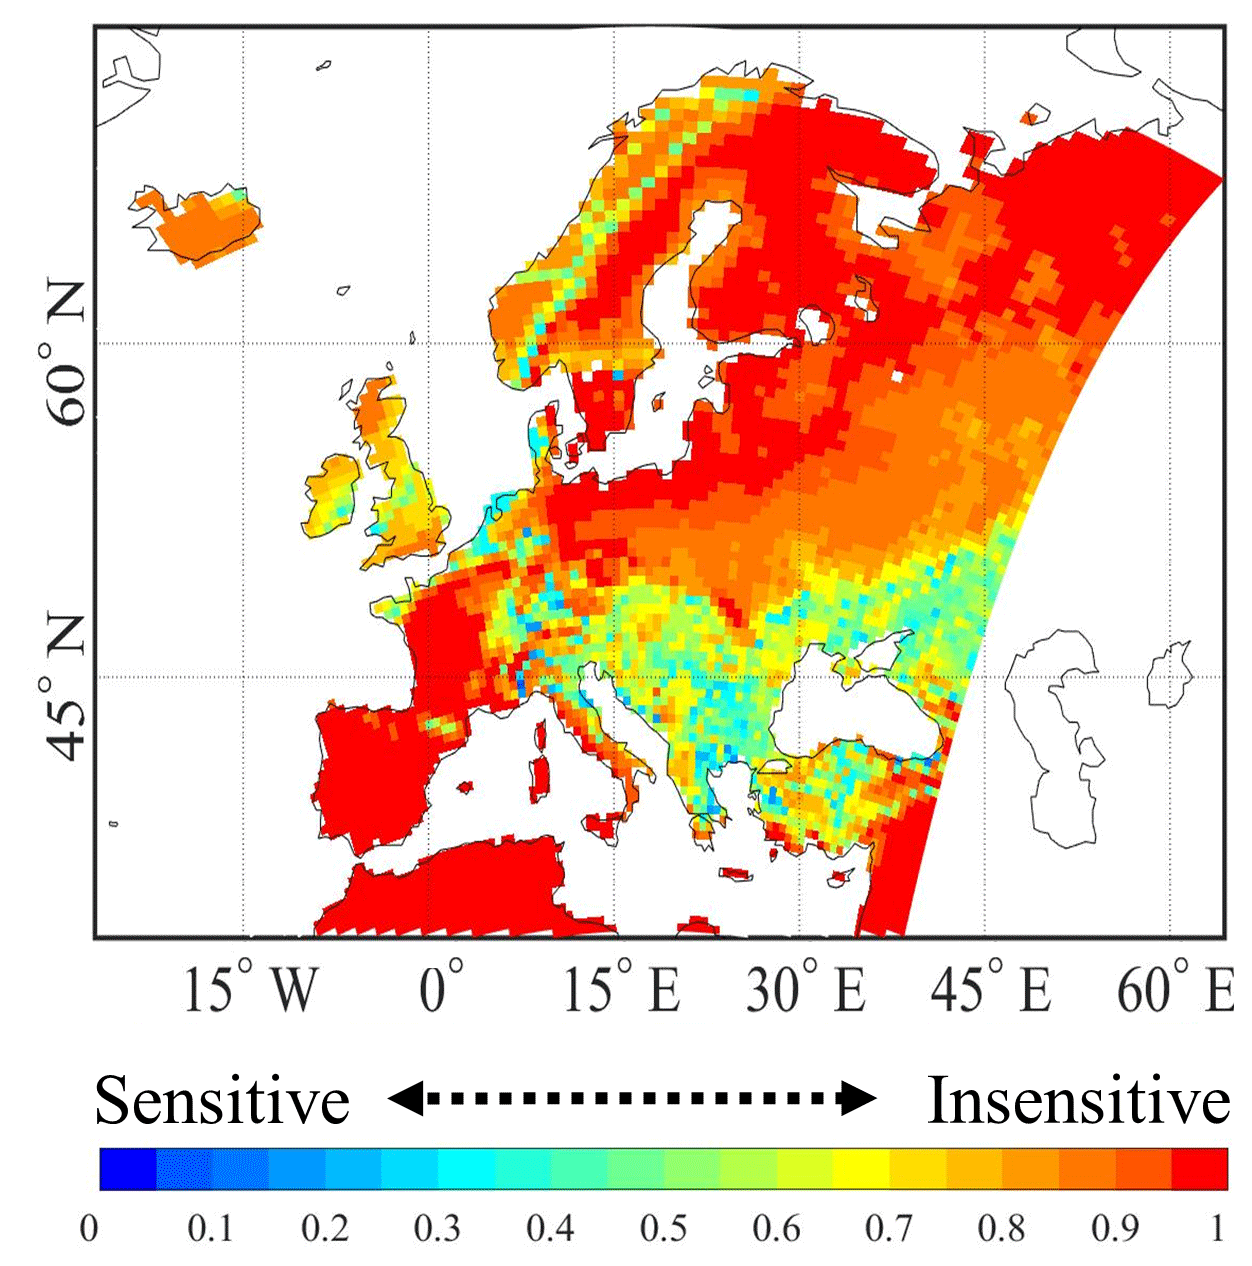
Figure 12Comparison of modification cases with CTRL from no modification case as CTRL. Red colors indicate that the coupling classification is sensitive to modifications in temperature and moisture, and greenish colors indicate that the coupling classification is insensitive to modifications in temperature and moisture.

Figure 13Sensitivity of coupling classes of (a) any coupling class, (b) classified as wet soil advantage level 1 or level 2, (c) classified as transition zone level 1 or level 2, and (d) classified as dry soil advantage level 1 or level 2.
Secondly, we explored differences regarding the occurrence of the different coupling classes within all summer days between the modification cases. This is based on the daily classification of the profiles in CTP-HIlow space. The analysis of sensitivity in the long-term coupling regimes allows to distinguish five regions used for a spatial aggregation: (1) pure nAC, where less than two modification cases changed the coupling regime maintaining nAC in nearly all cases, and (2) pure AC, where less than two modification cases changed the coupling regime maintaining AC in nearly all cases. Further, there are three regions with frequent switches (at least two cases) in the coupling regime. In region (3), the coupling regime changed between any AC class and the wet soil advantage, in region (4) the changes were between AC classes, the wet soil advantage and the transition zone, and in region (5) the changes were between the wet soil advantage and the transition zone. The cell remained in nAC in any of the modification cases. Figure 14 shows the distribution of summer days in the coupling classes for these regions and all cases. Figure 15 further adds sensitivity maps depicting the average dominance of each coupling regime relative to the other coupling classes and their occurrence (given in days) in summer. Hatched areas denote that the number of days in the respective coupling regime varied considerably by more than 10 % of the summer days between the modification cases.
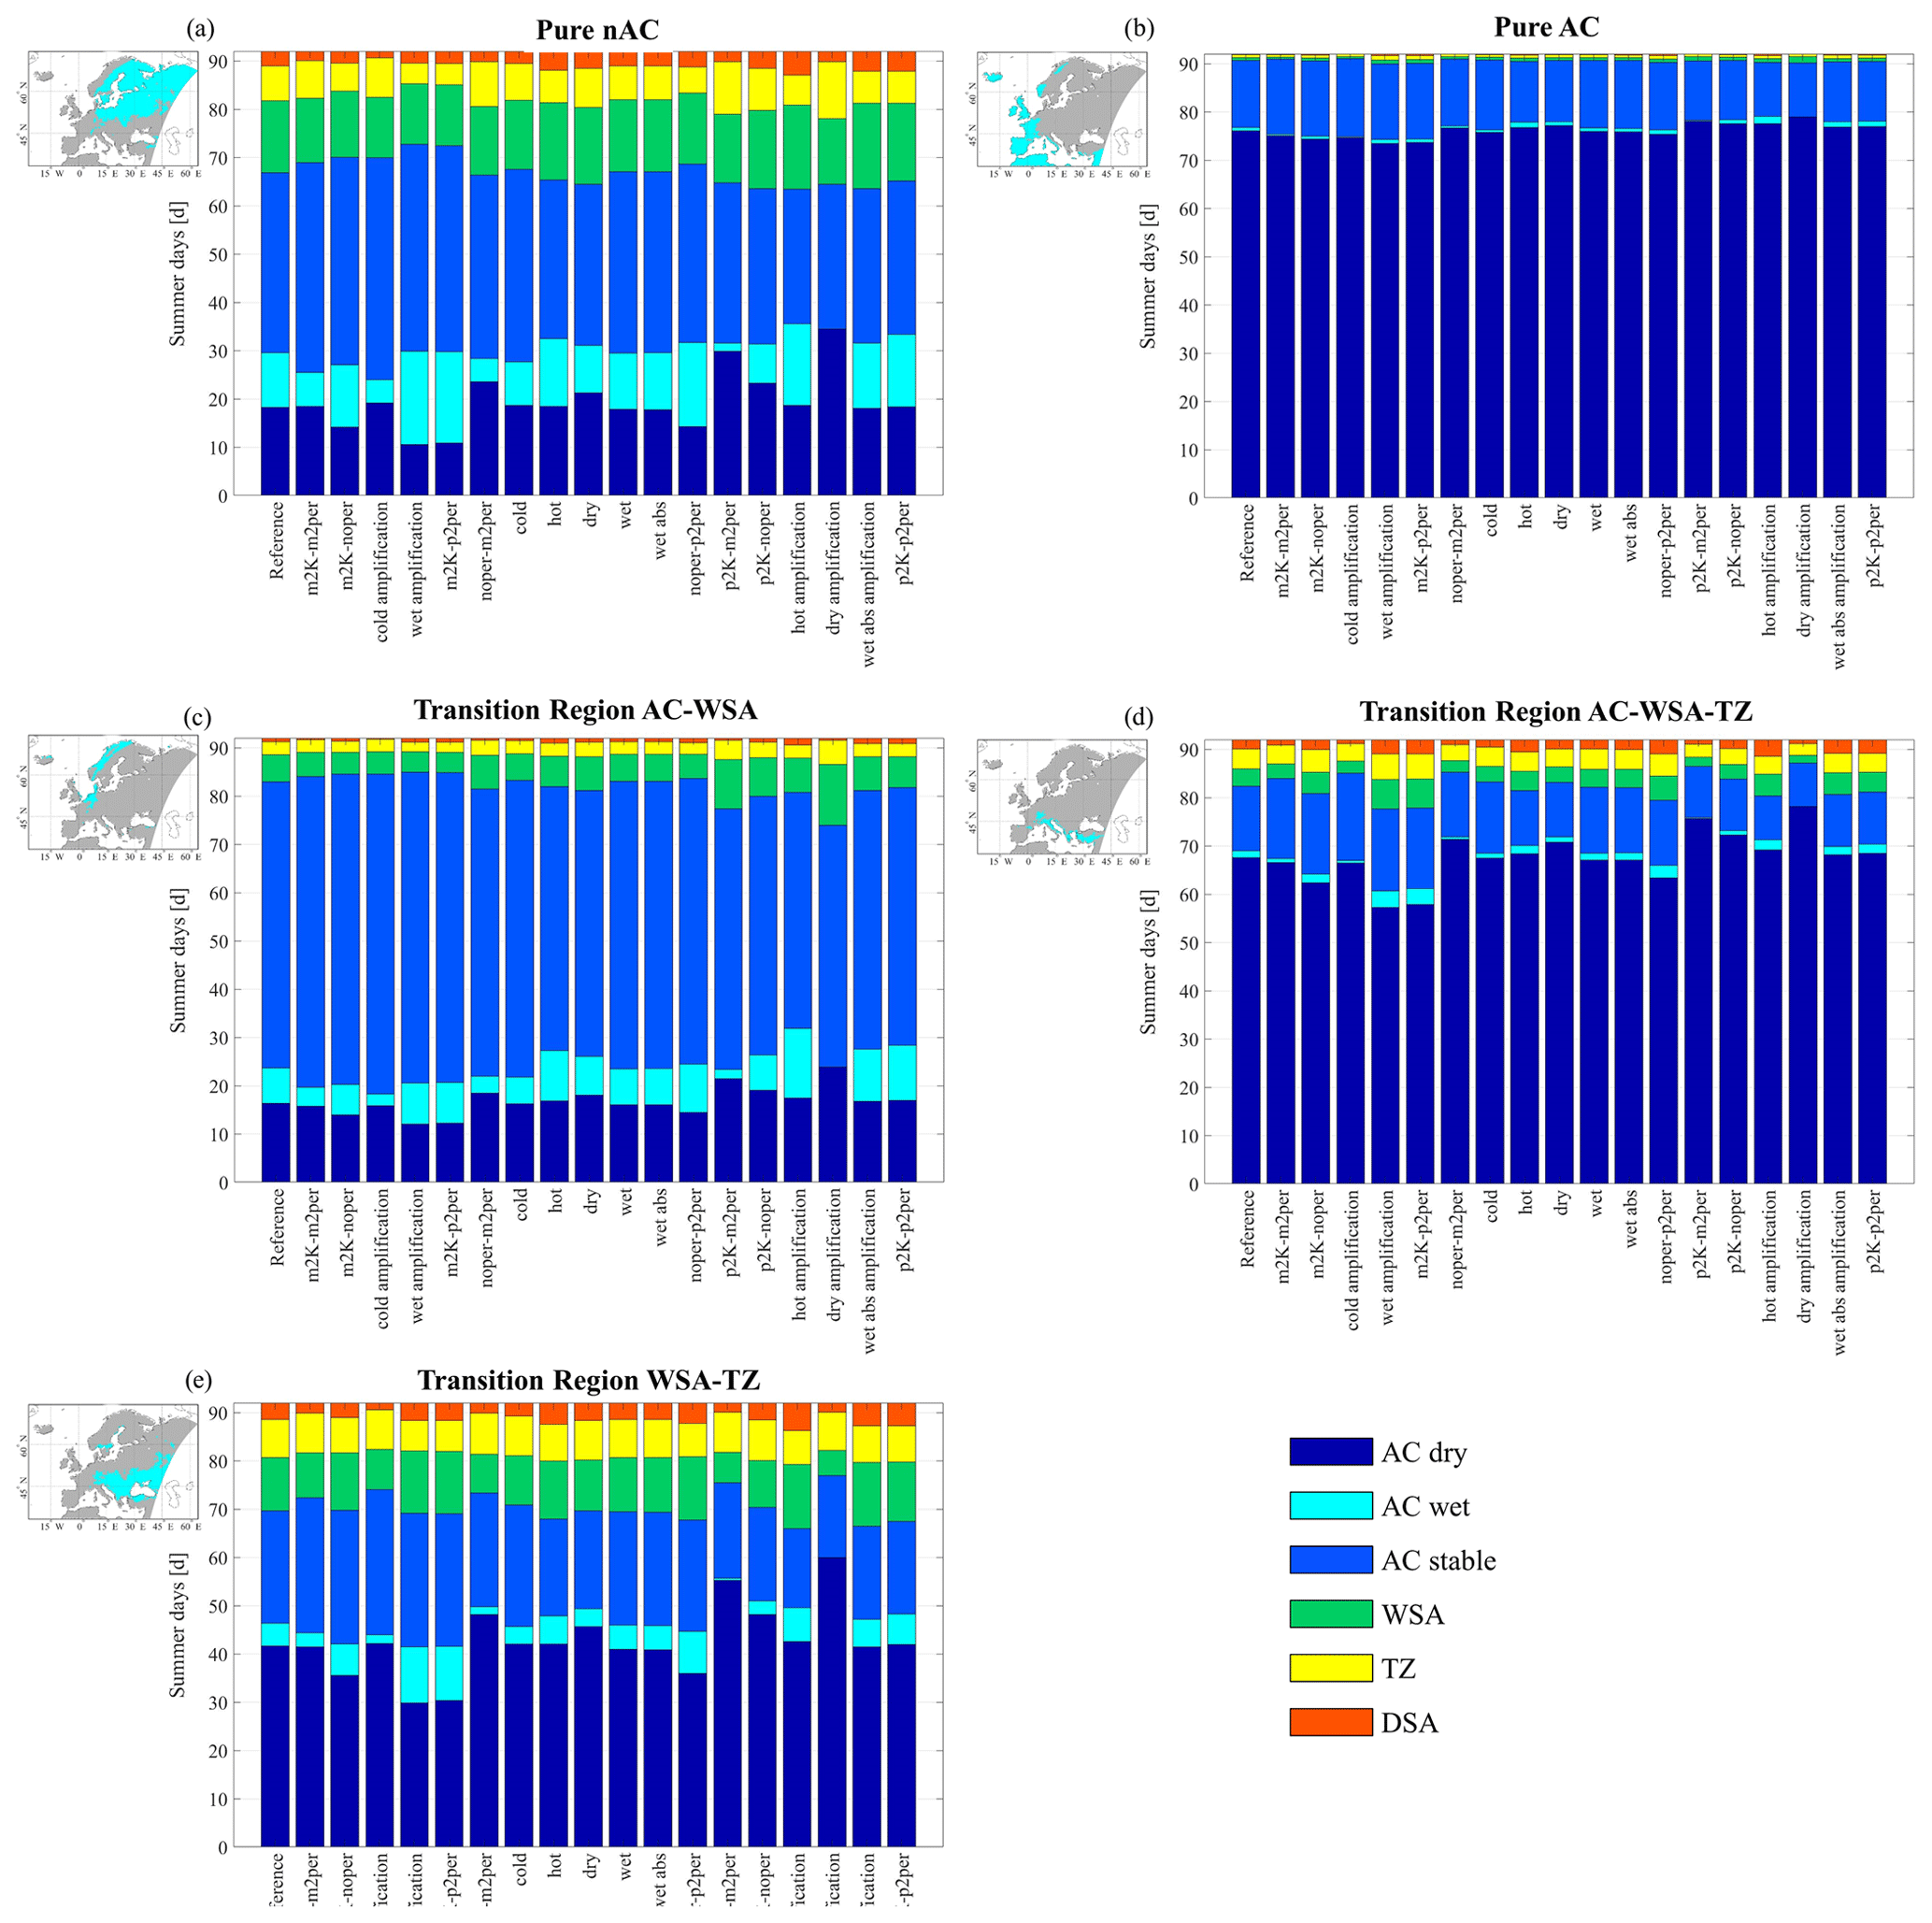
Figure 14Average distribution of the classes in the daily classification for all modification cases spatially aggregated in (a) cells always in nAC, (b) cells always in AC, (c) cells in which the long-term classification frequently switched between AC and nAC, (d) cells in which the long-term classification frequently switched between wet soil advantage (WSA) and transition zone (TZ).
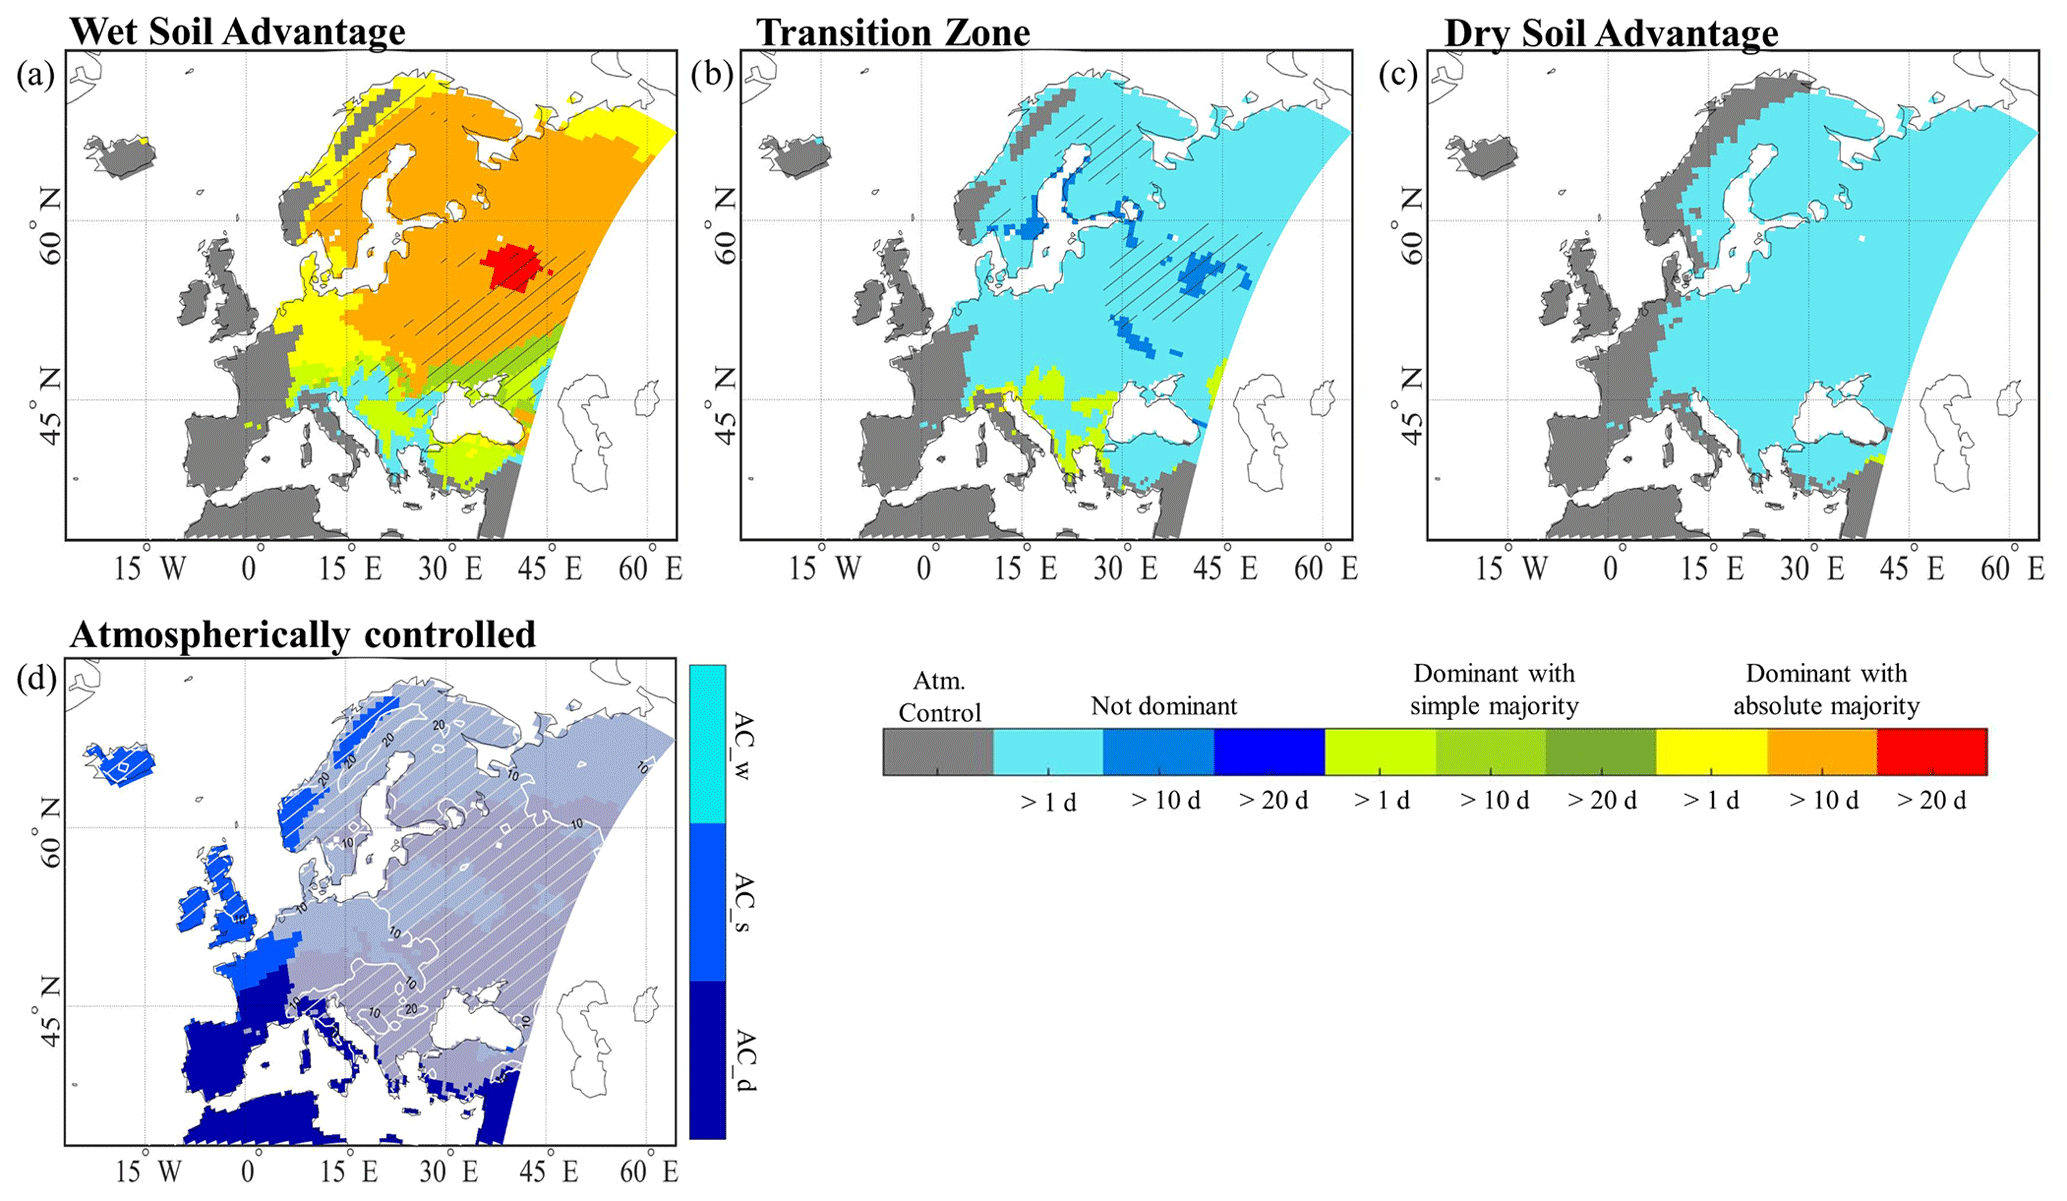
Figure 15Uncertainty maps of the non-atmospherically controlled classes: (a) wet soil advantage, (b) transition zone and (c) dry soil advantage. The colors indicate whether a class is on average dominant in absolute or simple majority, or whether another class is dominant. The color gradation denotes the average number of days. The hatching indicates that in these regions the variance in the number of days in this class is larger than 10 %. Panel (d) shows which atmospherically controlled class dominated in all cases. The hatched area marks the region in which the spread between the modification cases in occurrence of atmospherically controlled days per season is larger than 10 %.
In the pure AC region, the modification cases' impact on the distribution was negligible. Dry AC days dominated, and modifications of temperature and moisture barely influenced the atmospheric pre-conditioning. Considerable variance in the occurrence of coupling days of in part more than 20 % of the summer days occurred mainly in the hotspot region (Figs. 14 and 15d). In the pure nAC region, the number of nAC days ranged on spatial average between 19.2 and 28.5 d per season. The number of wet soil advantage days was relatively stable (ranged between 12.4 and 17.7 d), but the number of transition zone days varied in part considerably (between 4.3 and 11.8 d) with cases showing warming and great relative drying (p2K–m2per, dry amplification) having the most days in transition zone (Figs. 14a and 15b).
As indicated before, the classification was most variable in the WSA–TZ transition region. Similar to the pure nAC region, the number of nAC days varied in spatial average between 15 and 26.1 d between the modification cases (Fig. 15d), but in contrast to the pure nAC region, the number of days in the transition zone was relatively stable, and the number of days in wet soil advantage varied considerably (between 5.2 and 13.3 d) (Fig. 15a and b). The cases experiencing a strong reduction in relative humidity again showed the strongest shifts in the average occurrence of coupling classes throughout the season, which can be seen in clearly less nAC days and wet soil advantage days compared to the rest of the modification cases. In the AC–WSA transition region, the number of nAC days was at about the threshold of 10 % distinguishing AC and nAC (compare Fig. 1b), and differences in the distribution of coupling classes were usually small. Only the cases experiencing warming combined with great reductions in relative humidity exhibited a considerable impact. These cases experienced a clear increase in wet soil advantage days.
The same analyses were also performed for modification cases with higher temperature modifications between ±5 K and all combinations of moisture changes, as done in the core modification set (not shown). This slightly enlarged the transition belt between AC and nAC, and increased the region where dominant wet soil advantage or transition zone can occur. Apart from that, the patterns for sensitive regions (Fig. 12) were substantially similar, and the absence of cells in dominant dry soil advantage remained unaffected.
We modified daily temperature and moisture profiles around local sunrise of 30 summers from a regional climate simulation to examine the sensitivity of land–convection coupling strength to differences in the thermodynamic structure over Europe. The CTP-HIlow framework was applied to each of 18 modification cases grouped into two sets, on the one hand, to understand implications of warmer, cooler, moister or dryer atmospheric conditions for the coupling strength, and on the other hand, to investigate the sensitivity of the strong coupling region's location and the predominant sign of feedbacks within the domain. Analyses of the latter base on the idea that regions lying at the boundaries of two or more categories are particularly sensitive to changes in the atmosphere, as small changes in the pre-conditioning could initiate a different atmospheric response to surface wetness conditions.
Comparing the model's mean near-surface temperature and moisture as well as their temporal distributions with reanalysis data showed that the model has a dry, warm bias over the southern part of the domain and rather a cold bias with small differences in moisture over the northern part. The differences between the temperature and moisture distributions of model and reanalysis data were statistically insignificant (Ferguson and Wood, 2011). Therefore, the relative frequencies of wet soil advantage, dry soil advantage, transition zone and AC days from the model in summer are assumed to be represented in a realistic range and relation to each other.
Nevertheless, uncertainty in the quantification of the coupling classes' occurrence arising from model specific biases has to be acknowledged. The cold bias over eastern Europe results from an overestimation of cooler days at the expense of warmer ones, while the tails of the distribution are represented well in the model (not shown). Assuming that cooler days have a more stable atmospheric layering, the cold bias suggests an underestimation of CTP, and, given that the moisture bias in the same region is small, also an underestimation of the humidity deficit. This could hint at an underestimation of the modeled dry soil advantage days but also an overestimation of wet and stable AC days in the corresponding region. In the southern, mostly atmospherically controlled part of the domain, the warm and dry bias suggests an underestimation of the relative humidity and thus and overestimation of HIlow. The dry atmospheric conditions were one of the major inhibiting factors for coupling events in the model, which hints at an overestimation of dry AC days in the model. However, the distributions of temperature and moisture diverge more in the southern part; the quantification of potential coupling days has to be treated with caution over the Iberian Peninsula and the Mediterranean.
Studying spatial differences in the impacts of temperature and moisture changes reveals a north–south dipole in the coupling strength's sensitivity to changes in both variables indicated by a switch in the sign between the northern and the southern parts of the domain. Furthermore, temperature and moisture changes have contrary effects on the coupling strength throughout the domain. This means that simultaneous increases or decreases, respectively, in temperature and moisture have small net effects, and given that atmospheric temperature and moisture are strongly positively correlated in the Northern Hemisphere (e.g., Willett et al., 2010; Bastin et al., 2019), simultaneous changes of the same sign are considered most realistic. A strengthening of the coupling as a result of atmospheric warming is in line with the trend of stronger coupling in consequence of climate change over Europe. Seneviratne et al. (2006) showed the formation and expansion of a transitional region between wet and dry climates over central and eastern Europe in which strong L–A interactions can be expected. Dirmeyer et al. (2013) showed the trend of increasing coupling strength from a global perspective for both the land and the atmospheric segment.
Analyzing the relative importance of temperature versus moisture changes for the coupling strength within the domain suggests that the temperature control on the coupling strength is stronger in northern Europe, in particular that of coupling days in wet soil advantage (Fig. 8a and b), while moisture variations rather control the coupling strength in southern Europe. Please note that the sign of changes in nAC days and the coupling classes is not sensitive to the choice of the temperature–moisture scaling rate within a tested range of about ±2 % K−1 around the Clausius–Clapeyron rate of 7 % K−1 (Fig. 3). However, the rate does impact the magnitude of changes. In the event of a rate below 7 % K−1, the impact of the respective modification cancels out in the more moisture-controlled south. The areas of temperature and moisture control for nAC days coincide with the energy- and moisture-limited regimes for evapotranspiration over Europe (Knist et al., 2017; Denissen et al., 2020; Seneviratne et al., 2006). Our findings suggest that the energy and moisture limitations further propagate from the land segment of the coupling (connection between soil moisture and surface fluxes) to the atmospheric segment (connection between surface fluxes and boundary layer properties) along the local coupling process chain (Santanello et al., 2018).
Differences in the impacts of modified temperature and moisture gradients showed that the consideration of changes in the gradients can be as important for understanding differences in land–convection coupling as the temperature or moisture change itself. Please note that the vertical resolution of the model (40 levels) limits the representation of details in the profiles, and a higher vertical resolution would provide a more accurate estimate of the temperature and moisture gradients (Wakefield et al., 2021). However, while they, on the one hand, showed that lower vertical resolution introduces uncertainty, they also showed that data with limited resolution still provide reasonable results. Thus, the effects of altered gradients are expected to remain substantially similar also with a higher vertical resolution model output. It shows that increasing the temperature gradient, and hence destabilizing the atmosphere, usually increases the number of nAC days, whereas shallower gradients reduce them. Thus, a warming signal propagating deeply through the atmospheric column (e.g., wet_abs, Figs. 10 and 11) leads to a smaller increase in the coupling strength than one that warms only the lower atmospheric levels, resulting in a greater temperature gradient between 100–300 hPa a.g.l. (hot). However, in the latter case, a stronger surface temperature inversion needs to be dissolved by surface lifting, heating or moistening to enable buoyant lifting and deep convection. Inversions potentially reduce ABL growth during mixed layer development and thus inhibit the triggering of deep convection during the subsequent day and hence weaken the coupling again. This effect cannot be represented in the framework, as it does not resolve inversions in about the lowest 1000 m of the ABL. Further, including the energy partitioning at the land surface in the analysis would inform about ABL moistening and heating during the day and in particular the period of mixed layer development. Brogli et al. (2019) projected lapse-rate decreases in consequence of stronger upper-tropospheric than surface warming over Europe by the end of the 21st century, and that the decreases are stronger over northern Europe than over the Mediterranean. Warming and decreasing lapse rates are assumed to have contrary effects on the coupling strength, showing that further research is necessary to understand and quantify impacts of future warming on the L–A coupling strength.
Finally, the reliability of the coupling hotspot as suggested by Jach et al. (2020) was analyzed, at first, by testing the sensitivity of the daily classification of atmospheric pre-conditioning in consequence of the modifications, and secondly, by checking whether and how frequently the dominance of a feedback advantage was changed over the 30-year period. We have shown that modifications of temperature and moisture cause considerable differences in both the occurrence of nAC days and their partitioning in the different coupling classes over the strong coupling region throughout the summer season. However, this does not necessarily imply a change in the dominance of a coupling class. There are two regions in which the dominant coupling class is insensitive to changes in the atmospheric structure, wherefore a consistent regime can be expected. On the one hand, the atmospherically controlled southwest and Atlantic coastal areas of Europe remain in atmospheric control in every modification case. Even considerable increases in low-level atmospheric relative humidity did not decrease the humidity deficit to a level in which local surface triggered deep convection can occur on a frequent basis. On the other hand, none of the modification cases reduced the coupling so that the strong positively coupled region over the East European Plain disappeared. Thus, this region is considered a reliable hotspot region for positive feedbacks. Evidence for the location of the hotspot is also found in Koster et al. (2004) or Seneviratne et al. (2006), who investigated hotspots of soil moisture–precipitation coupling in a global model ensemble.
Frequent changes in the coupling regime occur over parts of Scandinavia, Germany and from the Alps to around the Black Sea. Regime changes are related to two effects or a combination of those. Firstly, the modifications frequently increase the number of nAC days above the threshold to be considered nAC and hence expand the size of the hotspot. This happens at the border between the reliable AC and the strong coupling region. Differences among the modification cases are usually small, which suggests that the effect in reality is small. Secondly, the region from the Alps to around the Black Sea has always enough nAC days to be considered nAC, but the dominant coupling class regularly shifts between the wet soil advantage and transition zone depending on the atmospheric temperature and moisture. The number of wet soil advantage and transition zone days is fairly equal in this region. Differences in temperature and moisture control which class dominates, and hence, following their definition, whether deep convection or shallow convection is more likely. This makes the region particularly interesting for future research on L–A feedback.
It has to be noted that the analysis focused on analyzing differences in the mean and vertical gradients of temperature and moisture to approximate a potentially realistic spread in the atmospheric segment of L–A coupling strength for Europe. The horizontal and temporal distributions were maintained, as the modification factors cannot cover changes in variability which would change the shape of the distributions. However, differences in the temporal distribution are to be expected in consequence of non-linear feedback processes, when a change in the mean temperature and moisture occurs, which can also impact the L–A coupling (Hirsch et al., 2014). Yet, a prediction of changes in the temporal distribution is complex and beyond what can be done with a modification factor. This suggests that further investigation is necessary to understand differences in the temporal distribution of temperature and moisture in the atmosphere and link them to L–A coupling to improve the understanding of modification in the coupling under changing climatic conditions.
By studying the sensitivity of the atmospheric segment of L–A coupling strength to modifications in vertical temperature and moisture during 30 summers over Europe, we have shown that the atmospheric pre-conditioning and the coupling are indeed sensitive to changes in temperature and moisture. However, no combination of temperature and moisture changes relocated or reshaped the coupling hotspot strongly over northeastern and eastern Europe. Differences in the frequency of occurrence of advantageous atmospheric conditions for feedbacks of any kind suggest that uncertainty remains in the accuracy of the coupling strength itself, but stronger coupling relative to the rest of the domain is considered reliable there. Further research including the development of datasets usable for validation or the analysis of L–A coupling in the most recent reanalysis datasets is required for refined approximations of the L–A coupling strength. Furthermore, the predominance of positive feedbacks, meaning convection is preferably triggered over wet soils, was preserved in all cases over the northern part of the coupling hotspot. Therefore, it is predestined for future studies on the impacts of natural and deliberate land surface modifications on the local and regional climate as options for climate change mitigation, as an influence can be expected and the dominant response is certain. This is particularly interesting in light of rising temperatures and the related trend of strengthened L–A coupling under global warming (Dirmeyer et al., 2013; Seneviratne et al., 2006). In the southern part, the coupling classes wet soil advantage and transition zone have an equal share throughout summer, and temperature and moisture modifications cause a switch in the regime in several cases, implying uncertainty in the dominant coupling regime. This makes the region particularly interesting for further studies on L–A coupling, because small changes in the atmospheric conditions may lead to a different atmospheric response. Additionally, the understanding and improved representation of these feedback processes in regional climate models are expected to reduce uncertainties in summer precipitation predictions in climate projections. Especially, the parameterization of convective precipitation has been shown to introduce uncertainties and more advanced triggering mechanisms for convection may lead to an improvement of precipitation predictions (Chen et al., 2017).
Finally, process-based coupling studies still face a substantial lack of spatially comprehensive data covering the vertical structure of the ABL on the regional scale and hence the reliance on model data. Efforts of creating a network of coordinated continuous long-term measurements such as the GLAFO initiative (Wulfmeyer et al., 2020) are required to close the gap and provide a validation basis for modeling-based studies. The modeling-based studies, in turn, are confronted with data storage and computation limitations, which currently leads to the practice of storing 3-D fields only with a limited number of vertical levels. The trend of increasing complexity of atmospheric models, higher temporal and spatial resolutions, as well as spatial and temporal coverage of simulations strongly exacerbates storage limitations. Though single model studies are limited in their generalizability as, e.g., the choice of parameterizations or lateral boundary conditions cause uncertainty in coupling assessments, it is unlikely that comprehensive model ensemble studies will become feasible on the regional scale in the short and medium terms. Therefore, we consider this modification approach as a valuable alternative to study the sensitivity of the atmospheric segment of L–A coupling providing evidence for the location of a L–A coupling hotspot and a range for potential coupling strength under current climatic conditions.
The model results are available on the CERA database of the DKRZ (http://cera-www.dkrz.de/WDCC/ui/Compact.jsp?acronym=DKRZ_LTA_1140_ds00005; Jach et al. 2021). The bias-corrected reanalysis data are available through the C3S platform and were downloaded in October 2020 (https://doi.org/10.24381/CDS.20D54E34; C3S, 2020).
The supplement related to this article is available online at: https://doi.org/10.5194/esd-13-109-2022-supplement.
LJ performed the simulations and did the analysis. LJ and TS designed the analysis. LJ prepared the manuscript with contributions from all co-authors.
The contact author has declared that neither they nor their co-authors have any competing interests.
Publisher's note: Copernicus Publications remains neutral with regard to jurisdictional claims in published maps and institutional affiliations.
We thank two anonymous reviewers for their comments and helpful remarks on the manuscript. This work was completed in part with the CSL High-Performance Storage System provided by Computational Science Lab at the University of Hohenheim, and we acknowledge support by the state of Baden-Württemberg through bwHPC.
The research of this study was funded by the Anton and Petra Ehrmann-Stiftung Research Training Group “Water-People-Agriculture”.
This paper was edited by Gabriele Messori and reviewed by two anonymous referees.
Bastin, S., Drobinski, P., Chiriaco, M., Bock, O., Roehrig, R., Gallardo, C., Conte, D., Domínguez Alonso, M., Li, L., Lionello, P., and Parracho, A. C.: Impact of humidity biases on light precipitation occurrence: observations versus simulations, Atmos. Chem. Phys., 19, 1471–1490, https://doi.org/10.5194/acp-19-1471-2019, 2019.
Baur, F., Keil, C., and Craig, G. C.: Soil moisture–precipitation coupling over Central Europe: Interactions between surface anomalies at different scales and the dynamical implication, Q. J. Roy. Meteorol. Soc., 144, 2863–2875, https://doi.org/10.1002/qj.3415, 2018.
Berg, A., Findell, K., Lintner, B. R., Gentine, P., and Kerr, C.: Precipitation Sensitivity to Surface Heat Fluxes over North America in Reanalysis and Model Data, J. Hydrometeorol., 14, 722–743, https://doi.org/10.1175/JHM-D-12-0111.1, 2013.
Branch, O. and Wulfmeyer, V.: Deliberate enhancement of rainfall using desert plantations, P. Natl. Acad. Sci. USA, 116, 201904754, https://doi.org/10.1073/pnas.1904754116, 2019.
Brogli, R., Kröner, N., Sørland, S. L., Lüthi, D., and Schär, C.: The Role of Hadley Circulation and Lapse-Rate Changes for the Future European Summer Climate, J. Climate, 32, 385–404, https://doi.org/10.1175/JCLI-D-18-0431.1, 2019.
Chen, L., Dirmeyer, P. A., Tawfik, A., and Lawrence, D. M.: Sensitivities of Land Cover–Precipitation Feedback to Convective Triggering, J. Hydrometeorol., 18, 2265–2283, https://doi.org/10.1175/JHM-D-17-0011.1, 2017.
Comer, R. E. and Best, M. J.: Revisiting GLACE: Understanding the Role of the Land Surface in Land–Atmosphere Coupling, J. Hydrometeorol., 13, 1704–1718, https://doi.org/10.1175/JHM-D-11-0146.1, 2012.
C3S: Near surface meteorological variables from 1979 to 2018 derived from bias-corrected reanalysis, C3S [data set], https://doi.org/10.24381/CDS.20D54E34, 2020.
Davin, E. L., Rechid, D., Breil, M., Cardoso, R. M., Coppola, E., Hoffmann, P., Jach, L. L., Katragkou, E., de Noblet-Ducoudré, N., Radtke, K., Raffa, M., Soares, P. M. M., Sofiadis, G., Strada, S., Strandberg, G., Tölle, M. H., Warrach-Sagi, K., and Wulfmeyer, V.: Biogeophysical impacts of forestation in Europe: first results from the LUCAS (Land Use and Climate Across Scales) regional climate model intercomparison, Earth Syst. Dynam., 11, 183–200, https://doi.org/10.5194/esd-11-183-2020, 2020.
Dee, D. P., Uppala, S. M., Simmons, A. J., Berrisford, P., Poli, P., Kobayashi, S., Andrae, U., Balmaseda, M. A., Balsamo, G., Bauer, P., Bechtold, P., Beljaars, A. C. M., van de Berg, L., Bidlot, J., Bormann, N., Delsol, C., Dragani, R., Fuentes, M., Geer, A. J., Haimberger, L., Healy, S. B., Hersbach, H., Hólm, E. V., Isaksen, L., Kållberg, P., Köhler, M., Matricardi, M., McNally, A. P., Monge-Sanz, B. M., Morcrette, J.-J., Park, B.-K., Peubey, C., de Rosnay, P., Tavolato, C., Thépaut, J.-N., and Vitart, F.: The ERA-Interim reanalysis: configuration and performance of the data assimilation system, Q. J. Roy. Meteorol. Soc., 137, 553–597, https://doi.org/10.1002/qj.828, 2011.
Denissen, J. M. C., Teuling, A. J., Reichstein, M., and Orth, R.: Critical Soil Moisture Derived From Satellite Observations Over Europe, J. Geophys. Res.-Atmos., 125, e2019JD031672, https://doi.org/10.1029/2019JD031672, 2020.
Dirmeyer, P. A., Cash, B. A., Kinter, J. L., Stan, C., Jung, T., Marx, L., Towers, P., Wedi, N., Adams, J. M., Altshuler, E. L., Huang, B., Jin, E. K., and Manganello, J.: Evidence for Enhanced Land–Atmosphere Feedback in a Warming Climate, J. Hydrometeorol., 13, 981–995, https://doi.org/10.1175/JHM-D-11-0104.1, 2012.
Dirmeyer, P. A., Jin, Y., Singh, B., and Yan, X.: Trends in Land–Atmosphere Interactions from CMIP5 Simulations, J. Hydrometeorol., 14, 829–849, https://doi.org/10.1175/JHM-D-12-0107.1, 2013.
Dirmeyer, P. A., Wang, Z., Mbuh, M. J., and Norton, H. E.: Intensified land surface control on boundary layer growth in a changing climate: Dirmeyer et al.: Land-PBL feedback in a changing climate, Geophys. Res. Lett., 41, 1290–1294, https://doi.org/10.1002/2013GL058826, 2014.
Dirmeyer, P. A., Chen, L., Wu, J., Shin, C.-S., Huang, B., Cash, B. A., Bosilovich, M. G., Mahanama, S., Koster, R. D., Santanello, J. A., Ek, M. B., Balsamo, G., Dutra, E., and Lawrence, D. M.: Verification of Land–Atmosphere Coupling in Forecast Models, Reanalyses, and Land Surface Models Using Flux Site Observations, J. Hydrometeorol., 19, 375–392, https://doi.org/10.1175/JHM-D-17-0152.1, 2018.
European Environmental Agency: CORINE Land Cover (CLC) 2006, CRC/TR32 Database (TR32DB), Version 17, Copernicus Land Monitoring Service, Copenhagen, available at: https://www.eea.europe.eu/data-and-maps/data/clc-2006-raster-3 (last access: 21 January 2022), 2013.
Ferguson, C. R. and Wood, E. F.: Observed Land–Atmosphere Coupling from Satellite Remote Sensing and Reanalysis, J. Hydrometeorol., 12, 1221–1254, https://doi.org/10.1175/2011JHM1380.1, 2011.
Findell, K. L. and Eltahir, E. A. B.: Atmospheric Controls on Soil Moisture–Boundary Layer Interactions. Part I: Framework Development, J. Hydrometeorol., 4, 552–569, https://doi.org/10.1175/1525-7541(2003)004<0552:ACOSML>2.0.CO;2, 2003a.
Findell, K. L. and Eltahir, E. A. B.: Atmospheric Controls on Soil Moisture–Boundary Layer Interactions. Part II: Feedbacks within the Continental United States, J. Hydrometeorol., 4, 570–583, https://doi.org/10.1175/1525-7541(2003)004<0570:ACOSML>2.0.CO;2, 2003b.
Findell, K. L., Gentine, P., Lintner, B. R., and Kerr, C.: Probability of afternoon precipitation in eastern United States and Mexico enhanced by high evaporation, Nat. Geosci., 4, 434–439, https://doi.org/10.1038/ngeo1174, 2011.
Findell, K. L., Gentine, P., Lintner, B. R., and Guillod, B. P.: Data Length Requirements for Observational Estimates of Land–Atmosphere Coupling Strength, J. Hydrometeorol., 16, 1615–1635, https://doi.org/10.1175/JHM-D-14-0131.1, 2015.
Gentine, P., Holtslag, A. A. M., D'Andrea, F., and Ek, M.: Surface and Atmospheric Controls on the Onset of Moist Convection over Land, J. Hydrometeorol., 14, 1443–1462, https://doi.org/10.1175/JHM-D-12-0137.1, 2013.
Guo, Z. and Dirmeyer, P. A.: Interannual Variability of Land–Atmosphere Coupling Strength, J. Hydrometeorol., 14, 1636–1646, https://doi.org/10.1175/JHM-D-12-0171.1, 2013.
Guo, Z., Dirmeyer, P. A., Koster, R. D., Sud, Y. C., Bonan, G., Oleson, K. W., Chan, E., Verseghy, D., Cox, P., Gordon, C. T., McGregor, J. L., Kanae, S., Kowalczyk, E., Lawrence, D., Liu, P., Mocko, D., Lu, C.-H., Mitchell, K., Malyshev, S., McAvaney, B., Oki, T., Yamada, T., Pitman, A., Taylor, C. M., Vasic, R., and Xue, Y.: GLACE: The Global Land–Atmosphere Coupling Experiment. Part II: Analysis, J. Hydrometeorol., 7, 611–625, https://doi.org/10.1175/JHM511.1, 2006.
Hirsch, A. L., Pitman, A. J., and Kala, J.: The role of land cover change in modulating the soil moisture-temperature land–atmosphere coupling strength over Australia, Geophys. Res. Lett., 41, 5883–5890, https://doi.org/10.1002/2014GL061179, 2014.
Hohenegger, C., Brockhaus, P., Bretherton, C. S., and Schär, C.: The Soil Moisture–Precipitation Feedback in Simulations with Explicit and Parameterized Convection, J. Climate, 22, 5003–5020, https://doi.org/10.1175/2009JCLI2604.1, 2009.
Iacono, M. J., Delamere, J. S., Mlawer, E. J., Shephard, M. W., Clough, S. A., and Collins, W. D.: Radiative forcing by long-lived greenhouse gases: Calculations with the AER radiative transfer models, J. Geophys. Res.-Atmos., 113, D13103, https://doi.org/10.1029/2008JD009944, 2008.
Jach, L., Warrach-Sagi, K., Ingwersen, J., Kaas, E., and Wulfmeyer, V.: Land Cover Impacts on Land-Atmosphere Coupling Strength in Climate Simulations With WRF Over Europe, J. Geophys. Res.-Atmos., 125, e2019JD031989, https://doi.org/10.1029/2019JD031989, 2020.
Jach, L., Warrach-Sagi, K., and Wulfmeyer, V.: FPS LUCAS EUR-44 UHOH ECMWF-ERAINT WRF381, DOKU at DKRZ [data set], available at: http://cera-www.dkrz.de/WDCC/ui/Compact.jsp?acronym=DKRZ_LTA_1140_ds00005 (last access: 21 January 2022), 2021.
Jacob, D., Teichmann, C., Sobolowski, S., Katragkou, E., Anders, I., Belda, M., Benestad, R., Boberg, F., Buonomo, E., Cardoso, R. M., Casanueva, A., Christensen, O. B., Christensen, J. H., Coppola, E., De Cruz, L., Davin, E. L., Dobler, A., Domingues, M., Fealy, R., Fernandez, J., Gaertner, M. A., García-Díez, M., Giorgi, F., Gobiet, A., Goergen, K., Gómez-Navarro, J. J., Gonzáles Alemán, J. J., Gutiérrez, C., Gutiérrez, J. M., Güttler, I., Haensler, A., Halenka, T., Jerez, S., Jiménez-Guerrero, P., Jones, R. G., Keuler, K., Kjellström, E., Knist, S., Kotlarski, S., Maraun, D., van Meijgaard, E., Mercogliano, P., Montávez, J. P., Navarra, A., Nikulin, G., de Noblet-Decoudré, N., Panitz, H.-J., Pfeifer, S., Piazza, M., Pichelli, E., Pietikäinen, J.-P., Prein, A. F., Preuschmann, S., Rechid, D., Rockel, B., Romera, R., Sánchez, E., Sieck, K., Soares, P. M. M., Somot, S., Srnec, L., Sørland, S. L., Termonia, P., Truhetz, H., Vaudard, R., Warrach-Sagi, K., and Wulfmeyer, V.: Regional climate downscaling over Europe: perspectives from the EURO-CORDEX community, Reg. Clim. Change, 20, 51, https://doi.org/10.1007/s10113-020-01606-9, 2020.
Jaeger, E. B. and Seneviratne, S. I.: Impact of soil moisture–atmosphere coupling on European climate extremes and trends in a regional climate model, Clim. Dynam., 36, 1919–1939, https://doi.org/10.1007/s00382-010-0780-8, 2011.
Kain, J. S.: The Kain–Fritsch Convective Parameterization: An Update, J. Appl. Meteorol. Clim., 43, 170–181, https://doi.org/10.1175/1520-0450(2004)043<0170:TKCPAU>2.0.CO;2, 2004.
Knist, S., Goergen, K., Buonomo, E., Christensen, O. B., Colette, A., Cardoso, R. M., Fealy, R., Fernández, J., García-Díez, M., Jacob, D., Kartsios, S., Katragkou, E., Keuler, K., Mayer, S., van Meijgaard, E., Nikulin, G., Soares, P. M. M., Sobolowski, S., Szepszo, G., Teichmann, C., Vautard, R., Warrach-Sagi, K., Wulfmeyer, V., and Simmer, C.: Land-atmosphere coupling in EURO-CORDEX evaluation experiments: Land-Atmosphere Coupling in EURO-CORDEX, J. Geophys. Res.-Atmos., 122, 79–103, https://doi.org/10.1002/2016JD025476, 2017.
Knist, S., Goergen, K., and Simmer, C.: Effects of land surface inhomogeneity on convection-permitting WRF simulations over central Europe, Meteorol. Atmos. Phys., 132, 53–69, https://doi.org/10.1007/s00703-019-00671-y, 2020.
Koster, R. D., Dirmeyer, P., Guo, Z., Bonan, G., Chan, E., Cox, P., Gordon, C. T., Kanae, S., Kowalczyk, E., Lawrence, D., Liu, P., Lu, C.-H., Malyshec, S., McAvaney, B., Mitchell, K., Mocko, D., Oki, T., Oleson, K., Pitman, A., Sud, Y. C., Taylor, C. M., Verseghy, D., Vasic, R., Xue, Y., and Yamada, T.: Regions of Strong Coupling Between Soil Moisture and Precipitation, Science, 305, 1138–1140, https://doi.org/10.1126/science.1100217, 2004.
Koster, R. D., Sud, Y. C., Guo, Z., Dirmeyer, P. A., Bonan, G., Oleson, K. W., Chan, E., Verseghy, D., Cox, P., Davies, H., Kowalczyk, E., Gordon, C. T., Kanae, S., Lawrence, D., Liu, P., Mocko, D., Lu, C.-H., Mitchell, K., Malyshev, S., McAvaney, B., Oki, T., Yamada, T., Pitman, A., Taylor, C. M., Vasic, R., and Xue, Y.: GLACE: The Global Land–Atmosphere Coupling Experiment. Part I: Overview, J. Hydrometeorol., 7, 590–610, https://doi.org/10.1175/JHM510.1, 2006.
Koster, R. D., Mahanama, S. P. P., Yamada, T. J., Balsamo, G., Berg, A. A., Boisserie, M., Dirmeyer, P. A., Doblas-Reyes, F. J., Drewitt, G., Gordon, C. T., Guo, Z., Jeong, J.-H., Lee, W.-S., Li, Z., Luo, L., Malyshev, S., Merryfield, W. J., Seneviratne, S. I., Stanelle, T., van den Hurk, B. J. J. M., Vitart, F., and Wood, E. F.: The Second Phase of the Global Land–Atmosphere Coupling Experiment: Soil Moisture Contributions to Subseasonal Forecast Skill, J. Hydrometeorol., 12, 805–822, https://doi.org/10.1175/2011JHM1365.1, 2011.
Kotlarski, S., Keuler, K., Christensen, O. B., Colette, A., Déqué, M., Gobiet, A., Goergen, K., Jacob, D., Lüthi, D., van Meijgaard, E., Nikulin, G., Schär, C., Teichmann, C., Vautard, R., Warrach-Sagi, K., and Wulfmeyer, V.: Regional climate modeling on European scales: a joint standard evaluation of the EURO-CORDEX RCM ensemble, Geosci. Model Dev., 7, 1297–1333, https://doi.org/10.5194/gmd-7-1297-2014, 2014.
Laguë, M. M., Bonan, G. B., and Swann, A. L. S.: Separating the Impact of Individual Land Surface Properties on the Terrestrial Surface Energy Budget in both the Coupled and Uncoupled Land–Atmosphere System, J. Climate, 32, 5725–5744, https://doi.org/10.1175/JCLI-D-18-0812.1, 2019.
Lorenz, R., Davin, E. L., and Seneviratne, S. I.: Modeling land-climate coupling in Europe: Impact of land surface representation on climate variability and extremes: Land-Climate Coupling In Europe, J. Geophys. Res., 117, D20109, https://doi.org/10.1029/2012JD017755, 2012.
Lorenz, R., Pitman, A. J., Hirsch, A. L., and Srbinovsky, J.: Intraseasonal versus Interannual Measures of Land–Atmosphere Coupling Strength in a Global Climate Model: GLACE-1 versus GLACE-CMIP5 Experiments in ACCESS1.3b, J. Hydrometeorol., 16, 2276–2295, https://doi.org/10.1175/JHM-D-14-0206.1, 2015.
Milovac, J., Ingwersen, J., and Warrach-Sagi, K.: Soil texture forcing data for the whole world for the Weather Research and Forecasting (WRF) Model of the University of Hohenheim (UHOH) based on the Harmonized World Soil Database (HWSD) at 30 arc-second horizontal resolution, WDC Climate, https://doi.org/10.1594/WDCC/WRF_NOAH_HWSD_world_TOP_SOILTYP, 2014.
Milovac, J., Warrach-Sagi, K., Behrendt, A., Späth, F., Ingwersen, J., and Wulfmeyer, V.: Investigation of PBL schemes combining the WRF model simulations with scanning water vapor differential absorption lidar measurements: WRF Sensitivity to PBL Schemes and LSMs, J. Geophys. Res.-Atmos., 121, 624–649, https://doi.org/10.1002/2015JD023927, 2016.
Miralles, D. G., Gentine, P., Seneviratne, S. I., and Teuling, A. J.: Land-atmospheric feedbacks during droughts and heatwaves: state of the science and current challenges: Land feedbacks during droughts and heatwaves, Ann. N. Y. Acad. Sci., 1436, 19–35, https://doi.org/10.1111/nyas.13912, 2019.
Mlawer, E. J., Taubman, S. J., Brown, P. D., Iacono, M. J., and Clough, S. A.: Radiative transfer for inhomogeneous atmospheres: RRTM, a validated correlated-k model for the longwave, J. Geophys. Res., 102, 16663–16682, https://doi.org/10.1029/97JD00237, 1997.
Nakanishi, M. and Niino, H.: Development of an Improved Turbulence Closure Model for the Atmospheric Boundary Layer, J. Meteorol. Soc. Jpn. Ser. II, 87, 895–912, https://doi.org/10.2151/jmsj.87.895, 2009.
Niu, G.-Y., Yang, Z.-L., Mitchell, K. E., Chen, F., Ek, M. B., Barlage, M., Kumar, A., Manning, K., Niyogi, D., Rosero, E., Tewari, M., and Xia, Y.: The community Noah land surface model with multiparameterization options (Noah-MP): 1. Model description and evaluation with local-scale measurements, J. Geophys. Res.-Atmos., 116, D12109, https://doi.org/10.1029/2010JD015139, 2011.
Perkins, S. E., Pitman, A. J., Holbrook, N. J., and McAneney, J.: Evaluation of the AR4 Climate Models' Simulated Daily Maximum Temperature, Minimum Temperature, and Precipitation over Australia Using Probability Density Functions, J. Climate, 20, 4356–4376, https://doi.org/10.1175/JCLI4253.1, 2007.
Pitman, A. J., de Noblet-Ducoudré, N., Cruz, F. T., Davin, E. L., Bonan, G. B., Brovkin, V., Claussen, M., Delire, C., Ganzeveld, L., Gayler, V., van den Hurk, B. J. J. M., Lawrence, P. J., van der Molen, M. K., Müller, C., Reick, C. H., Seneviratne, S. I., Strengers, B. J., and Voldoire, A.: Uncertainties in climate responses to past land cover change: First results from the LUCID intercomparison study, Geophys. Res. Lett., 36, L14814, https://doi.org/10.1029/2009GL039076, 2009.
Powers, J. G., Klemp, J. B., Skamarock, W. C., Davis, C. A., Dudhia, J., Gill, D. O., Coen, J. L., Gochis, D. J., Ahmadov, R., Peckham, S. E., Grell, G. A., Michalakes, J., Trahan, S., Benjamin, S. G., Alexander, C. R., Dimego, G. J., Wang, W., Schwartz, C. S., Romine, G. S., Liu, Z., Snyder, C., Chen, F., Barlage, M. J., Yu, W., and Duda, M. G.: The Weather Research and Forecasting Model: Overview, System Efforts, and Future Directions, B. Am. Meteorol. Soc., 98, 1717–1737, https://doi.org/10.1175/BAMS-D-15-00308.1, 2017.
Roundy, J. K. and Santanello, J. A.: Utility of Satellite Remote Sensing for Land–Atmosphere Coupling and Drought Metrics, J. Hydrometeorol., 18, 863–877, https://doi.org/10.1175/JHM-D-16-0171.1, 2017.
Roundy, J. K., Ferguson, C. R., and Wood, E. F.: Temporal Variability of Land–Atmosphere Coupling and Its Implications for Drought over the Southeast United States, J. Hydrometeorol., 14, 622–635, https://doi.org/10.1175/JHM-D-12-090.1, 2013.
Santanello, J. A., Peters-Lidard, C. D., Kumar, S. V., Alonge, C., and Tao, W.-K.: A Modeling and Observational Framework for Diagnosing Local Land–Atmosphere Coupling on Diurnal Time Scales, J. Hydrometeorol., 10, 577–599, https://doi.org/10.1175/2009JHM1066.1, 2009.
Santanello, J. A., Peters-Lidard, C. D., and Kumar, S. V.: Diagnosing the Sensitivity of Local Land–Atmosphere Coupling via the Soil Moisture–Boundary Layer Interaction, J. Hydrometeorol., 12, 766–786, https://doi.org/10.1175/JHM-D-10-05014.1, 2011.
Santanello, J. A., Dirmeyer, P. A., Ferguson, C. R., Findell, K. L., Tawfik, A. B., Berg, A., Ek, M., Gentine, P., Guillod, B. P., van Heerwaarden, C., Roundy, J., and Wulfmeyer, V.: Land–Atmosphere Interactions: The LoCo Perspective, B. Am. Meteorol. Soc., 99, 1253–1272, https://doi.org/10.1175/BAMS-D-17-0001.1, 2018.
Santanello Jr., J. A., Lawston, P., Kumar, S., and Dennis, E.: Understanding the Impacts of Soil Moisture Initial Conditions on NWP in the Context of Land–Atmosphere Coupling, J. Hydrometeorol., 20, 793–819, https://doi.org/10.1175/JHM-D-18-0186.1, 2019.
Schumacher, D. L., Keune, J., van Heerwaarden, C. C., Vilà-Guerau de Arellano, J., Teuling, A. J., and Miralles, D. G.: Amplification of mega-heatwaves through heat torrents fuelled by upwind drought, Nat. Geosci., 12, 712–717, https://doi.org/10.1038/s41561-019-0431-6, 2019.
Seneviratne, S. I., Lüthi, D., Litschi, M., and Schär, C.: Land–atmosphere coupling and climate change in Europe, Nature, 443, 205–209, https://doi.org/10.1038/nature05095, 2006.
Skamarock, W., Klemp, J., Dudhia, J., Gill, D., Barker, D., Wang, W., Huang, X.-Y., and Duda, M.: A Description of the Advanced Research WRF Version 3, UCAR/NCAR, https://doi.org/10.5065/D68S4MVH, 2008.
Späth, F., Wulfmeyer, V., Streck, T., and Behrendt, A.: The Land-Atmosphere Feedback Observatory (LAFO): A novel sensor network to improve weather forecasting and climate models, in: EGU General Assembly, 7–12 April 2019, Vienna, Austria, 2019.
Sun, J. and Pritchard, M. S.: Effects of explicit convection on global land–atmosphere coupling in the superparameterized CAM: Explicit Convection On Global Land-Atmosphere Coupling, J. Adv. Model. Earth Syst., 8, 1248–1269, https://doi.org/10.1002/2016MS000689, 2016.
Sun, J. and Pritchard, M. S.: Effects of Explicit Convection on Land Surface Air Temperature and Land-Atmosphere Coupling in the Thermal Feedback Pathway, J. Adv. Model. Earth Syst., 10, 2376–2392, https://doi.org/10.1029/2018MS001301, 2018.
Taylor, C. M., de Jeu, R. A. M., Guichard, F., Harris, P. P., and Dorigo, W. A.: Afternoon rain more likely over drier soils, Nature, 489, 423–426, https://doi.org/10.1038/nature11377, 2012.
Taylor, C. M., Birch, C. E., Parker, D. J., Dixon, N., Guichard, F., Nikulin, G., and Lister, G. M. S.: Modeling soil moisture-precipitation feedback in the Sahel: Importance of spatial scale versus convective parameterization, Geophys. Res. Lett., 40, 6213–6218, https://doi.org/10.1002/2013GL058511, 2013.
Thompson, G., Rasmussen, R. M., and Manning, K.: Explicit Forecasts of Winter Precipitation Using an Improved Bulk Microphysics Scheme. Part I: Description and Sensitivity Analysis, Mon. Weather Rev., 132, 519–542, https://doi.org/10.1175/1520-0493(2004)132<0519:EFOWPU>2.0.CO;2, 2004.
van Heerwaarden, C. C. and Teuling, A. J.: Disentangling the response of forest and grassland energy exchange to heatwaves under idealized land–atmosphere coupling, Biogeosciences, 11, 6159–6171, https://doi.org/10.5194/bg-11-6159-2014, 2014.
Ukkola, A. M., Pitman, A. J., Donat, M. G., De Kauwe, M. G., and Angélil, O.: Evaluating the Contribution of Land-Atmosphere Coupling to Heat Extremes in CMIP5 Models, Geophys. Res. Lett., 45, 9003–9012, https://doi.org/10.1029/2018GL079102, 2018.
Wakefield, R. A., Basara, J. B., Furtado, J. C., Illston, B. G., Ferguson, Craig. R., and Klein, P. M.: A Modified Framework for Quantifying Land–Atmosphere Covariability during Hydrometeorological and Soil Wetness Extremes in Oklahoma, J. Appl. Meteorol. Clim., 58, 1465–1483, https://doi.org/10.1175/JAMC-D-18-0230.1, 2019.
Wakefield, R. A., Turner, D. D., and Basara, J. B.: Evaluation of a land–atmosphere coupling metric computed from a ground-based infrared interferometer, J. Hydrometeorol., 22, 2073–2087, https://doi.org/10.1175/JHM-D-20-0303.1, 2021.
Willett, K. M., Jones, P. D., Thorne, P. W., and Gillett, N. P.: A comparison of large scale changes in surface humidity over land in observations and CMIP3 general circulation models, Environ. Res. Lett., 5, 025210, https://doi.org/10.1088/1748-9326/5/2/025210, 2010.
Wulfmeyer, V., Hardesty, R. M., Turner, D. D., Behrendt, A., Cadeddu, M. P., Di Girolamo, P., Schlüssel, P., Van Baelen, J., and Zus, F.: A review of the remote sensing of lower tropospheric thermodynamic profiles and its indispensable role for the understanding and the simulation of water and energy cycles: Remote Sensing Of Themodynamic Profiles, Rev. Geophys., 53, 819–895, https://doi.org/10.1002/2014RG000476, 2015.
Wulfmeyer, V., Späth, F., Behrendt, A., Jach, L., Warrach-Sagi, K., Ek, M., Turner, D. D., Senff, C., Ferguson, C. R., Santanello, J., Lee, T. R., Buban, M., and Verhoef, A.: The GEWEX Land-Atmosphere Feedback Observatory (GLAFO), GEWEX Quarterly, 30, 6–11, 2020.