the Creative Commons Attribution 4.0 License.
the Creative Commons Attribution 4.0 License.
 | 16 Aug 2021
Climate change projections of terrestrial primary productivity over the Hindu Kush Himalayan forests
Halima Usman
Thomas A. M. Pugh
Anders Ahlström
Increasing atmospheric carbon dioxide concentration [CO2] caused by anthropogenic activities has triggered a requirement to predict the future impact of [CO2] on forests. The Hindu Kush Himalayan (HKH) region comprises a vast territory including forests, grasslands, farmlands and wetland ecosystems. In this study, the impacts of climate change and land-use change on forest carbon fluxes and vegetation productivity are assessed for HKH using the Lund–Potsdam–Jena General Ecosystem Simulator (LPJ-GUESS). LPJ-GUESS simulations were driven by an ensemble of three climate models participating in the CMIP5 (Coupled Model Intercomparison Project phase 5) database. The modelled estimates of vegetation carbon (VegC) and terrestrial primary productivity were compared with observation-based estimates. Furthermore, we also explored the net biome productivity (NBP) and its components over HKH for the period 1851–2100 under the future climate scenarios RCP2.6 and RCP8.5. A reduced modelled NBP (reduced C sink) is observed from 1986–2015 primarily due to land-use change. However, an increase in NBP is predicted under RCP2.6 and RCP8.5. The findings of the study have important implications for the management of the HKH region, in addition to informing strategic decision making and land-use planning, and clarifying policy concerns.
- Article
(3649 KB) - Full-text XML
-
Supplement
(1446 KB) - BibTeX
- EndNote


Anthropogenic activities such as combustion of fossil fuels and land-use changes have led to large rises in atmospheric greenhouse gas (GHG) emissions such as carbon dioxide (CO2) and methane over the last century, with atmospheric CO2 mixing ratios increasing from 277 to 409 ± 0.1 ppm in 2019 since the pre-industrial period, and rising at the mean rate of 2.3 ppm yr−1 from 2010 to 2019 (Friedlingstein et al., 2020). This uptake is likely primarily driven by the fertilizing effects of elevated atmospheric CO2 concentrations on plant growth (Sitch et al., 2015) and by the regrowth of forests following past disturbances (Kondo et al., 2018; Pugh et al., 2019). However, the ability of this land sink to continue in the future remains highly uncertain (Phillips and Lewis, 2014).
Several studies have identified that warming can cause a stimulation in plant growth by increasing net primary productivity (NPP) and hence leading to enhanced carbon uptake (Delpierre et al., 2009; Sullivan et al., 2008; Wu et al., 2011). However, researchers have also addressed that the rising air temperatures may also stimulate autotrophic respiration in plants (Burton et al., 2008). Due to global temperature rise, droughts are predicted to increase in frequency, duration and severity in the future (Trenberth et al., 2013). The increase in temperature causes an exponential rise in vapour pressure deficit, resulting in stomatal closure, thus limiting the rate of photosynthesis and higher mortality (Williams et al., 2013). Hence, the determination of the effect of global rise in temperature on forests is becoming increasingly important as vegetation response to climate change will result in changes in net carbon uptake, water use efficiency, plant establishment, carbon biomass allocation and interaction with disturbances (Urban et al., 2017). Several studies suggest that there is a large gap in the current understanding of the quantification of biomass carbon stock leading to large uncertainty for the future projections in the ecosystem carbon balance (Ahlström et al., 2012; Jones et al., 2013; Pugh et al., 2018; Wu et al., 2017).
The Hindu Kush Himalayan (HKH) region is a diverse and ecological buffer zone, often referred to as the “Third Pole”, encompassing an area of 4.2 million km2. The region provides ecosystem services such as such as watershed protection, livestock shelter and sustaining communities of an estimated 240 million people (Krishnan et al., 2019). The HKH region has been experiencing a temperature rise of 0.2 since 1960 (Chen et al., 2013). The forests of HKH are undergoing changes of varied intensity as a result of climatic and human disturbances, alongside the various forest management policies practised in the different countries (Behera et al., 2018; Pulakesh et al., 2017). The rate of deforestation along the HKH has been reported to be 0.5 % yr−1 in Bhutan and 1.7 % yr−1 in Myanmar from 2000 to 2014 (Brandt et al., 2017). The warming trend observed over recent decades of the 20th century is attributed to the increase in anthropogenic GHG concentrations. The HKH region is believed to be becoming increasingly sensitive to climate change (Krishnan et al., 2019). In this region, the carbon dynamics are mostly influenced by the combined effects of climatic change and land-use land-cover change (LULCC) (de Almeida et al., 2018; Cao et al., 2018). Although studies on projections of temperature change exist, the combined effect of temperature, CO2 and LU change has not been investigated.
In this paper, the historical and future carbon balances of terrestrial ecosystems in the HKH region are investigated using results from the Lund–Potsdam–Jena General Ecosystem Simulator (LPJ-GUESS), a dynamic global vegetation model (DGVM) with a detailed description of forest stand structure and land use (Ahlström et al., 2012; Smith et al., 2001). The goal of the present study is to (1) evaluate the ability of the LPJ-GUESS model, as forced by climate from a selection of Earth system models (ESMs), to reproduce observation-based estimates of vegetation carbon and satellite-derived estimates of gross primary productivity (GPP) and NPP, and (2) analyse the spatial and temporal changes in net biome productivity (NBP) and its components (NPP, fire and soil respiration) and vegetation carbon (VegC) over the period 1851–2100.
2.1 Study area
The HKH region is situated between 16∘ N–40∘ S and 61–105∘ E encompassing Afghanistan, Bangladesh, Bhutan, China, India, Myanmar, Nepal and Pakistan (Fig. 1). Evergreen needleleaf forest (ENF) covers about 2.69 % of the HKH and 10.5 %, 0.06 %, 1.09 % and 9.37 % is covered by evergreen broadleaf forest (EBF), deciduous needleleaf forest (DNF), deciduous broadleaf forest (DBF) and mixed forest (MF), respectively. A major percentage of land cover is covered by open shrublands (OShrub) and grasslands (Grass) occupying 31.57 % and 32.08 % of the area of HKH. Furthermore, savannas (Sav) and woody savannas (Wsav) cover about 1.19 % and 4.46 %, respectively. The remaining land is covered by croplands (Crop) and closed shrubland (CShrub), with percentages of 5.61 % and 1.09 %, respectively. The forests of the HKH cover about 24 % of the region, supporting the 12 % of the population of the world by provision of diverse ecosystem goods and ecosystem services including energy, timber and freshwater (Behera et al., 2018).
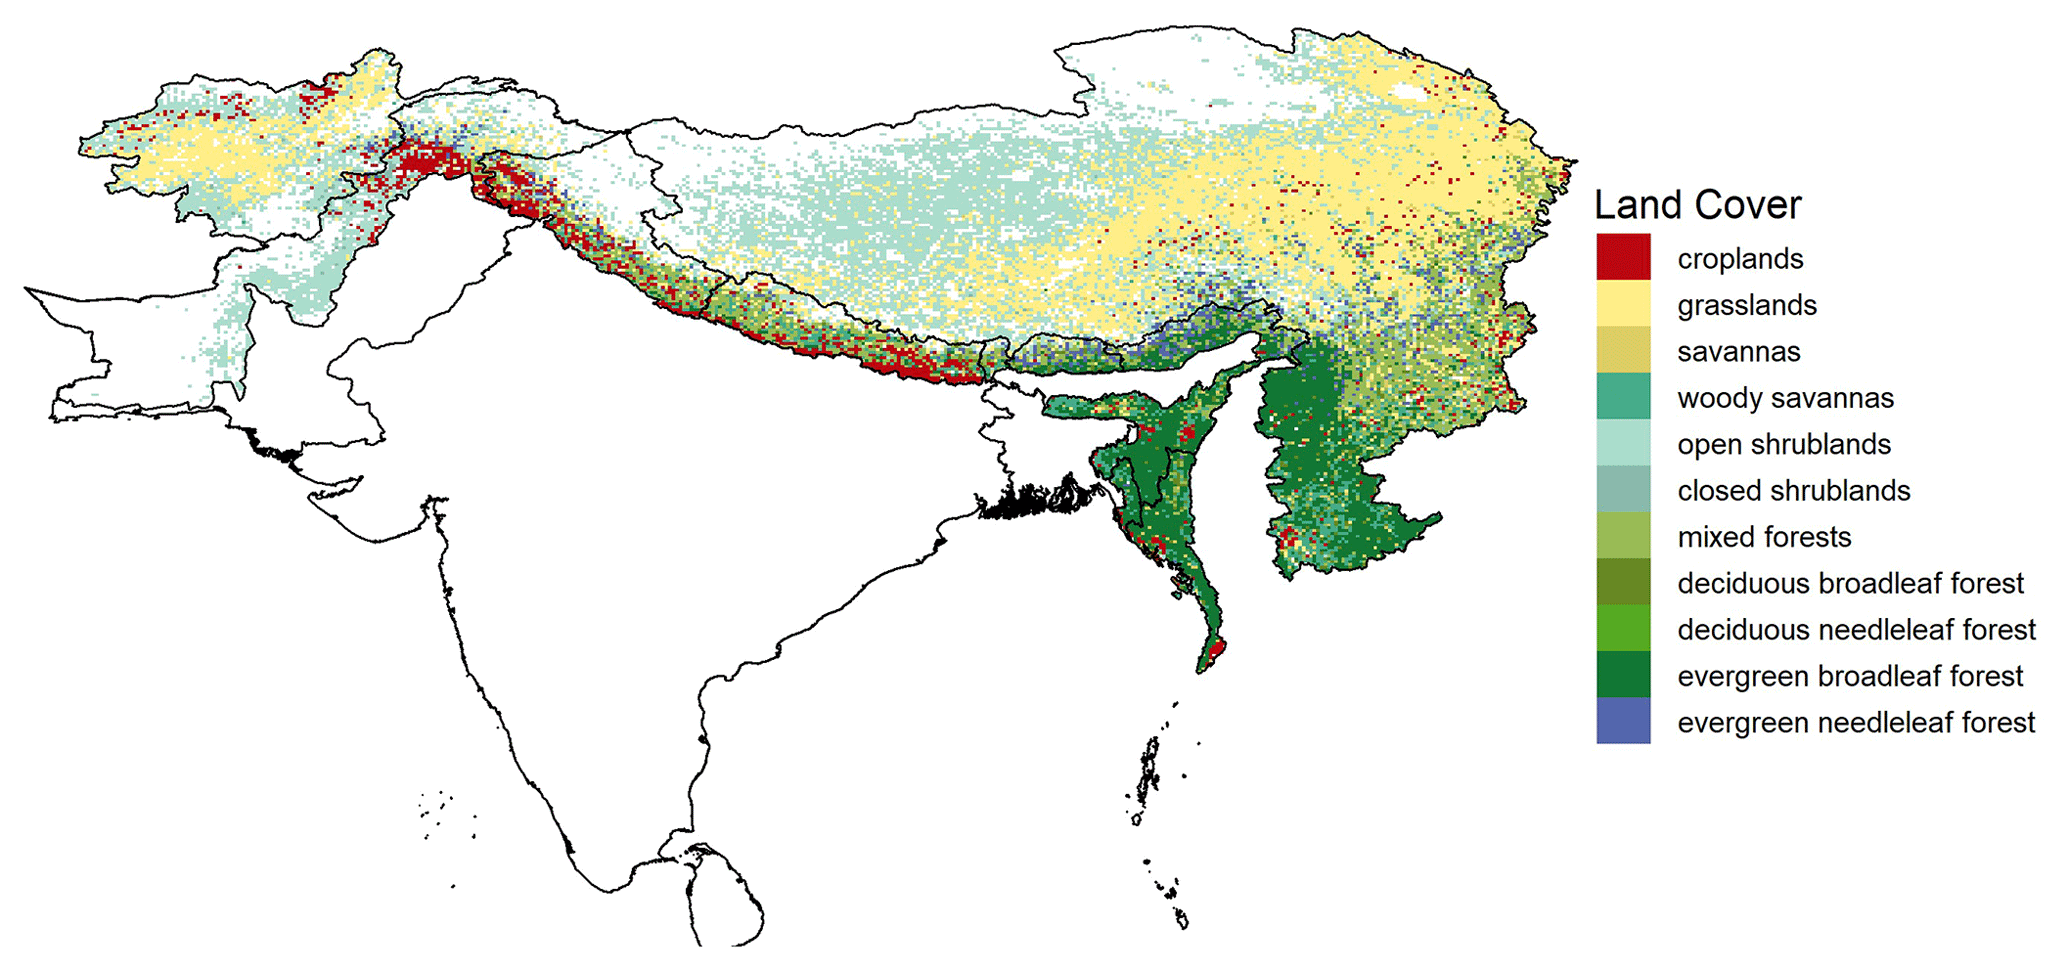
Figure 1Land cover of HKH from MODIS (MOD12Q1).
2.2 LPJ-GUESS ecosystem model
LPJ-GUESS is a coupled biogeography–biogeochemistry model which integrates process-based representation of terrestrial vegetation dynamics and biogeochemical cycling (Smith et al., 2001). In order to simulate the size of carbon pools in various parts of the plant such as leaves, sapwood, litter and soil, the model explicitly accounts for processes such as photosynthesis, allocation and resource competition between plants. The model is useful for predicting the changes in the ecosystem dynamics and is able to simulate and predict the future response of vegetation to elevated CO2 levels at leaf and stand scales (Sitch et al., 2015). In LPJ-GUESS, the species diversity of terrestrial vegetation is represented as groups of species with similar traits known as plant functional types (PFTs). The simulations here use 10 PFTs that are differentiated by attributes such as physiology, morphology, phenology and response to disturbance along with bioclimatic constraints. Trees are modelled as age cohorts across multiple replicate patches but are identical within each cohort (age class) (Smith et al., 2001).
LPJ-GUESS works on daily time steps, with some processes, such as vegetation dynamics, computed annually. The input data to the model include atmospheric [CO2] mixing ratio, precipitation, shortwave radiation, air temperature and soil type. Simulations begin from bare ground and go through a 500-year “spin-up phase” during which soil and carbon litter pools accumulate and reach a state of equilibrium. An analytical solution is used to accelerate spin-up of the soil carbon pools. In the spin-up phase, the model is forced by constant [CO2] and a repeated detrended 30-year climate segment from the beginning of the climate dataset is used. As the spin-up phase finishes, the “transient phase” begins, in which land use, climate and [CO2] evolve over time as specified in the forcing datasets. Here, we analyse outputs of vegetation carbon, gross primary productivity, net primary productivity and net biome productivity and its components.
2.3 Simulation protocol
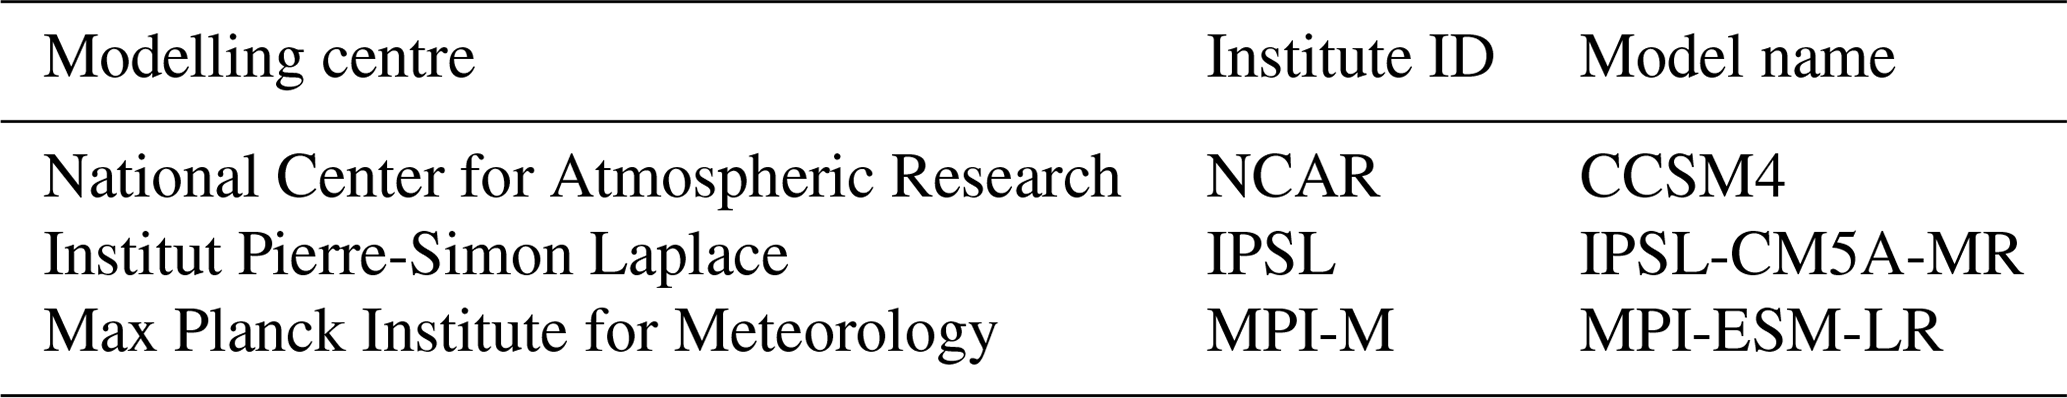
In this study, simulations are reanalysed from Ahlström et al. (2012) with a focus on the HKH region. Only an overview of the salient features of the setup is given for this study. For more setup details, please see Ahlström et al. (2012). Spatial patterns of carbon pool, fluxes and terrestrial primary productivity were investigated in HKH forests by using the output simulations of the LPJ-GUESS resolution of 0.5∘ × 0.5∘ with climate forcing from climate models participating in CMIP5 (Table 1) under RCP2.6 (Van Vuuren et al., 2007) and RCP8.5 (Riahi et al., 2011). The RCP2.6 emission pathway is representative of reduced GHG concentration levels. It is a defined as a “peak-and-decline” scenario, in which the radiative forcing level first reaches around 3.1 W m−2 by mid-century and returns to a value of 2.6 W m−2 by 2100. In contrast, RCP8.5 is characterized by increasing GHG emissions over time, culminating in a radiative forcing of 8.5 W m−2 in 2100. The climatic data were bias corrected by using the Climate Research Unit time series (CRU TS) 3.0 (Mitchell and Jones, 2005) 1961–1990 climatologies on an annual and monthly basis (seasonal bias correction). The monthly fields of precipitation, downward shortwave radiation and air temperature were bi-linearly interpolated to the CRU grid at a resolution of 0.5∘ × 0.5∘. The correction by the climatology fields (1961–1990) was adjusted for bias in annual averages and seasonal distribution. Figure S1a and b in the Supplement show an example of how bias correction adjusts the time series of temperature and precipitation.
Table 1CMIP5 models and modelling groups used to provide climate forcing data for LPJ-GUESS in this study.
Croplands and pastures were treated as natural grasslands in the vegetation model in simulations that simulated land use (LU) (Ahlström et al., 2012). To assess the impact of human land use, simulations containing potential natural vegetation (PNV) were also assessed in comparison to those containing LU for both RCP2.6 and RCP8.5.
2.4 Model evaluation
In this study, a global dataset of forest above-ground biomass (AGB) developed within European Commission-funded Operational Global Carbon Observing System (GEOCARBON) project was considered for the purpose of comparison with LPJ-GUESS VegC. The base year of this dataset is 2000. As LPJ-GUESS VegC includes both above- and below-ground vegetation carbon, the AGB of GEOCARBON was converted into VegC by applying a correction to estimate below-ground biomass in the GEOCARBON dataset based on Saatchi et al. (2011). The resulting above- and below-ground biomass was converted to carbon content by multiplying by 0.5.
Furthermore, the Moderate-resolution Imaging Spectroradiometer (MODIS) GPP and NPP product (MOD17A3H) was used for comparison with the modelled GPP and NPP. MOD17 is based on the light use efficiency approach and consists of two products: MOD17A2 and MOD17A3 (Zhao and Running, 2010). In this study, we incorporated MOD17A3, which contains annual sums of GPP and NPP, with a 0.0083∘ × 0.0083∘ spatial resolution for the period 2000–2010. In order to compare LPJ-GUESS GPP and NPP estimates, MOD17A3 GPP and NPP datasets were downloaded from the Application for Extracting and Exploring Analysis Ready Samples (AppEEARS) website (LP DAAC – AppEEARS; USGS, 2020). Land cover (MOD12Q1) used in this study was downloaded from http://files.ntsg.umt.edu/data/NTSG_Products/MOD17/GeoTIFF/MOD12Q1/ (last access: 21 January 2020; Numerical Terradynamic Simulation Group, 2020) and was used for land-cover stratification (Friedl et al., 2002). Land cover related to barren, water and urban was masked from LPJ-GUESS data in order to make it comparable with MOD17A3 data (i.e. identical spatial extent, land-cover classes and number of grid cells). Both the GEOCARBON and MODIS datasets were aggregated to 0.5∘ × 0.5∘ resolution for comparison with LPJ-GUESS.
3.1 Comparison between observed and LPJ-GUESS estimations of VegC
Simulations forced by three CMIP5 ESMs of mean VegC from 1986–2015 were compared with the observed GEOCARBON dataset (Fig. 2). The mean VegC of observed dataset was estimated to be 4.68 kg C m−2, while the modelled VegC for HKH averaged 1.93, 2.04 and 2.14 kg C m−2 for simulations forced by climate outputs from IPSL-CM5A-MR, MPI-ESM-LR and CCSM4, respectively. Most of the difference is found to be in the southern regions of HKH. A moderate agreement was found between the GEOCARBON and LPJ-GUESS VegC with a mean r2 value of 0.44.
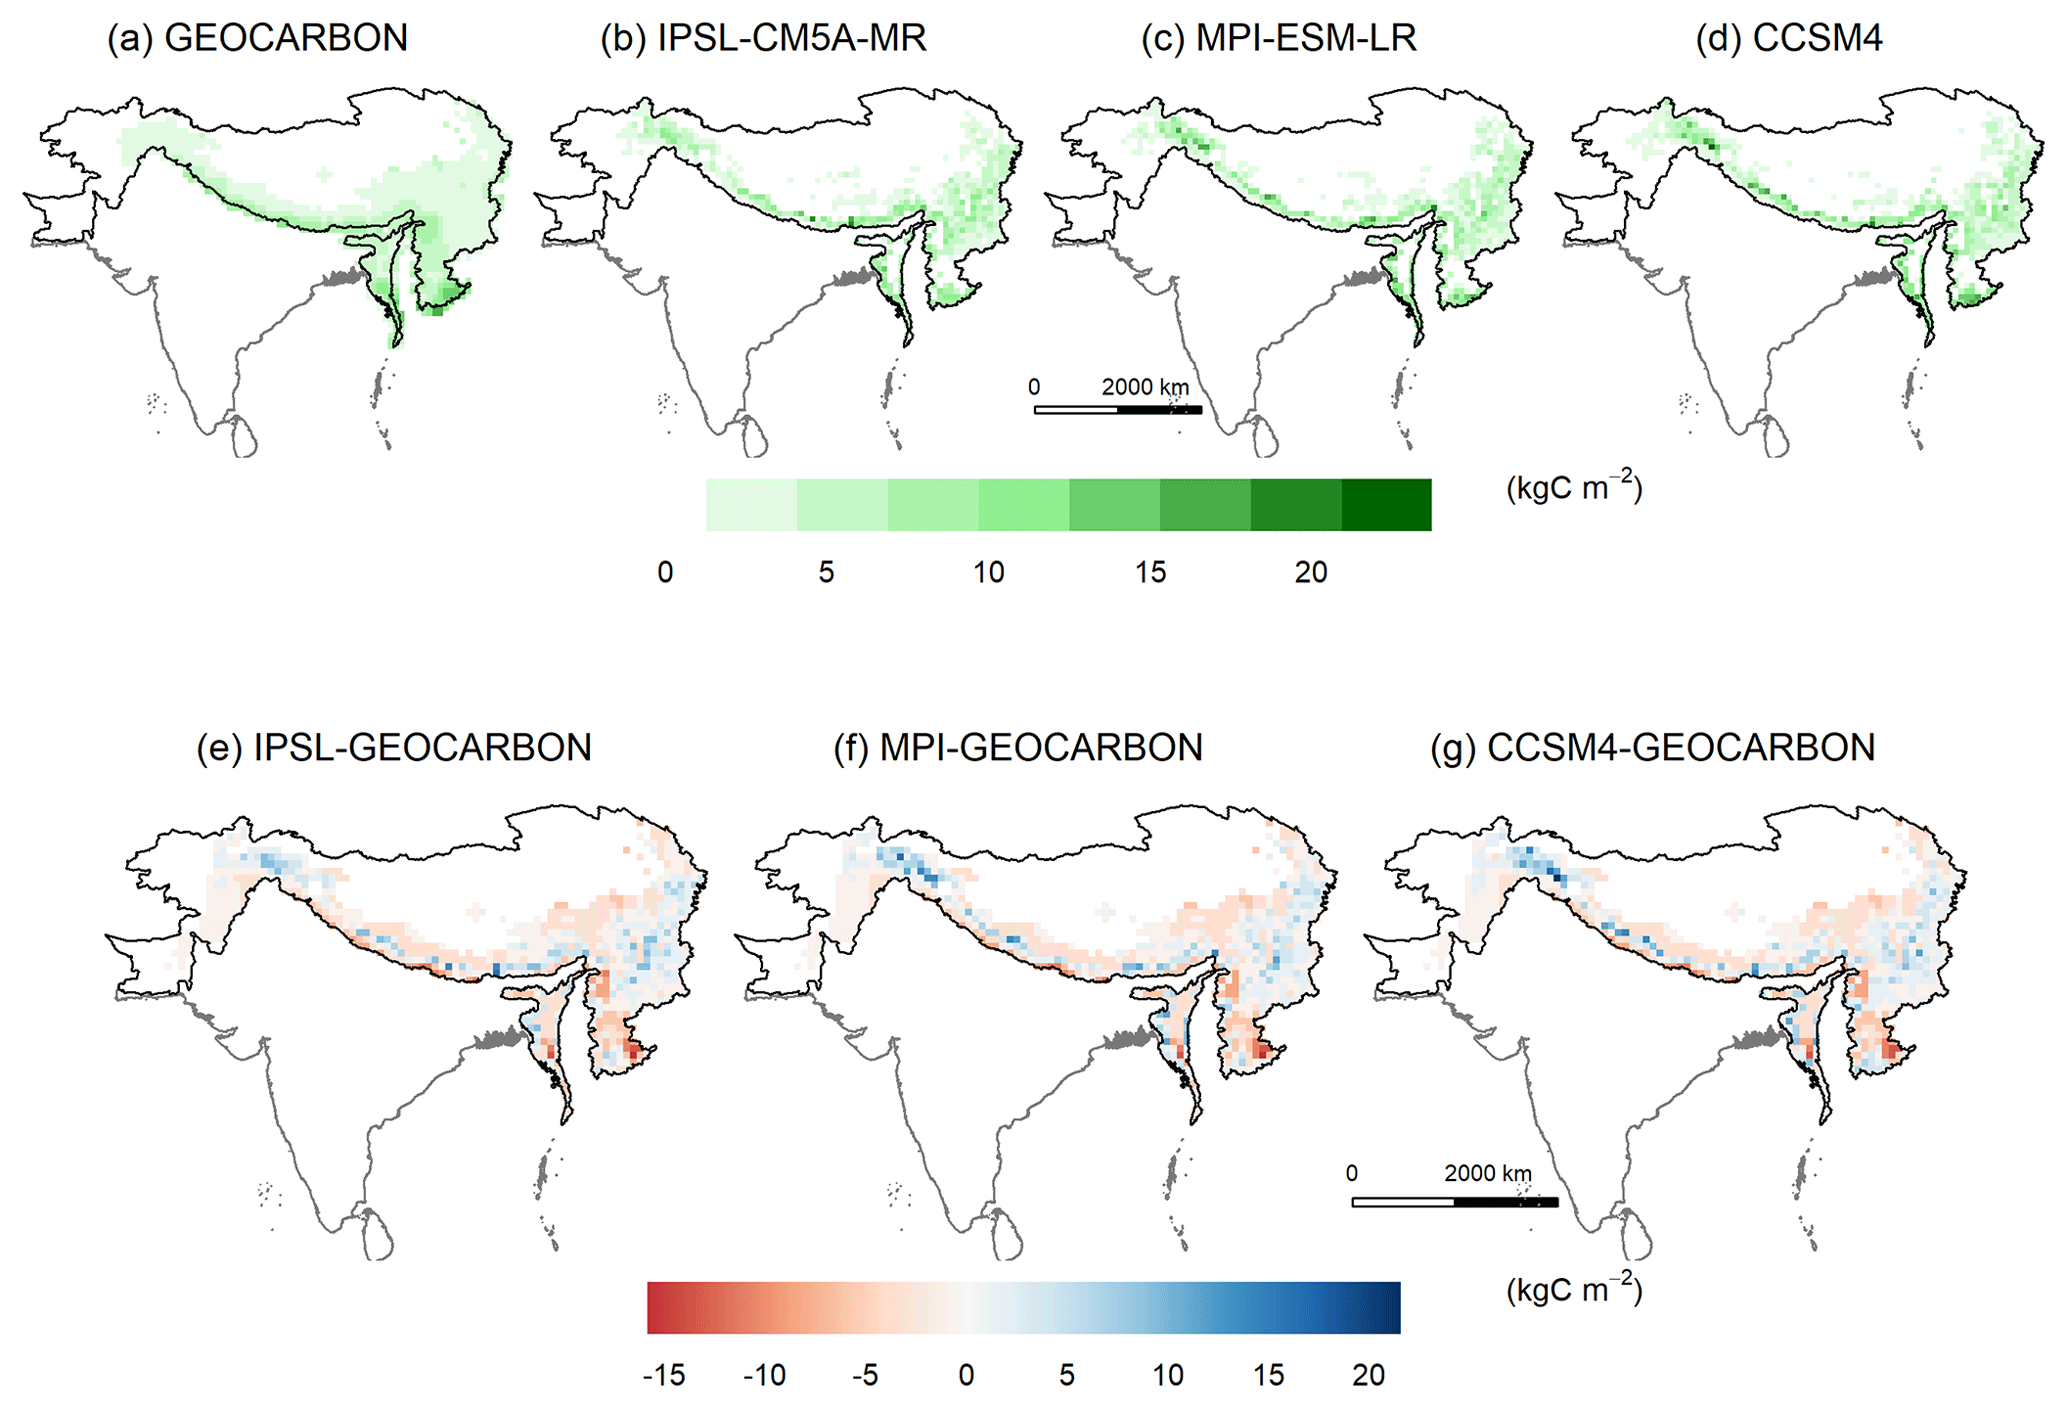
Figure 2The distribution of VegC as simulated by (a) GEOCARBON, (b) IPSL-CM5A-MR, (c) MPI-ESM-LR and (d) CCSM4, and (e–g) their respective differences with the GEOCARBON dataset for the HKH region.
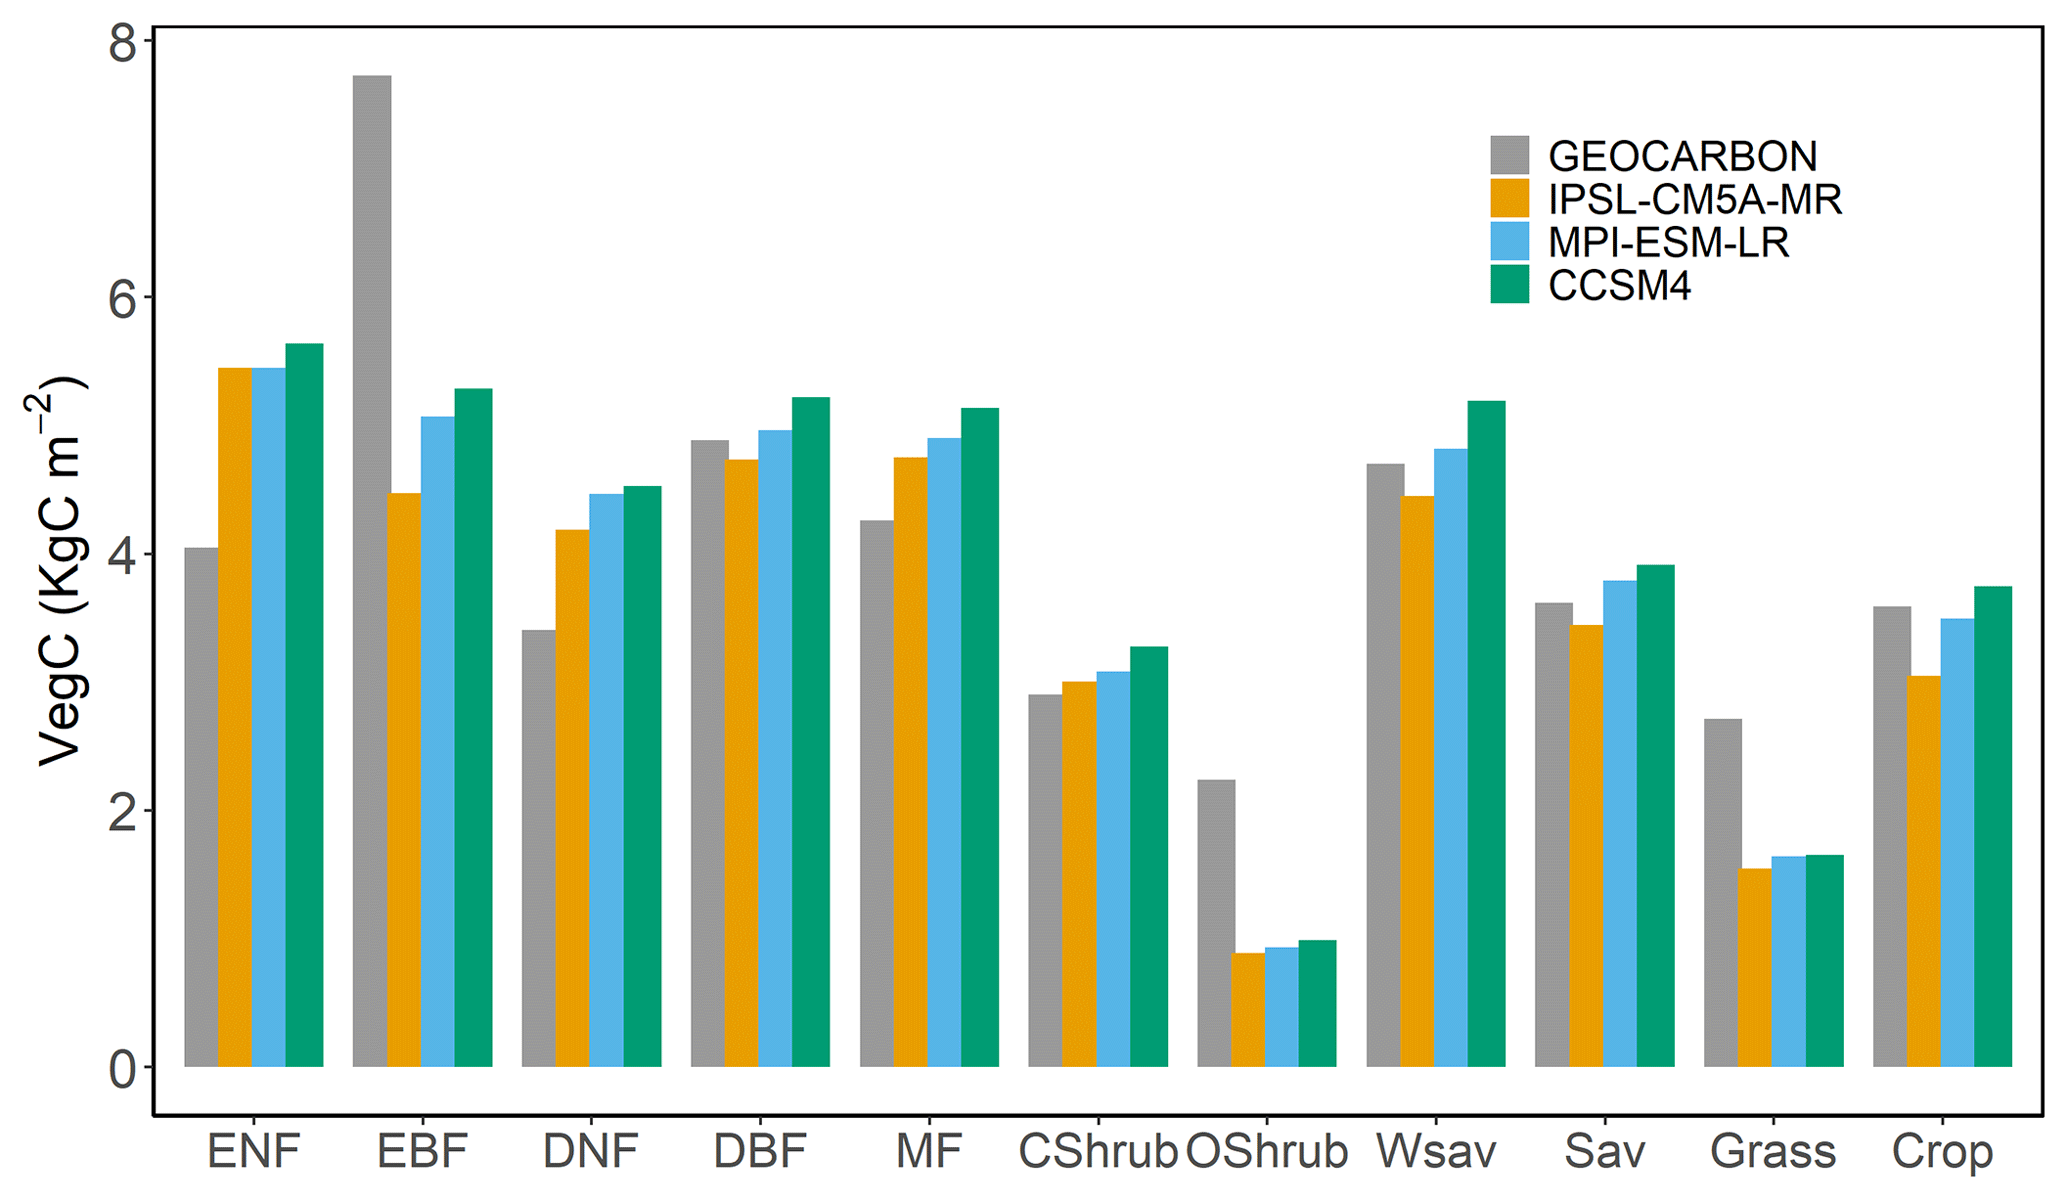
Figure 3Summary statistics of LPJ-GUESS and GEOCARBON VegC for HKH in kg C m−2 of CMIP5 models according to land-cover classes.
Furthermore, the simulations of the CMIP5 models and the observed estimations in the HKH region were compared according to land-cover classes from MOD12Q1 (Fig. 3). There is an underestimation of VegC in evergreen broadleaf forests. The mean GEOCARBON VegC was 7.73 kg C m−2, on average, 2.68 kg C m−2 higher than LPJ-GUESS VegC for evergreen broadleaf forest. VegC for remaining forest types showed a lesser difference than 1.5 kg C m−2. The simulation of VegC was not very sensitive to differences in the bias-corrected modelled climates from the CMIP5 models for the period from 1986–2015.
3.2 Evaluation of patterns of GPP and NPP from 2000–2010
The mean MODIS GPP for 2000–2010 was estimated to be 0.69 ± 0.26 . The GPP for IPSL-CM5A-MR, MPI-ESM-LR and CCSM4 was 0.84 ± 0.17, 0.83 ± 0.16 and 0.88 ± 0.16 , respectively (Fig. 4). The mean MODIS NPP was estimated to be 0.38 ± 0.12 and 0.43 ± 0.07, 0.42 ± 0.07, and 0.44 ± 0.07 for IPSL-CM5A-MR, MPI-ESM-LR and CCSM4, respectively (Fig. 4). Both of the spatial datasets are able to capture important features such as the low productive Himalayan barren areas in the north and high productive regions like the forests and croplands in lower parts of HKH region (Figs. S2 and S3 in the Supplement). There was a moderate spatial agreement between the MODIS and modelled GPP with mean r2 values of 0.54. However, there was a weaker correlation between the satellite-derived and modelled NPP with mean r2 values of 0.4. Averaged GPP and NPP from MODIS and LPJ-GUESS per land-cover classes from MOD12Q1 are shown in Fig. 5a and b, respectively. A difference is found in the EBF land-cover class when both datasets are compared. GPP for MODIS was estimated to be 2.48 , and for average ESMs GPP was estimated to be 1.34 . Furthermore, MODIS NPP was estimated to be 1.26 and the ESM average NPP was 0.56 .
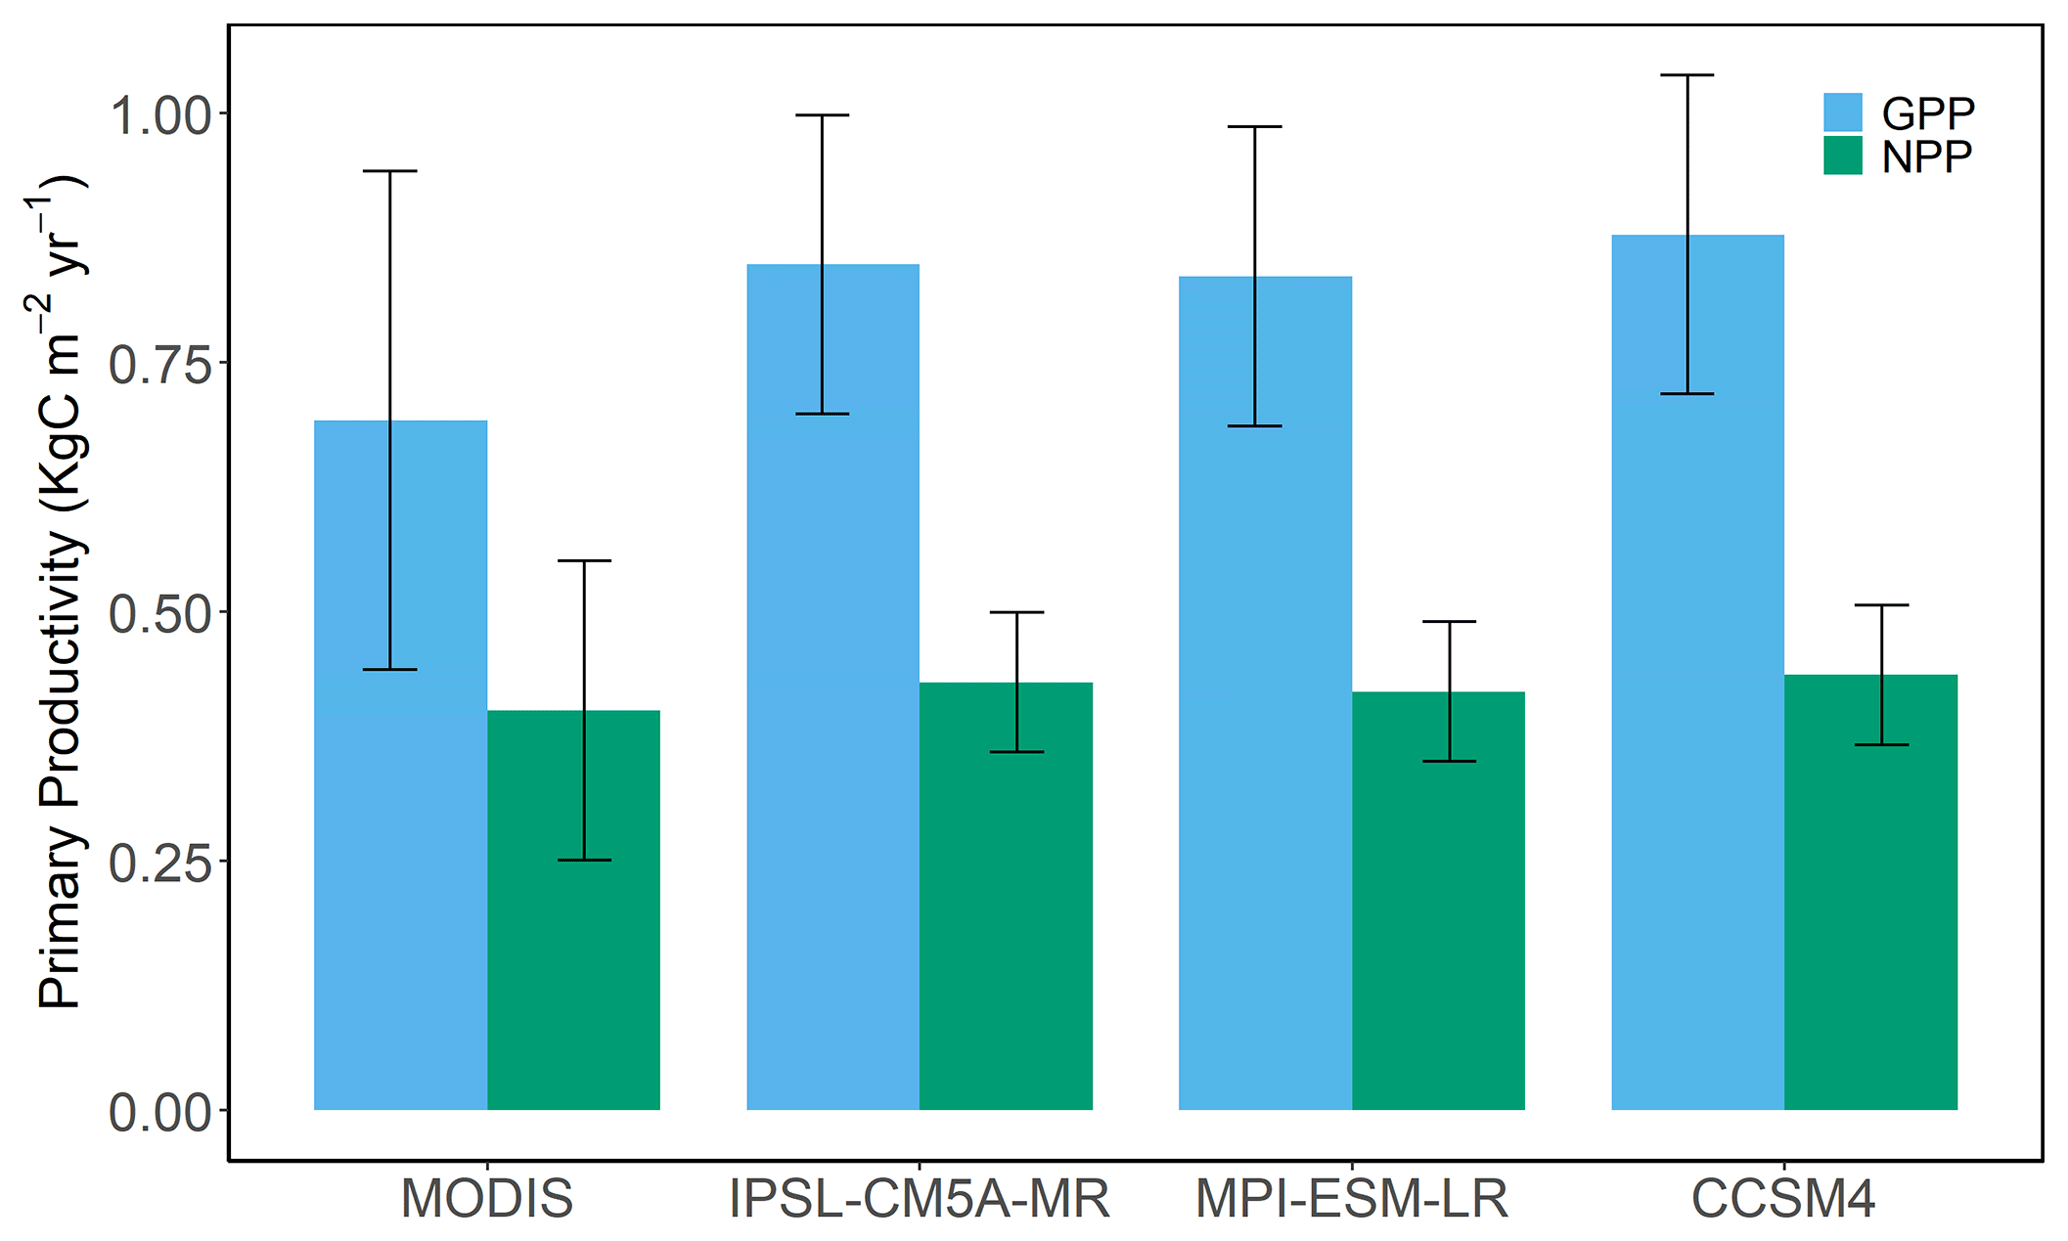
Figure 4GPP and NPP for HKH showing mean GPP (blue) and mean NPP (green) from MOD17 and from the LPJ-GUESS model forced by climate outputs from the three ESMs (average for the period 2000–2010). Vertical black bars illustrate ± standard error, where n=11.

Figure 5(a) Mean MOD17 and LPJ-GUESS GPP per land-cover class. (b) Mean MOD17 and LPJ-GUESS NPP per land-cover class. Vertical black bars illustrate ± standard error, where n=11.
3.3 Evaluation of PFT distributions in LPJ-GUESS
Figure 6 shows the distribution of the PFT simulated by the LPJ model in the HKH region. The LPJ-GUESS PFT distribution was compared to the land-cover classes of the MOD12Q1 dataset. A major part of C3 grasses (C3G) was found in the majority of HKH area including the Tibetan Plateau and western parts of the HKH region. MOD12Q1 classifies this area as open shrublands and grasslands, which is consistent given that shrubs are not explicitly included with the 10 global PFTs used. The modelled data and observed data correspond well to each other in terms of the major features of the broadleaf forests. In LPJ-GUESS, regions of Bangladesh and Myanmar, most of the area is covered by tropical broadleaf raingreen forest (TrBR), whereas MOD12Q1 land-cover classification shows those areas to be classified as evergreen broadleaf forests. There was minimal difference in 2000–2010 PFT distribution between the three ESM climates.

Figure 6Average distribution of PNV simulated from 2000–2010 by LPJ-GUESS forced by CCSM4 climate. Full PFT names (as shown in legend) are as follows: BNE indicates boreal needle-leaved evergreen tree; C3G indicates C3 grass; C4G indicates C4 grass; IBS indicates shade-intolerant broadleaved; TeBE indicates temperate broadleaved evergreen tree; TeBS indicates temperate broad-leaved summergreen tree; TrBE indicates tropical broad-leaved evergreen tree; TrBR indicates tropical broadleaved raingreen tree.
3.4 Projected spatial changes in the pattern of NBP and components
Two types of simulations were used in order to make a comparison to assess the spatial patterns of NBP. The simulations derived from the PNV were compared with simulations from LU simulations generated by the LPJ-GUESS model. NBP changes with PNV and LU were calculated for three time periods: the past period (1851–1880), present period (1986–2015) and the future scenario from 2071 to 2100 represented by RCP2.6 and RCP8.5. In PNV simulations for 1851–1880, the mean NBP for the three ESM climates was estimated to be 0.003 . It increased to 0.037 in 1986–2015. For RCP2.6 and RCP8.5, in the LU simulations, the NBP increased to 0.015 and 0.04 , showing a dampening effect of land-use change on NBP increases. The simulations show a shift from carbon source to sink in both future scenarios in both simulations, with higher NBP in RCP8.5 compared to RCP2.6. Most of the carbon sink in the future scenarios is seen in the central and lower regions of HKH (Fig. S4 in the Supplement). The Tibetan Plateau acts as a carbon sink as warming temperature and carbon fertilization stimulate vegetation growth in the future RCP8.5 scenario.
NBP was broken down into its component fluxes of NPP, fire and soil respiration rate (Figs. S5–S7 in the Supplement). Simulations of average NPP in the PNV and LU simulations in the past period (1851–1880) reached on average 0.306 and 0.303 , respectively. The present-day mean NPP across HKH was estimated to be 0.388 and 0.377 for PNV and LU simulations, respectively. The simulated NPP increased to 0.452 in PNV simulations and 0.437 in the LU simulations in RCP2.6. Furthermore, in RCP8.5, the NPP increased to 0.657 in PNV simulations and 0.622 in the LU simulations. Human land use thus moderately reduced future increases in NPP. An average value of fire flux was estimated to be 0.065 and 0.041 by LPJ-GUESS for the past period for the PNV and LU simulations, respectively. In the present period, the model simulates a slightly higher average fire flux of 0.065 in PNV simulations compared to 0.042 in LU simulations. For the future scenario, it is predicted that in RCP2.6 the fire flux will increase with an estimated value of 0.08 and 0.046 for PNV and LU simulations, respectively. The lower fire fluxes in the LU scenarios reflect the large area of land dedicated to agriculture, which increases over time. Agricultural land is assumed not to contribute to fire fluxes in these simulations. In future scenario (RCP8.5), it is predicted that the fire flux will increase to a mean of 0.081 in HKH. In PNV-simulated soil respiration, an overall increasing trend is seen in the HKH region. A lower rate of soil respiration is projected in the future scenario, with a mean value of 0.053 and 0.054 yr−1 in RCP2.6 for PNV and LU simulations, respectively. For RCP8.5, the mean soil respiration rate was found to be 0.075 yr−1 for both PNV and LU simulations.
Table S1 in the Supplement shows the average projected changes in NBP, NPP, fire and soil respiration rate forced by LPJ-GUESS by climate outputs from the three ESM climates for past period (1851–1880), present period (1986–2015) and future scenario (2071–2100) under RCP2.6 and RCP8.5. The choice of ESM climate had a minor effect on the results.
3.5 Projected temporal changes in the pattern of NBP and components according to elevation
Most of the high-elevation region, including the Tibetan Plateau region, is devoid of forest area, as it experiences a mean annual temperature of less than −2 ∘C. Hence, the area below 4500 m is classified as low elevation and elevation above 4500 m is classified as high elevation (Pulakesh et al., 2017). Figure 7a–d summarize the temporal patterns of NBP, NPP, fire and soil respiration according to low elevation and high elevation. In the past period from 1851–1880, the NBP flux is positive in lower-elevation regions (0–4500 m) of HKH as compared to higher-elevation areas. The HKH region was a carbon source in the period from 1851–1880; sink strength at an elevation of 0 to 4500 m increased from 1986 onwards, resulting in a carbon sink, and it became a relatively strong sink in the future scenario in RCP8.5. In RCP8.5, the PNV simulations estimated a NBP of 0.02 , and in the LU simulation it was estimated to be 0.01 . However, at higher elevation in PNV simulations, the NBP was estimated to be 0.12 and 0.08 in LU simulations.
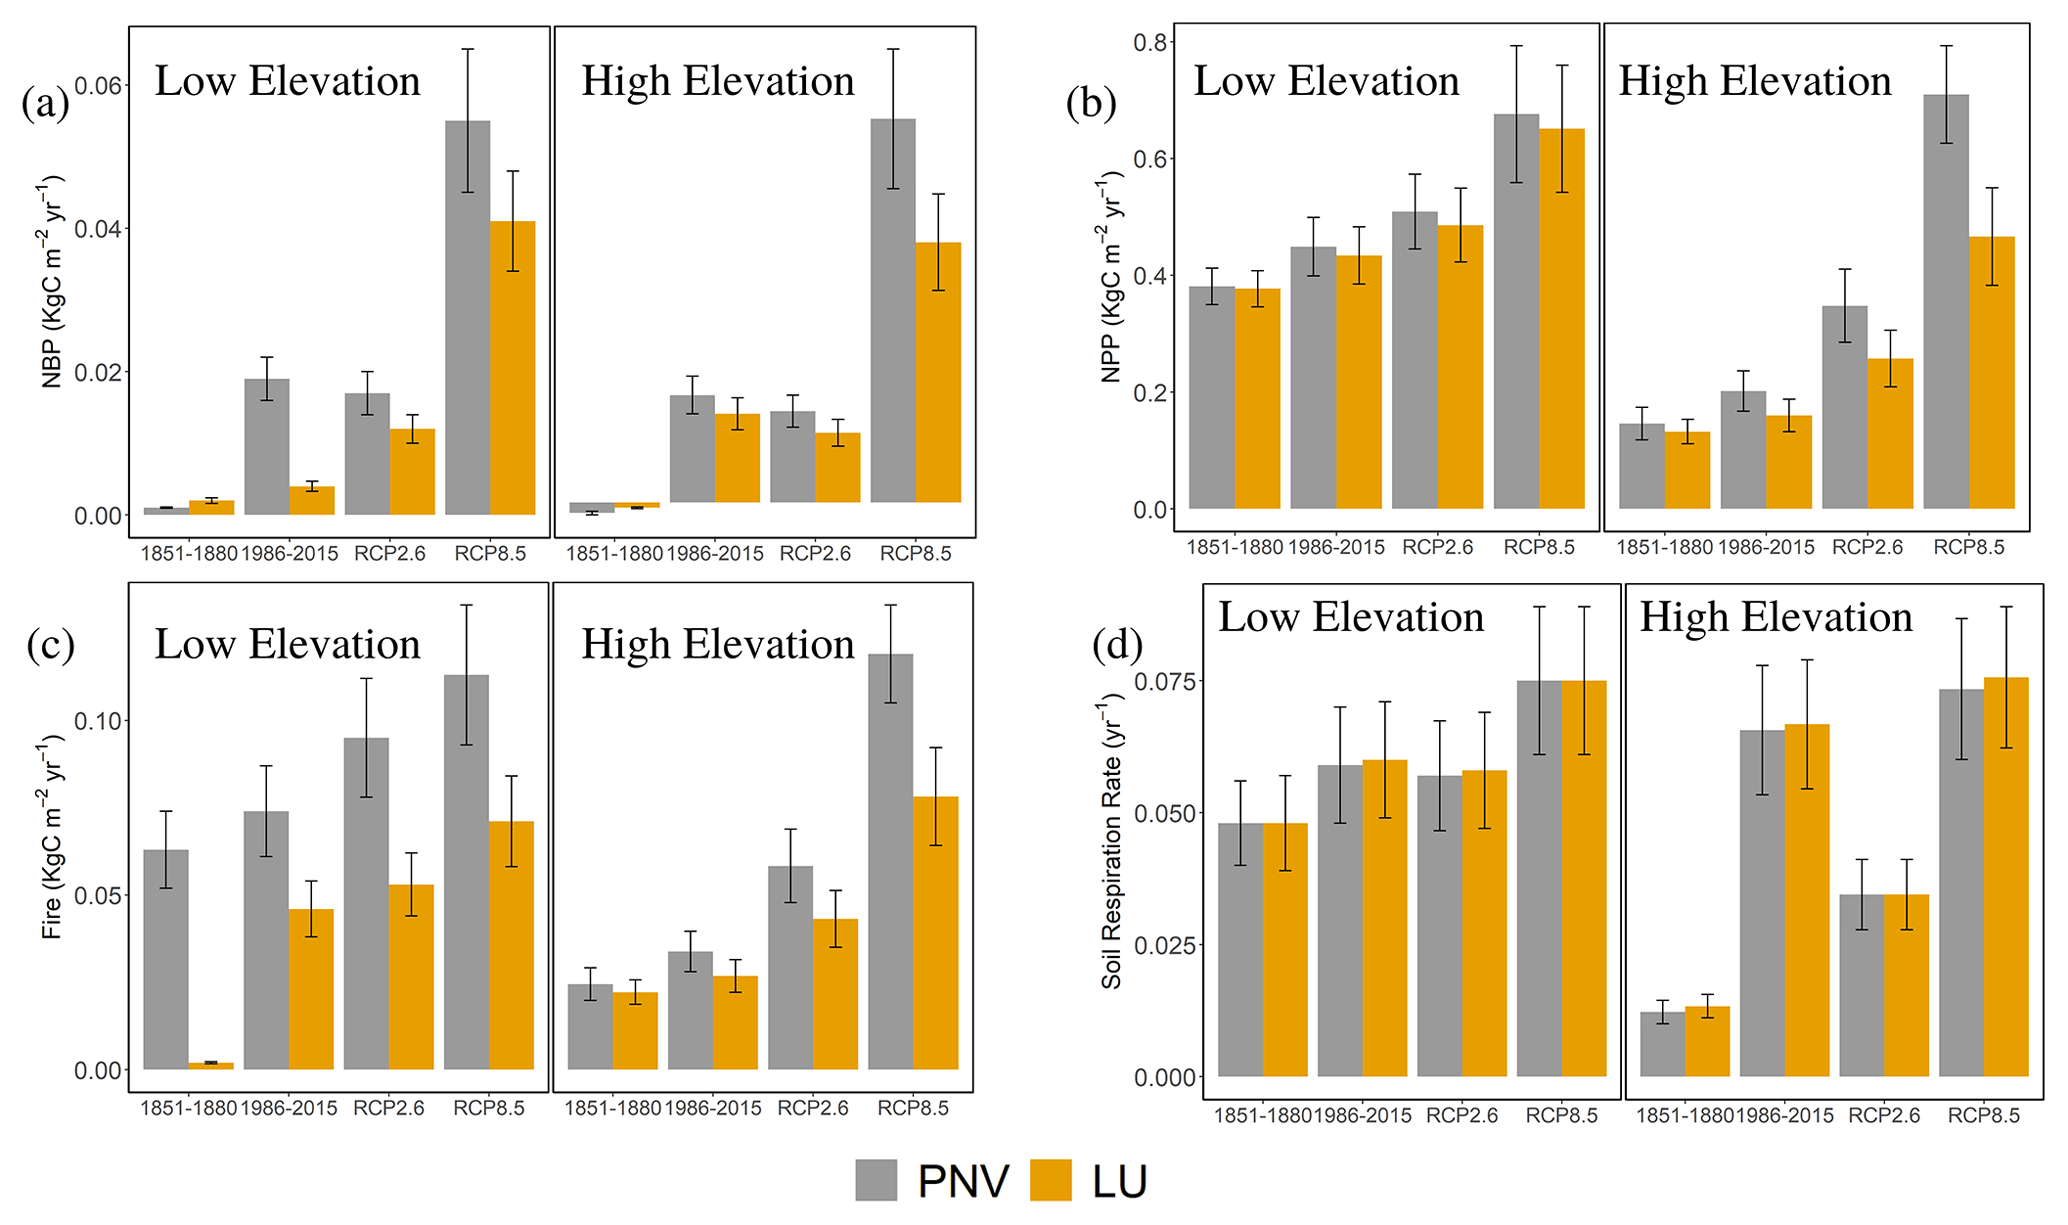
Figure 7LPJ-GUESS-simulated distribution by CCSM4 on (a) NBP, (b) NPP, (c) fire and (d) soil respiration rate in the HKH according to lower elevation (0–4500 m) and higher elevation (greater than 4500 m) for PNV (grey colour) and land-use change (orange colour). Vertical black bars illustrate ± standard error, where n=30.
We also analysed the change in NPP during the period from 1851 to 2100 and found that there was an upward trend in both lower and higher elevation in simulations including PNV and LU simulations. PNV-simulated NPP is projected to increase from 0.31 to 0.39 from 1851–1880 and 1986–2015. In the future scenario for PNV simulations, the NPP is estimated to be 0.46 in RCP2.6 and 0.66 RCP8.5, respectively. For LU simulations, the NPP is projected to increase from 0.31 to 0.38 from 1851–1880 and 1986–2015, respectively. In the future scenario, NPP in RCP2.6 is estimated to be 0.44 and 0.63 in RCP8.5 in LU simulations.
The temporal trend of fire flux from 1851–2100 shows generally higher flux values in PNV simulations as compared to LU simulations. At lower and higher elevations, an increasing trend of fire flux is seen. A higher fire flux is projected in the RCP8.5 scenario with a mean value of 5.9 and 7.08 in both the PNV and land-use simulations, respectively. The rate of soil respiration shows an increasing trend from the period of 1851–2100. A higher soil respiration rate is projected in higher elevation in RCP8.5 compared to RCP2.6 in PNV model simulations and LU model simulations. A similar trend was found in the MPI-ESM-LR climatic model included in the Supplement (Fig. S8).
3.6 Projected spatial changes in the pattern of vegetation carbon
Model estimates of VegC in HKH terrestrial ecosystems have increased since 1986 and will increase under both future climate scenarios in both PNV and LU simulations. For simulations with no land use, the mean VegC is estimated to be 3.58 and 4.05 kg C m−2 for the past and present periods and is projected to reach to 5.51 and 7.19 kg C m−2 under RCP2.6 and RCP8.5, respectively. Furthermore, for the LU simulations, the VegC is estimated to be 2.95 kg C m−2 in the past period and slightly decreases to 2.14 kg C m−2 in the present period. An increase in VegC is predicted in both scenarios, with a mean value of 2.45 and 3.80 kg C m−2 for RCP2.6 and RCP8.5, respectively. Spatial patterns show that the mean VegC (Fig. 8) will increase most in the lower belt of the HKH region and northeastern region in HKH during 2071–2100 under both the RCP2.6 and RCP8.5 scenarios.
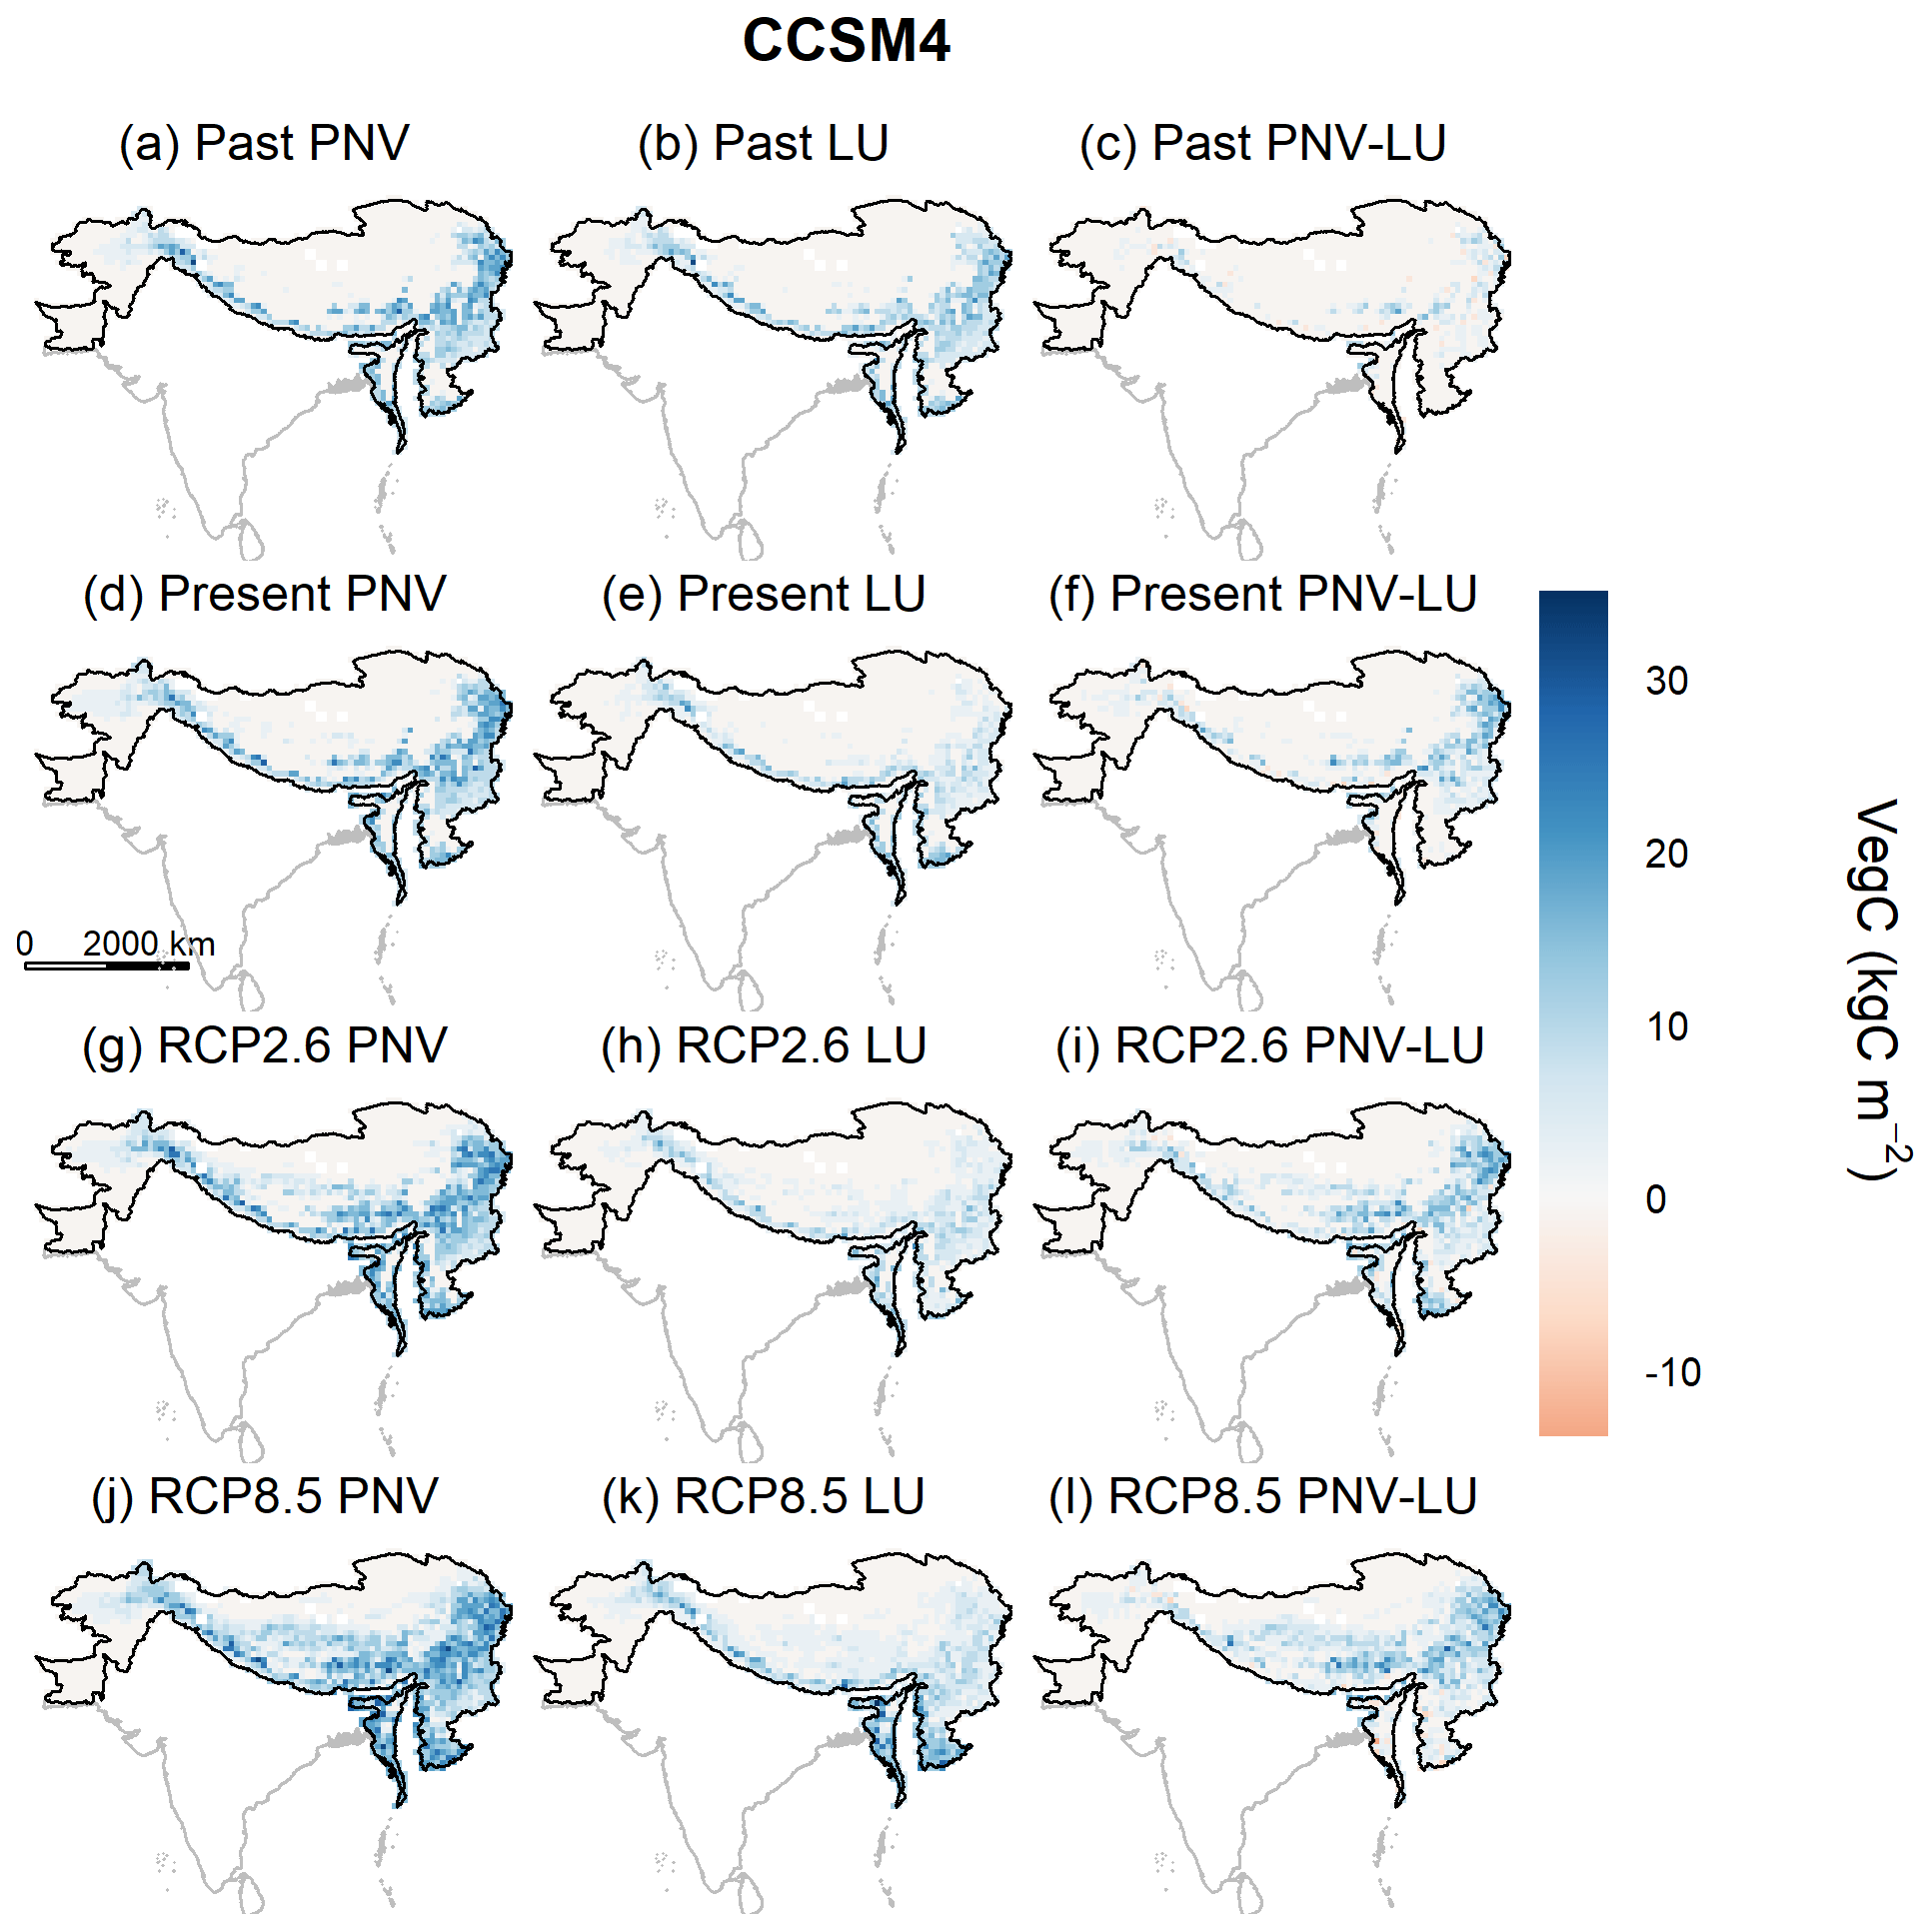
Figure 8LPJ-GUESS-simulated distribution by CCSM4 on VegC in HKH region under the (a) past period (1851–1880) with PNV, (b) past period (1851–1880) with land-use change, (c) difference between past PNV and past LU, (d) present period (1986–2015) with PNV, (e) present period (1986–2015) with land-use change, (f) difference between present PNV and past LU, (g) future scenario RCP2.6 (2071–2100) with PNV, (h) future scenario RCP2.6 with LU (2071–2100), (i) difference between future RCP2.6 PNV and LU, (j) future scenario RCP8.5 (2071–2100) with PNV, (k) future scenario RCP8.5 with LU and (l) difference between future RC8.5 PNV and LU.
3.7 Comparison of observational climate products
Figures 9 and 10 show a comparison between CRU and ERA5 datasets of temperature and precipitation from 1979 to 1990, respectively. The mean CRU temperature from 1979 to 1990 was estimated to be 5.64 ∘C, and for ERA5 it was estimated to be 4.32 ∘C. Both of the datasets capture higher temperature in the lower region of the HKH, with warmer temperature in Bangladesh and Myanmar. On the other hand, low temperatures are observed in the region of Tibetan Plateau. The two datasets overall showed a strong agreement with a strong correlation of 0.96. However, the agreement of spatial distribution of precipitation showed a lower correlation with an r value of 0.67. There is a difference of mean precipitation in the lower region of the eastern HKH. The CRU dataset shows an average precipitation of 0.0018 m d−1, whereas ERA5 data show an estimation of 0.0028 m d−1.
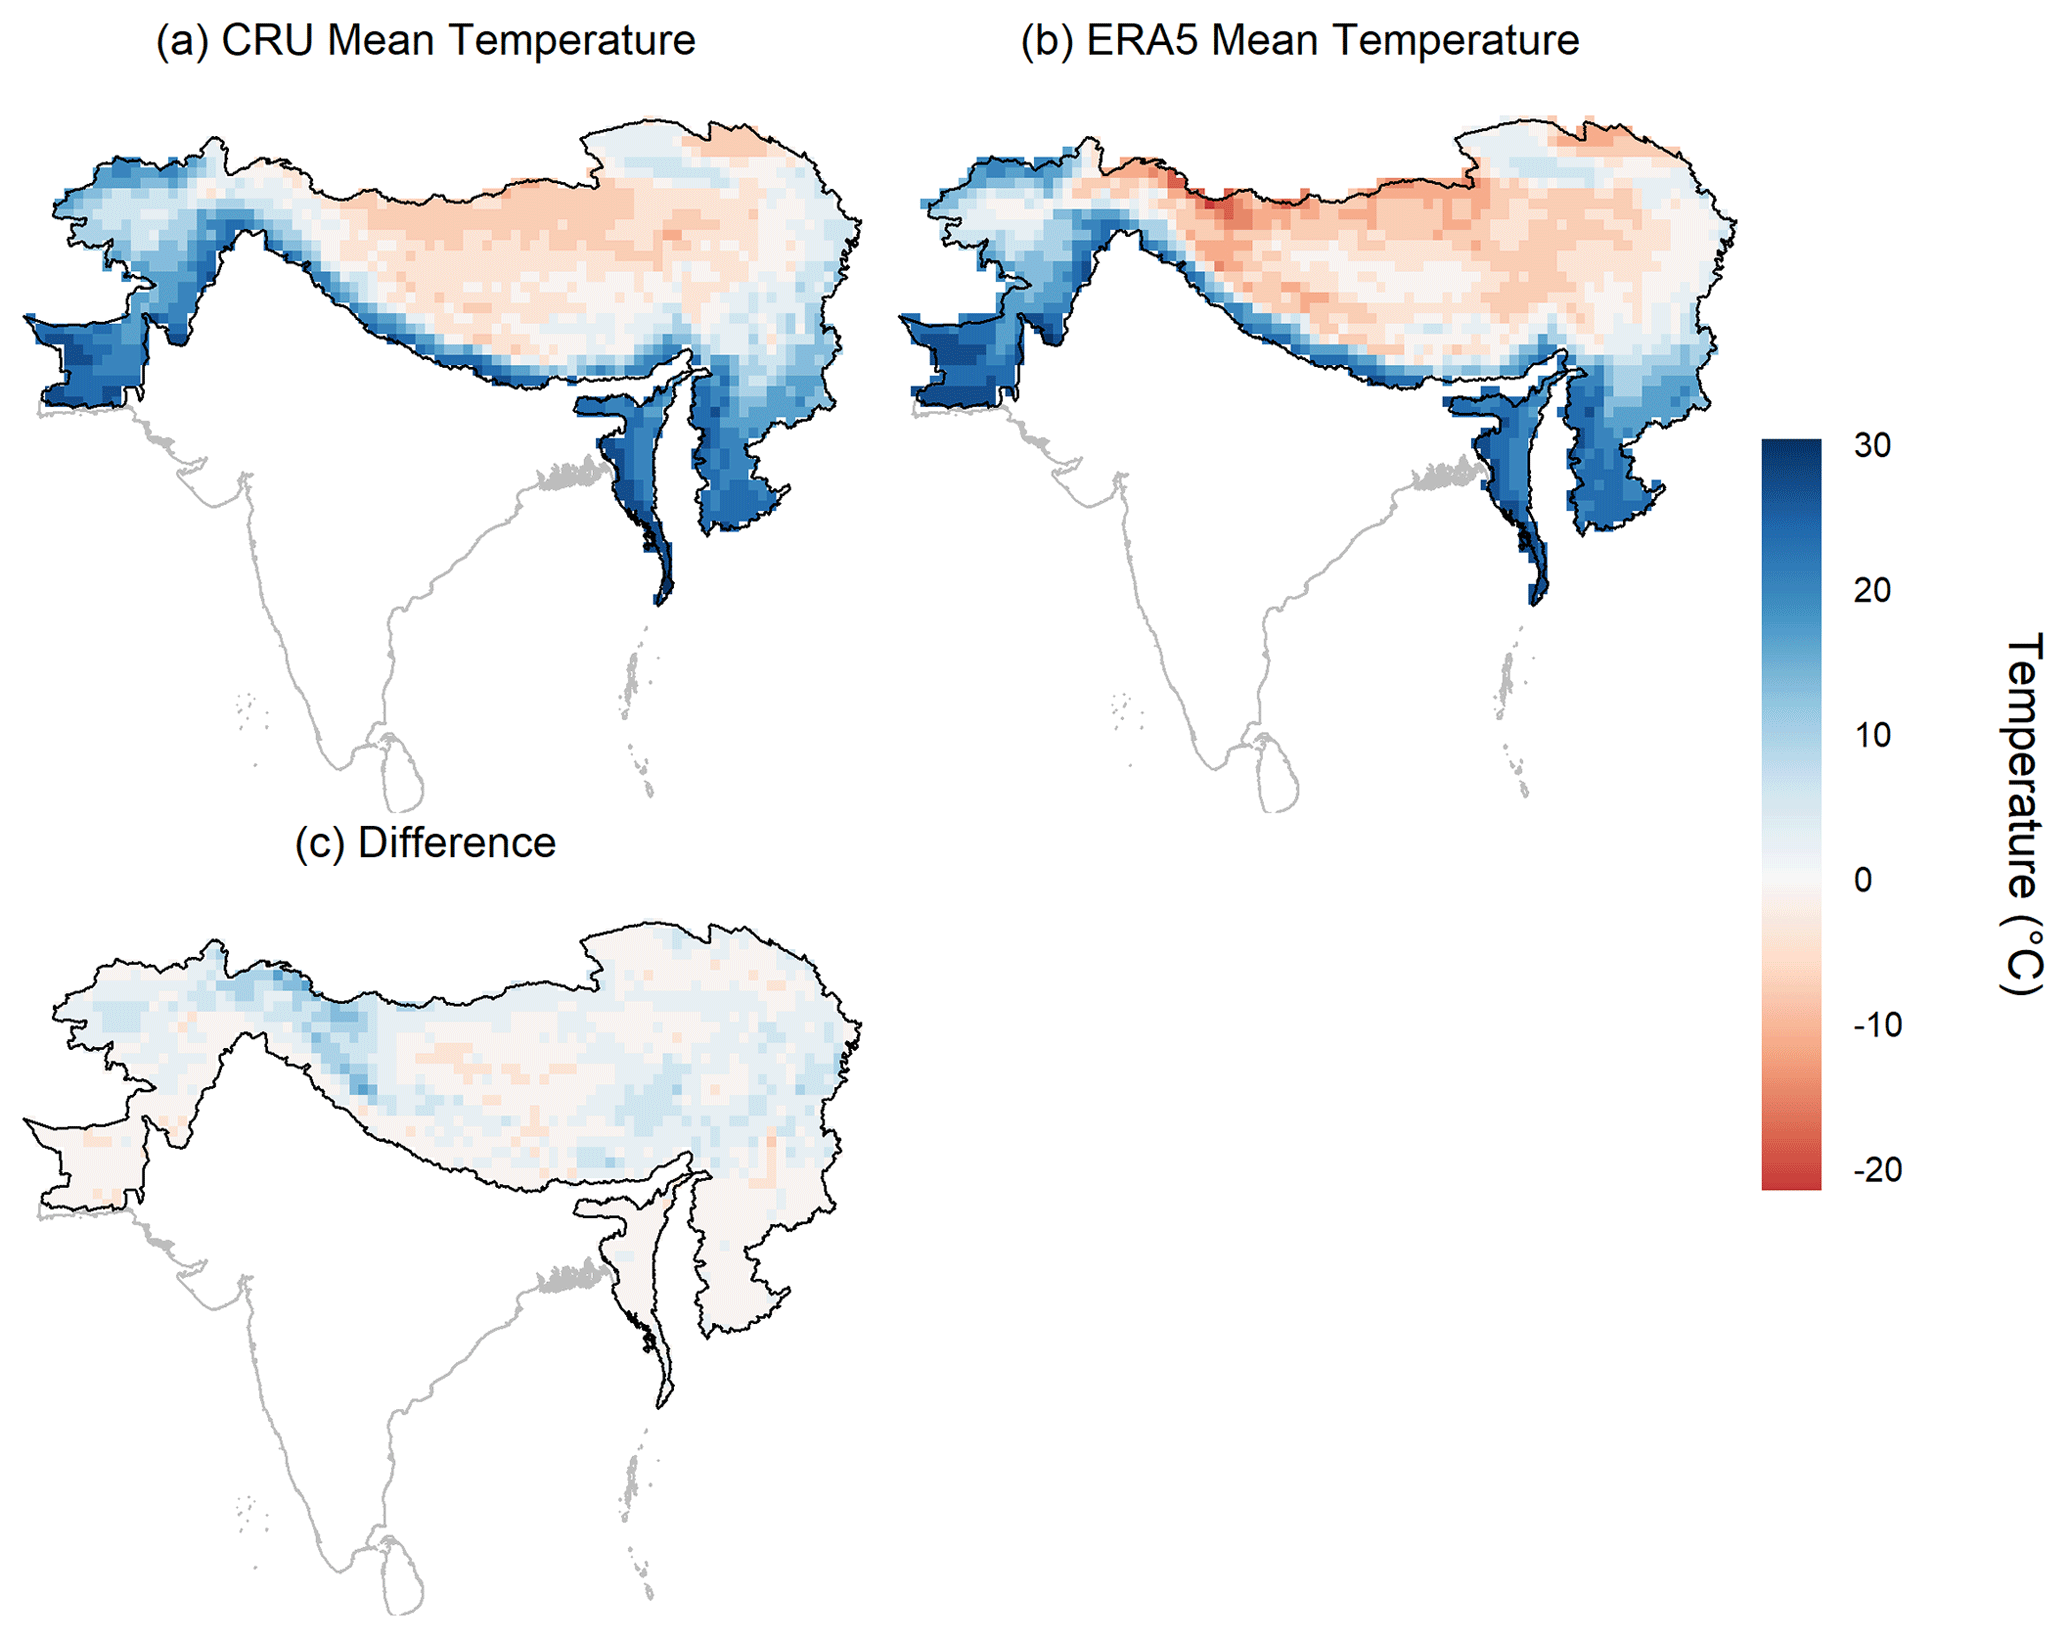
Figure 9Comparison of temperature (a) average CRU (1979–1990), (b) ERA5 data (1979–1990) and (c) the difference between the ERA5 and CRU datasets in degrees Celsius.

Figure 10Comparison of precipitation (a) average CRU (1960–1990), (b) ERA5 data (1979–1990) and (c) the difference between the ERA5 and CRU datasets in m d−1.
We compared the modelled simulations of VegC and primary productivity with satellite-based estimates. For VegC, the comparator dataset is a global above-ground biomass map from the GEOCARBON project for the year 2000. A good agreement was found between GEOCARBON and the ESMs with relatively little difference between the ESM climates. The difference between modelled and observed VegC was found in the EBF and may be attributed to the differences in terms of the coverage of above-ground or below-ground biomass of both datasets. The GEOCARBON dataset includes the spatial distribution of forest biomass covering only the above-ground vegetation for 2000. On the other hand, the LPJ-GUESS simulation covers vegetation both above and below the ground. Hence, uncertainties may arise due to converting above-ground biomass to the total above-ground and below-ground biomass for the datasets of GEOCARBON in order to be comparable with LPJ-GUESS VegC. Furthermore, the satellite-derived GEOCARBON biomass dataset was generated by harmonization of datasets of two different years. The tropical biomass products represent the year 2000 status of forests, and the boreal above-ground biomass maps are based on spaceborne radar data from the year 2010. The LPJ-GUESS VegC was averaged over the years from 1986 to 2015. Hence, the difference in the years of observations might have introduced additional uncertainty. This drawback of the observed dataset was also highlighted by Li et al. (2017).
Secondly, we compared the LPJ-GUESS GPP and NPP with MODIS datasets from 2000–2010. A higher GPP and NPP emerged in areas covered with dense forests mainly in the southeast and southwest HKH regions, especially in Bangladesh and Myanmar. The LPJ-GUESS GPP showed a better agreement with MODIS GPP than MODIS NPP. It is important to note that the LPJ-GUESS simulations here and the MODIS algorithm do not share common meteorological drivers and that might reduce the correlation between the two datasets (Liu et al., 2018). Previous studies have also reported that DGVMs generally overestimate GPP in the Northern Hemisphere (Li et al., 2016). This could be attributed to the absence of parametrization of tropospheric ozone that leads to overestimation of leaf area index (LAI) leading to increased GPP (Anav et al., 2013). Yet most of the researchers suggest that simulated GPP by DGVMs was neither overestimated nor underestimated, but the results are limited by number of observational or model considerations. For instance, the modelled LPJ-GUESS simulations here do not include the impact of nitrogen cycling (Li et al., 2016). The inconsistencies of primary productivity for EBF were also observed in various studies (Ardö, 2015; Garrigues et al., 2008). A study carried out by Ardö (2015), estimated MOD17 GPP to be 0.8 kg C m−2 higher compared to LPJ-GUESS GPP for the EBF land-cover class. Areas affected by frequent cloud cover or atmospheric contamination may then show inconsistent estimates of vegetation productivity using MOD17.
The second step was to explore the variability of NBP and its components and VegC over HKH from 1851–2100 with PNV and LU simulations and how this variability was influenced by elevation. Results showed that the terrestrial ecosystems of HKH had been a carbon sink for the period 1851–2015 with a generally positive NBP, and the region is projected to remain a carbon sink in both future scenarios. However, in the simulations containing land use, the sink strength of the region is lower than in the potential natural simulations. Past modelling studies (Houghton et al., 1987) did capture a large net release of carbon in the 1980s from Nepal, Bangladesh, Bhutan, India, Pakistan, Myanmar and China due to land-use change (mainly deforestation). Extensive research has shed light on the serious degradation of grasslands on the Tibetan Plateau of China due to anthropogenic disturbances starting from the 1960s (Joshi et al., 2013; Wang et al., 2008). This degradation appears to be captured well by the LPJ-GUESS simulation, as a reduction of NBP in parts of China can be seen in the spatial maps from 1986–2015. Furthermore, a recent study carried out by Calle et al. (2016) calculated the regional carbon fluxes LULCC in Asia for the period from 1980 to 2009 using eight carbon cycle DGVMs. Since the 1980s, the ensemble mean of the DGVMs also have shown a net carbon source from south Asian and east Asian land ecosystems. From 1951 to 2005, most parts of the HKH underwent rapid population and economic growth, increasing the demand for natural resources, hence resulting in large changes in LULCC and habitat fragmentation.
The LPJ-GUESS simulations for the HKH for 2071–2100 for both scenarios predicted a net sink of carbon. The simulations of LPJ-GUESS of the HKH region were consistent with the previous studies carried out at a global scale, where a C sink was reported in the future scenario by various DGVMs during the next century (Cramer et al., 2001). A greater increase in NBP and VegC was seen in RCP8.5, as the rate of photosynthesis by terrestrial vegetation rises due to increase, with atmospheric CO2 content leading to increased carbon uptake. A global-scale study carried out by Thompson et al. (2004) discussed that the CO2 fertilization could limit the global warming in the future scenario; however, the nutrient limitations, which were not considered here, could weaken this effect. The influence of carbon–nitrogen interactions has a greater effect in the colder climates as compared to carbon-only interactions due to inability of newly established vegetation to compete for the nitrogen resources with existing vegetation under nitrogen limitation (Wärlind et al., 2014). However, the version of LPJ-GUESS used in this study did not account for nutrient limitations and assume nitrogen to be at an optimal level for the terrestrial vegetation. The coupling of carbon and nitrogen cycles is becoming widely recognized, as nitrogen dynamics have been incorporated into global C cycling model (Fleischer et al., 2015).
In this study, the NPP increased from the period of 1851 to 2100. A higher NPP was simulated in RCP8.5, as increasing temperature and CO2 concentration level leads to increased NPP (Azhdari et al., 2020). The dominant fire occurrences taking place in the HKH region are savannah fires that include grassland fires and fires caused by deforestation and forest degradation (Van Der Werf et al., 2010). The ESMs used to force LPJ-GUESS predict increasing temperature and CO2 levels (Fig. S9 in the Supplement) in both RCP2.6 and RCP8.5 from the year 2000. Hence, with rising temperatures, the loss of carbon due to biomass burning in wildfires causes the drier forests to become more vulnerable to climate change as they are more sensitive to fire and droughts (Anderson-Teixeira et al., 2013). Studies of DGVMs indicate that in the absence of land-use changes (Sitch et al., 2015), the soil respiration rate increases with climate change; however, the simulations in this study taking account of land-use changes have also shown an increase in soil respiration rate. Climatic warming is considered to stimulate the rates of soil respiration, potentially resulting in further increases in global temperatures by accelerating the rate of the carbon feedback cycle via Ra and decomposition of organic matter (Carey et al., 2016).
The study also assessed the comparison of observational climate products over HKH for the period 1979–1990. Our analysis for precipitation showed that the ERA5 climatic data have a higher precipitation of 0.009 m d−1 in the HKH region of the evergreen broadleaf forests. However, for the CRU climatic dataset, the precipitation was estimated to be 0.005 m d−1. Hence, the underestimation in primary productivity and biomass could be attributed to the lower precipitation estimated by the CRU dataset. Past literature reported that reduction in precipitation can cause soil water stress, leading to a reduction in stomatal conductance and reduction in leaf area (Konings et al., 2017; Ondier et al., 2021).
The results of this study suggest that HKH will act as a net sink of C under both strong and weak scenarios of future climate change. There was relatively good correspondence between the model and complementary satellite-based estimates of biomass and primary productivity. However, it is important to note that as long as obtainability and access of meteorological data at a regional level and in situ validation data such as eddy covariance measurements and long-term ecological field assessments remain scarce, it can be expected for the representativity of vegetation carbon and vegetation productivity estimates for HKH to remain hard to evaluate definitively. The LPJ-GUESS simulations revealed that the NBP is projected to be higher in future scenarios than in the historical period, assuming that the LULCC does not increase dramatically. Furthermore, VegC storage spatial and temporal analyses suggest that, for the RCP8.5 scenario, the CMIP5 climate model produces, on average, a slightly higher VegC compared to RCP2.6, which is attributable to the CO2 fertilization effect in both PNV and LU simulations. Vegetation fluxes can help to analyse the carbon storage patterns; however, further studies are required to assess the effects of climatic changes and anthropogenic activities on the fragile ecosystems of the HKH for the establishment of policies to improve the livelihood of the local population and the overall carbon balance in the region.
Data used in this study are available at https://doi.org/10.4121/15097500.v1 (Usman et al., 2021).
The supplement related to this article is available online at: https://doi.org/10.5194/esd-12-857-2021-supplement.
HU carried out the research, TAMP provided help with data analysis and interpretation, AA provided data, and SB conceived the research idea and supervised the research. HU led the writing of the paper with contributions from all co-authors.
The authors declare that they have no conflict of interest.
Publisher's note: Copernicus Publications remains neutral with regard to jurisdictional claims in published maps and institutional affiliations.
This study contributes to the strategic research areas of BECC and MERGE.
This research has been supported by the NUST student support fund.
This paper was edited by Sagnik Dey and reviewed by two anonymous referees.
Ahlström, A., Schurgers, G., Arneth, A., and Smith, B.: Robustness and uncertainty in terrestrial ecosystem carbon response to CMIP5 climate change projections, Environ. Res. Lett., 7, 044008, https://doi.org/10.1088/1748-9326/7/4/044008, 2012.
Anav, A., Friedlingstein, P., Kidston, M., Bopp, L., Ciais, P., Cox, P., Jones, C., Jung, M., Myneni, R., and Zhu, Z.: Evaluating the land and ocean components of the global carbon cycle in the CMIP5 earth system models, J. Climate, 26, 6801–6843, https://doi.org/10.1175/JCLI-D-12-00417.1, 2013.
Anderson-Teixeira, K. J., Miller, A. D., Mohan, J. E., Hudiburg, T. W., Duval, B. D., and DeLucia, E. H.: Altered dynamics of forest recovery under a changing climate, Glob. Change Biol., 19, 2001–2021, https://doi.org/10.1111/gcb.12194, 2013.
Ardö, J.: Comparison between remote sensing and a dynamic vegetation model for estimating terrestrial primary production of Africa, Carbon Balance and Management, 10, 8, https://doi.org/10.1186/s13021-015-0018-5, 2015.
Azhdari, Z., Rafeie Sardooi, E., Bazrafshan, O., Zamani, H., Singh, V. P., Mohseni Saravi, M., and Ramezani, M.: Impact of climate change on net primary production (NPP) in south Iran, Environ. Monit. Assess., 192, 1–16, https://doi.org/10.1007/s10661-020-08389-w, 2020.
Behera, M. D., Murthy, M. S. R., Das, P., and Sharma, E.: Modelling forest resilience in Hindu Kush Himalaya using geoinformation, J. Earth Syst. Sci., 127, 95, https://doi.org/10.1007/s12040-018-1000-x, 2018.
Brandt, J. S., Allendorf, T., Radeloff, V., and Brooks, J.: Effects of national forest-management regimes on unprotected forests of the Himalaya, Conserv. Biol., 31, 1271–1282, https://doi.org/10.1111/cobi.12927, 2017.
Burton, A. J., Melillo, J. M., and Frey, S. D.: Adjustment of Forest Ecosystem Root Respiration as Temperature Warms, J. Integr. Plant Biol., 50, 1467–1483, 2008.
Calle, L., Canadell, J. G., Patra, P., Ciais, P., Ichii, K., Tian, H., Kondo, M., Piao, S., Arneth, A., Harper, A. B., Ito, A., Kato, E., Koven, C., Sitch, S., Stocker, B. D., Vivoy, N., Wiltshire, A., Zaehle, S., and Poulter, B.: Regional carbon fluxes from land use and land cover change in Asia, 1980–2009, Environ. Res. Lett., 11, 1–12, https://doi.org/10.1088/1748-9326/11/7/074011, 2016.
Cao, R., Shen, M., Zhou, J., and Chen, J.: Modeling vegetation green-up dates across the Tibetan Plateau by including both seasonal and daily temperature and precipitation, Agr. Forest Meteorol., 249, 176–186, https://doi.org/10.1016/j.agrformet.2017.11.032, 2018.
Carey, J. C., Tang, J., Templer, P. H., Kroeger, K. D., Crowther, T. W., Burton, A. J., Dukes, J. S., Emmett, B., Frey, S. D., Heskel, M. A., Jiang, L., Machmuller, M. B., Mohan, J., Panetta, A. M., Reich, P. B., Reinschj, S., Wang, X., Allison, S. D., Bamminger, C., Bridgham, S., Collins, S. L., De Dato, G., Eddy, W. C., Enquist, B. J., Estiarte, M., Harte, J., Henderson, A., Johnson, B. R., Larsen, K. S., Luo, Y., Marhan, S., Melillo, J. M., Peñuelas, J., Pfeifer-Meister, L., Poll, C., Rastetter, E., Reinmann, A. B., Reynolds, L. L., Schmidt, I. K., Shaver, G. R., Strong, A. L., Suseela, V., and Tietema, A.: Temperature response of soil respiration largely unaltered with experimental warming, P. Natl. Acad. Sci. USA, 113, 13797–13802, https://doi.org/10.1073/pnas.1605365113, 2016.
Chen, H., Zhu, Q., Peng, C., Wu, N., Wang, Y., Fang, X., Gao, Y., Zhu, D., Yang, G., Tian, J., Kang, X., Piao, S., Ouyang, H., Xiang, W., Luo, Z., Jiang, H., Song, X., Zhang, Y., Yu, G., Zhao, X., Gong, P., Yao, T., and Wu, J.: The impacts of climate change and human activities on biogeochemical cycles on the Qinghai–Tibetan Plateau, Glob. Change Biol., 19, 2940–2955, https://doi.org/10.1111/gcb.12277, 2013.
Cramer, W., Bondeau, A., Woodward, F. I., Prentice, I. C., Betts, R. A., Brovkin, V., Cox, P. M., Fisher, V., Foley, J. A., Friend, A. D., Kucharik, C., Lomas, M. R., Ramankutty, N., Sitch, S., Smith, B., White, A., and Young-Molling, C.: Global response of terrestrial ecosystem structure and function to CO2 and climate change: Results from six dynamic global vegetation models, Glob. Change Biol., 7, 357–373, https://doi.org/10.1046/j.1365-2486.2001.00383.x, 2001.
de Almeida, C. T., Delgado, R. C., Galvão, L. S., Aragão, L. E. de O. C. e. and Ramos, M. C.: Improvements of the MODIS Gross Primary Productivity model based on a comprehensive uncertainty assessment over the Brazilian Amazonia, ISPRS J. Photogramm. Remote Sens., 145, 268–283, https://doi.org/10.1016/j.isprsjprs.2018.07.016, 2018.
Delpierre, N., Soudani, K., François, C., Köstner, B., Pontailler, J. Y., Nikinmaa, E., Misson, L., Aubinet, M., Bernhofer, C., Granier, A., Grünwald, T., Heinesch, B., Longdoz, B., Ourcival, J. M., Rambal, S., Vesala, T., and Dufrêne, E.: Exceptional carbon uptake in European forests during the warm spring of 2007: A data-model analysis, Glob. Change Biol., 15, 1455–1474, https://doi.org/10.1111/j.1365-2486.2008.01835.x, 2009.
Fleischer, K., Wårlind, D., Van Der Molen, M. K., Rebel, K. T., Arneth, A., Erisman, J. W., Wassen, M. J., Smith, B., Gough, C. M., Margolis, H. A., Cescatti, A., Montagnani, L., Arain, A., and Dolman, A. J.: Low historical nitrogen deposition effect on carbon sequestration in the boreal zone, J. Geophys. Res.-Biogeo., 120, 2542–2561, https://doi.org/10.1002/2015JG002988, 2015.
Friedl, M. A., McIver, D. K., Hodges, J. C. F., Zhang, X. Y., Muchoney, D., Strahler, A. H., Woodcock, C. E., Gopal, S., Schneider, A., Cooper, A., Baccini, A., Gao, F., and Schaaf, C.: Global land cover mapping from MODIS: Algorithms and early results, Remote Sens. Environ., 83, 287–302, https://doi.org/10.1016/S0034-4257(02)00078-0, 2002.
Friedlingstein, P., O'Sullivan, M., Jones, M. W., Andrew, R. M., Hauck, J., Olsen, A., Peters, G. P., Peters, W., Pongratz, J., Sitch, S., Le Quéré, C., Canadell, J. G., Ciais, P., Jackson, R. B., Alin, S., Aragão, L. E. O. C., Arneth, A., Arora, V., Bates, N. R., Becker, M., Benoit-Cattin, A., Bittig, H. C., Bopp, L., Bultan, S., Chandra, N., Chevallier, F., Chini, L. P., Evans, W., Florentie, L., Forster, P. M., Gasser, T., Gehlen, M., Gilfillan, D., Gkritzalis, T., Gregor, L., Gruber, N., Harris, I., Hartung, K., Haverd, V., Houghton, R. A., Ilyina, T., Jain, A. K., Joetzjer, E., Kadono, K., Kato, E., Kitidis, V., Korsbakken, J. I., Landschützer, P., Lefèvre, N., Lenton, A., Lienert, S., Liu, Z., Lombardozzi, D., Marland, G., Metzl, N., Munro, D. R., Nabel, J. E. M. S., Nakaoka, S.-I., Niwa, Y., O'Brien, K., Ono, T., Palmer, P. I., Pierrot, D., Poulter, B., Resplandy, L., Robertson, E., Rödenbeck, C., Schwinger, J., Séférian, R., Skjelvan, I., Smith, A. J. P., Sutton, A. J., Tanhua, T., Tans, P. P., Tian, H., Tilbrook, B., van der Werf, G., Vuichard, N., Walker, A. P., Wanninkhof, R., Watson, A. J., Willis, D., Wiltshire, A. J., Yuan, W., Yue, X., and Zaehle, S.: Global Carbon Budget 2020, Earth Syst. Sci. Data, 12, 3269–3340, https://doi.org/10.5194/essd-12-3269-2020, 2020.
Garrigues, S., Lacaze, R., Baret, F., Morisette, J. T., Weiss, M., Nickeson, J. E., Fernandes, R., Plummer, S., Shabanov, N. V., Myneni, R. B., Knyazikhin, Y., and Yang, W.: Validation and intercomparison of global Leaf Area Index products derived from remote sensing data, J. Geophys. Res.-Biogeo., 113, G02028, https://doi.org/10.1029/2007JG000635, 2008.
Houghton, R. A., Boone, R. D., Fruci, J. R., Hobbi, J. E., Melillo, J. M., Palm, C. A., Peterson, B. J., Shaver, G. R., Woodwell, G. M., Moore, B., Skole, D. L., and Myers, N.: The flux of carbon from terrestrial ecosystems to the atmosphere in 1980 due to changes in land use: geographic distribution of the global flux, Tellus B, 39, 122–139, https://doi.org/10.1111/j.1600-0889.1987.tb00277.x, 1987.
Jones, C., Robertson, E., Arora, V., Friedlingstein, P., Shevliakova, E., Bopp, L., Brovkin, V., Hajima, T., Kato, E., Kawamiya, M., Liddicoat, S., Lindsay, K., Reick, C. H., Roelandt, C., Segschneider, J., and Tjiputra, J.: Twenty-first-century compatible co2 emissions and airborne fraction simulated by CMIP5 earth system models under four representative concentration pathways, J. Climate, 26, 4398–4413, https://doi.org/10.1175/JCLI-D-12-00554.1, 2013.
Joshi, L., Shrestha, R. M., Jasra, A. W., Joshi, S., Gilani, H., and Ismail, M.: Rangeland Ecosystem Services in the Hindu Kush Himalayan Region, in: High-altitude rangelands and their interfaces in the Hindu Kush Himalayas, edited by: Ning, W., Rawat, G. S., Joshi, S., Ismail, M., and Sharma, E., ICIMOD, Kathmandu, 2013.
Konings, A. G., Williams, A. P., and Gentine, P.: Sensitivity of grassland productivity to aridity controlled by stomatal and xylem regulation, Nat. Geosci., 10, 284–288, https://doi.org/10.1038/ngeo2903, 2017.
Kondo, M., Ichii, K., Patra, P. K., Poulter, B., Calle, L., Koven, C., Pugh, T. A. M., Kato, E., Harper, A., Zaehle, S., and Wiltshire, A.: Plant Regrowth as a Driver of Recent Enhancement of Terrestrial CO2 Uptake, Geophys. Res. Lett., 45, 4820–4830, https://doi.org/10.1029/2018GL077633, 2018.
Krishnan, R., Shrestha, A. B., Ren, G., Rajbhandari, R., Saeed, S., Sanjay, J., Syed, M. A., Vellore, R., Xu, Y., You, Q., and Ren, Y.: Unravelling Climate Change in the Hindu Kush Himalaya: Rapid Warming in the Mountains and Increasing Extremes, in: The Hindu Kush Himalaya Assessment – Mountains, Climate Change, Sustainability and People, Springer Nature Switzerland, Cham, Switzerland, 57–97, 2019.
Li, X., Zhu, Z., Zeng, H., and Piao, S.: Estimation of gross primary production in China (1982–2010) with multiple ecosystem models Legacy effects of drought on gross primary productivity of temperate grassland in China View project Estimation of gross primary production in China (1982–2010) with multiple ecosystem models, Ecol. Model., 324, 33–44, https://doi.org/10.1016/j.ecolmodel.2015.12.019, 2016.
Li, W., Ciais, P., Peng, S., Yue, C., Wang, Y., Thurner, M., Saatchi, S. S., Arneth, A., Avitabile, V., Carvalhais, N., Harper, A. B., Kato, E., Koven, C., Liu, Y. Y., Nabel, J. E. M. S., Pan, Y., Pongratz, J., Poulter, B., Pugh, T. A. M., Santoro, M., Sitch, S., Stocker, B. D., Viovy, N., Wiltshire, A., Yousefpour, R., and Zaehle, S.: Land-use and land-cover change carbon emissions between 1901 and 2012 constrained by biomass observations, Biogeosciences, 14, 5053–5067, https://doi.org/10.5194/bg-14-5053-2017, 2017.
Liu, L., Peng, S., AghaKouchak, A., Huang, Y., Li, Y., Qin, D., Xie, A., and Li, S.: Broad Consistency Between Satellite and Vegetation Model Estimates of Net Primary Productivity Across Global and Regional Scales, J. Geophys. Res.-Biogeo., 123, 3603–3616, https://doi.org/10.1029/2018JG004760, 2018.
Mitchell, T. D. and Jones, P. D.: An improved method of constructing a database of monthly climate observations and associated high-resolution grids, Int. J. Climatol., 25, 693–712, https://doi.org/10.1002/joc.1181, 2005.
Numerical Terradynamic Simulation Group: https://www.ntsg.umt.edu/default.php, last access: 21 January 2020.
Ondier, J. O., Okach, D. O., Onyango, J. C., and Otieno, D. O.: Ecosystem productivity and CO2 exchange response to the interaction of livestock grazing and rainfall manipulation in a Kenyan savanna, Environ. Sustain. Indic., 9, 100095, https://doi.org/10.1016/j.indic.2020.100095, 2021.
Phillips, O. L. and Lewis, S. L.: Evaluating the tropical forest carbon sink, Glob. Change Biol., 20, 2039–2041, https://doi.org/10.1111/gcb.12423, 2014.
Pugh, T. A. M., Jones, C. D., Huntingford, C., Burton, C., Arneth, A., Brovkin, V., Ciais, P., Lomas, M., Robertson, E., Piao, S. L., and Sitch, S.: A Large Committed Long-Term Sink of Carbon due to Vegetation Dynamics, Earths Future, 6, 1413–1432, https://doi.org/10.1029/2018EF000935, 2018.
Pugh, T. A. M., Lindeskog, M., Smith, B., Poulter, B., Arneth, A., Haverd, V., and Calle, L.: Role of forest regrowth in global carbon sink dynamics, P. Natl. Acad. Sci. USA, 116, 4382–4387, https://doi.org/10.1073/pnas.1810512116, 2019.
Pulakesh, D., Mukunda Dev, B. and Manchiraju Sri Ramachandra, M.: Forest fragmentation and human population varies logarithmically along elevation gradient in Hindu Kush Himalaya-utility of geospatial tools and free data set, J. Mt. Sci, 14, 2432–2447, https://doi.org/10.1007/s11629-016-4159-0, 2017.
Riahi, K., Rao, S., Krey, V., Cho, C., Chirkov, V., Fischer, G., Kindermann, G., Nakicenovic, N., and Rafaj, P.: RCP 8.5-A scenario of comparatively high greenhouse gas emissions, Climatic Change, 109, 33–57, https://doi.org/10.1007/s10584-011-0149-y, 2011.
Saatchi, S. S., Harris, N. L., Brown, S., Lefsky, M., Mitchard, E. T. A., Salas, W., Zutta, B. R., Buermann, W., Lewis, S. L., Hagen, S., Petrova, S., White, L., Silman, M., and Morel, A.: Benchmark map of forest carbon stocks in tropical regions across three continents, P. Natl. Acad. Sci. USA, 108, 9899–9904, https://doi.org/10.1073/pnas.1019576108, 2011.
Sitch, S., Friedlingstein, P., Gruber, N., Jones, S. D., Murray-Tortarolo, G., Ahlström, A., Doney, S. C., Graven, H., Heinze, C., Huntingford, C., Levis, S., Levy, P. E., Lomas, M., Poulter, B., Viovy, N., Zaehle, S., Zeng, N., Arneth, A., Bonan, G., Bopp, L., Canadell, J. G., Chevallier, F., Ciais, P., Ellis, R., Gloor, M., Peylin, P., Piao, S. L., Le Quéré, C., Smith, B., Zhu, Z., and Myneni, R.: Recent trends and drivers of regional sources and sinks of carbon dioxide, Biogeosciences, 12, 653–679, https://doi.org/10.5194/bg-12-653-2015, 2015.
Smith, B., Prentice, I. C., and Sykes, M. T.: Representation of vegetation dynamics in modelling of European ecosystems: comparison of two contrasting approaches, Global Ecol. Biogeogr., 10, 621–637, https://doi.org/10.1046/j.1466-822X.2001.t01-1-00256.x, 2001.
Sullivan, P. F., Arens, S. J. T., Chimner, R. A., and Welker, J. M.: Temperature and microtopography interact to control carbon cycling in a high arctic fen, Ecosystems, 11, 61–76, https://doi.org/10.1007/s10021-007-9107-y, 2008.
Thompson, S. L., Govindasamy, B., Mirin, A., Caldeira, K., Delire, C., Milovich, J., Wickett, M., and Erickson, D.: Quantifying the effects of CO2-fertilized vegetation on future global climate and carbon dynamics, Geophys. Res. Lett., 31, 1–4, https://doi.org/10.1029/2004GL021239, 2004.
Trenberth, K. E., Dai, A., Schrier, G. van der, Jones, P. D., Barichivich, J., Briffa, K. R., and Sheffield, J.: Global warming and changes in drought, Nat. Clim. Change, 4, 17–22, https://doi.org/10.1038/nclimate2067, 2013.
Urban, J., Ingwers, M. W., McGuire, M. A., and Teskey, R. O.: Increase in leaf temperature opens stomata and decouples net photosynthesis from stomatal conductance in Pinus taeda and Populus deltoides x nigra, J. Exp. Bot., 68, 1757–1767, https://doi.org/10.1093/jxb/erx052, 2017.
USGS: LP DAAC – AppEEARS, available at: https://lpdaac.usgs.gov/tools/appeears/, last access: 21 January 2020.
Usman, H., Pugh, T., Ahlström, A., and Baig, S.: Simulations underlying the analysis in the publication: Climate Change Projections of Terrestrial Primary Productivity over the Hindu Kush Himalayan Forests, 4TU.ResearchData [dataset], https://doi.org/10.4121/15097500.v1, 2021.
van der Werf, G. R., Randerson, J. T., Giglio, L., Collatz, G. J., Mu, M., Kasibhatla, P. S., Morton, D. C., DeFries, R. S., Jin, Y., and van Leeuwen, T. T.: Global fire emissions and the contribution of deforestation, savanna, forest, agricultural, and peat fires (1997–2009), Atmos. Chem. Phys., 10, 11707–11735, https://doi.org/10.5194/acp-10-11707-2010, 2010.
Van Vuuren, D. P., Den Elzen, M. G. J., Lucas, P. L., Eickhout, B., Strengers, B. J., Van Ruijven, B., Wonink, S., and Van Houdt, R.: Stabilizing greenhouse gas concentrations at low levels: An assessment of reduction strategies and costs, Climatic Change, 81, 119–159, https://doi.org/10.1007/s10584-006-9172-9, 2007.
Wang, H., Zhou, X., Wan, C., Fu, H., Zhang, F., and Ren, J.: Eco-environmental degradation in the northeastern margin of the Qinghai–Tibetan Plateau and comprehensive ecological protection planning, Environ. Geol., 55, 1135–1147, https://doi.org/10.1007/s00254-007-1061-7, 2008.
Wårlind, D., Smith, B., Hickler, T., and Arneth, A.: Nitrogen feedbacks increase future terrestrial ecosystem carbon uptake in an individual-based dynamic vegetation model, Biogeosciences, 11, 6131–6146, https://doi.org/10.5194/bg-11-6131-2014, 2014.
Williams, A. P., Allen, C. D., Macalady, A. K., Griffin, D., Woodhouse, C. A., Meko, D. M., Swetnam, T. W., Rauscher, S. A., Seager, R., Grissino-Mayer, H. D., Dean, J. S., Cook, E. R., Gangodagamage, C., Cai, M., and Mcdowell, N. G.: Temperature as a potent driver of regional forest drought stress and tree mortality, Nat. Clim. Change, 3, 292–297, https://doi.org/10.1038/nclimate1693, 2013.
Wu, Z., Dijkstra, P., Koch, G. W., Peñuelas, J., and Hungate, B. A.: Responses of terrestrial ecosystems to temperature and precipitation change: A meta-analysis of experimental manipulation, Glob. Change Biol., 17, 927–942, https://doi.org/10.1111/j.1365-2486.2010.02302.x, 2011.
Wu, Z., Ahlström, A., Smith, B., Ardö, J., Eklundh, L., Fensholt, R., and Lehsten, V.: Climate data induced uncertainty in model-based estimations of terrestrial primary productivity, Environ. Res. Lett., 12, 064013, https://doi.org/10.1088/1748-9326/aa6fd8, 2017.
Zhao, M. and Running, S. W.: Drought-induced reduction in global terrestrial net primary production from 2000 through 2009, Science, 329, 940–943, https://doi.org/10.1126/science.1192666, 2010.