the Creative Commons Attribution 4.0 License.
the Creative Commons Attribution 4.0 License.
 | 22 Oct 2021
Soil organic carbon dynamics from agricultural management practices under climate change
Tobias Herzfeld
Jens Heinke
Susanne Rolinski
Christoph Müller
Sequestration of soil organic carbon (SOC) on cropland has been proposed as a climate change mitigation strategy to reduce global greenhouse gas (GHG) concentrations in the atmosphere, which in particular is needed to achieve the targets proposed in the Paris Agreement to limit the increase in atmospheric temperature to well below 2 ∘C. We analyze the historical evolution and future development of cropland SOC using the global process-based biophysical model LPJmL, which was recently extended by a detailed representation of tillage practices and residue management (version 5.0-tillage2). We find that model results for historical global estimates for SOC stocks are at the upper end of available literature, with ∼2650 Pg C of SOC stored globally in the year 2018, ∼170 Pg C of which is stored in cropland soils. In future projections, assuming no further changes in current cropland patterns and under four different management assumptions with two different climate forcings, RCP2.6 and RCP8.5, results suggest that agricultural SOC stocks decline in all scenarios, as the decomposition of SOC outweighs the increase in carbon inputs into the soil from altered management practices. Different climate change scenarios, as well as assumptions on tillage management, play a minor role in explaining differences in SOC stocks. The choice of tillage practice explains between 0.2 % and 1.3 % of total cropland SOC stock change in the year 2100. Future dynamics in cropland SOC are most strongly controlled by residue management: whether residues are left on the field or harvested. We find that on current cropland, global cropland SOC stocks decline until the end of the century by only 1.0 % to 1.4 % if residue retention management systems are generally applied and by 26.7 % to 27.3 % in the case of residue harvest. For different climatic regions, increases in cropland SOC can only be found for tropical dry, warm temperate moist, and warm temperate dry regions in management systems that retain residues.
- Article
(3507 KB) - Full-text XML
-
Supplement
(6817 KB) - BibTeX
- EndNote


To meet the targets of the Paris Agreement of 2015 to keep the increase in global mean temperature well below 2 ∘C, and especially for the ambitious target of below 1.5 ∘C, several negative emission technologies which remove carbon dioxide (CO2) from the atmosphere have been proposed (Minx et al., 2018; Rogelj et al., 2018, 2016). At the same time as the climate is warming, the global human population is expected to increase to 9.7 billion people in 2050 and 10.9 billion by 2100 (United Nations et al., 2019), putting additional pressure on future food production systems. Food production alone has to increase by at least 50 % (FAO, 2019) or even double by the year 2050, depending on dietary preferences, demographical trends, and climate projections, if global food demand is to be met (Bodirsky et al., 2015). Different agricultural management practices have been proposed as carbon (C) sequestration strategies to mitigate climate change and increase the quality and health of the soil by increasing soil organic carbon (SOC) content of cropland soils (Lal, 2004), which also decreases the risk of soil erosion and soil degradation (Lal, 2009).
Tillage influences many biophysical properties, such as soil temperature and soil hydraulic properties (Snyder et al., 2009), and can increase different forms of soil degradation (Lal, 1993; Kurothe et al., 2014; Cerdà et al., 2009). The potential of SOC sequestration for agricultural management practices, e.g., the effect of no till, is debated in the scientific community (Baker et al., 2007; Powlson et al., 2014). Because tillage management is closely interrelated with residue management (Guérif et al., 2001; Snyder et al., 2009), these two practices should always be investigated simultaneously. Residue management can affect SOC stocks and soil water properties, as residues left on the soil surface can increase soil infiltration, reduce evaporation (Guérif et al., 2001; Ranaivoson et al., 2017), and add soil organic matter into the soil (Maharjan et al., 2018). Soil moisture and therefore plant productivity are also influenced by irrigation. While irrigated systems generally tend to have higher SOC stocks due to positive feedbacks on plant productivity, the feedbacks and mechanisms on SOC development are still not well understood (Humphrey et al., 2021; Emde et al., 2021). The effectiveness of irrigation systems for SOC development is influenced by climate and initial SOC stock, and it tends to be higher in semiarid regions and less effective in humid regions (Trost et al., 2013).
Minasny et al. (2017) have proposed the “4 per 1000 Soils for Food Security and Climate” initiative, which aims to increase global SOC sequestration by 0.4 % per year. They argue that under best-management practices, this target rate could be even higher. This approach would translate into a 2–3 Pg C a−1 SOC increase in the first 1 m of the soil, which is equivalent to about 20 %–35 % of global greenhouse gas (GHG) emissions (Minasny et al., 2017). This proposal has been criticized, as it overestimates the possible effect of SOC sequestration potential through agricultural management (de Vries, 2018; White et al., 2018). Field trials on SOC sequestration potentials show results with higher, as well as lower, sequestration rates but only represent the local soil and climatic conditions for the time of the experiment (Fuss et al., 2018; Minx et al., 2018), which reduces the likelihood for their validity on larger scales or over longer time periods.
Global total SOC stocks are estimated between 1500 Pg C (excluding permafrost regions) (Hiederer and Köchy, 2011) and up to 2456 Pg C for the upper 200 cm (Batjes, 1996) and agricultural SOC stocks alone, which are subject to agricultural management, are estimated to be between 140 and 327 Pg C depending on soil depth (Jobbágy and Jackson, 2000; Zomer et al., 2017). Since the beginning of cultivation by humans approximately 12 000 years ago, global SOC stocks for the top 200 cm of soil have declined by 116 Pg C because of agriculture by one estimate (Sanderman et al., 2017). Management assumptions play an important role in these estimates; e.g., Pugh et al. (2015) found that residue removal and tillage effects contribute to 6 % and 8 % of total land use change (LUC) emissions between the year 1850 and 2012 alone, which translates into biomass and soil C losses of approximately 13.5 and 16 Pg C, respectively.
In this study, we use a modeling approach to quantify the historical development of global cropland SOC stocks using new data for agricultural management such as manure and residue management, as well as a new dataset of the spatial distribution of tillage practices. In addition, we investigate the potential for SOC sequestration under different climate change scenarios on current cropland.
2.1 The LPJmL5.0-tillage2 model
The LPJmL5.0-tillage2 model combines the dynamic phenology scheme of the natural vegetation (Forkel et al., 2014), with version 5.0-tillage, which covers the terrestrial nitrogen cycle (von Bloh et al., 2018), and the representation of tillage practices and residue management (Lutz et al., 2019a). The model code is available at: https://doi.org/10.5281/zenodo.4625868 (Herzfeld et al., 2021). All organic matter pools in vegetation, litter, and soil in LPJmL5.0-tillage2 are represented by C pools and the corresponding N pools with variable C:N ratios. For soil carbon, the slow and fast soil pools are explicitly distributed over five soil layers (Schaphoff et al., 2013). With the term “SOC” we refer to the sum of all soil and litter C pools. After the harvest of crops, root carbon is transferred to the belowground litter pool. The incorporation of aboveground residues into the soil is dependent on the chosen management practices. Different tillage and residue management schemes, as well as the accounting for direct effects of SOC on soil hydraulic properties and thus on soil organic matter (SOM) decomposition and plant productivity, have been introduced in the implementation of tillage practices in version 5.0-tillage (Lutz et al., 2019a) and are thus explicitly considered here (Fig. 1). The model accounts for an irrigation scheme for green and blue water consumption (Rost et al., 2008) and the effects of different irrigation systems (Jägermeyr et al., 2015). Irrigation water is dynamically calculated and coupled with the overall water balance between soil, vegetation, and climate properties (Schaphoff et al., 2018).

Figure 1Carbon cycling on cropland and productivity feedbacks from plants to residues as well as soil stocks and soil water, as modeled in LPJmL5.0-tillage. Arrows indicate fluxes; boxes and circles are stocks.
In LPJmL5.0-tillage2, the amount of carbon in biomass, which is either harvested or can be left on the field as crop residue, is dependent on productivity (plant growth). Litter pool sizes are determined by the amount of biomass that is left on the field (i.e., not harvested) and the rate at which the litter is decomposed. At decomposition, the model assumes a fixed ratio of 40 % of C that is transferred from litter to the soil carbon pools; the other 60 % of C is emitted to the atmosphere as CO2, as in von Bloh et al. (2018). N cycling is included in the model, as explained in detail in von Bloh et al. (2018), and follows similar principles as SOC decomposition, reflecting the actual C:N ratios of the decomposing material. Applied N from manure, which is now explicitly considered in contrast to the previous model version LPJmL5.0-tillage, is assumed to consist of equal shares of mineral and organic N so that 50 % is added to the ammonium pool of the first soil layer and the rest is added to the aboveground leaf litter nitrogen pool. While manure composition is highly variable across animal type, feed, and treatment, a general ratio of 1:2 of ammonium to total N in manure is in principle supported by the ranges reported by Van Kessel and Reeves (2002). The organic leaf litter nitrogen is quickly decomposed and added to the ammonium pool of the soil. The C part of the organic manure is allocated to the leaf litter C pool (i.e., an easily degradable organic pool that can be left on the soil surface or incorporated into the soil column by tillage), with a fixed C:N ratio of 14.5 (IPCC, 2019). Total fertilizer amounts (i.e., mineral fertilizer and manure) are applied either completely at sowing or split into two applications per growing season. Manure is always applied at the first application event at sowing. Only when total combined fertilizer inputs (manure and mineral N) exceed 5 g N m−2 is half of the total fertilizer applied in a second application as mineral fertilizer, which is applied after 40 % of the necessary phenological heat sums to reach maturity have been accumulated.
2.2 Simulation protocol
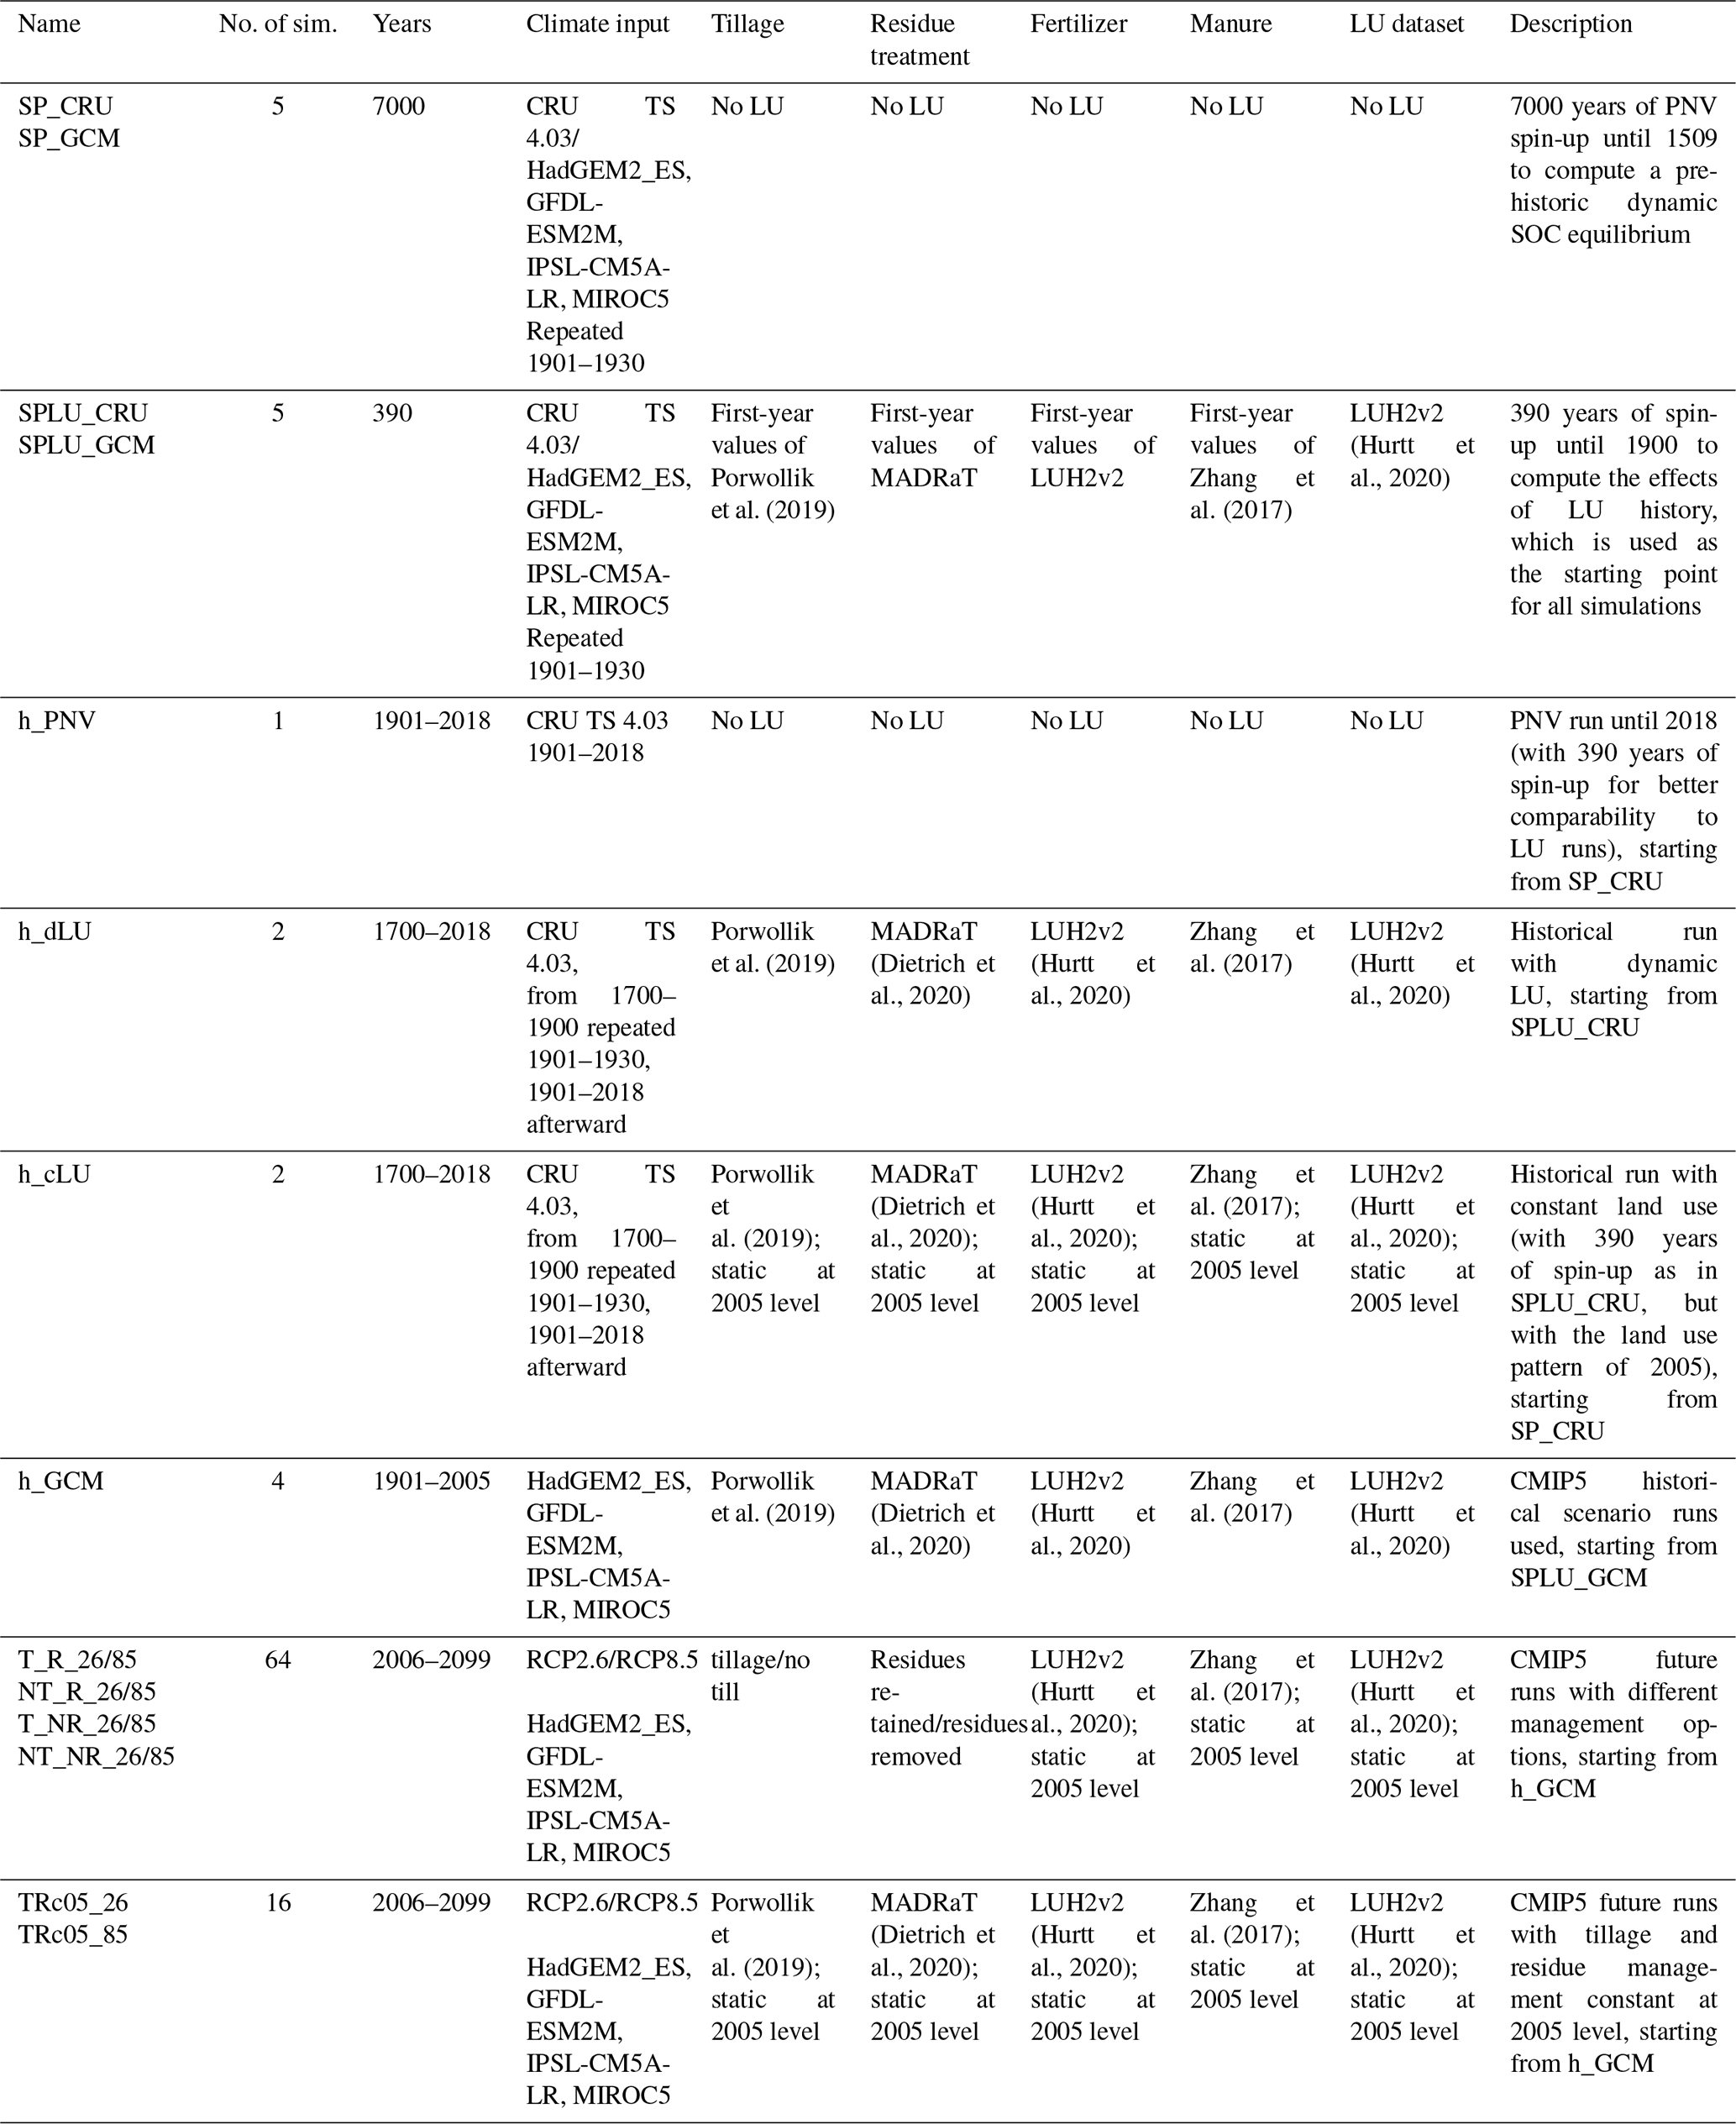
A list of the simulations carried out for this study is summarized in Table 1. An initial spin-up simulation per general circulation model (GCM) and Climate Research Unit gridded Time Series (CRU TS) climate data of 7000 years is conducted to bring SOC stocks into a dynamic prehistoric equilibrium (SP-GCM/SP-CRU), in which the first 30 years of weather data are cyclically recycled, mimicking stable climate conditions. A second GCM-specific spin-up simulation to introduce land use dynamics starts in 1510 so that cropland older than that has reached a new dynamic equilibrium by 1901 when the actual simulations start and land use history is accounted for otherwise. Simulations were run for four groups: (a) historical runs from 1901–2018 using CRU TS version 4.03 climate input (Harris et al., 2020) and inputs on historical management time series (which is subject to the same spin-up procedures as the GCM-specific simulations), (b) historical simulations from 1901–2005 with climate inputs from the four GCMs and historical management time series, (c) future simulations using projections of the four GCMs for the Representative Concentration Pathways RCP2.6 (low radiative forcing) and RCP8.5 (high radiative forcing) and four different stylized management settings – conventional tillage and residues retained (T_R), conventional tillage and residues removed (T_NR), no till and residues retained (NT_R), and no till and residues removed (NT_NR) – and (d) simulations as in (c) but with [CO2] held constant at the level of the year 2005 (379.8 ppmv) that are used to quantify the CO2 effect. All other inputs (land use, N fertilizer, manure) for all future simulations were also held constant at the year 2005 values. In future simulations, we accounted for unlimited water supply from resources available for irrigation. Additionally, the rainfed-to-irrigated cropland pattern was held constant at the year 2005 pattern. An additional simulation per GCM was conducted for which all inputs, as well as management assumptions, are static after 2005. These are used to analyze the business-as-usual case under constant land use (h_cLU). To compare the results to literature values on the maximum potential of global SOC stocks without land use, an additional simulation with potential natural vegetation (PNV) was conducted, with all land assumed to be natural vegetation with internally computed vegetation composition and dynamics.
Table 1Overview of the different simulations conducted for this study. For more details and the purposes of the simulation, see the text. No LU: no land use, PNV: potential natural vegetation.
2.3 Model inputs
We created input datasets for an explicit representation of land use, fertilizer, manure, and residue management using the MADRaT tool (Dietrich et al., 2020). Historic land use patterns of shares of physical cropland, also separated into an irrigated and rainfed area, as well as mineral fertilizer data (application rate per crop in g N m−2 a−1) for the period of the years 1900 to 2015, are based on the Land-Use Harmonization (LUH2v2) data (Hurtt et al., 2020), which provide fractional land use patterns for the period of 850–2015 as part of the Coupled Model Intercomparison Project – CMIP6 (Eyring et al., 2016). Manure application rates for the period 1860–2014 are based on Zhang et al. (2017) and account for organic N. With MADRaT, we were also able to produce data on CFT-specific (CFT: crop functional type) fractions of residue rates left on the field (recycling shares) for the period 1850–2015. We generated data on residue recycling shares in 5-year time steps for the period 1965–2015 and interpolated linearly between time steps to get an annual time series. Between 1850 and 1965, default recycling shares for cereals of 0.25, for fibrous of 0.3, for non-fibrous of 0.3, and no use of 0.8 were assigned to 1850 and linearly interpolated to the values of 1965. Cereals include temperate cereals, rice, maize, and tropical cereals; fibrous crops include pulses, soybean, groundnut, rapeseed, and sugarcane; non-fibrous crops include temperate roots, and tropical roots; and no-use crops include sunflower, others, pastures, bioenergy grasses, and bioenergy trees. Information on conventional tillage and conservation agriculture (no till) management was based on Porwollik et al. (2019) for the period 1974–2010. Before 1974, conventional tillage was assumed as the default management on all cropland. We assume one tillage event after initial cultivation of natural land, independent of the tillage scenario. This assumption does not affect the results of future projections as we constrain our analysis to cropland that is already cultivated in 2005.
Historical simulations were driven using the CRU TS version 4.03 climate input (Harris et al., 2020) from 1901 to 2018. Since this dataset does not provide data before 1901, the 30-year climate from 1901 to 1930 was used repeatedly for spin-up simulations covering the period before 1901. Data on [CO2] were taken from ice core measurements (Le Quéré et al., 2015) and the Mauna Loa station (Tans and Keeling, 2021). Future simulations from 2006–2099 used climate scenarios from four GCMs taken from the Coupled Model Intercomparison Project Phase 5 (CMIP5) in bias-adjusted form as provided by the ISIMIP2b project (Frieler et al., 2017; Hempel et al., 2013): HadGEM2-ES, GFDL-ESM2M, IPSL-CM5A-LR, and MIROC5 for both a weak climate forcing (Representative Concentration Pathway – RCP – 2.6) and a strong climate forcing (RCP8.5) with corresponding [CO2] levels. The GCM datasets provide inputs for air temperature, precipitation, radiation, and [CO2]. The historic period for these GCM-specific simulations was based on bias-adjusted data from the GCMs rather than on CRU data to avoid inconsistencies at the transition between historic and future periods. Land use change in the future was not analyzed in this context, as the SOC potential of the current agricultural area was the focus of this investigation so that land use patterns after 2005 were held constant after 2005. All results are presented as averages across the ensemble of climate models per RCP unless stated otherwise. Additional simulations with constant [CO2] for both RCP2.6 and RCP8.5 allow for the isolation of CO2 fertilization effects. Conventional tillage starts in 1700. For the period 1700–1850, the residue extraction rate of the year 1850 is assumed. The degree to which tillage affects soil properties and processes depends on the tillage intensity, which is a combination of tillage efficiency and mixing efficiency. The fraction of residues submerged (tillage efficiency) by tillage is set to 0.95. The mixing efficiency for tillage management is set to 0.9, representing a full inversion tillage practice, also known as conventional tillage (White et al., 2010). The effects of both mixing and tillage efficiency are described in detail in Lutz et al. (2019a). The fraction of residues harvested in the case of residue extraction is 70 % of all aboveground residues (with the remaining 30 % of aboveground residues and all roots left on the field). In the case without residue harvest, 100 % is left on the field, and only the harvested organs (e.g., grains) are removed.
2.4 Data analysis and metrics
Our analysis is based on simulated changes in cropland SOC stocks as well as the contributing processes, including the turnover rate, heterotrophic respiration, litterfall, and the net primary production (NPP) of cropland areas. NPP is calculated following Schaphoff et al. (2018).
The turnover rate for cropland is calculated as
with mtrSOC,agr as the mean turnover rate for cropland SOC (% a−1), SOCagr as the SOC content for cropland (g), and rhagr as the heterotrophic respiration for cropland (g a−1).
Decomposition of organic matter pools follows the first-order kinetics described in Sitch et al. (2003). Total heterotrophic respiration (Rh) accounts for 60 % of directly decomposed litter (Rh,litter) and respiration of the fast and slow soil pools (decomposition rate of 0.03 and 0.001 a−1, respectively). From the 40 % remaining litter pool, 98.5 % is transferred to the fast soil C pool and 1.5 % to the slow soil C pool.
Cropland litterfall (Clitterfall,agr; g C a−1) is calculated by considering root, stem, and leaf carbon as a function of residue recycling shares:
with Croot,CFT being the C pools of crop roots per CFT, Cleaf,PFT the C pool of crop leaves per CFT, Cstem,PFT the stems and mobile reserves per CFT, fres,CFT the residue fraction which is returned to the soil per CFT, and fcell,agr the fraction of agricultural area of the cell. The h_dLU_cropland scenario uses the results from the h_dLU simulation and accounts for the cropland SOC only, by taking the cropland area at the specific time point into account. The h_dLU_area05 scenario, on the other hand, also uses the results from the h_dLU simulation as described in Table 1 but accounts for all the area which is either already cropland or will become cropland at any point in time until 2005. To calculate the historical losses of SOC from land use change in the h_dLU_area05 scenario, the fraction of SOC under PNV which will become cropland is combined with the historical cropland SOC parts and calculated as
where is the SOC density (g m−2) for PNV area at time step t, which will become cropland in the future, calculated as
where , , and are the SOC densities (g m−2) for the PNV part within the cell, the density for the entire cell, and the agricultural part within the cell, respectively, at time step t (year); areapnv,t and areaagr,t are the corresponding areas of PNV and agriculture (m−2) at time step t; and areacell is the area of the entire cell, which does not change over time. We considered different climatic regions such as tropical wet, tropical moist, topical dry, warm temperate moist, warm temperate dry, cold temperate moist, cold temperate dry, boreal moist, and boreal dry regions, following the IPCC climate zone classification (IPCC, 2006; Fig. S1 in the Supplement), using averaged climate inputs for the period between the years 2000 and 2009. Polar dry, polar moist, and tropical montane regions were excluded from this analysis, as these regions do not include any cropland.
Modeled global average SOC stocks (period 2000–2009 and year 2018) are compared with previous model versions and literature estimates (Table 2). Simulated SOC stocks in LPJmL5.0-tillage2 exhibit higher SOC content compared to the LPJmL5.0 (von Bloh et al., 2018) model version and LPJ-GUESS (Olin et al., 2015), with total average global SOC stocks of 2640 Pg C for simulations with land use (h_dLU) and 2940 Pg C for simulations with PNV only and no land use (h_PNV). The simulated stocks correspond well to estimates by Carvalhais et al. (2014) for global averages but are lower for cropland SOC stocks. Total SOC stocks simulated by LPJmL5.0-tillage2 are 2640 Pg for the entire soil column of 3 m, which is 300 Pg higher than estimates provided by Jobbágy and Jackson (2000). Global SOC for PNV is 2580 Pg for the upper 2 m, which compares well with estimates between 2376 and 2476 Pg provided by Batjes (1996), who reported SOC stocks for the upper 2 m of soil. Global average cropland SOC stocks between the years 2000 and 2009 as well as for the year 2018 for the entire soil column are estimated to be 170 Pg C, which is higher than estimates of 148–151 Pg C by Olin et al. (2015). Zomer et al. (2017) reported cropland SOC stocks of 140 Pg C for the upper 0.3 m of soil, which is higher than the cropland SOC stocks of 75 Pg C simulated for the upper 0.3 m in LPJmL. Ren et al. (2020) reported cropland SOC stocks for the first 0.5 m of soil to be 115 Pg C for the period 2000–2010, which is higher than cropland SOC of 95 Pg C for the upper 0.5 m in LPJmL. Scharlemann et al. (2014) conducted a literature review on global SOC stock and found a wide range of estimates (504–3000 Pg C) and variability across time and space as well as a high dependency on soil depth, with a median global SOC stock of 1460 Pg C. Generally, simulated SOC stocks by LPJmL5.0-tillage2 correspond well to literature and other model estimates.
Table 2Global SOC pools (Pg C) for the LPJmL5.0-tillage2, LPJmL5.0, and LPJ-GUESS model compared to literature estimates. Values are averages for the period 2000–2009, for the year 2018, and the upper 0.3, 1, and 2 m of soil. PNV values are simulations with potential natural vegetation only (no land use); global SOC average includes PNV and land use.
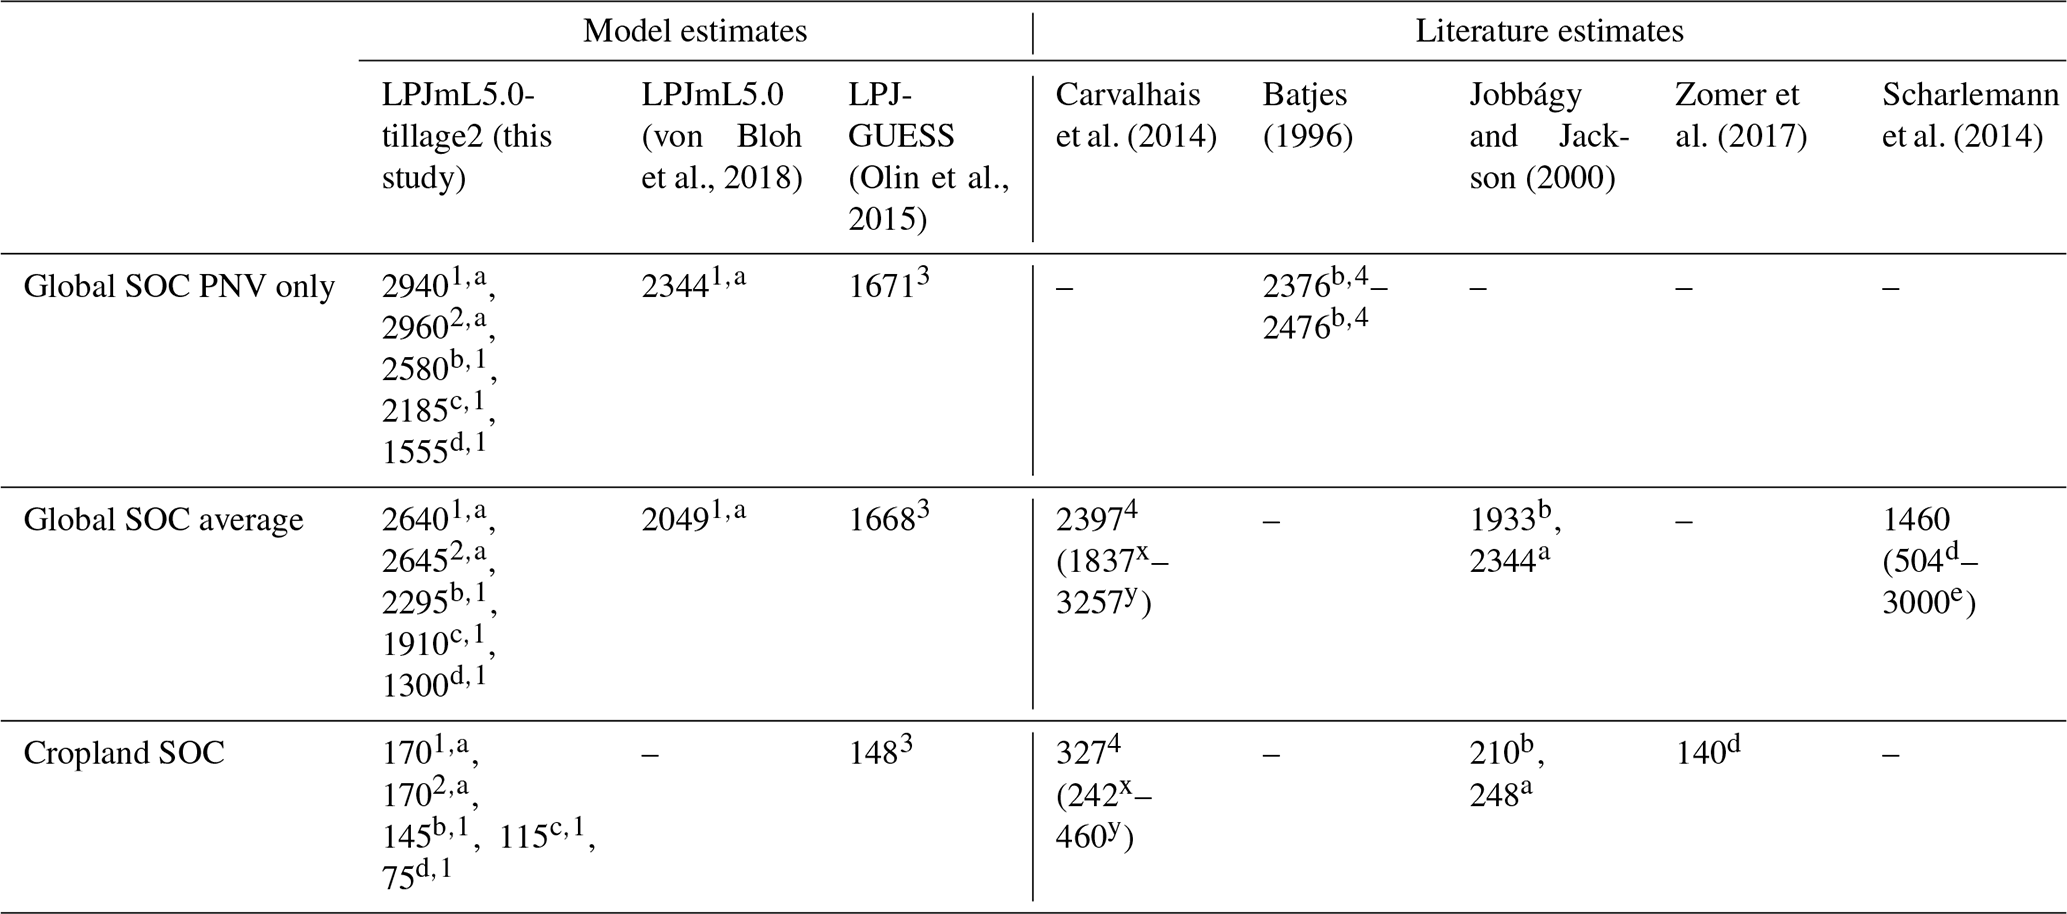
Values are estimates for a the entire soil column, b the upper 2 m of
soil, c the upper 1 m of soil, d the upper 0.3 m of soil, and e not
indicated.
Year of estimate value: 1 2000–2009, 2 2018, 3 1996–2005,
4 not indicated. x Percentile 2.5, y percentile 97.5.
4.1 Historical development of cropland NPP and SOC stocks
During the simulation period, cropland NPP increases in the dynamic LU simulation (h_dLU) from 0.7 Pg C a−1 in 1700 to 4.7 Pg C a−1 in 2018, while cropland SOC increases from 18 Pg C to a total of 171 Pg C (Fig. 2a and c) in the year 2018. The increase in cropland SOC can be explained by an increase in cropland area (Fig. S2B in the Supplement). During the same time, harvested C increases from 0.1 to 2.0 Pg C a−1. The ratio of harvested C to cropland NPP increases with time, especially after the year 1900 (Fig. 2b), as more material is harvested compared to cropland NPP. The aggregated SOC stock on all land that is cropland in the year 2005 declines substantially, especially after the year 1900 (red line in Fig. 2c), which reflects the decline in cropland SOC density (Fig. S2a in the Supplement). We also find that cropland SOC density steadily increases between 1700 and 1950 and decreases since 1950 (Fig. S2a in the Supplement). Simulations with a constant land use pattern of 2005 (h_cLU) for cropland NPP and cropland SOC show no substantial dynamics (Fig. 2a and c). These simulations are not entirely insightful because they do not account for the historical increase in inputs, e.g., fertilizer.
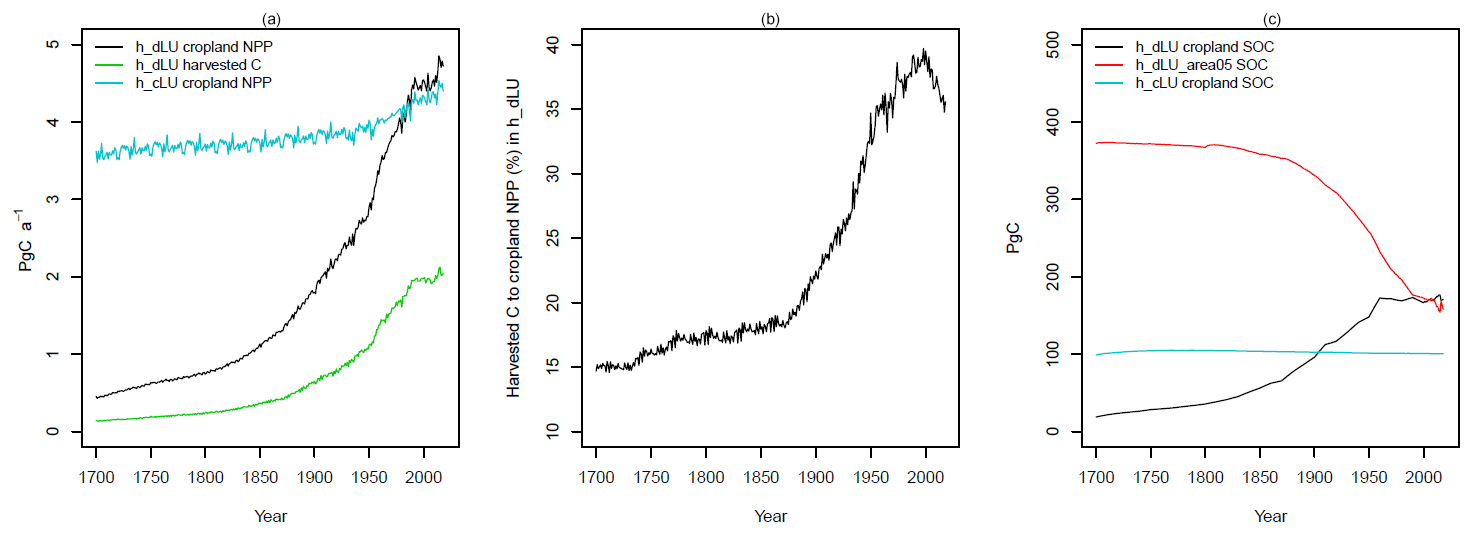
Figure 2Plots for cropland NPP and harvested C (a), percentage of harvested C to cropland NPP in h_dLU (b) and SOC for cropland stocks, and historical SOC losses from LUC (c) for the years 1700–2018 for simulations with transient land use (h_dLU), constant land use of 2005 (h_cLU), transient land use, and SOC development from land use change including cropland area and historical PNV area that will be converted until the year 2005 (h_dLU_area05).
In contrast to the scenario with dynamic land use and the ones with constant land use, the h_dLU_area05 scenario describes a combination of historical cropland SOC and historical SOC of natural vegetation (calculated as described in Eqs. 4 and 5), which is or has been cropland until the year 2005. This describes the SOC dynamics of all land that is subject to historical land use change (LUC) (Fig. 2c). Loss of historical SOC is calculated as the difference between the years 1700 and 2018 on the land area that was cropland at any point in time (Fig. 2c, red line). Through this approach, we calculate a total historical SOC loss of 215 Pg C. Cropland SOC stocks increase over time (Fig. 2c, black line), reflecting the increase in cropland area. PNV has a higher SOC density, and therefore SOC stock, before the conversion to cropland (Fig. S2a in the Supplement). For the calculation of SOC loss, we only considered the area that is converted from PNV to cropland at any point in time between 1700 and 2018 in post-processing according to Eqs. (4) and (5). Because SOC density is generally lower in cropland compared to PNV (Fig. S2a in the Supplement), SOC is lost after conversion (Fig. 2c, red line).
4.2 Future soil carbon development with idealized management under climate change
Future cropland SOC stock development was analyzed considering two different radiative forcing pathways (RCPs) with four different climate scenarios (GCMs) per RCP and four idealized management assumptions (Table 2). To estimate the SOC sequestration potential on current cropland and to exclude the influence from LUC, the cropland area was kept constant at the year 2005 pattern. Results for future SOC development show that the maximum decrease in SOC stocks on current global cropland area between the year 2005 and the end of the century occurs in the scenario with no till applied on global cropland, no residues retained, and RCP8.5 climate (NT_NR_85). Total cropland SOC loss for this scenario is evaluated as 38.4 Pg C, or 28.1 % in relative terms compared to the SOC stocks in the year 2005. All management systems that extract residue from the field show a strong decrease in cropland SOC stocks, independent of the climate scenario (Fig. 3b). Differences for cropland SOC development between different tillage systems as well as between the two radiative forcing pathways RCP2.6 and RCP8.5 are small. Management systems that retain residue on the field after harvest show the smallest reduction in cropland SOC stocks, with a maximum reduction of 5.1 Pg C (equivalent to 3.8 % decline) in the T_R_26 management system. Differences between GCM-specific climate scenarios or radiative forcing pathways (RCPs) were small in comparison to differences in residue management assumptions for SOC, turnover rates, and litterfall rates (Fig. 3) but larger than differences in assumptions on tillage systems. Only for agricultural NPP (Fig. 3a) were differences in radiative forcing pathways the main determinant of NPP dynamics, followed by GCM-specific climate scenarios.
Table 3Summary of absolute and relative global cropland SOC stock change between the years 2006 and 2099 for different management systems for RCP2.5 and RCP8.5 as averages across all four GCMs.

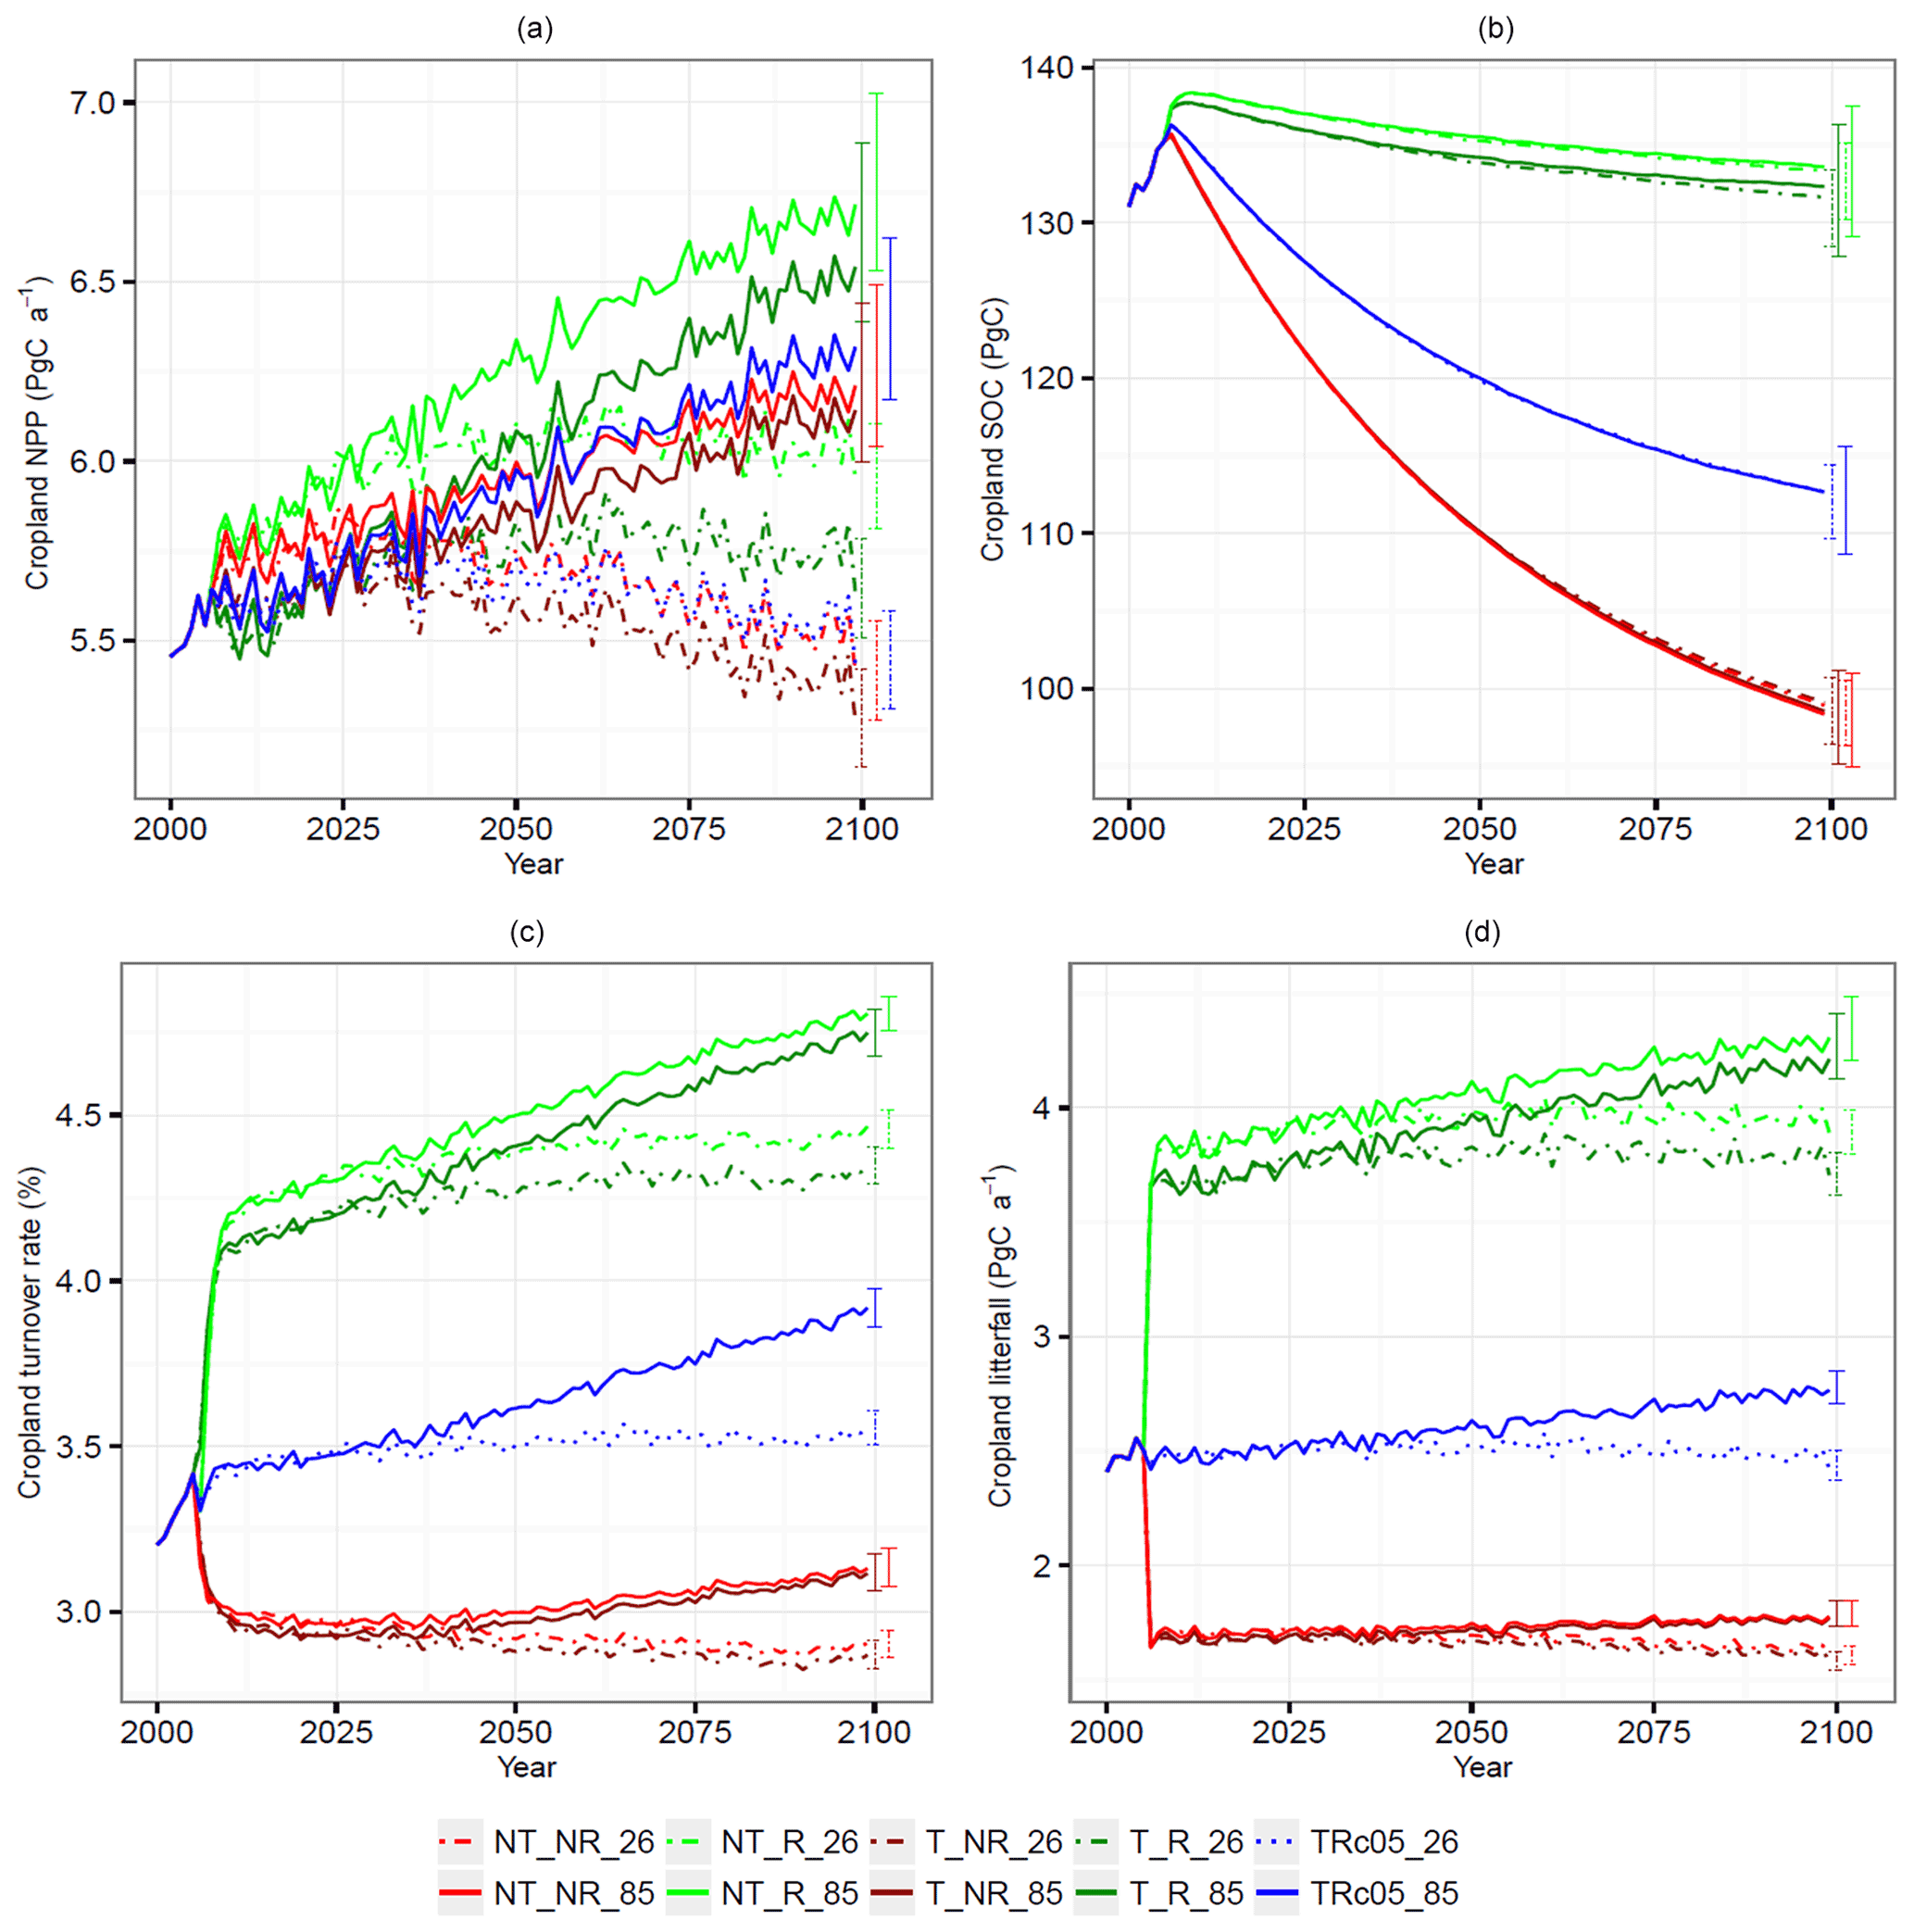
Figure 3Global sums for cropland for NPP (a), SOC (b), turnover rate (c), and litterfall (d) from 2000–2005 for default management inputs and from 2006–2099 under constant cropland area of 2005 for five different management scenarios and two RCPs. Presented are the mean values across all four GCMs as lines. The spread across all GCMs is depicted as bars in the year 2100. The numbers _26 and _85 describe the climate forcing RCP2.6 (e.g., TRc05_26) and RCP8.5 (e.g., TRc05_85). Green: residues retained (R), red: residues removed (NR), dashed: RCP2.6, solid: RCP8.5, light color: no till (NT), dark color: tillage (T). Tillage and residue management are held constant at 2005 level in TRc05: tillage and residues left on the field (T_R), tillage and residues removed (T_NR), no till plus residues left on the field (NT_R), and no till and residues removed (NT_NR). Dynamics prior to 2005 (all scenarios equal) mostly show the expansion of cropland until 2005 so that total SOC increases because the area increases. Turnover rates between 2000 and 2005 increase because decomposition rates are high on freshly deforested land.
Stocks of cropland SOC and turnover rates (Fig. 3c) initially increase in systems that retain residues, such as T_R and NT_R, after the change in management after the year 2005 (Fig. 3b and c), as more residual C is added to the soil column in comparison to the historic residue removal rates (Fig. 3d). Turnover rates are higher for the high radiative forcing pathway RCP8.5 in comparison to RCP2.6. The simulated cropland NPP (Fig. 3a) is sensitive to the radiative forcing, as the level of NPP is higher in the high-end RCP8.5 scenario and lower in the lower-end RCP2.6 scenario. This is because of the strong response of NPP to CO2 fertilization, which overcompensates for the climate-driven reduction in NPP (compare Fig. S3 in the Supplement). NPP is less sensitive to the assumptions on tillage practices in comparison to the effects of assumptions on residue management. The no-till and residue system (NT_R) results in the highest NPP mainly due to water-saving effects caused by the surface litter cover, which reduces evaporation from the soil surface and at the same time increases infiltration of water into the soil. NPP increases steadily until 2099 in RCP8.5 scenarios because of the CO2 fertilization effects (compare Fig. S3 in the Supplement). In RCP2.6, NPP first slightly increases and then decreases until the end of the century in all tillage and residue scenarios. However, the ranking of management effects is insensitive to the radiative forcing pathway: no till and residues (NT_R) results in the highest NPP, tillage and no residues (T_NR) results in the lowest values.
4.3 Regional cropland SOC analysis
Simulation results show that globally aggregated SOC stocks on current cropland decline until the end of the century for all management systems, but there are regional differences (Fig. 4). We find that in some regions, cropland SOC can increase until the end of the century, even though global sums indicate a total decline. For cropland SOC density, increases between the years 2006 and 2099 can be found for T_R and NT_R management systems for more than a third of the global cropland area, most clearly in regions in Europe, India, Pakistan, Afghanistan, southern Chile, southern Mexico, eastern China, and the southeastern USA (Fig. 4c and d). Historically, regions which have already shown an increase in cropland SOC density from 1900 until today, such as France and Pakistan, or a decrease, such as Canada and Argentina, also tend to continue this development in the future (see plots in Fig. 4 for exemplary cells). In systems in which residues are not returned to the soil (T_NR and NT_NR), global cropland SOC density change is dominated by a decline.
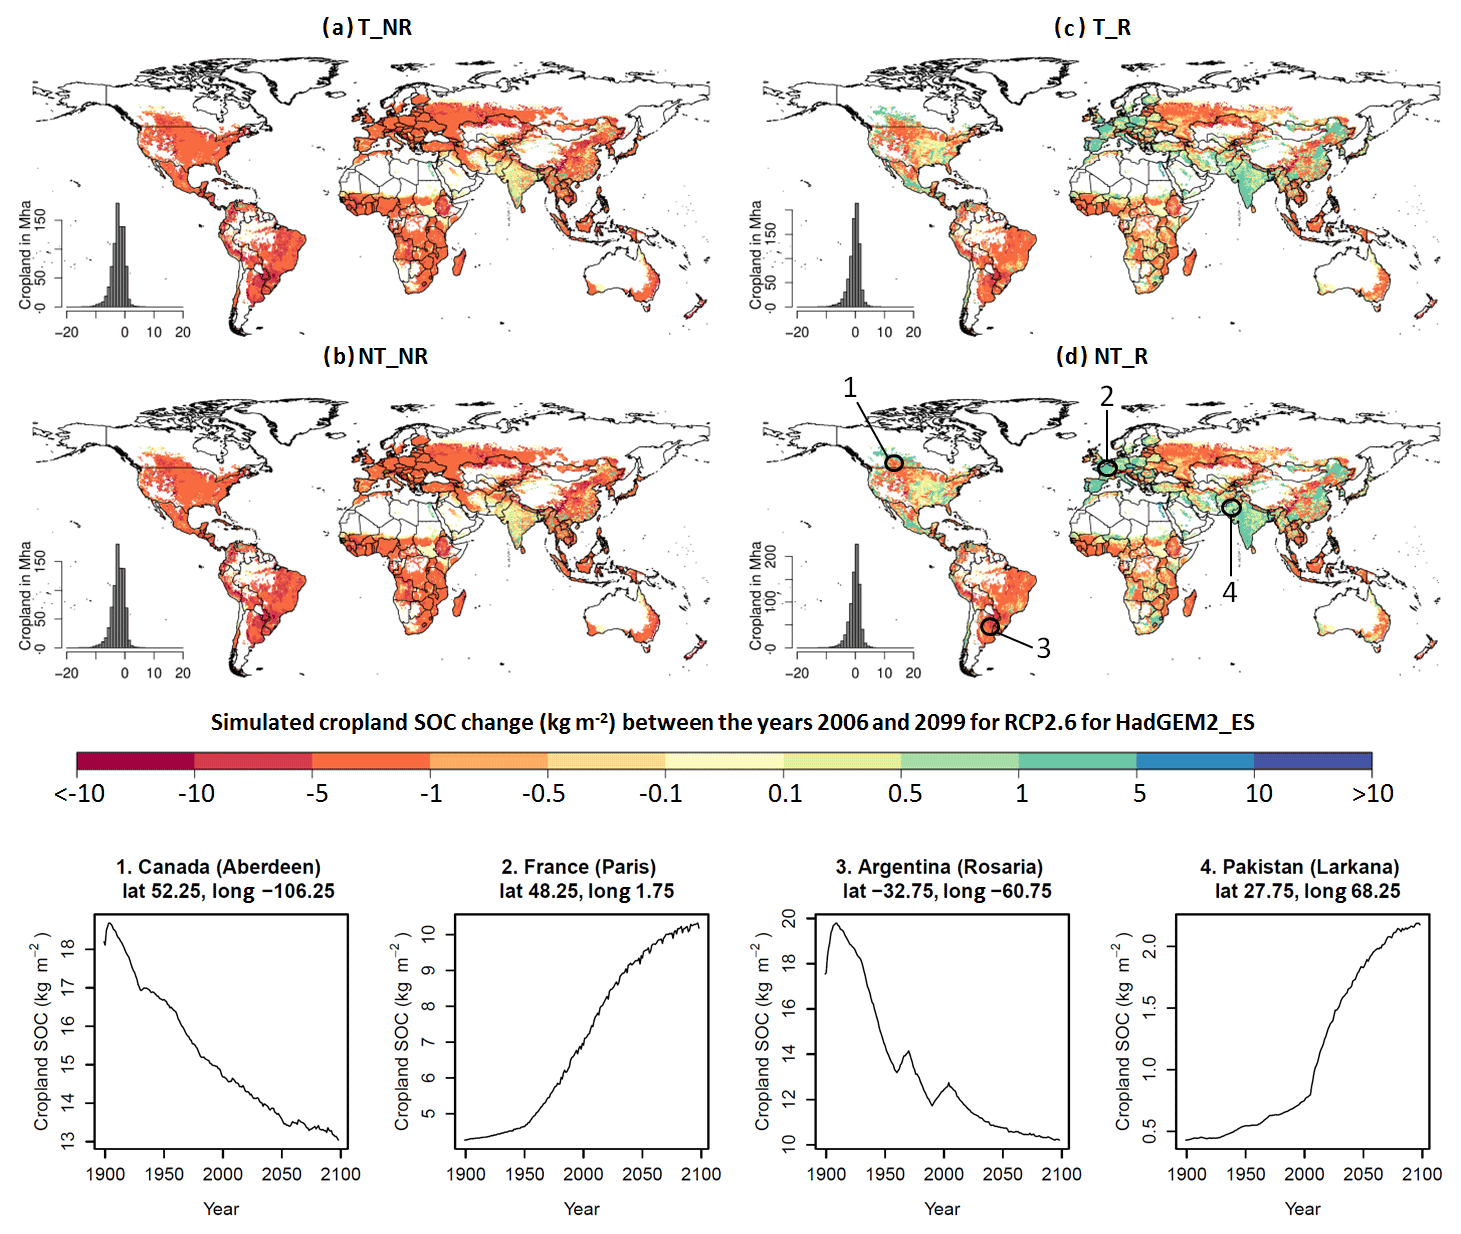
Figure 4Simulated cropland SOC change (kg m−2) between the years 2006 and 2099 (kg m−2) for RCP2.6 for GCM HadGEM2-ES for the four different management options (T_R, NT_R, T_NR, and NT_NR). Plots 1–4 show examples of SOC development (kg m−2) from the years 1900 to 2099 for different explanatory regions as shown on the map (d) (NT_R). The difference maps of affected change categories between RCP2.6 and RCP8.5 are shown in Fig. 5. Maps for GFDL-ESM2M, IPSL-CM5A-LR and MIROC5, and RCP8.5 are in the Supplement (Figs. S7 to S13).
Results for different climatic regions suggest that the difference between RCP2.6 and RCP8.5 radiative forcing only plays a minor role for cropland SOC stock development (Fig. 5). Findings suggested that a positive median increase in cropland SOC density between the years 2006 and 2099 can be found in warm temperate moist, warm temperate dry, and boreal regions for RCP2.6 (GCM average) for the tillage and residue (T_R) and the no-till and residue (NT_R) management systems (Fig. 5a). The total aggregated cropland SOC change for each climate region depends on the cropland extent of the region. The smallest amounts of cropland are found in boreal moist and dry regions, which results in a total cropland SOC stock change of negligible size (Fig. 5b and d). Total increases in cropland SOC stocks can be found for both RCP2.6 (Fig. 5a and b) and RCP8.5 (GCM average) (Fig. 5c and d) for tropical dry, warm temperate moist, and warm temperate dry regions in the tillage and residue (T_R) and the no-till and residue (NT_R) management systems. For all regions across all simulations, in management systems in which residues are not returned to the soil, cropland SOC stocks decrease. The highest absolute losses of total cropland SOC stocks for these systems (T_NR and NT_NR) can be found in cold temperate dry climates, followed by tropical moist and warm temperate dry regions, which are the regions with major cropland shares.
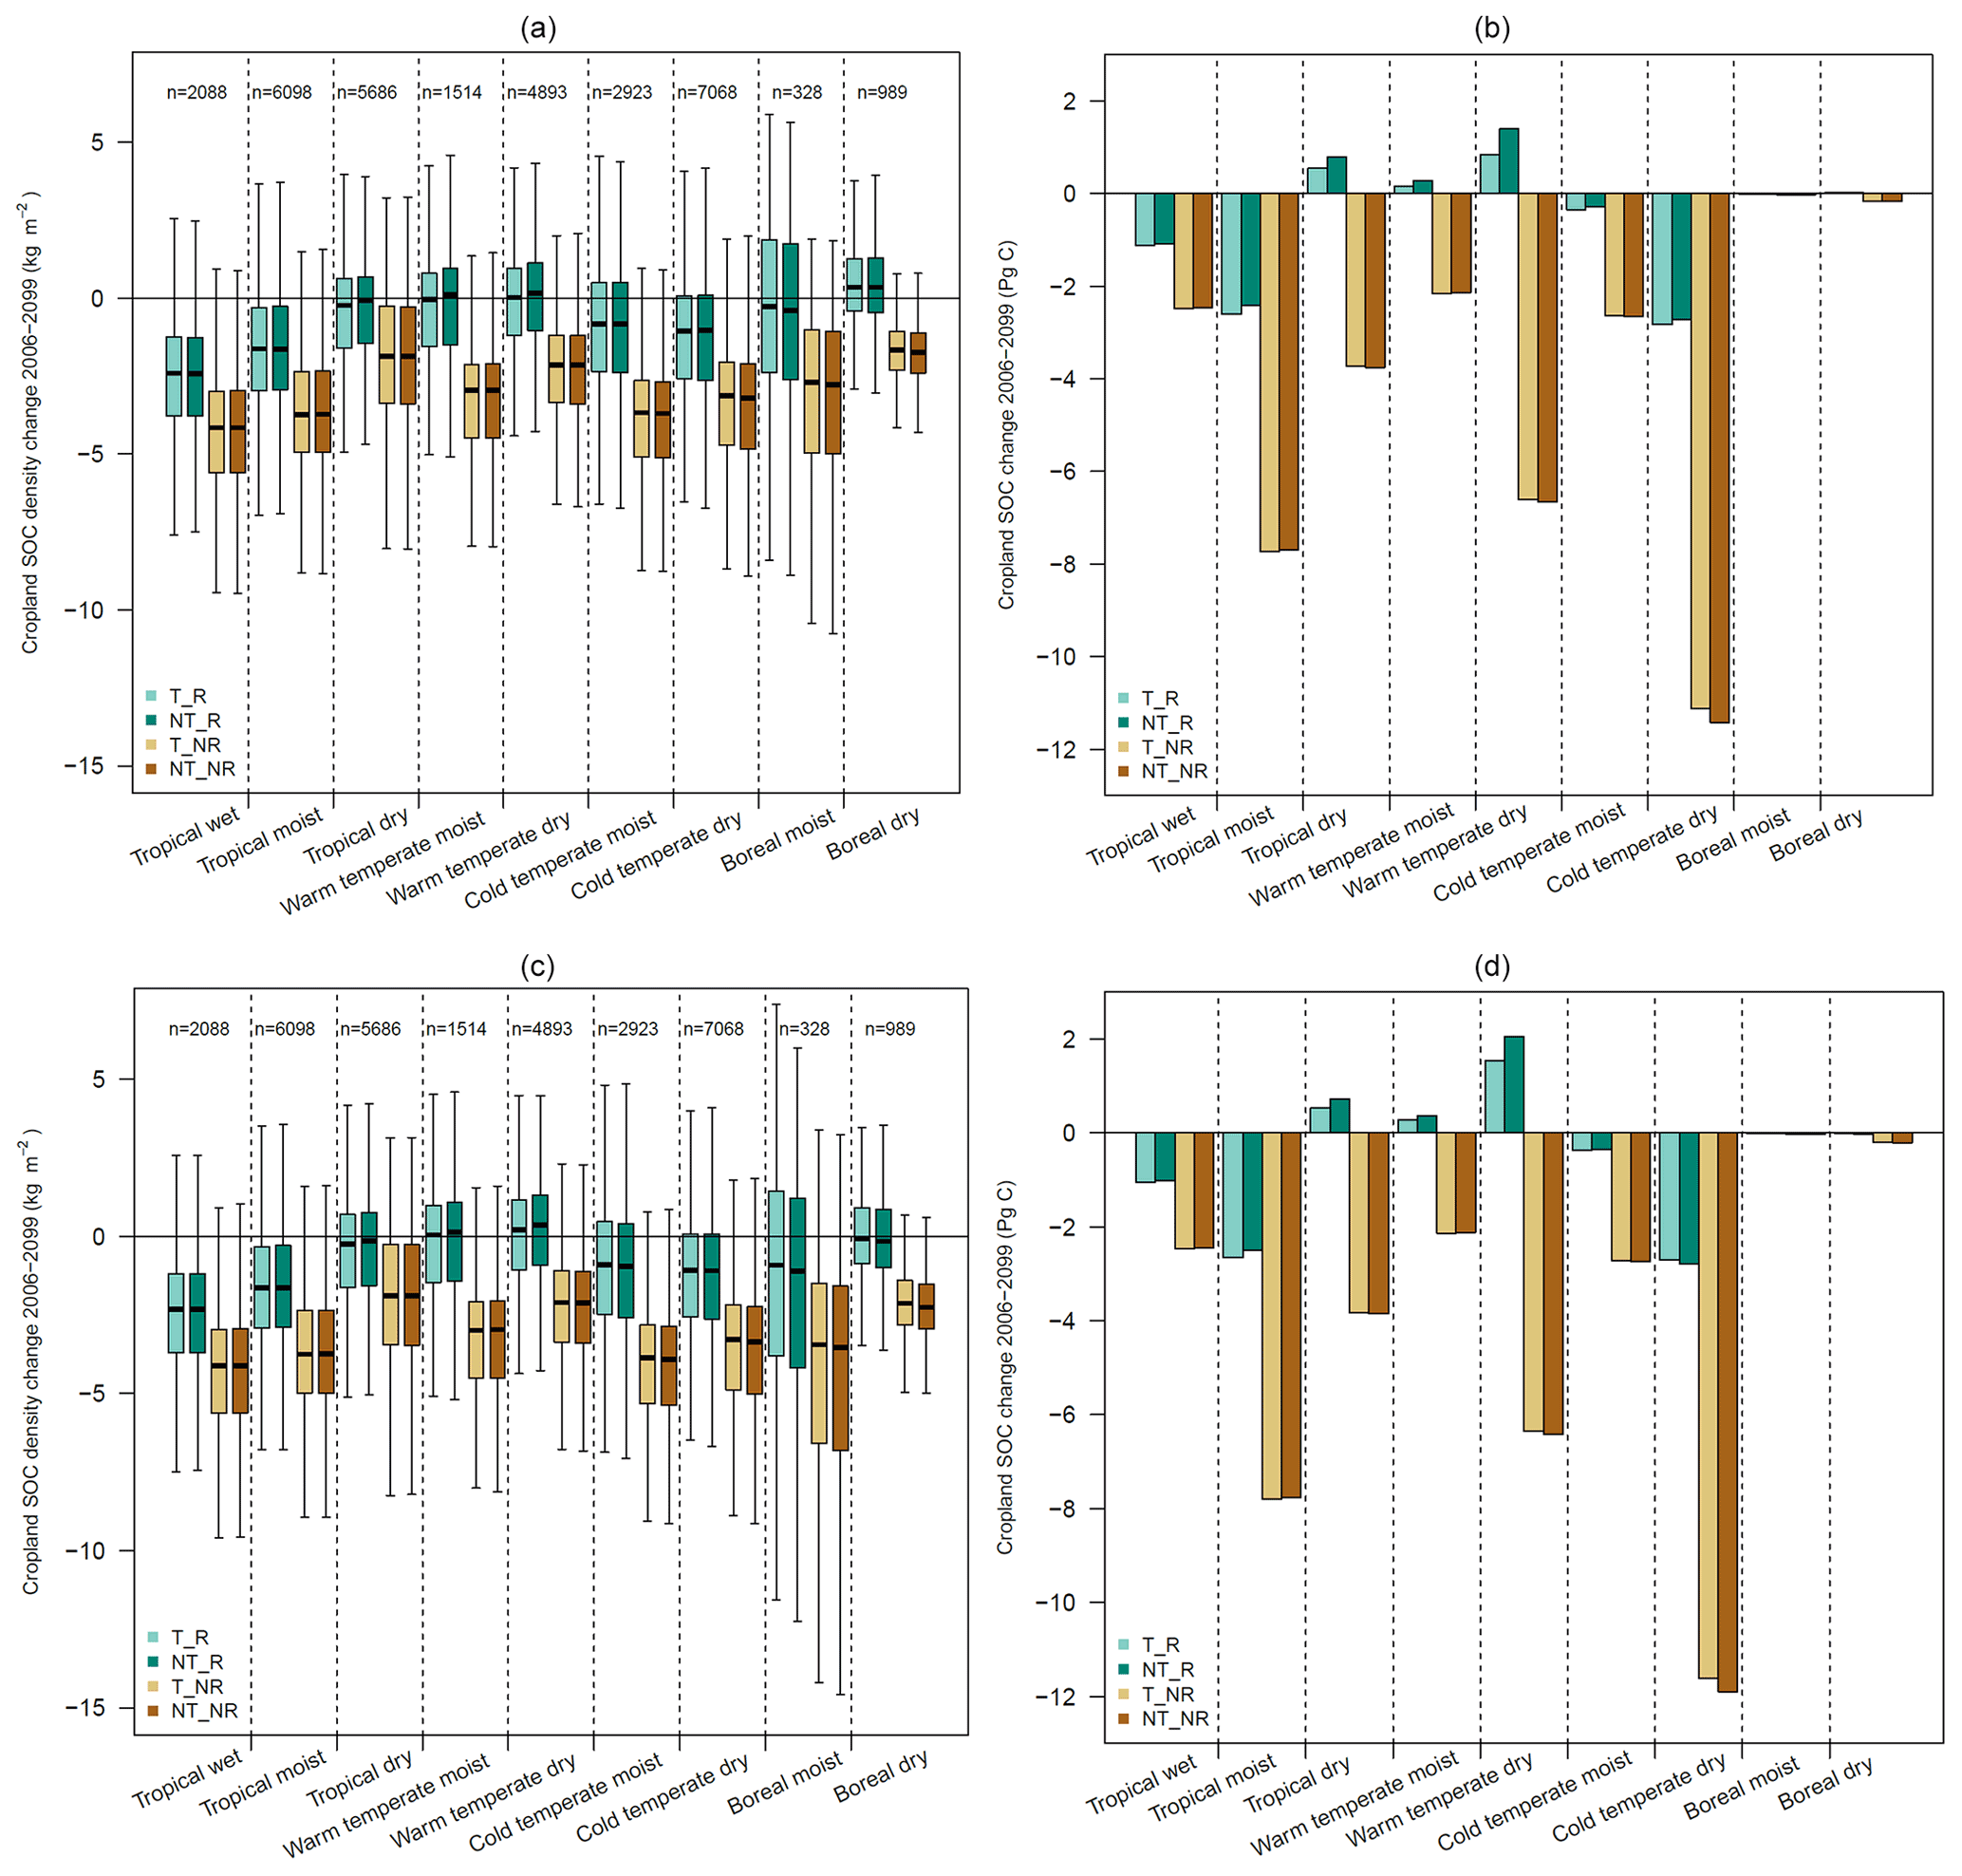
Figure 5Box plots of cropland SOC density change (kg m−2) and bar plots of total cropland SOC change (Pg C) between the years 2006 and 2099, averaged across the four GCMs (HadGEM2_ES, GFDL-ESM2M, IPSL-CM5A-LR, MIROC5) in RCP2.6 (a, b) and RCP8.5 (c, d) for the climatic regions classified by the IPCC (2006) and the four management systems T_R, NT_R, T_NR, and NT_NR. The same plots for each GCM can be found in Figs. S5 and S6 in the Supplement; n is the number of cropland cells included in each climate region.
Regional results also indicate stronger differences between GCM-specific climate scenarios within the same radiative forcing pathway (RCP). The highest positive cropland SOC stock response can be found for GCM GFDL-ESM2M in both RCP2.6 and RCP8.5 for the tillage and residue (T_R) and the no-till and residue (NT_R) systems for warm temperate dry climates, while the positive response for tropical dry and warm temperate moist climates is lower compared to the other three GCMs (compare Fig. S5D and S6D in the Supplement). Results for the IPSL-CM5A-LR climate scenarios for both RCP2.6 and RCP8.5 generally show the most negative response for cropland SOC density change and cropland SOC stock change, followed by HadGEM2_ES.
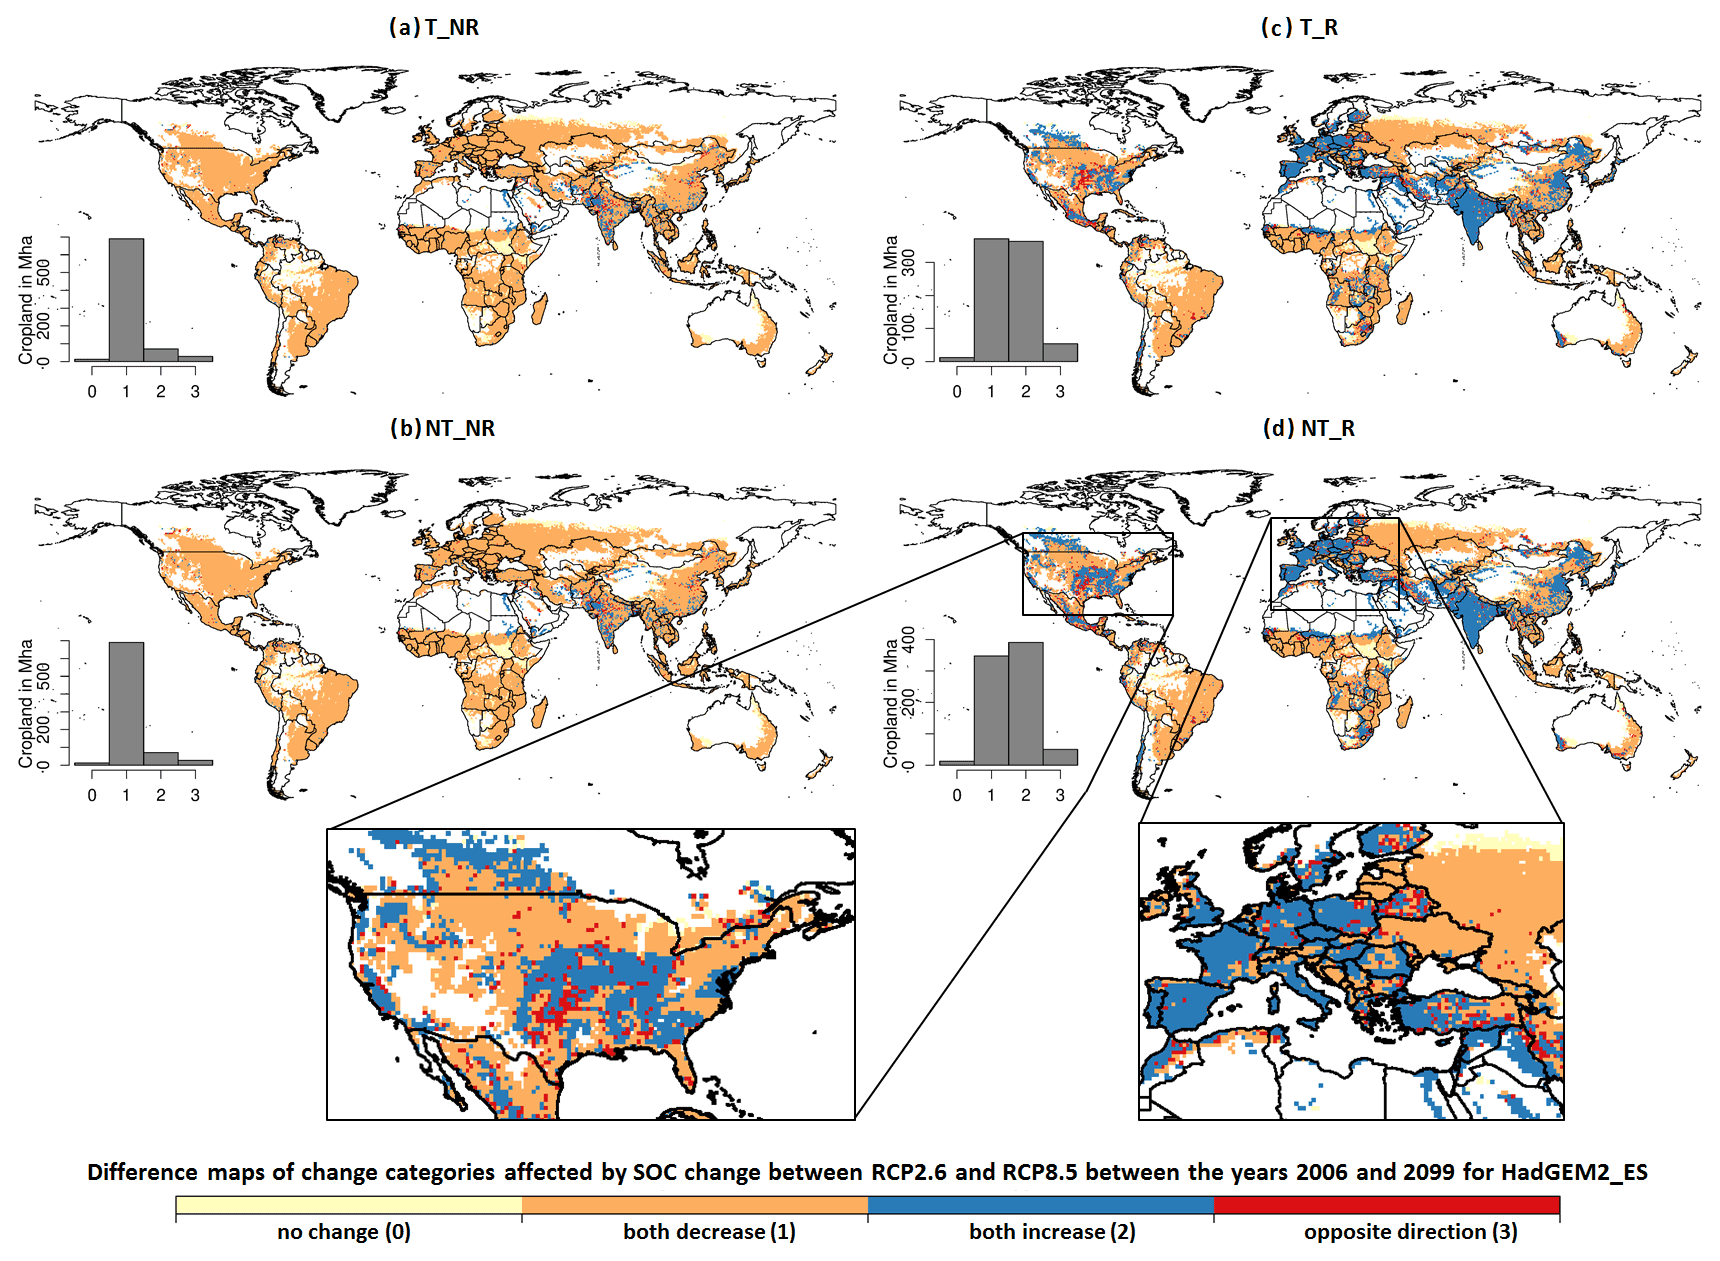
Figure 6Difference maps of change categories for cropland SOC density change between RCP2.6 and RCP8.5 from the year 2006 until 2099 for GCM HadGEM_ES in each management system. Orange areas indicate a reduction in cropland SOC density between the years 2006 and 2099 in both RCPs, and blue areas show an increase in SOC density; in light yellow areas no change occurs, and for red areas SOC density change occurs in opposite directions in RCP2.6 and RCP8.5. The numbers in brackets (0 to 3) correspond to the categories in the histogram.
The comparison of cropland affected in RCP2.6 and RCP8.5 indicates that most regions show effects with the same direction of response in SOC density, so either it decreases or increases in both RCP2.6 and RCP8.5, which is highlighted by the blue and orange regions in Fig. 6. Red cells, which indicate that the effects in both RCPs go in the opposite direction, can only be found in a few regions, e.g., the United States and Turkey. In total, between 50 and 53 million hectares (Mha) of cropland show the opposite directions globally for the tillage and residue (T_R) and the no-till and residue (NT_R) systems, while this is halved (between 27 and 29 Mha) for the tillage and no residue (T_NR) and no-till and no residue (NT_NR) management system.
5.1 SOC development in the past and losses due to land use change
Historical simulations show that the conversion of natural land to cropland caused SOC losses of 215 Pg C between the years 1700 and 2018 (Fig. 2c). Soil C density and NPP in natural vegetation are higher compared to those found in croplands, which results in C losses after conversion of natural land to cropland. NPP in croplands is often lower compared to NPP in natural vegetation, as the cultivated period is typically shorter than the vegetative period in which natural vegetation is productive so that cultivated plants have less time to accumulate C. Further, cropland is cultivated and crops are harvested, which results in the extraction of NPP in the form of harvested material; this leads to a further decline of SOC stocks. Cropland expansion is the main driver for increases in total cropland SOC stocks, as cropland SOC density steadily increased since the year 1700 starting at 7 kg m−2 and reached its maximum in the year 1960 at 13 kg m−2, but since then cropland SOC density has decreased down to 11 kg m−2 today (Fig. S2a in the Supplement). SOC density on cropland showed this trend, even though fertilizer use increased since the 1960s, which was found to be able to promote SOC sequestration, especially in temperate regions (Alvarez, 2005). Since the 1960s, cropland expansion has slowed down, but global yields have, on average, more than doubled (Pingali, 2012; Ray et al., 2012; Wik et al., 2008). Ren et al. (2020) show that historical cropland SOC increase was mainly attributed to cropland expansion, which is in agreement with the findings here. The ratio of harvested C to cropland NPP increases with time (Fig. 2b) so that the increase in yields does not have a positive effect on cropland SOC, as more and more C is extracted from the soil in the form of harvested material.
It was estimated that conversion of natural land to cultivated land can result in SOC loss of 30 % to 50 % (Lal, 2001). Sanderman et al. (2017) estimated historical global SOC losses of natural land to cropland conversion as 133 Pg C, of which most of the losses occurred in the last 200 years. Pugh et al. (2015) modeled C emissions from LUC accounting for agricultural management, such as harvesting and tillage, and found maximum C losses in vegetation and SOC of 225 Pg C since the year 1850. Le Quéré et al. (2018) also estimated the C flux to the atmosphere due to LUC, including deforestation, to be 235 Pg C (±95) since the year 1750.
5.2 Future cropland SOC development on current global cropland
Future SOC stocks on current cropland depend on climate and management. We find that current cropland remains a source of C, even though the decline of SOC on current cropland can be reduced through management. The most efficient measure to reduce SOC losses on cropland is residue management. In the model, SOC is formed by C transfer from litter to the soil through decomposition fluxes (Schaphoff et al., 2018), bioturbation, or tillage practices (Lutz et al., 2019a). Residues left on the field are added to the litter C pool, where they are subject to decomposition. Root C is added to the belowground litter pool, with a specific decomposition according to soil temperature and moisture conditions. Stubbles and root biomass enter the litter pool after harvest, while the amount of residue extracted or retained depends on crop productivity. The addition of fresh material from crop residues increases the turnover rate in the soil, as this material is more easily decomposed than the remaining SOC stocks from the historical natural ecosystems. In the model, SOC decomposition is only driven by the temperature and moisture of the litter and soil layers, whereas the chemical composition of the residues is not taken into account. While the N content of the available material can strongly influence the decomposition and humification of residues and the formation of SOM (Hatton et al., 2015; Averill and Waring, 2018), this effect is not considered here and should be included in future model development.
The different management aspects show the same ranking in importance under both radiative forcing pathways, and the changes in cropland SOC only differ slightly. Cropland SOC stocks at the end of the century vary only between the two RCPs between −0.6 % and +0.6 % for all four management systems. This is caused by a compensating effect of higher productivity by elevated CO2 under RCP8.5, which counteracts the increase in turnover rates at higher temperatures (see Fig. S3 in the Supplement for comparison with constant [CO2] simulations).
Even though experiments have shown that tillage can reduce SOC stocks significantly compared to no till (Abdalla et al., 2016; Kurothe et al., 2014), tillage management only has small effects on aggregated global cropland SOC in our simulations. Tillage practices account for differences in cropland SOC stocks of 0.9 % and 1.3 % between T_R and NT_R in 2099 for RCP8.5 and RCP2.6, respectively, and less than 0.2 % between T_NR and NT_NR for both RCPs. Differences in SOC stocks on cropland between the tillage systems decrease if residues are not retained on the field. NPP responds more strongly to the tillage system, which is likely to be driven by secondary effects (e.g., no-till management increases soil moisture and nutrient availability from mineralization), but shows no long-term effect on SOC stock development.
With the given complexity in responses to tillage, the application of no tillage has been discussed ambiguously in the literature (Chi et al., 2016; Derpsch et al., 2014, 2010; Dignac et al., 2017; Powlson et al., 2014). The LPJmL5.0-tillage model is capable of reproducing these process interactions and diversity in results well (Lutz et al., 2019a). Tillage systems thus need to be selected based on local conditions, but we find these to be less important than residue management. Given this dependency of the SOC accumulation potential on climatic and management conditions, there are strong regional differences in the response of SOC to changes in management. In line with Stella et al. (2019), who investigated the contribution of crop residues to cropland SOC conservation in Germany and found a decrease in SOC stocks until 2050, if residues are not returned to the soil, we find that large parts of western Europe can indeed increase the SOC stocks under management systems in which residues are retained on the field. Zomer et al. (2017) analyzed the global sequestration potential for SOC increase in cropland soils and found the highest potentials in India, Europe, and the midwestern USA, results which correspond well to our findings. Also, the duration of the historical cultivation of the cropland is an important aspect in the ability to sequester C in current cropland soils. Stella et al. (2019) find the highest SOC sequestration potentials in soils with low SOC stocks (i.e., in highly degraded soils).
5.3 Potential for SOC sequestration on cropland and recommendations for future analysis
For the past years, there has been an ongoing debate on how much SOC can be stored in agricultural soils through adequate management as a climate change mitigation strategy (Baker et al., 2007; Batjes, 1998; Lal, 2004; Luo et al., 2010; Stockmann et al., 2013). For example, globally applied no-till management on cropland was estimated to have an SOC sequestration potential of 0.4–0.6 Gt CO2 a−1 (Powlson et al., 2014). Additionally, the sequestration of SOC can be beneficial to soil quality and productivity and minimize soil degradation (Lal, 2009, 2004). An increase in cropland irrigation can effectively influence SOC development (Trost et al., 2013; Bondeau et al., 2007). In our simulations with LPJmL5.0-tillage2, we find that on current cropland, these sequestration potentials cannot be achieved by varying tillage practices and residue removal rates, even though the residue management system is important for cropland SOC dynamics. At the same time, we account for an unlimited supply of water resources available for irrigation, reducing the constraint on SOC development by limitations from irrigation water. As such, our estimates of SOC development should tend to be optimistic in all regions where irrigation is applied but where water resources are limited.
There is a general uncertainty in how experimental findings can be scaled up, e.g., as demonstrated by a review conducted by Fuss et al. (2018). While process-based modeling as applied here can take environmental conditions into account and can compare different management aspects, it is still subject to various uncertainties. One crucial aspect is the history of land use systems, including the trend in land productivity. Karstens et al. (2020) show that global historical cropland SOC stocks are declining even though cropland inputs are increasing at the same time. Depending on the agricultural management option, it is argued that the maximum sequestration potential is reached after the soil has a new higher equilibrium state, which can be reached after 10–100 years, depending on climate, soil type, and SOC sequestration option (Smith, 2016). The IPCC suggests a default saturation time of the soil sink of 20 years, after which the equilibrium is reached, which then has to be maintained to avoid additional release of CO2 (IPCC, 2006). Increasing cropland SOC in a first step can be achieved by adding more C to the soil than is lost by respiration, decomposition and harvest, and soil disturbance. Maintaining SOC levels on cropland after the soil has reached a new equilibrium will require the application of management strategies that do not deplete SOC. The “4 per 1000” initiative requires annual SOC sequestration on croplands of approximately 2 to 3 Pg C a−1 in the top 1 m of cropland soils, which was criticized to be unrealistic (de Vries, 2018; White et al., 2018). In this analysis, only two management options affecting SOC, tillage treatment and residue management, are considered. High SOC sequestration potentials on cropland are argued to only be achieved by applying a variety of management options, e.g., additional restoration of degraded land (Griscom et al., 2017; Lal, 2003), agroforestry (Lorenz and Lal, 2014; Torres et al., 2010), biochar (Smith, 2016), and biowaste compost (Mekki et al., 2019), which add forms of organic material that increase turnover times of SOC. A combination of these different practices is more likely to achieve higher SOC sequestration rates on cropland (Fuss et al., 2018). Management options that aim at increasing SOC may also affect yields, as they can maintain productivity and ensure yield stability (Pan et al., 2009), but reductions in SOC can also reduce yields substantially (Basso et al., 2018). Additionally, the productivity increase can come with an even stronger increase in harvested material, as demonstrated here, which can lead to a reduction in total cropland SOC. The conversion from natural land to cropland typically causes substantial SOC losses, which stresses the need to further limit land use expansion and thus requires an intensification of land productivity on current cropland. In our analysis, we did not account for the effects of future LUC, but projections show an increase in total cropland area in the future (Stehfest et al., 2019) so that global SOC is expected to further decline.
Further research on agricultural management practices that influence SOC development at the global scale should investigate the impact of cover crops, rotations, irrigation systems, and optimal cultivar choice per region and location (e.g., Minoli et al., 2019) as well as different options for cropland intensification (e.g., Gerten et al., 2020) in a more explicit manner. SOC stabilization mechanisms, such as clay mineral protection and forming of macroaggregates in no-till managed soils (Luo et al., 2016), effects of microorganisms, such as N fixation and phosphorous acquisition from fungi and bacteria, which also regulate plant productivity and community dynamics (Heijden et al., 2008), as well as effects of soil structure (Bronick and Lal, 2005) on SOC dynamics, have not been considered here or in other global process-based assessments and should be taken into account. Plants and associated root systems can reduce surface erosion and water runoff (Gyssels et al., 2005), but losses of SOC from runoff and increased erosion (Kurothe et al., 2014; Naipal et al., 2018) are not considered here either. Residues from plants can influence labile, intermediate, and stable SOC pools through the C:N ratio. Residues with high C:N ratios (e.g., straw) decompose relatively slowly and can increase SOC but reduce N availability to the plants, while residues with low C:N decompose relatively fast and can release N to the soil through mineralization (Macdonald et al., 2018). The speed of residue decomposition can also influence the effectiveness of residues as a soil cover, with effects on soil moisture through infiltration. Impacts of biodiversity and living fauna such as microorganisms on SOC sequestration are not modeled in this analysis, even though they are recognized to have a substantial influence on the dynamics of SOC (Chevallier et al., 2001).
The implementation of such effects is desirable but needs to be assessed with respect to the process understanding, the availability of input data at the global scale, and the availability of modeling approaches (Lutz et al., 2019b). Global-scale modeling approaches, in comparison to local or regional studies, allow for the possibility to identify regional patterns related to SOC sequestration responses with the potential to foster experimental studies in areas not investigated so far but that are relevant for global assessments (Luo et al., 2016; Nishina et al., 2014). They are needed to upscale findings from experimental sites so that the potential of such measures for climate change mitigation can be better understood and climate protection plans can be made with better estimates.
In conclusion, the agricultural management systems analyzed here are not sufficient to increase global SOC stocks on current cropland until the end of the 21st century. The interaction of SOC sequestration and cropland productivity needs to be better disentangled. Additional C inputs from, e.g., manure, cover crops, and rotations are needed and could offset further SOC losses, but additional research on the potentials of these cropland management options and available amounts that could be applied is needed. We find that the potential for SOC sequestration on current global cropland is too small to fulfill expectations as a negative emission technology, which stresses the importance of reducing GHG emissions more strictly by other means, to reach climate protection targets as outlined in the 2015 Paris Agreement.
The source code is available under the GNU APGL version 3 license. The exact version of the code described here and the R script used for post-processing the data from the simulations conducted are archived under https://doi.org/10.5281/zenodo.4625868 (Herzfeld et al., 2021).
The supplement related to this article is available online at: https://doi.org/10.5194/esd-12-1037-2021-supplement.
TH and CM designed the study in discussion with JH and SR. TH conducted all the model simulations and wrote the paper with support from CM. TH conducted the analysis and prepared all the figures with input from CM and JH. All authors edited the paper.
The contact author has declared that neither they nor their co-authors have any competing interests.
Publisher's note: Copernicus Publications remains neutral with regard to jurisdictional claims in published maps and institutional affiliations.
Tobias Herzfeld and Susanne Rolinski gratefully thank the German Ministry for Education and Research (BMBF) for funding this work, which is part of the MACMIT project (01LN1317A). Jens Heinke thanks the BMBF for funding through the EXIMO project (01LP1903D). Tobias Herzfeld thanks Vera Porwollik for the support in preparing input datasets and code development. We thank the two anonymous referees for their helpful comments to improve the paper.
This research has been supported by the Bundesministerium für Bildung, Wissenschaft, Forschung und Technologie (grant no. 01LN1317A and 01LP1903D).
The article processing charges for this open-access publication were covered by the Potsdam Institute for Climate Impact Research (PIK).
This paper was edited by Kirsten Zickfeld and reviewed by two anonymous referees.
Abdalla, K., Chivenge, P., Ciais, P., and Chaplot, V.: No-tillage lessens soil CO2 emissions the most under arid and sandy soil conditions: results from a meta-analysis, Biogeosciences, 13, 3619–3633, https://doi.org/10.5194/bg-13-3619-2016, 2016.
Alvarez, R.: A review of nitrogen fertilizer and conservation tillage effects on soil organic carbon storage, Soil Use Manag., 21, 38–52, https://doi.org/10.1079/SUM2005291, 2005.
Averill, C. and Waring, B.: Nitrogen limitation of decomposition and decay: How can it occur?, Glob. Chang. Biol., 24, 1417–1427, https://doi.org/10.1111/gcb.13980, 2018.
Baker, J. M., Ochsner, T. E., Venterea, R. T., and Griffis, T. J.: Tillage and soil carbon sequestration – What do we really know?, Agric. Ecosyst. Environ., 118, 1–5, https://doi.org/10.1016/j.agee.2006.05.014, 2007.
Basso, B., Dumont, B., Maestrini, B., Shcherbak, I., Robertson, G. P., Porter, J. R., Smith, P., Paustian, K., Grace, P. R., Asseng, S., Bassu, S., Biernath, C., Boote, K. J., Cammarano, D., De Sanctis, G., Durand, J.-L., Ewert, F., Gayler, S., Hyndman, D. W., Kent, J., Martre, P., Nendel, C., Priesack, E., Ripoche, D., Ruane, A. C., Sharp, J., Thorburn, P. J., Hatfield, J. L., Jones, J. W., and Rosenzweig, C.: Soil Organic Carbon and Nitrogen Feedbacks on Crop Yields under Climate Change, Agric. Environ. Lett., 3, 1–5, https://doi.org/10.2134/ael2018.05.0026, 2018.
Batjes, N. H.: Total carbon and nitrogen in the soils of the world, Eur. J. Soil Sci., 47, 151–163, https://doi.org/10.1111/j.1365-2389.1996.tb01386.x, 1996.
Batjes, N. H.: Mitigation of atmospheric CO2 concentrations by increased carbon sequestration in the soil, Biol. Fertil. Soils, 27, 230–235, https://doi.org/10.1007/s003740050425, 1998.
Bodirsky, B. L., Rolinski, S., Biewald, A., Weindl, I., Popp, A., and Lotze-Campen, H.: Global Food Demand Scenarios for the 21st Century, PLoS One, 10, e0139201, https://doi.org/10.1371/journal.pone.0139201, 2015.
Bondeau, A., Smith, P. C., Zaehle, S., Schaphoff, S., Lucht, W., Cramer, W., Gerten, D., Lotze-Campen, H., Müller, C., Reichstein, M., and Smith, B.: Modelling the role of agriculture for the 20th century global terrestrial carbon balance, Glob. Change Biol., 13, 679–706, https://doi.org/10.1111/j.1365-2486.2006.01305.x, 2007.
Bronick, C. J. and Lal, R.: Soil structure and management: a review, Geoderma, 124, 3–22, https://doi.org/10.1016/j.geoderma.2004.03.005, 2005.
Carvalhais, N., Forkel, M., Khomik, M., Bellarby, J., Jung, M., Migliavacca, M., Mu, M., Saatchi, S., Santoro, M., Thurner, M., Weber, U., Ahrens, B., Beer, C., Cescatti, A., Randerson, J. T., and Reichstein, M.: Global covariation of carbon turnover times with climate in terrestrial ecosystems, Nature, 514, 213–217, https://doi.org/10.1038/nature13731, 2014.
Cerdà, A., Flanagan, D. C., le Bissonnais, Y., and Boardman, J.: Soil erosion and agriculture, Soil Tillage Res., 106, 107–108, https://doi.org/10.1016/j.still.2009.10.006, 2009.
Chevallier, T., Blanchart, E., Girardin, C., Mariotti, A., Albrecht, A., and Feller, C.: The role of biological activity (roots, earthworms) in medium-term C dynamics in vertisol under a Digitaria decumbens (Gramineae) pasture, Appl. Soil Ecol., 16, 11–21, https://doi.org/10.1016/S0929-1393(00)00102-5, 2001.
Chi, J., Waldo, S., Pressley, S., O'Keeffe, P., Huggins, D., Stöckle, C., Pan, W. L., Brooks, E., and Lamb, B.: Assessing carbon and water dynamics of no-till and conventional tillage cropping systems in the inland Pacific Northwest US using the eddy covariance method, Agric. For. Meteorol., 218–219, 37–49, https://doi.org/10.1016/j.agrformet.2015.11.019, 2016.
Derpsch, R., Friedrich, T., Kassam, A., and Hongwen, L.: Current status of adoption of no-till farming in the world and some of its main benefits, Int. J. Agric. Biol. Eng., 3, 1–25, https://doi.org/10.3965/j.issn.1934-6344.2010.01.001-025, 2010.
Derpsch, R., Franzluebbers, A. J., Duiker, S. W., Reicosky, D. C., Koeller, K., Friedrich, T., Sturny, W. G., Sá, J. C. M., and Weiss, K.: Why do we need to standardize no-tillage research?, Soil Tillage Res., 137, 16–22, https://doi.org/10.1016/j.still.2013.10.002, 2014.
de Vries, W.: Soil carbon 4 per mille: a good initiative but let's manage not only the soil but also the expectations, Geoderma, 309, 111–112, https://doi.org/10.1016/j.geoderma.2017.05.023, 2018.
Dietrich, J. P., Mishra, A., Weindl, I., Bodirsky, B. L., Wang, X., Baumstark, L., Kreidenweis, U., Klein, D., Steinmetz, N., Chen, D., Humpenoeder, F., and Wirth, S.: mrland: MadRaT land data package, Zenodo [code], https://doi.org/10.5281/zenodo.3822083, 2020.
Dignac, M.-F., Derrien, D., Barré, P., Barot, S., Cécillon, L., Chenu, C., Chevallier, T., Freschet, G. T., Garnier, P., Guenet, B., Hedde, M., Klumpp, K., Lashermes, G., Maron, P.-A., Nunan, N., Roumet, C., and Basile-Doelsch, I.: Increasing soil carbon storage: mechanisms, effects of agricultural practices and proxies. A review, Agron. Sustain. Dev., 37, 1–14, https://doi.org/10.1007/s13593-017-0421-2, 2017.
Emde, D., Hannam, K. D., Most, I., Nelson, L. M., and Jones, M. D.: Soil organic carbon in irrigated agricultural systems: A meta-analysis, Glob. Change Biol., 27, 3898–3910, https://doi.org/10.1111/gcb.15680, 2021.
Eyring, V., Bony, S., Meehl, G. A., Senior, C. A., Stevens, B., Stouffer, R. J., and Taylor, K. E.: Overview of the Coupled Model Intercomparison Project Phase 6 (CMIP6) experimental design and organization, Geosci. Model Dev., 9, 1937–1958, https://doi.org/10.5194/gmd-9-1937-2016, 2016.
FAO: The State of Food and Agriculture 2019 (SOFA). Moving forward on food loss and waste reduction., Food and Agriculture Organization of the United Nations (FAO), Rome, License: CC BY-NC-SA 3.0 IGO, 2019.
Forkel, M., Carvalhais, N., Schaphoff, S., v. Bloh, W., Migliavacca, M., Thurner, M., and Thonicke, K.: Identifying environmental controls on vegetation greenness phenology through model–data integration, Biogeosciences, 11, 7025–7050, https://doi.org/10.5194/bg-11-7025-2014, 2014.
Frieler, K., Lange, S., Piontek, F., Reyer, C. P. O., Schewe, J., Warszawski, L., Zhao, F., Chini, L., Denvil, S., Emanuel, K., Geiger, T., Halladay, K., Hurtt, G., Mengel, M., Murakami, D., Ostberg, S., Popp, A., Riva, R., Stevanovic, M., Suzuki, T., Volkholz, J., Burke, E., Ciais, P., Ebi, K., Eddy, T. D., Elliott, J., Galbraith, E., Gosling, S. N., Hattermann, F., Hickler, T., Hinkel, J., Hof, C., Huber, V., Jägermeyr, J., Krysanova, V., Marcé, R., Müller Schmied, H., Mouratiadou, I., Pierson, D., Tittensor, D. P., Vautard, R., van Vliet, M., Biber, M. F., Betts, R. A., Bodirsky, B. L., Deryng, D., Frolking, S., Jones, C. D., Lotze, H. K., Lotze-Campen, H., Sahajpal, R., Thonicke, K., Tian, H., and Yamagata, Y.: Assessing the impacts of 1.5 ∘C global warming – simulation protocol of the Inter-Sectoral Impact Model Intercomparison Project (ISIMIP2b), Geosci. Model Dev., 10, 4321–4345, https://doi.org/10.5194/gmd-10-4321-2017, 2017.
Fuss, S., Lamb, W. F., Callaghan, M. W., Hilaire, J., Creutzig, F., Amann, T., Beringer, T., Garcia, W. de O., Hartmann, J., Khanna, T., Luderer, G., Nemet, G. F., Rogelj, J., Smith, P., Vicente, J. L. V., Wilcox, J., Dominguez, M. del M. Z., and Minx, J. C.: Negative emissions – Part 2: Costs, potentials and side effects, Environ. Res. Lett., 13, 063002, https://doi.org/10.1088/1748-9326/aabf9f, 2018.
Gerten, D., Heck, V., Jägermeyr, J., Bodirsky, B. L., Fetzer, I., Jalava, M., Kummu, M., Lucht, W., Rockström, J., Schaphoff, S., and Schellnhuber, H. J.: Feeding ten billion people is possible within four terrestrial planetary boundaries, Nat. Sustain., 3, 200–208, https://doi.org/10.1038/s41893-019-0465-1, 2020.
Griscom, B. W., Adams, J., Ellis, P. W., Houghton, R. A., Lomax, G., Miteva, D. A., Schlesinger, W. H., Shoch, D., Siikamäki, J. V., Smith, P., Woodbury, P., Zganjar, C., Blackman, A., Campari, J., Conant, R. T., Delgado, C., Elias, P., Gopalakrishna, T., Hamsik, M. R., Herrero, M., Kiesecker, J., Landis, E., Laestadius, L., Leavitt, S. M., Minnemeyer, S., Polasky, S., Potapov, P., Putz, F. E., Sanderman, J., Silvius, M., Wollenberg, E., and Fargione, J.: Natural climate solutions, P. Natl. Acad. Sci. USA, 114, 11645–11650, https://doi.org/10.1073/pnas.1710465114, 2017.
Guérif, J., Richard, G., Dürr, C., Machet, J. M., Recous, S., and Roger-Estrade, J.: A review of tillage effects on crop residue management, seedbed conditions and seedling establishment, Soil Tillage Res., 61, 13–32, https://doi.org/10.1016/S0167-1987(01)00187-8, 2001.
Gyssels, G., Poesen, J., Bochet, E., and Li, Y.: Impact of plant roots on the resistance of soils to erosion by water: a review, Prog. Phys. Geogr., 29, 189–217, https://doi.org/10.1191/0309133305pp443ra, 2005.
Harris, I., Osborn, T. J., Jones, P., and Lister, D.: Version 4 of the CRU TS monthly high-resolution gridded multivariate climate dataset, Sci. Data, 7, 109, https://doi.org/10.1038/s41597-020-0453-3, 2020.
Hatton, P.-J., Castanha, C., Torn, M. S., and Bird, J. A.: Litter type control on soil C and N stabilization dynamics in a temperate forest, Glob. Change Biol., 21, 1358–1367, https://doi.org/10.1111/gcb.12786, 2015.
Heijden, M. G. A. V. D., Bardgett, R. D., and Straalen, N. M. V.: The unseen majority: soil microbes as drivers of plant diversity and productivity in terrestrial ecosystems, Ecol. Lett., 11, 296–310, https://doi.org/10.1111/j.1461-0248.2007.01139.x, 2008.
Hempel, S., Frieler, K., Warszawski, L., Schewe, J., and Piontek, F.: Bias corrected GCM input data for ISIMIP Fast Track, GFZ Data Services, https://doi.org/10.5880/PIK.2016.001, 2013.
Herzfeld, T., Müller, C., Heinke, J., Rolinski, S., and Porwollik, V.: LPJmL Model Source Code (version 5.0-tillage2), Zenodo [code], https://doi.org/10.5281/zenodo.4625868, 2021.
Hiederer, R. and Köchy, M.: Global Soil Organic Carbon Estimates and the Harmonized World Soil Database, EUR 25225 EN, 79, https://doi.org/10.2788/13267, 2011.
Humphrey, V., Berg, A., Ciais, P., Gentine, P., Jung, M., Reichstein, M., Seneviratne, S. I., and Frankenberg, C.: Soil moisture–atmosphere feedback dominates land carbon uptake variability, Nature, 592, 65–69, https://doi.org/10.1038/s41586-021-03325-5, 2021.
Hurtt, G. C., Chini, L., Sahajpal, R., Frolking, S., Bodirsky, B. L., Calvin, K., Doelman, J. C., Fisk, J., Fujimori, S., Klein Goldewijk, K., Hasegawa, T., Havlik, P., Heinimann, A., Humpenöder, F., Jungclaus, J., Kaplan, J. O., Kennedy, J., Krisztin, T., Lawrence, D., Lawrence, P., Ma, L., Mertz, O., Pongratz, J., Popp, A., Poulter, B., Riahi, K., Shevliakova, E., Stehfest, E., Thornton, P., Tubiello, F. N., van Vuuren, D. P., and Zhang, X.: Harmonization of global land use change and management for the period 850–2100 (LUH2) for CMIP6, Geosci. Model Dev., 13, 5425–5464, https://doi.org/10.5194/gmd-13-5425-2020, 2020.
IPCC: 2006 IPCC Guidelines for National Greenhouse Gas Inventories, Prepared by the National Greenhouse Gas Inventories Programme, edited by: Eggleston, H. S., Buendia, L., Miwa, K., Ngar,a T., and Tanabe, K., IGES, Japan, 2006.
IPCC: 2019 Refinement to the 2006 IPCC Guidelines for National Greenhouse Gas Inventories – Chapter 5 – Cropland – Volume 4: Agriculture, Forestry and Other Land Use, edited by: Calvo Buendia, E., Tanabe, K., Kranjc, A., Baasansuren, J., Fukuda, M., Ngarize S., Osako, A., Pyrozhenko, Y., Shermanau, P., and Federici, S., Intergovernmental Panel on Climate Change (IPCC), Geneva, Switzerland, 2019.
Jägermeyr, J., Gerten, D., Heinke, J., Schaphoff, S., Kummu, M., and Lucht, W.: Water savings potentials of irrigation systems: global simulation of processes and linkages, Hydrol. Earth Syst. Sci., 19, 3073–3091, https://doi.org/10.5194/hess-19-3073-2015, 2015.
Jobbágy, E. G. and Jackson, R. B.: The Vertical Distribution of Soil Organic Carbon and Its Relation to Climate and Vegetation, Ecol. Appl., 10, 423–436, https://doi.org/10.1890/1051-0761(2000)010[0423:TVDOSO]2.0.CO;2, 2000.
Karstens, K., Bodirsky, B. L., Dietrich, J. P., Dondini, M., Heinke, J., Kuhnert, M., Müller, C., Rolinski, S., Smith, P., Weindl, I., Lotze-Campen, H., and Popp, A.: Management induced changes of soil organic carbon on global croplands, Biogeosciences Discuss. [preprint], https://doi.org/10.5194/bg-2020-468, in review, 2020.
Kurothe, R. S., Kumar, G., Singh, R., Singh, H. B., Tiwari, S. P., Vishwakarma, A. K., Sena, D. R., and Pande, V. C.: Effect of tillage and cropping systems on runoff, soil loss and crop yields under semiarid rainfed agriculture in India, Soil Tillage Res., 140, 126–134, https://doi.org/10.1016/j.still.2014.03.005, 2014.
Lal, R.: Tillage effects on soil degradation, soil resilience, soil quality, and sustainability, Soil Tillage Res., 27, 1–8, https://doi.org/10.1016/0167-1987(93)90059-X, 1993.
Lal, R.: World cropland soils as a source or sink for atmospheric carbon, Adv. Agron., 71, 145–191, https://doi.org/10.1016/S0065-2113(01)71014-0, 2001.
Lal, R.: Offsetting global CO2 emissions by restoration of degraded soils and intensification of world agriculture and forestry, Land Degrad. Dev., 14, 309–322, https://doi.org/10.1002/ldr.562, 2003.
Lal, R.: Soil Carbon Sequestration Impacts on Global Climate Change and Food Security, Science, 304, 1623–1627, https://doi.org/10.1126/science.1097396, 2004.
Lal, R.: Challenges and opportunities in soil organic matter research, Eur. J. Soil Sci., 60, 158–169, https://doi.org/10.1111/j.1365-2389.2008.01114.x, 2009.
Le Quéré, C., Moriarty, R., Andrew, R. M., Canadell, J. G., Sitch, S., Korsbakken, J. I., Friedlingstein, P., Peters, G. P., Andres, R. J., Boden, T. A., Houghton, R. A., House, J. I., Keeling, R. F., Tans, P., Arneth, A., Bakker, D. C. E., Barbero, L., Bopp, L., Chang, J., Chevallier, F., Chini, L. P., Ciais, P., Fader, M., Feely, R. A., Gkritzalis, T., Harris, I., Hauck, J., Ilyina, T., Jain, A. K., Kato, E., Kitidis, V., Klein Goldewijk, K., Koven, C., Landschützer, P., Lauvset, S. K., Lefèvre, N., Lenton, A., Lima, I. D., Metzl, N., Millero, F., Munro, D. R., Murata, A., Nabel, J. E. M. S., Nakaoka, S., Nojiri, Y., O'Brien, K., Olsen, A., Ono, T., Pérez, F. F., Pfeil, B., Pierrot, D., Poulter, B., Rehder, G., Rödenbeck, C., Saito, S., Schuster, U., Schwinger, J., Séférian, R., Steinhoff, T., Stocker, B. D., Sutton, A. J., Takahashi, T., Tilbrook, B., van der Laan-Luijkx, I. T., van der Werf, G. R., van Heuven, S., Vandemark, D., Viovy, N., Wiltshire, A., Zaehle, S., and Zeng, N.: Global Carbon Budget 2015, Earth Syst. Sci. Data, 7, 349–396, https://doi.org/10.5194/essd-7-349-2015, 2015.
Le Quéré, C., Andrew, R. M., Friedlingstein, P., Sitch, S., Hauck, J., Pongratz, J., Pickers, P. A., Korsbakken, J. I., Peters, G. P., Canadell, J. G., Arneth, A., Arora, V. K., Barbero, L., Bastos, A., Bopp, L., Chevallier, F., Chini, L. P., Ciais, P., Doney, S. C., Gkritzalis, T., Goll, D. S., Harris, I., Haverd, V., Hoffman, F. M., Hoppema, M., Houghton, R. A., Hurtt, G., Ilyina, T., Jain, A. K., Johannessen, T., Jones, C. D., Kato, E., Keeling, R. F., Goldewijk, K. K., Landschützer, P., Lefèvre, N., Lienert, S., Liu, Z., Lombardozzi, D., Metzl, N., Munro, D. R., Nabel, J. E. M. S., Nakaoka, S., Neill, C., Olsen, A., Ono, T., Patra, P., Peregon, A., Peters, W., Peylin, P., Pfeil, B., Pierrot, D., Poulter, B., Rehder, G., Resplandy, L., Robertson, E., Rocher, M., Rödenbeck, C., Schuster, U., Schwinger, J., Séférian, R., Skjelvan, I., Steinhoff, T., Sutton, A., Tans, P. P., Tian, H., Tilbrook, B., Tubiello, F. N., van der Laan-Luijkx, I. T., van der Werf, G. R., Viovy, N., Walker, A. P., Wiltshire, A. J., Wright, R., Zaehle, S., and Zheng, B.: Global Carbon Budget 2018, Earth Syst. Sci. Data, 10, 2141–2194, https://doi.org/10.5194/essd-10-2141-2018, 2018.
Lorenz, K. and Lal, R.: Soil organic carbon sequestration in agroforestry systems. A review, Agron. Sustain. Dev., 34, 443–454, https://doi.org/10.1007/s13593-014-0212-y, 2014.
Luo, Y., Ahlström, A., Allison, S. D., Batjes, N. H., Brovkin, V., Carvalhais, N., Chappell, A., Ciais, P., Davidson, E. A., Finzi, A., Georgiou, K., Guenet, B., Hararuk, O., Harden, J. W., He, Y., Hopkins, F., Jiang, L., Koven, C., Jackson, R. B., Jones, C. D., Lara, M. J., Liang, J., McGuire, A. D., Parton, W., Peng, C., Randerson, J. T., Salazar, A., Sierra, C. A., Smith, M. J., Tian, H., Todd-Brown, K. E. O., Torn, M., Groenigen, K. J. van, Wang, Y. P., West, T. O., Wei, Y., Wieder, W. R., Xia, J., Xu, X., Xu, X., and Zhou, T.: Toward more realistic projections of soil carbon dynamics by Earth system models, Global Biogeochem. Cycles, 30, 40–56, https://doi.org/10.1002/2015GB005239, 2016.
Luo, Z., Wang, E., and Sun, O. J.: Can no-tillage stimulate carbon sequestration in agricultural soils? A meta-analysis of paired experiments, Agric. Ecosyst. Environ., 139, 224–231, https://doi.org/10.1016/j.agee.2010.08.006, 2010.
Lutz, F., Herzfeld, T., Heinke, J., Rolinski, S., Schaphoff, S., von Bloh, W., Stoorvogel, J. J., and Müller, C.: Simulating the effect of tillage practices with the global ecosystem model LPJmL (version 5.0-tillage), Geosci. Model Dev., 12, 2419–2440, https://doi.org/10.5194/gmd-12-2419-2019, 2019a.
Lutz, F., Stoorvogel, J. J., and Müller, C.: Options to model the effects of tillage on N2O emissions at the global scale, Ecol. Model., 392, 212–225, https://doi.org/10.1016/j.ecolmodel.2018.11.015, 2019b.
Macdonald, C. A., Delgado-Baquerizo, M., Reay, D. S., Hicks, L. C., and Singh, B. K.: Soil Nutrients and Soil Carbon Storage, in: Soil Carbon Storage, Elsevier, 167–205, https://doi.org/10.1016/B978-0-12-812766-7.00006-8, 2018.
Maharjan, G. R., Prescher, A.-K., Nendel, C., Ewert, F., Mboh, C. M., Gaiser, T., and Seidel, S. J.: Approaches to model the impact of tillage implements on soil physical and nutrient properties in different agro-ecosystem models, Soil Tillage Res., 180, 210–221, https://doi.org/10.1016/j.still.2018.03.009, 2018.
Mekki, A., Aloui, F., and Sayadi, S.: Influence of biowaste compost amendment on soil organic carbon storage under arid climate, J. Air Waste Manag. Assoc., 69, 867–877, https://doi.org/10.1080/10962247.2017.1374311, 2019.
Minasny, B., Malone, B. P., McBratney, A. B., Angers, D. A., Arrouays, D., Chambers, A., Chaplot, V., Chen, Z.-S., Cheng, K., Das, B. S., Field, D. J., Gimona, A., Hedley, C. B., Hong, S. Y., Mandal, B., Marchant, B. P., Martin, M., McConkey, B. G., Mulder, V. L., O'Rourke, S., Richer-de-Forges, A. C., Odeh, I., Padarian, J., Paustian, K., Pan, G., Poggio, L., Savin, I., Stolbovoy, V., Stockmann, U., Sulaeman, Y., Tsui, C.-C., Vågen, T.-G., van Wesemael, B., and Winowiecki, L.: Soil carbon 4 per mille, Geoderma, 292, 59–86, https://doi.org/10.1016/j.geoderma.2017.01.002, 2017.
Minoli, S., Müller, C., Elliott, J., Ruane, A. C., Jägermeyr, J., Zabel, F., Dury, M., Folberth, C., François, L., Hank, T., Jacquemin, I., Liu, W., Olin, S., and Pugh, T. A. M.: Global Response Patterns of Major Rainfed Crops to Adaptation by Maintaining Current Growing Periods and Irrigation, Earths Future, 7, 1464–1480, https://doi.org/10.1029/2018EF001130, 2019.
Minx, J. C., Lamb, W. F., Callaghan, M. W., Fuss, S., Hilaire, J., Creutzig, F., Amann, T., Beringer, T., Garcia, W. de O., Hartmann, J., Khanna, T., Lenzi, D., Luderer, G., Nemet, G. F., Rogelj, J., Smith, P., Vicente, J. L. V., Wilcox, J., and Dominguez, M. del M. Z.: Negative emissions – Part 1: Research landscape and synthesis, Environ. Res. Lett., 13, 063001, https://doi.org/10.1088/1748-9326/aabf9b, 2018.
Naipal, V., Ciais, P., Wang, Y., Lauerwald, R., Guenet, B., and Van Oost, K.: Global soil organic carbon removal by water erosion under climate change and land use change during AD 1850–2005, Biogeosciences, 15, 4459–4480, https://doi.org/10.5194/bg-15-4459-2018, 2018.
Nishina, K., Ito, A., Beerling, D. J., Cadule, P., Ciais, P., Clark, D. B., Falloon, P., Friend, A. D., Kahana, R., Kato, E., Keribin, R., Lucht, W., Lomas, M., Rademacher, T. T., Pavlick, R., Schaphoff, S., Vuichard, N., Warszawaski, L., and Yokohata, T.: Quantifying uncertainties in soil carbon responses to changes in global mean temperature and precipitation, Earth Syst. Dynam., 5, 197–209, https://doi.org/10.5194/esd-5-197-2014, 2014.
Olin, S., Lindeskog, M., Pugh, T. A. M., Schurgers, G., Wårlind, D., Mishurov, M., Zaehle, S., Stocker, B. D., Smith, B., and Arneth, A.: Soil carbon management in large-scale Earth system modelling: implications for crop yields and nitrogen leaching, Earth Syst. Dynam., 6, 745–768, https://doi.org/10.5194/esd-6-745-2015, 2015.
Pan, G., Smith, P., and Pan, W.: The role of soil organic matter in maintaining the productivity and yield stability of cereals in China, Agr. Ecosyst. Environ., 129, 344–348, https://doi.org/10.1016/j.agee.2008.10.008, 2009.
Pingali, P. L.: Green Revolution: Impacts, limits, and the path ahead, P. Natl. Acad. Sci. USA, 109, 12302–12308, https://doi.org/10.1073/pnas.0912953109, 2012.
Porwollik, V., Rolinski, S., Heinke, J., and Müller, C.: Generating a rule-based global gridded tillage dataset, Earth Syst. Sci. Data, 11, 823–843, https://doi.org/10.5194/essd-11-823-2019, 2019.
Powlson, D. S., Stirling, C. M., Jat, M. L., Gerard, B. G., Palm, C. A., Sanchez, P. A., and Cassman, K. G.: Limited potential of no-till agriculture for climate change mitigation, Nat. Clim. Change, 4, 678–683, https://doi.org/10.1038/nclimate2292, 2014.
Pugh, T. A. M., Arneth, A., Olin, S., Ahlström, A., Bayer, A. D., Klein Goldewijk, K., Lindeskog, M., and Schurgers, G.: Simulated carbon emissions from land-use change are substantially enhanced by accounting for agricultural management, Environ. Res. Lett., 10, 124008, https://doi.org/10.1088/1748-9326/10/12/124008, 2015.
Ranaivoson, L., Naudin, K., Ripoche, A., Affholder, F., Rabeharisoa, L., and Corbeels, M.: Agro-ecological functions of crop residues under conservation agriculture. A review, Agron. Sustain. Dev., 37, 1–17, https://doi.org/10.1007/s13593-017-0432-z, 2017.
Ray, D. K., Ramankutty, N., Mueller, N. D., West, P. C., and Foley, J. A.: Recent patterns of crop yield growth and stagnation, Nat. Commun., 3, 1–7, https://doi.org/10.1038/ncomms2296, 2012.
Ren, W., Banger, K., Tao, B., Yang, J., Huang, Y., and Tian, H.: Global pattern and change of cropland soil organic carbon during 1901–2010: Roles of climate, atmospheric chemistry, land use and management, Geography and Sustainability, 1, 59–69, https://doi.org/10.1016/j.geosus.2020.03.001, 2020.
Rogelj, J., den Elzen, M., Höhne, N., Fransen, T., Fekete, H., Winkler, H., Schaeffer, R., Sha, F., Riahi, K., and Meinshausen, M.: Paris Agreement climate proposals need a boost to keep warming well below 2 ∘C, Nature, 534, 631–639, https://doi.org/10.1038/nature18307, 2016.
Rogelj, J., Popp, A., Calvin, K. V., Luderer, G., Emmerling, J., Gernaat, D., Fujimori, S., Strefler, J., Hasegawa, T., Marangoni, G., Krey, V., Kriegler, E., Riahi, K., van Vuuren, D. P., Doelman, J., Drouet, L., Edmonds, J., Fricko, O., Harmsen, M., Havlik, P., Humpenöder, F., Stehfest, E., and Tavoni, M.: Scenarios towards limiting global mean temperature increase below 1.5 ∘C, Nat. Clim. Change, 8, 325–332, https://doi.org/10.1038/s41558-018-0091-3, 2018.
Rost, S., Gerten, D., Bondeau, A., Lucht, W., Rohwer, J., and Schaphoff, S.: Agricultural green and blue water consumption and its influence on the global water system, Water Resour. Res., 44, W09405, https://doi.org/10.1029/2007WR006331, 2008.
Sanderman, J., Hengl, T., and Fiske, G. J.: Soil carbon debt of 12,000 years of human land use, P. Natl. Acad. Sci. USA, 114, 9575–9580, https://doi.org/10.1073/pnas.1706103114, 2017.
Schaphoff, S., Heyder, U., Ostberg, S., Gerten, D., Heinke, J., and Lucht, W.: Contribution of permafrost soils to the global carbon budget, Environ. Res. Lett., 8, 014026, https://doi.org/10.1088/1748-9326/8/1/014026, 2013.
Schaphoff, S., von Bloh, W., Rammig, A., Thonicke, K., Biemans, H., Forkel, M., Gerten, D., Heinke, J., Jägermeyr, J., Knauer, J., Langerwisch, F., Lucht, W., Müller, C., Rolinski, S., and Waha, K.: LPJmL4 – a dynamic global vegetation model with managed land – Part 1: Model description, Geosci. Model Dev., 11, 1343–1375, https://doi.org/10.5194/gmd-11-1343-2018, 2018.
Scharlemann, J. P., Tanner, E. V., Hiederer, R., and Kapos, V.: Global soil carbon: understanding and managing the largest terrestrial carbon pool, Carbon Manag., 5, 81–91, https://doi.org/10.4155/cmt.13.77, 2014.
Sitch, S., Smith, B., Prentice, I. C., Arneth, A., Bondeau, A., Cramer, W., Kaplan, J. O., Levis, S., Lucht, W., Sykes, M. T., and others: Evaluation of ecosystem dynamics, plant geography and terrestrial carbon cycling in the LPJ dynamic global vegetation model, Glob. Chang. Biol., 9, 161–185, https://doi.org/10.1046/j.1365-2486.2003.00569.x, 2003.
Smith, P.: Soil carbon sequestration and biochar as negative emission technologies, Glob. Change Biol., 22, 1315–1324, https://doi.org/10.1111/gcb.13178, 2016.
Snyder, C. S., Bruulsema, T. W., Jensen, T. L., and Fixen, P. E.: Review of greenhouse gas emissions from crop production systems and fertilizer management effects, Agr. Ecosyst. Environ., 133, 247–266, https://doi.org/10.1016/j.agee.2009.04.021, 2009.
Stehfest, E., van Zeist, W.-J., Valin, H., Havlik, P., Popp, A., Kyle, P., Tabeau, A., Mason-D'Croz, D., Hasegawa, T., Bodirsky, B. L., Calvin, K., Doelman, J. C., Fujimori, S., Humpenöder, F., Lotze-Campen, H., van Meijl, H., and Wiebe, K.: Key determinants of global land-use projections, Nat. Commun., 10, 2166, https://doi.org/10.1038/s41467-019-09945-w, 2019.
Stella, T., Mouratiadou, I., Gaiser, T., Berg-Mohnicke, M., Wallor, E., Ewert, F., and Nendel, C.: Estimating the contribution of crop residues to soil organic carbon conservation, Environ. Res. Lett., 14, 094008, https://doi.org/10.1088/1748-9326/ab395c, 2019.
Stockmann, U., Adams, M. A., Crawford, J. W., Field, D. J., Henakaarchchi, N., Jenkins, M., Minasny, B., Mcbratney, A. B., Courcelles, V. D. R. D., Singh, K., Wheeler, I., Abbott, L., Angers, D. A., Baldock, J., Bird, M., Brookes, P. C., Chenu, C., Jastrow, J. D., Lal, R., Lehmann, J., O'Donnell, A. G., Parton, W. J., Whitehead, D., and Zimmermann, M.: The knowns, known unknowns and unknowns of sequestration of soil organic carbon, Agric. Ecosyst. Environ., 164, 80–99, https://doi.org/10.1016/j.agee.2012.10.001, 2013.
Tans, P. and Keeling, R.: Earth System Research Laboratories (ESRL) Global Monitoring Laboratory – Carbon Cycle Greenhouse Gases, National Oceanic and Atmospheric Administration (NOAA), US Department of Commerce, available at: https://gml.noaa.gov/ccgg/trends/, last access: 30 April 2021.
Torres, A. B., Marchant, R., Lovett, J. C., Smart, J. C. R., and Tipper, R.: Analysis of the carbon sequestration costs of afforestation and reforestation agroforestry practices and the use of cost curves to evaluate their potential for implementation of climate change mitigation, Ecol. Econ., 69, 469–477, https://doi.org/10.1016/j.ecolecon.2009.09.007, 2010.
Trost, B., Prochnow, A., Drastig, K., Meyer-Aurich, A., Ellmer, F., and Baumecker, M.: Irrigation, soil organic carbon and N2O emissions. A review, Agron. Sustain. Dev., 33, 733–749, https://doi.org/10.1007/s13593-013-0134-0, 2013.
United Nations, Department of Economic and Social Affairs, and Population Division: World population prospects 2019: Highlights, (ST/ESA/SER.A/423), United Nations, Department of Economic and Social Affairs Population Division, New York, NY, 2019.
Van Kessel, J. and Reeves, J.: Nitrogen mineralization potential of dairy manures and its relationship to composition, Biol. Fertil. Soils, 36, 118–123, https://doi.org/10.1007/s00374-002-0516-y, 2002.
von Bloh, W., Schaphoff, S., Müller, C., Rolinski, S., Waha, K., and Zaehle, S.: Implementing the nitrogen cycle into the dynamic global vegetation, hydrology, and crop growth model LPJmL (version 5.0), Geosci. Model Dev., 11, 2789–2812, https://doi.org/10.5194/gmd-11-2789-2018, 2018.
White, J. W., Jones, J. W., Porter, C., McMaster, G. S., and Sommer, R.: Issues of spatial and temporal scale in modeling the effects of field operations on soil properties, Oper. Res., 10, 279–299, https://doi.org/10.1007/s12351-009-0067-1, 2010.
White, R. E., Davidson, B., Lam, S. K., and Chen, D.: A critique of the paper “Soil carbon 4 per mille” by Minasny et al. (2017), Geoderma, 309, 115–117, https://doi.org/10.1016/j.geoderma.2017.05.025, 2018.
Wik, M., Pingali, P., and Broca, S.: Global Agricultural Performance: Past Trends and Future Prospects, Background Paper for the World Development Report 2008, World Bank, Washington, DC, USA, 39, 2008.
Zhang, B., Tian, H., Lu, C., Dangal, S. R. S., Yang, J., and Pan, S.: Global manure nitrogen production and application in cropland during 1860–2014: a 5 arcmin gridded global dataset for Earth system modeling, Earth Syst. Sci. Data, 9, 667–678, https://doi.org/10.5194/essd-9-667-2017, 2017.
Zomer, R. J., Bossio, D. A., Sommer, R., and Verchot, L. V.: Global Sequestration Potential of Increased Organic Carbon in Cropland Soils, Sci. Rep.-UK, 7, 15554, https://doi.org/10.1038/s41598-017-15794-8, 2017.