the Creative Commons Attribution 4.0 License.
the Creative Commons Attribution 4.0 License.
 | 09 Nov 2020
A continued role of short-lived climate forcers under the Shared Socioeconomic Pathways
Borgar Aamaas
Camilla W. Stjern
Zbigniew Klimont
Terje K. Berntsen
Bjørn H. Samset
Mitigation of non-CO2 emissions plays a key role in meeting the Paris Agreement ambitions and sustainable development goals. Implementation of respective policies addressing these targets mainly occur at sectoral and regional levels, and designing efficient mitigation strategies therefore relies on detailed knowledge about the mix of emissions from individual sources and their subsequent climate impact. Here we present a comprehensive dataset of near- and long-term global temperature responses to emissions of CO2 and individual short-lived climate forcers (SLCFs) from 7 sectors and 13 regions – for both present-day emissions and their continued evolution as projected under the Shared Socioeconomic Pathways (SSPs). We demonstrate the key role of CO2 in driving both near- and long-term warming and highlight the importance of mitigating methane emissions from agriculture, waste management, and energy production as the primary strategy to further limit near-term warming. Due to high current emissions of cooling SLCFs, policies targeting end-of-pipe energy sector emissions may result in net added warming unless accompanied by simultaneous methane and/or CO2 reductions. We find that SLCFs are projected to play a continued role in many regions, particularly those including low- to medium-income countries, under most of the SSPs considered here. East Asia, North America, and Europe will remain the largest contributors to total net warming until 2100, regardless of scenario, while South Asia and Africa south of the Sahara overtake Europe by the end of the century in SSP3-7.0 and SSP5-8.5. Our dataset is made available in an accessible format, aimed also at decision makers, to support further assessment of the implications of policy implementation at the sectoral and regional scales.
- Article
(1618 KB) - Full-text XML
-
Supplement
(887 KB) - BibTeX
- EndNote


At the core of any strategy for sustained, long-term abatement of climate change are strong reductions in emissions of CO2 and other long-lived greenhouse gases (LLGHGs). However, most anthropogenic activities emit a suite of additional species, with a range of climate impacts, commonly termed short-lived climate forcers (SLCFs). While differing in characteristics and contribution to temperature change, their common feature of a much shorter atmospheric residence time compared to LLGHGs has resulted in significant discussion of the role of SLCF mitigation in strategies to reduce climate change, in particular to limit near-term warming (e.g., Bowerman et al., 2013; Pierrehumbert, 2014; Rogelj et al., 2015; Shindell et al., 2012; Shoemaker et al., 2013; Stohl et al., 2015).
Many assessments have placed particular emphasis on the subset of SLCFs with a warming impact on climate, namely black carbon (BC), methane (CH4) and tropospheric ozone (sometimes collectively referred to as short-lived climate pollutants, SLCPs) (e.g., AMAP, 2015; CCAC, 2019; UNEP, 2017). Assuming effective abatement of SLCPs, some studies estimate a reduction in global temperature increase of 0.2–0.5 ∘C by mid-century (e.g., Shindell et al., 2012). More recent work suggests that some of these early estimates may overestimate the effect of SLCP mitigation (Rogelj et al., 2014; Smith and Mizrahi, 2013; Stohl et al., 2015; Takemura and Suzuki, 2019). While results from early studies brought some concern that the attractiveness of SLCP mitigation could lead to delayed action on CO2 emissions, most scientific studies emphasize that SLCP measures should only be considered complementary to early and stringent CO2 mitigation for the achievement of long-term climate goals (Ramanathan and Carmichael, 2008; Rogelj et al., 2014).
SLCF mitigation may also give rise to potential trade-offs. Due to co-emission, any given mitigation measure or policy can affect a broad range of species. The combinations may, however, vary significantly between sources and mitigation strategies motivated by, and designed to address, different societal challenges. For instance, many SLCFs are tightly linked to air quality (Anenberg et al., 2012; Lelieveld et al., 2015; Shindell et al., 2012) and sustainable development (Haines et al., 2017; UNEP, 2019), in addition to their climate impacts. The numerous environmental and societal co-benefits of SLCF reductions are well recognized but may lead to adverse climatic consequences (Arneth et al., 2009). While some SLCFs with a warming contribution to temperature change can, in part, be mitigated individually (in particular methane), improving air quality requires consideration of all relevant species. Removal of all present-day anthropogenic aerosols may add as much as 0.5 ∘C of additional global near-term warming according to recent work (Hienola et al., 2018; Samset et al., 2018; Aamaas et al., 2019). Due to co-emission, species such as sulfur dioxide (SO2) are also commonly affected by measures to reduce climate warming even if these have LLGHGs as the primary target. Hence, while it remains clear that deep reductions in emissions of methane and BC play a key role in pathways for global emissions that limit global warming to 1.5 and 2 ∘C warming (Harmsen et al., 2019; Rogelj et al., 2015, 2018; Shindell and Smith, 2019; Xu and Ramanathan, 2017), co-emitted species such as sulfate need to be carefully considered.
A key characteristic of SLCFs is that the composition of emissions, as well as their subsequent radiative forcing, can vary significantly between individual emission sources (Bond et al., 2013; Lund et al., 2014b; Persad and Caldeira, 2018; Unger et al., 2010). While previous scenarios for long-term evolution of aerosols and ozone precursor emissions projected a general, rapid decline even in pathways with high climate forcing and greenhouse gas (GHG) levels (Gidden et al., 2019; Rao et al., 2017), the most recent generation scenarios, the Shared Socioeconomic Pathways (SSPs) (O'Neill et al., 2014; Riahi et al., 2017), exhibit a much larger spatiotemporal heterogeneity in projections of these emissions. Additionally, the SSPs provide a framework for combining future climate scenarios (representative concentration pathways, RCPs) with socioeconomic development and hence more detailed information about plausible future evolutions of society and natural systems. Up-to-date and detailed knowledge of the climate impact of individual emission sources is critical for the design of effective mitigation strategies and to provide decision makers with more integrated guidance on how to best address linkages between climate, sustainable development, and air quality in policy processes (Melamed et al., 2016). While studies comparing and quantifying the impacts of SLCFs and CO2 exist, they differ in selection of sectors and/or regions, methodology, and emission inventory, making direct comparison difficult (e.g., Harmsen et al., 2019; Kupiainen et al., 2019; Lund et al., 2014a; Sand et al., 2015; Unger et al., 2010). Furthermore, studies often consider only the equilibrium effect of present-day emissions, emission pulses or very simplified scenarios.
In the present work, we provide a comprehensive and updated investigation of the contribution to near- and long-term global temperature impacts from individual SLCF and LLGHG emissions. We first quantify the temperature response to an idealized pulse of present-day emissions to demonstrate the methodology and temporal behavior of the various emitted species, focusing on both added benefits and trade-offs offered by SLCF mitigation. Then we calculate the future evolutions of temperature impacts as they are projected to develop under the pathways for future socioeconomic development, climate policy, and air pollution described by the SSP–RCP scenarios. The temperature impact is calculated for 7 economic sectors and 13 source regions, accounting for best available knowledge and geographical dependence of the forcing efficacy of different SLCFs, thereby providing a more detailed breakdown than previous literature. By making our full dataset openly available, we aim to provide a toolkit for further studies of the implications of policy implementation at the sectoral and regional level, demonstrating the potential for such applications for a set of idealized sectoral emission reduction packages.
Using the concept of absolute global temperature change potential (AGTP) (Shine et al., 2005), we calculate the global-mean temperature response over time to emissions of CO2, CH4, ammonia (NH3), BC, organic carbon (OC), and SO2, as well as the ozone precursors nitrogen oxide (NOx) and carbon monoxide (CO) and volatile organic compounds (VOCs) from 7 sectors and 13 regions (Fig. 1).
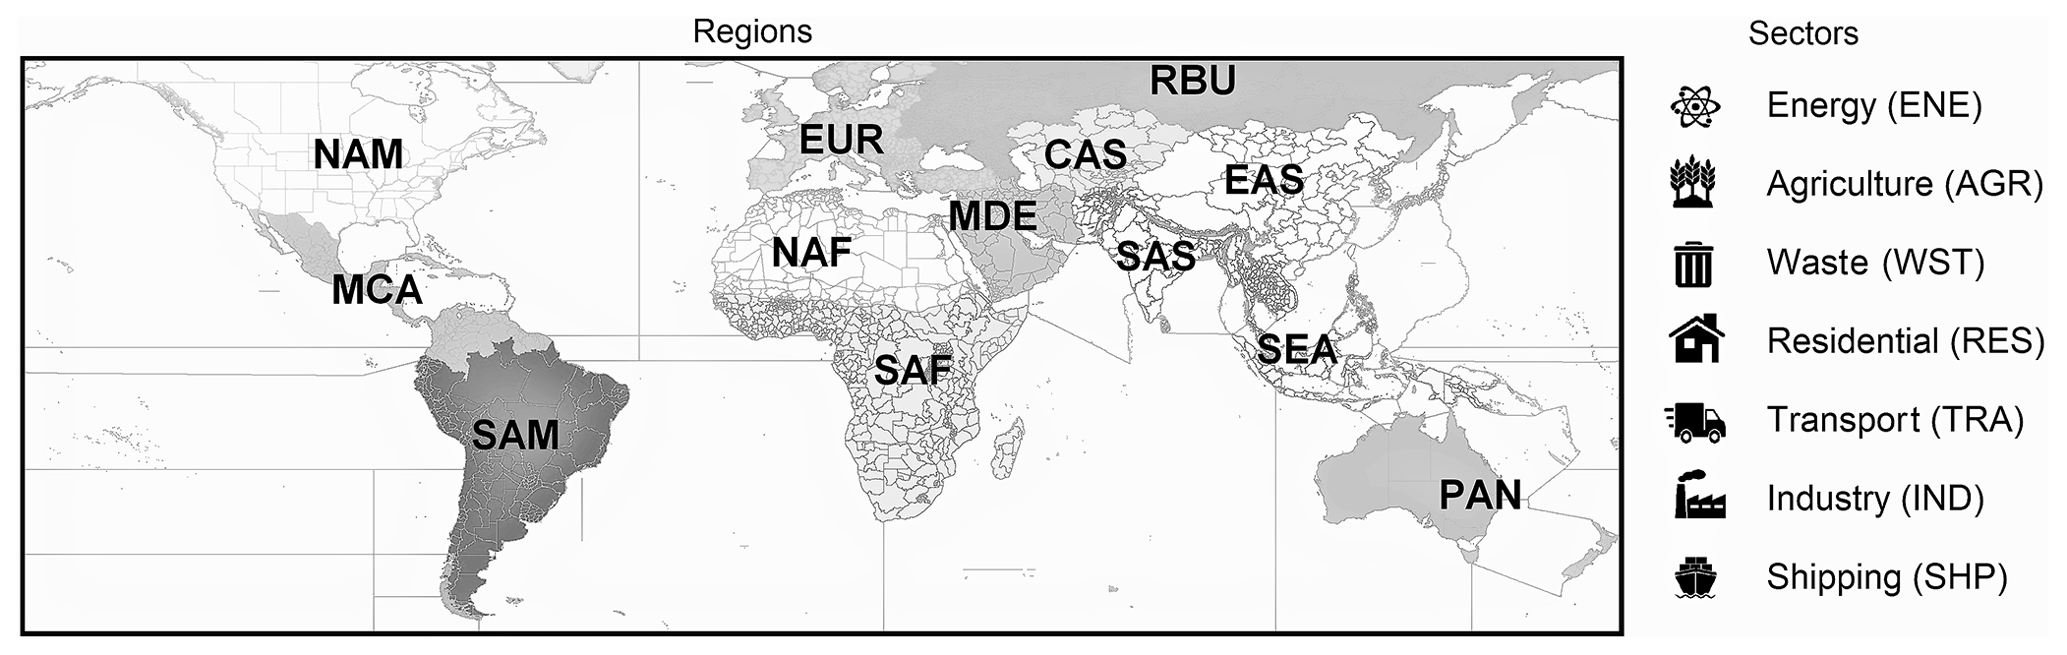
Figure 1Emission source regions and sectors used in the analysis.
2.1 Calculations of global and regional AGTPs
The AGTP is an emission-metric-based emulator of the climate response and a well-established method that enables us to quantify and compare global temperature impacts of a large number of sources and scenarios in a transparent and, in terms of computer resources, cost-effective manner. The approach is described in detail in the literature (Fuglestvedt et al., 2010; Shine et al., 2005; Aamaas et al., 2013); here we give a brief outline.
The AGTP gives the global-mean surface temperature response per kilogram of species emitted as a function of time after an emission pulse, i.e., an instantaneous one-off emission. At time H after the emission, the AGTP for species i is given (for each sector and region) by
where Fi is the radiative efficiency. Emissions of SLCFs can have both direct and indirect radiative effects. For BC, OC, and SO2 we account for the direct, semi-direct, and indirect radiative forcing (RF) as described below. AGTPs for NOx, CO, and VOCs include the forcing due to tropospheric ozone production and (for NOx) nitrate aerosol formation, as well as the longer-term effect on methane lifetime and methane-induced ozone loss. The AGTP for methane includes the direct forcing, as well as the effect of OH-induced changes in its lifetime and effects on tropospheric ozone and stratospheric water vapor. See Aamaas et al. (2013) for details and analytical expressions for the AGTP of individual species.
For CO2 and methane, we calculate the global-mean F for year 2014 global concentrations (i.e., the year that is considered present-day in our emissions data; see below) using the equations from Etminan et al. (2016). Compared to the approach used by the IPCC Fifth Assessment report (AR5) (Myhre et al., 2013), this increases the radiative efficiency of methane by 14 %. For NH3, we use the IPCC AR5 best estimate for global mean radiative efficiency for all regions. For the remaining short-lived species, we derive values of Fi that depend on the location of the emission and calculate region-specific AGTPs for BC, OC, SO2, and the ozone precursors. The regional radiative efficiencies (i.e., the global radiative forcing per unit of regional emissions) for BC, OC, sulfate, nitrate, and ozone (in response to NOx, CO and VOC) are derived using radiative kernels (Samset and Myhre, 2011) and atmospheric concentrations from simulations performed with the global chemistry transport model OsloCTM3 (Søvde et al., 2012) for the second phase of the Hemispheric Transport of Air Pollution (HTAP2) (Janssens-Maenhout et al., 2015). Details about the chemistry and aerosol parameterizations and properties can be found in Lund et al. (2018). In addition to their direct radiative effects, aerosols also affect the energy balance through modifications of clouds and atmospheric heating rates (indirect and semi-direct effects). To account for the additional negative RF resulting from aerosol–cloud interactions, we scale the AGTP of SO2 by a factor of 2.1 based on the ratio of total global RF of sulfate to that due to direct effects alone from the IPCC AR5 (Myhre et al., 2013). Due to lack of available information about geographical dependence of the radiative efficiency, the same scaling factor is applied for all regions, recognizing that this is a simplification as the indirect effect also likely varies with location of emission. We also account for the semi-direct effect of BC (i.e., the rapid adjustments of the atmosphere to the local heating (Smith et al., 2018). Here we use the multi-model ratio between semi-direct and direct BC RF from Stjern et al. (2017) and calculate an average adjustment factor for the rapid adjustments of −15 %. This is then applied to the AGTP of BC for all regions except South Africa, where Stjern et al. (2017) found a small positive forcing from rapid adjustments. Radiative forcing of BC deposition on snow and ice is not included in our estimates.
IRFT in (Eq. 1) is the impulse response function used to estimate the temperature response to a given radiative forcing:
where cj and dj are constants and timescales of the fast and slow model of the climate system response, respectively, and λ is the equilibrium climate sensitivity (ECS). An IRF is also used to represent the atmospheric decay of CO2. Several different IRFs exist in the literature. Here we use the IRFT from Geoffroy et al. (2013) (G13) and the IRF from Joos et al. (2013). Values of cj, dj, and λ derived from the analytical solution of the two-layer energy balance model used by G13 are given in Table 1. Compared to the IRFT from Boucher and Reddy (2008; B&R08) used in the bulk of previous metrics studies including IPCC AR5, G13 has shorter timescales and yields a lower ECS (0.885 K (W m compared to 1.06 K (W m from B&R08. To place our values in the context of previous literature and explore sensitivities to the choice of IRFs, we perform additional calculations using different combinations of IRFT and IRF; see Sect. 1 of the Supplement.

Finally, we consistently account for the climate–carbon feedback (CCf) in the AGTPs. The IRF, derived from complex models, implicitly includes the CCf. However, this is not the case for other components. This inconsistency was first highlighted in Myhre et al. (2013), where a first attempt to include the CCf was made for halocarbons based on an earlier study by Collins et al. (2013). This method has since been refined. Here we use the framework developed by Gasser et al. (2017) where a separate IRF for the CCf was derived using the simple Earth system model OSCARv2.2. This IRF is used to calculate a Δ AGTPi(H), which is then added to the AGTPi(H) without CCf. The difference between this method and the approach taken by Myhre et al. (2013) is discussed in Gasser et al. (2017). We also perform a sensitivity test to quantify the impact on our estimated temperature responses of excluding the CCf; see Sect. 4.1. Furthermore, as different methods to account for the CCf exist in the literature, we provide both sets of AGTPs for further use (see “Data Availability”).
2.2 Emission data and temperature response calculations
As described above, we investigate the role and global temperature impacts of SLCF and CO2 from two different perspectives. First, the AGTPs at two given time horizons H (here 10 and 100 years) are multiplied by year 2014 emissions from the Community Emission Data System (CEDS) (Hoesly et al., 2018) for each species, sector, and region. The result is the near- and long-term global temperature response, ΔTi(H), to present-day regional and sectoral emissions.
Next, we quantify the temperature response to temporally evolving emissions from 1900 to 2100. The AGTP framework can readily be extended from pulse-based calculations since any scenario can be viewed as a series of pulse emissions and analyzed through convolution (Aamaas et al., 2013). The temperature response ΔT at time t for species i is (for each region and sector) given by
Importantly, the AGTPs are linear in that they do not account for the potential changes in radiative efficiency with changing background pollution levels; see Sect. 4 for further discussion.
Historical emissions are from the CEDS database, while future emissions follow the SSP–RCP scenarios. Gridded and harmonized emissions are available via ESFG from the Integrated Assessment Modeling Community (IAMC) for the nine SSP–RCP combinations that form the core of the Coupled Model Intercomparison Project Phase 6 (CMIP6) experiments (Gidden et al., 2019): SSP1-1.9, SSP1-2.6, SSP2-4.5, SSP3-7.0, SSP3-lowNTCF, SSP4-3.4, SSP4-6.0, SSP5-3.4, and SSP5-8.5. The gridded SSP–RCP data product, including the methodology for country- and sector-level emission mapping, is documented by Feng et al. (2020). We extract regional emission scenarios using the geographical definitions and spatial mask from HTAP2 (Janssens-Maenhout et al., 2015). Furthermore, we consider the energy (ENE), agriculture (AGR), waste (WST), residential (RES), industry plus solvents (IND), transport (TRA), and shipping (SHP) sectors, as they are defined in the CEDS-SSP inventory (Feng et al., 2020; Hoesly et al., 2018). Due to the large spread in historical estimates and lack of emissions consistent with CEDS, we do not include CO2 emissions due to land use and land cover change. Additionally, agricultural waste burning is excluded as these are more difficult to mitigate and estimates of future CO2 emissions are not available.
We establish a range in total net global-mean temperature response on 10- and 100-year timescales due to uncertainties in radiative forcing by performing a Monte Carlo analysis. Each RF mechanism is treated as a random variable, following a probability density function (PDF) defined based on existing literature, and the distribution for the total RF is derived by summing the individual PDFs, i.e., assuming that each RF mechanisms is independent. For the aerosols and their precursors, we use the multi-model results from the AeroCom Phase II experiment (Myhre et al., 2013a), while for CO2, NH3, and ozone precursors, we use the uncertainties from the IPCC AR5 (Myhre et al., 2013b). For further details, see Aamaas et al. (2019) and Lund et al. (2017). Our temperature responses are also influenced by uncertainties in emissions and climate sensitivity. A comprehensive analysis of uncertainty in all three factors is challenging due to lack of data, but the potential impact is discussed in Sect. 4.
4.1 Near- and long-term temperature response to current emissions
We first discuss the global mean surface temperature response to 1 year of present-day (i.e., year 2014) emissions for global total emissions and broken down by key contributing sectors and geographical source regions as shown in Fig. 2. While we here select 10- and 100-year time horizons to represent near- and long-term impacts, we recognize that other choices may affect the relative importance and even sign of the temperature response from some of the SLCFs, or that they may be more relevant for certain applications. For this reason, we also provide the full time series of our AGTPs (see Data Availability).
Globally, current emissions result in an approximate balance between cooling and warming SLCFs in the near-term, with main warming contributions from BC and CH4and cooling from SO2 and NOx (Fig. 2a). The total net effect after 10 years is therefore only slightly larger than that due to CO2 alone. As the impact of the SLCFs decays over years to decades upon emission, the total net temperature impact after 100 years is predominantly determined by CO2. As clearly seen in Fig. 2a, CO2 emissions also cause a notable contribution to near-term warming. While both of these features are well known in the scientific community, the role of CO2 as driver also of near-term warming is not always fully acknowledged in the discussions of LLGHGs versus SLCFs.
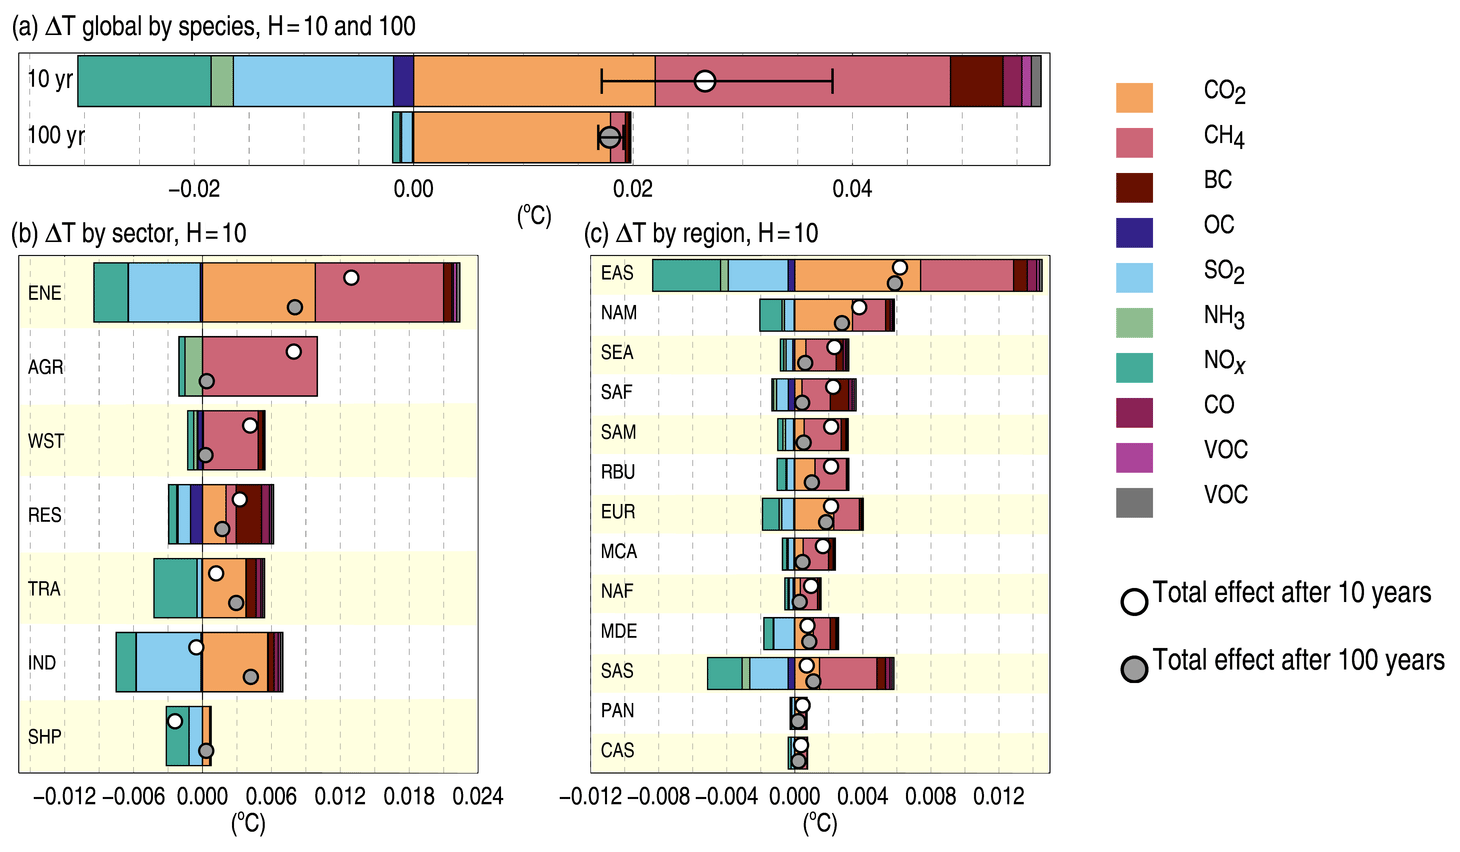
Figure 2Global-mean surface temperature impact (∘C) (a) 10 and 100 years after 1 year of present-day (i.e., year 2014) global total emissions of SLCFs and CO2, (b) after 10 years following emissions from 7 major economic sectors, and (c) after 10 years following emissions in 13 source regions. Panels (b) and (c) are sorted by total net effect on the 10-year timescale (white circle). Error bars (±1 SD) in (a) represent the range in total net temperature impact due to uncertainties in radiative forcing.
Differences in the mix of emissions result in net impacts on global temperature that vary significantly in both magnitude and sign between sectors and regions. Of the economic sectors, energy (ENE), agriculture (AGR), and waste management (WST) give the largest net near-term warming (i.e., after 10 years) (Fig. 2b). For AGR and WST, this is a result of strong methane-induced warming. The energy sector (ENE) is also characterized by a significant warming due to methane (originating from fossil fuel mining and distribution), as well as CO2, but also by a considerable cooling from high emissions of SO2. Our results hence reinforce the importance of methane as a driver of near-term warming but show that the net effect on global temperature of SLCF mitigation may be small in the case of the energy sector if simultaneous reductions in SO2 take place. A particular feature of the energy sector, however, is that a significant portion of methane mitigation from oil and gas (production and distribution) can be done independently from other energy-related (combustion) emissions. An explicit distinction between production and combustion emissions was not available in the gridded CEDS inventory, but, as illustrated in Sect. 3.2, mitigation strategies targeting one category or the other can result in distinctly different temperature outcomes. Global emissions from industry (IND) and shipping (SHP) cause a net cooling impact despite a considerable warming from CO2 emissions. In the long term, the net impact of AGR and WST is small, while energy is the largest individual contributor to warming due to its high CO2 emissions (note that N2O is not included in the present analysis as emissions are not included in the gridded CEDS and SSP database but would add a small contribution to the long-term impact of AGR). The second largest driver of long-term temperature change is IND, demonstrating the importance of non-CO2 emissions for shaping relative weight over different time frames. Aviation is not included here but was recently evaluated by Lund et al. (2017).
The largest regional contribution to net near-term warming is caused by emissions in East Asia (EAS) and North America (NAM), followed by Southeast Asia (SEA) and South Africa (SAF) (Fig. 2c). However, the relative contributions from individual species vary. In EAS and NAM, as well as Europe (EUR), the impact of current emissions of cooling and warming SLCFs approximately balance in the near-term, and these regions cause comparable net warming impacts on 10- and 100-year timescales, as seen by comparing the white and grey circles in Fig. 2c. These balancing characteristics do not imply that SLCF emissions should not be reduced but that the net benefits on global temperature may be low if mitigation measures that simultaneously affect both cooling and warming SLCFs are implemented, in turn placing added focus on the need to reduce CO2 in order to mitigate warming in both the near and long term. In SEA, SAF, and South and Central America (SAM and MCA) methane and BC emissions are presently high while emissions of CO2 and cooling aerosols are low compared to other regions, resulting in a net warming impact after 10 years that is substantially higher than that of CO2 alone. This, in turn, suggests that using SLCF emission reduction to limit near-term warming would be more effective here than in many other regions. Such detailed characteristics at the emission source level are needed for the design of effective mitigation strategies.
Breaking down the temperature impacts further into economic sectors within each region (not shown), we find that the results largely mirror the relative role of species and sectors on the global level in Fig. 2b. The warming contributions in South America and Africa, and hence higher potential for net temperature reductions, stem primarily from the agriculture, waste management, and energy production sectors. In SAF, mitigation of BC emissions from the residential and transport sectors also play an important role. In most regions, emissions from IND cause a net negative impact on global temperature change, while in the ENE sector impacts of cooling and warming SLCFs compete and warming from CO2 is a key driver of both near- and long-term warming.
Overall, the potential for global temperature reductions inherent in the present SLCF emissions is highly inhomogeneous, and co-emitted species – including CO2 – must be taken into account in any targeted climate policy for reduction of near-term warming. We emphasize that mitigation of SLCFs, while important, need to be sustained and complementary to strong cuts in CO2 for long-term reduction in global warming.
4.2 Temperature response to example mitigation measures
The results above suggest that strategies for emission reductions clearly can play out very differently in terms of net impact on global temperature across source region and sector. To further illustrate the importance of considering co-emissions and demonstrate the applicability of our dataset, we calculate the effect on global temperature in the near- and long-term following simplified examples of emission reduction packages in three of the global sectors (ENE, AGR, and SHP). The measures are broadly assumed to be motivated by either (i) air quality improvements (package 1, P1), (ii) methane reductions (as part of the SDG agenda or climate mitigation) (P2), or (iii) CO2 reductions and climate targets (P3). Table 2 shows the set of species reduced in each case, with the percentage reduction given in parentheses. We note that these reductions are based on expert judgment given underlying assumptions, e.g., for the reduction in shipping speed, and are associated with uncertainties. Furthermore, they are assumed to occur instantaneously. However, as the primary purpose here is illustrative, the examples are kept idealized and should be interpreted as such.
Table 2Summary of species considered in the idealized emission reduction packages, the percentage reduction assumed, and example polices. All percentages refer the total emissions of a given sector and not total anthropogenic emissions.
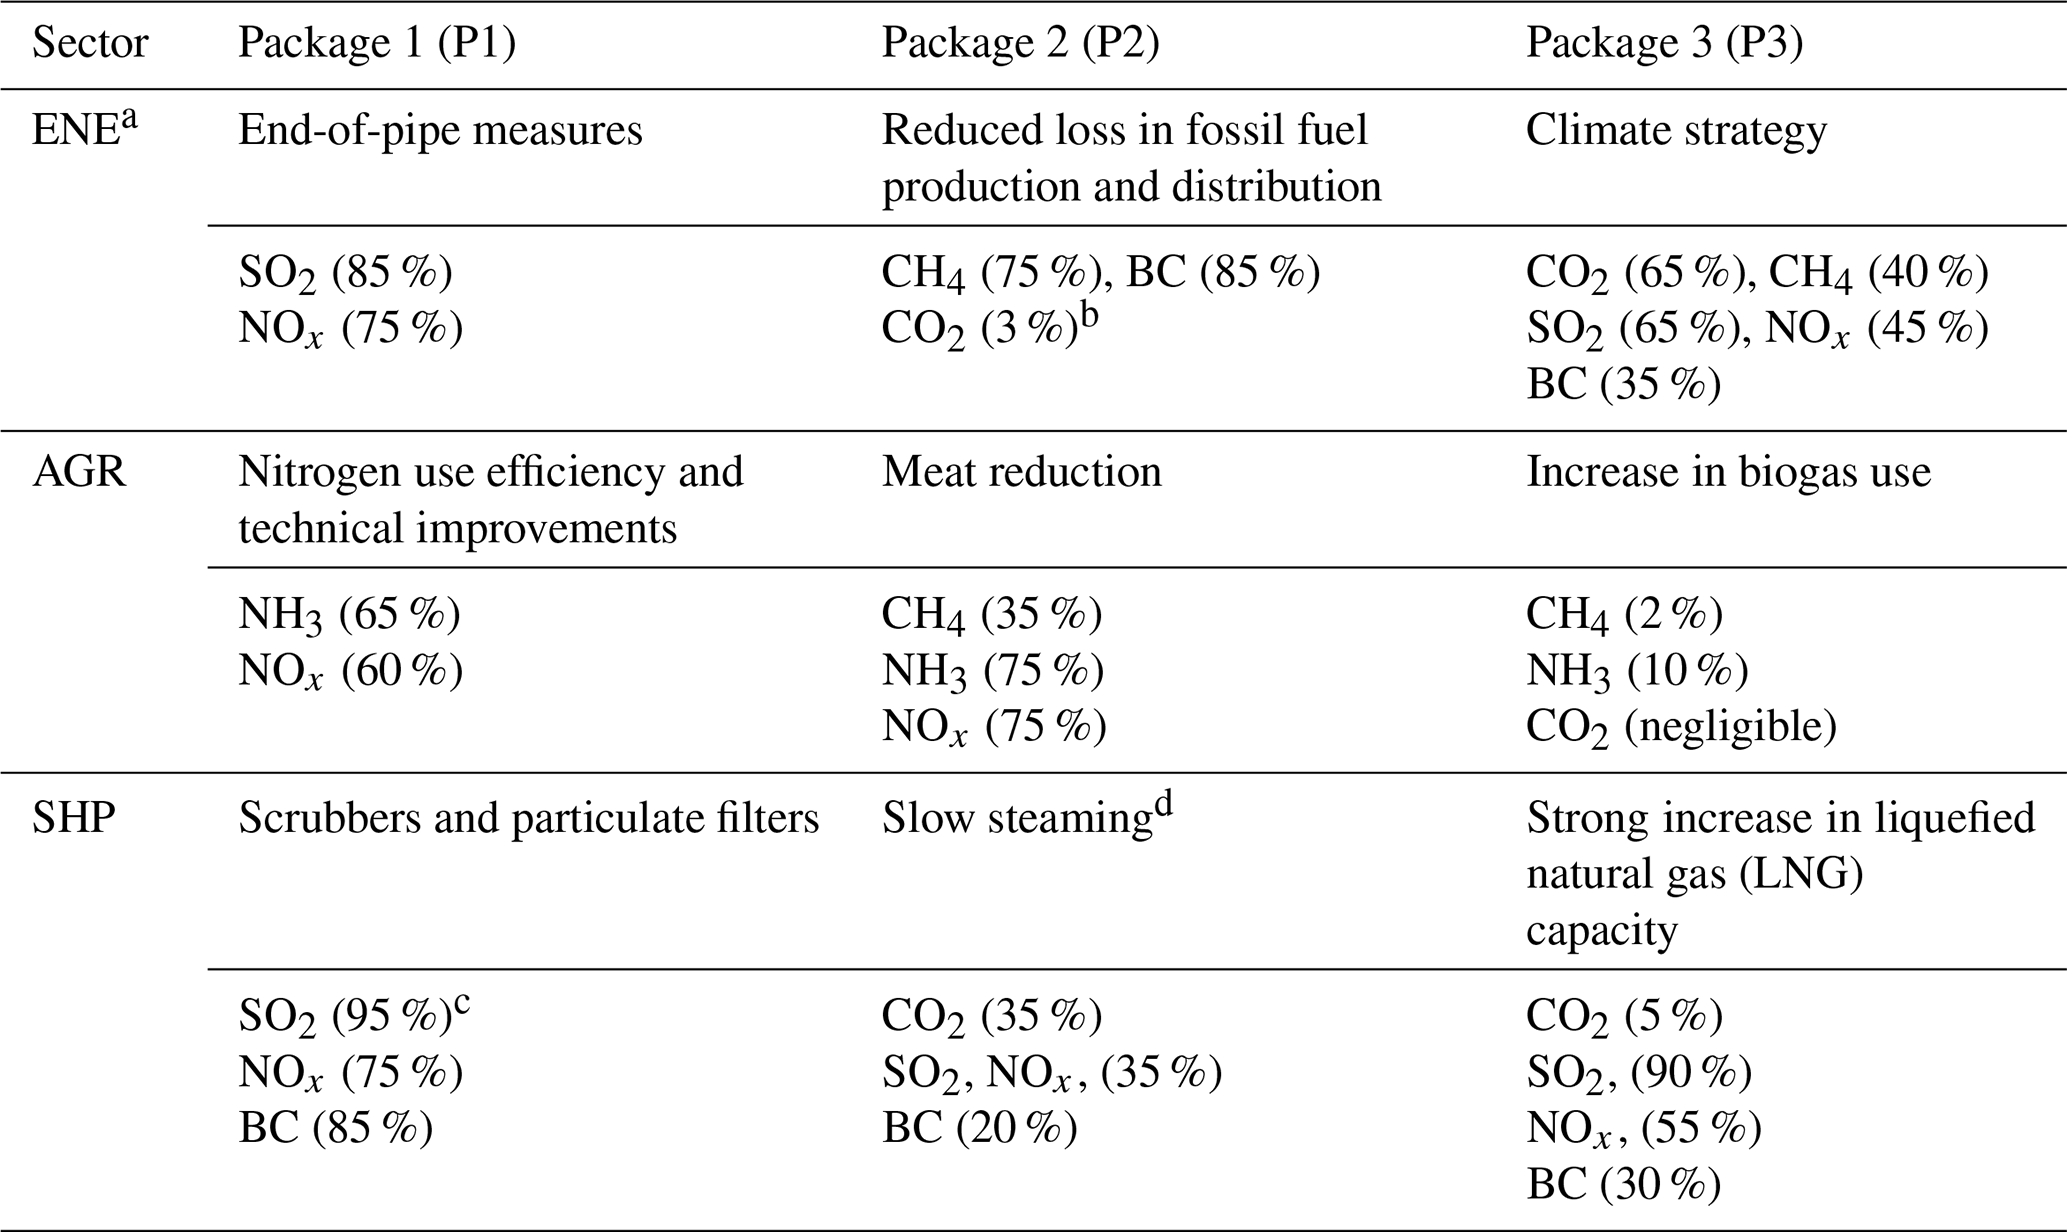
a Here represents stationary combustion in power and industry.
b Through use of recovered CH4 instead of coal as fuel in oil, gas, and coal industries.
c The reduction level is based on a year 2015 baseline with
relatively high sulfur content for international shipping.
d Assuming about 20 % reduction in speed.
The global temperature effect resulting from elimination of emissions in each package on 10- and 100-year time horizons is shown in Fig. 3. The energy sector can be subdivided into fossil fuel production and distribution and combustion categories. An air-quality-driven set of measures (P1), e.g., end-of-pipe measures such as scrubbers, filters, and catalysts, could therefore be implemented that would strongly reduce SO2 and NOx emissions but not noticeably affect the key methane or CO2 contribution. Such measures are well understood, i.e., their efficiencies, costs, and technical implementation have been well documented and their real-life application is already widespread, but there is still large potential, especially in fast-growing economies. As shown by the top bar on the left in Fig. 3, the subsequent near-term temperature impact would be a warming contribution due to removal of cooling aerosols, adding to the already large net warming impact of the sector (Fig. 2b). As seen from the right-hand side of Fig. 3, the long-term effect would also be minor, leaving the dominating CO2 warming. A significant fraction of methane emissions, originating from the production and distribution of fossil fuels, could be mitigated separately from several other SLCFs, for instance by addressing venting and leaks from oil, gas and coal exploration, and upstream and downstream gas flaring. Respective measures would include capture, recovery, and use of gas, as well as reduced and improved flaring, with added benefits in terms of reduced CO2 and BC (P2). This results in a notable reduction in the near-term impact of the sector. Finally, P3 shows the impact of a dedicated climate strategy, here illustrated by the difference between a middle-of-the-road and a below-two-degrees scenario (in 2050, obtained from the GAINS model (Klimont et al., 2017), where more substantial CO2 mitigation also results in larger reduction of the sector's long-term temperature impact than in P2.
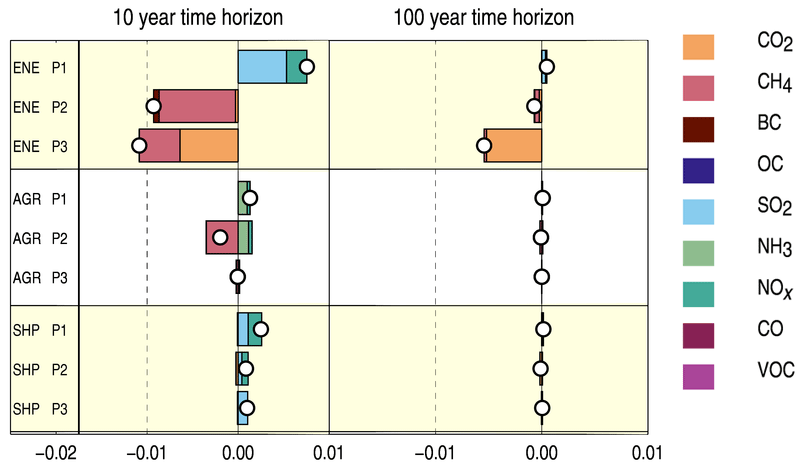
Figure 3Global-mean surface temperature impact (∘C) on 10- and 100-year time horizons resulting from instantaneous reductions of different sets (listed in Table 2) of SLCFs and CO2 emissions. White circles indicate the net impact of these reductions.
Due to the dominating contribution from methane to the temperature impact of the agriculture sector, measures that primarily target other emissions, such as improving nitrogen use efficiency (P1), unsurprisingly bring low net climate benefits unless accompanied by simultaneous measures for methane reductions (P2). An example of the latter is promoting dietary changes, leading to lower meat consumption and consequently lower livestock numbers. Reducing NH3 and NOx (P1) could, however, bring important local air quality benefits, and our results suggest that these would come with relatively small trade-offs from unmasking of aerosol cooling, at least in terms of global mean temperature on this timescale. Only small additional benefits (at a global scale) were estimated for the increased use of biogas (P3) based in utilization of livestock manures. The net impact of the shipping sector (SHP) is a cooling in the near-term, as shown in several previous studies (e.g., Berntsen and Fuglestvedt, 2008; Fuglestvedt et al., 2009). Measures that eliminate shipping emissions of SO2 (low sulfur fuels, scrubbers) and NOx (selective catalytic reduction) hence result in an added near-term warming also when simultaneous elimination of the sector's CO2 emissions occur (P2, P3).
This example is simplified and illustrative, and we calculate pulse-based temperature impacts following instantaneous emission reductions. However, since our pulse-based emission metrics can easily be used to study changes over time to any emission or policy scenario through convolution (Aamaas et al., 2013), our dataset has broad applicability. In the next section, we use precisely this method to quantify the impact of temporally evolving emissions according to the most recent scenarios.
4.3 Temperature response to SLCFs and CO2 under the SSP–RCP scenarios
While knowledge of the present-day emission composition and net temperature impact over time is essential to support mitigation design and implementation, real-world emissions will evolve following a combination of socioeconomic developments, technological advancement and policy adoption. Next, we investigate plausible pathways for the future impact of SLCFs and CO2 by quantifying the global temperature change over the period 1900–2100 to regional and sectoral emissions following the SSP–RCP scenarios. In the following paragraphs, we show results from four of the nine SSP–RCP scenarios used in the present analysis (SSP1-1.9, SSP2-4.5, SSP3-7.0 and SSP5-8.5). These span the range of future emission evolutions, but we recognize that the realism of SSP5-8.5 is debated in the literature due to its very high emissions (e.g., Ritchie and Dowlatabadi, 2017).
Figure 4 shows the evolution of temperature response under the SSP–RCPs for our source regions, with corresponding results for the global economic sectors given in Fig. S3. Our emissions regions have large differences not only in terms of present-day emissions but also of past evolution. This historical contribution, which was not captured in the analysis of the first half of the paper, brings NAM and EUR as the two largest contributors to the present-day warming (Fig. 4a) due to their much higher past CO2 emissions, in line with previous literature (Höhne et al., 2011; Skeie et al., 2017). While presently being the largest emission source, EAS only surpasses EUR and NAM in terms of contribution to temperature change between 2020 and 2030 when the cumulative effect of CO2 is accounted for. In SSP1-1.9, where emissions of CO2 decline strongly during the first half of the century in all regions, the net temperature response levels off or starts to decline in the second half of the century. In the remaining scenarios, the net temperature impact increases over the century for all regions. EAS remains the largest contributor, whereas in SSP5-8.5 South Asia (SAS) overtakes NAM as the second most important region by 2100 and SAF reaches the same order of magnitude as EUR. This shows a projected shift in emissions and increasing importance of the developing world. We note that since our primary focus here is on quantifying the contributions to, and potential for further reduction of, near- and long-term temperature impacts, we do not include negative CO2 emissions, which is already a mitigation measure. Furthermore, the gridded SSP–RCP inventory only provide negative CO2 as a separate category without information for mapping these emissions to economic sectors. We do, however, include the negative CO2 category in our inventory of regional scenarios for further analyses beyond our study (see “Data Availability”).
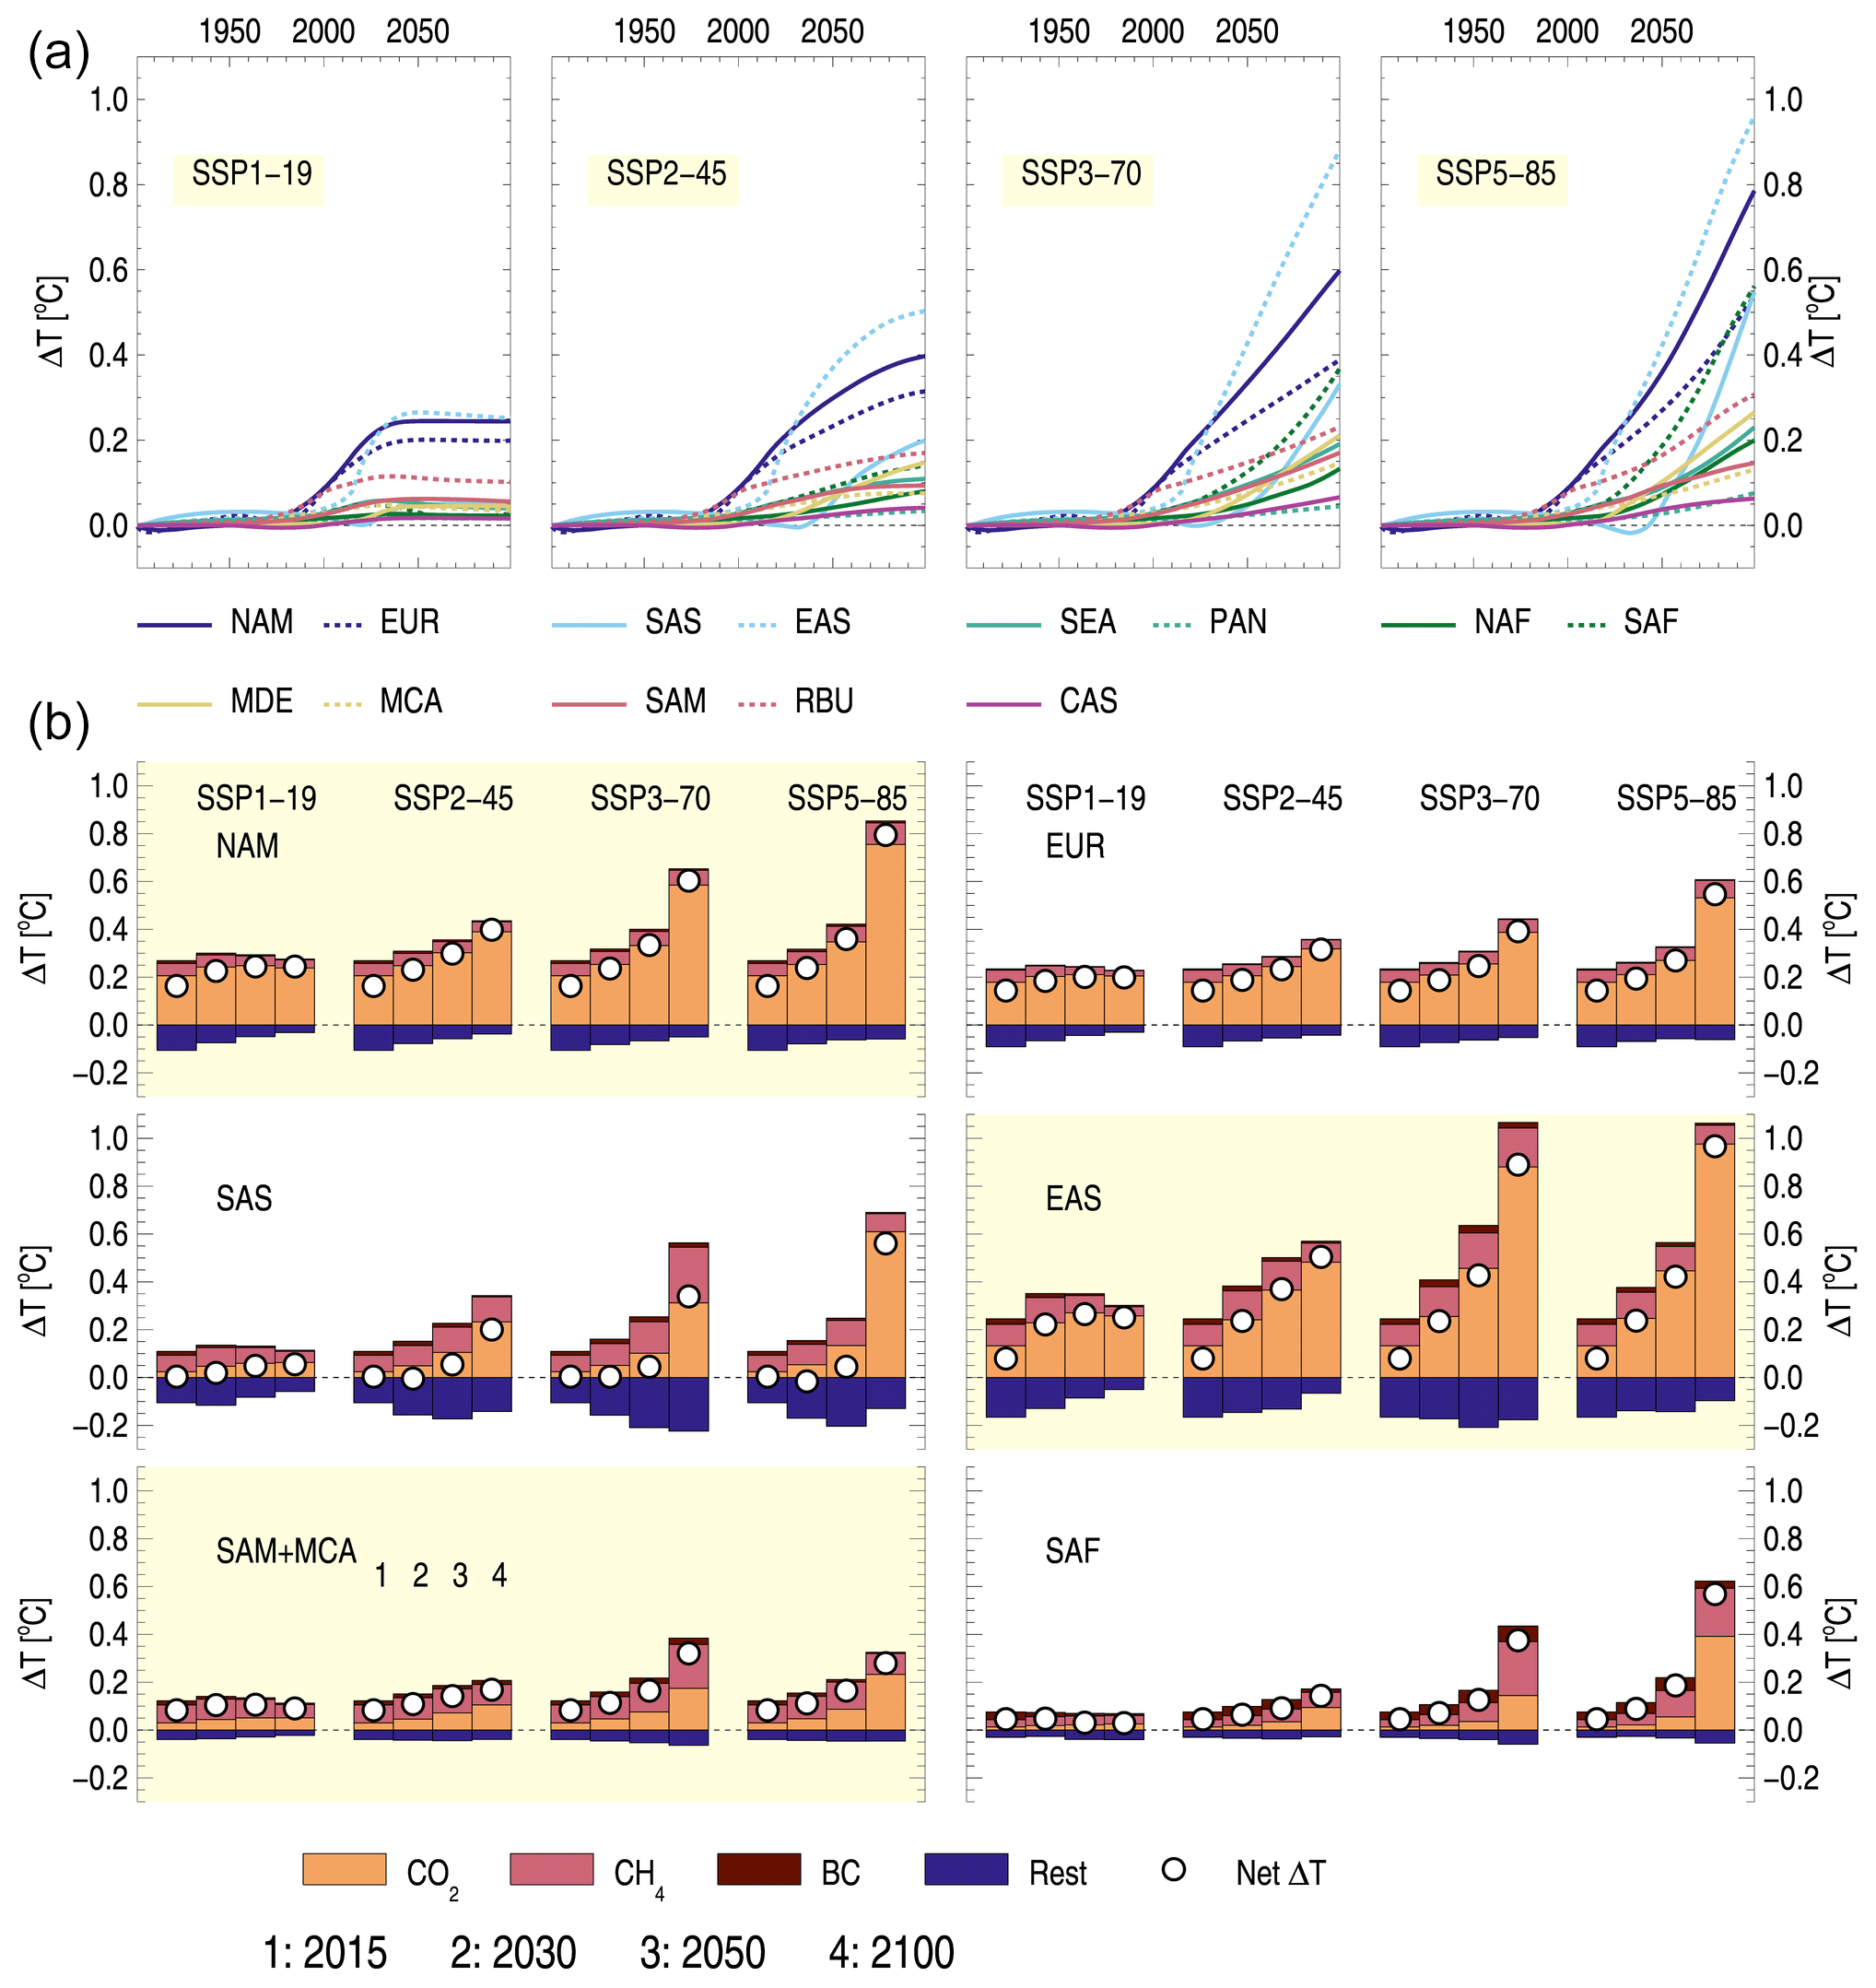
Figure 4Global mean temperature response to historical emissions and future SSP pathways: (a) net (i.e., sum over all species and sectors) response over the period 1900 to 2100 for each region and scenario and (b) net response in 2015, 2030, 2050 and 2100 to emissions in six regions broken down by contributions from CO2; BC; methane; and the sum of SO2, OC, NH3, and ozone precursors (i.e., “rest”).
In our calculations, the net temperature response to emissions from the global energy (ENE) sector becomes larger than that due to AGR and RES in the early 2000s (Fig. S1a), after which ENE remains the largest individual sector until 2100 in all scenarios. The relative importance of AGR and ENE historically is yet another example of how including SLCFs can change relevance over different time frames, as also demonstrated by Reisinger and Clark (2018) for non-CO2 livestock emissions. In our results, both the warming due to CH4 from AGR and the contributions from cooling emissions from ENE act to shape the relative role of the two sectors over time. The global mean temperature impact of IND switches from a net cooling to a net warming in the late 20th century as the warming due to CO2 accumulates and overwhelms the cooling from SO2.
While the contribution from CO2 to the net warming becomes dominant by 2100 for most regions and sectors in all scenarios, the relative importance of SLCFs and CO2 continue to be highly variable across emission source over time, in particular under SSP3-7.0 and SSP5-8.5. This can be seen in Fig. 4b, where we break down the future net temperature response in 2030, 2050, and 2100 into individual contributions from methane, CO2, BC, and the sum of SO2 and NOx. Here we show a selection of the source regions that differ notably in composition and temporal trend. See Fig. S4 for remaining regions.
The SSP–RCPs differ in both climate forcing targets and stringency of air pollution control, as well as underlying socioeconomic development. SSP1-1.9 is characterized by low societal challenges to mitigation and adaptation, and strong climate and air quality policies, resulting in rapidly declining emissions of both SLCFs and CO2. However, even for strong air pollution there is a differentiation between high-, medium- and low-income countries, with a substantial time lag in the latter two (Rao et al., 2017). For example, emissions of SO2 in SAS and SAF decline less than in other regions, subsequently maintaining a significant cooling contribution to the temperature impact. In the intermediate scenario, SSP2-4.5, there is a reduction in emissions, but this is delayed and slower compared to SSP1-1.9. In SSP3-7.0, the world follows a path with more inequality and conflict, where only weak air pollution control is implemented and the end-of-century climate forcing, and hence CO2 emissions, is higher. Subsequently, emission trends and SLCF contributions display more regional heterogeneity. There is a particularly strong projected increase in methane emission in South Asia, Africa, and South America in this scenario. While previous decades have seen a southeastward shift in air pollution emissions, from high-income regions at northern latitudes to East Asia and South Asia, these findings suggest that a second shift may be underway, towards low- and middle-income countries in the developing world. Further studies are needed to improve the knowledge about the resulting climate and environmental consequences, as well as how to strengthen the mitigation options in these regions. While EAS remains the region with the largest warming impact by 2100 in all scenarios, the contributions to warming from methane and BC in SAF and SAS surpasses those of EAS in 2100 in both SSP3-7.0 and SSP5-8.5. The net temperature response to emissions in SAS increases from close to zero to a significant warming as CO2 emissions increase. SSP5-8.5 is characterized by high challenges to mitigation and high climate forcing in 2100 but still assumes strong air pollution control since the high use of fossil fuels would otherwise result in unbearable air pollution levels. Combined, this leads to increasing temperature impact due to increasing CO2 emissions with lower SLCF impacts than in SSP3-7.0 but a non-negligible contribution from methane for several regions. Hence, in medium- and low-income regions, SLCFs, and in particular methane, are projected to play a continued important role for future temperature change.
Clearly, and as expected, the largest difference in SLCF contributions to future temperature response is between SSP1-1.9 and SSP3-7.0. To see where the largest additional climatic benefit can be gained from mitigating SLCF emissions in line with SSP1-1.9, relative to SSP3-7.0, we show the difference in temperature between these two scenarios in 2030, 2050, and 2100 in Fig. 5. Results are shown by region and sector, for all combinations where the temperature difference is greater than ±0.01 ∘C. For comparison, the CMIP6 mean difference in projected surface temperature between SSP3-7.0 and SSP1-2.6 (which is close to SSP1-1.9 in emissions) is around 0.5 ∘C in 2050 and 2 ∘C in 2100 when accounting for all global emissions (Tokarska et al., 2020). As seen from Figs. 4 and S3, CO2 is the key driver of this long-term temperature difference between the scenarios for most sectors and regions. However, as seen in Fig. 5, there are also important SLCF contributions, most notably from the large sources of methane: agriculture, energy, and waste management. Furthermore, 9 of the 12 top contributions are from regions in Africa, South Asia, or South and Central America, again demonstrating the importance of the development in low- and middle-income countries for future levels of SLCFs. Figure 5 also shows how the strong SLCF mitigation in SSP1-1.9, relative to SSP3-7.0, can result in a net warming contribution to climate for some region–sector combinations, as exemplified by the industry sector in East Asia and South Asia. As shown by the data on the right-hand side of Fig. 5, for most sector–region combinations, around 10 % of the avoided (or added) warming from strong mitigation would already be realized by 2030, and around 40 %–50 % would be realized by 2050.
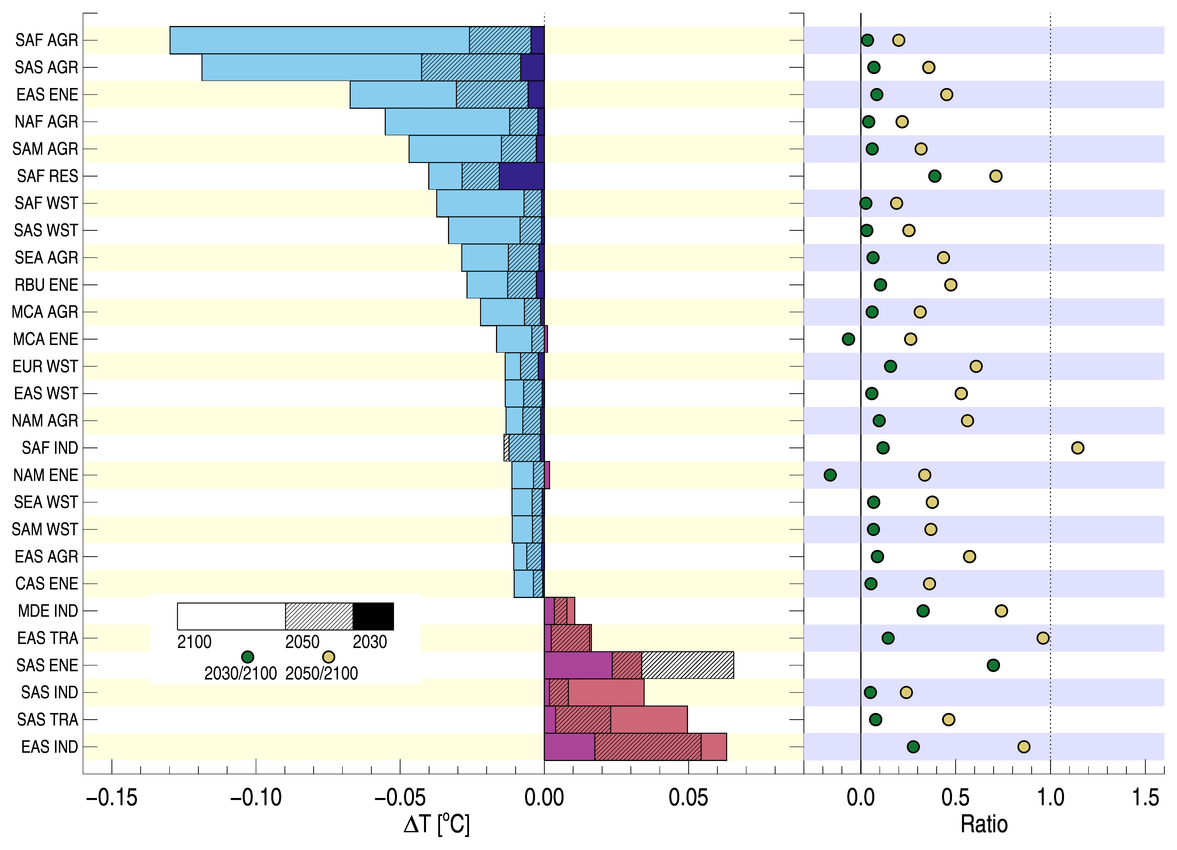
Figure 5Difference in net SLCF (i.e., sum of all components except CO2) temperature response between SSP1-1.9 and SSP3-7.0 in 2030, 2050, and 2100 by region and sector. Only combinations of sectors and regions where the differences in global temperature response is larger than ±0.01 ∘C are shown. For each of these combinations, the data on the right show the ratio between the temperature response difference in 2030 and 2100 and between 2050 and 2100.
In terms of avoided global warming, there is much to be gained by moving from a global emission pathway following SSP3-7.0 to one following SSP1-1.9, including contributions from reductions of SLCFs, as discussed above. While a comprehensive assessment of policy and technological interventions required to translate this potential to actual emission cuts is beyond the scope of the present study, we outline key general features and discuss specific examples in the case of methane in the following paragraphs.
The available literature suggests that rapid reductions of air pollutants' emissions are technically possible drawing on experience in both developed and developing countries (Crippa et al., 2016; Kanaya et al., 2020; Klimont et al., 2017) but would require simultaneous strengthening of institutions to enforce the laws. The focus of policies would differ between OECD countries and the developing world. As demonstrated by our findings, further measures in the OECD would primarily focus on reducing emissions from residential heating, non-road transportation, and agriculture, while assuring enforcement of legislation in power and industry sectors. The rapidly industrializing and developing countries would need to further strengthen legislation for the power, industry, and transport sectors; implement improved measures to reduce waste management emissions; reduce emissions from agriculture; and provide wide access to clean fuels to secure cooking and heating needs. Several of these policies would contribute positively to the SDGs (Rafaj et al., 2018). For methane, i.e., the non-CO2 component found here to be most important for future warming, the technical potential for considerable reductions until 2050 exists (Höglund-Isaksson et al., 2020). Reducing venting, increasing utilization of associated petroleum gas in oil and gas exploration, increasing the use of biogas from waste should be a priority. Integrated response options that can deliver significant mitigation also exist for the agriculture sector, including increased productivity of land used for food production and improved livestock management (Smith et al., 2019). A similar suite of methane measures is needed for both the developed and developing world, although waste management requires larger transformation, and there is additional significant potential to reduce emissions from coal mining sector in the latter. A recent study suggests that anthropogenic fossil methane emissions may be significantly underestimated (Hmiel et al., 2020), and as such reductions may be even more critical. Specific measures for reducing aerosols and ozone precursors in order to improve air quality while contributing to climate change mitigation have recently been assessed for Southeast Asia (UNEP, 2019) and Latin America (UNEP, 2018). As shown in the present analysis, contributions from SLCFs to temperature change are projected to increase strongly in the Middle East and Africa in several scenarios. An increasing carbonization in Africa south of the Sahara, primarily due to the increasing use of oil in the transport sector, has already been observed (Steckel et al., 2019). This underlines the need for further focus on these regions in future studies and assessments.
SSP3-7.0 and SSP1-1.9 not only differ in the stringency of the assumed air pollution control but also in socioeconomic development and end-of-century climate forcing. To isolate the role of air pollution policies in the transition to a low warming pathway, a companion scenario to SSP3-7.0 has been developed, the SSP3-lowNTCF (Gidden et al., 2019). Here, the socioeconomic narrative is the same, but emission factors for the short-lived species are assumed to be in line with those in SSP1-1.9. The result is similar global CO2 emissions but up to 60 % reductions in global SLCF emissions in SSP3-lowNTCF relative to SSP3-7.0. Using the SSP3-lowNTCF emissions as input, we find that this in turn leads to a net temperature response to total global emissions in 2100 that is 13 % lower in SSP3-lowNTCF than in SSP3-7.0 (an absolute difference of 0.5 ∘C, from 3.7 to 3.2 ∘C in our calculations). For comparison, the net temperature response is 71 % (or 2.6 ∘C) lower in SSP1-1.9 than in SSP3-7.0 in our calculations.
The potential for reducing near-term warming by targeting BC emissions in the transport and residential sectors has been highlighted earlier (e.g., UNEP, 2011). We also find notable BC warming contributions from the residential sector in some regions, mainly South Asia and Africa, but estimate quite low BC effects from the transport sector. This has three main reasons. Firstly, since earlier studies (done about 10 years ago) there have been significant changes in legislation, and new diesel trucks and cars are (in several regions) equipped with particulate filters, effectively removing BC. By now these vehicles represent a significant part of the fleet in many regions, and the trend is expected to continue. Secondly, as described in Sect. 2, we use an AGTP for BC that is 15 % lower than in previous studies using the same methodology. This is done to account for the rapid adjustments associated with BC shortwave absorption (Stjern et al., 2017), which has been found to reduce the effective RF in a range of global climate models via changes in stability and cloud formation (Smith et al., 2018). For our study, this factor applies to BC emissions from all sources and hence results in a reduced the net warming impact. Finally, we account for cooling from nitrate aerosols from emissions of NOx, for which the transport sector is a significant source, even in regions where stricter vehicle emission standards (e.g., Euro 5) have been adopted.
Caveats and uncertainties
The AGTP is a well-established framework that has been applied in several studies of attribution of temperature impacts to emission sources and scenarios (e.g., Collins et al., 2013; Lund et al., 2017; Sand et al., 2015; Stohl et al., 2015; Aamaas et al., 2019). Here we have also consistently included the carbon–climate feedback in the AGTP for all species. This increases the non-CO2 AGTPs, however, less than initially suggested by Myhre et al. (2013) as discussed by Gasser et al. (2017). Figure S5 shows the global mean net temperature response to total emissions under six of the nine SSP–RCPs, with and without the feedback. By the end of century, there is a 5 %–9 % difference depending on scenario.
A key strength of the AGTP framework is that allows us to investigate the effects of individual species, sources, and scenarios, which would be confounded by the low signal-to-noise ratio in fully coupled models, in a transparent manner. However, there are also caveats. Importantly, the AGTP metric is linear, while in reality the radiative efficiency can have nonlinear dependencies on the background atmospheric conditions. In this study, we account for one part such nonlinearities by using radiative efficiencies for the aerosols and ozone precursors that vary with emission location to calculate region-specific AGTPs. The part of the nonlinearities caused by changing background levels of pollutants over time is, however, not included. For the well-mixed greenhouse gases CO2, CH4, and N2O, the radiative efficiency (RE) is reduced with increasing atmospheric background concentrations. Previous literature suggests that the sensitivity to emission scenario is small, and the relationship between emissions and temperature response more linear, for CO2 (Caldeira and Kasting, 1993). However, the same has not been shown for methane (and N2O, which is not considered here). We therefore perform an additional sensitivity test where we calculate an AGTP(t) that is adjusted to the global atmospheric concentrations over time (using the equation from Etminan et al. (2016) and global concentrations for each SSP–RCP from the IIASA SSP database (IIASA, 2020; Riahi et al., 2017). Figure S5 shows the resulting temperature response, compared to the temperature response calculated with and without the CCf. As expected, using a dynamically adjusted RE results in a lower warming in the high-emission scenarios and a slightly higher temperature response under low emissions. In the case of extreme scenario SSP5-8.5, the effect is of the same order of magnitude as that from adding the CCf but is of opposite sign. For aerosols and ozone precursors, potential saturation effects involve complex, spatially heterogeneous chemistry, cloud, and climate interactions that require detailed chemistry–climate simulations to be resolved, and even then may not be fully captured due to, e.g., the coarse resolution of current models. We emphasize that the absolute magnitude of temperature changes quantified with the AGTP framework should be interpreted with care, as this method is primarily designed to study relative importance and relationships between individual emissions and sources.
Our analysis reflects best-estimate input data to the extent possible, but results have considerable uncertainty in emissions, RF, and climate sensitivity. As shown in Fig. 2a, we estimate, due to uncertainty in RF alone, a 1 SD range in the total net temperature response on the 10-year time horizon of ±0.01 ∘C, about 38 % of the net temperature response of 0.03 ∘C (the range is considerably lower on the 100-year timescale as the RF of SLCFs is much more uncertain than that of CO2). Uncertainties in emission inventories are difficult to quantify, but are generally considered lowest for CO2 and SO2 emissions and high for carbonaceous aerosols (Hoesly et al., 2018). The level of uncertainty also differs across regions and sectors, with emissions from nature-related emissions (e.g., agriculture, landfills) more uncertain than emissions in the fossil fuel sector (Amann et al., 2013; Jonas et al., 2019). Moreover, recent studies point to emission trends that are not accurately represented in the global inventory, such as SO2 and NOx in China (Zheng et al., 2018) and fossil fuel CH4 emissions (Hmiel et al., 2020). However, due to high spatiotemporal variability and lack of consistent data, a comprehensive uncertainty analysis at the regional and sectoral level is challenging. The equilibrium climate sensitivity (ECS) inherent in the climate response in IRF used in the present analysis is 0.885 K (W m. This is in the upper range reported by Bindoff et al. (2013) but lower than many recent estimates (Forster et al., 2019; Zelinka et al., 2020). While emission uncertainties can have a strong spatiotemporal character, changes in the ECS mostly act to scale estimates for all sectors and regions but is less important for their relative ranking.
Our analysis is limited to temperature change as a measure of climate impacts. SLCFs, and in particular aerosols, also play a key role in shaping local and regional hydrology and dynamics. Comparing the SSP3-7.0 and SSP3-lowNTCF scenarios, Allen et al. (2020) recently found a significant precipitation increase due to removal of aerosols, with the strongest moistening trends over Asia. An increase in the Asian summer monsoon precipitation in scenarios with strong air pollution reductions was also recently found by Wilcox et al. (2020). Hence, further studies using coupled models are needed to fully capture the effects of the SLCFs under SSPs on local climate and environment.
Complementary mitigation of CO2 and other LLGHG with SLCFs is of key importance for achieving the ambitions of the Paris Agreement and meeting the Sustainable Development Goals. Using the concept of Absolute Global Temperature change Potential (AGTP), an emission-metric-based emulator of the climate response, we here investigate the contribution from emissions of SLCFs and CO2 from 7 economic sectors in 13 source regions to global temperature change. In addition to quantifying the near- and long-term temperature response to present-day emissions, i.e., in line with the traditional emission metric studies, we evaluate the role of individual SLCFs and CO2 as projected by the most recent generation scenarios, the Shared Socioeconomic Pathways (SSPs), with greater regional and sectoral detail than previous literature. We account for the geographical dependence of the radiative forcing of SLCF emissions, as well as the current understanding of global-scale indirect and semi-direct aerosol forcing. A key update to our method relative to the bulk of comparable literature is a treatment of the carbon–climate feedback in the AGTPs of the SLCFs.
As is well established, CO2 is the dominant driver of warming on longer timescales and any strategy for limiting long-term temperature change critically depends on deep cuts in CO2 emission. As shown by our results, CO2 also gives a significant contribution to near-term warming. The potential for additional reductions in near-term temperature change from reductions in present-day SLCF emissions is highly inhomogeneous across region and sector. Key in all regions are the major emitters of methane, in particular agriculture and waste management, but also energy production. In contrast, some sectors and regions, notably industry, energy, and transport in East Asia, South Asia, and the Middle East, have strong contributions from cooling SLCFs resulting in a net negative near-term temperature impact or an approximate balance between cooling and warming SLCFs. While this does not imply that mitigation measures should not be implemented, understanding of the detailed characteristics and relevance over time at the emission source level is needed for the design and assessment of mitigation strategies.
The regional heterogeneity in SLCF emissions and subsequent contributions to global temperature change continues under most of the nine SSP–RCP scenarios considered here. While CO2 becomes the dominant contributor to warming in all regions over time, SLCFs are projected to continue to play an important role for global temperature change over the 21st century in many regions. In particular, emissions of SLCFs in East Asia and South Asia are projected to remain high, at least until the mid-21st century. Moreover, there is a shift in emissions towards low- and middle-income countries in the developing world. Notably, a strong increase in emissions in Africa south of the Sahara is projected under most of the SSP–RCPs considered and is especially pronounced in SSP3-7.0 and SSP5-8.5. Hence, in addition to the focus on the current major current sources of SLCFs, enabling technological and legislative development on the African continent will likely be of key importance for a transition from high-emission pathways towards one in line with SSP1-1.9 and the ambitions of the Paris Agreement, which in turn could already lead to reductions in global warming over the next couple of decades. Technological advancement could bring benefits even if there is no dedicated climate policy addressing SLCFs, simply by reduced emission factors, as demonstrated by the SSP3-lowNTCF scenario.
The large spatiotemporal heterogeneity in emissions trends and subsequent temperature responses underlines the need to go beyond global emission scenarios. By quantifying the global temperature response to emissions from 13 regions, 7 sectors, and 9 scenarios in a consistent and transparent framework, we provide a more comprehensive dataset than, to our knowledge, currently exists. We note that the AGTP framework is primarily designed to study relative importance and relationships between individual emissions and sources and that the absolute magnitude of temperature responses should be interpreted with care due to the linearity of the AGTP. The uncertainties in emissions could also affect the regional and sectoral ranking but are poorly known. However, by making our full dataset publicly available, we provide a tool that enables further analysis and comparison of, e.g., mitigation strategies at the sectoral and regional level without the use of complex models.
Regional and sectoral emission time series, AGTPs, and temperature responses are publicly available via Figshare under the DOI https://doi.org/10.6084/m9.figshare.11386455 (Lund et al., 2020). The full set of gridded SSP anthropogenic emission data are available from the ESGF system (https://esgf-node.llnl.gov/search/input4mips/, Cinquini et al., 2014, last access: December 2019). Code is available upon request from Marianne T. Lund (m.t.lund@cicero.oslo.no).
The supplement related to this article is available online at: https://doi.org/10.5194/esd-11-977-2020-supplement.
MTL led the study, prepared the input data, and wrote the paper. BA performed the emission metric and uncertainty calculations. CWS and BHS produced the graphics. ZK and TKB contributed to the design of the analysis. All authors contributed to the manuscript preparation.
The authors declare that they have no conflict of interest.
We thank Glen Peters and Robbie Andrews (CICERO) for their assistance with the technical implementation of the carbon-climate feedback. We also thank the two anonymous referees for their comments and suggestions.
This research has been supported by the Research Council of Norway (grant no. 248834).
This paper was edited by Hermann Held and reviewed by two anonymous referees.
Allen, R. J., Turnock, S., Nabat, P., Neubauer, D., Lohmann, U., Olivié, D., Oshima, N., Michou, M., Wu, T., Zhang, J., Takemura, T., Schulz, M., Tsigaridis, K., Bauer, S. E., Emmons, L., Horowitz, L., Naik, V., van Noije, T., Bergman, T., Lamarque, J.-F., Zanis, P., Tegen, I., Westervelt, D. M., Le Sager, P., Good, P., Shim, S., O'Connor, F., Akritidis, D., Georgoulias, A. K., Deushi, M., Sentman, L. T., John, J. G., Fujimori, S., and Collins, W. J.: Climate and air quality impacts due to mitigation of non-methane near-term climate forcers, Atmos. Chem. Phys., 20, 9641–9663, https://doi.org/10.5194/acp-20-9641-2020, 2020.
Amann, M., Klimont, Z., and Wagner, F.: Regional and Global Emissions of Air Pollutants: Recent Trends and Future Scenarios, Annu. Rev. Env. Resour., 38, 31–55, https://doi.org/10.1146/annurev-environ-052912-173303, 2013.
AMAP: AMAP Assessment 2015: Black carbon and ozone as Arctic climate forcers. Arctic Monitoring and Assessment Programme (AMAP), Oslo, Norway, vii + 116 pp., https://www.amap.no/documents/download/2506/inline (last access: 3 November 2020), 2015.
Aamaas, B., Berntsen, T. K., and Samset, B. H.: The regional temperature implications of strong air quality measures, Atmos. Chem. Phys., 19, 15235–15245, https://doi.org/10.5194/acp-19-15235-2019, 2019.
Aamaas, B., Peters, G. P., and Fuglestvedt, J. S.: Simple emission metrics for climate impacts, Earth Syst. Dynam., 4, 145–170, https://doi.org/10.5194/esd-4-145-2013, 2013.
Anenberg, S. C., Schwartz, J., Shindell, D., Amann, M., Faluvegi, G., Klimont, Z., Janssens-Maenhout, G., Pozzoli, L., Dingenen, R. V., Vignati, E., Emberson, L., Muller, N. Z., West, J. J., Williams, M., Demkine, V., Hicks, W. K., Kuylenstierna, J., Raes, F., and Ramanathan V.: Global Air Quality and Health Co-benefits of Mitigating Near-Term Climate Change through Methane and Black Carbon Emission Controls, Environ. Health Persp., 120, 831–839, https://doi.org/10.1289/ehp.1104301, 2012.
Arneth, A., Unger, N., Kulmala, M., and Andreae, M. O.: Clean the Air, Heat the Planet? Science, 326, 672–673, https://doi.org/10.1126/science.1181568, 2009.
Berntsen, T. and Fuglestvedt, J.: Global temperature responses to current emissions from the transport sectors, Proc. Natl. Acad. Sci. USA, 105, 19154–19159, https://doi.org/10.1073/pnas.0804844105, 2008.
Bindoff, N. L., Stott, P. A., AchutaRao, K. M., Allen, M. R., Gillett, N., Gutzler, D., Hansingo, K., Hegerl, G., Hu, Y., Jain, S., Mokhov, I. I., Overland, J., Perlwitz, J., Sebbari, R., and Zhang, X.: Detection and Attribution of Climate Change: from Global and Regional, in: Climate Change 2013: The Physical Science Basis, Contribution of Working Group I to the Fifth Assessment Report of the Intergovernmental Panel on Climate Change, edited by: Stocker, T. F., Qin, D., Plattner, G.-K., Tignor, M., Allen, S. K., Boschung, J., Nauels, A., Xia, Y., Bex, V., and Midgley, P. M., Cambridge University Press, Cambridge, UK and New York, NY, USA, 2013.
Bond, T. C., Doherty, S. J., Fahey, D. W., Forster, P. M., Berntsen, T., DeAngelo, B. J., Flanner, M. G., Ghan, S., Kärcher, B., Koch, D., Kinne, S., Kondo, Y., Quinn, P. K., Sarofim, M. C., Schultz, M. G., Schulz, M., Venkataraman, C., Zhang, H., Zhang, S., Bellouin, N., Guttikunda, S. K., Hopke, P. K., Jacobson, M. Z., Kaiser, J. W., Klimont, Z., Lohmann, U., Schwarz, J. P., Shindell, D., Storelvmo, T., Warren, S. G., and Zender, C. S.: Bounding the role of black carbon in the climate system: A scientific assessment, J. Geophys. Res.-Atmos., 118, 5380–5552, https://doi.org/10.1002/jgrd.50171, 2013.
Boucher, O. and Reddy, M. S.: Climate trade-off between black carbon and carbon dioxide emissions, Energ. Policy, 36, 193–200, https://doi.org/10.1016/j.enpol.2007.08.039, 2008.
Bowerman, N. H. A., Frame, D. J., Huntingford, C., Lowe, J. A., Smith, S. M., and Allen, M. R.: The role of short-lived climate pollutants in meeting temperature goals, Nat. Clim. Change, 3, 1021, https://doi.org/10.1038/nclimate2034, 2013.
Caldeira, K. and Kasting, J. F.: Insensitivity of global warming potentials to carbon dioxide emission scenarios, Nature, 366, 251–253, https://doi.org/10.1038/366251a0, 1993.
CCAC Air pollution in Asia and Pacific: Science-based solution, United Nations Environment Programme (UNEP), January 2019, https://ccacoalition.org/en/resources/air-pollution-asia-and-pacific-science-based-solutions-summary-full-report. (last access: 29 October 2020), ISBN 978-9-2807-3725-7, 2019.
Cinquini, L., Crichton, D., Mattmann, C., Harney, J., Shipman, G., Wang, F., Ananthakrishnan, R., Miller, N., Denvil, S., Morgan, M., Pobre, Z., Bell, G. M., Doutriaux, C., Drach, R., Williams, D., Kershaw, P., Pascoe, S., Gonzalez, E., Fiore, S., and Schweitzer, R. : The Earth System Grid Federation: An open infrastructure for access to distributed geospatial data, Future Generation Computer Systems, 36, 400–417, https://doi.org/10.1016/j.future.2013.07.002, 2014.
Collins, W. J., Fry, M. M., Yu, H., Fuglestvedt, J. S., Shindell, D. T., and West, J. J.: Global and regional temperature-change potentials for near-term climate forcers, Atmos. Chem. Phys., 13, 2471–2485, https://doi.org/10.5194/acp-13-2471-2013, 2013.
Crippa, M., Janssens-Maenhout, G., Dentener, F., Guizzardi, D., Sindelarova, K., Muntean, M., Van Dingenen, R., and Granier, C.: Forty years of improvements in European air quality: regional policy-industry interactions with global impacts, Atmos. Chem. Phys., 16, 3825–3841, https://doi.org/10.5194/acp-16-3825-2016, 2016.
Etminan. M., Myhre, G., Highwood, E. J., and Shine, K. P.: Radiative forcing of carbon dioxide, methane, and nitrous oxide: A significant revision of the methane radiative forcing, Geophys. Res. Lett., 43, 12614–12623, https://doi.org/10.1002/2016gl071930, 2016.
Feng, L., Smith, S. J., Braun, C., Crippa, M., Gidden, M. J., Hoesly, R., Klimont, Z., van Marle, M., van den Berg, M., and van der Werf, G. R.: The generation of gridded emissions data for CMIP6, Geosci. Model Dev., 13, 461–482, https://doi.org/10.5194/gmd-13-461-2020, 2020.
Forster, P. M., Maycock, A. C., McKenna, C. M., and Smith, C. J.: Latest climate models confirm need for urgent mitigation, Nat. Clim. Change, 10, 7–10, https://doi.org/10.1038/s41558-019-0660-0, 2019.
Fuglestvedt, J., Berntsen, T., Eyring, V., Isaksen, I., Lee, D. S., and Sausen, R.: Shipping Emissions: From Cooling to Warming of Climate – and Reducing Impacts on Health, Environ. Sci. Tech., 43, 9057–9062, https://doi.org/10.1021/es901944r, 2009.
Fuglestvedt, J. S., Shine, K. P., Berntsen, T., Cook, J., Lee, D. S., Stenke, A., Skeie, R. B., Velders, G. J. M., and Waitz, I. A.: Transport impacts on atmosphere and climate: Metrics, Atmos. Environ., 44, 4648–4677, https://doi.org/10.1016/j.atmosenv.2009.04.044, 2010.
Gasser, T., Peters, G. P., Fuglestvedt, J. S., Collins, W. J., Shindell, D. T., and Ciais, P.: Accounting for the climate-carbon feedback in emission metrics, Earth Syst. Dynam., 8, 235–253, https://doi.org/10.5194/esd-8-235-2017, 2017.
Geoffroy, O., Saint-Martin, D., Olivié, D. J. L., Voldoire, A., Bellon, G., and Tytéca, S.: Transient Climate Response in a Two-Layer Energy-Balance Model. Part I: Analytical Solution and Parameter Calibration Using CMIP5 AOGCM Experiments, J. Climate, 26, 1841–1857, https://doi.org/10.1175/jcli-d-12-00195.1, 2013.
Gidden, M. J., Riahi, K., Smith, S. J., Fujimori, S., Luderer, G., Kriegler, E., van Vuuren, D. P., van den Berg, M., Feng, L., Klein, D., Calvin, K., Doelman, J. C., Frank, S., Fricko, O., Harmsen, M., Hasegawa, T., Havlik, P., Hilaire, J., Hoesly, R., Horing, J., Popp, A., Stehfest, E., and Takahashi, K.: Global emissions pathways under different socioeconomic scenarios for use in CMIP6: a dataset of harmonized emissions trajectories through the end of the century, Geosci. Model Dev., 12, 1443–1475, https://doi.org/10.5194/gmd-12-1443-2019, 2019.
Haines, A., Amann, M., Borgford-Parnell, N., Leonard, S., Kuylenstierna, J., and Shindell, D.: Short-lived climate pollutant mitigation and the Sustainable Development Goals, Nat. Clim. Change, 7, 863–869, https://doi.org/10.1038/s41558-017-0012-x, 2017.
Harmsen, M., Fricko, O., Hilaire, J., van Vuuren, D. P., Drouet, L., Durand-Lasserve, O., Fujimori, S., Keramidas, K., Klimont, Z., Luderer, G., Aleluia Reis, L., Riahi, K., Sano, F., and Smith, S. J.: Taking some heat off the NDCs? The limited potential of additional short-lived climate forcers' mitigation, Clim. Change, https://doi.org/10.1007/s10584-019-02436-3, 2019.
Hienola, A., Partanen, A.-I., Pietikäinen, J.-P., O’Donnell, D., Korhonen, H., Matthews, H. D., and Laaksonen, A.: The impact of aerosol emissions on the 1.5 ∘C pathways, Environ. Res. Lett., 13, 044011, https://doi.org/10.1088/1748-9326/aab1b2, 2018.
Hmiel, B., Petrenko, V. V., Dyonisius, M. N., Buizert, C., Smith, A. M., Place, P. F., Harth, C., Beaudette, R., Hua, Q., Yang, B., Vimont, I., Michel, S. E., Severinghaus, J. P., Etheridge, D., Bromley, T., Schmitt, J., Faïn, X., Weiss, R. F., and Dlugokencky, E.: Preindustrial 14CH4 indicates greater anthropogenic fossil CH4 emissions, Nature, 578, 409–412, https://doi.org/10.1038/s41586-020-1991-8, 2020.
Hoesly, R. M., Smith, S. J., Feng, L., Klimont, Z., Janssens-Maenhout, G., Pitkanen, T., Seibert, J. J., Vu, L., Andres, R. J., Bolt, R. M., Bond, T. C., Dawidowski, L., Kholod, N., Kurokawa, J.-I., Li, M., Liu, L., Lu, Z., Moura, M. C. P., O'Rourke, P. R., and Zhang, Q.: Historical (1750–2014) anthropogenic emissions of reactive gases and aerosols from the Community Emissions Data System (CEDS), Geosci. Model Dev., 11, 369–408, https://doi.org/10.5194/gmd-11-369-2018, 2018.
Höglund-Isaksson, L., Gómez-Sanabria, A., Klimont, Z., Rafaj, P., and Schöpp, W.: Technical potentials and costs for reducing global anthropogenic methane emissions in the 2050 timeframe – results from the GAINS model, Environ. Res. Communications, 2, 025004, https://doi.org/10.1088/2515-7620/ab7457, 2020.
Höhne, N., Blum, H., Fuglestvedt, J., Skeie, R. B., Kurosawa, A., Hu, G., Lowe, J., Gohar, L., Matthews, B., Nioac de Salles, A. C., and Ellermann C.: Contributions of individual countries' emissions to climate change and their uncertainty, Clim. Change, 106, 359–391, https://doi.org/10.1007/s10584-010-9930-6, 2011.
IIASA: SSP Database (Shared Socioeconomic Pathways) – Version 2.0, https://tntcat.iiasa.ac.at/SspDb/dsd?Action=htmlpage&page=_10, (last access: 9 June 2020).
Janssens-Maenhout, G., Crippa, M., Guizzardi, D., Dentener, F., Muntean, M., Pouliot, G., Keating, T., Zhang, Q., Kurokawa, J., Wankmüller, R., Denier van der Gon, H., Kuenen, J. J. P., Klimont, Z., Frost, G., Darras, S., Koffi, B., and Li, M.: HTAP_v2.2: a mosaic of regional and global emission grid maps for 2008 and 2010 to study hemispheric transport of air pollution, Atmos. Chem. Phys., 15, 11411–11432, https://doi.org/10.5194/acp-15-11411-2015, 2015.
Jonas, M., Bun, R., Nahorski, Z., Marland, G., Gusti, M., and Danylo, O.: Quantifying greenhouse gas emissions, Mitig. Adapt. Strat. for Gl., 24, 83–852, https://doi.org/10.1007/s11027-019-09867-4, 2019.
Joos, F., Roth, R., Fuglestvedt, J. S., Peters, G. P., Enting, I. G., von Bloh, W., Brovkin, V., Burke, E. J., Eby, M., Edwards, N. R., Friedrich, T., Frölicher, T. L., Halloran, P. R., Holden, P. B., Jones, C., Kleinen, T., Mackenzie, F. T., Matsumoto, K., Meinshausen, M., Plattner, G.-K., Reisinger, A., Segschneider, J., Shaffer, G., Steinacher, M., Strassmann, K., Tanaka, K., Timmermann, A., and Weaver, A. J.: Carbon dioxide and climate impulse response functions for the computation of greenhouse gas metrics: a multi-model analysis, Atmos. Chem. Phys., 13, 2793–2825, https://doi.org/10.5194/acp-13-2793-2013, 2013.
Kanaya, Y., Yamaji, K., Miyakawa, T., Taketani, F., Zhu, C., Choi, Y., Komazaki, Y., Ikeda, K., Kondo, Y., and Klimont, Z.: Rapid reduction in black carbon emissions from China: evidence from 2009–2019 observations on Fukue Island, Japan, Atmos. Chem. Phys., 20, 6339–6356, https://doi.org/10.5194/acp-20-6339-2020, 2020.
Klimont, Z., Kupiainen, K., Heyes, C., Purohit, P., Cofala, J., Rafaj, P., Borken-Kleefeld, J., and Schöpp, W.: Global anthropogenic emissions of particulate matter including black carbon, Atmos. Chem. Phys., 17, 8681–8723, https://doi.org/10.5194/acp-17-8681-2017, 2017.
Kupiainen, K. J., Aamaas, B., Savolahti, M., Karvosenoja, N., and Paunu, V.-V.: Climate impact of Finnish air pollutants and greenhouse gases using multiple emission metrics, Atmos. Chem. Phys., 19, 7743–7757, https://doi.org/10.5194/acp-19-7743-2019, 2019.
Lelieveld, J., Evans, J. S., Fnais, M., Giannadaki, D., and Pozzer, A. : The contribution of outdoor air pollution sources to premature mortality on a global scale, Nature, 525, 367–371, https://doi.org/10.1038/nature15371, 2015.
Lund, M. T., Berntsen, T. K., and Fuglestvedt, J. S.: Climate Impacts of Short-Lived Climate Forcers versus CO2 from Biodiesel: A Case of the EU on-Road Sector, Environ. Sci. Tech., 48, 14445–14454, https://doi.org/10.1021/es505308g, 2014a.
Lund, M. T., Berntsen, T. K., Heyes, C., Klimont, Z., and Samset, B. H. Global and regional climate impacts of black carbon and co-emitted species from the on-road diesel sector, Atmos. Environ., 98, 50–58, https://doi.org/10.1016/j.atmosenv.2014.08.033, 2014b.
Lund, M. T., Aamaas, B., Berntsen, T., Bock, L., Burkhardt, U., Fuglestvedt, J. S., and Shine, K. P.: Emission metrics for quantifying regional climate impacts of aviation, Earth Syst. Dynam., 8, 547–563, https://doi.org/10.5194/esd-8-547-2017, 2017.
Lund, M. T., Myhre, G., Haslerud, A. S., Skeie, R. B., Griesfeller, J., Platt, S. M., Kumar, R., Myhre, C. L., and Schulz, M.: Concentrations and radiative forcing of anthropogenic aerosols from 1750 to 2014 simulated with the Oslo CTM3 and CEDS emission inventory, Geosci. Model Dev., 11, 4909–4931, https://doi.org/10.5194/gmd-11-4909-2018, 2018.
Lund, M. T., Aamaas, B., Stjern, C. W., Klimont, Z., Berntsen, T. K., and Samset, B. H.: Data collection – “A continued role of Short-Lived Climate Forcers under the Shared Socioeconomic Pathways”, figshare, Dataset, https://doi.org/10.6084/m9.figshare.11386455, 2020.
Melamed, M. L., Schmale, J., and von Schneidemesser, E.: Sustainable policy – key considerations for air quality and climate change, Curr. Opin. Env. Sust., 23, 85–91, https://doi.org/10.1016/j.cosust.2016.12.003, 2016.
Myhre, G., Samset, B. H., Schulz, M., Balkanski, Y., Bauer, S., Berntsen, T. K., Bian, H., Bellouin, N., Chin, M., Diehl, T., Easter, R. C., Feichter, J., Ghan, S. J., Hauglustaine, D., Iversen, T., Kinne, S., Kirkevåg, A., Lamarque, J.-F., Lin, G., Liu, X., Lund, M. T., Luo, G., Ma, X., van Noije, T., Penner, J. E., Rasch, P. J., Ruiz, A., Seland, Ø., Skeie, R. B., Stier, P., Takemura, T., Tsigaridis, K., Wang, P., Wang, Z., Xu, L., Yu, H., Yu, F., Yoon, J.-H., Zhang, K., Zhang, H., and Zhou, C.: Radiative forcing of the direct aerosol effect from AeroCom Phase II simulations, Atmos. Chem. Phys., 13, 1853–1877, https://doi.org/10.5194/acp-13-1853-2013, 2013a.
Myhre, G., Shindell, D., Brèon, F.-M., Collins, W., Fuglestvedt, J., Huang, J., Koch, D., Lamarque, J.-F., Lee, D., Mendoza, B., Nakajima, T., Robock, A., Stephens, G., Takemura, T., and Zhang, H.: Anthropogenic and natural radiative forcing, in: Climate Change 2013: The Physical Science Basis. Contribution of Working Group I to the Fifth Assessment Report of the Intergovernmental Panel on Climate Change, edited by: Stocker, T.F., D. Qin, G.-K., Plattner, M., Tignor, S. K., Allen, J., Boschung, A., Nauels, Y., Xia, V. Bex and, Midgley, P. M., Cambridge University Press, Cambridge, United Kingdom and New York, NY, USA, 2013b.
O’Neill, B. C., Kriegler, E., Riahi, K., Ebi, K. L., Hallegatte, S., Carter, T. R., Mathur, R., and van Vuuren, D. P. A new scenario framework for climate change research: the concept of shared socioeconomic pathways, Clim. Change, 122, 387–400, https://doi.org/10.1007/s10584-013-0905-2, 2014.
Persad, G. G. and Caldeira, K.: Divergent global-scale temperature effects from identical aerosols emitted in different regions, Nat. Commun., 9, 3289, https://doi.org/10.1038/s41467-018-05838-6, 2018.
Pierrehumbert, R. T.: Short-Lived Climate Pollution, Annu. Rev. Earth Pl. Sc., 42, 341–379, https://doi.org/10.1146/annurev-earth-060313-054843, 2014.
Rafaj, P., Kiesewetter, G., Gül, T., Schöpp, W., Cofala, J., Klimont, Z., Purohit, P., Heyes, C., Amann, M., Borken-Kleefeld, J., and Cozzi, L.: Outlook for clean air in the context of sustainable development goals, Global Environ. Chang., 53, 1–11, https://doi.org/10.1016/j.gloenvcha.2018.08.008, 2018.
Ramanathan, V. and Carmichael, G.: Global and regional climate changes due to black carbon, Nat. Geosci., 1, 221–227, https://doi.org/10.1038/ngeo156, 2008.
Rao, S., Klimont, Z., Smith, S. J., Van Dingenen, R., Dentener, F., Bouwman, L., Riahi, K., Amann, M., Bodirsky, B. L., van Vuuren, D. P., Aleluia Reis, L., Calvin, K., Drouet, L., Fricko, O., Fujimori, S., Gernaat, D., Havlik, P., Harmsen, M., Hasegawa, T., Heyes, C., Hilaire, J., Luderer, G., Masui, T., Stehfest, E., Strefler J., van der Sluis, S., and Tavoni, M. : Future air pollution in the Shared Socio-economic Pathways, Global Environ. Chang., 42, 346–358, https://doi.org/10.1016/j.gloenvcha.2016.05.012, 2017.
Reisinger, A. and Clark, H.: How much do direct livestock emissions actually contribute to global warming?, Glob. Change Biol., 24, 1749–1761, https://doi.org/10.1111/gcb.13975, 2018.
Riahi, K., van Vuuren, D. P.Riahi K., van Vuuren, D. P., Kriegler, E., Edmonds, J., O’Neill, B. C., Fujimori, S., Bauer, N., Calvin, K., Dellink, R., Fricko, O., Lutz, W., Popp, A., Cuaresma, J. C., Kc, S., Leimbach, M., Jiang, L., Kram, T., Rao, S., Emmerling, J., Ebi, K., Hasegawa, T., Havlik, P., Humpenöder, F., Da Silva, L. A., Smith, S., Stehfest, E., Bosetti, V., Eom, J., Gernaat, D., Masui, T., Rogelj, J., Strefler, J., Drouet, L., Krey, V., Luderer, G., Harmsen, M., Takahashi, K., Baumstark, L., Doelman, J. C., Kainuma, M., Klimont, Z., Marangoni, G., Lotze-Campen, H., Obersteiner, M., Tabeau, A., Tavoni, M., and Kriegler, E.,: The Shared Socioeconomic Pathways and their energy, land use, and greenhouse gas emissions implications: An overview, Global Environ. Chang, 42, 153–168, https://doi.org/10.1016/j.gloenvcha.2016.05.009, 2017.
Ritchie, J. and Dowlatabadi, H.: Why do climate change scenarios return to coal?, Energy, 140, 1276–1291, https://doi.org/10.1016/j.energy.2017.08.083, 2017.
Rogelj, J., Meinshausen, M., Schaeffer, M., Knutti, R., and Riahi, K.: Impact of short-lived non-CO2 mitigation on carbon budgets for stabilizing global warming, Environ. Res. Lett., 10, 075001, https://doi.org/10.1088/1748-9326/10/7/075001, 2015.
Rogelj, J., Schaeffer, M., Meinshausen, M., Shindell, D. T., Hare, W., Klimont, Z., Velders, G. J. M., Amann, M., and Schellnhuber, H. J.: Disentangling the effects of CO2 and short-lived climate forcer mitigation, P. Natl. A. Sci. USA, 111, 16325–16330, https://doi.org/10.1073/pnas.1415631111, 2014.
Rogelj, J., Shindell, D., Jiang, K., Fifita, S., Forster, P., Ginzburg, V., Handa, C., Kheshgi, H., Kobayashi, S., Kriegler, E., Mundaca, L., Séférian, R., and Vilariño, M. V.: Mitigation Pathways Compatible with 1.5 ∘C in the Context of Sustainable Development, in: Global Warming of 1.5 ∘C. An IPCC Special Report on the impacts of global warming of 1.5 ∘C above pre-industrial levels and related global greenhouse gas emission pathways, in the context of strengthening the global response to the threat of climate change, sustainable development, and efforts to eradicate poverty, edited by: Masson-Delmotte, V., Zhai, P., Pörtner, H.-O., Roberts, D., Skea, J., Shukla, P. R., Pirani, A., Moufouma-Okia, W., Péan, C., Pidcock, R., Connors, S., Matthews, J. B. R., Chen, Y., Zhou, X., Gomis, M. I., Lonnoy, E., Maycock, T., Tignor, M., and Waterfield, T., in press, 2018.
Samset, B. H. and Myhre, G.: Vertical dependence of black carbon, sulphate and biomass burning aerosol radiative forcing, Geophys. Res. Lett., 38, L24802, https://doi.org/10.1029/2011gl049697, 2011.
Samset, B. H., Sand, M., Smith, C. J., Bauer, S. E., Forster, P. M., Fuglestvedt, J. S., Osprey S., and Schleussner, C.-F.: Climate Impacts From a Removal of Anthropogenic Aerosol Emissions, Geophys. Res. Lett., 45, 1020–1029, https://doi.org/10.1002/2017GL076079, 2018.
Sand, M., Berntsen, T. K., von Salzen, K., Flanner, M. G., Langner, J., and Victor, D. G.: Response of Arctic temperature to changes in emissions of short-lived climate forcers, Nat. Clim. Change., 6, 286, https://doi.org/10.1038/nclimate2880, 2015.
Shindell, D. and Smith, C. J.: Climate and air-quality benefits of a realistic phase-out of fossil fuels, Nature, 573, 408–411, https://doi.org/10.1038/s41586-019-1554-z, 2019.
Shindell, D., Kuylenstierna, J. C. I., Vignati, E., van Dingenen, R., Amann, M., Klimont, Z., Anenberg, S. C., Muller, N., Janssens-Maenhout, G., Raes, F., Schwartz, J., Faluvegi, G., Pozzoli, L., Kupiainen, K., Höglund-Isaksson, L., Emberson, L., Streets, D., Ramanathan, V., Hicks, K., Oanh, N. T. K., Milly, G., Williams, M., Demkine, V., and Fowler, D.: Simultaneously Mitigating Near-Term Climate Change and Improving Human Health and Food Security, Science, 335, 183–189, https://doi.org/10.1126/science.1210026, 2012.
Shine, K. P., Fuglestvedt, J. S., Hailemariam, K., and Stuber, N: Alternatives to the Global Warming Potential for Comparing Climate Impacts of Emissions of Greenhouse Gases, Clim. Change., 68, 281–302, https://doi.org/10.1007/s10584-005-1146-9, 2005.
Shoemaker, J. K., Schrag, D. P., Molina, M. J., and Ramanathan, V.: What Role for Short-Lived Climate Pollutants in Mitigation Policy?, Science, 342, 1323–1324, https://doi.org/10.1126/science.1240162, 2013.
Skeie, R. B., Fuglestvedt, J., Berntsen, T., Peters, G. P., Andrew, R., Allen, M., and Kallbekken, S.: Perspective has a strong effect on the calculation of historical contributions to global warming, Environ. Res. Lett., 12, 024022, https://doi.org/10.1088/1748-9326/aa5b0a, 2017.
Smith, C. J., Kramer, R. J., Myhre, G., Forster, P. M., Soden, B. J., Andrews, T., Boucher, O., Faluvegi, G., Fläschner, D., Hodnebrog, Ø., Kasoar, M., Kharin, V., Kirkevåg, A., Lamarque, J.-F., Mülmenstädt, J., Olivié, D., Richardson, T., Samset, B. H., Shindell, D., Stier, P., Takemura, T., Voulgarakis, A., and Watson-Parris, D.: Understanding Rapid Adjustments to Diverse Forcing Agents, Geophys. Res. Lett., 45, 12023–12031, https://doi.org/10.1029/2018gl079826, 2018.
Smith, P., Nkem, J., Calvin, K., Campbell, D., Cherubini, F., Grassi, G., Korotkov, V., Hoang, A. L., Lwasa, S., McElwee, P., Nkonya, E., Saigusa, N., Soussana, J.-F., and Taboada, M. A. : Interlinkages Between Desertification, Land Degradation, Food Security and Greenhouse Gas Fluxes: Synergies, Trade-offs and Integrated Response Options, in: Climate Change and Land: an IPCC special report on climate change, desertification, land degradation, sustainable land management, food security, and greenhouse gas fluxes in terrestrial ecosystems, edited by: Shukla, P. R., Skea J., Calvo, E., Buendia, V., Masson-Delmotte, H.-O., Portner, D. C., Roberts, P., Zhai, R., Slade, S., Connors, R., van Diemen, M., Ferrat, E., Haughey, E., Luz, S. S., Neogi, M., Pathak, J., Petzold, J., Portugal Pereira, P., Vyas, P., Huntley, E., Kissick, K., Belkacemi, M., and Malley, J., in press, 2019.
Smith, S. J. and Mizrahi, A.: Near-term climate mitigation by short-lived forcers, P. Natl. A. Sci. USA, 110, 14202–14206, https://doi.org/10.1073/pnas.1308470110, 2013.
Steckel, J. C., Hilaire, J., Jakob, M., and Edenhofer, O. : Coal and carbonization in sub-Saharan Africa, Nat. Clim. Change, 10, 83–88, https://doi.org/10.1038/s41558-019-0649-8, 2019.
Stjern, C. W., Samset, B. H., Myhre, G., Forster, P. M., Hodnebrog, Ø., Andrews, T., Boucher, O., Faluvegi, G., Iversen, T., Kasoar, M., Kharin, V., Kirkevåg, A., Lamarque, J.-F., Olivié, D., Richardson, T., Shawki, D., Shindell, D., Smith, C. J., Takemura, T., and Voulgarakis, A. Rapid Adjustments Cause Weak Surface Temperature Response to Increased Black Carbon Concentrations, J. Geophys. Res.-Atmos., 122, 11462–11481, https://doi.org/10.1002/2017JD027326, 2017.
Stohl, A., Aamaas, B., Amann, M., Baker, L. H., Bellouin, N., Berntsen, T. K., Boucher, O., Cherian, R., Collins, W., Daskalakis, N., Dusinska, M., Eckhardt, S., Fuglestvedt, J. S., Harju, M., Heyes, C., Hodnebrog, Ø., Hao, J., Im, U., Kanakidou, M., Klimont, Z., Kupiainen, K., Law, K. S., Lund, M. T., Maas, R., MacIntosh, C. R., Myhre, G., Myriokefalitakis, S., Olivié, D., Quaas, J., Quennehen, B., Raut, J.-C., Rumbold, S. T., Samset, B. H., Schulz, M., Seland, Ø., Shine, K. P., Skeie, R. B., Wang, S., Yttri, K. E., and Zhu, T.: Evaluating the climate and air quality impacts of short-lived pollutants, Atmos. Chem. Phys., 15, 10529–10566, https://doi.org/10.5194/acp-15-10529-2015, 2015.
Søvde, O. A., Prather, M. J., Isaksen, I. S. A., Berntsen, T. K., Stordal, F., Zhu, X., Holmes, C. D., and Hsu, J.: The chemical transport model Oslo CTM3, Geosci. Model Dev., 5, 1441–1469, https://doi.org/10.5194/gmd-5-1441-2012, 2012.
Takemura, T. and Suzuki, K.: Weak global warming mitigation by reducing black carbon emissions, Sci. Rep., 9, 4419, https://doi.org/10.1038/s41598-019-41181-6, 2019.
Tokarska, K. B., Stolpe, M. B., Sippel, S., Fischer, E. M., Smith, C. J., Lehner, F., and Knutti, R.: Past warming trend constrains future warming in CMIP6 models, Science Advances, 6, eaaz9549, https://doi.org/10.1126/sciadv.aaz9549, 2020.
UNEP Integrated Assessment of Black Carbon and Tropospheric Ozone, https://www.ccacoalition.org/en/files/2011integrated-assessment-fullunep-wmopdf, (last access: 29 October 2020), 2011.
UNEP The Emissions Gap Report 2017, United Nations Environment Programme (UNEP), Nairobi, https://wedocs.unep.org/bitstream/handle/20.500.11822/22070/EGR_2017.pdf (last access: 29 October 2020), 2017.
UNEP Integrated Assessment of Short-lived Climate Pollutants in Latin America and the Caribbean, https://www.ccacoalition.org/en/files/ccacslcp-lac-assessment-fullweb-2pdf-0 (last access: 29 October 2020), 2018.
UNEP Air Pollution in Asia and the Pacific: Science-based Solutions, UNEP, Paris, https://www.ccacoalition.org/en/files/fullreport2019air-pollution-asia-pacificv0226pdf (last access: 29 October 2020), 2019.
Unger, N., Bond, T. C., Wang, J. S., Koch, D. M., Menon, S., Shindell, D. T., and Bauer, S.: Attribution of climate forcing to economic sectors, P. Natl. A. Sci. USA, 107, 3382–3387, https://doi.org/10.1073/pnas.0906548107, 2010.
Wilcox, L. J., Liu, Z., Samset, B. H., Hawkins, E., Lund, M. T., Nordling, K., Undorf, S., Bollasina, M., Ekman, A. M. L., Krishnan, S., Merikanto, J., and Turner, A. G.: Accelerated increases in global and Asian summer monsoon precipitation from future aerosol reductions, Atmos. Chem. Phys. 20 11955–11977, https://doi.org/10.5194/acp-20-11955-2020, 2020
Xu, Y. and Ramanathan, V.: Well below 2 ∘C: Mitigation strategies for avoiding dangerous to catastrophic climate changes, P. Natl. A. Sci. USA, 114, 10315–10323, https://doi.org/10.1073/pnas.1618481114, 2017.
Zelinka, M. D., Myers, T. A., McCoy, D. T., Po-Chedley, S., Caldwell, P. M., Ceppi, P., Klein, S. A., and Taylor, K. E.: Causes of Higher Climate Sensitivity in CMIP6 Models, Geophys. Res. Lett., 47, e2019GL085782, https://doi.org/10.1029/2019gl085782, 2020.
Zheng, B., Tong, D., Li, M., Liu, F., Hong, C., Geng, G., Li, H., Li, X., Peng, L., Qi, J., Yan, L., Zhang, Y., Zhao, H., Zheng, Y., He, K., and Zhang, Q.: Trends in China's anthropogenic emissions since 2010 as the consequence of clean air actions, Atmos. Chem. Phys., 18, 14095–14111, https://doi.org/10.5194/acp-18-14095-2018, 2018.