the Creative Commons Attribution 4.0 License.
the Creative Commons Attribution 4.0 License.
 | 27 Aug 2020
Groundwater storage dynamics in the world's large aquifer systems from GRACE: uncertainty and role of extreme precipitation
Mohammad Shamsudduha
Richard G. Taylor
Under variable and changing climates groundwater storage sustains vital ecosystems and enables freshwater withdrawals globally for agriculture, drinking water, and industry. Here, we assess recent changes in groundwater storage (ΔGWS) from 2002 to 2016 in 37 of the world's large aquifer systems using an ensemble of datasets from the Gravity Recovery and Climate Experiment (GRACE) and land surface models (LSMs). Ensemble GRACE-derived ΔGWS is well reconciled to in situ observations (r=0.62–0.86, p value <0.001) for two tropical basins with regional piezometric networks and contrasting climate regimes. Trends in GRACE-derived ΔGWS are overwhelmingly non-linear; indeed, linear declining trends adequately (R2>0.5, p value <0.001) explain variability in only two aquifer systems. Non-linearity in ΔGWS derives, in part, from the episodic nature of groundwater replenishment associated with extreme annual (>90th percentile, 1901–2016) precipitation and is inconsistent with prevailing narratives of global-scale groundwater depletion at the scale of the GRACE footprint (∼200 000 km2). Substantial uncertainty remains in estimates of GRACE-derived ΔGWS, evident from 20 realisations presented here, but these data provide a regional context to changes in groundwater storage observed more locally through piezometry.
- Article
(4686 KB) - Full-text XML
-
Supplement
(7327 KB) - BibTeX
- EndNote


Groundwater is estimated to account for between a quarter and a third of the world's annual freshwater withdrawals to meet agricultural, industrial, and domestic demand (Döll et al., 2012; Wada et al., 2014; Hanasaki et al., 2018). As the world's largest distributed store of fresh water, groundwater plays a vital role in sustaining ecosystems and enabling adaptation to increased variability in rainfall and river discharge brought about by climate change (Taylor et al., 2013a). Sustained reductions in the volume of groundwater (i.e. groundwater depletion) resulting from human withdrawals or changes in climate have historically been observed as declining groundwater levels recorded in wells (Scanlon et al., 2012a; Castellazzi et al., 2016; MacDonald et al., 2016). The limited distribution and duration of piezometric records hinder, however, direct observation of changes in groundwater storage globally including many of the world's large aquifer systems (WHYMAP and Margat, 2008).
Since 2002 the Gravity Recovery and Climate Experiment (GRACE) has enabled large-scale (≥200 000 km2) satellite monitoring of changes in total terrestrial water storage (ΔTWS) globally (Tapley et al., 2004). As the twin GRACE satellites circle the globe ∼15 times a day they measure the inter-satellite distance at a minute precision (within 1 µm) and provide ΔTWS for the entire earth approximately every 30 d. GRACE satellites sense the movement of total terrestrial water mass derived from both natural (e.g. droughts) and anthropogenic (e.g. irrigation) influences globally (Rodell et al., 2018). Changes in groundwater storage (GRACE-derived ΔGWS) are computed from ΔTWS after deducting contributions (Eq. 1) that arise from other terrestrial water stores including soil moisture storage (ΔSMS), surface water storage (ΔSWS), and snow water storage (ΔSNS) using data from land surface models (LSMs) either exclusively (Rodell et al., 2009; Famiglietti et al., 2011; Scanlon et al., 2012a; Famiglietti and Rodell, 2013; Richey et al., 2015; Thomas et al., 2017) or in combination with in situ observations (Rodell et al., 2007; Swenson et al., 2008; Shamsudduha et al., 2012).
Substantial uncertainty persists in the quantification of changes in terrestrial water stores from GRACE measurements that are limited in duration (2002 to 2016) and the application of uncalibrated, global-scale LSMs (Shamsudduha et al., 2012; Döll et al., 2014; Scanlon et al., 2018). Computation of ΔGWS from GRACE ΔTWS is argued, nevertheless, to provide evaluations of large-scale changes in groundwater storage where regional-scale piezometric networks do not currently exist (Famiglietti, 2014).
Previous assessments of changes in groundwater storage using GRACE in the world's 37 large aquifer systems (Richey et al., 2015; Thomas et al., 2017) (Fig. 1, Table 1) have raised concerns about the sustainability of human use of groundwater resources. One analysis (Richey et al., 2015) employed a single GRACE ΔTWS product (CSR) in which changes in subsurface storage (ΔSMS + ΔGWS) were attributed to ΔGWS. This study applied linear trends without regard to their significance to compute values of GRACE-derived ΔGWS over 11 years from 2003 to 2013 and concluded that the majority of the world's aquifer systems (n=21) are either “overstressed” or “variably stressed”. A subsequent analysis (Thomas et al., 2017) employed a different GRACE ΔTWS product (Mascons) and estimated ΔSWS from LSM data for both surface and subsurface runoff, though the latter is normally considered to be groundwater recharge (Rodell et al., 2004). Using performance metrics normally applied to surface water systems including dams, this latter analysis classified nearly a third (n=11) of the world's aquifer systems as having their lowest sustainability criterion.
Table 1Identification number, name, and general location of the world's 37 large aquifer systems as provided in the WHYMAP database (https://www.whymap.org/, last access: 5 August 2020). The mean climatic condition of each of the 37 aquifer systems based on the aridity index is tabulated.
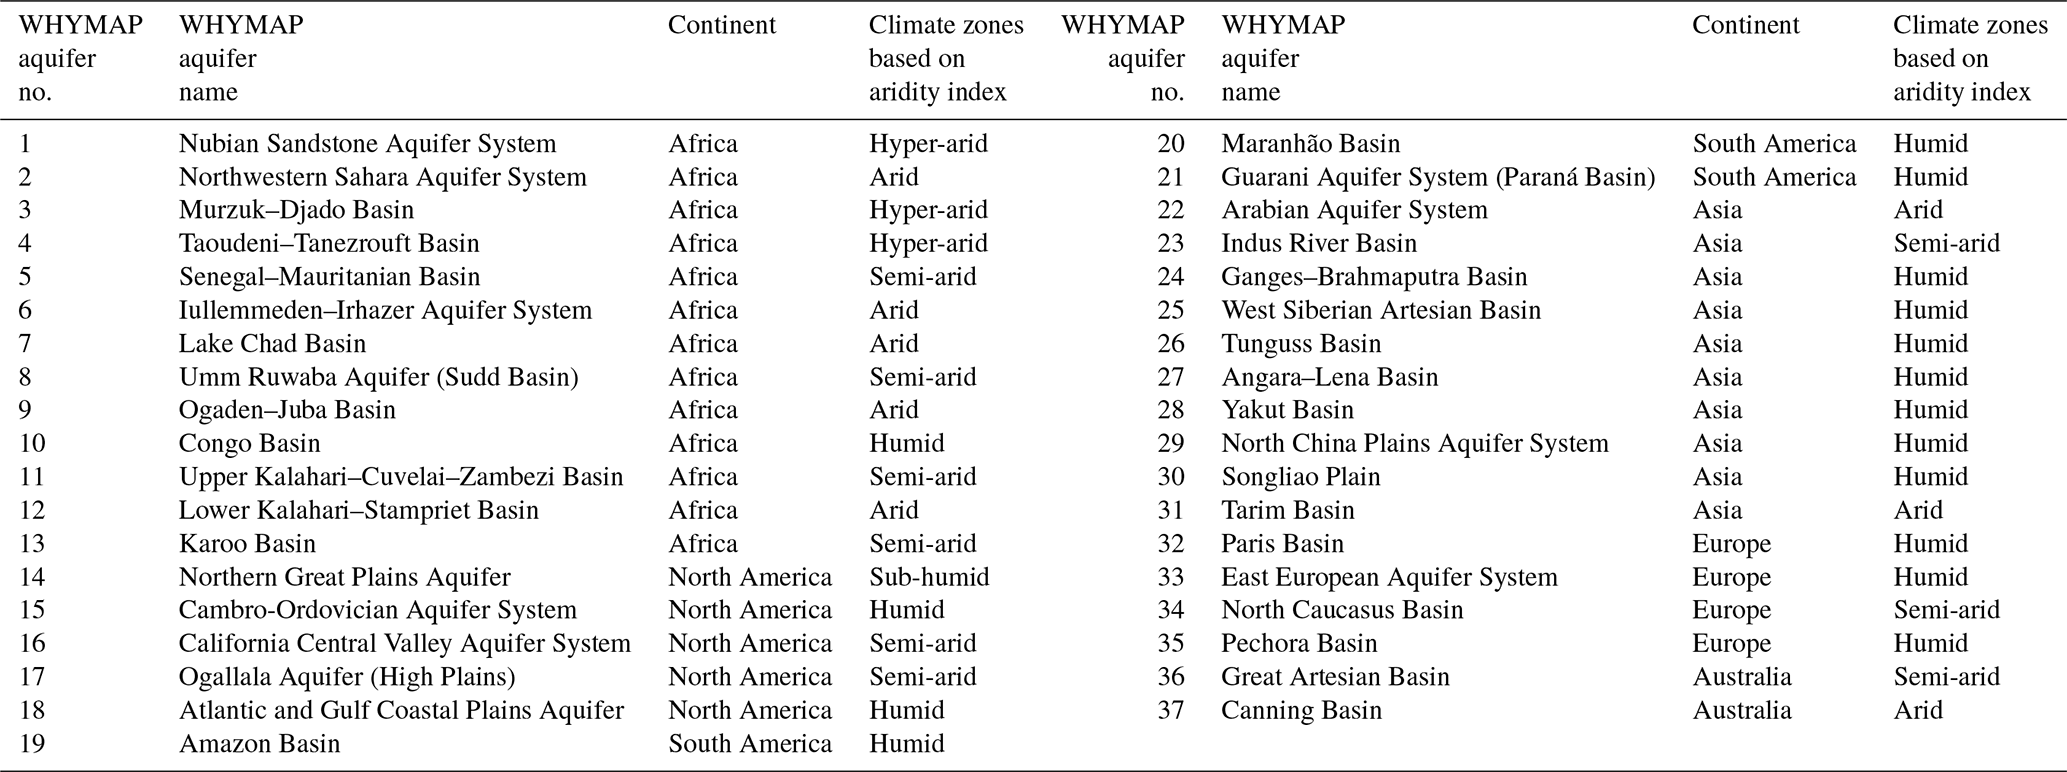
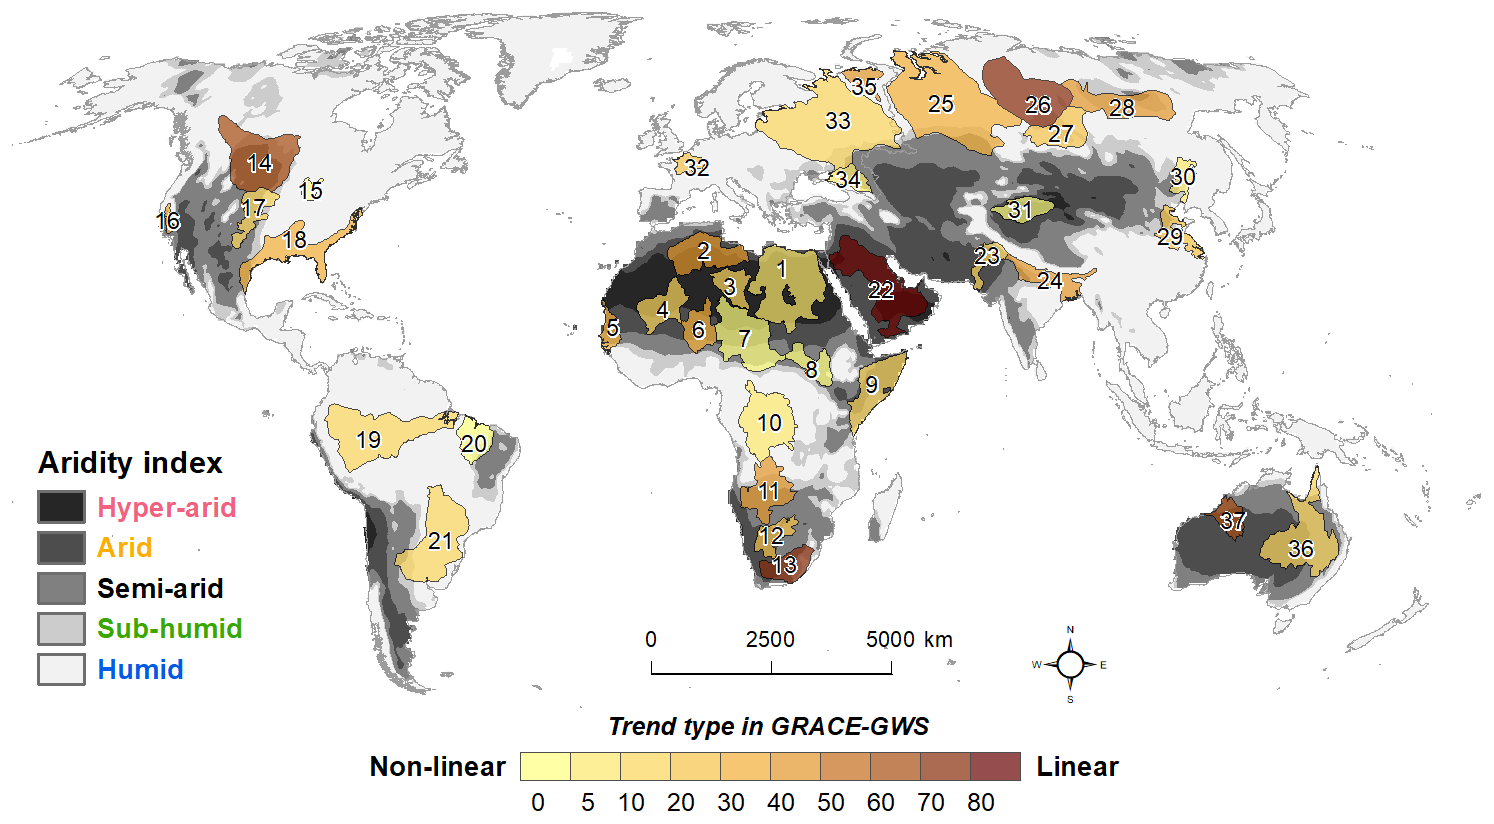
Figure 1Global map of 37 large aquifer systems from the GIS database of the World-wide Hydrogeological Mapping and Assessment Programme (WHYMAP); the names of these aquifer systems are listed in Table 1 and correspond to the numbers shown on this map for reference. Grey shading shows the aridity index based on CGIAR’s database of the Global Potential Evapotranspiration (Global-PET) and Global Aridity Index (https://cgiarcsi.community/, last access: 5 August 2020); the proportion (as a percentage) of long-term trends in GRACE-derived ΔGWS of these large aquifer systems that is explained by linear trend fitting is shown in colour (i.e. linear trends toward dark red and non-linear trends toward light brown–yellow).
Here, we update and extend the analysis of ΔGWS in the world's 37 large aquifer systems using an ensemble of three GRACE ΔTWS products (CSR, Mascons, GRGS) over a 14-year period from August 2002 to July 2016. To isolate GRACE-derived ΔGWS from GRACE ΔTWS, we employ estimates of ΔSMS, ΔSWS, and ΔSNS from five LSMs (CLM, Noah, VIC, Mosaic, Noah v.2.1) run by NASA's Global Land Data Assimilation System (GLDAS). As such, we explicitly account for the contribution of ΔSWS to ΔTWS, which has been commonly overlooked (Rodell et al., 2009; Richey et al., 2015) despite evidence of its significant contribution to ΔTWS (Kim et al., 2009; Shamsudduha et al., 2012; Getirana et al., 2017). Further, we characterise trends in time series records of GRACE-derived ΔGWS by employing a non-parametric seasonal trend decomposition procedure based on Loess (STL) (Cleveland et al., 1990) that allows for the resolution of seasonal, trend, and irregular components of GRACE-derived ΔGWS for each large aquifer system. In contrast to linear or multiple linear regression techniques, STL does not assume that data are normally distributed or that the underlying trend is linear (Shamsudduha et al., 2009; Humphrey et al., 2016; Sun et al., 2017).
2.1 Global large aquifer systems
We use the World-wide Hydrogeological Mapping and Assessment Programme (WHYMAP) Geographic Information System (GIS) dataset for the delineation of world's 37 large aquifer systems (Fig. 1, Table 1) (WHYMAP and Margat, 2008). The WHYMAP network, led by the German Federal Institute for Geosciences and Natural Resources (BGR), serves as a central repository and hub for global groundwater data, information, and mapping with a goal of assisting regional, national, and international efforts toward sustainable groundwater management (Richts et al., 2011). The largest aquifer system in this dataset (Table S1 in the Supplement) is the East European Aquifer System (WHYMAP no. 33; area: 2.9 million km2), and the smallest is the California Central Valley Aquifer System (WHYMAP no. 16; area: 71 430 km2), which is smaller than the typical sensing area of GRACE (∼200 000 km2). However, Longuevergne et al. (2013) argue that GRACE satellites are sensitive to total mass changes at a basin scale, so ΔTWS measurements can be applied to smaller basins if the magnitude of temporal mass changes is substantial due to mass water withdrawals (e.g. intensive groundwater-fed irrigation). The mean and median sizes of these large aquifers are ∼945 000 and ∼600 000 km2, respectively.
2.2 GRACE products
We use post-processed, gridded () monthly GRACE TWS data from CSR land (Landerer and Swenson, 2012) and JPL Global Mascon (Watkins et al., 2015; Wiese et al., 2016) solutions from NASA's dissemination site (http://grace.jpl.nasa.gov/data, last access: 5 August 2020), as well as a third GRGS GRACE solution (CNES/GRGS release RL03-v1) (Biancale et al., 2006) from the French space agency, Centre National D'études Spatiales (CNES). To address the uncertainty associated with different GRACE processing strategies (CSR, JPL Mascons, GRGS), we apply an ensemble mean of the three GRACE solutions (Bonsor et al., 2018).
The CSR land solution (version RL05.DSTvSCS1409) is post-processed from spherical harmonics released by the Centre for Space Research (CSR) at the University of Texas at Austin. CSR gridded datasets are available at a monthly time step and a spatial resolution of (∼111 km at Equator), though the actual spatial resolution of the GRACE footprint (Scanlon et al., 2012a) is 450 km ×450 km or ∼200 000 km2. To amplify TWS signals we apply the dimensionless scaling factors provided as bins that are derived from minimising differences between TWS estimated from GRACE and the hydrological fields from the Community Land Model (CLM4.0) (Landerer and Swenson, 2012). JPL Mascons (version RL05M_1.MSCNv01) data processing involves the same glacial isostatic adjustment correction but applies no spatial filtering as JPL RL05M directly relates inter-satellite range-rate data to mass concentration blocks (Mascons) to estimate monthly gravity fields in terms of equal-area mass concentration functions in order to minimise measurement errors. Gridded Mascon fields are provided at a spatial sampling of 0.5∘ in both latitude and longitude (∼56 km at the Equator). Similar to the CSR product, dimensionless scaling factors are provided as bins (Shamsudduha et al., 2017) to apply to the JPL Mascons product that also derive from the Community Land Model (CLM4.0) (Wiese et al., 2016). The scaling factors are multiplicative coefficients that minimise the difference between the smoothed and unfiltered monthly ΔTWS variations from the CLM4.0 hydrology model (Wiese et al., 2016). Finally, GRGS GRACE (version RL03-v1) monthly gridded solutions with a spatial resolution of are extracted, and aggregated time series data are generated for each aquifer system. A description of the estimation method for ΔGWS from GRACE and in situ observations is provided below.
2.3 Estimation of ΔGWS from GRACE
We apply monthly measurements of terrestrial water storage anomalies (ΔTWS) from Gravity Recovery and Climate Experiment (GRACE) satellites and simulated records of soil moisture storage (ΔSMS), surface runoff or surface water storage (ΔSWS), and snow water equivalent (ΔSNS) from NASA's Global Land Data Assimilation System (GLDAS version 1.0) at grids for the period of August 2002 to July 2016 to estimate (Eq. 1) groundwater storage changes (ΔGWS) in the 37 WHYMAP large aquifer systems. This approach is consistent with previous global (Thomas et al., 2017) and basin-scale (Rodell et al., 2009; Asoka et al., 2017; Feng et al., 2018) analyses of ΔGWS from GRACE. We apply three gridded GRACE products (CSR, JPL Mascons, GRGS), an ensemble mean of ΔTWS and individual storage components of ΔSMS and ΔSWS from four land surface models (LSMs: CLM, Noah, VIC, Mosaic), and a single ΔSNS from Noah model (GLDAS version 2.1) to derive a total of 20 realisations of ΔGWS (Table S5) for each of the 37 aquifer systems. We then averaged all the GRACE-derived ΔGWS estimates to generate an ensemble mean ΔGWS time series record for each aquifer system. GRACE and GLDAS LSM-derived datasets are processed and analysed in the R programming language (R Core Team, 2017).
2.4 GLDAS land surface models
To estimate GRACE-derived ΔGWS using Eq. (1), we use simulated soil moisture storage (ΔSMS), surface runoff, as a proxy for surface water storage ΔSWS (Bhanja et al., 2016, Getirana et al., 2017; Thomas et al., 2017), and snow water equivalent (ΔSNS) from NASA's Global Land Data Assimilation System (GLDAS). The GLDAS system (https://ldas.gsfc.nasa.gov/gldas/, last access: 5 August 2020) drives multiple offline (not coupled to the atmosphere) land surface models globally (Rodell et al., 2004) at variable grid resolutions (from 2.5∘ to 1 km), enabled by the Land Information System (LIS) (Kumar et al., 2006). Currently, GLDAS (version 1) drives four land surface models (LSMs): Mosaic, Noah, the Community Land Model (CLM), and the Variable Infiltration Capacity (VIC) model. We apply monthly ΔSMS (sum of all soil profiles) and ΔSWS data at a spatial resolution of from four GLDAS LSMs: the Community Land Model (CLM, version 2.0) (Dai et al., 2003), Noah (version 2.7.1) (Ek et al., 2003), the Variable Infiltration Capacity (VIC) model (version 1.0) (Liang et al., 2003), and Mosaic (version 1.0) (Koster and Suarez, 1992). The respective total depths of modelled soil profiles are 3.4, 2.0, 1.9, and 3.5 m in CLM (10 vertical layers), Noah (four vertical layers), VIC (three vertical layers), and Mosaic (three vertical layers) (Rodell et al., 2004). For snow water equivalent (ΔSNS), we use simulated data from the Noah (v.2.1) model (GLDAS version 2.1) forced by the global meteorological dataset from Princeton University (Sheffield et al., 2006); LSMs under GLDAS (version 1) are forced by the Climate Prediction Center (CPC) Merged Analysis of Precipitation (CMAP) data (Rodell et al., 2004).
2.5 Global precipitation datasets
To evaluate the relationships between precipitation and GRACE-derived ΔGWS, we use a high-resolution (0.5 ∘) gridded, global precipitation dataset (version 4.01) (Harris et al., 2014) available from the Climatic Research Unit (CRU) at the University of East Anglia (https://crudata.uea.ac.uk/cru/data/hrg/, last access: 5 August 2020). In light of uncertainty in observed precipitation datasets globally, we test the robustness of the relationship between precipitation and groundwater storage using the GPCC (Global Precipitation Climatology Centre) precipitation dataset (Schneider et al., 2017) (https://www.esrl.noaa.gov/psd/data/gridded/data.gpcc.html) from 1901 to 2016. Time series (January 1901 to July 2016) of monthly precipitation from CRU and GPCC datasets for the WHYMAP aquifer systems were analysed and processed in the R programming language (R Core Team, 2017).
2.6 Seasonal trend decomposition (STL) of GRACE ΔGWS
Monthly time series records (August 2002 to July 2016; Figs. S1–S36) of the ensemble mean GRACE ΔTWS and GRACE-derived ΔGWS were decomposed to seasonal, trend, and remainder or residual components using a non-parametric time series decomposition technique known as the seasonal trend decomposition procedure based on a locally weighted regression method called Loess (STL) (Cleveland et al., 1990). Loess is a nonparametric method so that the fitted curve is obtained empirically without assuming the specific nature of any structure that may exist within the data (Jacoby, 2000). A key advantage of the STL method is that it reveals relatively complex structures in time series data that could easily be overlooked using traditional statistical methods such as linear regression.
STL decomposition techniques have previously been used to analyse GRACE ΔTWS regionally (Hassan and Jin, 2014) and globally (Humphrey et al., 2016). GRACE-derived ΔGWS time series records for each aquifer system were decomposed using the STL method (see Eq. 2) in the R programming language (R Core Team, 2017) as
where Yt is the monthly ΔGWS at time t, Tt is the trend component, St is the seasonal component, and Rt is a remainder (residual or irregular) component.
The STL method consists of a series of smoothing operations with different moving window widths chosen to extract different frequencies within a time series, and it can be regarded as an extension of classical methods for decomposing a series into its individual components (Chatfield, 2003). The nonparametric nature of the STL decomposition technique enables the detection of non-linear patterns in long-term trends that cannot be assessed through linear trend analyses (Shamsudduha et al., 2009). For STL decomposition, it is necessary to choose values of smoothing parameters to extract trend and seasonal components. The selection of parameters in STL decomposition is a subjective process. The choice of the seasonal smoothing parameter determines the extent to which the extracted seasonal component varies from year to year: a large value will lead to similar components in all years, whereas a small value will allow the extracted component to track the observations more closely. Similar comments apply to the choice of smoothing parameter for the trend component. We experimented with several different choices of smoothing parameters (see Fig. S37) and checked the residuals (i.e. remainder component) for the overall performance of the STL decomposition model. We conducted the Shapiro–Wilk normality test on the residuals after fitting the STL smooth line with a range of trend cycle (t.window) and seasonal (s.window) windows and compared the p values. Visualisation of the results with several smoothing parameters (Fig. S37) and the corresponding smaller p values (i.e. p value <0.01) of the normality test suggested that the overall structure of time series at all sites could be captured reasonably well using window widths of 13 for the seasonal component and 37 for the trend. We apply the STL decomposition with a robust fitting of the Loess smoother (Cleveland et al., 1990) to ensure that the fitting of the curvilinear trend does not have an adverse effect due to extreme outliers in the time series data (Jacoby, 2000). Finally, to make the interpretation and comparison of non-linear trends across all 37 aquifer systems, smoothing parameters were then fixed for all subsequent STL analyses.
3.1 Variability in ΔTWS of the large aquifer systems
Ensemble mean time series of GRACE ΔTWS for the world's 37 large aquifer systems are shown in Fig. 2 (High Plains Aquifer System, no. 17) and Figs. S1–S36 (remaining 36 aquifer systems). The STL decomposition of an ensemble GRACE ΔTWS in the High Plains Aquifer System (no. 17) decomposes the time series into seasonal, trend, and residual components (see Fig. S37). Variance (square of the standard deviation) in monthly GRACE ΔTWS (Figs. 3a and 4, Table S1) is highest (>100 cm2) primarily under monsoonal precipitation regimes within the Intertropical Convergence Zone (e.g. Upper Kalahari–Cuvelai–Zambezi 11, Amazon 19, Maranhão 20, Ganges–Brahmaputra 24). The sum of individual components derived from the STL decomposition (i.e. seasonal, trend, and irregular or residual) approximates the overall variance in time series data. The majority of the variance (>50 %) in ΔTWS is explained by seasonality (Fig. 3a); non-linear (curvilinear) trends represent <25 % of the variance in ΔTWS with the exception of the Upper Kalahari–Cuvelai–Zambezi no. 11 (42 %). In contrast, variance in GRACE ΔTWS in most hyper-arid and arid basins is low (Fig. 3a) at <10 cm2 (e.g. Nubian 1, NW Sahara 2, Murzuk–Djado 3, Taoudeni–Tanezrouft 4, Ogaden–Juba 9, Lower Kalahari–Stampriet 12, Karoo 13, Tarim 31) and largely (>65 %) attributed to ΔGWS (Table S2). Overall, changes in ΔTWS (i.e. difference between two consecutive hydrological years) are correlated (Pearson correlation, r>0.5, p value <0.01) with annual precipitation for 25 of the 37 large aquifer systems (Table S1). GRACE ΔTWS in aquifer systems under monsoonal precipitation regimes is strongly correlated with rainfall, with a lag of 2 months (r>0.65, p value <0.01).
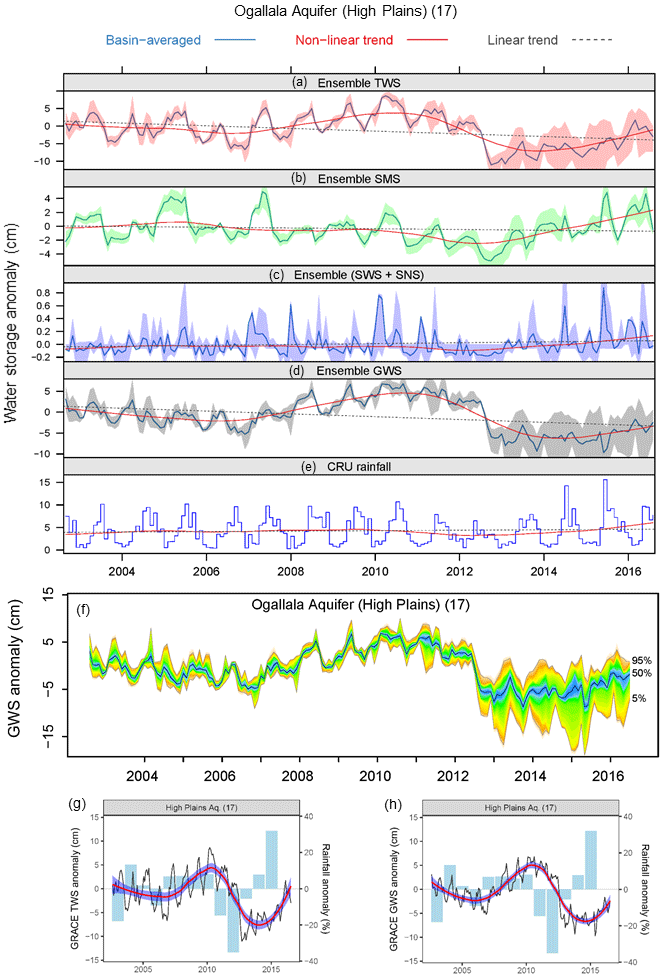
Figure 2Time series data on terrestrial water storage anomaly (ΔTWS) from GRACE and individual water stores from GLDAS land surface models (LSMs): (a) ensemble monthly GRACE ΔTWS from three solutions (CSR, Mascons, GRGS), (b–c) ensemble monthly ΔSMS and ΔSWS + ΔSNS from four GLDAS LSMs (CLM, Noah, VIC, Mosaic), (d) computed monthly ΔGWS and (e) monthly precipitation from August 2002 to July 2016, (f) range of uncertainty in GRACE-derived GWS from 20 realisations, (g) ensemble TWS and annual precipitation, and (h) ensemble GRACE-derived GWS and annual precipitation for the High Plains Aquifer System in the USA (WHYMAP aquifer no. 17). Values on the y axis in panels (a–e) show monthly water storage anomalies (cm), and panels (g, h) show monthly precipitation (cm). Time series data for the 36 large aquifer systems can be found in Figs. S1–S36.
3.2 GRACE ΔGWS and evidence from in situ piezometry
Evaluations of computed GRACE-derived ΔGWS using in situ observations are limited spatially and temporally by the availability of piezometric records (Swenson et al., 2006; Strassberg et al., 2009; Scanlon et al., 2012b; Shamsudduha et al., 2012; Panda and Wahr, 2015; Feng et al., 2018). Consequently, comparisons of GRACE and in situ ΔGWS remain opportunity-driven and, here, comprise the Limpopo Basin in southern Africa and the Bengal Basin in Bangladesh where we possess time series records of adequate duration and density. The Bengal Basin is a part of the Ganges–Brahmaputra aquifer system (aquifer no. 24), whereas the Limpopo Basin is located between the Lower Kalahari–Stampriet Basin (aquifer no. 12) and the Karoo Basin (aquifer no. 13). The two basins feature contrasting climates (i.e. tropical humid versus tropical semi-arid) and geologies (i.e. unconsolidated sands versus weathered crystalline rock) that represent key controls on the magnitude and variability expected in ΔGWS. Both basins are in the tropics and, as such, serve less well to test the computation of GRACE-derived ΔGWS at middle and high latitudes.
In the Bengal Basin, computed GRACE and in situ ΔGWS values demonstrate an exceptionally strong seasonal signal associated with monsoonal recharge that is amplified by dry-season abstraction (Shamsudduha et al., 2009, 2012) and high storage of the regional unconsolidated sand aquifer, represented by a bulk specific yield (Sy) of 10 % (Fig. S38a). Time series of GRACE and LSMs are shown in Fig. S39. The ensemble mean time series of computed GRACE ΔGWS from three GRACE TWS solutions and five NASA GLDAS LSMs is strongly correlated (r=0.86, p value <0.001) with in situ ΔGWS derived from a network of 236 piezometers (mean density of one piezometer per 610 km2) for the period of 2003 to 2014. In the semi-arid Limpopo Basin where mean annual rainfall (469 mm for the period of 2003 to 2015) is one-fifth of that in the Bengal Basin (2276 mm), the seasonal signal in ΔGWS, primarily in weathered crystalline rocks with a bulk Sy of 2.5 %, is smaller (Fig. S38b). Time series of GRACE and LSMs are shown in Fig. S40. Comparison of in situ ΔGWS, derived from a network of 40 piezometers (mean density of one piezometer per 1175 km2), and computed GRACE-derived ΔGWS shows broad correspondence (r=0.62, p value <0.001), though GRACE-derived ΔGWS is “noisier”; intra-annual variability may result from uncertainty in the representation of other terrestrial stores using LSMs that are used to compute GRACE-derived ΔGWS from GRACE ΔTWS. The magnitude of uncertainty in monthly ΔSWS, ΔSMS, and ΔSNS, which are estimated by GLDAS LSMs to compute GRACE-derived ΔGWS in each large-scale aquifer system, is depicted in Figs. 2 and S1–S36. The favourable, statistically significant correlations between the computed ensemble mean GRACE-derived ΔGWS and in situ ΔGWS shown in these two contrasting basins indicate that, at large scales (∼200 000 km2), the methodology used to compute GRACE-derived ΔGWS has merit.
3.3 Trends in GRACE ΔGWS time series
Computation of GRACE-derived ΔGWS for the 37 large-scale aquifers globally is shown in Figs. 2 and 5. Figure 2 shows the ensemble GRACE ΔTWS and GLDAS LSM datasets used to compute GRACE-derived ΔGWS for the High Plains Aquifer System in the USA (aquifer no. 17 in Fig. 1); datasets used for all other large-scale aquifer systems are given in the Supplement (Figs. S1–S36). In addition to the ensemble mean, we show uncertainty in GRACE-derived ΔGWS associated with 20 realisations from GRACE products and LSMs. Monthly time series data on ensemble GRACE-derived ΔGWS for the other 36 large-scale aquifers are plotted (absolute scale) in Fig. 5 (in black) and fitted with a Loess-based trend (in blue). For all but five large aquifer systems (e.g. Lake Chad Basin WHYMAP no. 7, Umm Ruwaba 8, Amazon 19, West Siberian Basin 25, and East European 33), the dominant time series component explaining variance in GRACE-derived ΔGWS is trend (Figs. 3b and S41–S77). Trends in GRACE-derived ΔGWS are, however, overwhelmingly non-linear (curvilinear); linear trends adequately (R2>0.5, p value <0.05) explain variability in GRACE-derived ΔGWS in just 5 of 37 large-scale aquifer systems, and of these, only two (Arabian 22, Canning 37) are declining. GRACE-derived ΔGWS values for three intensively developed, large-scale aquifer systems (Table S1: California Central Valley 16, Ganges–Brahmaputra 24, North China Plain 29) show episodic declines (Fig. 5), though in each case their overall trend from 2002 to 2016 is declining but non-linear (Fig. 1).
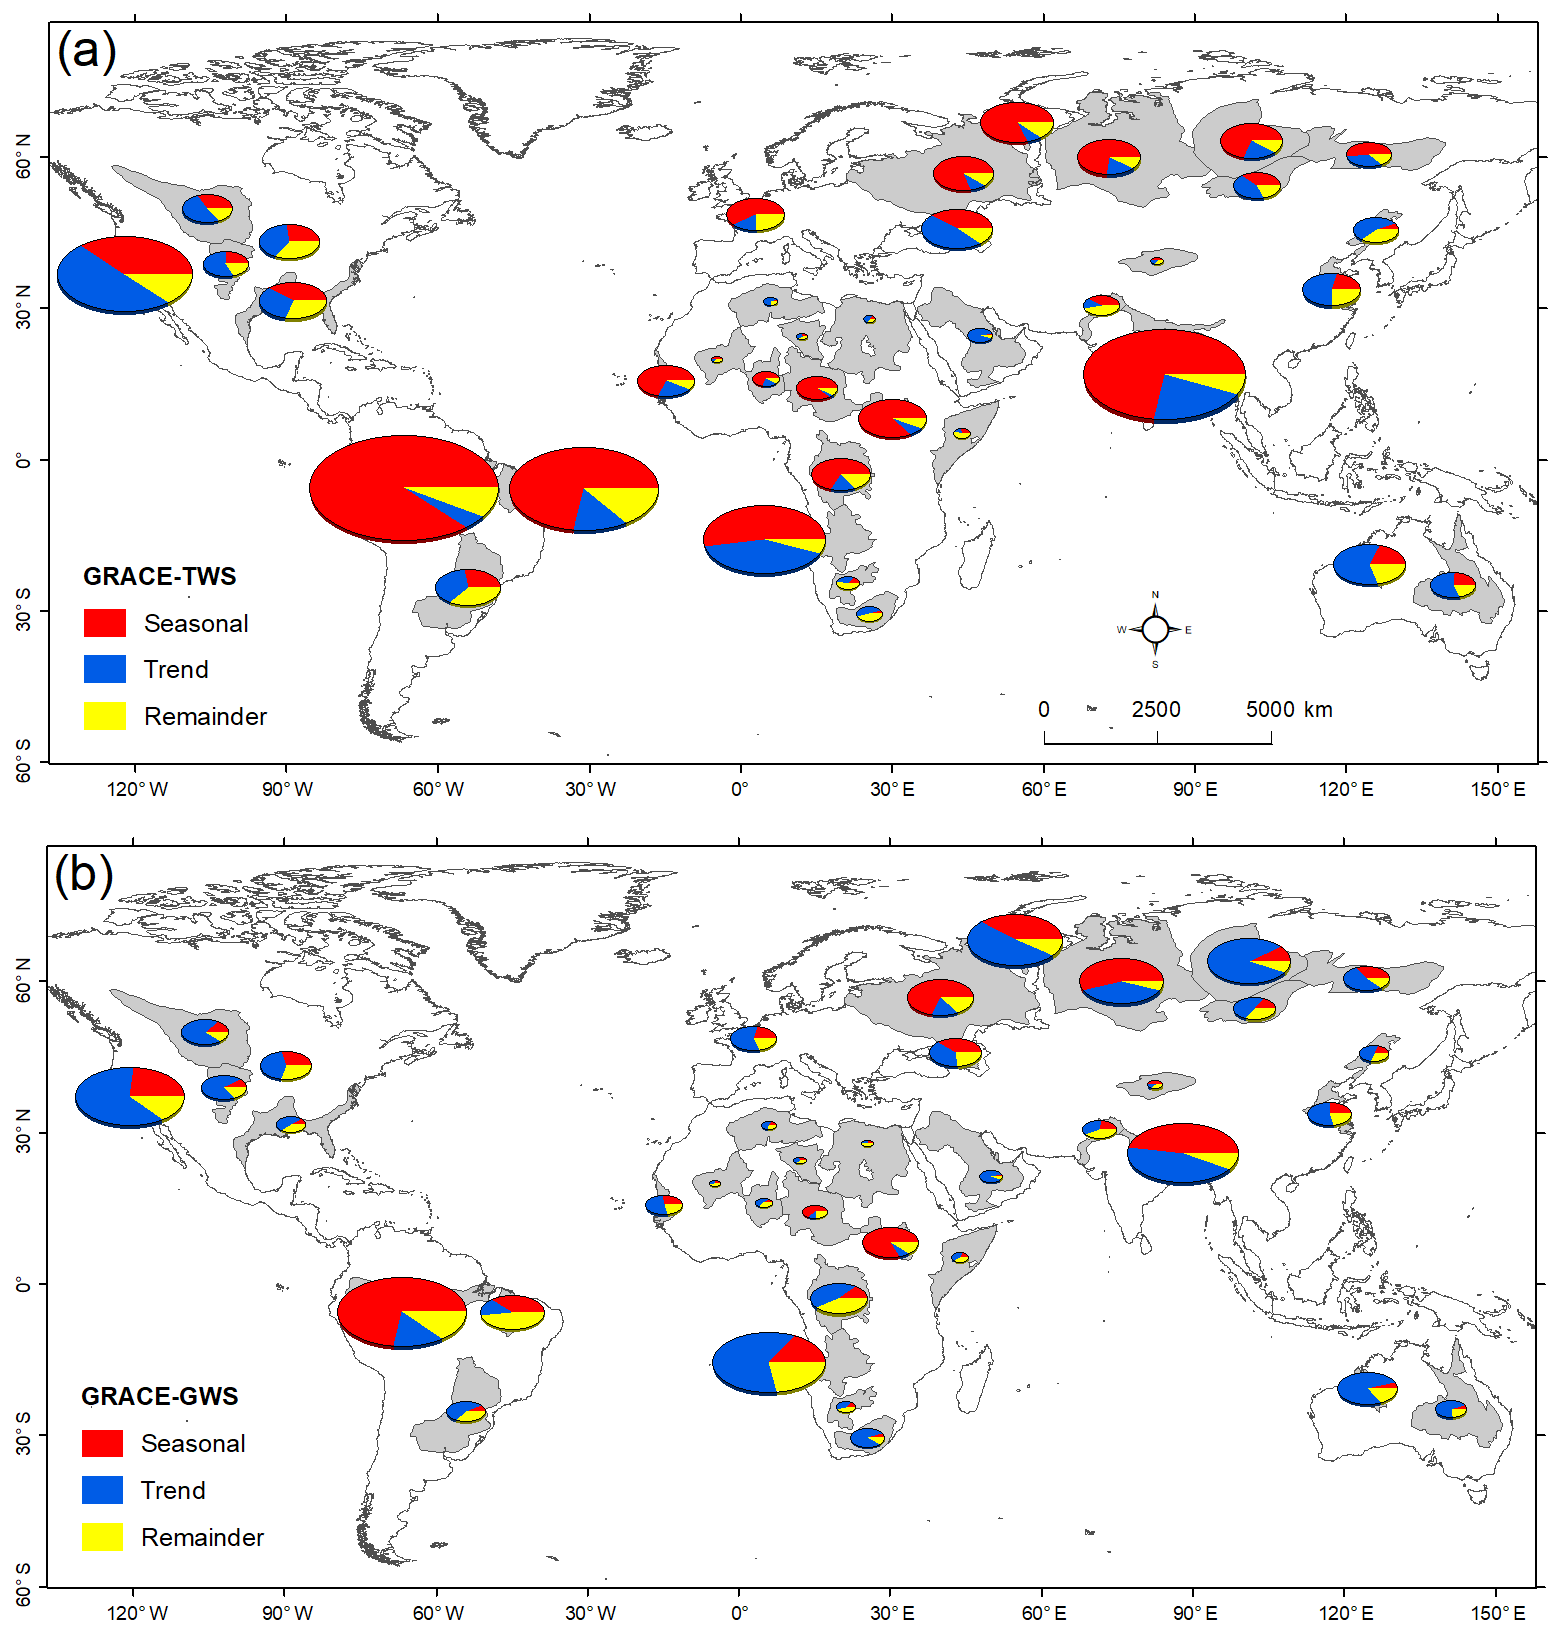
Figure 3Seasonal trend decomposition of (a) GRACE ΔTWS and (b) GRACE ΔGWS time series data (2002 to 2016) for the world's 37 large aquifer systems using the STL decomposition method; seasonal, trend, and remainder or irregular components of time series data are decomposed and plotted as pie charts that are scaled by the variance of the time series in each aquifer system.

Figure 4Monthly time series data (black) on ensemble GRACE ΔTWS for 36 large aquifer systems with a fitted non-linear trend line (Loess smoothing line in thick blue) through the time series data; GRACE ΔTWS for the remaining large aquifer system (High Plains Aquifer System, WHYMAP aquifer no. 17) is given in Fig. 2. The shaded area in semi-transparent cyan shows the range of the 95 % confidence interval of the fitted Loess-based non-linear trends; light grey bar diagrams behind the lines on each panel show the annual precipitation anomaly (i.e. percentage deviation from the mean precipitation for the period of 1901 to 2016); banner colours indicate the dominant climate of each aquifer based on the mean aridity index shown in the legend in Fig. 1.

Figure 5Monthly time series data (black) on ensemble GRACE ΔGWS for 36 large aquifer systems with a fitted non-linear trend line (Loess smoothing line in thick blue) through the time series data; GRACE ΔGWS for the remaining large aquifer system (High Plains Aquifer System, WHYMAP aquifer no. 17) is given in Fig. 2. The shaded area in semi-transparent cyan shows the range of the 95 % confidence interval of the fitted Loess-based non-linear trends; light grey bar diagrams behind the lines on each panel show the annual precipitation anomaly (i.e. percentage deviation from the mean precipitation for the period of 1901 to 2016); banner colours indicate the dominant climate of each aquifer based on the mean aridity index shown in the legend in Fig. 1.
3.4 Computational uncertainty in GRACE ΔGWS
For several large aquifer systems primarily in arid and semi-arid environments, we identify anomalously negative or positive estimates of GRACE-derived ΔGWS that deviate substantially from underlying trends (Figs. 6 and S78). For example, the semi-arid Upper Kalahari–Cuvelai–Zambezi Basin (11) features an extreme negative anomaly in GRACE-derived ΔGWS (Fig. 6a) in 2007–2008 that is the consequence of simulated values of terrestrial stores (ΔSWS+ΔSMS) by GLDAS LSMs that exceed the ensemble GRACE ΔTWS signal. Inspection of individual time series data for this basin (Fig. S11) reveals greater consistency in the three GRACE ΔTWS time series data (variance of CSR: 111 cm2; Mascons: 164 cm2; GRGS: 169 cm2) compared to simulated ΔSMS among the four GLDAS LSMs (variance of CLM: 9 cm2; Mosaic: 90 cm2; Noah: 98 cm2; VIC is 110 cm2). In the humid Congo Basin (10), positive ΔTWS values in 2006–2007 but negative ΔSMS values produce anomalously high values of GRACE-derived ΔGWS (Figs. 6b and S10). In the snow-dominated, humid Angara–Lena Basin (27), a strongly positive combined signal of ΔSNS+ΔSWS exceeding ΔTWS leads to a very negative estimation of ΔGWS when groundwater is following a rising trend (Figs. 6c and S26).
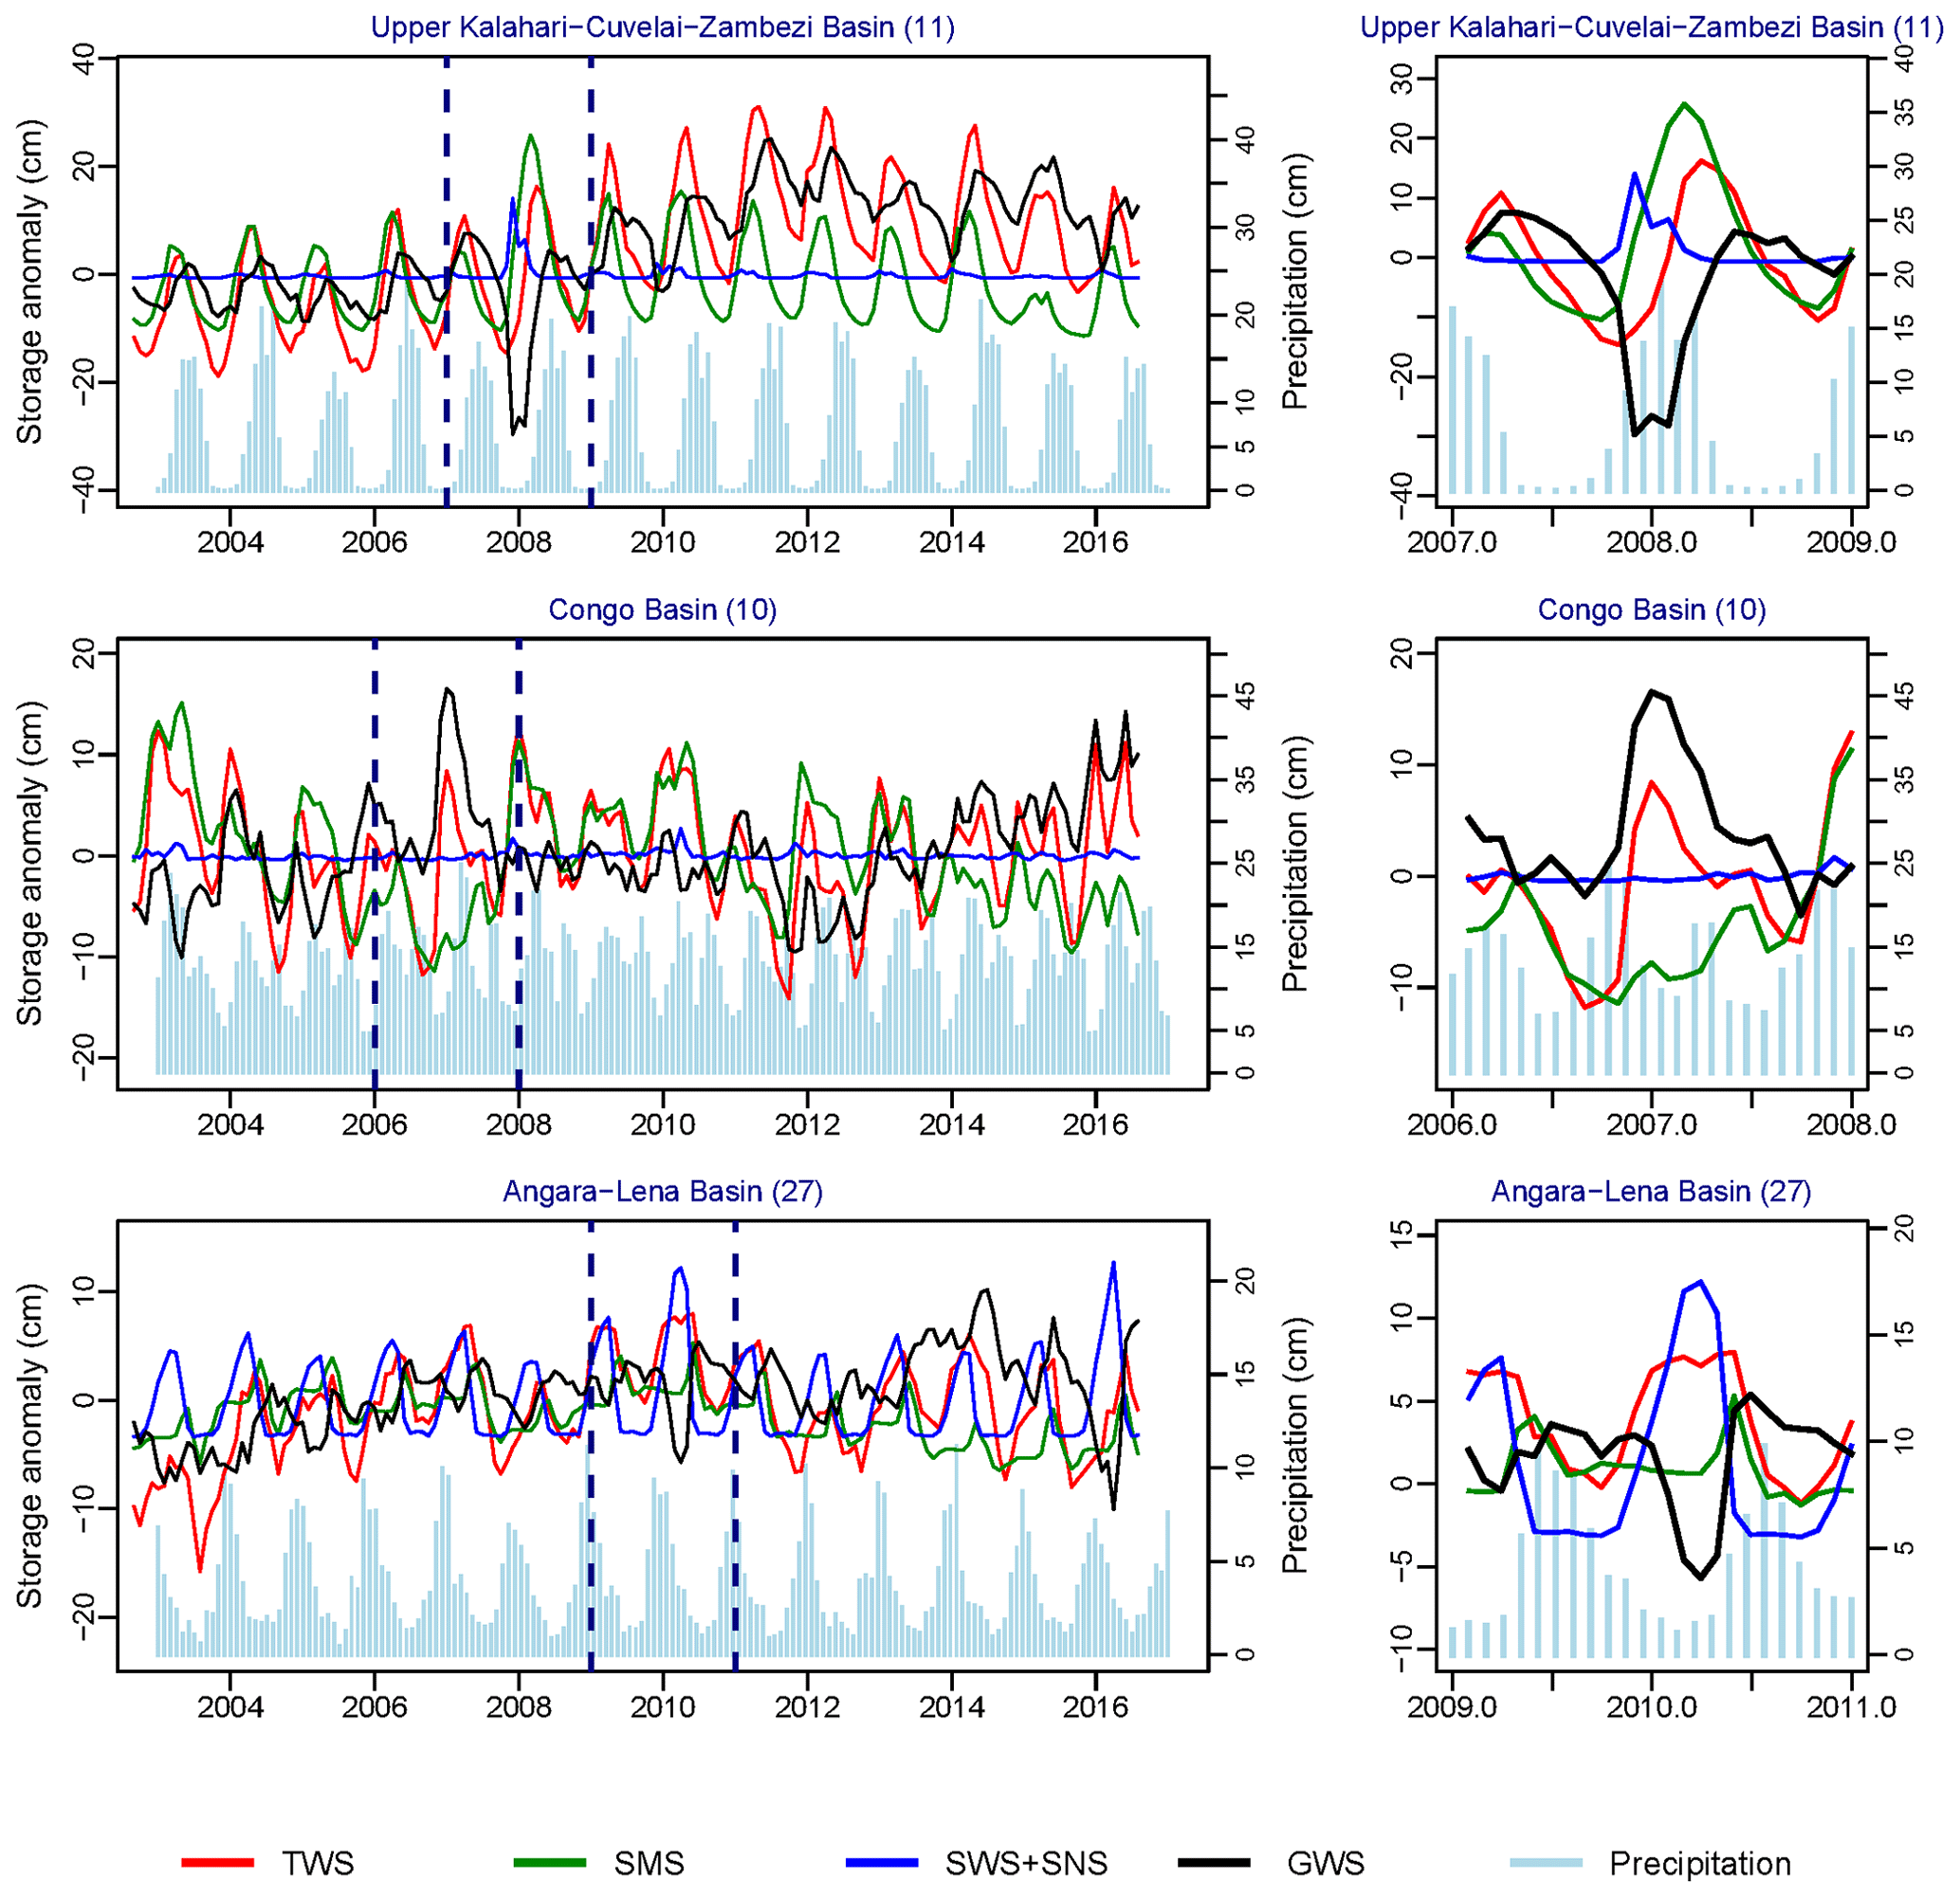
Figure 6Time series of ensemble mean GRACE ΔTWS (red), GLDAS ΔSMS (green), ΔSWS + ΔSNS (blue), and computed GRACE ΔGWS (black) showing the calculation of anomalously negative or positive values of GRACE ΔGWS that deviate substantially from underlying trends. The three examples are (a) the Upper Kalahari–Cuvelai–Zambezi Basin (11) under a semi-arid climate, (b) the Congo Basin (10) under a tropical humid climate, and (c) the Angara–Lena Basin (27) under a temperate humid climate. Examples from an additional five aquifer systems under semi-arid and arid climates are given in the Supplement (Fig. S75).
3.5 GRACE ΔGWS and extreme precipitation
Non-linear trends in GRACE-derived ΔGWS (i.e. difference in STL trend component between two consecutive years) demonstrate a significant association with precipitation anomalies from the CRU dataset for each hydrological year (i.e. percent deviations from mean annual precipitation between 2002 and 2016) in semi-arid environments (Fig. 7; Pearson correlation, r=0.62, p<0.001). These associations over extreme hydrological years are particularly strong in a number of individual aquifer systems (Fig. 5; Tables S3 and S4) including the Great Artesian Basin (36) (r=0.93), California Central Valley (16) (r=0.88), North Caucasus Basin (34) (r=0.65), Umm Ruwaba Basin (8) (r=0.64), and Ogallala (High Plains) Aquifer (17) (r=0.64). In arid aquifer systems, overall associations between GRACE ΔGWS and precipitation anomalies are statistically significant but moderate (r=0.36, p<0.001); a strong association is found only for the Canning Basin (37) (r=0.52). In humid (and sub-humid) aquifer systems, no overall statistically significant association is found, yet strong correlations are noted for two temperate aquifer systems (Northern Great Plains Aquifer (14), r=0.51; Angara–Lena Basin (27), r=0.54); weak correlations are observed in the humid tropics for the Maranhão Basin (20, r=0.24) and Ganges–Brahmaputra Basin (24, r=0.28).
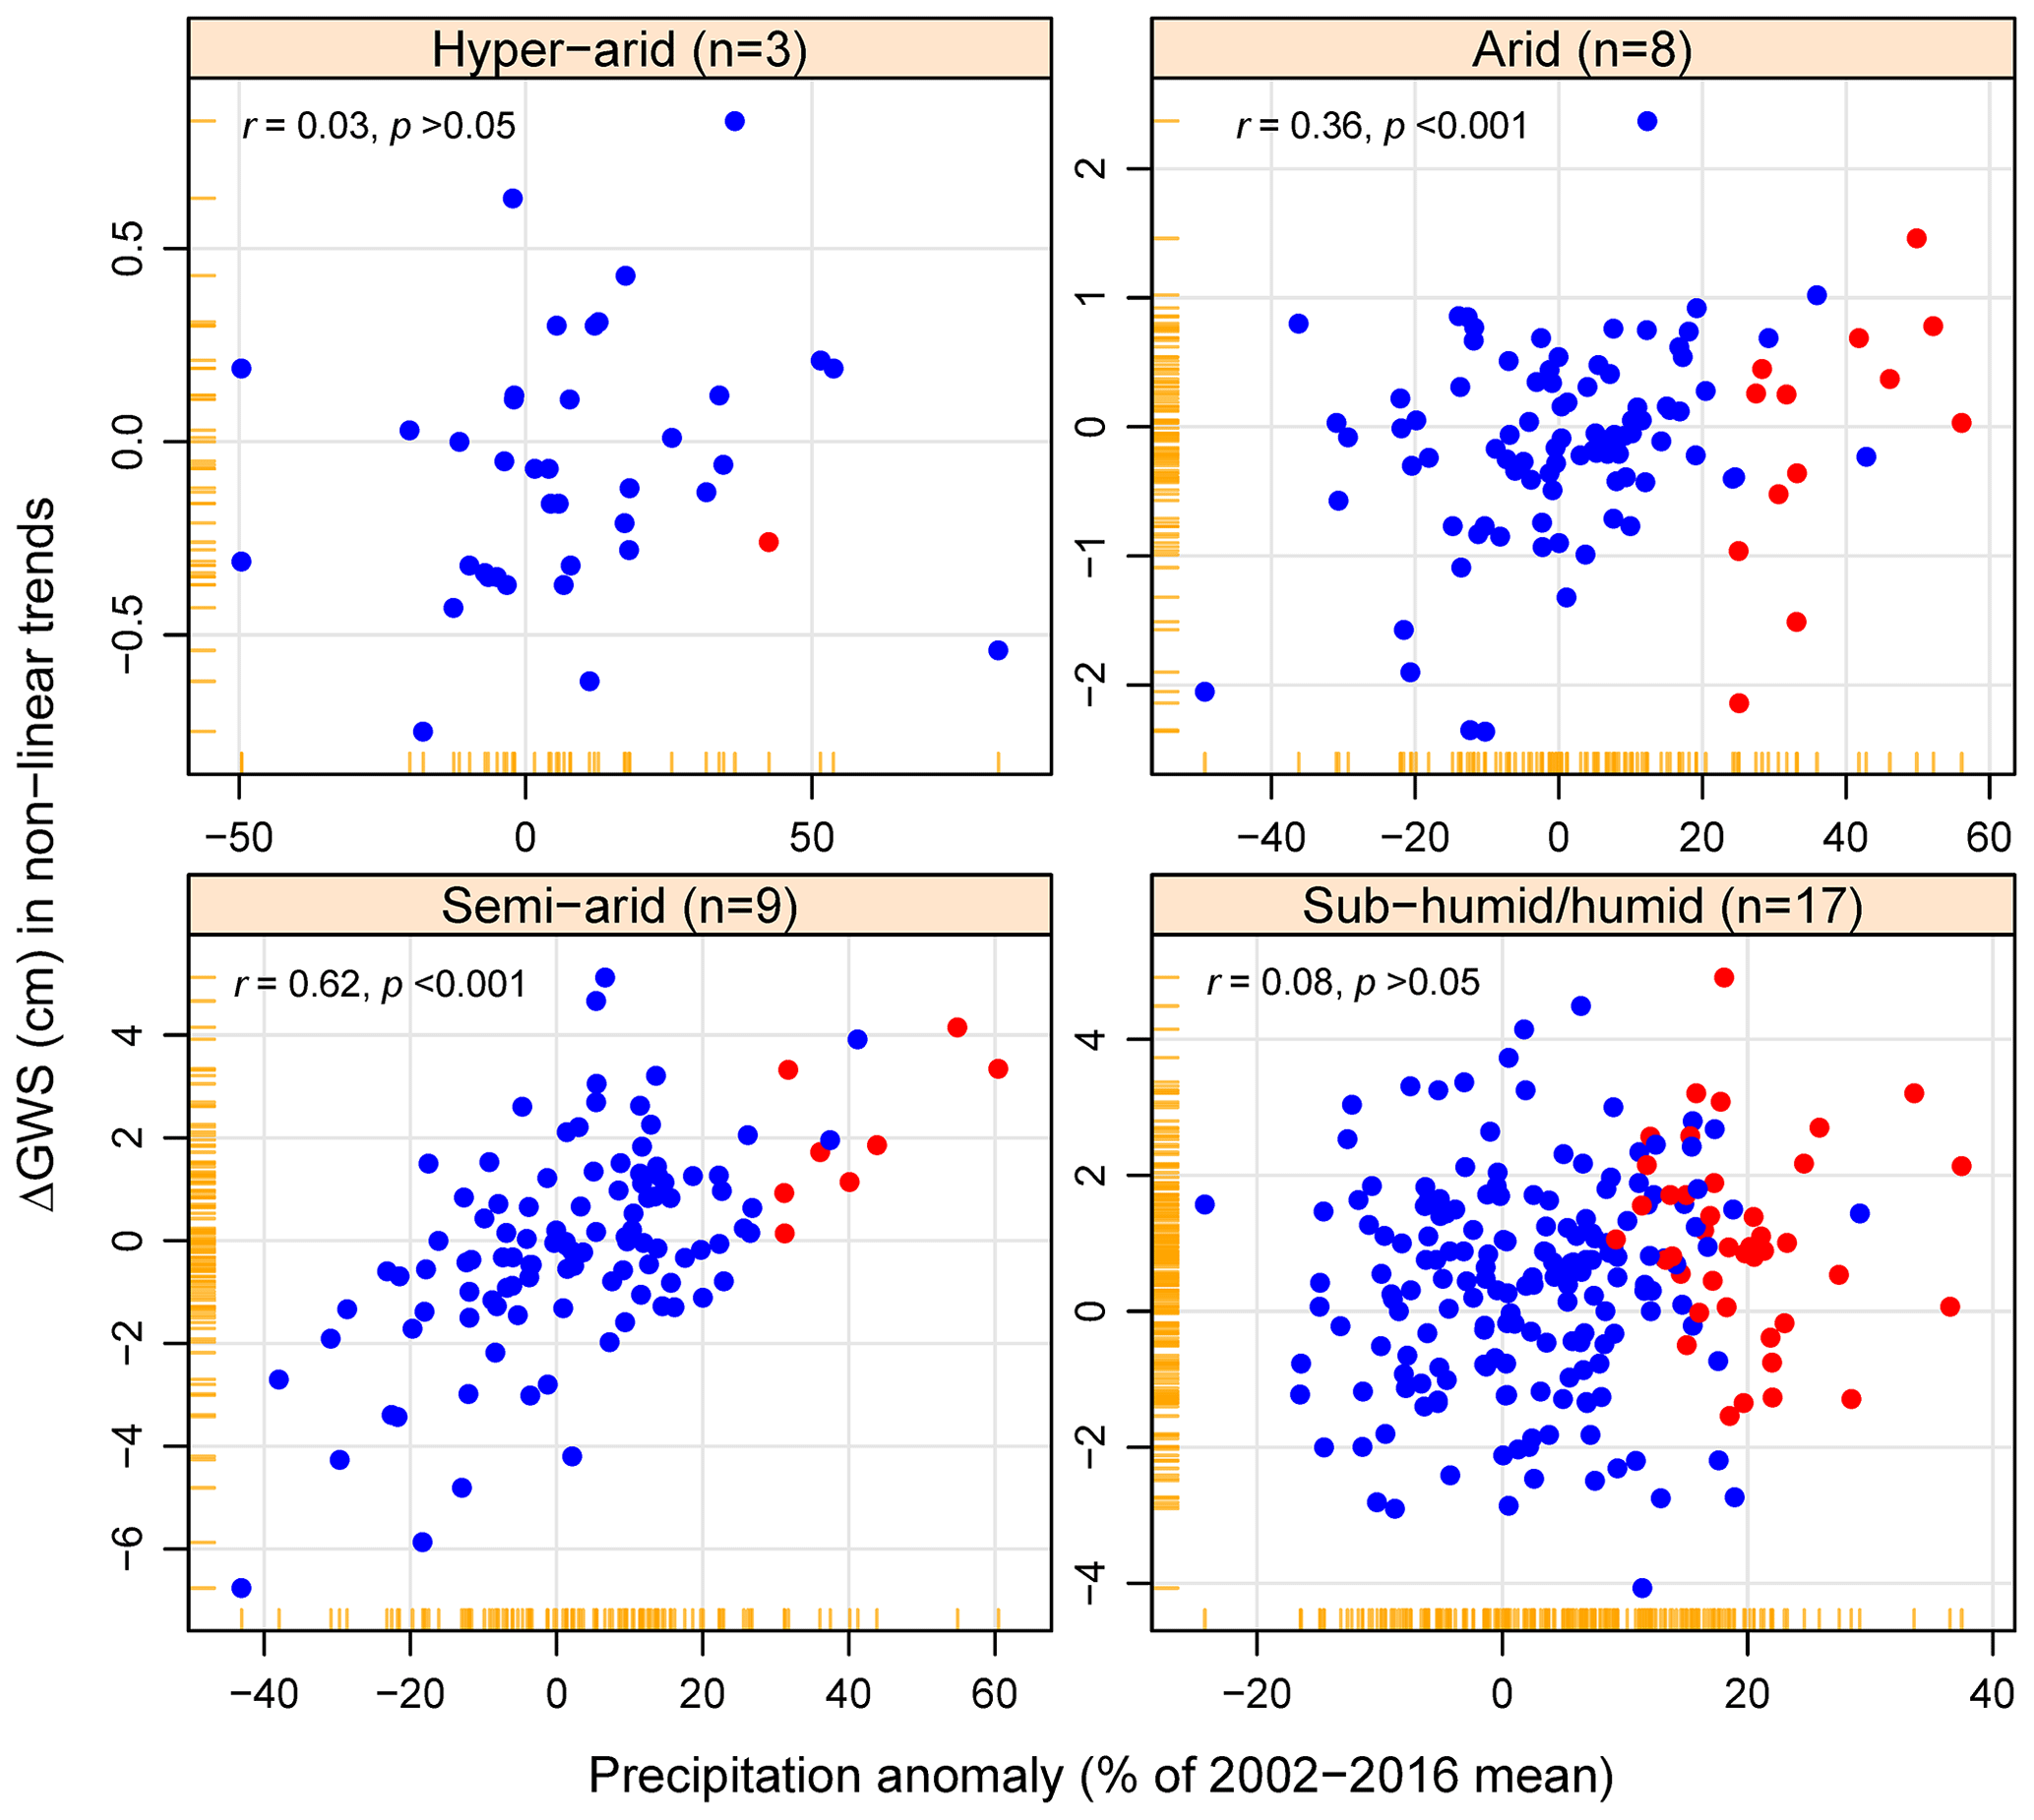
Figure 7Relationships between precipitation anomaly and annual changes in non-linear trends of GRACE ΔGWS in the 37 large aquifer systems grouped by aridity indices. Annual precipitation is calculated based on hydrological year (August to July) for 12 of these aquifer systems and the other 25 following the calendar year (January to December); the highlighted (red) circles on the scatterplots are the years of statistically extreme (> 90th percentile; period: 1901 to 2016) precipitation.
Distinct rises observed in GRACE-derived ΔGWS correspond to extreme seasonal (annual) precipitation (Fig. 5; Tables S3 and S4). In the semi-arid Great Artesian Basin (aquifer no. 36) (Figs. 5 and S35), two consecutive years (2009–2010 and 2010–2011) of statistically extreme (i.e. >90th percentile, period: 1901 to 2016) monthly precipitation interrupt a multi-annual (2002 to 2009) declining trend. Pronounced rises in GRACE-derived ΔGWS in response to extreme annual rainfall are visible in other semi-arid, large aquifer systems including the Umm Ruwaba Basin (8) in 2007, Lower Kalahari–Stampriet Basin (12) in 2011, California Central Valley (16) in 2005, Ogalalla (High Plains) Aquifer (17) in 2015, and Indus Basin (23) in 2010 and 2015 (Tables S3 and S4 and Figs. S2, S8, S12, S16, S22). Similar rises in GRACE-derived ΔGWS in response to extreme annual rainfall in arid basins include the Lake Chad Basin (7) in 2012 and Ogaden–Juba Basin (9) in 2013 (Table S3 and Figs. S7, S9). In the Canning Basin, a substantial rise in GRACE-derived ΔGWS occurred in 2010–2011 (Tables S3 and S4 and Fig. S36) in response to extreme annual rainfall, though the overall trend is declining.
Non-linear trends that feature substantial rises in GRACE-derived ΔGWS in response to extreme annual precipitation under humid climates are observed in the Maranhão Basin (20) in 2008–2009, Guarani Aquifer System (21) in 2015–2016, and North China Plain (29) in 2003. Consecutive years of extreme precipitation in 2012 and 2013 also generate a distinct rise in GRACE-derived ΔGWS in the Songliao Plain (30) (Tables S3 and S4 and Fig. S29). In the heavily developed (Table S2) Ganges–Brahmaputra Basin (24), a multi-annual (2002 to 2010) declining trend is halted by extreme (i.e. highest over the GRACE period of 2002 to 2016 but 59th percentile over the period of 1901 to 2016 using the CRU dataset) annual precipitation in 2011 (Tables S3 and S4 and Fig. S23). Consecutive years from 2014 to 2015 of extreme annual precipitation increased GRACE-derived ΔGWS and disrupted a multi-annual declining trend in the West Siberian Artesian Basin (25) (Tables S3 and S4 and Fig. S24). In the sub-humid Northern Great Plains (14), distinct rises in GRACE-derived ΔGWS occurred in 2010 (Tables S3 and S4 and Fig. S14) in response to extreme annual precipitation, though the overall trend is linear and rising. The overall agreement in mean annual precipitation between the CRU and GPCC datasets for the period of 1901 to 2016 is strong (median correlation coefficient in 37 aquifer systems; r=0.92).
4.1 Uncertainty in GRACE-derived ΔGWS
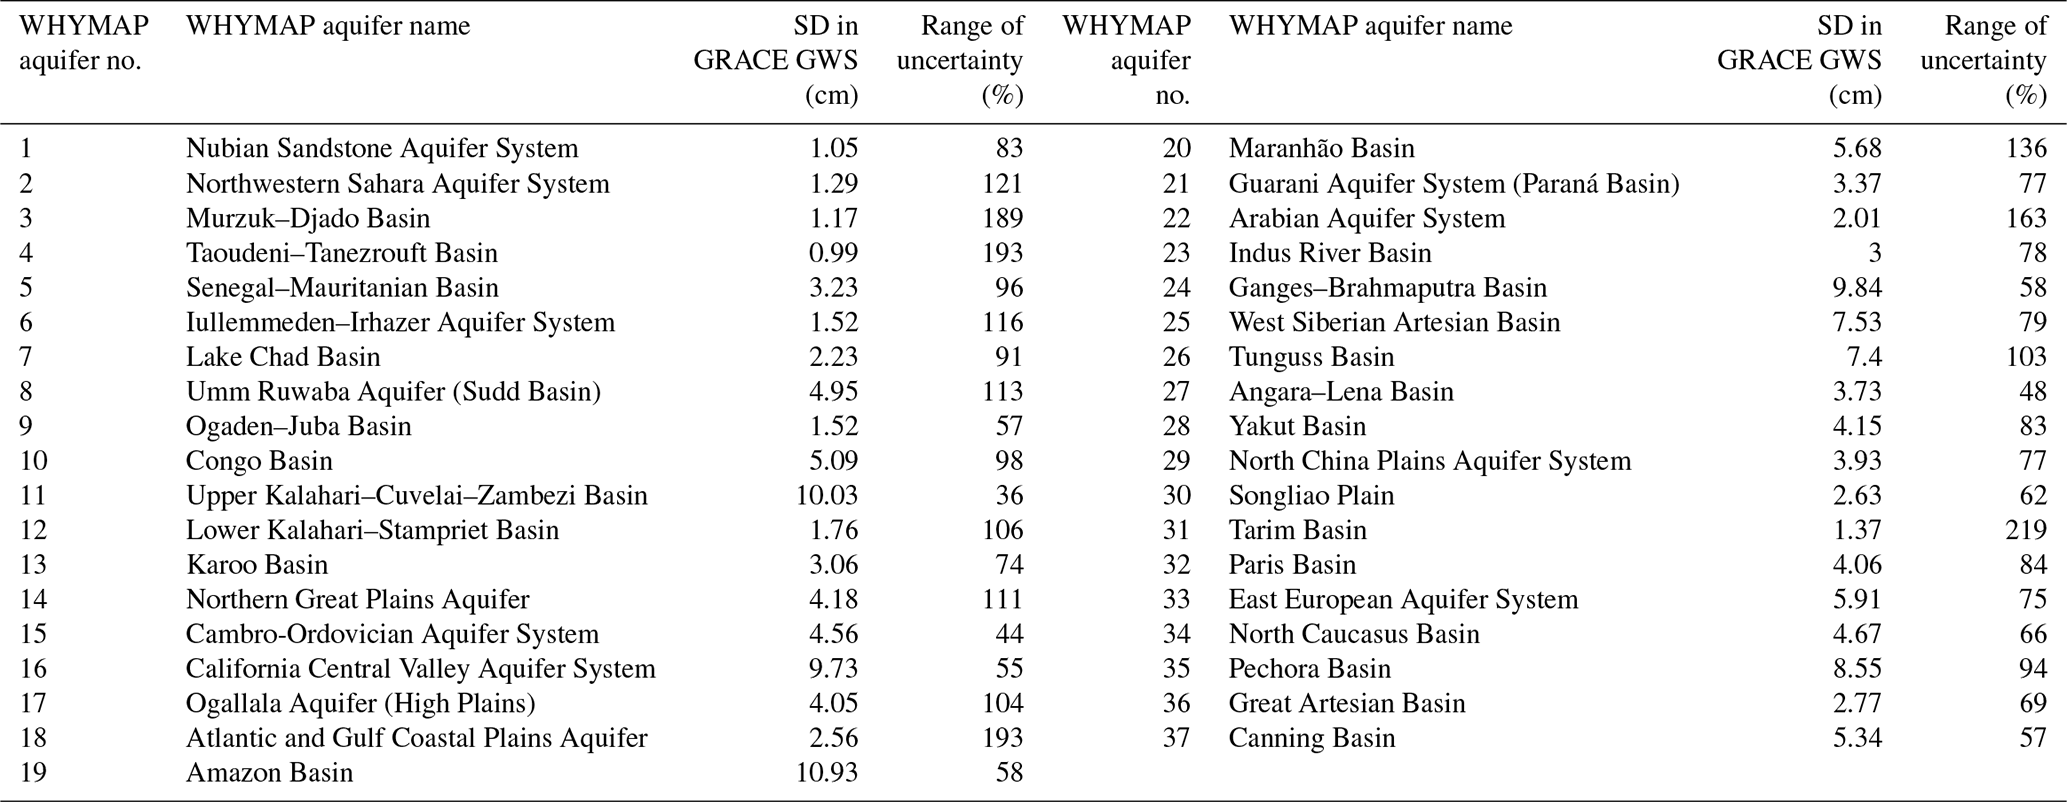
We compute the range of uncertainty in GRACE-derived ΔGWS associated with 20 potential realisations from applied GRACE (CSR, JPL Mascons, GRGS) products and LSMs (CLM, Noah, VIC, Mosaic). Uncertainty is generally higher for aquifer systems located in arid to hyper-arid environments (Table 2, see Fig. S79). Computation of GRACE-derived ΔGWS relies upon uncalibrated simulations of individual terrestrial water stores (i.e. ΔSWS, ΔSWS, ΔSNS) from LSMs to estimate ΔGWS from GRACE ΔTWS. A recent global-scale comparison of ΔTWS estimated by GLDAS LSMs and GRACE (Scanlon et al., 2018) indicates that LSMs systematically underestimate water storage changes. Further, the absence of river routing and representation of lakes and reservoirs in the estimation of ΔSWS by LSMs constrains the computation of GRACE ΔGWS as similarly recognised by Scanlon et al. (2019). Finally, substantial variability in ΔSMS among GLDAS models and the limited depth (<3.5 m b.g.l.) to the deepest soil layer over which these LSMs simulate ΔSMS also hamper the estimation of GRACE ΔGWS, especially in drylands where the thickness of unsaturated zones may be an order of magnitude greater (Scanlon et al., 2009).
Table 2Variability (expressed as standard deviation) in GRACE-derived estimates of GWS from 20 realisations (three GRACE TWS values and an ensemble mean of TWS, four LSMs and an ensemble mean of surface water and soil moisture storage, and snow water storage) and their reported range of uncertainty (% deviation from the ensemble mean) in the world's 37 large aquifer systems.
We detect probable errors in GLDAS LSM data from events that produce large deviations in GWS (Fig. 5). These errors occur because GRACE-derived ΔGWS is computed as a residual (Eq. 1); overestimation (or underestimation) of these combined stores produces negative (or positive) values of GRACE-derived ΔGWS when the aggregated value of other terrestrial water stores is strongly positive (or negative) and no lag is assumed (Shamsudduha et al., 2017). Evidence from the limited piezometric data presented here and elsewhere (Panda and Wahr, 2015; Feng et al., 2018) suggests that the dynamics in computed GRACE-derived ΔGWS are nonetheless reasonable, yet the amplitude of ΔGWS from piezometry is scalable due to uncertainty in the applied Sy (Shamsudduha et al., 2012).
Assessments of ΔGWS derived from GRACE are constrained by both their limited time span (2002–2016) and course spatial resolution (>200 000 km2). For example, centennial-scale piezometry in the Ganges–Brahmaputra aquifer system (no. 24) reveals that recent groundwater depletion (i.e. groundwater withdrawals that are unlikely to be replenished within a century as per Bierkens and Wada, 2019) in NW India traced by GRACE (Figs. 5 and S23) (Rodell et al., 2009; Chen et al., 2014) follows more than a century of groundwater accumulation (see Fig. S80) through the leakage of surface water via a canal network constructed primarily during the 19th century (MacDonald et al., 2016). Long-term piezometric records from central Tanzania and the Limpopo Basin of southern Africa (Fig. S81) show dramatic increases in ΔGWS associated with extreme seasonal rainfall events that occurred prior to 2002 and thus provide a vital context to the more recent period of ΔGWS estimated by GRACE. At regional scales, GRACE-derived ΔGWS can differ substantially from more localised, in situ observations of ΔGWS from piezometry. In the Karoo Basin (aquifer no. 13), GRACE-derived ΔGWS is also rising (Figs. 5 and S13) over periods during which groundwater depletion has been reported in parts of the basin (Rosewarne et al., 2013). In the Guarani Aquifer System (21), groundwater depletion is reported for 2005 to 2009 in Ribeirão Preto near São Paulo as a result of intensive groundwater withdrawals for urban water supplies and the irrigation of sugarcane (Foster et al., 2009), yet GRACE-derived ΔGWS over this same period is rising.
4.2 Variability in GRACE ΔGWS and role of extreme precipitation
Non-linear trends in GRACE-derived ΔGWS arise, in part, from inter-annual variability in precipitation which has similarly been observed in analyses of GRACE ΔTWS (Humphrey et al., 2016; Sun et al., 2017; Bonsor et al., 2018). Annual precipitation in the Great Artesian Basin (aquifer no. 36) provides a dramatic example of how years (2009–2010 and 2010–2011 from both CRU and GPCC datasets) of extreme precipitation can generate anomalously high groundwater recharge that arrests a multi-annual declining trend (Fig. 5), increasing variability in GRACE-derived ΔGWS over the relatively short period (15 years) of GRACE data. The disproportionate contribution of episodic, extreme rainfall to groundwater recharge has previously been shown by Taylor et al. (2013b) from long-term piezometry in semi-arid central Tanzania where nearly 20 % of the recharge observed over a 55-year period resulted from a single season of extreme rainfall, associated with the strongest El Niño event (1997–1998) of the last century (Fig. S81a). Further analysis from multi-decadal piezometric records in drylands across tropical Africa (Cuthbert et al., 2019) confirms this bias in response to intensive precipitation.
The dependence of groundwater replenishment on extreme annual precipitation indicated by GRACE-derived ΔGWS for many of the world's large aquifer systems is consistent with evidence from other sources. In a pan-tropical comparison of stable-isotope ratios of oxygen (18O:16O) and hydrogen (2H:1H) in rainfall and groundwater, Jasechko and Taylor (2015) show that recharge is biased to intensive monthly rainfall, commonly exceeding the 70th percentile. In humid Uganda, Owor et al. (2009) demonstrate that groundwater recharge observed from piezometry is more strongly correlated with daily rainfall exceeding a threshold (10 mm) than all daily rainfall. Periodicity in groundwater storage indicated by both GRACE and in situ data has been associated with large-scale synoptic controls on precipitation (e.g. El Niño–Southern Oscillation, Pacific Decadal Oscillation) in southern Africa (Kolusu et al., 2019) and has been shown to amplify recharge in major US aquifers (Kuss and Gurdak, 2014) and groundwater depletion in India (Mishra et al., 2016).
In some large-scale aquifer systems, GRACE-derived ΔGWS exhibits comparatively weak correlations with precipitation. In the semi-arid Iullemmeden–Irhazer Aquifer (6) variance in rainfall over the period of GRACE observations following the multi-decadal Sahelian drought is low (Table S1), and the net rise in GRACE-derived ΔGWS is associated with changes in the terrestrial water balance resulting from land cover change (Ibrahim et al., 2014). In the Amazon (16), rising trends in GRACE-derived ΔGWS, which are aligned with ΔTWS reported previously by Scanlon et al. (2018) and Rodell et al. (2018), occur during a period (2010–2016; see Table S18) that is the driest since the 1980s (Chaudhari et al., 2019); analyses over the longer term (1980–2015) nevertheless point to an overall intensification of the Amazonian hydrological cycle.
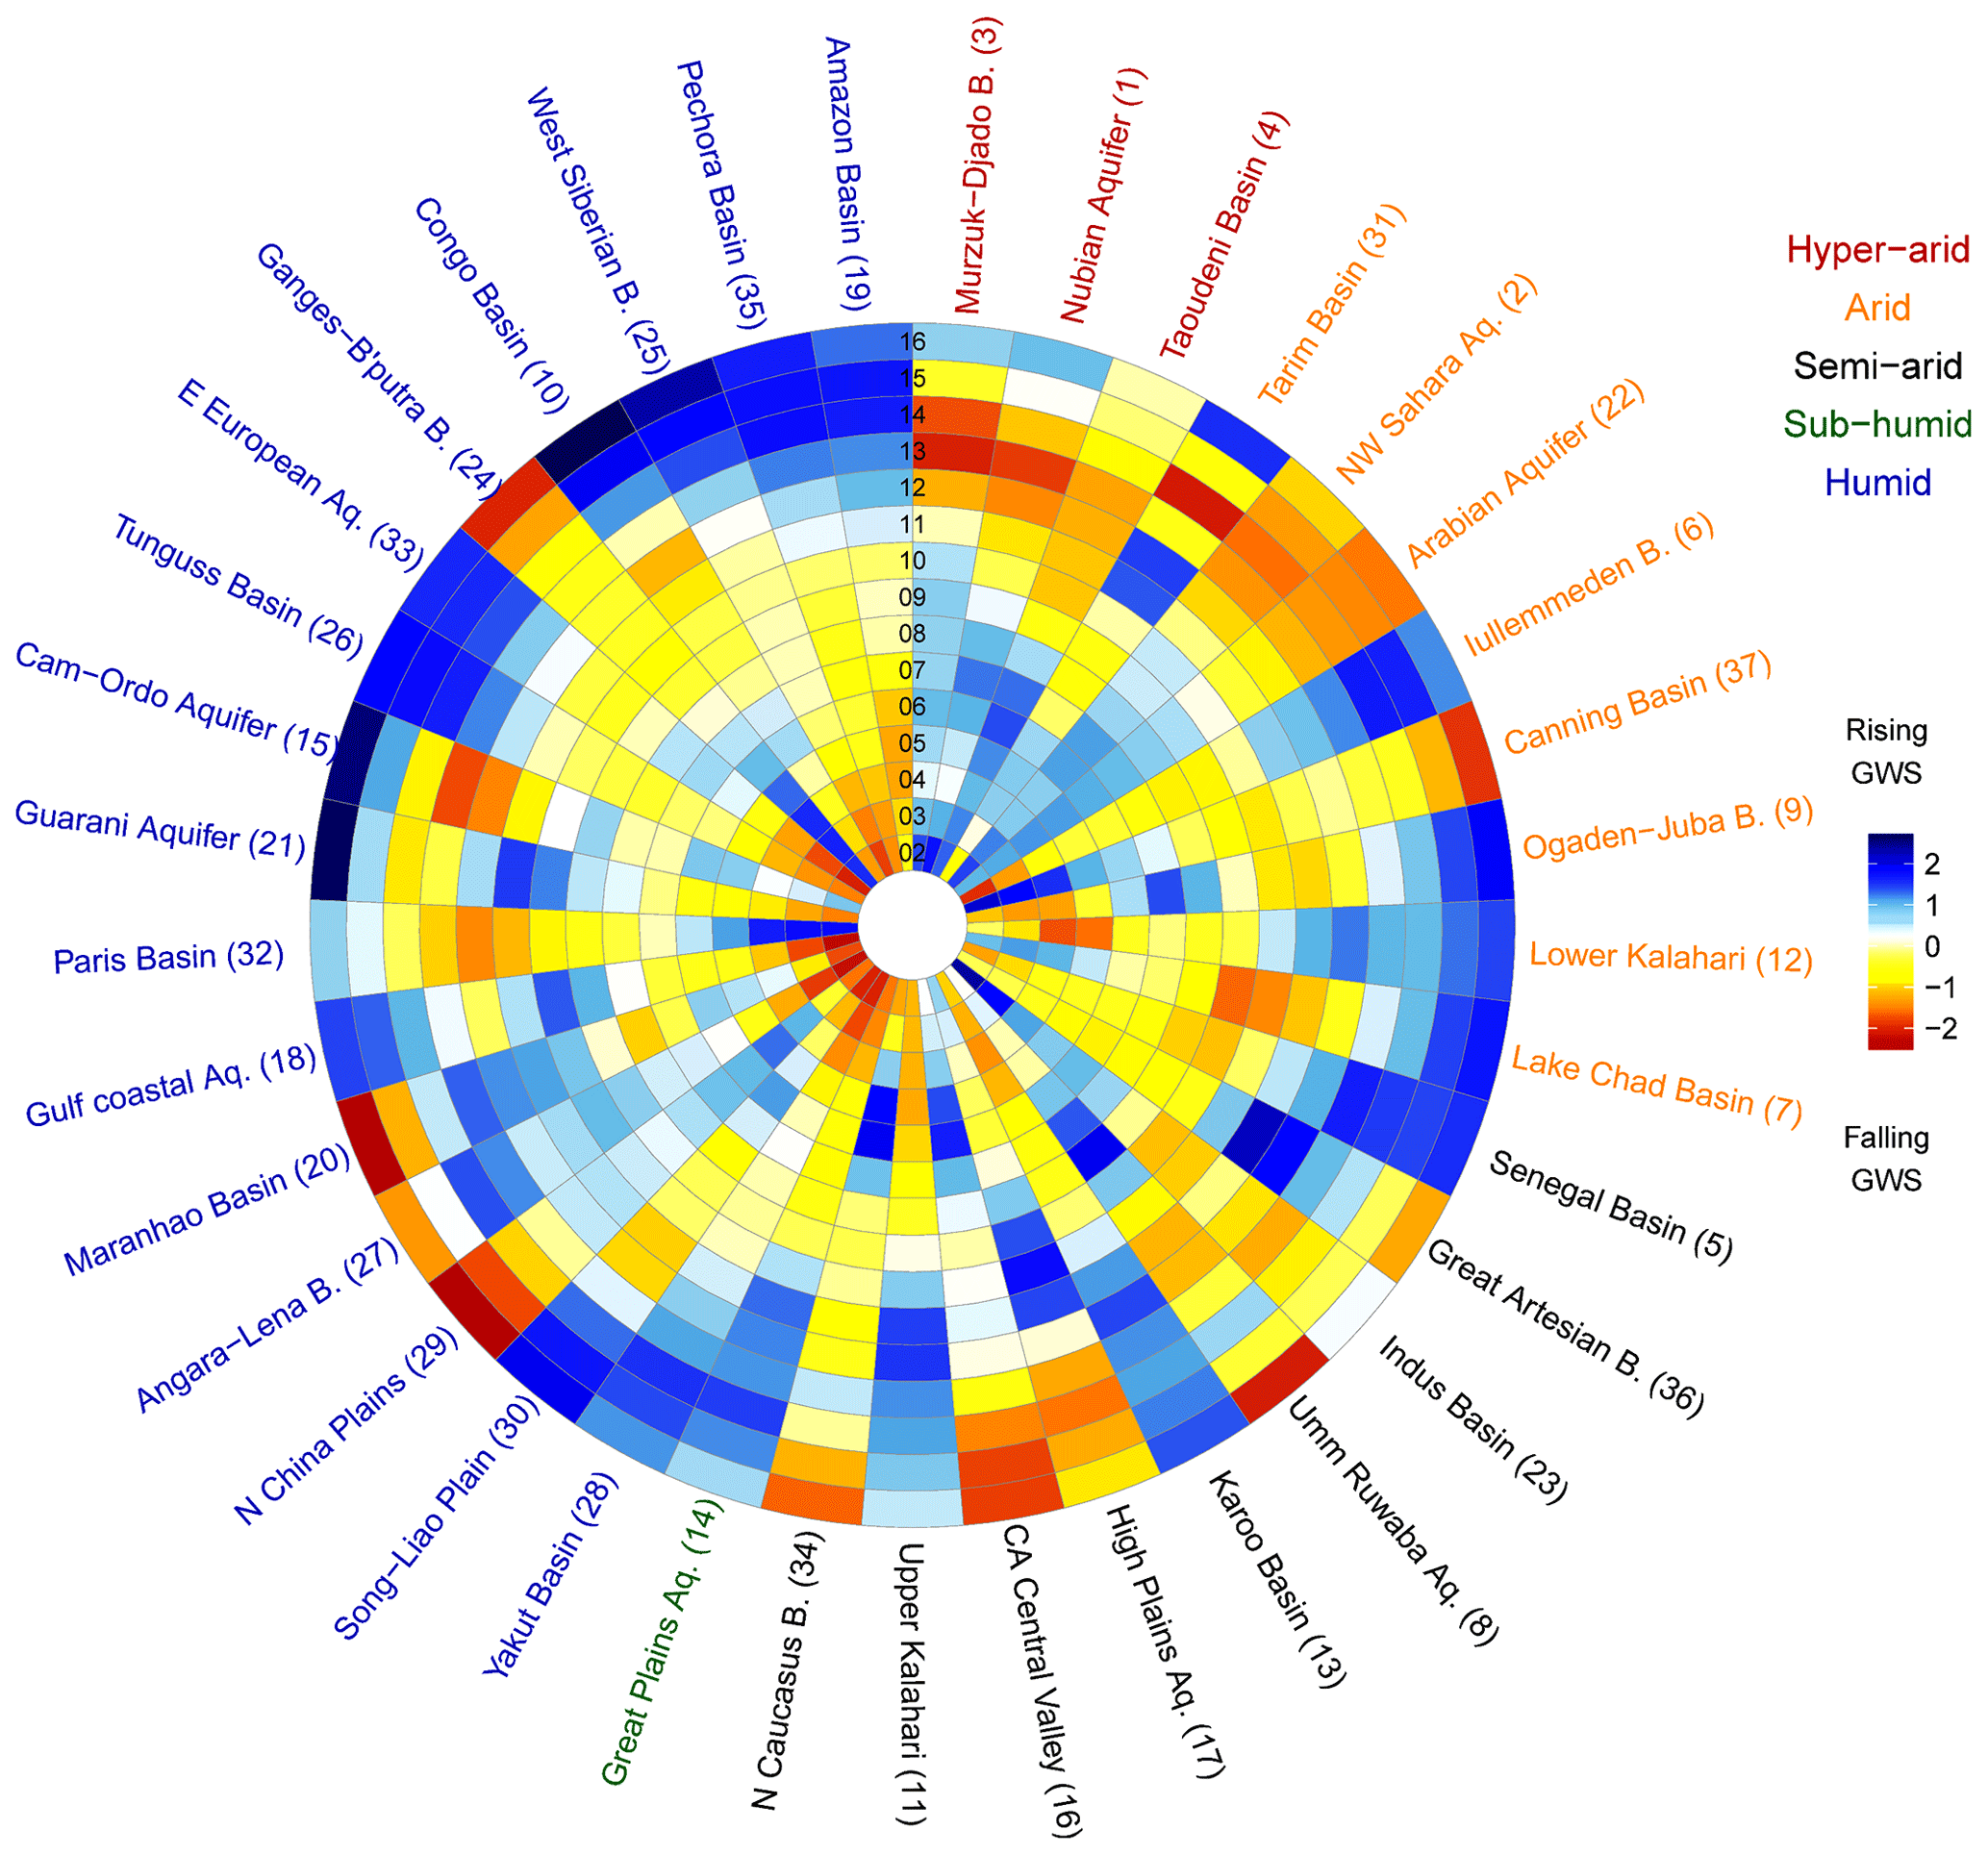
Figure 8Standardised monthly anomaly of non-linear trends of ensemble mean GRACE ΔGWS for the 37 large aquifer systems from 2002 to 2016. Colours yellow to red indicate progressively declining short-term trends, whereas colours cyan to navy blue indicate rising trends. Aquifers are arranged clockwise according to the mean aridity index starting from the hyper-arid climate on top of the circular diagram to progressively humid. Legend colours indicate the climate of each aquifer based on the mean aridity index; time in years (2002 to 2016) is shown from the centre of the circle outwards to the periphery.
4.3 Trends in GRACE ΔGWS under global change
Our analysis identifies non-linear trends in GRACE-derived ΔGWS for the vast majority (32 of 37) of the world's large aquifer systems (Figs. 1, 5, and 8). Non-linearity reflects, in part, the variable nature of groundwater replenishment observed at the scale of the GRACE footprint that is consistent with more localised emerging evidence from multi-decadal piezometric records (Taylor et al., 2013b) (Fig. S81a). The variable and often episodic nature of groundwater replenishment complicates assessments of the sustainability of groundwater withdrawals and highlights the importance of long-term observations over decadal timescales in undertaking such evaluations. Dramatic rises in freshwater withdrawals, primarily associated with the expansion of irrigated agriculture in semi-arid environments, have nevertheless led to groundwater depletion, as computed globally from hydrological models (e.g. Wada et al., 2010; de Graaf et al., 2017) and volumetric-based calculations (Konikow, 2011). Further, groundwater depletion globally has been shown to contribute to sea level rise (e.g. Wada et al., 2016). However, as recognised in a comprehensive review by Bierkens and Wada (2019), groundwater depletion is often localised, occurring below the footprint (200 000 km2) of GRACE as has been well demonstrated by detailed modelling studies in the California Central Valley (Scanlon et al., 2012a) and North China Plain (Cao et al., 2013).
Projections of the sustainability of groundwater withdrawals under global change are complicated, in part, by uncertainty in how radiative forcing will affect large-scale regional controls on extreme annual precipitation like the El Niño–Southern Oscillation (Latif and Keenlyside, 2009). Globally, Reager et al. (2016) show a trend towards enhanced precipitation on land under climate change. Given this trend and the observed intensification of precipitation on land from global warming (Allan et al., 2010; Westra et al., 2013; Zhang et al., 2013; Myhre et al., 2019), groundwater recharge to many large-scale aquifer systems may increase under climate change as revealed by the statistical relationships found in this study between ΔGWS and extreme annual precipitation. The magnitude of this increase is, however, unlikely to offset the impact of human withdrawals in areas of intensive abstraction for irrigated agriculture as shown in NW India by Xie et al. (2020). The developed set of GRACE-derived ΔGWS time series data for the world's large aquifer systems provided here offers a consistent, additional benchmark alongside long-term piezometry to assess not only large-scale climate controls on groundwater replenishment but also opportunities to enhance groundwater storage through managed aquifer recharge.
Changes in groundwater storage (ΔGWS) computed from GRACE satellite data continue to rely upon uncertain, uncalibrated estimates of changes in other terrestrial stores of water found in soil, surface water, and snow–ice from global-scale models. The application here of ensemble mean values of three GRACE ΔTWS processing strategies (CSR, JPL Mascons, GRGS) and five land surface models (GLDAS 1: CLM, Noah, VIC, Mosaic; GLDAS 2: Noah) is designed to reduce the impact of uncertainty in an individual model or GRACE product on the computation of GRACE-derived ΔGWS. We nevertheless identify a few instances in which erroneously high or low values of GRACE-derived ΔGWS are computed; these occur primarily in arid and semi-arid environments where uncertainty in the simulation of terrestrial water balances is greatest. Over the period of GRACE observations (2002 to 2016), we show favourable comparisons between GRACE-derived ΔGWS and piezometric observations (r=0.62 to 0.86) in two contrasting basins (i.e. semi-arid Limpopo Basin, tropical humid Bengal Basin) for which in situ data are available. This study thus contributes to a growing body of research and observations reconciling computed GRACE-derived ΔGWS and ground-based data.
GRACE-derived ΔGWS from 2002 to 2016 for the world's 37 large-scale aquifer systems shows substantial variability as explicitly revealed by 20 potential realisations from GRACE products and LSMs computed here; trends in ensemble mean GRACE-derived ΔGWS are overwhelmingly (87 %) non-linear. Linear trends adequately explain variability in GRACE-derived ΔGWS in just five aquifer systems for which linear declining trends, indicative of groundwater depletion, are observed in two aquifer systems (Arabian, Canning); overall trends for three intensively developed, large-scale aquifer systems (California Central Valley, Ganges–Brahmaputra, North China Plain) are declining but non-linear. This non-linearity in GRACE-derived ΔGWS for the vast majority of the world's large aquifer systems is inconsistent with previous analyses at the scale of the GRACE footprint (∼200 000 km2), asserting global-scale groundwater depletion. Groundwater depletion, more commonly observed by piezometry, is experienced at scales well below the GRACE footprint and is likely to be more pervasive than suggested by the presented analysis of large-scale aquifers. Non-linearity in GRACE-derived ΔGWS arises, in part, from episodic recharge associated with extreme (> 90th percentile) annual precipitation. This episodic replenishment of groundwater, combined with natural discharges that sustain ecosystem functions and human withdrawals, produces highly dynamic aquifer systems that complicate assessments of the sustainability of groundwater withdrawals from large aquifer systems. These findings highlight, however, potential opportunities for sustaining groundwater withdrawals through induced recharge from extreme precipitation and managed aquifer recharge.
Time series data for a monthly anomaly (August 2002 to July 2016) from an ensemble mean of three GRACE products, GLDAS land surface models, and monthly precipitation data from CRU for the 37 world's large aquifer systems can be accessed at the UK's National Geoscience Data Centre (NGDC) at https://doi.org/10.5285/0387fd53-9fed-468e-bda9-0bde8f5fda13 (Shamsudduha and Taylor, 2019).
Supplementary information is available for this paper as a single PDF file. The supplement related to this article is available online at: https://doi.org/10.5194/esd-11-755-2020-supplement.
MS and RGT co-developed the study. MS processed and analysed datasets; both MS and RGT discussed and interpreted results. RGT drafted the paper, and both authors made comments and edited to finalise the paper.
The authors declare that they have no conflict of interest.
Mohammad Shamsudduha and Richard G. Taylor acknowledge support from NERC-ESRC-DFID UPGro GroFutures (http://grofutures.org/, last access: 5 August 2020). Richard G. Taylor also acknowledges the support of a Royal Society Leverhulme Trust Senior Fellowship. This study acknowledges the World-wide Hydrogeological Mapping and Assessment Programme (WHYMAP) of the German Federal Institute for Geosciences and Natural Resources (BGR) and UNESCO for world’s large aquifer system Geographic Information System (GIS) database. Gridded CSR and JPL Mascons GRACE data from NASA’s GRCTellus repository and GRGS GRACE data from the French National Centre for Space Studies (CNES) are acknowledged. NASA’s Goddard Earth Sciences Data and Information Services Centre (GES DISC) is duly acknowledged for GLDAS (version 1 and 2) land surface model data. This study also acknowledges the University of East Anglia (UK) for CRU and the National Center for Atmospheric Research (USA) for GPCC precipitation data. Finally, support from the Bangladesh Water Development Board (BWDB) and the Department of Water and Sanitation (South Africa) for groundwater-level data, as well as CGIAR for the Global Aridity Index data, is duly acknowledged.
This research has been supported by the UK NERC-ESRC-DFID (grant no. NE/M008932/1 (UPGro GroFutures)) and the UK Royal Society (grant no. LT170004 (Leverhulme Trust Senior Fellowship)).
This paper was edited by Richard Betts and reviewed by Marc Bierkens and Soumendra Bhanja.
Allan, R. P., Soden, B. J., John, V. O., Ingram, W., and Good, P.: Current changes in tropical precipitation, Environ. Res. Lett., 5, 025205, https://doi.org/10.1088/1748-9326/5/2/025205, 2010.
Asoka, A., Gleeson, T., Wada, Y., and Mishra, V.: Relative contribution of monsoon precipitation and pumping to changes in groundwater storage in India, Nat. Geosci., 10, 109–117, 2017.
Bhanja, S. N., Mukherjee, A., Saha, D., Velicogna, I., and Famiglietti, J. S.: Validation of GRACE based groundwater storage anomaly using in-situ groundwater level measurements in India, J. Hydrol., 543, 729–738, 2016.
Biancale, R., Lemoine, J.-M., Balmino, G., Loyer, S., Bruisma, S., Perosanz, F., Marty, J.-C., and Gégout, P.: 3 Years of Geoid Variations from GRACE and LAGEOS Data at 10-day Intervals from July 2002 to March 2005, CNES/GRGS, 2006.
Bierkens, M. F. P. and Wada, Y.: Non-renewable groundwater use and groundwater depletion: a review, Environ. Res. Lett., 14, 063002, https://doi.org/10.1088/1748-9326/ab1a5f, 2019.
Bonsor, H. C., Shamsudduha, M., Marchant, B. P., MacDonald, A. M., and Taylor, R. G.: Seasonal and Decadal Groundwater Changes in African Sedimentary Aquifers Estimated Using GRACE Products and LSMs, Remote Sens., 10, 904, https://doi.org/10.3390/rs10060904, 2018.
Cao, G., Zheng, C., Scanlon, B. R., Liu, J., and Li, W.: Use of flow modeling to assess sustainability of groundwaterresources in the North China Plain, Water Resour. Res., 49, 159–175, https://doi.org/10.1029/2012WR011899, 2013.
Castellazzi, P., Martel, R., Rivera, A., Huang, J., Pavlic, G., Calderhead, A. I., Chaussard, E., Garfias, J., and Salas, J.: Groundwater depletion in Central Mexico: Use of GRACE and InSAR to support water resources management, Water Resour. Res., 52, 5985–6003, https://doi.org/10.1002/2015WR018211, 2016.
Chatfield, C.: The analysis of time series – an introduction, 6th ed., Chapman and Hall, CRC Press, Boca Raton, 2003.
Chaudhari, S., Pokhrel, Y., Moran, E., and Miguez-Macho, G.: Multi-decadal hydrologic change and variability in the Amazon River basin: understanding terrestrial water storage variations and drought characteristics, Hydrol. Earth Syst. Sci., 23, 2841–2862, https://doi.org/10.5194/hess-23-2841-2019, 2019.
Chen, J., Li, J., Zhang, Z., and Ni, S.: Long-term groundwater variations in Northwest India from satellite gravity measurements, Global Planet. Change, 116, 130–138, 2014.
Cleveland, R. B., Cleveland, W. S., McRae, J. E., and Terpenning, I.: STL: A Seasonal Trend Decomposition Procedure Based on LOESS, J. Off. Stat., 6, 3–33, 1990.
Cuthbert, M. O., Taylor, R. G., Favreau, G., Todd, M. C., Shamsudduha, M., Villholth, K. G., MacDonald, A. M., Scanlon, B. R., Kotchoni, D. O. V., Vouillamoz, J.-M., Lawson, F. M. A., Adjomayi, P. A., Kashaigili, J., Seddon, D., Sorensen, J. P. R., Ebrahim, G. Y., Owor, M., Nyenje, P. M., Nazoumou, Y., Goni, I., Ousmane, B. I., Sibanda, T., Ascott, M. J., Macdonald, D. M. J., Agyekum, W., Koussoubé, Y., Wanke, H., Kim, H., Wada, Y., Lo, M.-H., Oki, T., and Kukuric, N.: Observed controls on resilience of groundwater to climate variability in sub-Saharan Africa, Nature, 572, 230–234, https://doi.org/10.1038/s41586-019-1441-7, 2019.
Dai, Y., Zeng, X., Dickinson, R. E., Baker, I., Bonan, G. B., Bosilovich, M. G., Denning, A. S., Dirmeyer, P. A., Houser, P. R., Niu, G., Oleson, K. W., Schlosser, C. A., and Yang, Z.-L.: The common land model (CLM), B. Am. Meteorol. Soc., 84, 1013–1023, 2003.
de Graaf, I. E. M., van Beek, L. P. H., Gleeson, T., Moosdorf, N., Schmitz, O., Sutanudjaja, E. H., and Bierkens, M. F. P.: A global-scale two layer transient groundwater model: development and application to groundwater depletion, Adv. Water Resour., 102, 53–67, 2017.
Döll, P., Hoffmann-Dobrev, H., Portmann, F. T., Siebert, S., Eicker, A., Rodell, M., Strassberg, G., and Scanlon, B. R.: Impact of water withdrawals from groundwater and surface water on continental water storage variations, J. Geodyn., 59–60, 143–156, 2012.
Döll, P., Schmied, H. M., Schuh, C., Portmann, F. T., and Eicker, A.: Global-scale assessment of groundwater depletion and related groundwater abstractions: Combining hydrological modeling with information from well observations and GRACE satellites, Water Resour. Res., 50, 5698–5720, https://doi.org/10.1002/2014WR015595, 2014.
Ek, M. B., Mitchell, K. E., Lin, Y., Rogers, E., Grunmann, P., Koren, V., Gayno, G., and Tarpley, J. D.: Implementation of Noah land surface model advances in the National Centers for Environmental Prediction operational mesoscale Eta model, J. Geophys. Res., 108, 8851, https://doi.org/10.1029/2002JD003296, 2003.
Famiglietti, J. S., Lo, M., Ho, S. L., Bethune, J., Anderson, K. J., Syed, T. H., Swenson, S. C., Linage, C. R. d., and Rodell, M.: Satellites measure recent rates of groundwater depletion in California's Central Valley, Geophys. Res. Lett., 38, L03403, https://doi.org/10.1029/2010GL046442, 2011.
Famiglietti, J. S. and Rodell, M.: Water in the Balance, Science, 340, 1300–1301, https://doi.org/10.1126/science.1236460, 2013.
Famiglietti, J. S.: The global groundwater crisis, Nat. Clim. Change, 4, 945–948, https://doi.org/10.1038/nclimate2425, 2014.
Feng, W., Shum, C. K., Zhong, M., and Pan, Y.: Groundwater Storage Changes in China from Satellite Gravity: An Overview, Remote Sens., 10, p. 674, https://doi.org/10.3390/rs10050674, 2018.
Foster, S., Hirata, R., Vidal, A., Schmidt, G., and Garduño, H.: The Guarani Aquifer Initiative – Towards Realistic Groundwater Management in a Transboundary Context, The World Bank, https://www.worldbank.org/en/topic/water (last access: 5 August 2020), Washington, D.C., 28, 2009.
Getirana, A., Kumar, S., Girotto, M., and Rodell, M.: Rivers and Floodplains as Key Components of Global Terrestrial Water Storage Variability, Geophys. Res. Lett., 44, 10359–10368, 2017.
Hanasaki, N., Yoshikawa, S., Pokhrel, Y., and Kanae, S.: A global hydrological simulation to specify the sources of water used by humans, Hydrol. Earth Syst. Sci., 22, 789–817, https://doi.org/10.5194/hess-22-789-2018, 2018.
Harris, I., Jones, P. D., Osborn, T. J., and Lister, D. H.: Updated high-resolution grids of monthly climatic observations - the CRU TS3.10 Dataset, Int. J. of Clim., 34, 623–642, 2014.
Hassan, A. A. and Jin, S.: Lake level change and total water discharge in East Africa Rift Valley from satellite-based observations, Global Planet Change, 117, 79–90, https://doi.org/10.1016/j.gloplacha.2014.03.005, 2014.
Humphrey, V., Gudmundsson, L., and Seneviratne, S. I.: Assessing Global Water Storage Variability from GRACE: Trends, Seasonal Cycle, Subseasonal Anomalies and Extremes, Surv. Geophys., 37, 357–395, https://doi.org/10.1007/s10712-016-9367-1, 2016.
Ibrahim, M., Favreau, G., Scanlon, B. R., Seidel, J. L., Coz, M. L., Demarty, J., and Cappelaere, B.: Long-term increase in diffuse groundwater recharge following expansion of rainfed cultivation in the Sahel, West Africa, Hydrogeol. J., 22, 1293–1305, 2014.
Jacoby, W. G.: Loess::a nonparametric, graphical tool for depicting relationships between variables, Elect. Stud., 19, 577–613, 2000.
Jasechko, S. and Taylor, R. G.: Intensive rainfall recharges tropical groundwaters, Environ. Res. Lett., 10, 124015, https://doi.org/10.1088/1748-9326/10/12/124015, 2015.
Kim, H., Yeh, P. J.-F., Oki, T., and Kanae, S.: Role of rivers in the seasonal variations of terrestrial water storage over global basins, Geophys. Res. Lett., 36, L17402, https://doi.org/10.1029/2009GL039006, 2009.
Kolusu, S. R., Shamsudduha, M., Todd, M. C., Taylor, R. G., Seddon, D., Kashaigili, J. J., Ebrahim, G. Y., Cuthbert, M. O., Sorensen, J. P. R., Villholth, K. G., MacDonald, A. M., and MacLeod, D. A.: The El Niño event of 2015–2016: climate anomalies and their impact on groundwater resources in East and Southern Africa, Hydrol. Earth Syst. Sci., 23, 1751–1762, https://doi.org/10.5194/hess-23-1751-2019, 2019.
Konikow, L. F.: Contribution of global groundwater depletion since 1900 to sea-level rise, Geophys. Res. Lett., 38, L17401, https://doi.org/10.1029/2011GL048604, 2011.
Koster, R. D. and Suarez, M. J.: Modeling the land surface boundary in climate models as a composite of independent vegetation stands, J. Geophys. Res., 97, 2697–2715, 1992.
Kumar, S. V., Peters-Lidard, C. D., Tian, Y., Houser, P. R., Geiger, J., Olden, S., Lighty, L., Eastman, J. L., Doty, B., Dirmeyer, P., Adams, J., Mitchell, K., Wood, E. F., and Sheffield, J.: Land information system: An interoperable framework for high resolution land surface modeling, Environ. Modell. Softw., 21, 1402–1415, 2006.
Kuss, A. J. M. and Gurdak, J. J.: Groundwater level response in U.S. principal aquifers to ENSO, NAO, PDO, and AMO, J. Hydrol., 519 (Part B), 1939–1952, 2014.
Landerer, F. W. and Swenson, S. C.: Accuracy of scaled GRACE terrestrial water storage estimates, Water Resour. Res., 48, W04531, https://doi.org/10.1029/2011WR011453, 2012.
Latif, M. and Keenlyside, N. S.: El Niño/Southern Oscillation response to global warming, P. Natl. Acad. Sci. USA, 106, 20578–20583, https://doi.org/10.1073/pnas.0710860105, 2009.
Liang, X., Xie, Z., and Huang, M.: A new parameterization for surface and groundwater interactions and its impact on water budgets with the variable infiltration capacity (VIC) land surface model, J. Geophys. Res., 108, 8613, https://doi.org/10.1029/2002JD003090, 2003.
Longuevergne, L., Wilson, C. R., Scanlon, B. R., and Crétaux, J. F.: GRACE water storage estimates for the Middle East and other regions with significant reservoir and lake storage, Hydrol. Earth Syst. Sci., 17, 4817–4830, https://doi.org/10.5194/hess-17-4817-2013, 2013.
MacDonald, A. M., Bonsor, H. C., Ahmed, K. M., Burgess, W. G., Basharat, M., Calow, R. C., Dixit, A., Foster, S. S. D., Gopal, K., Lapworth, D. J., Lark, R. M., Moench, M., Mukherjee, A., Rao, M. S., Shamsudduha, M., Smith, L., Taylor, R. G., Tucker, J., van Steenbergen, F., and Yadav, S. K.: Groundwater quality and depletion in the Indo-Gangetic Basin mapped from in situ observations, Nat. Geosci., 9, 762–766, 2016.
Mishra, V., Aadhar, S., Asoka, A., S. Pai, and Kumar, R.: On the frequency of the 2015 monsoon season drought in the Indo-Gangetic Plain, Geophys. Res. Lett., 43, 12102–12112, https://doi.org/10.1002/2016GL071407, 2016.
Myhre, G., Alterskjær, K., Stjern, C. W., Hodnebrog, Ø., Marelle, L., Samset, B. H., Sillmann, J., Schaller, N., Fischer, E., Schulz, M., and Stohl, A.: Frequency of extreme precipitation increases extensively with event rareness under global warming, Sci. Rep.-UK, 9, 16063, https://doi.org/10.1038/s41598-019-52277-4, 2019.
Owor, M., Taylor, R. G., Tindimugaya, C., and Mwesigwa, D.: Rainfall intensity and groundwater recharge: empirical evidence from the Upper Nile Basin, Environ. Res. Lett., 4, https://doi.org/10.1088/1748-9326/4/3/035009, 2009.
Panda, D. K. and Wahr, J.: Spatiotemporal evolution of water storage changes in India from the updated GRACE-derived gravity records, Water Resour. Res., 51, 135–149, https://doi.org/10.1002/2015WR017797, 2015.
R Core Team: R – A language and environment for statistical computing (R version 3.4.3), R Foundation for Statistical Computing, http://www.R-project.org/ (last access: 5 August 2020), Vienna, Austria, 2017.
Reager, J. T., Gardner, A. S., Famiglietti, J. S., Wiese, D. N., Eicker, A., and Lo, M.-H.: A decade of sea level rise slowed by climate-driven hydrology, Science, 351, 699–703, 2016.
Richey, A. S., Thomas, B. F., Lo, M.-H., Reager, J. T., Famiglietti, J. S., Voss, K., Swenson, S., and Rodell, M.: Quantifying renewable groundwater stress with GRACE, Water Resour. Res., 51, 5217–5238, https://doi.org/10.1002/2015WR017349, 2015.
Richts, A., Struckmeier, W. F., and Zaepke, M.: WHYMAP and the Groundwater Resources of the World 1:25,000,000, in: Sustaining Groundwater Resources. International Year of Planet Earth, edited by: J., J., Springer, Dordrecht, 159–173, 2011.
Rodell, M., Houser, P. R., Jambor, U., Gottschalck, J., Mitchell, K., Meng, C.-J., Arsenault, K., Cosgrove, B., Radakovich, J., Bosilovich, M., Entin, J. K., Walker, J. P., Lohmann, D., and Toll, D.: The Global Land Data Assimilation System, B. Am. Meteorol. Soc., 85, 381–394, 2004.
Rodell, M., Chen, J., Kato, H., Famiglietti, J. S., Nigro, J., and Wilson, C. R.: Estimating ground water storage changes in the Mississippi River basin (USA) using GRACE, Hydrogeol. J., 15, 159–166, https://doi.org/10.1007/s10040-006-0103-7, 2007.
Rodell, M., Velicogna, I., and Famiglietti, J. S.: Satellite-based estimates of groundwater depletion in India, Nature, 460, 999–1003, https://doi.org/10.1038/nature08238, 2009.
Rodell, M., Famiglietti, J. S., Wiese, D. N., Reager, J. T., Beaudoing, H. K., Landerer, F. W., and Lo, M. H.: Emerging trends in global freshwater availability, Nature, 557, 651–659, https://doi.org/10.1038/s41586-018-0123-1, 2018.
Rosewarne, P. N., Woodford, A. C., O'Brien, R., Tonder, G. V., Esterhuyse, C., Goes, M., Talma, A. S., Tredoux, G., and Visser, D.: Karoo Groundwater Atlas, Volume 2. Karoo Groundwater Expert Group (KGEG), Ground Water Division, The Geological Society of South Africa, Cape Town, South Africa, 1–35, 2013.
Scanlon, B. R., Stonestrom, D. A., Reedy, R. C., Leaney, F. W., Gates, J., and Cresswell, R. G.: Inventories and mobilization of unsaturated zone sulfate, fluoride, and chloride related to land use change in semiarid regions, southwestern United States and Australia, Water Resour. Res., 45, W00A18, https://doi.org/10.1029/2008WR006963, 2009.
Scanlon, B. R., Faunt, C. C., Longuevergne, L., Reedy, R. C., Alley, W. M., McGuire, V. L., and McMahon, P. B.: Groundwater depletion and sustainability of irrigation in the US High Plains and Central Valley, P. Natl. Acad. Sci. USA, 109, 9320–9325, 2012a.
Scanlon, B. R., Longuevergne, L., and Long, D.: Ground referencing GRACE satellite estimates of groundwater storage changes in the California Central Valley, USA, Water Resour. Res., 48, W04520, https://doi.org/10.1029/2011WR011312, 2012b.
Scanlon, B. R., Zhang, Z., Save, H., Sun, A. Y., Müller Schmied, H., van Beek, L. P. H., Wiese, D. N., Wada, Y., Long, D., Reedy, R. C., Longuevergne, L., Döll, P., and Bierkens, M. F. P.: Global models underestimate large decadal declining and rising water storage trends relative to GRACE satellite data, P. Natl. Acad. Sci. USA, 115, 1080–1089, https://doi.org/10.1073/pnas.1704665115, 2018.
Scanlon, B. R., Zhang, Z., Rateb, A., Sun, A., Wiese, D., Save, H., Beaudoing, H., Lo, M. H., Müller-Schmied, H., Döll, P., van Beek, R., Swenson, S., Lawrence, D., Croteau, M., and Reedy, R. C.: Tracking seasonal fluctuations in land water storage using global models and GRACE satellites, Geophy. Res. Lett., 46, 5254–5264, https://doi.org/10.1029/2018GL081836, 2019.
Schneider, U., Finger, P., Meyer-Christoffer, A., Rustemeier, E., Ziese, M., and Becker, A.: Evaluating the Hydrological Cycle over Land Using the Newly-Corrected Precipitation Climatology from the Global Precipitation Climatology Centre (GPCC), Atmosphere, 8, 52, https://doi.org/10.3390/atmos8030052, 2017.
Shamsudduha, M., Chandler, R. E., Taylor, R. G., and Ahmed, K. M.: Recent trends in groundwater levels in a highly seasonal hydrological system: the Ganges-Brahmaputra-Meghna Delta, Hydrol. Earth Syst. Sci., 13, 2373–2385, https://doi.org/10.5194/hess-13-2373-2009, 2009.
Shamsudduha, M., Taylor, R. G., and Longuevergne, L.: Monitoring groundwater storage changes in the highly seasonal humid tropics: validation of GRACE measurements in the Bengal Basin, Water Resour. Res., 48, W02508, https://doi.org/10.1029/2011WR010993, 2012.
Shamsudduha, M., Taylor, R. G., Jones, D., Longuevergne, L., Owor, M., and Tindimugaya, C.: Recent changes in terrestrial water storage in the Upper Nile Basin: an evaluation of commonly used gridded GRACE products, Hydrol. Earth Syst. Sci., 21, 4533–4549, https://doi.org/10.5194/hess-21-4533-2017, 2017.
Shamsudduha, M. and Taylor, R.: GRACE and GLDAS datasets for world's large aquifer systems, https://doi.org/10.5285/0387fd53-9fed-468e-bda9-0bde8f5fda13, 2019.
Sheffield, J., Goteti, G., and Wood, E. F.: Development of a 50-year high-resolution global dataset of meteorological forcings for land surface modeling, J. Clim., 19, 3088–3111, 2006.
Strassberg, G., Scanlon, B. R., and Chambers, D.: Evaluation of groundwater storage monitoring with the GRACE satellite: Case study of the High Plains aquifer, central United States, Water Resour. Res., 45, W05410, https://doi.org/10.1029/2008WR006892, 2009.
Sun, A. Y., Scanlon, B. R., AghaKouchak, A., and Zhang, Z.: Using GRACE Satellite Gravimetry for Assessing Large-Scale Hydrologic Extremes, Remote Sens., 9, 1287, https://doi.org/10.3390/rs9121287, 2017.
Swenson, S., Yeh, P. J.-F., Wahr, J., and Famiglietti, J. S.: A comparison of terrestrial water storage variations from GRACE with in situ measurements from Illinois, Geophys. Res. Lett., 33, L16401, https://doi.org/10.1029/2006GL026962, 2006.
Swenson, S., Famiglietti, J., Basara, J., and Wahr, J.: Estimating profile soil moisture and groundwater variations using GRACE and Oklahoma Mesonet soil moisture data, Water Resour. Res., 44, W01413, https://doi.org/10.1029/2007WR006057, 2008.
Tapley, B. D., Bettadpur, S., Ries, J. C., Thompson, P. F., and Watkins, M. M.: GRACE measurements of mass variability in the Earth system, Science, 305, 503–505, 2004.
Taylor, R. G., Scanlon, B., Doll, P., Rodell, M., van Beek, R., Wada, Y., Longuevergne, L., Leblanc, M., Famiglietti, J. S., Edmunds, M., Konikow, L., Green, T. R., Chen, J., Taniguchi, M., Bierkens, M. F. P., MacDonald, A., Fan, Y., Maxwell, R. M., Yechieli, Y., Gurdak, J. J., Allen, D. M., Shamsudduha, M., Hiscock, K., Yeh, P. J. F., Holman, I., and Treidel, H.: Ground water and climate change, Nat. Clim. Change, 3, 322–329, https://doi.org/10.1038/nclimate1744, 2013a.
Taylor, R. G., Todd, M. C., Kongola, L., Maurice, L., Nahozya, E., Sanga, H., and MacDonald, A.: Evidence of the dependence of groundwater resources on extreme rainfall in East Africa, Nat. Clim. Change, 3, 374–378, https://doi.org/10.1038/nclimate1731, 2013b.
Thomas, B. F., Caineta, J., and Nanteza, J.: Global assessment of groundwater sustainability based on storage anomalies, Geophys. Res. Lett., 44, 11445–11455, https://doi.org/10.1002/2017GL076005, 2017.
Wada, Y., van Beek, L. P. H., van Kempen, C. M., Reckman, J. W. T. M., Vasak, S., and Bierkens, M. F. P.: Global depletion of groundwater resources, Geophys. Res. Lett., 37, L20402, https://doi.org/10.1029/2010GL044571, 2010.
Wada, Y., Wisser, D., and Bierkens, M. F. P.: Global modeling of withdrawal, allocation and consumptive use of surface water and groundwater resources, Earth Syst. Dynam., 5, 15–40, https://doi.org/10.5194/esd-5-15-2014, 2014.
Wada, Y., Lo, M.-H., Yeh, P. J. F., Reager, J. T., Famiglietti, J. S., Wu, R.-J., and Tseng, Y.-H.: Fate of water pumped from underground and contributions to sea-level rise, Nat. Clim. Change, 6, 777–780, https://doi.org/10.1038/nclimate3001, 2016.
Watkins, M. M., Wiese, D. N., Yuan, D.-N., Boening, C., and Landerer, F. W.: Improved methods for observing Earth's time variable mass distribution with GRACE using spherical cap mascons, J. Geophys. Res.-Sol. Ea., 120, 2648–2671, https://doi.org/10.1002/2014JB011547, 2015.
Westra, S., Alexander, L. V., and Zwiers, F. W.: Global Increasing Trends in Annual Maximum Daily Precipitation, J. Clim., 26, 3904–3918, https://doi.org/10.1175/JCLI-D-12-00502.1, 2013.
WHYMAP and Margat, J.: Groundwater resources of the world: Large Aquifer Systems, BGR, http://ihp-wins.unesco.org/layers/geonode:world_aquifer_systems (last access: 5 August 2020), Hannover and UNESCO, Paris, 2008.
Wiese, D. N., Landerer, F. W., and Watkins, M. M.: Quantifying and reducing leakage errors in the JPL RL05M GRACE mascon solution, Water Resour. Res., 52, 7490–7502, https://doi.org/10.1002/2016WR019344, 2016.
Xie, H., Longuevergne, L., Ringler, C., and Scanlon, B. R.: Integrating groundwater irrigation into hydrological simulation of India: Case of improving model representation of anthropogenic water use impact using GRACE, J. Hydrol.: Regional Studies, 29, 100681, https://doi.org/10.1016/j.ejrh.2020.100681, 2020.
Zhang, X., Wan, H., Zwiers, F. W., Hegerl, G. C., and Min, S.-K.: Attributing intensification of precipitation extremes to human influence, Geophys. Res. Lett., 40, 5252–5257, https://doi.org/10.1002/grl.51010, 2013.