the Creative Commons Attribution 4.0 License.
the Creative Commons Attribution 4.0 License.
 | 18 Feb 2020
Changes in the future summer Mediterranean climate: contribution of teleconnections and local factors
Monika J. Barcikowska
Sarah B. Kapnick
Lakshmi Krishnamurty
Simone Russo
Annalisa Cherchi
Chris K. Folland
This study analyzes future climate for the Mediterranean region projected with the high-resolution coupled CM2.5 model, which incorporates a new and improved land model (LM3). The simulated climate changes suggest pronounced warming and drying over most of the region. However, the changes are distinctly smaller than those of the CMIP5 multi-model ensemble. In addition, the changes over much of southeast and central Europe indicate very modest warming compared to the CMIP5 projections and also a tendency toward wetter conditions. These differences indicate a possible role of factors such as land surface–atmospheric interactions in these regions. Our analysis also highlights the importance of correctly projecting the magnitude of changes in the summer North Atlantic Oscillation, which has the capacity to partly offset anthropogenic warming and drying over the western and central Mediterranean. Nevertheless, the projections suggest a decreasing influence of local atmospheric dynamics and teleconnections in maintaining the regional temperature and precipitation balance, in particular over arid regions like the eastern and southern Mediterranean, which show a local maximum of warming and drying. The intensification of the heat low in these regions rather suggests an increasing influence of warming land surface on the local surface atmospheric circulation and progressing desertification.
- Article
(20269 KB) - Full-text XML
-
Supplement
(6869 KB) - BibTeX
- EndNote


The climate in the Mediterranean region is primarily characterized by mild, wet winters and hot, dry summers. However, the complex geomorphological characteristics, including gulfs, peninsulas, islands, and the mountain ridges surrounding the Mediterranean Sea basin, as well as the influence of the midlatitude and tropical atmospheric circulation patterns translate into a distinctively complex climate.
The influence of the midlatitude circulation on the regional hydroclimate is mostly manifest in the teleconnection with the North Atlantic Oscillation (NAO; e.g., Hurrell, 1995; Krichak et al., 2002; Barcikowska et al., 2018). The summer expression of the NAO (SNAO; Folland et al., 2009; Linderholm et al., 2009; Blade et al., 2012a) in its positive phase yields a stronger meridional sea level pressure (SLP) gradient over the North Atlantic, an enhanced anticyclonic southern lobe with dry conditions over northwest Europe, and rather wet conditions over the central Mediterranean. The SNAO has been linked to the Atlantic Meridional Oscillation (Knight et al., 2006; Folland et al., 2009; Linderholm and Folland, 2017), which originates from both internal ocean variations (Knight et al., 2005, 2006; Delworth and Mann, 2000; Enfield et al., 2001) and anthropogenic sources (Rotstayn and Lohman, 2002; Mann and Emanuel, 2006). However, the current literature has not yet reached a full consensus on the spatial definition (fingerprint), origin, and impacts of the SNAO. The results of observational analysis vary depending on the chosen dataset, period, summer season interval, and the analysis method (Allan and Folland, 2018; Barnston and Livezey, 1987; Hurrell and van Loon, 1997; Hurrell and Folland, 2002; Hurrell et al., 2003; Hurrell and Deser, 2009; Cassou et al., 2005; Folland et al., 2009; Blade et al., 2012a). This sensitivity stems largely from the pronounced interannual to multidecadal variability of the observed SNAO.
In the summer, the northward shift of the Hadley cell reveals a connection between the hot and arid eastern part of the Mediterranean and the Asian and African monsoons, as well as a possible connection between these two monsoons (Rodwell and Hoskins, 1996; Ziv et al., 2004; Fontaine et al., 2011; Raicich et al., 2003; Rowell, 2003). The thermal balance of the central–eastern part of the Mediterranean is largely maintained by the two dynamical factors, i.e., the cool air advection of the low-level northerly winds (i.e., Etesians; HMSO, 1962; Metaxas, 1977; Maheras, 1980; Prezerakos, 1984; Reddaway and Bigg, 1996; Zecchetto and de Biasio, 2007; Chronis et al., 2011) and the adiabatic warming of the mid- and upper-level subsidence winds (Raicich et al., 2003; Mariotti et al., 2002; Tyrlis et al., 2013), which counterbalance each other. Ziv et al. (2004) have shown these two factors to be significantly correlated, pointing to the Asian summer monsoon, which exerts an influence on the Mediterranean surface, middle, and upper troposphere dynamics. The possible mechanism behind this linkage was explored in a framework of the Rossby wave pattern response to the diabatic heating of the monsoon convection, i.e., the monsoon–desert mechanism (Rodwell and Hoskins, 1996; Tyrlis et al., 2013; Rizou et al., 2015; Cherchi et al., 2014, 2016). Additionally, Rodwell and Hoskins (2001) explained changes in Etesian winds as a direct result of changes in the subsidence over the eastern Mediterranean, which via Sverdrup's equation controls the low-level northerly flow.
The geographic location and socioeconomic state of the Mediterranean make the population in this region particularly vulnerable to climate change. The southern part of the Mediterranean, which is dominated by agricultural activities, is especially sensitive to prolonged water shortages and their consequences, such as drought and wildfires. Giorgi (2006) found this region to be particularly responsive to projected climate change and identified it as a climate hot spot. In fact, both CMIP3 (Giorgi and Lionello, 2008; Hanf et al., 2012) and CMIP5 future projections for this region (Diffenbaugh and Giorgi, 2012; Alessandri et al., 2014; Mariotti et al., 2015; Feng et al., 2014) indicate very strong warming and reductions in precipitation during the summer season. These changes can increase the aridity of the region and hence severely impact water and food security.
However, some studies (e.g., Christensen and Boberg, 2012; Mueller and Seneviratne, 2012) indicated that the projected CMIP3 and CMIP5 future warming is spuriously amplified by a strong summertime positive bias in land surface temperature caused by the deficiencies in the simulated atmosphere–land surface feedbacks. Soil moisture–temperature feedbacks were identified as a dominant factor controlling summer temperature variability in the Mediterranean and central Europe in a changing climate (Seneviratne et al., 2006), including the projected and observed amplification of warming hot extremes (Diffenbaugh et al., 2007; Hirschi et al., 2011). Berg et al. (2016) have shown that projected reductions in soil moisture diminish the positive trends in latent heat fluxes over land, which enhances sensible heat fluxes, thereby increasing land surface temperatures and its aridity. Global coupled models like those used in CMIP and in the present study do not include dynamic irrigation, and changes in water management may alter the availability of surface water; in offline modeling they have been shown to have regional cooling effects (Sacks et al., 2009). Hence, simulating future climate changes in the Mediterranean requires a good understanding of land hydrology, land use, and associated land–atmosphere feedbacks.
Cherchi et al. (2016) also found that the projected CMIP5 future severe warming over the eastern Mediterranean cannot be explained with the impact of the South Asian monsoon teleconnection maintained via the monsoon–desert mechanism alone. On the other hand, Blade et al. (2012a, b) argued that the regional warming and drying projected in CMIP3 is caused by the misrepresentation of the summer NAO teleconnection. Kelley et al. (2012) indicated that CMIP5 models show a rather modest improvement in the simulated regional hydroclimate compared to CMIP3. The CMIP5 historical simulations still differ from the observations, for example by showing a strong wetting over the northwestern parts of Europe and drying over the southwestern parts of the Mediterranean (e.g., Kelley et al., 2012), though some earlier lower-resolution models do show strong drying over many, though not all, parts of northwest Europe as well (e.g., Rowell and Jones, 2006). The inconsistencies found between the observations and simulations do not add to the credibility of the current future projections for the Mediterranean and prompt further investigation using higher-resolution models and also an advanced understanding of the land surface–atmosphere feedbacks as well as the regional teleconnections.
In this study we analyze the future summer climate over the Mediterranean projected with the GFDL CM2.5 model (Delworth et al., 2012). It incorporates higher spatial resolution (∼50 km) and an improved land model (LM3) with enhanced hydrology and associated land–atmospheric feedbacks (Milly et al., 2014). This likely improves the simulated hydroclimate and temperature over many continental regions including Europe (Delworth et al., 2012). The analysis aims to interpret the derived future climate changes through the prism of the contributing SNAO teleconnection, as well as the impact of local surface warming and the associated land surface–air interactions.
Section 2 describes the model and experiments used, the dataset for comparison, and the methodology. Section 3 focuses on the summer time-mean climatology of the region and its teleconnections. It evaluates the performance of the model in terms of the simulated regional precipitation and large-scale circulation features, which shape the summer regime of the Mediterranean climate. It also examines the capacity of the model to simulate the SNAO and its impact on the Mediterranean climate. The last part of this section focuses on a representation of the key dynamical features of the eastern Mediterranean climate, i.e., the linkage between the mid- and upper-level subsidence and the low-level northerly flow (and the associated Etesian winds) together with its coupling with the Indian monsoon. Section 4 investigates future climate changes over the Mediterranean derived from the model projections. It examines the regional changes from the perspective of (a) large-scale circulation over the Euro-Atlantic and the influence of the SNAO teleconnection, as well as (b) local land surface warming and its influence on the climate regime of the eastern Mediterranean. Section 5 discusses and summarizes the main results.
2.1 Coupled model and experiments
The coupled model used in this study is the Geophysical Fluid Dynamics Laboratory (GFDL) CM2.5. It has an atmospheric and land surface horizontal grid scale of approximately 50 km with 32 levels in the vertical. The horizontal grid scale of the ocean increases from 28 km in the tropics to 8–11 km at high latitudes. CM2.5 incorporates a new land model (LM3) of land water, energy, and carbon, with an enhanced representation of soil moisture and land–atmospheric feedbacks between soil moisture and precipitation (Milly et al., 2014; Berg et al., 2016). Details of the CM2.5 model features can be found in Delworth et al. (2012). The representation of the summer precipitation climatology in CM2.5 is also compared using a 4000-year control run of GFDL CM2.1, which is the CM2.5 predecessor. CM2.1 incorporates a grid scale of 2∘ latitude × 2.5∘ longitude for the atmosphere. The ocean resolution is variable, being approximately 1∘ latitude × 1∘ longitude, with a finer meridional resolution in the tropics. The CM2.1 atmospheric model has 24 vertical levels (Delworth et al., 2006). The ocean component CM2.1 and CM2.5 consist of 50 levels in the vertical. Future changes projected with CM2.5 are compared with that derived with the CSIRO-Mk3-6-0 model (1.9∘ × 1.9∘ horizontal resolution for the atmosphere), which includes the ocean component based on the GFDL ocean model. This choice was determined by the fact that future projections of the CSIRO-Mk3-6-0 model, unlike CM2.1, follow the same protocol for the forcing scenario, i.e., the IPCC RCP8.5 scenario (Meinshausen et al., 2011; Riahi et al., 2011), as those of CM2.5.
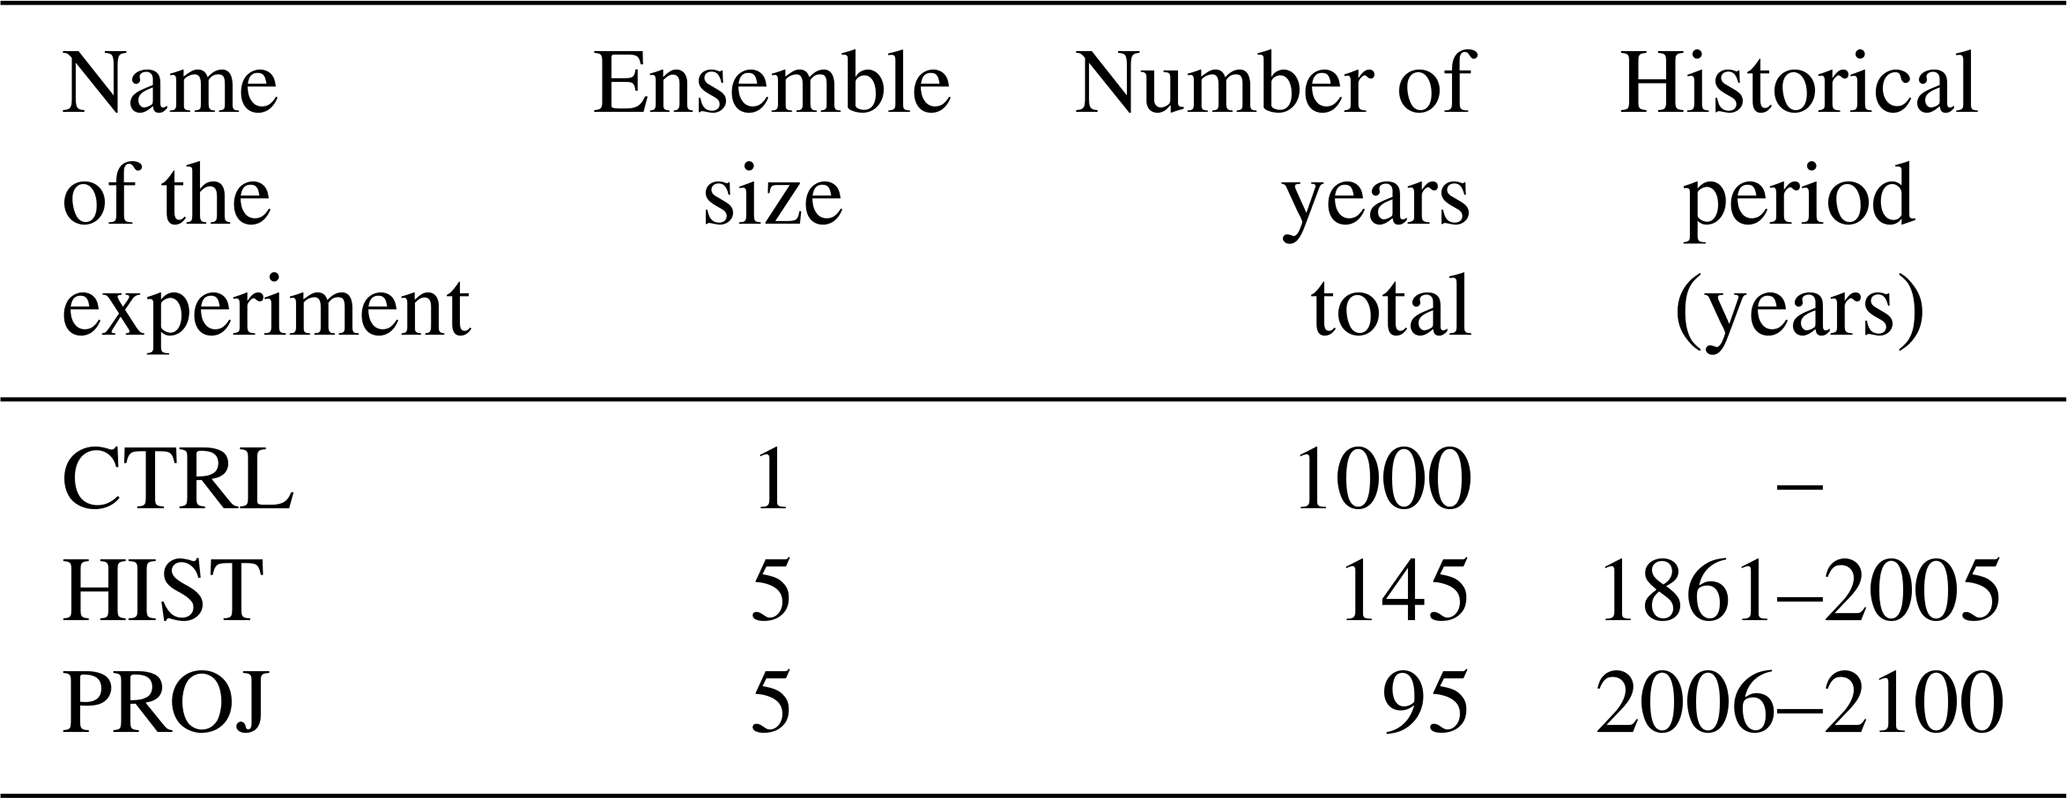
The set of experiments performed using CM2.5 are listed in Table 1 and consist of control simulations (hereafter CTRL) and five-member ensembles of historical simulations (hereafter HIST), as well as future projections (hereafter PROJ) performed with CM2.5. The CTRL simulation consists of a 1000-year integration, whereby greenhouse gas and aerosol compositions are held fixed at the levels of the year 1860. In the HIST and PROJ ensembles, the forcing follows the protocols of the Coupled Model Intercomparison Project Phase 5 (http://cmip-pcmdi.llnl.gov/cmip5/forcing.html, last access: March 2019). For the historical period (1861–2005), the radiative forcings are based on observational estimates of concentrations of well-mixed greenhouse gases (GHGs), ozone, volcanoes, aerosols, solar irradiance changes, and land use distribution. For the future (2006–2100) the radiative forcing follows an estimate of projected changes defined in the IPCC RCP8.5 scenario. This scenario assumes high population growth, slow technological change and energy intensity improvements, and a lack of developed climate change policies, resulting in large energy demand and GHG emissions.
2.2 Datasets used for comparison
The simulated features of large-scale circulation are compared with reanalysis data for monthly pressure at mean sea level (hereafter SLP), wind vectors at the 850 and 200 hPa levels, and vertical velocity at 200 hPa for the period 1979–2017. Reanalysis data are provided by the NCEP-DOE AMIP-II Reanalysis 2 (hereafter NCEP-DOE2) with 2.5∘ × 2.5∘ horizontal resolution and 17 vertical levels (Kanamitsu et al., 2002; https://www.esrl.noaa.gov/psd/data/gridded/data.ncep.reanalysis2.html, last access: March 2019).
The simulated precipitation is compared with the seasonal time-averaged precipitation provided by the University of Delaware (V4.01; Legates and Willmott, 1990; http://climate.geog.udel.edu/~climate/html_pages/README.ghcn_ts2.html, last access: July 2018). This is a global gridded land dataset with 0.5∘ × 0.5∘ horizontal resolution for the period 1980–2015. For the same period we also use the EOBS precipitation dataset provided by the EU-FP6 project UERRA (http://www.uerra.eu, last access: March 2019) and the Copernicus Climate Change Service (Cornes et al., 2018; version 17), provided at 0.25∘ × 0.25∘ horizontal resolution.
The observational analysis of the summer North Atlantic Oscillation (Sect. 3.2) is carried out using the July–August mean sea level pressure (SLP) provided by NOAA/ESRL PSD 20th Century Reanalysis version 2c (Compo et al., 2006, 2011; https://www.esrl.noaa.gov/psd/data/20thC_Rean/, last access: March 2019). The spatial patterns of the dominant component of the SLP variations are computed with empirical orthogonal function (EOF) analysis over the domain (25–70∘ N, 70∘ W–50∘ E), following Folland et al. (2009). The robustness of the pattern is tested against chosen periods of different length.
2.3 Analysis methods
The representation of the simulated large-scale atmospheric circulation over the Mediterranean (Sect. 3.1) is analyzed using CTRL run monthly mean fields of the lower-, mid-, and upper-level dynamics over the region covering southern Europe, North Africa, and South Asia (30–50∘ N, 30∘ W–110∘ E). The analysis of the simulated SNAO teleconnection focuses on the Euro-Atlantic region. In the analysis of the eastern Mediterranean climate, we define the region of focus as EMED (30–36∘ N, 36–42∘ E). We will also refer to the eastern Mediterranean land region, which includes Syria, Lebanon, Israel, Jordan, and the Levant region.
The time-mean large-scale circulation features are analyzed based on the monthly means of hydrometeorological variables for the summer (June, July, and August; hereafter JJA) season. Future changes are estimated by comparing the climatology at the end of the 21st century (i.e., 2061–2099, hereinafter future) of the RCP8.5 scenario with that at the end of the 20th century (i.e., 1961–1999, hereinafter present) of the historical simulation using monthly mean fields for the summer season.
The teleconnection of the Mediterranean climate with SNAO is analyzed using the full (1000-year) CTRL run (Sect. 3.2), as well as the historical and future runs. The SNAO is defined as a lead component of SLP vector time series over the Euro-Atlantic region (25–75∘ N, 70∘ W–50∘ E) in “core summer” (July–August), following Folland et al. (2009). The choice of the time window is determined by the fact that the temporal behavior of the SNAO in significantly correlated only within these two months. The impact of this teleconnection on Mediterranean climate is estimated based on correlations between SNAO PC time series and the regional temperature and precipitation using the long CTRL experiments and the historical and future ensembles. The evolution of the SNAO fingerprint in the 20th and 21st century is analyzed by projecting the vector time series of the HIST and PROJ experiments (240 years, 1861–2100) on the SNAO eigenvector derived from the CTRL run. To analyze potential changes in the spatial pattern of SNAO and associated impacts, the EOF analysis is applied independently to each of the HIST and PROJ ensembles in the period 1950–2010 and 2040–2100, respectively, by detrending the time series before computing the EOF. In both epochs, the analysis has also been tested for shorter periods (i.e., 50 and 30 years), which did not change the results in qualitative terms. Each of the five SNAO time series for the 1950–2010 and 2040–2100 periods was correlated with the respective detrended precipitation fields. The results are compared with the observational analysis using SLP provided by the 20CR dataset in the period 1870–2010.
The summer climate regime of the eastern Mediterranean (EMED) is examined from the perspective of the regional mid- and upper-tropospheric subsidence and its physical linkage with the surface circulation (Sect. 3.3). The seasonal variability of the subsidence over the eastern Mediterranean is derived from EOF analysis applied to vertical velocity (ω) fields at 500 hPa and also at 300 hPa (each level separately) over the region covering the Mediterranean, North Africa, and the Middle East in July. The physical linkage between the subsidence and surface circulation is estimated using correlations between the time series of the first EOF component (PC1) and the regional sea level pressure, geopotential height, and wind vectors at 850 hPa. The relationship between the EMED region dynamics and the Indian summer monsoon (ISM) is estimated by computing additional correlations with precipitation, outgoing longwave radiation, and the vertically integrated water column. The analysis shows the correlations computed using time series of EOF ω at 500 hPa, but the correlations using EOF ω at 300 hPa were almost the same. The results of the analysis are shown for July when the magnitude of subsidence and the Etesians is at its maximum and the response of the Rossby waves to monsoon rainfall is also strongest (Tyrlis et al., 2013; Lin et al., 2007; Lin, 2009). The results derived for June and August are shown in the Supplement.
Future changes in the dynamical linkages governing the summer climate regime over the eastern Mediterranean were analyzed by comparing the 5-decade-long samples for July, i.e., 1960–2010 and 2050–2100. The linkage was calculated in a similar manner to that of the control run using correlations between the time series of the EOF over the EMED region subsidence and the atmospheric surface circulation fields. All EOF time series were computed by projecting the respective run on the eigenvector derived from the control run. The correlations were derived for each run (historical and future, respectively) using a priori detrended time series. The final result shows the ensemble mean for the five-member historical and future correlations.
An additional analysis investigates the potential influence of the local EMED temperature on the derived local dynamical relationships (Sect. 4.3 and the Supplement). Therefore, the derived correlations were differentiated between samples, with the 300 warmest and the 300 coldest summers (July) over the Mediterranean chosen from the control run time series. Their selection is based on surface temperature in the EMED region. Additionally, a diagnosis of temperature impacts on the regional atmospheric circulation was performed using composite differences between the two temperature samples and the associated relative humidity, sea level pressure, wind components, geopotential height, vertical velocity, and precipitation. The results were corroborated by testing their sensitivity to the precise choice of the region.
3.1 Simulated summer mean Mediterranean climate
Figure 1a and b demonstrate that the model captures the subtropical low-tropospheric circulation with high fidelity when compared with the reanalysis (NCEP-DOE2). It accurately reproduces the zonal pressure gradient over the Mediterranean, both in terms of pattern and magnitude, forged by the difference between the subtropical anticyclone over the North Atlantic and the massive Asian monsoon heat low. The latter extends westward through the Arabian Peninsula towards the Levant region and southern Asia Minor. Concomitant to the zonal pressure gradient and adjustments to the regional orography is a persistent western to northerly flow over the central and eastern Mediterranean (i.e., the Etesian winds). The model realistically captures its local-scale features, which are created by adjustments to the regional topography. This includes a local wind maximum centered over the Aegean Sea and its southern extension reaching the Sahel region. These northerlies are also channeled through the Red Sea straits and the Persian Gulf, reaching the Indian Ocean.
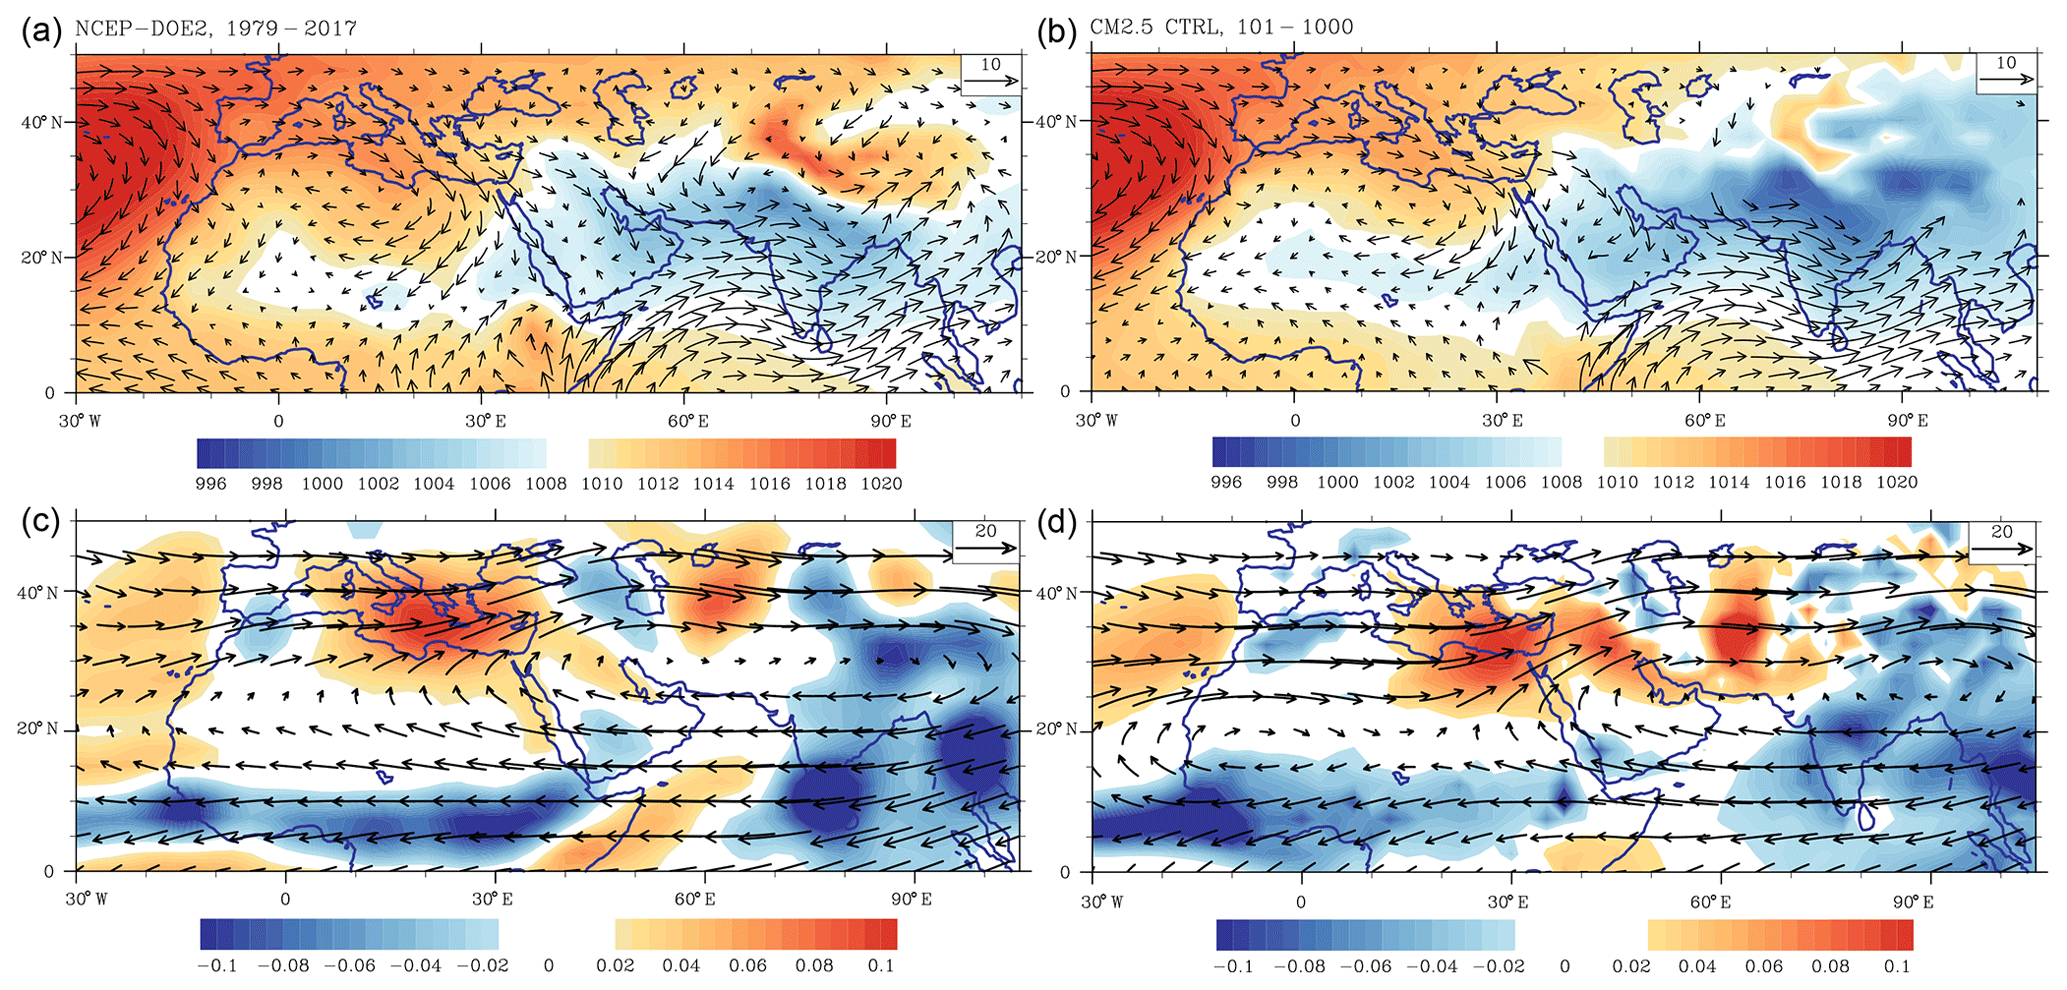
Figure 1Seasonal (JJA) time-mean sea level pressure (hPa) and wind vector at 850 hPa (m s−1) in (a) NCEP-DOE2 and (b) CM2.5. Seasonal (July) time-mean vertical velocities at 500 hPa (Pa s−1; downward motion denoted with positive values) and wind vectors at 200 hPa (Pa s−1; downward motion denoted with positive values) estimated for (c) NCEP-DOE2 and (d) CM2.5 CTRL. Observational data are used for 1979–2017, and control simulation data are used for years 101–1000. All datasets are interpolated to the 2.5∘ horizontal grid.
Figure 1c and d show that the model reproduces the location and magnitude of the summer subtropical mid-troposphere anticyclone, which spreads from the eastern Mediterranean across South Asia. The simulated mid-troposphere also captures the location and a realistic magnitude of the persistent mid-troposphere (500 hPa) subsidence (positive ω), which creates the exceptionally hot and arid climate of the eastern Mediterranean. This subsidence gradually decreases towards the Iranian Plateau, which together with ascending motion over the South Asian monsoon region creates a large-scale time-mean zonal gradient. The simulated zonal gradient is clearly shown (Fig. 2a) by a vertical cross section of vertical velocity (ω) averaged over 20–34∘ N between the east Mediterranean region (positive ω means enhanced subsidence) and South Asia (negative ω means ascending air). This characteristic gradient agrees well with its observational counterpart (Fig. 2b) both in terms of magnitude and pattern. Importantly, the model captures the observed local maximum of the eastern Mediterranean subsidence located at middle-tropospheric levels (300–700 hPa), the region most sensitive to the impact of the Indian monsoon teleconnection.
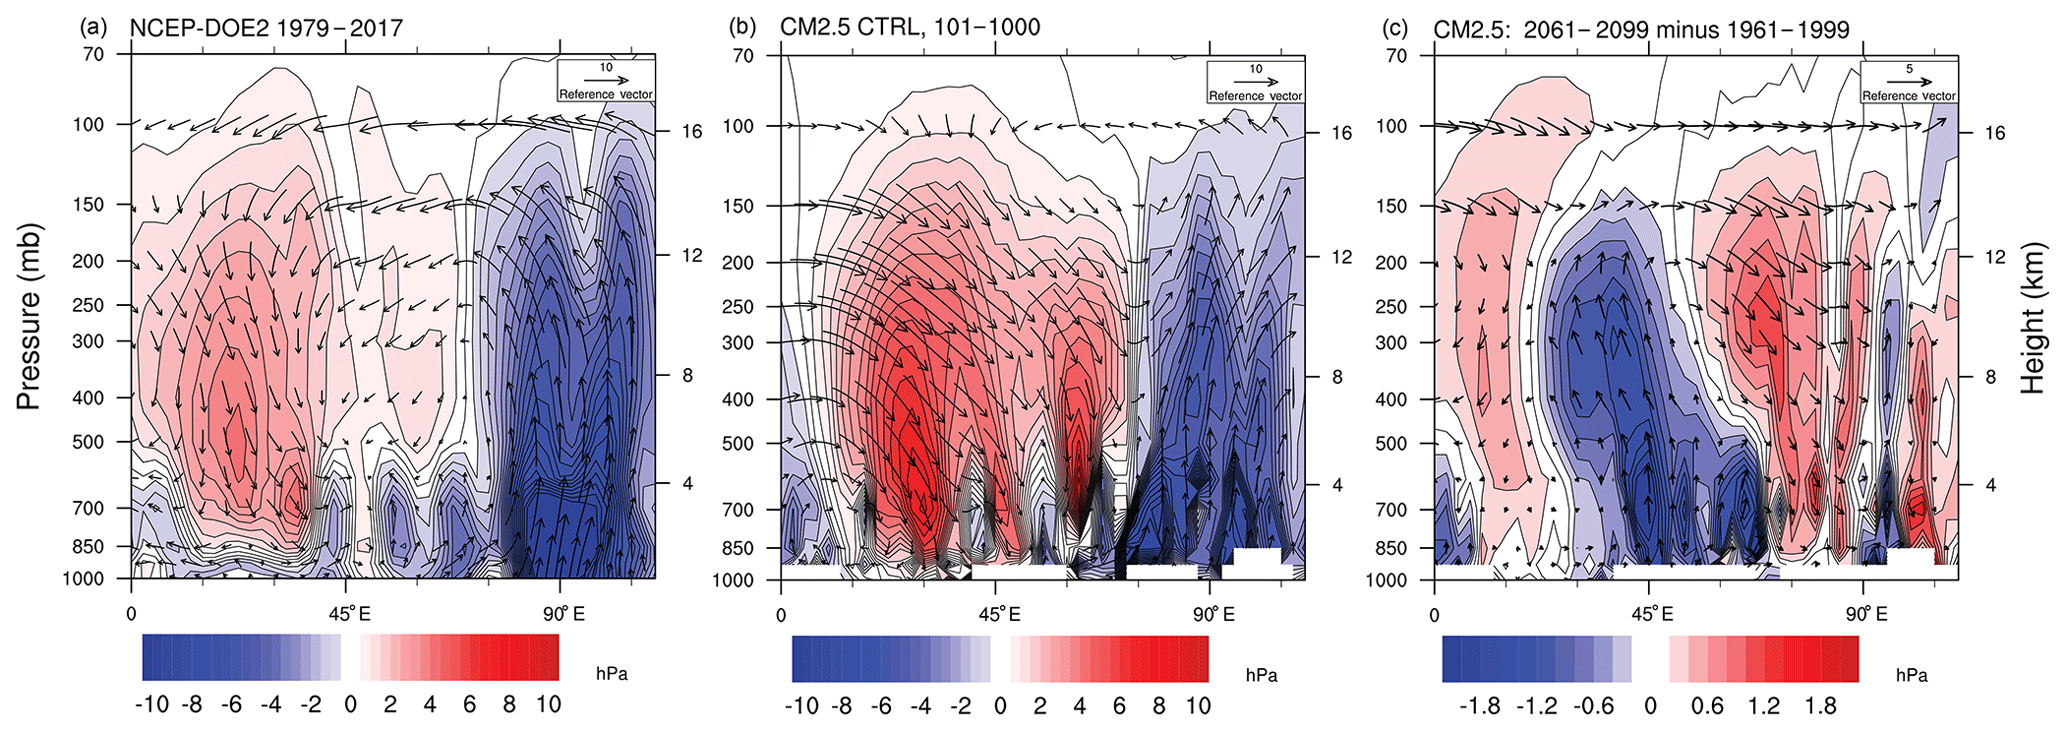
Figure 2Height (pressure)–longitude cross section of vertical velocity (Pa s−1; shaded contours, downward motion denoted with positive values) and the vector of zonal wind (m s−1) and vertical velocity (converted to meters per second and scaled with a factor of 1000) in July. The figure shows time-mean values in July (a) derived for the period 1979–2017 in NCEP-DOE2, (b) derived from 101 to 1000 years of the CTRL run in CM2.5, and (c) projected future changes in the period 2061–2099 in the PROJ ensemble mean compared with the baseline period 1961–1999 in the HIST ensemble mean. All fields are shown on the 2.5∘ × 2.5∘ horizontal grid and at the original vertical levels, which is common for CM2.5 and NCEP-DOE2.
Figure 3 shows climatologies of the Mediterranean precipitation provided by the observations, the CM2.5 control run, and also its low-resolution (CMIP3) predecessor, i.e., CM2.1, at their original horizontal resolutions. Globally, CM2.5 has been shown to represent temperature and precipitation better than almost every CMIP5 model (Knutti et al., 2013). Regionally, we compare CM2.1 with CM2.5 to understand a representation of differences in precipitation with resolution enhancement and all else being equal. Although both CM2.1 and CM2.5 depict the general spatial features of the climatology (i.e., large values in the northern Mediterranean, particularly over the Alps and the Balkans), the former introduces large biases (up to 50 %) in the regions with sharp spatial gradients. CM2.5 reproduces precipitation with a greater level of detail, clearly indicating the advantages of higher horizontal model resolution for regions with complex orography. However, precipitation magnitude in most mountainous areas, e.g., the northern Iberian Peninsula, the Alps, and over Asia Minor, is larger than in observational datasets, like the University of Delaware and EOBS. The climatology in CM2.5, in terms of pattern and magnitude, seems to be more consistent with the EOBS dataset. However, due to a relatively large observational uncertainty in many mountainous areas leading to the underrepresentation of precipitation over complex terrain in gridded observational datasets, it is difficult to validate the model rainfall climatology in the region (Lundquist et al., 2019). The CM2.5 results are comparable to the downscaling simulations using high-resolution (at ∼50 and ∼12 km) regional climate models of the EURO-CORDEX experiment (Jacob et al., 2014). Kotlarski et al. (2014) demonstrate that the regional models capture realistic features of the European climate. However, the majority of the experiments feature a wet bias over most regions of Europe. This includes, similar to CM2.5, a wet bias over the Iberian Peninsula, the Balkans, and Asia Minor, although some of the models also exhibit a dry bias over southeastern Europe. Moreover, increasing the spatial resolution from 50km to 12 km yielded usually higher precipitation amounts, thereby enhancing the wet bias (Kotlarski et al., 2014).
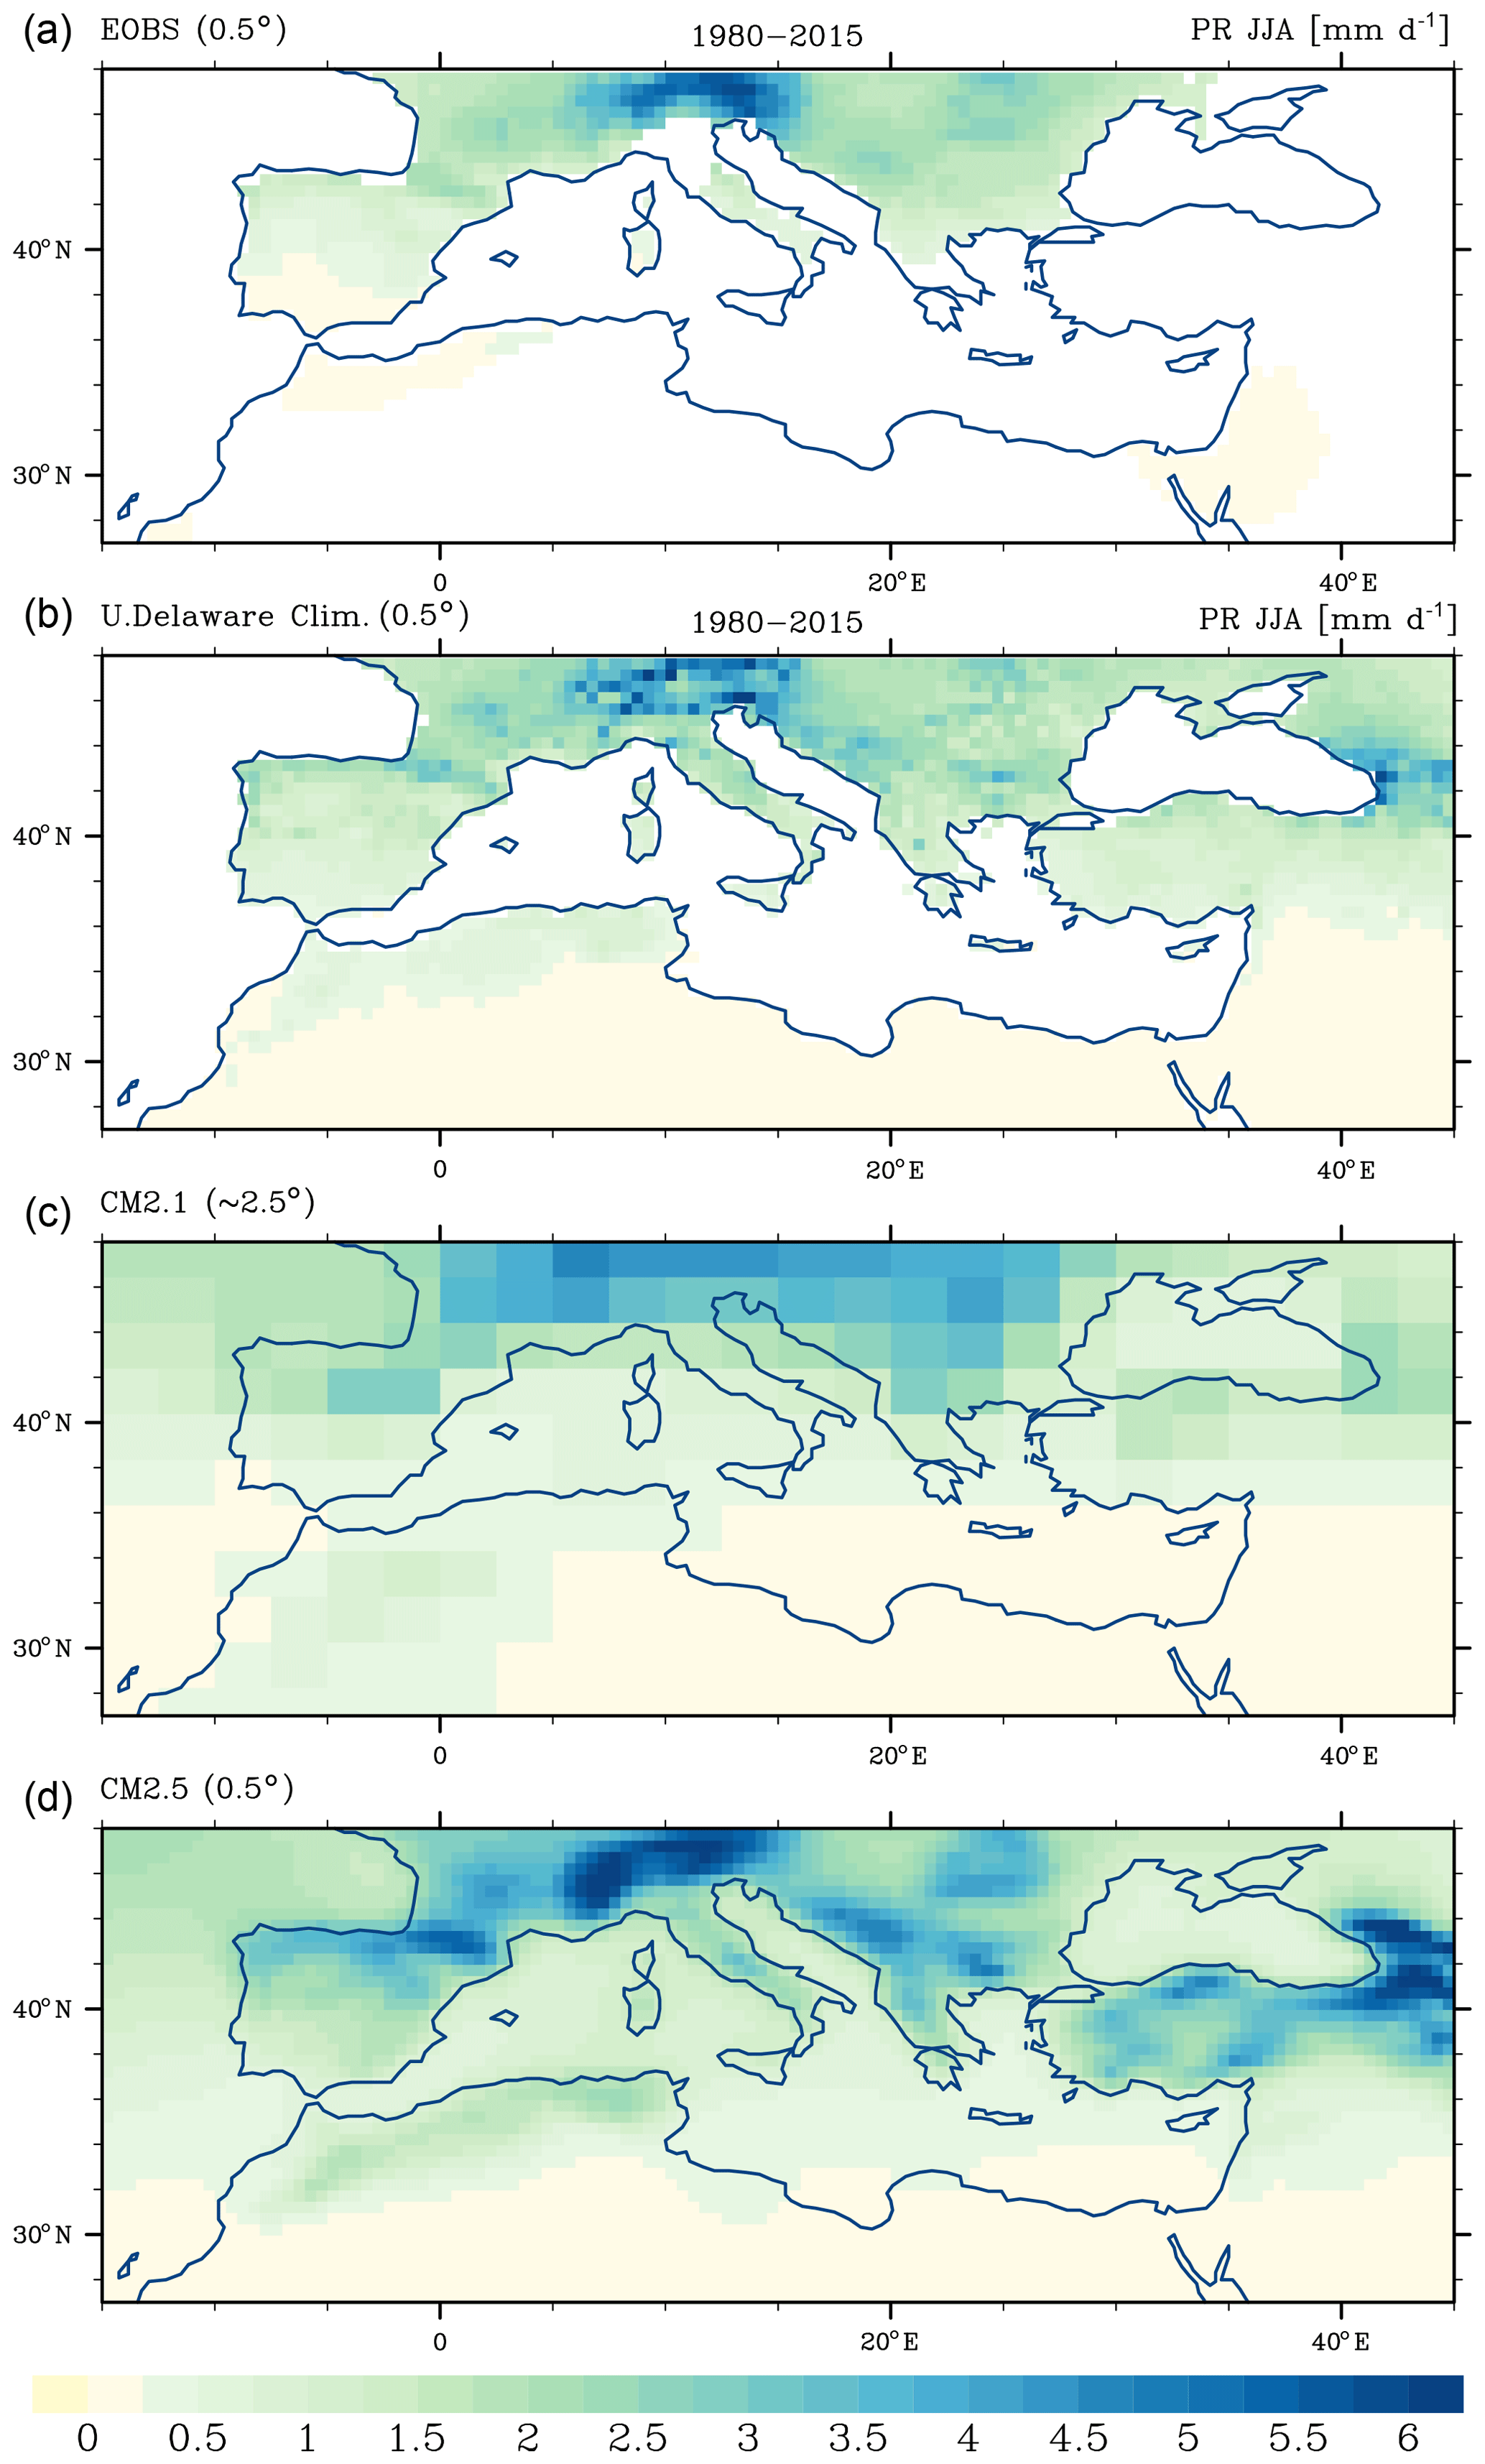
Figure 3Seasonal (JJA) mean precipitation (mm d−1) for (a) EOBS observations, (b) the University of Delaware climatology, (c) CM2.1, and (d) CM2.5. The time mean of seasonal data from years 101–1000 of the control simulations is used, as are years 1980–2015 of the observed datasets. Both observational datasets are shown at 0.5∘ lat × long resolution. Regions with missing data are left blank.
Overall, our analysis indicates that the high-resolution CM2.5 control run faithfully reproduces the mean surface- and upper-tropospheric circulation over the Mediterranean, and it captures the complexity of the regional precipitation found in observations with a similar resolution (Fig. 3). Increasing the horizontal atmospheric resolution from 200 km in CM2.1 (approximately the average of CMIP5 models) to 50 km in CM2.5 improves the representation of mountains and coastlines (Kapnick et al., 2014; Delworth et al., 2012), which is necessary to improve regional precipitation, land–ocean dynamics, and regional circulation (Pascale et al., 2016).
3.2 The impact of the summer North Atlantic teleconnections on the Mediterranean region
The imperative of the following section is to test the capability of the model to simulate the SNAO as an independent, internally generated climate component, which would prove the physical validity of the statistically derived component, following the methodology described in Sect. 2.3. However, allowing for the fact that (a) circulation over the SNAO region is influenced by different key factors at different times, giving rise to time-varying dominant modes of apparent internal variability, and (b) each simulation represents a different, nondeterministic state of internal climate variations, one should not expect to obtain from each run a replica of the observed SNAO component.
3.2.1 Spatial pattern of SNAO
The EOF analysis applied to the CTRL run (Table 1) results in two modes: the first mode (CTRL EOF1) represents the SNAO and dominates the summer SLP variations, explaining twice as much total variance as CTRL EOF2 (34 % and 15 %, respectively).
Figure 4a depicts the spatial pattern of CTRL EOF1. The derived dipole resembles the observed SNAO signature (e.g., Folland et al., 2009), including a distinct northward shift when compared to the winter counterpart (shown in, e.g., Barcikowska et al., 2017). The dipole pattern has a northern lobe over the southwestern flank of Greenland and a southern lobe centered north of the Azores in the vicinity of ∼45∘ N, 30∘ E. At its positive phase SNAO is manifest with negative anomalies in the former and positive anomalies in the latter region, thereby strengthening the meridional SLP gradient over the North Atlantic. The pattern is also similar when analyzed for the single months of July and August (not shown).
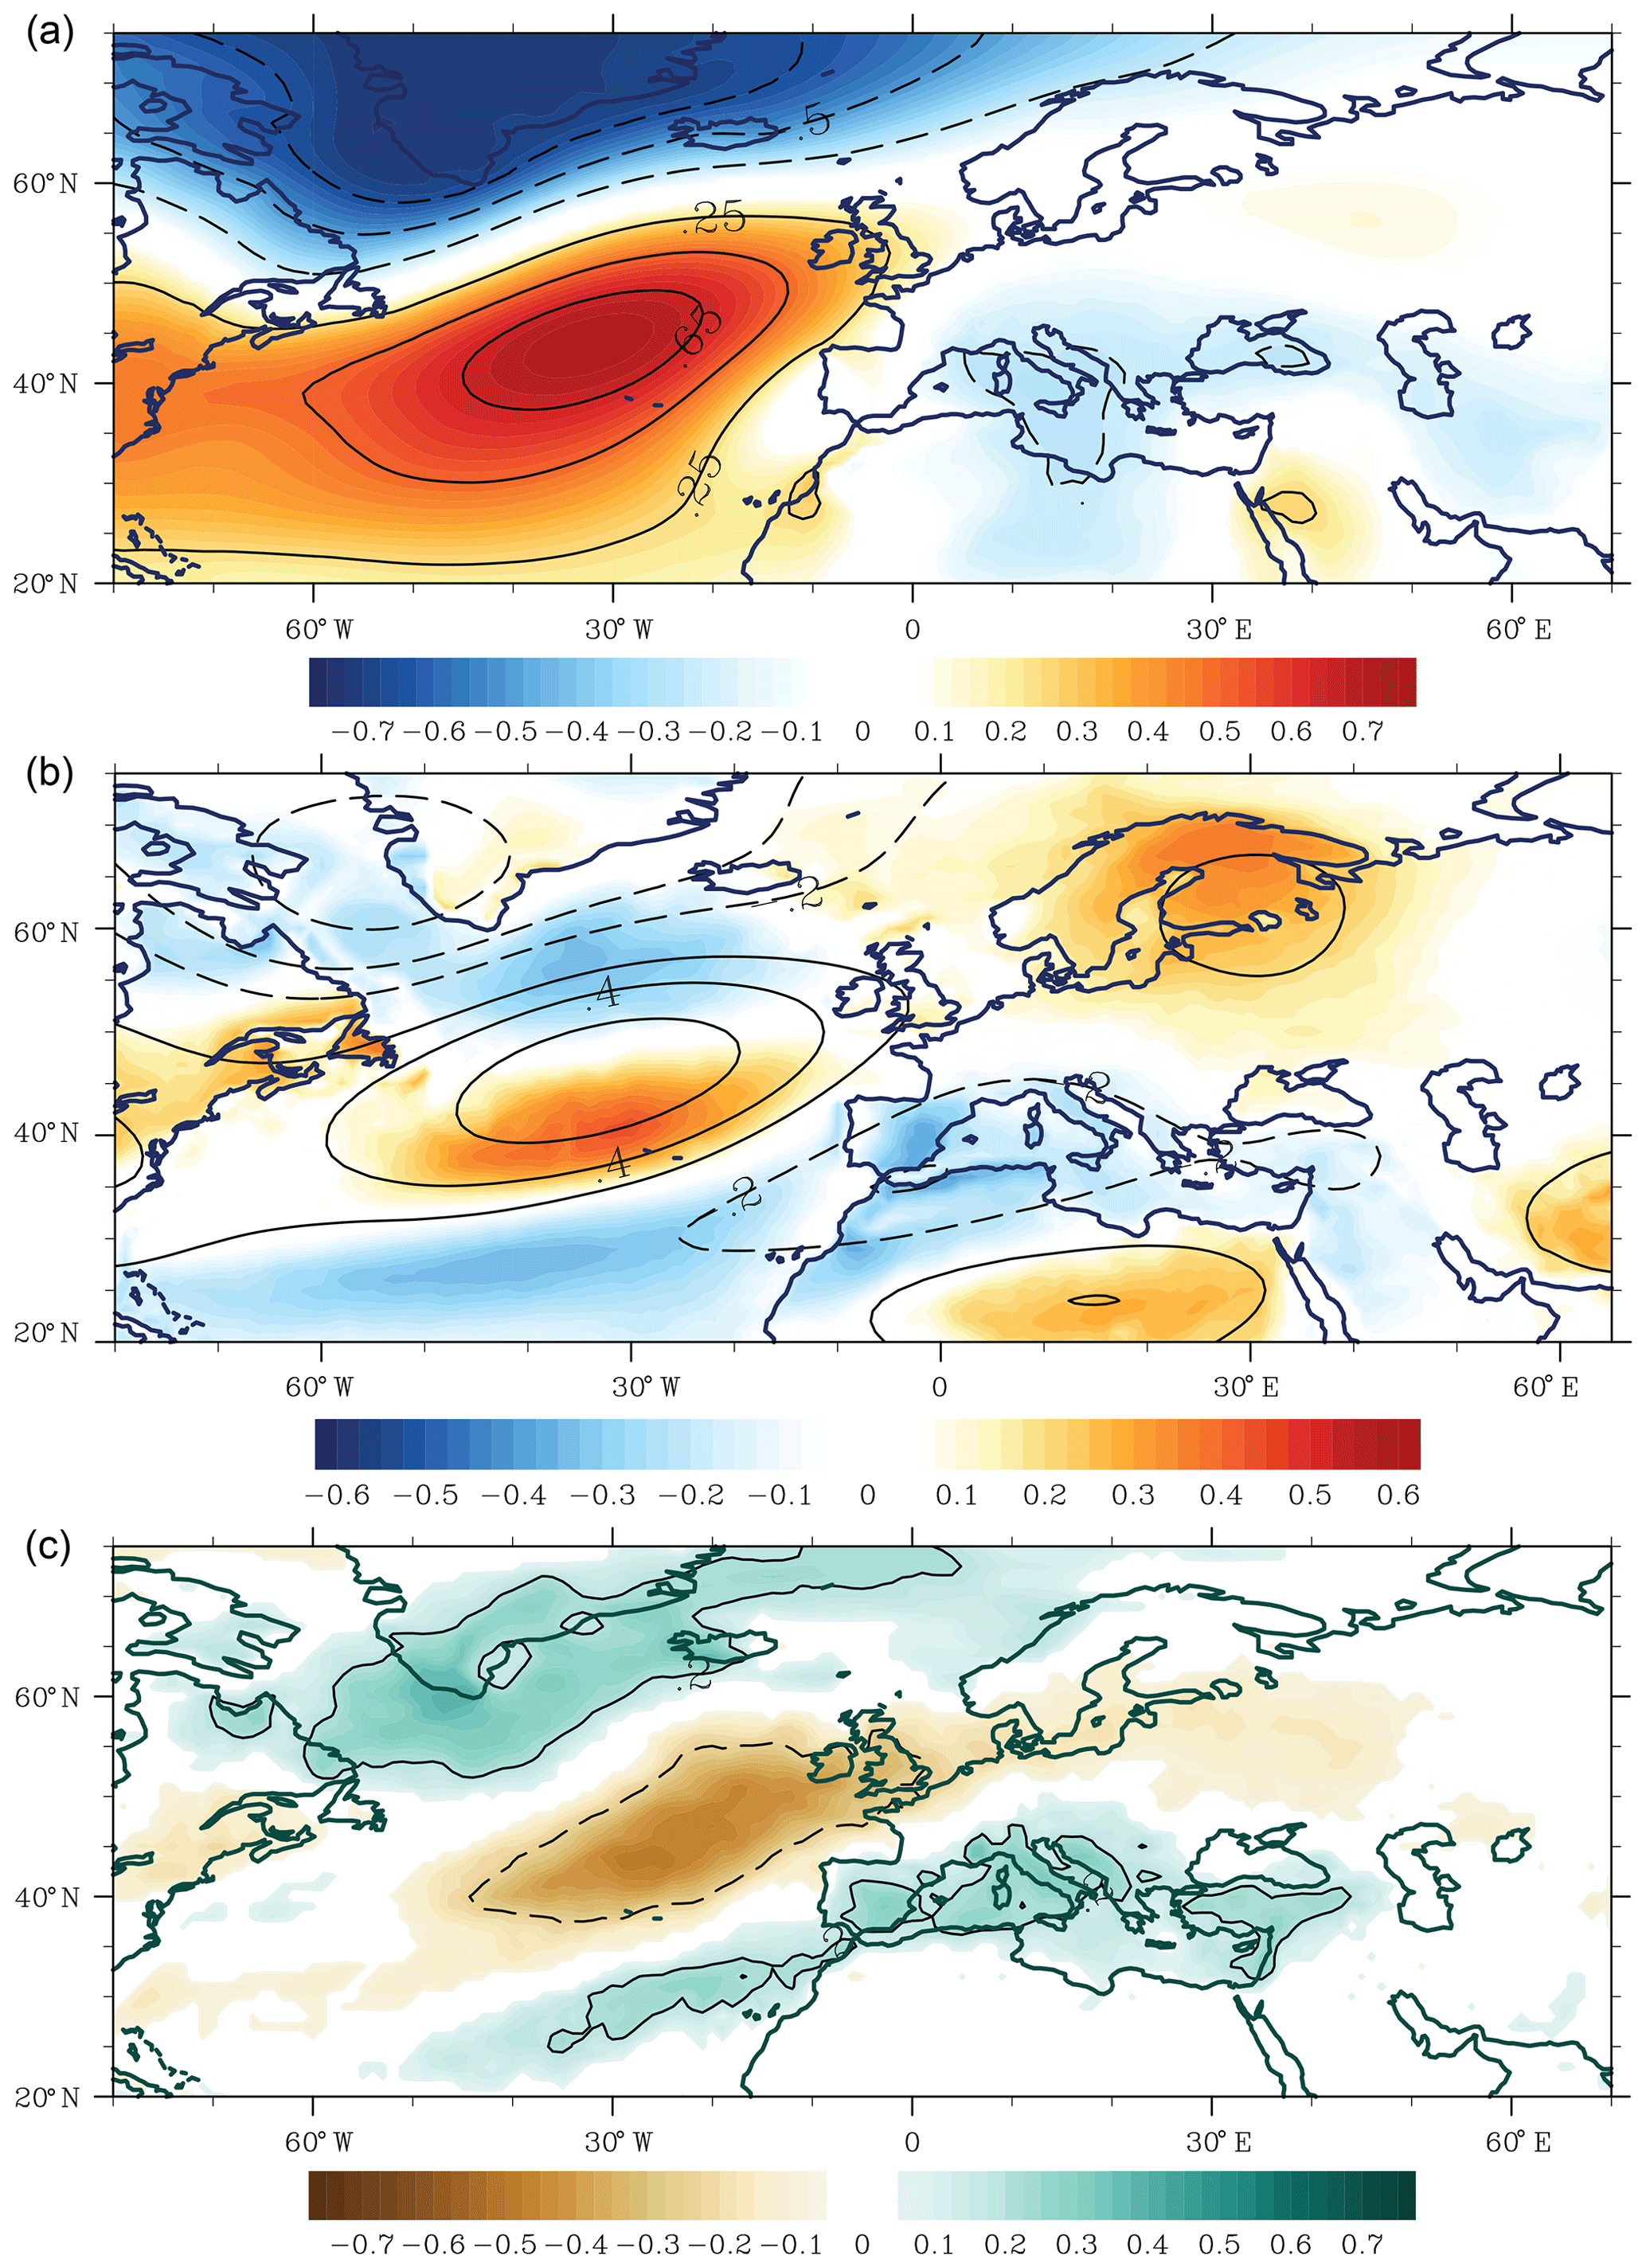
Figure 4Correlation between principal component time series of the SNAO SLP in JA and (a) sea level pressure, (b) temperature at 2 m (shaded) and geopotential height at 850 hPa (contours), and (c) precipitation. All derived from the CTRL run. Contours in (a) and (c) are shown for 0.25 and 0.5 correlations. Correlations are shown only when significant at the 1 % level.
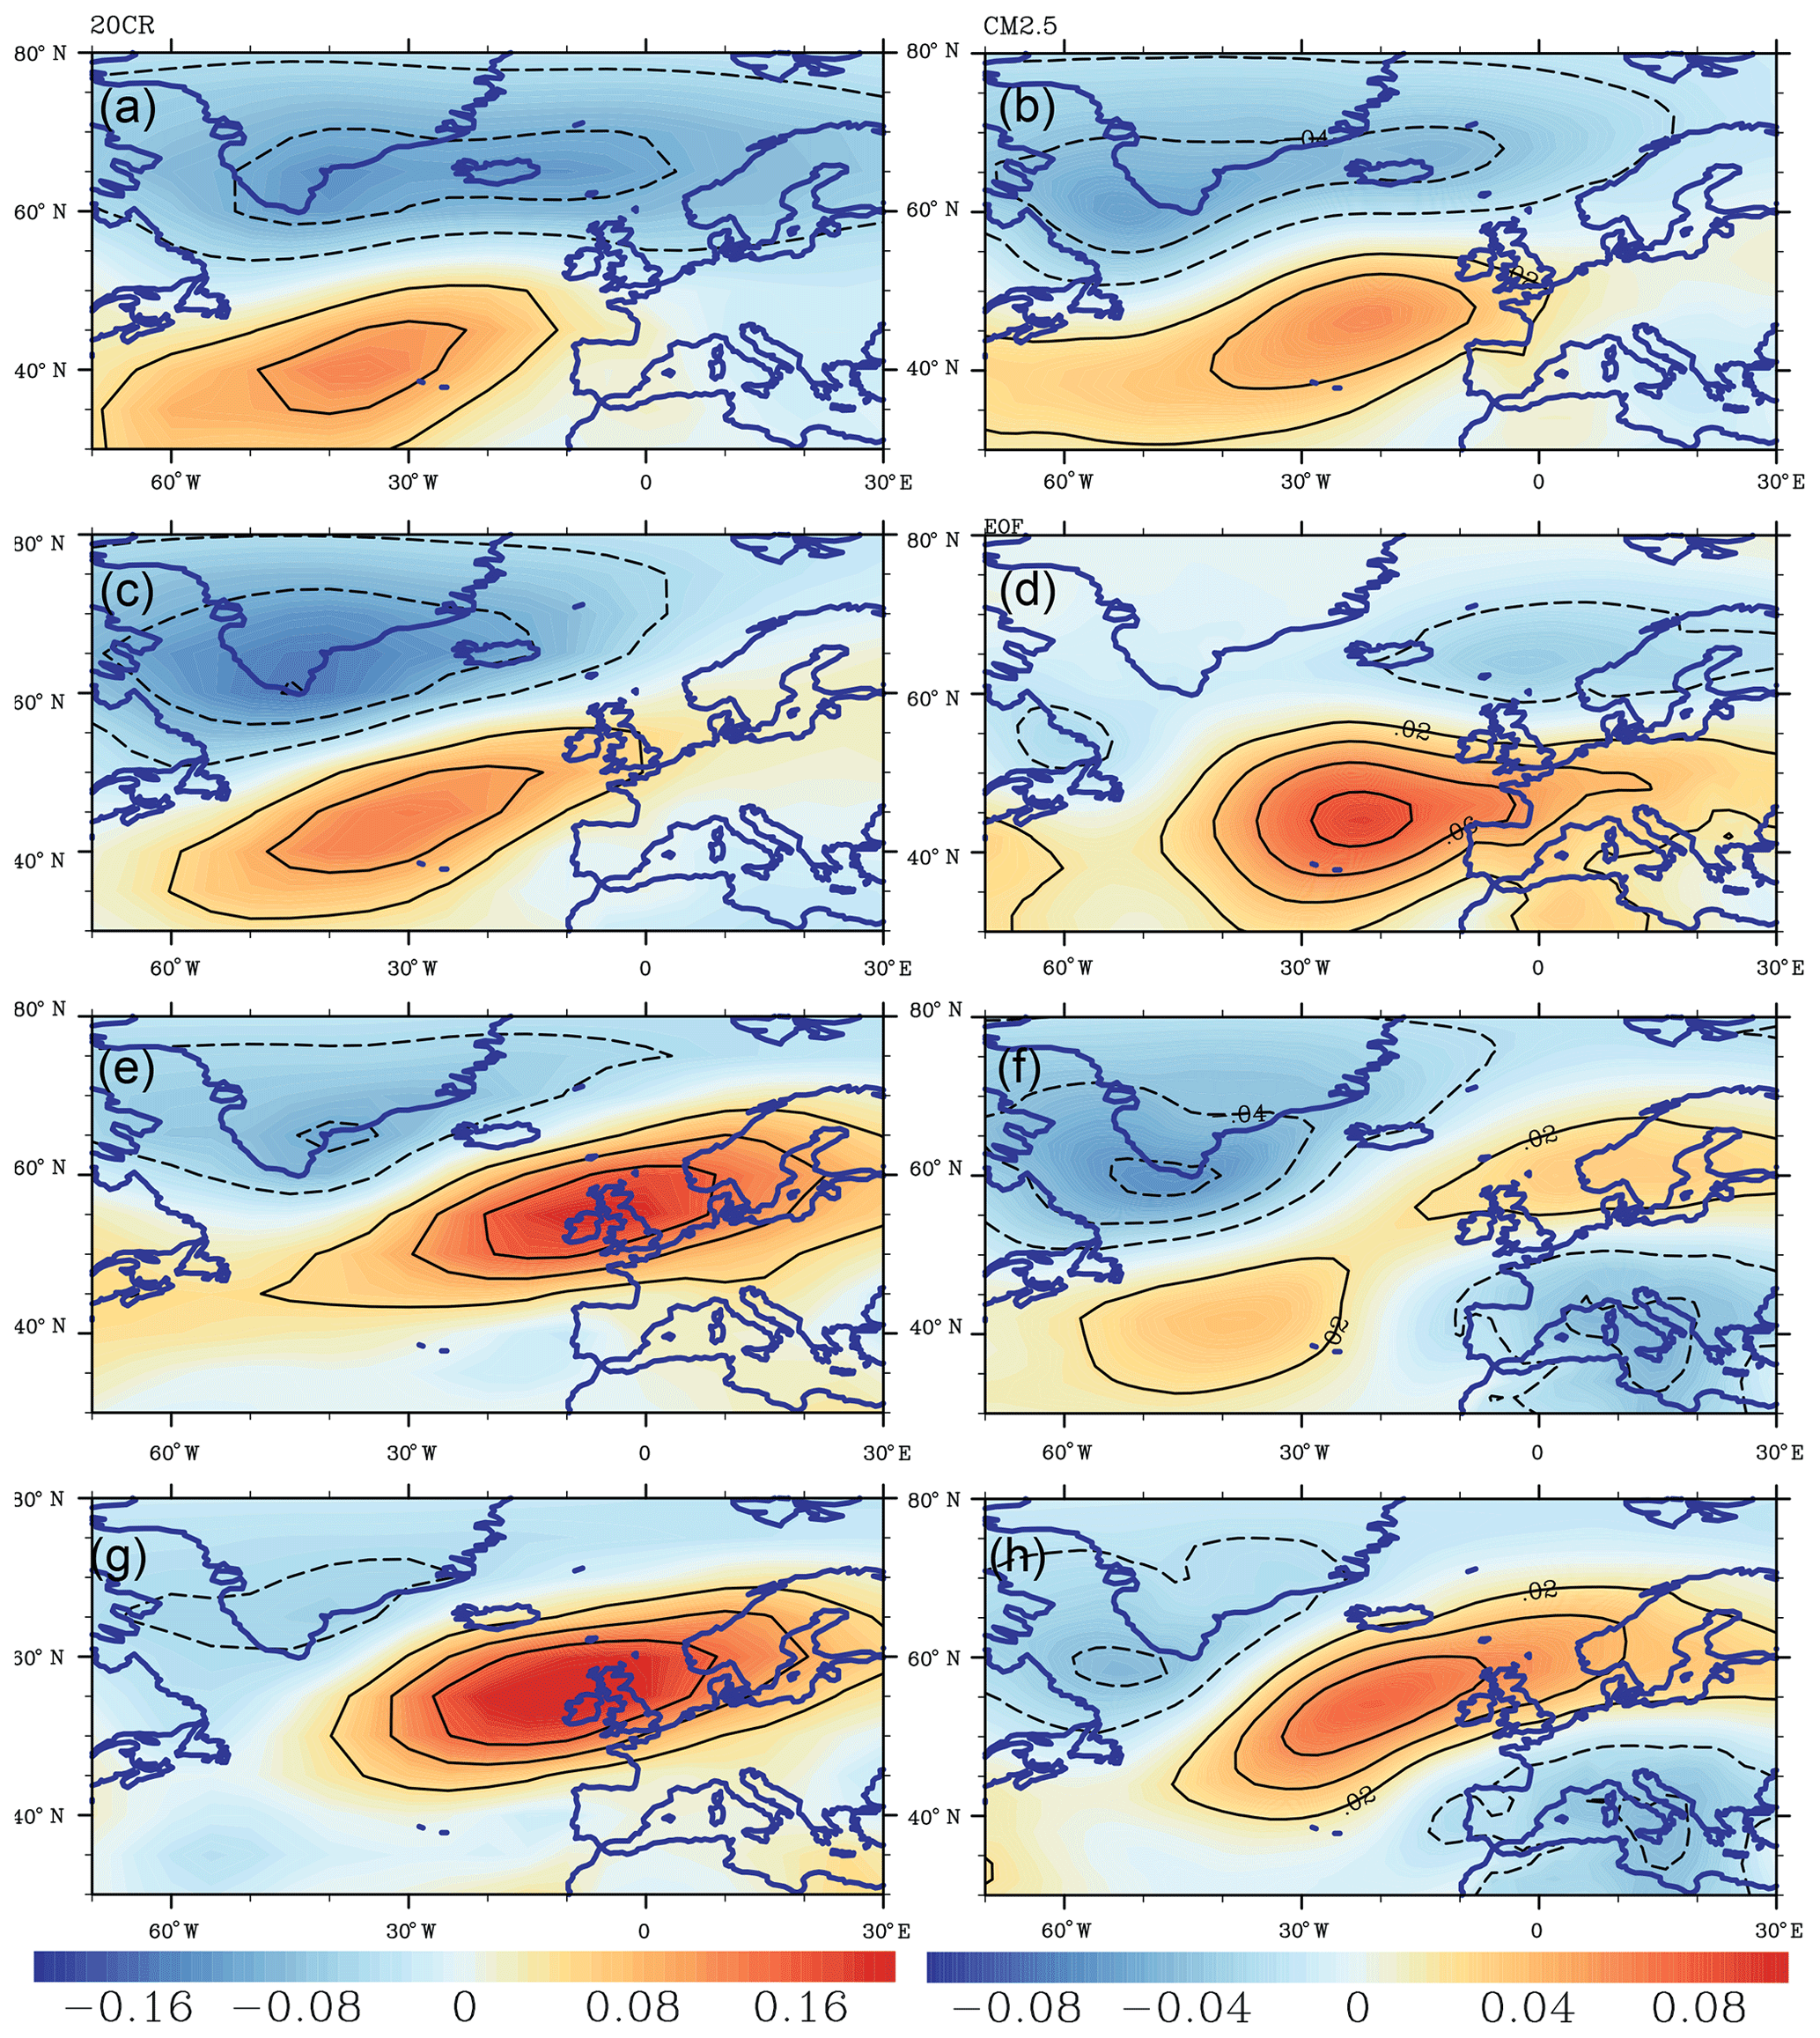
Figure 5Spatial pattern of the SNAO (EOF) derived from the 20CR reanalysis (a, c, e, g) and from the first CM2.5 HIST run (b, d, f, h), shown as correlations between the first principal component time series and SLP in July–August. The pattern is derived from the periods (a, b) 1870–1920, (c, d) 1900–1950, (e, f) 1940–1990, and (g, h) 1960–2010. Please note that the sign of each derived EOF is arbitrary. The analysis took this fact into account and unified the sign, showing the SNAO at its positive phase.
Further analysis also indicates that the signature of the simulated SNAO in Fig. 5b and d is much more consistent with the observed one in Fig. 5a and c before the 1970s rather than in the recent 6 decades (Fig. 5f and h compared with Fig. 5e and g). The analysis of EOF1 is derived from the consecutive periods of 20CR reanalysis, which are 50-year periods, i.e., (a) 1870–1920, (c) 1900–1950, (e) 1940–1990, and (g) 1960–2010 in Fig. 5, as well as 40-year periods, i.e., 1851–1890, 1891–1930, 1931–1970, and 1971–2010 in Fig. S1 in the Supplement. It suggests an evolution of the SNAO fingerprint in time. The patterns observed in the early observational period (1870–1920 and 1900–1950 in Fig. 5a and c) bear very strong resemblance to the simulated counterpart (Fig. 5b and d) and also to the one simulated in the CTRL EOF1 (Fig. 4a), i.e., including the northern centers of action at southern Greenland and with the southern lobe located north of the Azores (∼45∘ N, 35∘ E). In contrast, the EOF derived for the recent decades (e.g., 1960–2010 in Fig. 5g and h or 1971–2010 in Fig. S1) exhibits a weak northern lobe and a much stronger southern lobe, with the latter also being shifted northeast towards the British Isles. These differences are also consistent with other observational analyses of the recent 6 decades (Blade et al., 2012a; Syed et al., 2012).
A similar evolution of the SNAO pattern is found in four out of the five HIST members available when comparing the early observational periods with the most recent decades (Fig. 5b, h and S2). For example, the pattern derived from all the HIST runs in the period 1870–1920 (Figs. S2 and 5b) resembles both the one derived from the observations (Fig. 5a) and the one derived from the CTRL run (Fig. 4a). In the most recent period (i.e., 1960–2010), the SNAO fingerprints simulated in HIST runs (Fig. S2) and the one derived from the observations (Fig. 5g) feature a much weaker northern lobe, and the southern lobe is shifted northeastward towards the British Isles. This tendency intensifies even more when the more recent period is extended towards the future using PROJ members (e.g., 1970–2030, 1970–2060; Fig. S3). As the anthropogenic forcing is the only deterministic factor in the HIST and PROJ experiments, the above results highlight its potential importance in shaping the SNAO and hence explaining to some degree the temporal evolution of its spatial signature in the 20th century.
3.2.2 Impact of SNAO on the Mediterranean climate
The SNAO simulated in CM2.5 exerts an impact on the precipitation, surface temperature, and geopotential height over the North Atlantic and Europe (Fig. 4), which strongly resembles its observational counterpart (e.g., Folland et al., 2009; Blade et al., 2012a). This includes a distinct tripolar pattern of precipitation anomalies with the lobe over southern Greenland, over northern Europe and its vicinity over the North Atlantic, and southern Europe (Fig. 4c). The location corresponds closely with the fingerprint of anomalous surface temperature (Fig. 4b).
The derived SNAO teleconnection at its positive (negative) phase, manifested in the positive (negative) SLP anomalies over its southern lobe (Fig. 4a), is linked with anomalous warming and drying (cooling, wetting) over northwestern Europe and anomalous cooling and wetting (warming, drying) over the Mediterranean (Fig. 4b and c). Consistent with the observations (Folland et al., 2009), the impact on the former region is almost twice as strong as on the latter, both in terms of precipitation and temperature. For example, the magnitude of correlation coefficients in the vicinity of the southern SNAO lobe (i.e., southwest of the British Isles) exceeds about 0.6 for precipitation and 0.5 for temperature, but in the Mediterranean, it remains below 0.35 and 0.4, respectively, for precipitation and temperature.
The SNAO teleconnection to the northern and southern parts of Europe also points to different physical mechanisms. While the impact of the SNAO on northern Europe has been straightforwardly explained with changes in the North Atlantic storm tracks (Folland et al., 2009), the impact on the southern Europe hydroclimate (shown in observations by Linderholm et al., 2009) is manifested through the changes in the mid- and upper-tropospheric geopotential height. The correlation analysis between the SNAO time series and 500 hPa geopotential height (Fig. 4b, contours) yields a tripolar structure, with the positions of the nodes being well collocated with those of precipitation and temperature. Hence, the negative correlations of geopotential height found over the Mediterranean provide a plausible explanation for the regional precipitation anomalies during the positive SNAO phase, which links to the local effects of an anomalous mid- and upper-tropospheric trough, associated cooling, and intensified potential instability over the Mediterranean.
3.3 Summer climate regime over the eastern Mediterranean
In this section, we investigate the ability of CM2.5 to simulate the key features shaping the hot and arid climate of the eastern Mediterranean (EMED, as defined in Sect. 2). This comprises (a) the linkage between the surface and the mid- and upper-tropospheric dynamics, which maintains the thermal balance of the region, and (b) the teleconnection with the Indian summer monsoon (hereafter ISM).
The connection between the mid- and upper-tropospheric subsidence and surface circulation over EMED (Fig. 6) is depicted with correlations between time series of the dominant EOF of vertical velocity (ω) at 500 hPa (i.e., EOF1 in Fig. 6a), geopotential height and wind vector at 850 hPa, outgoing longwave radiation, and precipitation. The EOF pattern is almost identical to the simulated and observed climatology, featuring a monopole pattern being well collocated with the local maximum of subsidence in the vicinity of Crete (Tyrlis et al., 2013; Ziv et al., 2004). The EOF persists as a dominant component up to the upper troposphere (∼200 hPa), explaining 33 %–35 % of the total variance. Figure 6b and c show that CM2.5 skillfully captures the connection between the strengthening mid- and upper-tropospheric subsidence and the intensifying Etesians, zonal pressure gradient, and concomitant anticyclonic circulation in the central Mediterranean. Consistent with the impact of the adiabatic descent (and associated radiative cooling in dry regions under clear-sky conditions), these changes are also manifest in the larger outgoing longwave radiation and to a smaller degree in reduced precipitation (Fig. 6e and f). The simulated CM2.5 relationship closely resembles its observational counterpart, derived by correlating the regional anomalies of ω 500 hPa and meridional wind using the detrended NCEP-DOE2 dataset, shown in Fig. 6d.
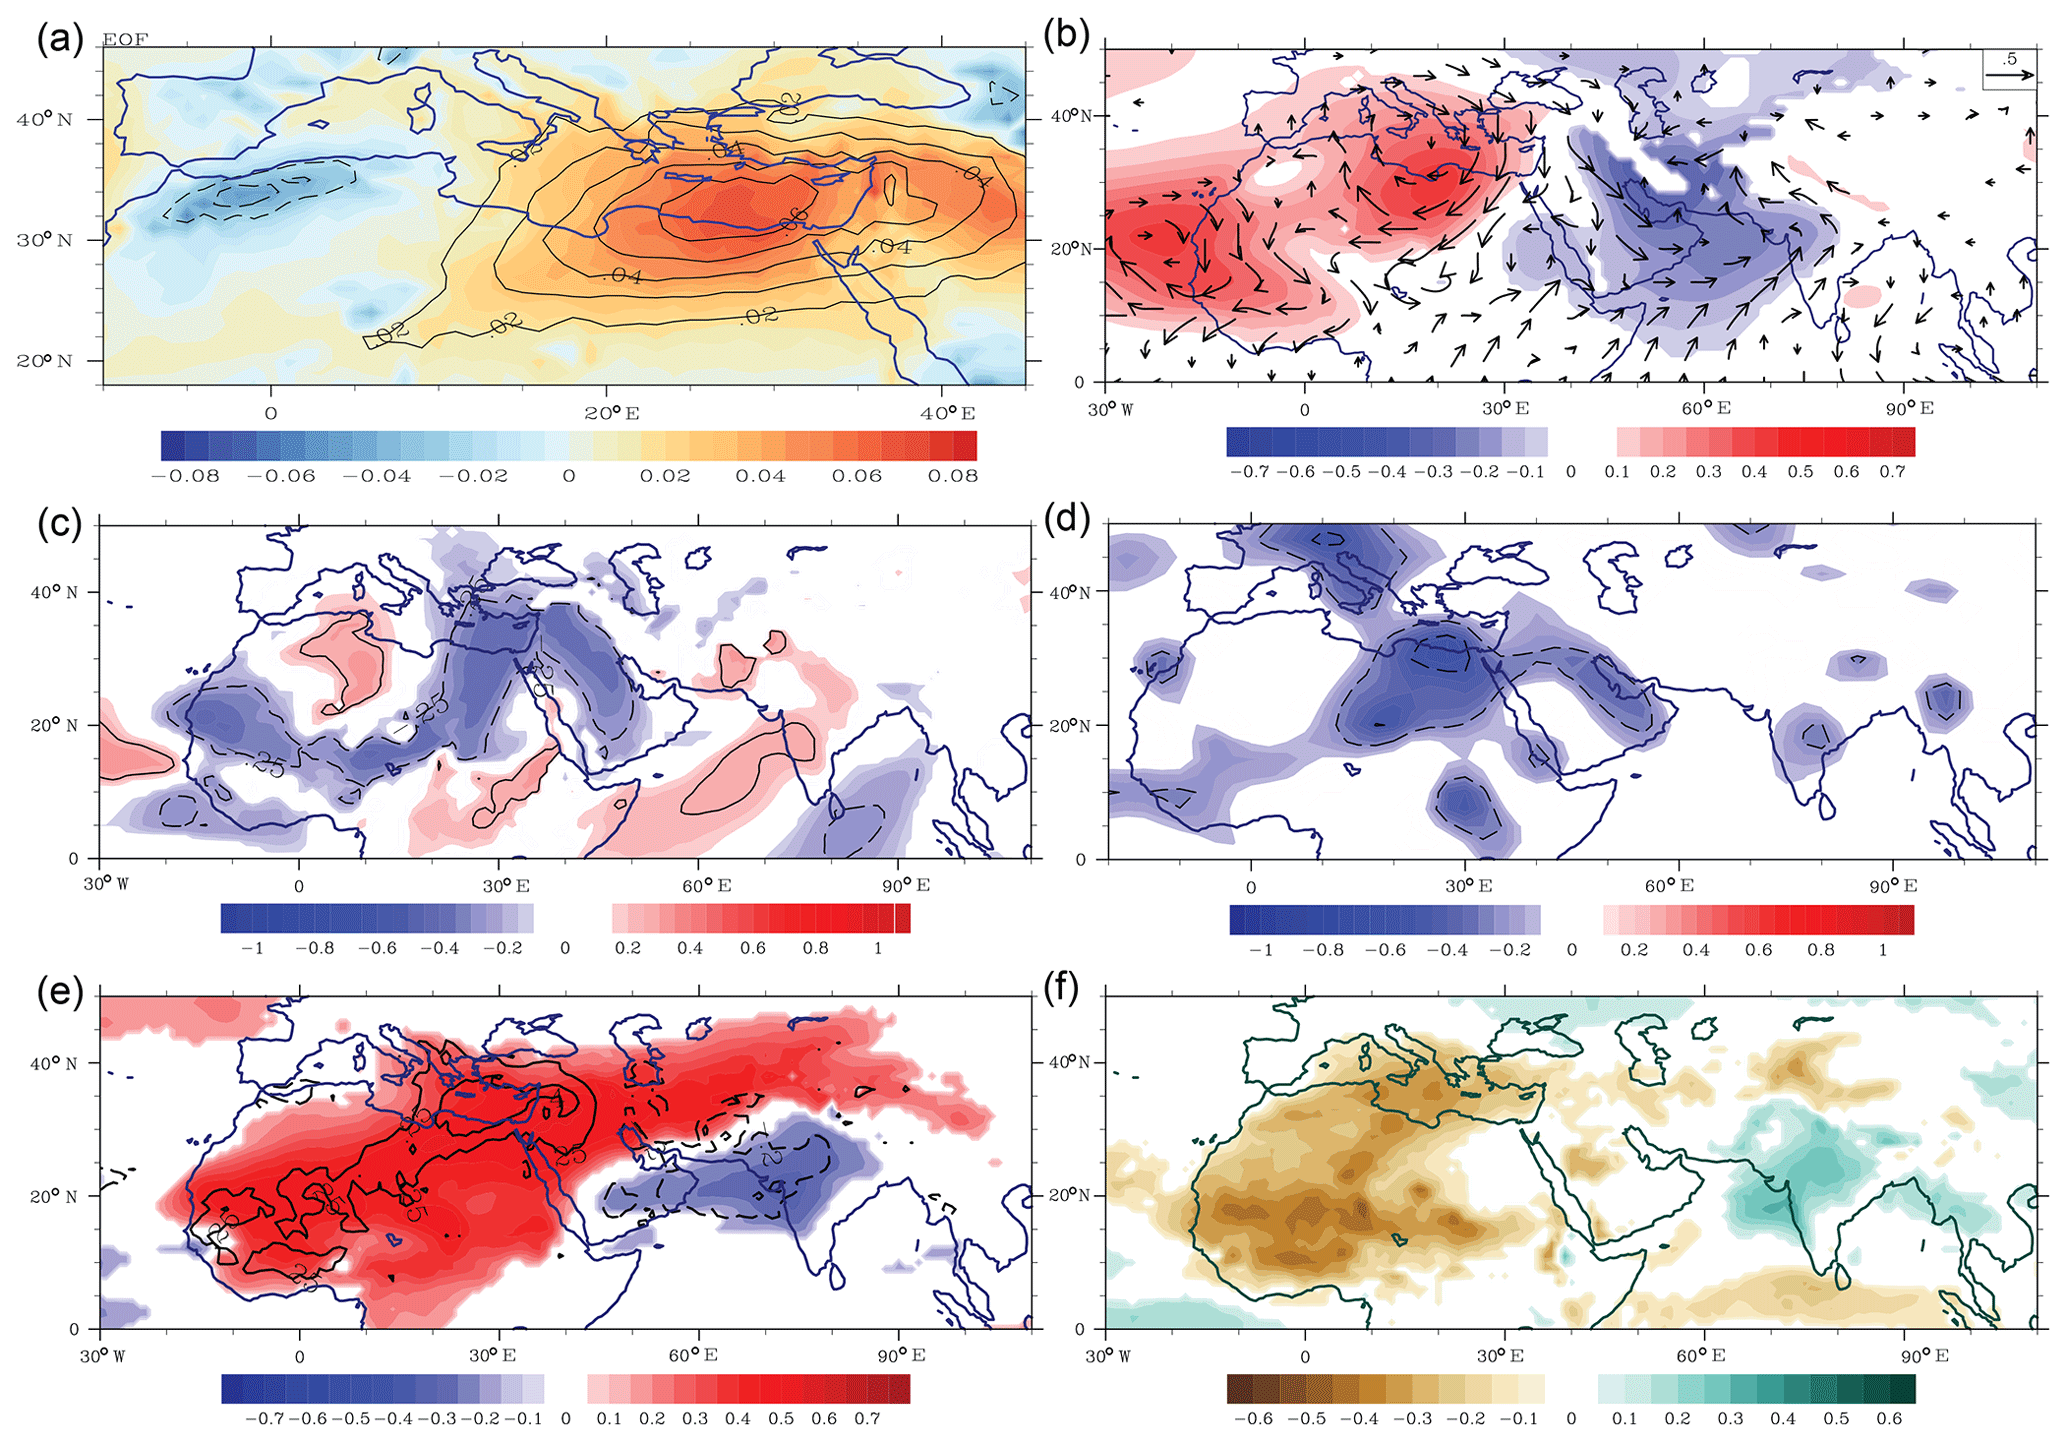
Figure 6(a) First EOF of the vertical velocity at 500 hPa (EOF1 ω, shaded) and at 300 hPa (contours), derived for each level separately and from the monthly means of July in the CTRL run. The time series of the EOF1 ω at 500 hPa are correlated with (b) geopotential height (shaded), the u and v components (shown as vectors) at 850 hPa, (c) meridional wind at 850 hPa, (e) outgoing longwave radiation (shaded), ω at 500 hPa (contours: −0.2, 0.2, 0.4), and (f) precipitation. (d) Correlations derived between the observed (NCEP) ω at 500 hPa over the eastern Mediterranean region (32–34∘ N, 25–30∘ E) and the meridional wind at 850 hPa. Correlations shown for (b), (c), (e), and (f) at the 1 % level, as well as for (d) at the 10 % significance level.
The correlations derived between the ω and monsoon indices (Fig. 6) suggest that the model reproduces the impacts of the Indian summer monsoon (ISM) teleconnection, consistent with previous modeling and observational studies (Hoskins, 1996; Rodwell and Hoskins, 2001; Tyrlis et al., 2013; Ziv et al., 2004; Cherchi et al., 2014). The analysis represents the linkage between the strengthening subsidence over the EMED region and the intensified ISM, depicted here with the negative anomalies of the outgoing longwave radiation (OLR; Fig. 6e), positive anomalies of precipitation in Fig. 6f, and vertically integrated water vapor (not shown) centered over the northwestern coast of India. The intensified ISM is congruent with the intensified heat low over the Arabian Peninsula and the Arabian Sea, as well as the intensified southwesterlies over the Arabian Sea, which feed the monsoon with moisture (Fig. 6b and c). As pointed out previously in Ziv et al. (2004), the linkage also exerts an effect on the surface circulation over EMED by modulating the intensity of the heat low and hence the intensity of the zonal pressure gradient over the Mediterranean and associated regional northerly flow, i.e., the Etesians.
These results suggest that CM2.5 is capable of capturing the most prominent features of the summer climate regime over the eastern Mediterranean. The next section investigates the projected future Mediterranean climate, interpreting this through the prism of the governing factors, i.e., large-scale circulation, local relationships, and teleconnections.
4.1 Comparison of future and present summer climate
CM2.5 projections of future large-scale circulation over the Euro-Atlantic region are largely consistent with those seen in the CMIP3 and CMIP5 simulations. The most prominent feature of the derived changes is a northward shift and strengthening of the North Atlantic meridional SLP gradient. This pattern, manifest as an SLP dipole with cyclonic anomalies centered over Greenland and anticyclonic anomalies centered southwest of the British Isles, is a typical fingerprint of anthropogenic climate change (Collins et al., 2013). The anthropogenic fingerprint closely resembles the CTRL-based SNAO at its positive phase (despite a slight shift northeast of the CRTL SNAO), thereby suggesting a possible contribution of the anthropogenic component towards positive tendencies of the future SNAO, similarly to what was found by Folland et al. (2009) for HadCM3 and HadGEM1.
Figure 7 indicates a very strong warming locally reaching 7 ∘C (in JJA during the whole day) and an intensification of the thermal low over the Sahara, the eastern Mediterranean, and the Arabian Peninsula. The local maximum of the warming, located over the Levant and inland Arabian Peninsula, collocates well with an anomaly of convergent flow and ascending air, expanding from the surface up to mid-tropospheric levels (Figs. 2c and S4) and thereby intensifying the Persian trough. The latter contributes to the weaker subsidence in the eastern Mediterranean and, together with an intensified subsidence over the central Mediterranean, shifts the local maximum of subsidence towards the northwest.

Figure 7Projected future changes for the summer (JJA) (a) sea level pressure (hPa, shaded) as well as the u and v wind components at 850 hPa (m s−1; vectors), (b) surface temperature (∘C), and (c) total precipitation rate (mm d−1) over the period 2061–2099 compared with the baseline period 1961–1999. Changes are derived at the original horizontal resolution.
The projected changes in the circulation over Europe show important differences from the CMIP5 multi-model ensemble of the RCP8.5 scenario (Collins et al., 2013) and the CMIP3 ensemble of the A1B scenario (Giorgi and Lionello, 2008), both in quantitative and qualitative terms. The changes simulated in CM2.5 can be largely described as a transition zone between the intensifying anticyclonic circulation, centered in the vicinity of the British Isles, and the intensifying thermal low over the eastern Mediterranean and the Middle East. Hence the northwestern and central parts, including the central Mediterranean, feature an increase in SLP. Both the increasing SLP in the central Mediterranean and the decreasing SLP in the eastern Mediterranean amplify the zonal pressure gradient in this region and the concomitant Etesian winds. In contrast, the CMIP5 ensemble shows negative SLP anomalies over most of Europe (except the British Isles), which contribute to the weakening of the regional zonal pressure gradient and the associated northerly flow (Collins et al., 2013; Fig. 12.18).
The warming projected in CM2.5 shows a stark gradient between the southwestern and northeastern parts of Europe, which is consistent with the CMIP5 and the EURO-CORDEX ensembles. However, for the latter ones, the gradient is weaker and the minimum of warming shifted northward (see EEA, 2017, Map3.4; Fig. S6), i.e., located over the southeastern Baltic countries. In CM2.5 the minimum of warming is located in the northern Balkans and southeast Europe (Fig. 7b), and it is accompanied by wetting tendencies. For these regions, the projected CM2.5 warming is strikingly weaker compared to other ensemble projections. While CM2.5 projects values falling within 0.5–2.5 ∘C, the ensemble average of combined global and regional circulation model (GCM and RCM) simulations from the EURO-CORDEX initiative (EEA, 2017, Map 3.4, p. 76) projects warming of 3.5–5.5 ∘C. The 10-member RCP8.5 ensemble of the CSIRO-Mk3-6-0 model indicates warming exceeding 6 ∘C (Fig. S5). The warming projected in CM2.5 for regions such as the Iberian Peninsula, southern France, and the southern Balkans varies between 3.5 and 6 ∘C; this is still distinguishably lower than in CSIRO-Mk3-6-0, which projects warming between ∼5.5 and 8 ∘C.
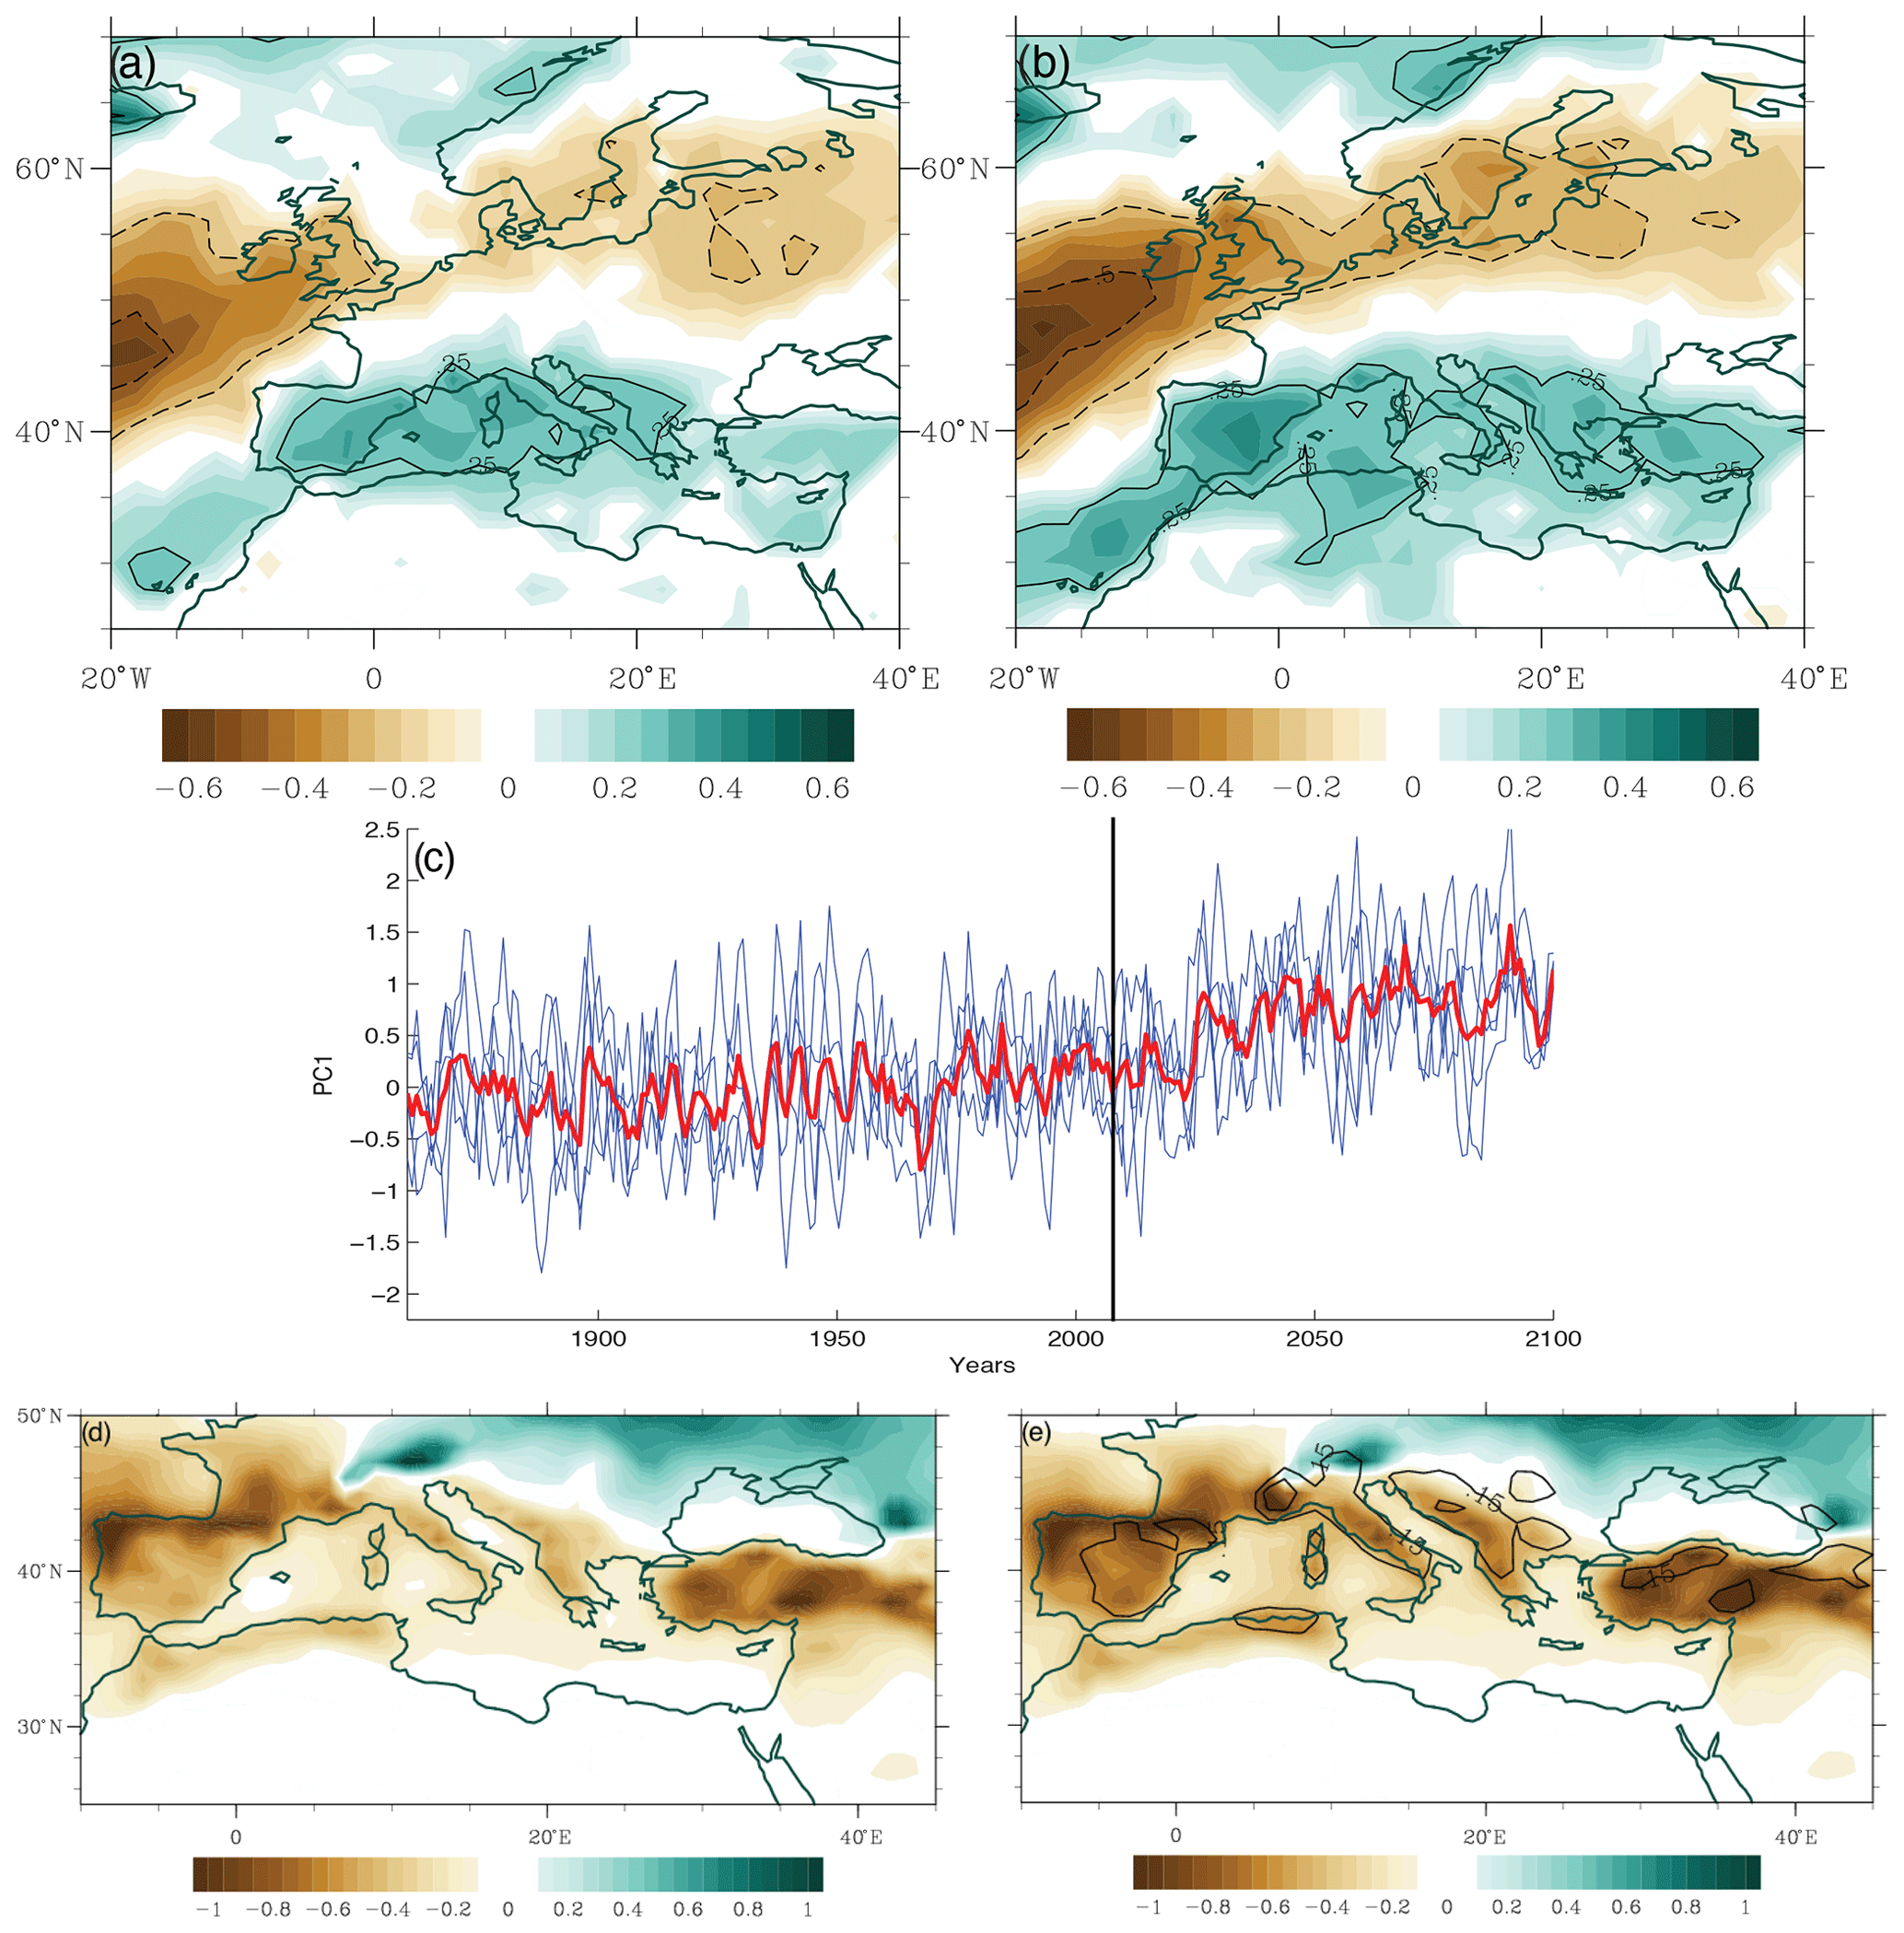
Figure 8(a, b) Correlations (shaded) between the SNAO time series and precipitation in the 1900–1950 (a) HIST runs and 2050–2100 (b) PROJ runs. Contours denote 0.25 and 0.5. (c) Evolution of SNAO SLP time series in the 1850–2100 period for each run (blue) and the ensemble mean (red). The vertical line divides the HIST and PROJ time series. (d, e) Projected future changes in the summer precipitation (mm d−1) (as in Fig. 7c, except estimated at 1∘ horizontal resolution), (d) including SNAO impact and (e) with the impact of the future SNAO removed (shaded). Contours in (e) denote regions where the drying is stronger by 0.15 mm d−1 compared to (d). The impact of SNAO is estimated based on the linear regression between the detrended time series of SNAO and precipitation.
CM2.5 features (Fig. 7c) a sharp transition zone between the drying in southwestern Europe and the wetting in northeastern Europe. However, the gradient in CM2.5, analogously to the temperature change gradient, is much sharper and the wetting tendencies extend southward (down to the northern Balkans) when compared with the CMIP3 and CMIP5 ensemble (EEA, 2017, Map 3.8). Owing to its relatively high resolution, CM2.5 also provides more spatially refined information, which includes, for example, sharper gradients along the coasts and in the mountainous regions. All coastal regions experience reductions in precipitation, expected from the strengthening temperature contrast between the fast-warming land and slower-warming sea. These reductions are especially pronounced along the northwestern coasts of the Iberian Peninsula, where rainfall is typically larger due to incoming North Atlantic storms.
4.2 Future changes in SNAO–Mediterranean teleconnections
Analysis of the 20th and 21st century simulations exhibits long-term changes in the behavior of the SNAO, both in terms of magnitude and pattern. The temporal evolution of the SNAO, depicted as an ensemble average of the HIST + PROJ runs (Fig. 8c), indicates its positive tendencies both in the latter half of the 20th century and the 21st century. However, the trend found for the former period is much weaker and in separate realizations is even hampered by relatively strong interannual to multidecadal variations. This is consistent with the SNAO signal observed in the recent decades, which features rich variability across timescales and a relatively weak positive trend, as described in Sect. 3.2.1. For the latter period (particularly 2040–2100) the trend becomes strong enough to be discernible in every realization.
Further analysis points to the subtle changes in the future spatial pattern of the SNAO. Comparison of the SLP fingerprint between 1960–2010 and 2050–2100 (Fig. 8a and b) indicates a northeastward shift, thereby making the southern lobe of the SNAO located closer to the British Isles. This feature is also consistent with the projected intensification and northeastward shift of the meridional SLP gradient over the North Atlantic (Fig. 7a). The future changes in the SNAO are also discernible in the teleconnection with the European hydroclimate. The comparison of the correlations, derived for the time series of the SNAO component and precipitation anomalies (Fig. 8a and b), indicates a strengthening impact over Europe, i.e., enhanced drying (wetting) in northern Europe and wetting (drying) over southern Europe during the positive (negative) SNAO phase. The changes over the Mediterranean are found mostly over the Iberian Peninsula, the southern Balkans, and Asia Minor, suggesting that the future intensification of the SNAO may play an important role in these regions in moistening and offsetting the drying effects of the anthropogenic changes.
As shown in the previous section, changes in the seasonal precipitation over the Mediterranean (Fig. 7b and c) indicate strong warming and drying. Hence, the key implication of these results is that without the SNAO the future climate drying in the Mediterranean would be even more severe. Figure 8d and e depict the seasonal regional future changes (1961–1999 versus 2061–2099) and the changes without the contribution of the SNAO, which offsets the regional drying. The comparison of the changes indicates that the largest differences are well collocated with the intensified impact of the SNAO (Fig. 8a and b). For example, the average drying would intensify from to −0.65 mm d−1 (∼27 % to 43 %; please note that the relatively large percentage numbers for this region are partly due to very low summertime local average precipitation) for the southeast and central Iberian Peninsula, from to −0.55 mm d−1 (∼10 % to 18 %) over the Balkan coast, and from to −0.8 mm d−1 (∼18 % to 26 %) for parts of Asia Minor if the impact of the SNAO were removed. These differences underline the role of the SNAO in shaping the climate of southern Europe.
These results are consistent with Blade et al. (2012a), who emphasized the role of the SNAO in offsetting the future drying and warming in the Mediterranean. On the other hand, our results do not support the theory proposed by Blade et al. (2012a) that potential deficiencies in the regional impact of the SNAO teleconnection simulated by the CMIP5 model are causing excessive warming and drying in the future projections for the Mediterranean. The impact of the SNAO (in terms of pattern and magnitude) in CM2.5 is almost the same as the one shown for the CM2.1 (Blade et al., 2012a), and yet the former projects substantially less intense warming and drying over southern Europe compared to the latter (Blade et al., 2012a) or to the CMIP3 and CMIP5 ensembles (Collins et al., 2013). Moreover, CM2.5 projections for the northern Balkans and central Europe show wetting tendencies as opposed to the drying projected in the CM2.1 runs and CMIP3/CMIP5 ensembles. For these regions CM2.5 projections also show strikingly weaker warming (∼0.5 to 2 ∘C) compared to the CSIRO-Mk3-6-0 ensemble (∼6–7 ∘C, Fig. S5) or EURO-CORDEX initiative (∼3.5–5.5 ∘C; EEA, 2017). However, the impact of the SNAO (observed and simulated in CM2.1 and CM2.5) in these regions is very small or negligible, suggesting that other factors might be responsible for these discrepancies.
4.3 Future changes in the summer regime of the eastern Mediterranean
This section focuses on future changes in the key local features shaping the regime of the EMED climate. This includes an analysis of the stationarity of the local linkage between the low- and mid- to upper-tropospheric dynamics as well as the influence of local surface warming on the surface circulation.
4.3.1 Changes in the local linkage shaping the EMED climate regime
Figure 9 compares the HIST and the PROJ five-member ensemble average of the correlations, derived between the regional mid-tropospheric subsidence and the indices of the surface circulation. The comparison of the correlations, which represent the dynamical linkage governing the present and future climate regime over EMED, exhibits qualitative and quantitative differences. For the future period, the correlations estimated for the regional surface pressure systems (Fig. 9b), the concomitant zonal pressure gradient, and the surface northerlies (i.e., the Etesians; Fig. 9d) are substantially weaker, e.g., by more than a factor of 2 (from ∼0.7 to ∼0.3), for the regions of Levant and the Persian Gulf. Figure 9c and d also show that for some regions of North Africa the linkage almost vanishes. This is consistent with the radically reduced correlations estimated for water vapor and precipitation (from ∼0.4–0.5 to ∼0) over the African monsoon region (Fig. 9e and f), which largely depends on the influx of moisture transported with the northerly flow over EMED and North Africa.
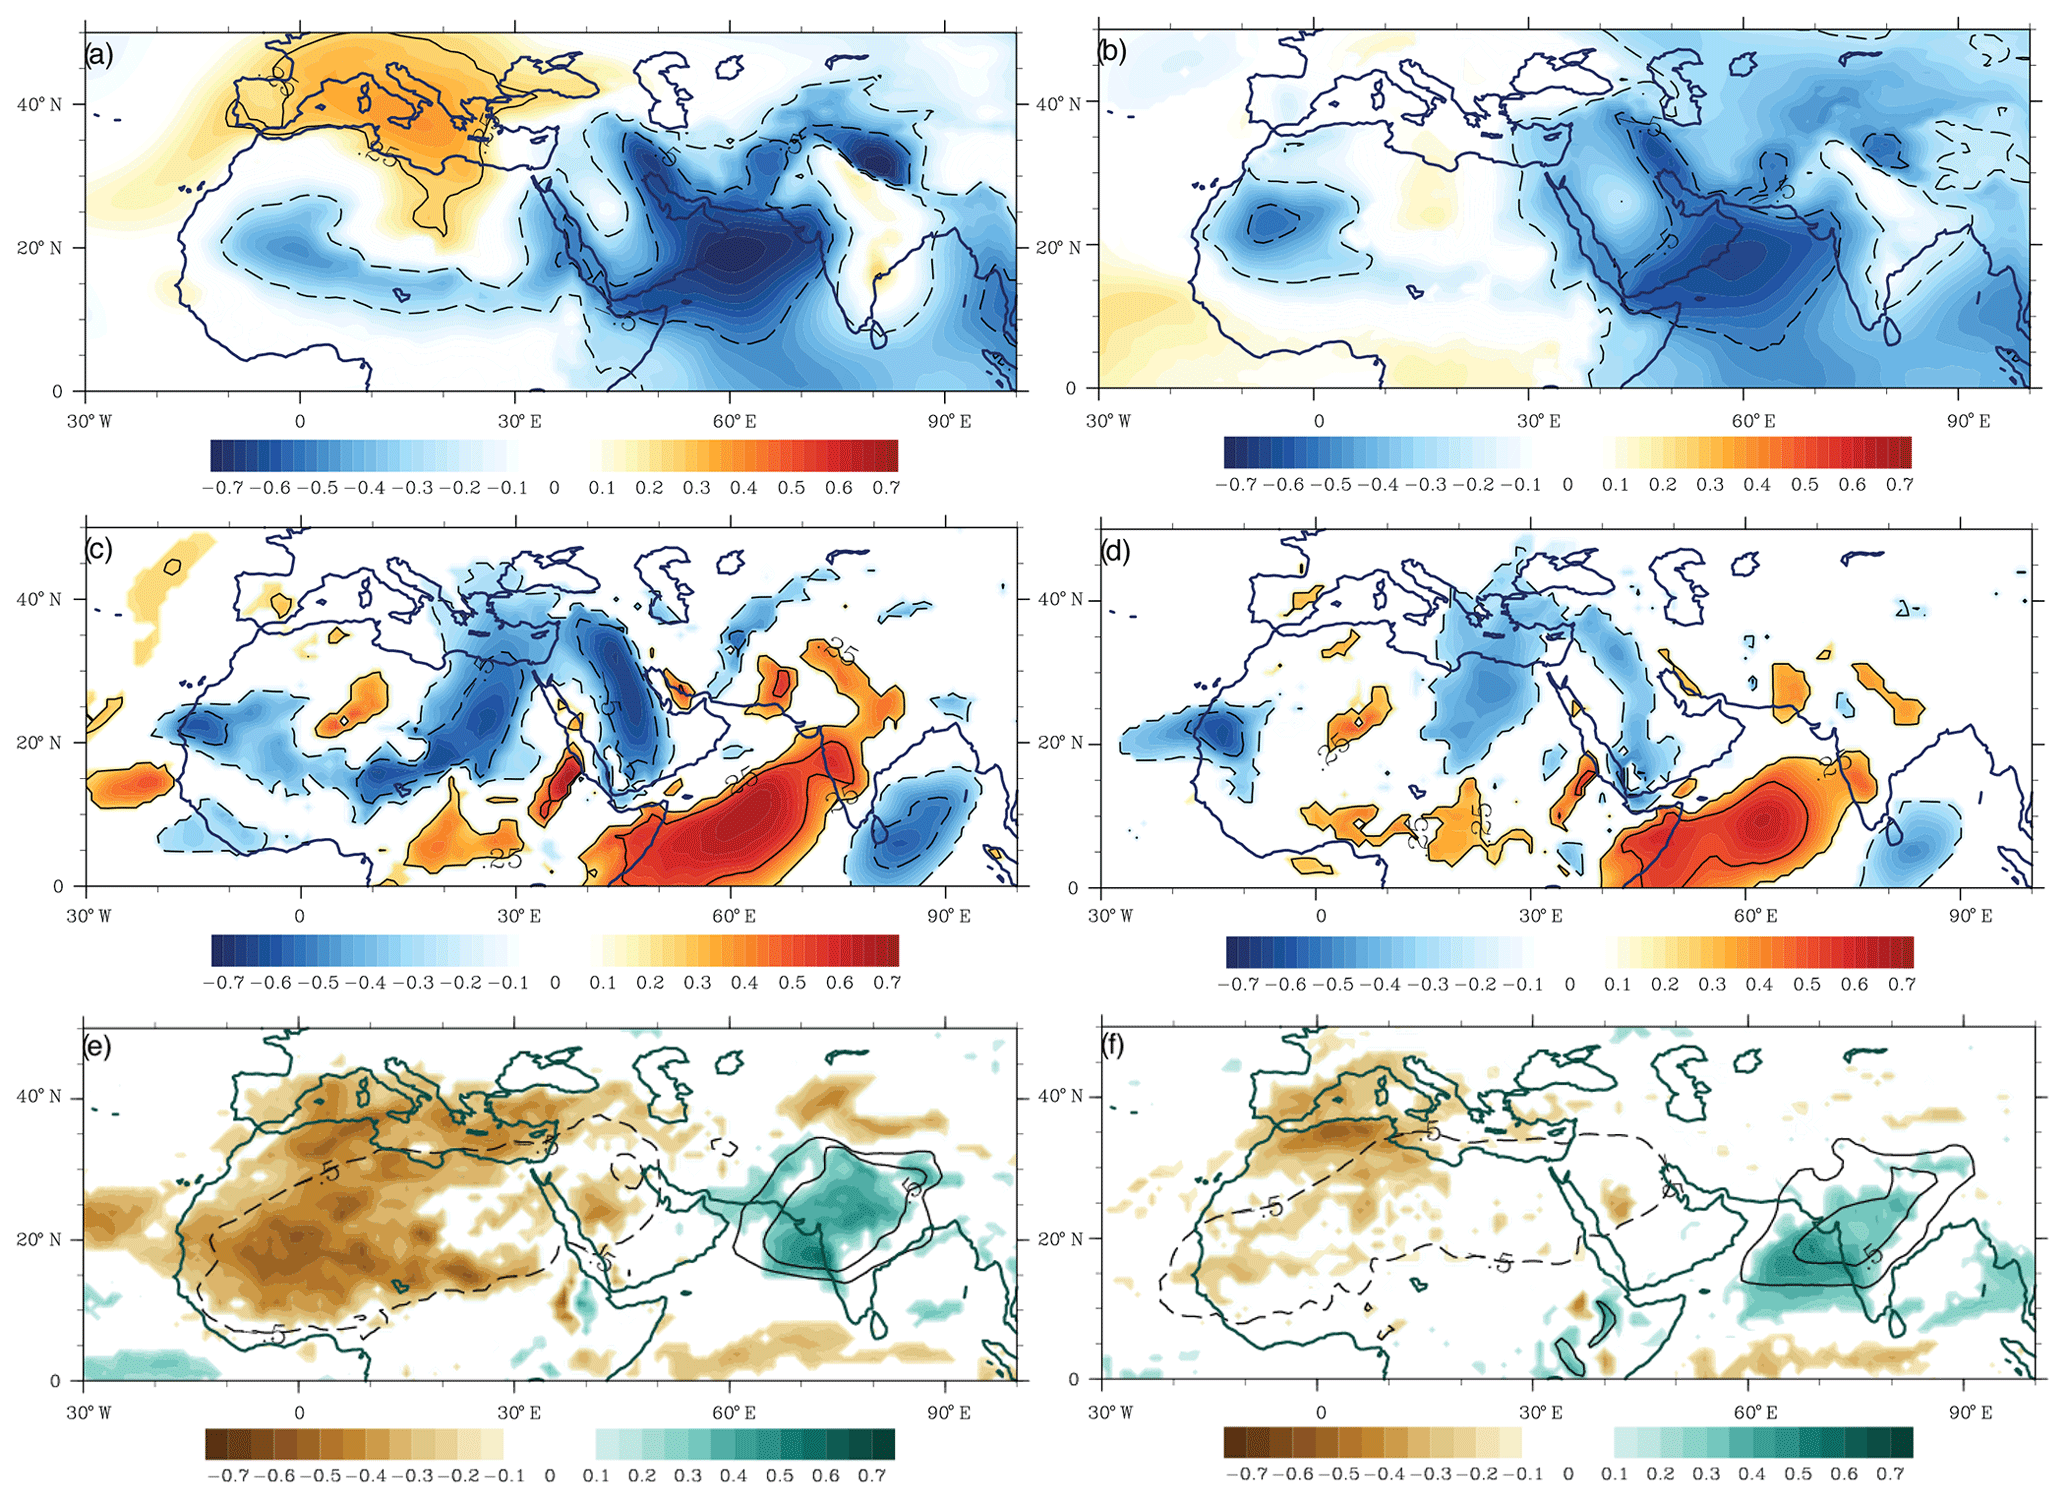
Figure 9Correlations between the PC1 time series of ω at 500 hPa in July and surface atmospheric circulation in the periods (a, c, e) 1960–2010 and (b, d, f) 2050–2100. Correlation values are estimated for (a, b) SLP (shaded and contours), (c, d) meridional wind (shaded and contours), (e, f) precipitation (shaded), and vertically integrated water vapor (contours for the values −0.5, 0.3, 0.5). For (a)–(d) contours are shown for 0.25 and 0.5 correlation values.
On the other hand, correlations between the EMED subsidence and ISM indices (July), i.e., precipitation and column-integrated water vapor (Fig. 9e and f), do not show quantitative differences. The patterns derived for both variables are slightly shifted towards the southwest in the future period, which is consistent with the changes in the atmospheric circulation supplying the ISM with moisture.
These results suggest a pronounced weakening of the local linkage between the mid- and upper-tropospheric subsidence and surface circulation over the EMED. Moreover, given that the local linkage serves as a “medium path” for the teleconnection between the ISM and surface circulation over EMED, future weakening of the local linkage will most likely diminish the impact of this teleconnection on the EMED surface circulation. On the other hand, the projected intensification of the heat low over EMED, North Africa, and the Middle East points to an increasing role of the warming over the arid surfaces. Thus, in the following section, we explore apparent nonlinearities in the summer climate regime of the eastern Mediterranean associated with the local surface temperature.
4.3.2 Nonlinear dependency of the local linkages between the low-tropospheric and the mid-tropospheric dynamics and their contributions to the thermal balance over EMED
In this section, we focus on the impacts of the warming local surface temperature on the low-level circulation, including the linkage between the low-level and mid-tropospheric dynamics over EMED. The analysis uses the CTRL run, which excludes the time-varying anthropogenic climate forcing and hence allows us to focus on the natural variability of the system and nonlinear interactions that would be difficult to statistically calculate in shorter HIST runs. As described in Sect. 2, we analyze two samples with 300 cases of the lowest and highest monthly mean temperature in July, with respect to the mean surface temperature over the EMED region.
The following analysis compares the strength of the local linkage between the mid- and upper-tropospheric subsidence over EMED derived for the sample with the cold and warm temperatures, much as was done in the previous section comparing recent historical and future periods. The comparison, consistent with the results shown in the previous section (Fig. 9), indicates a radical weakening of the linkage derived between the mid-level subsidence over EMED and the zonal surface pressure systems over the central and eastern Mediterranean, Etesian winds and their extension over North Africa and the Persian Gulf, and precipitation over the Sahel (Fig. S6).
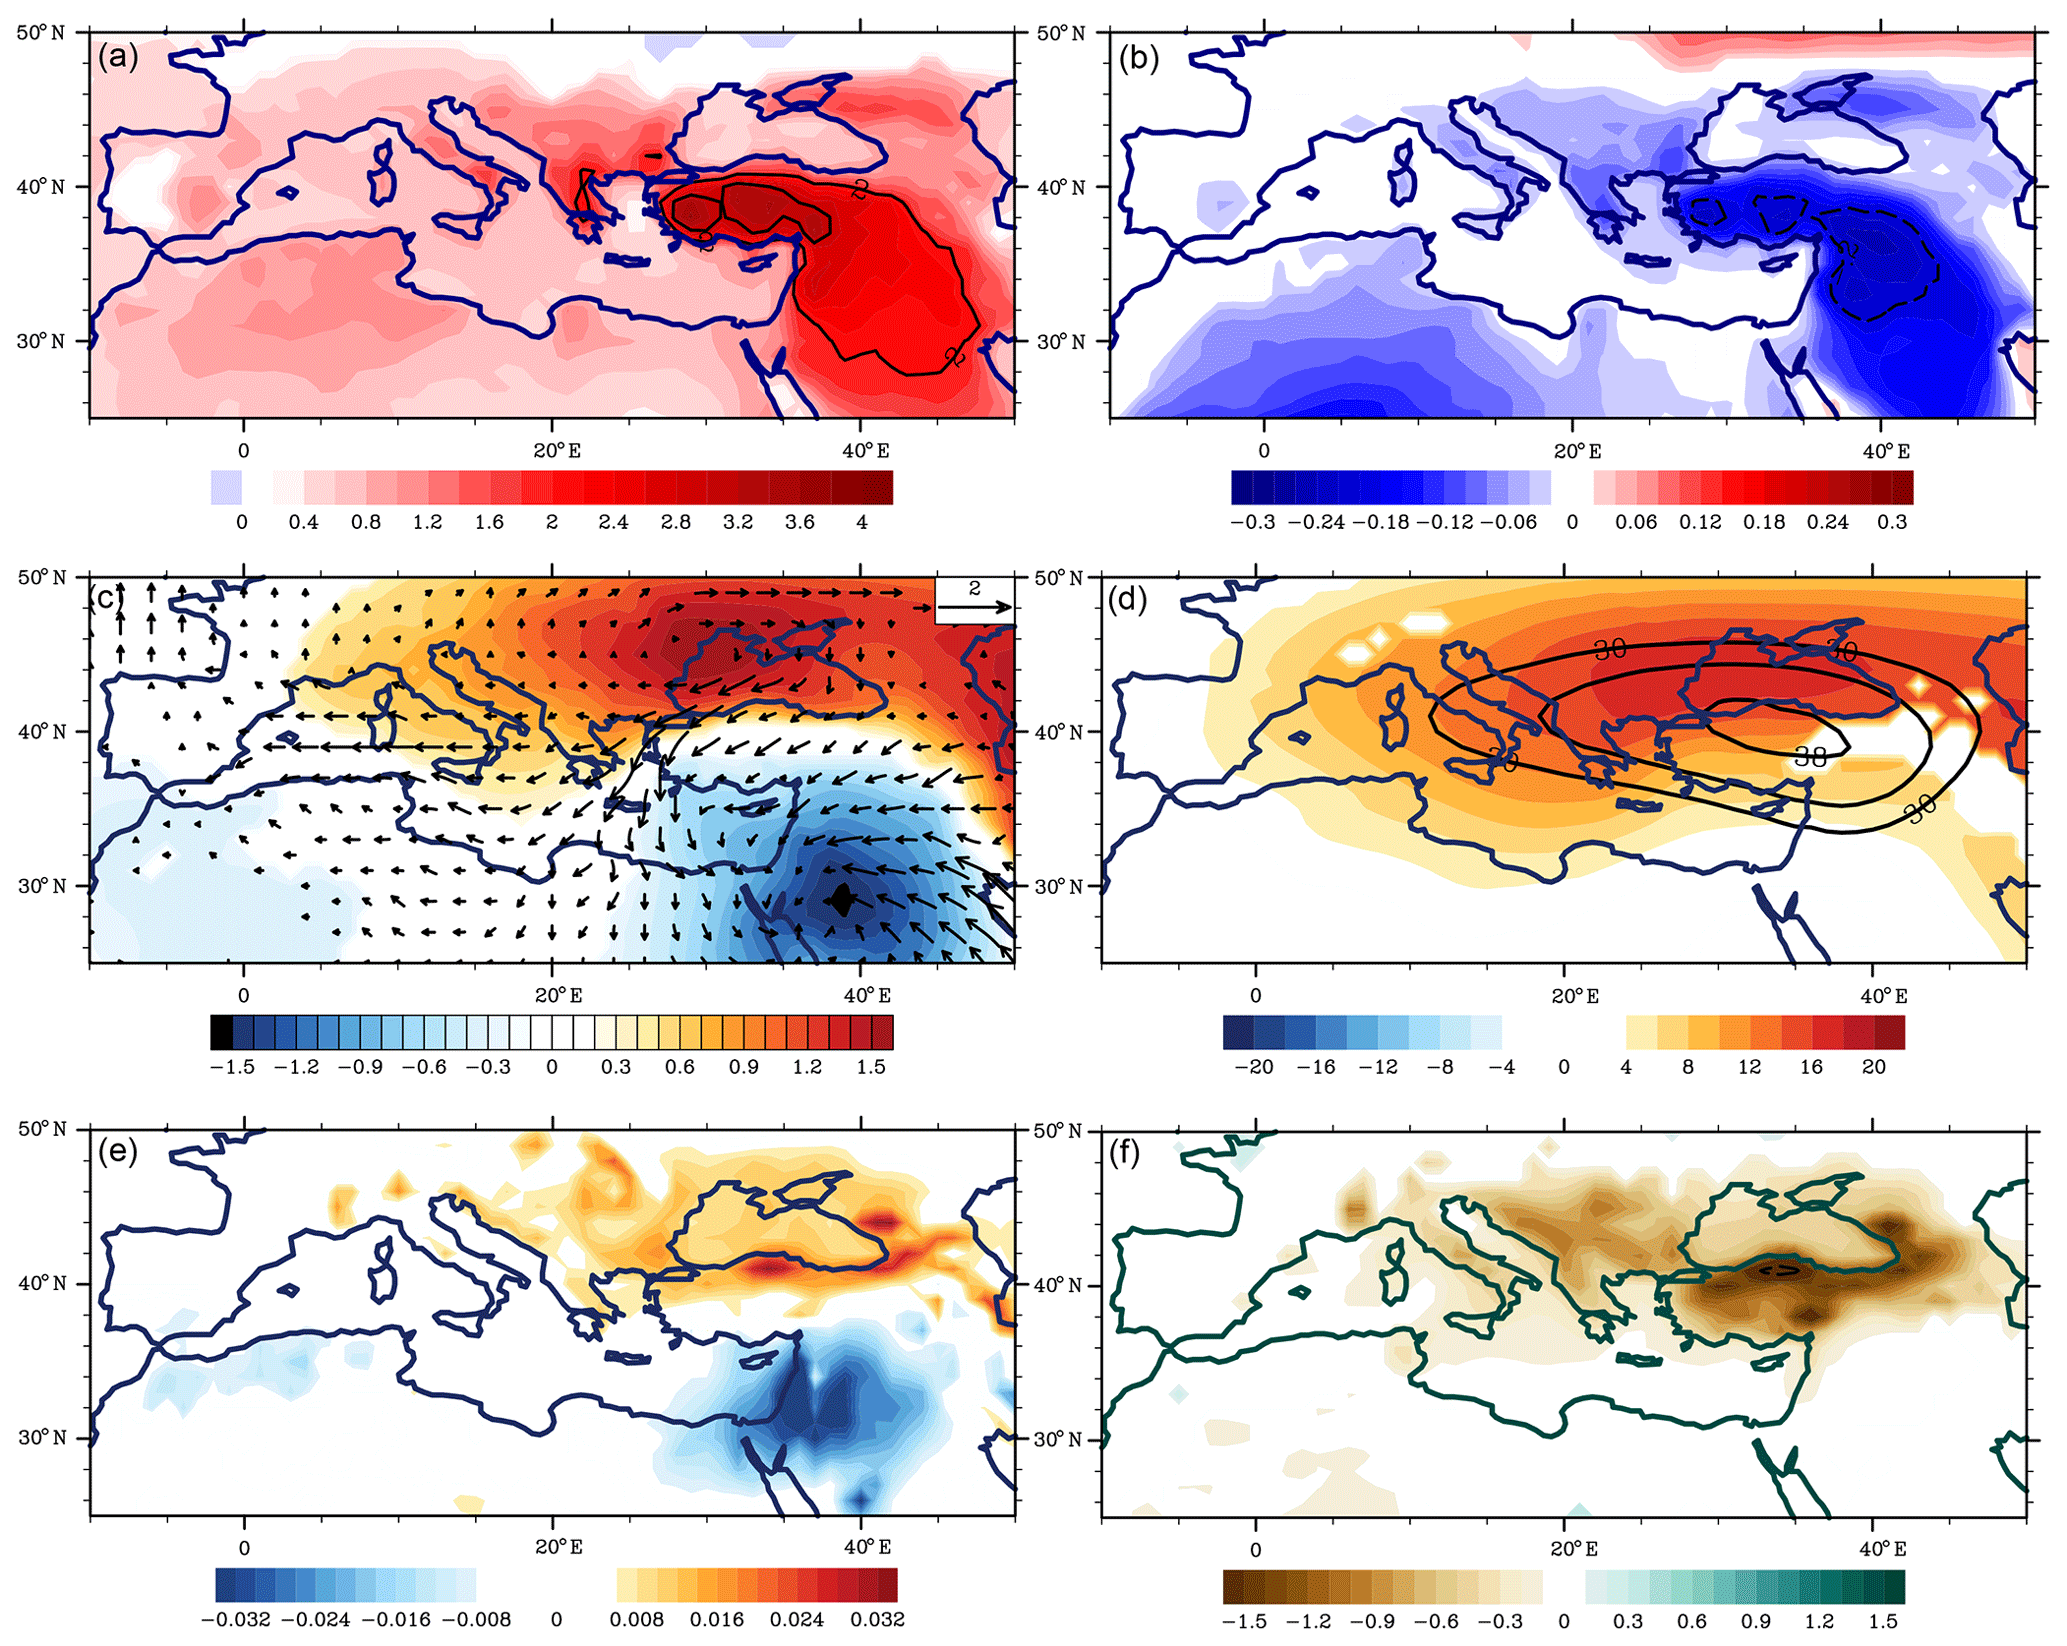
Figure 10(a) Composite differences between the sample with the 300 warmest and 300 coolest seasons over the eastern Mediterranean (30–36∘ N, 36–42∘ E) for July in the CTRL run, derived from (a) surface temperature (∘C), associated differences in (b) relative humidity, (c) SLP (hPa), and vector wind at 850 hPa (m s−1), (d) height at 850 hPa (shaded) and 500 hPa (contours), (e) ω at 500 hPa, and (f) precipitation (mm d−1).
Further analysis shows the influence that the warming land over the eastern Mediterranean exerts on the local circulation. Figure 10 depicts the response of the summer Mediterranean climate to the surface warming over EMED, estimated with composite differences between the two samples (high temperature minus low temperature), in terms of temperature, relative humidity, pressure and wind vector, geopotential height at 500 and 800 hPa, ω at 500 hPa, and precipitation. The response (Fig. 10c) features bipolar SLP anomalies, with a low-pressure anomaly over North Africa, EMED, and the Middle East and a high-pressure anomaly centered over the northern Balkans and the Black Sea. The intensified heat low over the EMED and the Arabian Peninsula (Fig. 10c) is in congruence with the enhanced convergence in these regions and the reduced subsidence at the low- and mid-tropospheric levels at 500 hPa (Fig. 10e) and 700 hPa (not shown). At the same time, the positive SLP anomalies (Fig. 10c) and the increased subsidence over Asia Minor and the Black Sea are physically consistent with increased adiabatic warming and stability, which are reflected in the maximum of warming and the reduced relative humidity and precipitation (Fig. 10a, b, and f). The derived bipolar SLP anomaly also intensifies the zonal pressure gradient over the central and eastern Mediterranean, which directly translates into intensified Etesian winds (Fig. 10c).
The analysis repeated for the July–August season yields similar results, although with a reduced magnitude due to a weaker signal in June and August (Fig. S7). The analysis repeated for the response to the warming over the domains extending towards the southern parts of the central and western Mediterranean (Fig. S8a and b) yields qualitatively similar results (i.e., the bipolar SLP anomalies), but with an increased magnitude of the response over the southwestern Mediterranean. On the other hand, the analysis repeated for the warming regions confined to the Levant, Arabian Peninsula, and Asia Minor and the Black Sea (30–50∘ E, 30–45∘ N; Fig. S8e) shows a pattern with the response (anticyclone anomaly) intensified towards the Middle East. The most similar results are obtained, qualitatively and quantitatively, when the region is confined to the same latitudes but slightly extending towards the east and west (30–50∘ E, 30–36∘ N; Fig. S8c), i.e., centered over the Levant and northern parts of the Arabian Peninsula.
Our analysis indicates that the dynamical regime over the EMED largely depends on the local temperature. During relatively cool years the dynamical relationship between the low-level Etesian winds and the mid-level subsidence, which maintains the local temperature balance, seems to be much stronger. During warmer years, this relationship is weaker, which is likely due to the local response in surface circulation triggered by the warming land. The response (i.e., an intensifying heat low, anomalous convergence, and very pronounced ascending motion at the low levels and mid-levels of the EMED and Arabian Peninsula; intensified zonal pressure gradient and Etesians; strong drying over Asia Minor and the southern Balkans) is consistent with the anthropogenic changes projected over the Mediterranean (in JJA: Figs. 7a–c, S4a, c, and e; in July: Fig. S4b, d, and f). Overall, this suggests that the importance of the local atmospheric responses, driven by the warming land surface, will have an increasing influence on the future climate of the Mediterranean region.
The analysis, however, does not explain the processes involved in the dipole-like response in the circulation, which comprises SLP, winds, and ω anomalies north from the EMED region (particularly Asia Minor and the Black Sea). One might suspect that, in response to warming over the EMED, the anomalous convergence and ascending motion over the EMED would trigger a seesaw connection with northward-located regions. This link could stem from the interactions of the anomalous warming and upward velocity anomalies with the seasonally varying descending branch of the Hadley cell over EMED, in result expanding it towards Asia Minor. Testing this hypothesis requires more elaborate analysis and could be the objective of future research.
Based on state-of-the-art future projections (CMIP3 and CMIP5 generation) the Mediterranean has been identified as a climate change hot spot (Giorgi and Lionello, 2008), not only due to the sensitivity of its climate to the anthropogenic forcing but also due to the socioeconomic vulnerability of the local societies. Yet the projected changes are not fully reflected in the observations for the second half of the 20th century. While the derived anthropogenic fingerprint suggests strong warming and drying during the summer, the observations indicate opposite wetting tendencies for some regions – in the vicinity of the Black Sea and off the Balkan coast. This discrepancy may stem from the fact that the Mediterranean climate features abundant cross-scale variations, which at present dominate the anthropogenic signal. But there can be other reasons for this inconsistency, i.e., deficiencies in model representations of land–atmospheric feedbacks (as mentioned above) or deficiencies in capturing the impacts of certain teleconnections.
The former has been shown to cause an overestimation of the projected future summer warming and drying in most CMIP3 and CMIP5 models (Christensen and Boberg, 2012; Mueller and Seneviratne, 2012), particularly in the Mediterranean as well as central and southeast Europe (Diffenbaugh et al., 2007; Hirschi et al., 2011; Seneviratne et al., 2006). The coincidence of the amplified drying and warming in these regions has been explained through a “terrestrial branch” of soil moisture–atmosphere interactions (Guo et al., 2006; Dirmeyer, 2011; Berg et al., 2015), which cause negative correlations of precipitation and temperature over land in summer. For example, lower precipitation leads to a reduced soil moisture and latent heat flux, thereby increasing sensible heating at the surface and near-surface air temperatures.
Deficiencies in capturing the impacts of certain teleconnections have been suggested to incapacitate CMIP3/CMIP5 models in offsetting projected future regional drying and hence to spuriously exaggerate regional warming and drying (Blade et al., 2012a). Obtaining realistic future projections for this region requires not only refined spatial scales, but also a realistic balance between the contributing impacts of local land–atmosphere feedbacks, large-scale circulation, and teleconnections. In this study, we use the high-resolution CM2.5 climate model integrations to analyze the projected future changes in temperature and precipitation over the Mediterranean and discern between the role of the simulated SNAO teleconnections and the local impacts of the warming land surface and associated land surface–air interactions.
Our analysis demonstrates the high ability of the CM2.5 model to reproduce key large-scale and regional features shaping the complex summer Mediterranean climate, thereby highlighting the advantages of the employed high spatial resolution. The model accurately captures the spatial features and magnitude of the subtropical mid-tropospheric anticyclone extended between the Levant and South Asia, as well as the low-tropospheric zonal pressure gradient between the subtropical North Atlantic anticyclone and the massive Asian monsoon heat low. The pressure gradient, manifested in the Mediterranean as a complex structure of northerly winds, i.e., the Etesians, is resolved in the model with great detail including the distinguishable branch over the Aegean Sea and its southward extension toward the Sahel region, as well as the one over the Persian Gulf. The mean precipitation, which features an exceptional spatial complexity in the Mediterranean, is represented with a much higher degree of realism when compared with the low-resolution CM2.1, for example.
Furthermore, we find that CM2.5 faithfully reproduces the most prominent pattern of atmospheric variability over the North Atlantic, i.e., the North Atlantic Oscillation, and its impact on the Mediterranean hydroclimate. In the simulations and observations, SNAO emerges as a leading EOF component, explaining ∼34 % and ∼28 % of the total variance over the analysis domain, respectively (Folland et al., 2009). Remarkably, the simulated pattern corresponds better to the observed one before the 1970s rather than for the more recent decades. Moreover, the simulated impact of the SNAO on the Mediterranean hydroclimate is more consistent with the century-long observations (1900–1998, 1900–2007; Folland et al., 2009) than the most recent decades of observations (1950–2010 in Blade et al., 2012a). For example, the impact on precipitation and surface temperature derived with the shorter dataset is relatively high (the magnitude of correlations reaches up to 0.5–0.6), but with significant results confined mostly to the Balkans and Italy. In contrast, the correlations derived for the century-long precipitation record are of lower magnitude (i.e., lower than 0.45), but they are significant over most parts of the Mediterranean, as shown in Folland et al. (2009). The study mentioned above also explains that the impact of SNAO is to some extent shaped by its low-frequency variations that may have partly originated from anthropogenic forcing. This forcing contributes to a smaller extent in the observational record before the 1950s and is also not included in the CM2.5 control run. Hence, the apparent ambiguity of the observed SNAO impacts may stem from the varying-in-time importance of the low-frequency and high-frequency factors that shape the SNAO in the 20th century (as highlighted by Linderholm and Folland, 2017), though this issue still requires further investigation. Further analysis of the CM2.5 runs also shows that the impacts of the SNAO teleconnection on the Mediterranean precipitation are comparable with those simulated with previous-generation models, such as HADCM3 (Blade et al., 2012a). The impacts simulated with CM2.5 are also indistinguishably different from those captured in the GFDL CM2.1 runs (i.e., the low-resolution predecessor of CM2.5), except the region of Asia Minor, where CM2.1 does not capture the significant impact of SNAO.
Moreover, the model skillfully captures the linkage between the low-level northerly flow and the mid- and upper-tropospheric subsidence over the eastern Mediterranean. These two factors have counteracting effects on the regional temperature, hence playing an important role in maintaining the local temperature balance. Therefore, their linkage is the key feature that shapes the summer climate for the eastern Mediterranean. Additionally, the derived correlations between the mid- and upper-tropospheric subsidence over the Mediterranean and the indices of the Indian summer monsoon are consistent with the monsoon–desert mechanism (Rodwell and Hoskins, 1996; Tyrlis et al., 2013).
Overall, our analysis of the CM2.5 control run confirms the capability of the model to simulate key components of the regional climate, in particular the SNAO teleconnection, and the local linkage between the surface and upper-level dynamics in the Mediterranean summer regime. This allowed us to further investigate the regional future changes through the prism of the evolution of these two factors.
The CM2.5 projections of large-scale climate changes over the Euro-Atlantic region are largely consistent with the CMIP5 ensemble projections. The projected changes in large-scale circulation, i.e., the expansion of the Hadley cell and the intensification and northward shift of the atmospheric meridional cells, constitute a typical anthropogenic fingerprint of the future changes over the North Atlantic (e.g., Collins et al., 2013; Folland et al., 2009). Consistent with the previous CMIP projections (e.g., Collins et al., 2013), these changes are reflected in the strengthening of the SNAO towards its positive phase (Blade et al., 2012a; Folland et al., 2009). For Europe, CM2.5 projects drying over the subtropics (southern Mediterranean) and wetting of the midlatitudes (northern Europe), which is consistent with the previous generations of the models and explained by the “wet-get-wetter and dry-get-drier” mechanism (Held and Soden, 2006; Seager et al., 2010).
Nonetheless, the CM2.5 projections show distinguishable differences in the large-scale atmospheric circulation patterns of the future changes and a higher complexity of the derived temperature and precipitation changes over Europe when compared with the CMIP3 and CMIP5 ensembles. Importantly, CM2.5 simulations imply less radical magnitudes of warming over most of Europe, fewer regions and smaller magnitudes of drying anomalies, and larger areas with wetting anomalies. For example, the CMIP ensembles feature negative SLP tendencies over most of Eurasia, including an intensification of the heat low over the Mediterranean in contrast with the CM2.5 projections featuring negative SLP tendencies over the Mediterranean and positive SLP tendencies over western and central Europe. As a consequence, the former rather indicates a weakening of the atmospheric circulation over the Mediterranean, while the latter indicates a strengthening zonal SLP gradient and hence stronger northerly flow, i.e., Etesian winds, in this region.
Regarding the precipitation changes, CM2.5 simulates a sharp gradient between drying over southwest Europe, including most of the Mediterranean, and wetting over northeast and central Europe, including the Alps and northern parts of the Balkans. This feature distinguishes CM2.5 from the previous CMIP runs, which mostly project strong drying over all of Europe except Scandinavia, as depicted, for example, in the CSIRO-Mk3-6-0 model ensemble (Fig. S5).
Consistent with the previous CMIP ensembles, CM2.5 also projects a strong gradient between warming in southwestern Europe and weaker warming in northeastern Europe. The regions of North Africa and the Levant feature the maximum of warming (locally reaching 8 ∘C over summer) in the Mediterranean, while the Iberian Peninsula and central parts of the region (i.e., southern France and Italy) show slightly lower values, i.e., 4–6 ∘C. Nevertheless, the warming projected in CM2.5 is much less radical when compared to the CMIP3 (Dubrovsky et al., 2014) and CMIP5 (Collins et al., 2013) ensembles, as well as the high-resolution EURO-CORDEX GCM–RCM RCP8.5 multi-model ensemble (EEA, 2017; Jacob et al., 2014). This discrepancy is particularly distinguishable for the northern Balkans and southeastern Europe, where CM2.5 shows a minimum warming of 0.5–2.5 ∘C, while the other ensembles indicate a warming of 3.5–5.5 ∘C or stronger.
The very intense warming and drying over Europe projected in the CMIP ensembles has been linked to a temperature-dependent warm summertime bias caused by deficient representations of moisture–temperature feedbacks in most CMIP3 and CMIP5 models (Christensen and Boberg, 2012; Mueller and Seneviratne, 2012; Boberg and Christensen, 2012). On the other hand, Berg et al. (2016) and Milly et al. (2014) demonstrated that the representation of soil moisture and land–atmospheric feedbacks between soil moisture and precipitation in the LM3 model, used in CM2.5, is significantly improved. Moreover, the atmosphere–land interactions have been shown to play an important role in the future summer climate, in particular over central and southeastern Europe (Seneviratne et al., 2006; Diffenbaugh et al., 2007; Hirschi et al., 2011). In conclusion, the improvements in the land model incorporated in CM2.5 at its high spatial resolution are responsible for the stark contrast between the CMIP3/CMIP5 and CM2.5 regional projections (i.e., less intense warming and drying over Europe, including the minimum of warming and wetting tendencies in southeastern Europe). These feedbacks should be explored in more detail in future work using targeted experiments like the Global Land–Atmosphere Coupling Experiment (Seneviratne et al., 2013), but they lie outside the scope of this paper.
Consistent with previous studies (Blade et al., 2012a; Folland et al., 2009), we show that the SNAO may play a role in counterbalancing the projected drying over the Mediterranean. This is due to the projected strengthening of the SNAO towards its positive phase, which is manifest in the positive anomalies of precipitation (wetting) over large parts of the region. Nevertheless, our analysis also shows that (a) the representation of the regional SNAO impacts and (b) the projected future evolution of the SNAO are almost the same in CM2.5 and its low-resolution predecessor, i.e., the CM2.1 model, as well as other previous-generation models. Hence the SNAO teleconnection does not seem to be a strong candidate for explaining the differences in the future projections for the summer European climate between the CM2.5 and CMIP3/CMIP5 ensembles.
Moreover, the future changes in the eastern Mediterranean climate regime projected in CM2.5 suggest a weakening role of atmospheric dynamics in maintaining the regional hydroclimate and temperature balance. We found a weakening of the linkage between the low-level circulation (e.g., northerly Etesian winds) and the mid- and upper-level subsidence over the eastern Mediterranean, which are responsible for the regional temperature balance. This change, as additional analysis shows, can be explained by the emerging local response of surface circulation triggered by the warming land. The response (i.e., an anomalous intensification of the heat low over the EMED, Sahara, and the Persian trough; anticyclonic anomalies, increasing subsidence, and drying over the central Mediterranean; an intensified zonal pressure gradient and Etesian winds) is consistent with the projected CM2.5 climate change. This supports the concept that atmospheric responses driven by warming surface temperatures will become a more prominent factor shaping the future Mediterranean climate.
Overall, our analysis indicates very profound climate changes for the Mediterranean region in the summer, although they do not seem to be as radical as projected by the previous-generation models. The differences between CM2.5 projections of future changes and those of previous-generation models point to the role of factors such as land surface–atmospheric interactions, in particular over central and southeastern Europe, rather than large-scale atmospheric dynamics and teleconnections. This highlights the importance of the ability of future-generation models to capture local land–atmospheric interactions.
The GFDL CM2.5 model code is publicly available at https://www.gfdl.noaa.gov/cm2-5-and-flor-quickstart/ (Delworth et al., 2006). Analysis scripts are available on request from the corresponding author.
The supplement related to this article is available online at: https://doi.org/10.5194/esd-11-161-2020-supplement.
All authors contributed to the idea and scope of the paper. MJB performed the analyses and wrote the paper. SBK, LK, SR, AC, and CKF provided help with data analysis, discussed the results, and contributed to the writing of the paper. SBK provided help with data access and collection.
The authors declare that they have no conflict of interest.
The authors are grateful to Ileana Blade, Fred Kucharski and Eduardo Zorita, Salvatore Pascale, and Baoqiang Xiang for helpful comments and discussions.
This paper was edited by Stefan Dekker and reviewed by two anonymous referees.
Alessandri, A., De Felice, M., Zeng, N., Mariotti, A., Pan, Y., Cherchi, A., Lee, J. Y., Wang, B., Ha, K. J., Ruti, P., and Artale, V.: Robust assessment of the expansion and retreat of Mediterranean climate in the 21st century, Sci. Rep., 4, 7211, https://doi.org/10.1038/srep07211, 2014.
Allan, R. and Folland, C. K.: Atmospheric circulation. 1. Mean sea level pressure and related modes of variability – In: State of the Climate 2017, B. Am. Meteorol. Soc., 99, S39–S41, 2018.
Barcikowska, M., Knutson, T., and Zhang, R.: Observed and simulated fingerprints of multidecadal climate variability, and their contributions to periods of global SST stagnation, J. Climate, 30, 721–737, https://doi.org/10.1175/JCLI-D-16-0443.1, 2017.
Barcikowska, M. J., Kapnick, S. B., and Feser, F.: Impact of large-scale circulation changes in the North Atlantic sector on the current and future Mediterranean winter hydroclimate, Clim. Dynam., 50, 2039–2059, https://doi.org/10.1007/s00382-017-3735-5, 2018.
Barnston, A. G. and Livezey, R. E.: Classification, seasonality and persistence of low-frequency atmospheric circulation patterns, Mon. Weather Rev., 115, 1083–1126, 1987.
Berg, A., Lintner, B. R., Findell, K., Seneviratne, S. I., van den Hurk, B., Ducharne, A., Chéruy, F., Hagemann, S., Lawrence, D. M., Malyshev, S., Meier, A., and Gentine, P.: Interannual Coupling between Summertime Surface Temperature and Precipitation over Land: Processes and Implications for Climate Change, J. Climate, 28, 1308–1328, 2015.
Berg, A., Findell, K., Lintner, B., Giannini, A., Seneviratne, S. I., Van den Hurk, B., Lorenz, R., Pitman, A., Hagemann, S., Meier, A., Cheruy, F., Ducharne, A., Malyshev, S., and Milly, P. C. D.: Land–atmosphere feedbacks amplify aridity increase over land under global warming, Nat. Clim. Change, 6, 869–874, https://doi.org/10.1038/nclimate3029, 2016.
Blade, I., Liebmann, B., Fortuny, D., and van Oldenborgh, G. J.: Observed and simulated impacts of the summer NAO in Europe: implications for projected drying in the Mediterranean region, Clim. Dynam., 39, 709–727, 2012a.
Blade, I., Fortuny, D., van Oldenborgh, G. J., and Liebmann, B.: The summer North Atlantic Oscillation in CMIP3 models and related uncertainties in projected summer drying in Europe, J. Geophys. Res., 117, D16104, https://doi.org/10.1029/2012JD017816, 2012b.
Boberg, F. and Christensen, J.: Overestimation of Mediterranean summer temperature projections due to model deficiencies, Nat. Clim. Change, 2, 433–436, https://doi.org/10.1038/nclimate1454, 2012.
Cassou, C., Terray, L., and Phillips, A. S.: Tropical Atlantic influence on European heat waves, J. Climate, 18, 2805–2811, 2005.
Cherchi, A., Annamalai, H., Masina, S., and Navarra, A.: South Asian summer monsoon and eastern Mediterranean climate: the monsoon–desert mechanism in CMIP5 simulations, J. Climate, 27, 6877–6903, 2014.
Cherchi, A., Annamalai, H., and Masina, S.: Twenty-first century projected summer mean climate in the Mediterranean interpreted through the monsoon-desert mechanism, Clim. Dynam., 47, 2361–2371, https://doi.org/10.1007/s00382-015-2968-4, 2016.
Christensen, J. H. and Boberg, F.: Temperature dependent climate projection deficiencies in CMIP5 models, Geophys. Res. Lett., 39, L24705, https://doi.org/10.1029/2012GL053650, 2012.
Chronis, T., Raitsos, D. E., Kassis, D., and Sarantopoulos, A.: The summer North Atlantic oscillation influence on the Eastern Mediterranean, J. Climate, 24, 5584–5596, 2011.
Collins, M., Knutti, R., Arblaster, J., Dufresne, J.-L., Fichefet, T., Friedlingstein, P., Gao, X., Gutowski, W. J., Johns, T., Krinner, G., Shongwe, M., Tebaldi, C., Weaver, A. J., and Wehner, M.: Long-term Climate Change: Projections, Commitments and Irreversibility, in: Climate Change 2013: The Physical Science Basis, Contribution of Working Group I to the Fifth Assessment Report of the Intergovernmental Panel on Climate Change, edited by: Stocker, T. F., Qin, D., Plattner, G.-K., Tignor, M., Allen, S. K., Boschung, J., Nauels, A., Xia, Y., Bex, V., and Midgley, P. M., Cambridge University Press, Cambridge, UK and New York, NY, USA, 2013.
Compo, G. P., Whitaker, J. S., and Sardeshmukh, P. D.: Feasibility of a 100 year reanalysis using only surface pressure data, B. Am. Meteorol. Soc., 87, 175–190, https://doi.org/10.1175/BAMS-87-2-175, 2006.
Cornes, R., van der Schrier, G., van den Besselaar, E. J. M., and Jones, P. D.: An Ensemble Version of the E-OBS Temperature and Precipitation Datasets, J. Geophys. Res.-Atmos., 123, 9391–9409, https://doi.org/10.1029/2017JD028200, 2018.
Delworth, T. L. and Mann, M.: Observed and simulated multidecadal variability in the Northern Hemisphere, Clim. Dynam., 16, 661–676 , https://doi.org/10.1007/s003820000075, 2000.
Delworth, T. L., Broccoli, A. J., Rosati, A., Stouffer, R. J., Balaji, V., Beesley, J. A., Cooke, W. F., Dixon, K. W., Dunne, J., Dunne, K. A., Durachta, J. W., Findell, K. L., Ginoux, P., Gnanadesikan, A., Gordon, C. T., Griffies, S. M., Gudgel, R., Harrison, M. J., Held, I. M., Hemler, R. S., Horowitz, L. W., Klein, S. A., Knutson, T. R., Kushner, P. J., Langenhorst, A. R., Lee, H., Lin, S., Lu, J., Malyshev, S. L., Milly, P. C., Ramaswamy, V., Russell, J., Schwarzkopf, M. D., Shevliakova, E., Sirutis, J. J., Spelman, M. J., Stern, W. F., Winton, M., Wittenberg, A. T., Wyman, B., Zeng, F., and Zhang, R.: GFDL's CM2 Global Coupled Climate Models. Part I: Formulation and Simulation Characteristics, J. Climate, 19, 643–674, 2006.
Delworth, T. L., Rosati, A., Anderson, W., Adcroft, A. J., Balaji, V., Benson, R., Dixon, K., Griffies, S. M., Lee, H., Pacanowski, R. C., Vecchi, G. A., Wittenberg, A. T., Zeng, F., and Zhang, R.: Simulated Climate and Climate Change in the GFDL CM2.5 High-Resolution Coupled Climate Model, J. Climate, 25, 2755–2781, 2012.
Diffenbaugh, N. S. and Giorgi, F.: Climate change hotspots in the CMIP5 global climate model ensemble, Climatic Change 114, 813–822, https://doi.org/10.1007/s10584-012-0570-x, 2012.
Diffenbaugh, N. S., Pal, J. S., Giorgi, F., and Gao, X.: Heat stress intensification in the Mediterranean climate change hotspot, Geophys. Res. Lett., 34, L11706, https://doi.org/10.1029/2007GL030000, 2007.
Dirmeyer, P. A.: The terrestrial segment of soil moisture–climate coupling, Geophys. Res. Lett., 38, L16702, https://doi.org/10.1029/2011GL048268, 2011.
Dubrovsky, M., Hayes, M., Duce, P., Trnka, M., and Zara, P.: Multi-GCM projections of future drought and climate variability indicators for the Mediterranean region, Reg. Environ. Change, 14, 1907–1919, https://doi.org/10.1007/s10113-013-0562-z, 2014.
EEA – European Environment Agency: Climate change, impacts and vulnerability in Europe 2016 – An indicator based report, EEA Report No. 1/2017.2017, Luxemburg, https://doi.org/10.2800/534806, 2017.
Enfield, D. B., Mestas-Nunez, A. M., and Trimble, P. J.: The Atlantic multidecadal oscillation and its relation to rainfall and river flows in the continental U.S., Geophys. Res. Lett., 28, 2077–2080, 2001.
Feng, S., Hu, Q., Huang, W., Ho, C.-H., Li, R., and Tang, Z.: Projected climate regime shift under future global warming from multi-model, multi-scenario CMIP5 simulations, Global Planet. Change, 112, 41–52, 2014.
Folland, C. K., Knight, J., Linderholm, H. W., Fereday, D., Ineson, S., and Hurrell, J. W.: The summer North Atlantic Oscillation: past, present, and future, J. Climate, 22, 1082–1103, 2009.
Fontaine, B., Roucou, P., Gaetani, M., and Marteau, R.: Recent changes in precipitation, ITCZ convection and northern tropical circulation over North Africa (1979–2007), Int. J. Climatol., 31, 633–648, 2011.
Giorgi, F.: Climate change hot-spots, Geophys. Res. Lett., 33, L08707, https://doi.org/10.1029/2006GL025734, 2006.
Giorgi, F. and Lionello, P.: Climate change projections for the Mediterranean region, Global Planet. Change, 63, 90–104, 2008.
Guo, Z., Dirmeyer, P. A., Koster, R. D., Sud, Y. C., Bonan, G., Oleson, K. W., Chan, E., Verseghy, D., Cox, P., Gordon, C. T., McGregor, J. L., Kanae, S., Kowalczyk, E., Lawrence, D., Liu, P., Mocko, D., Lu, C., Mitchell, K., Malyshev, S., McAvaney, B., Oki, T., Yamada, T., Pitman, A., Taylor, C. M., Vasic, R., and Xue, Y.: GLACE: The Global Land–Atmosphere Coupling Experiment. Part II: Analysis, J. Hydrometeorol., 7, 611–625, https://doi.org/10.1175/JHM511.1, 2006.
Hanf, F., Körper, J., Spangehl, T., and Cubasch, U.: Shifts of climate zones in multi-model climate change experiments using the Köppen climate classification, Meteorol. Z., 21, 111–123, 2012.
Held, I. M. and Soden, B. J.: Robust Responses of the Hydrological Cycle to Global Warming, J. Climate, 19, 5686–5699, https://doi.org/10.1175/JCLI3990.1, 2006.
Hirschi, M., Seneviratne, S., Alexandrov, V., Boberg, F., Boroneant, C., Christensen, O. B., Formayer, H., Orlowsky, B., and Stepanek, P.: Observational evidence for soil-moisture impact on hot extremes in southeastern Europe, Nat. Geosci., 4, 17–21, https://doi.org/10.1038/ngeo1032, 2011.
Hoskins, B. J.: On the existence and strength of the summer subtropical anticyclones – Bernhard Haurwitz memorial, B. Am. Meteorol. Soc., 77, 1287–1292, 1996.
HMSO: Weather in the Mediterranean I: general meteorology, 2nd Edn, Her Majesty Stationery Office, London, 362 pp., 1962.
Hurrell, J. W.: Decadal trends in the North Atlantic Oscillation: regional temperatures and precipitation, Science, 269, 676–679, 1995.
Hurrell, J.W . and Deser, C.: North Atlantic climate variability: the role of the North Atlantic Oscillation, J. Mar. Syst., 78, 28–41, 2009.
Hurrell, J. W. and Folland, C. K.: A change in the summer circulation over the North Atlantic, CLIVAR Exchanges, No. 25, International CLIVAR Project Office, Southampton, UK, 52–54, 2002.
Hurrell, J. W. and van Loon, H.: Decadal variations in climate associated with the North Atlantic Oscillation, Climatic Change, 36, 301–326, 1997.
Hurrell, J. W., Kushnir, Y., Ottersen, G., and Visbeck, M.: An overview of the North Atlantic Oscillation. The North Atlantic Oscillation: climatic significance and environmental impact, Geophys. Monogr. Am. Geophys. Union, 134, 1–35, 2003.
Jacob, D., Petersen, J., Eggert, B., Alias, A., Christensen, O. B., Bouwer, L. M., Braun, A., Colette, A., Déqué, M., Georgievski, G., Georgopoulou, E., Gobiet, A., Menut, L., Nikulin, G., Haensler, A., Hempelmann, N., Jones, C., Keuler, K., and Kovats, S.: EURO-CORDEX: New high-resolution climate change projections for European impact research, Reg. Environ. Change, 14, 563–578, 2014.
Kanamitsu, M., Ebisuzaki, W., Woollen, J., Yang, S., Hnilo, J. J., Fiorino, M., and Potter, G. L.: NCEP–DOE AMIP-II Reanalysis (R-2), B. Am. Meteorol. Soc., 83, 1631–1644, 2002.
Kapnick, S. B., Delworth, T. L., Ashfaq, M., Malyshev, S., and Milly, P. C.: Snowfall less sensitive to warming in Karakoram than in Himalayas due to a unique seasonal cycle, Nat. Geosci., 7, 834–840, https://doi.org/10.1038/ngeo2269, 2014.
Kelley, C., Ting, M., Seager, R., and Kushnir, Y.: Mediterranean precipitation climatology, seasonal cycle, and trend as simulated by CMIP5, Geophys. Res. Lett., 39, L21703, https://doi.org/10.1029/2012GL053416, 2012.
Knight, J. R., Allan, R. J., Folland, C. K., Vellinga, M., and Mann, M. E.: A signature of persistent natural thermohaline circulation cycles in observed climate, Geophys. Res. Lett., 32, L20708, https://doi.org/10.1029/2005GL024233, 2005.
Knight, J. R., Folland, C. K., and Scaife, A. A.: Climatic impacts of the Atlantic multidecadal oscillation, Geophys. Res. Lett., 33, L17706, https://doi.org/10.1029/2006GL026242, 2006.
Knutti, R., Masson, D., and Gettelman, A.: Climate model genealogy: Generation CMIP5 and how we got there, Geophys. Res. Lett., 40, 1194–1199, 2013.
Kotlarski, S., Keuler, K., Christensen, O. B., Colette, A., Déqué, M., Gobiet, A., Goergen, K., Jacob, D., Lüthi, D., van Meijgaard, E., Nikulin, G., Schär, C., Teichmann, C., Vautard, R., Warrach-Sagi, K., and Wulfmeyer, V.: Regional climate modeling on European scales: a joint standard evaluation of the EURO-CORDEX RCM ensemble, Geosci. Model Dev., 7, 1297–1333, https://doi.org/10.5194/gmd-7-1297-2014, 2014.
Krichak, S. O., Kishcha, P., and Alpert, P.: Decadal trends of main Eurasian oscillations and the Mediterranean precipitation, Theor. Appl. Climatol., 72, 209–220, 2002.
Legates, D. R. and Willmott, C. J.: Mean seasonal and spatial variability in gauge-corrected, global precipitation, Int. J. Climatol., 10, 111–127, 1990.
Lin, H.: Global extratropical response to diabatic heating variability of the Asian summer monsoon, J. Atmos. Sci., 66, 2697–2713, 2009.
Lin, H., Derome, J., and Brunet, G.: The nonlinear transient atmospheric response to tropical forcing, J. Climate, 20, 5642–5665, 2007.
Linderholm, H. W. and Folland, C. K.: Summer North Atlantic Oscillation (SNAO) variability on interannual to palaeoclimate time scales, in: CLIVAR Exchanges 72, 57–60 and Past Global Changes Magazine, PAGES Mag., 25, 57–60, 2017.
Linderholm, H. W., Folland, C. K., and Walther, A.: A multicentury perspective on the summer North Atlantic Oscillation (SNAO) and drought in the eastern Atlantic Region, J. Quatern. Sci., 24, 415–425, 2009.
Lundquist, J., Hughes, M., Gutmann, E., and Kapnick, S.: Our skill in modeling mountain rain and snow is bypassing the skill of our observational networks, B. Am. Meteorol. Soc., 100, 2473–2490, https://doi.org/10.1175/BAMS-D-19-0001.1, 2019.
Maheras, P.: Le problem des Etesiens, Mediterranee, N40, 57–66, 1980.
Mann, M. E. and Emanuel, K. A.: Atlantic hurricane trends linked to climate change, Eos Trans. AGU, 87, 233–241, https://doi.org/10.1029/2006EO240001, 2006.
Mariotti, A., Pan, Y., Zeng, N., and Alessandri, A.: Long-term climate change in the Mediterranean region in the midst of decadal variability, Clim. Dynam., 44, 1437–1456, 2015.
Mariotti, A., Struglia, M. V., Zeng, N., and Lau, K. M.: The hydrological cycle in the Mediterranean region and implications for the water budget of the Mediterranean Sea, J. Climate, 15, 1674–1690, 2002.
Meinshausen, M., Smith, S. J., Calvin, K., Daniel, J. S., Kainuma, M. L. T., Lamarque, J.-F., Matsumoto, K., Montzka, S. A., Raper, S. C. B., Riahi, K., Thomson, A., Velders, G. J. M., and Vuuren, D. P. P.: The RCP greenhouse gas concentrations and their extensions from 1765 to 2300, Climatic Change, 109, 213, https://doi.org/10.1007/s10584-011-0156-z, 2011.
Metaxas, D. A.: The interannual variability of the Etesian frequency as a response of atmospheric circulation anomalies, B. Hellen. Meteorol. Soc., 2, 30–40, 1977.
Milly, P. C. D., Malyshev, S. L., Shevliakova, E., Dunne, K. A., Findell, K. L., Gleeson, T., Liang, Z., Phillipps, P., Stouffer, R. J., and Swenson, S.: An Enhanced Model of Land Water and Energy for Global Hydrologic and Earth-System Studies, J. Hydrometeorol., 15, 1739–1761, 2014.
Mueller, B. and Seneviratne, S. I.: Hot days induced by precipitation deficits at the global scale, P. Natl. Acad. Sci. USA, 109, 12398–12403, https://doi.org/10.1073/pnas.1204330109, 2012.
Mueller, B. and Seneviratne, S. I.: Systematic land climate and evapotranspiration biases in CMIP5 simulations, Geophys. Res. Lett., 41, 128–134, 2014.
Pascale, S., Bordoni, S., Kapnick, S. B., Vecchi, G. A., Jia, L., Delworth, T. L., and Anderson, W.: The impact of horizontal resolution on North American monsoon Gulf of California moisture surges in a suite of coupled global climate models, J. Climate, 29, 7911–7936, 2016.
Prezerakos, N. G.: Does the extension of the Azores anticyclone towards the Balkans really exist, Arch. Meteorol. Geophys. Bioklimatol. A, 33, 217–227, 1984.
Raicich, F., Pinardi, N., and Navarra, A.: Teleconnections between Indian monsoon and Sahel rainfall and the Mediterranean, Int. J. Climatol., 23, 173–186, 2003.
Reddaway, J. M. and Bigg, G. R.: Climatic change over the Mediterranean and links to the more general atmospheric circulation, Int. J. Climatol., 16, 651–661, 1996.
Riahi, K., Rao, S., Krey, V., Cho, C., Chirkov, V., Fischer, G., Kindermann, G., Nakicenovic, N., and Rafaj, P.: RCP 8.5 – A scenario of comparatively high greenhouse gas emissions, Climatic Change, 109, 33–57, 2011.
Rizou, D., Flocas, H. A., Athanasiadis, P., and Bartzokas, A.: Relationship between the Indian summer monsoon and the large-scale circulation variability over the Mediterranean, Atmos. Res., 152, 159–169, 2015.
Rodwell, M. J. and Hoskins, B. J.: Monsoons and the dynamics of deserts, Q. J. Roy. Meteorol. Soc., 122, 1385–1404, 1996.
Rodwell, M. J. and Hoskins, B. J.: Subtropical anticyclones and summer monsoons, J. Climate, 14, 3192–3211, 2001.
Rotstayn, L. and Lohman, U.: Tropical rainfall trends and the indirect aerosol effect, J. Climate, 15, 2103–2116, 2002.
Rowell, D. P.: The Impact of Mediterranean SSTs on the Sahelian Rainfall Season, J. Climate, 16, 849–862, 2003.
Rowell, D. P. and Jones, R. G.: Causes and uncertainty of future summer drying over Europe, Clim. Dynam., 27, 281–299, 2006.
Sacks, W. J., Cook, B. I., Buenning, N., Levis, S., and Helkowski, J. H.: Effects of global irrigation on the near-surface climate, Clim. Dynam., 33, 159–175, 2009.
Seager, R., Naik, N., and Vecchi, G.: Thermodynamic and dynamic mechanisms for large-scale changes in the hydrological cycle in response to global warming, J. Climate, 23, 4651–4668, 2010.
Seneviratne, S. I., Lüthi, D., Litschi, M., and Schär, C.: Land atmosphere coupling and climate change in Europe, Nature, 443, 205–209, 2006.
Seneviratne, S. I., Wilhelm, M., Stanelle, T., van den Hurk, B., Hagemann, S., Berg, A., Cheruy, F., Higgins, M. E., Meier, A., Brovkin, V., Claussen, M., Ducharne, A., Dufresne, J.-L., Findell, K. L., Ghattas, J., Lawrence, D. M., Malyshev, S., Rummukainen, M., and Smith, B.: Impact of soil moisture-climate feedbacks on CMIP5 projections: first results from the GLACE-CMIP5 experiment, Geophys. Res. Lett., 40, 5212–5217, 2013.
Syed, F. S., Yoo, J. H., Körnich, H., and Kucharski, F.: Extratropical influences on the inter-annual variability of South-Asian monsoon, Clim. Dynam., 38, 1661–1674, https://doi.org/10.1007/s00382-011-1059-4, 2012.
Tyrlis, E., Lelieveld, J., and Steil, B.: The summer circulation over the Eastern Mediterranean and the Middle East: influence of the South Asian monsoon, Clim. Dynam., 40, 1103–1123, 2013.
Zecchetto, S. and de Biasio, F.: Sea surface winds over the Mediterranean basin from satellite data (2000–04): meso- and local-scale features on annual and seasonal time scales, J. Appl. Meteorol. Clim., 46, 814–827, 2007.
Ziv, B., Saaroni, H., and Alpert, P.: The factors governing the summer regime of the eastern Mediterranean, Int. J. Climatol., 24, 1859–1871, 2004.