the Creative Commons Attribution 4.0 License.
the Creative Commons Attribution 4.0 License.
The role of moisture transport for precipitation in the inter-annual and inter-daily fluctuations of the Arctic sea ice extension
Luis Gimeno-Sotelo
Raquel Nieto
Marta Vázquez
Luis Gimeno
By considering the moisture transport for precipitation (MTP) for a target region to be the moisture that arrives in this region from its major moisture sources and which then results in precipitation in that region, we explore (i) whether the MTP from the main moisture sources for the Arctic region is linked with inter-annual fluctuations in the extent of Arctic sea ice superimposed on its decline and (ii) the role of extreme MTP events in the inter-daily change in the Arctic sea ice extent (SIE) when extreme MTP simultaneously arrives from the four main moisture regions that supply it. The results suggest (1) that ice melting at the scale of inter-annual fluctuations against the trend is favoured by an increase in moisture transport in summer, autumn, and winter and a decrease in spring and, (2) on a daily basis, extreme humidity transport increases the formation of ice in winter and decreases it in spring, summer, and autumn; in these three seasons extreme humidity transport therefore contributes to Arctic sea ice melting. These patterns differ sharply from that linked to the decline on a long-range scale, especially in summer when the opposite trend applies, as ice melt is favoured by a decrease in moisture transport for this season at this scale.
- Article
(11544 KB) - Full-text XML
- Companion paper
-
Supplement
(3407 KB) - BibTeX
- EndNote
If the scientific community were collectively to select an unambiguous indicator of climate change, the long-term decline in the average annual extent of Arctic sea ice (SIE) would undoubtedly be among the most widely proposed. This is not just because of the extreme levels of social concern that this topic generates (IPCC, 2013) in view of all the considerable environmental implications, but also because the scientific complexity of this field of study covers a very broad spectrum of disciplines. These range from atmospheric and oceanic sciences related to the origins and processes of the sea ice to marine biology and even economics and energy resources (IPCC, 2013), all related to the study of the consequences of any change.
One of the most influential atmospheric mechanisms affecting the Arctic SIE, and one which has received the most attention, is the transport of moisture from mid-latitudes. A number of authors (e.g. Dufour et al., 2016; Oshima and Yamazaki, 2017) have found no significant long-term changes in the poleward moisture transport towards the Arctic, while others (e.g. Zhang et al., 2012) noted an intensification of this transport over the last few decades. A change in moisture transport towards the Arctic may have different impacts and, for example, in the cold season (September–April) it can have two effects, in that it provides more humidity into the Arctic with a consequent increase in the radiative forcing of water vapour, which in turn contributes to increased melting of the ice, but also in that it can contribute to a change in the patterns of rainfall over the Arctic.
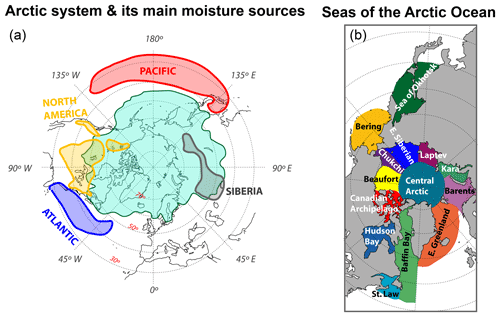
Figure 1(a) The Arctic region (AR) using the definition of Roberts et al. (2010) (light blue region) together with the major moisture sources for the Arctic as detected by Vazquez et al. (2016) and named Atlantic (dark blue region), Pacific (red region), North America (yellow region), and Siberia (grey region). (b) The Arctic Ocean (AO) and its main subregions.
The first of these two effects has undoubtedly attracted more attention of late. More moisture transport into the Arctic may induce anomalous long-wave downward radiation at the surface, warming of the atmospheric column, and a decrease in Arctic ice (e.g. Woods and Caballero, 2016). At a seasonal scale, Kapsch et al. (2013) showed a greater transport of humidity towards the Arctic in the winter and the preceding spring (in those years when there is a low concentration of sea ice in the Arctic in summer). Much attention has also been focused on the role of extreme moisture transport events, in both winter (e.g. Woods et al., 2013; Park et al., 2015) and spring (e.g. Yang and Magnusdottir, 2017), with similar conclusions in both cases that extreme events are accompanied by a reduction in the concentration of sea ice.
The second effect occurs via the impact of changes in moisture transport in Arctic precipitation and is more complex because changes in precipitation can cause different changes in ice cover associated with different fusion mechanisms depending on the form of precipitation (rain or snow), as well as its intensity and seasonality (Vihma, 2016).
It is important to note that there is no a single cause of the change in sea ice extent, and, indeed, different factors could come into play at the same time, making it difficult to identify a causal relationship. For example, changes in circulation might imply changes in the transport of moisture, with consequent changes in radiative forcing due to changes in water vapour or cloud formation, but there might also be changes in the wind, with the consequent displacement of ice or changes to the heat flux; changes in circulation would thus both encompass and cause other effects. This multiplicity of causes together with the difficulty of establishing causal relationships via a single factor should always be taken into account when analysing drivers of sea ice melting.
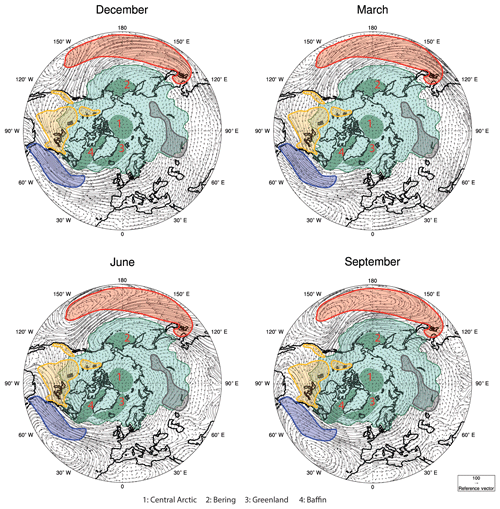
Figure 2Climatological values of the vertical integrated moisture flux (VIMF) (vector, kg m−1 s−1) for the first month of each season together with the main Arctic sources identified by Vázquez et al. (2016). The light green filled area represents the Arctic region as defined by Roberts et al. (2010), and the dark green areas represent the AO subregions that receive most moisture from the source regions.
The temporal variability of the SIE is dominated by the annual cycle. However, there is an important variability that appears once this annual cycle is removed, which is seen at multiple scales with the long-range and inter-annual scales being the most widely studied. In our previous work (Gimeno-Sotelo et al., 2018), we addressed the changes in patterns of moisture transport for precipitation (MTP), obtained via a Lagrangian approach, and linked to the annual mean decline, by comparing two periods (before vs. after the major point of change in 2003). However, some substantial high-frequency inter-annual fluctuations are also superimposed on this negative trend, and these modulate the annual observations of SIE but have attracted less attention. Additionally, to our knowledge the role of extreme MTP events on the daily progress of the SIE has never been analysed. This is relevant because one of the strongest influences of moisture transport on the Arctic sea ice is via moisture incursion (Woods and Caballero, 2016), with extreme individual moisture transport events being highly correlated with changes in Arctic temperature and being crucial to the understanding of changes in SIE (Yang and Magnusdottir, 2017). Because these events influence the inter-daily variability of SIE, and because ultimately the monthly averaged MTP studied at the inter-annual scale results from the sum of contributions from individual transport events, our focus here is on the inter-annual and the inter-daily scales, with the synoptic and the intraseasonal scales being the subject of future studies
In this article we complement our previous study by (i) focusing on the pattern of MTP linked to high-frequency inter-annual variability as characterised by years with low or high SIE set against its long-term decline and (ii) analysing the role of extreme MTP events in the Arctic SIE by investigating what happens to the daily march of the Arctic sea ice extent when extreme MTP transport periods from the four main sources of humidity for the Arctic coincide. As in Gimeno-Sotelo et al. (2018), we also compared these results with computations of vertical integrated moisture flux (VIMF) and with an analysis of changes of the frequency of occurrence of the atmospheric circulation types responsible for changes in moisture transport.
The Arctic region (AR) and its four main sources of moisture (Fig. 1a), and the Arctic Ocean (AO) and its subregions (Fig. 1b), are the same as used in our previous study (Gimeno-Sotelo, 2018). The boundary of the AR was defined by Roberts et al. (2010) as “the geosphere and biosphere north of the boreal mean decadal 10 ∘C sea surface isotherm, the surface air 0 ∘C contour that encircles the North Pole, and the southern limit of terrain that drains into the High Arctic”, and the moisture sources were defined by Vazquez et al. (2016) by the tracking of backward trajectories of particles from the region and analyzing where most of their moisture was gained. The study covers the period from 1 January 1980 to 31 December 2016, and the daily data on the Arctic SIE were obtained from the US National Snow and Ice Data Center (Fetterer, 2016). Data from the European Centre for Medium-Range Weather Forecasts (ECMWF) reanalysis (ERA-Interim) (Dee et al., 2011) were used to drive the Lagrangian moisture transport model and to calculate the vertically integrated moisture transport. This reanalysis contains data since 1979 at 6 h intervals with a spatial resolution of 1∘ × 1∘ in latitude and longitude with 61 vertical levels (1000 to 0.1 hPa). It is considered to be the reanalysis that best represents the hydrological cycle (Lorenz and Kunstmann, 2012), being particularly useful for studies of the Arctic region (Jakobson et al., 2012; Graversen et al., 2011).
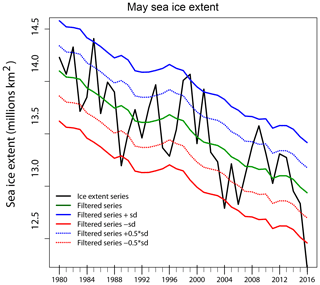
Figure 3Monthly May Arctic ice extent series for the AR from 1980 to 2016 (black line), together with a filtered series using an 11-year running mean (green line). Blue (red) solid and dotted lines were obtained adding (subtracting) the standard deviations and half the standard deviation of the non-filtered series, respectively, to each of the values of the filtered series.
The Lagrangian approach used to calculate the MTP is that used by Stohl and James (2004, 2005), based on the FLEXPART particle dispersion model in which the atmosphere is divided into finite elements of volume of equal mass, which we call particles, and their trajectory is traced for a period of 10 days, normally used as the average time that water vapour resides in the troposphere (Numaguti, 1999). The specific moisture changes of the particles are used to estimate the total budget of atmospheric humidity, or evaporation minus precipitation (E−P), by adding up all these changes in specific humidity for all the particles in a given area. By choosing all the particles that (a) leave a given source region, (b) reach the AR, and (c) lose humidity in the AR, we can calculate the MTP from the source region to the AR for a given daily, monthly, or yearly timescale by adding these losses of specific humidity for all these particles. This Lagrangian method has been used extensively and successfully in the analysis of moisture sources and sinks (e.g. Gimeno et al., 2010, 2013) and is considered state of the art compared with other methods of tracing water vapour (Gimeno et al., 2012, 2016).
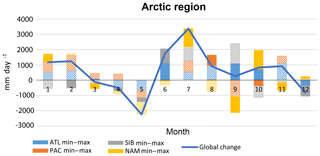
Figure 4Differences among mean values of moisture transport for precipitation (MTP) (mm day−1) for years with low vs. high Arctic SIE for each source region (coloured bars) and the total value taking into account all the sources for every month (solid line). Filled bars show differences that are statistically significant at the 95 % confidence level.
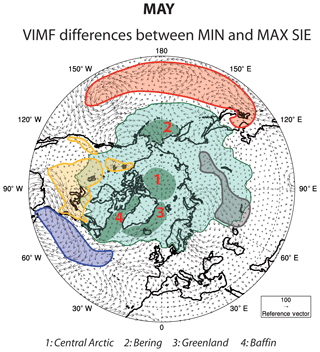
Figure 5Composite of differences of vertical integrated moisture flux (VIMF) (vector, kg m−1 s−1) between low- and high-SIE years for May. The AR (light green filled region), the Pacific, Atlantic, North America, and Siberia moisture sources (red, purple, yellow, and grey filled areas, respectively) and the main AO subregions central Arctic (1), Bering (2), Greenland (3), and Baffin (4) are also displayed.
Changes in moisture in the Arctic lead to effects on the Arctic ice, which do not always result in the same direction of change. Without considering changes in the albedo and the resulting feedback, or changes in the vertical profiles of temperature and humidity, the direct interaction can be summarised in four main actions: (i) changes in the balance of infrared (IR) radiation given the importance of water vapour as a greenhouse gas, the general effect being to increase the incident IR radiation causing heating of the surface (e.g. Bagget et al., 2016); (ii) changes in condensation processes due to enhanced water vapour, which necessarily affect the surface temperature by emission of sensible heat to the atmosphere due to the release of latent heat; (iii) changes in cloud cover, which can alter the incident radiation at the surface, and in this case the effect will depend on the height of the cloud cover and seasonality; and (iv) changes in precipitation where there are dynamical or thermodynamical forcing mechanisms, the relationship between precipitation and melting ice being variable depending on the type of precipitation and the season (e.g. Vihma et al., 2016). All these actions can have different effects on the sea ice cover at the timescales of our study, from daily to decadal variations.
A general scheme of the moisture transport to the Arctic can be extracted from the climatological values of VIMF throughout the year. Figure 2 illustrates these values for the first month of each season together with the main Arctic sources identified by Vázquez et al. (2016), the AR, and the main subregions of the AO in terms of moisture received from the source regions (Fig. S1 in the Supplement shows the 12 months). These figures are useful for visualising some of the most pertinent results from our previous studies, namely the following:
- i.
The Pacific, North America, Siberia, and Atlantic sources contribute to the moisture received in the AR by about 35 %, 30 %, 20 %, and 15 %, respectively, with the relative importance of the four moisture sources being relatively constant throughout the year (Gimeno-Sotelo et al., 2018).
- ii.
There are four subregions of the AO (Baffin Bay, the Bering Sea, Greenland, and the central Arctic; noted as 4, 2, 3, and 1, respectively, in the Fig. 2), which receive most of the moisture reaching the AO from the four main sources, with small variations throughout the year for Baffin Bay, the Bering Sea, and the central Arctic, but with a marked seasonal cycle for Greenland (Gimeno-Sotelo et al., 2018).
- iii.
The Atlantic source is dominant in the Baffin and Greenland subregions, the Pacific source dominates in the Bering, and all four sources contribute to the central Arctic (Vázquez et al., 2016).
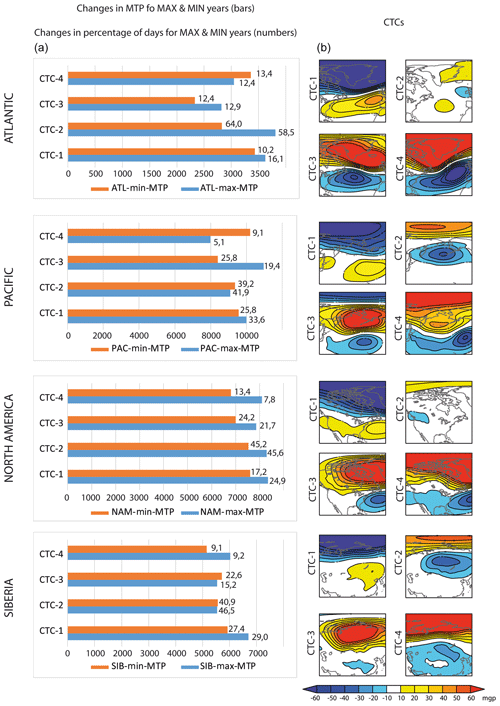
Figure 6(b) Anomalies of geopotential height at 850 hPa (Z850) for the four types of circulation centred in the four source sectors (classes CTC1 to CTC4) for spring and associated with (a) the average MTP and percentage of occurrence for each CTC for minimum SIE years (orange bars) vs. the maximum (blue bars) in May. The number associated with each of the bars represents the percentage of occurrence for each circulation type (CTC) for minimum vs. maximum SIE years for May (%).
4.1 Patterns of moisture transport for precipitation linked to high-frequency inter-annual fluctuations of the Arctic sea ice extent
To separate the superimposed high-frequency inter-annual fluctuations from the long-term decline in the Arctic SIE, we divided the annual mean time series for each month into low- and high-frequency components as per Yang and Magnusdottir (2017). Figure 3 illustrates this approach by showing the monthly May Arctic ice extent series for the AR from 1980 to 2016 (black line), together with a filtered series using an 11-year running mean (obtained by substituting each value with the mean of the five previous values, the five subsequent values, and the value itself, shown by the green line). In this work, we will consider high-SIE years for the May series to be those years when the values in the non-filtered series are higher, in more than half the standard deviation of the non-filtered series, than the filtered series (those years above the blue dotted line in Fig. 3). Likewise, low-SIE years for the May series correspond with those years that are lower, in more than half the standard deviation of the non-filtered series, than the filtered series (years below the red dotted line in Fig. 3). A list of all the high- and low-SIE years for the AR by month is shown in the Supplement, together with the high- and low-SIE years for the main AO subregions, in order to help identify the subregion that most influences the extreme SIE in the AR (Table S1).
Figure 4 shows the differences among the mean values of MTP for years with low vs. high Arctic SIE for each source region (Fig. 1a) and for each month. These amounts result from averaging the daily values of MTP, which allows us to estimate the statistical significance by comparing the daily values of MTP for years with low and high SIE using a Student's t test. A minimum of 2 months (60 days) and a maximum of 7 months (220 days) are used for the analysis; in either case the Student's t test is valid. Table S2 shows the mean and standard deviation of MTP for minimum and maximum SIE years by month. The results show that for all seasons apart from spring, MTP is greater for years of low ice extent than for those of high extent. The increase in MTP for the minimum SIE years vs. the maximum shows a major peak in July and a smaller one in May. For both these months there is agreement among all four moisture sources, with the MTP being higher for all of them in July and lower for all of them in May. The summer increase in the MTP is statistically significant for the Atlantic source in June, the Pacific source in August, the Siberian source in June and August, and the North American source in July. In the autumn, the changes in MTP from the different sources are variable, with the MTP from the Atlantic source growing significantly for September and October, but from North America the MTP decreases significantly in September and November but increases in October, in which month the MTP also decreases significantly from the Pacific source. This change in the pattern of MTP does not differ in essence from that observed with the long-term decline of the Arctic SIE (Gimeno-Sotelo et al., 2018) for the autumn, but it is clearly different from that which occurs in the summer, which is characterised by a clear decrease in MTP for the period of low SIE (after 2003) compared with the high-SIE period (before 2003).
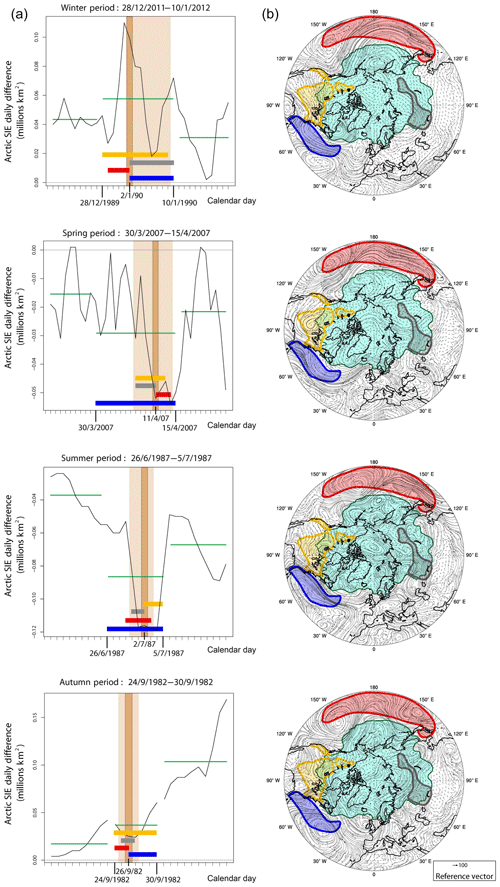
Figure 9Four selected cases of Ext-MTP (mm day−1), one for each season. (a) Daily change in SIE (black line), extreme MTP periods for each of the sources (horizontal bars in colour), coincident extreme MTP for the sources (the light brown vertical bar shows when there are three coincident MTPs, and the dark brown vertical bar shows when there are four coincident MTPs), and averages of the daily change in SIE for different periods (green horizontal bars). (b) Vertical integrated moisture flux plotted for the day on which the Ext-MTP occurred.
Figure 5 shows the composite of differences of VIMF between low- and high-SIE years for May (results for the remaining months are displayed in Fig. S2). The use of VIMF can help to illustrate how moisture is transported from each source to the Arctic, and where the moisture ends up, but it is additionally useful to compare the results of our Lagrangian approach to estimating MTP by checking whether the patterns of differences of VIMF for low- vs. high-SIE years are compatible with the identified changes. On inspection of Fig. 5, we note that there are no fluxes from the sources to the Arctic; instead they are in the opposite direction, implying that the VIMF is lower for low-SIE than for high-SIE years in accordance with the results in Fig. 3. Results of VIMF analysis for the other months can also explain with almost complete agreement every significant result found from the Lagrangian analysis, with the change in the moisture transport associated with high-low SIE being consistent with the increase or decrease observed in Fig. 4. The circulation types (CTCs) used in this study are the same as those described in Gimeno-Sotelo et al. (2018), based on an approach developed by Fettweis et al. (2011). The CTCs were obtained individually for each source region, based on a correlation analysis, where atmospheric circulation is categorised into four discrete CTCs, each containing days that showed similar patterns of circulation. In essence, the method is used to calculate a similarity index based on correlations with the geopotential height field at 850 hPa obtained from ERA-Interim for each pair of days. It uses the highest number of similar days and a high correlation threshold (0.95) to define the first class; it then uses a lower similarity threshold with the remaining days to define the second class, and so on. The procedure is repeated using different thresholds to optimise the percentage of variance explained (Philipp et al., 2010). The CTCs are shown in Fig. S3 and in general they resemble known teleconnection patterns in the four regions analysed (Barnston and Livezey, 1987, and http://www.cpc.ncep.noaa.gov/data/teledoc/telecontents.shtml, last access: 1 August 2018). For the Atlantic sector, for example, CTC1 resembles the positive phase of the eastern Atlantic pattern and CTC2 resembles the negative phase of the eastern Atlantic and western Russia. CTC3 resembles the negative phase of the North Atlantic Oscillation, and CTC4 resembles the positive phase of the Scandinavian pattern. Changes in the frequency and average MTP of those CTCs linked to high or low MTP can help to corroborate our Lagrangian results. Figure 6, for example, shows the CTCs for spring together with the average MTP and percentage of occurrence for each CTC for minimum vs. maximum SIE years for May. Table S3 shows the MTP averages for days grouped in each of the CTCs considering minimum and maximum SIE years by month together with the fraction of days as a percentage grouped for each CTC. The results of this analysis confirm those from the Lagrangian analysis almost entirely. For the Atlantic source, for example, a change in the frequency of CTC2 is observed for low-SIE years (64 % of days in May) vs. high-SIE years (only 58.5 %) together with a decrease in MTP associated with CTC2, which is coherent with the decrease in MTP for low-SIE years. CTC2 resembles the negative phase of the eastern Atlantic and western Russia (positive height anomalies over the central North Atlantic and negative height anomalies over Europe), linked to enhanced precipitation in the Barents Sea. Thus a decrease in the frequency of this mode would result in reduced MTP for this AO subregion, which is one of the main sinks of the Atlantic source (Gimeno-Sotelo et al., 2018). A similar analysis for the remaining months, sources, and CTCs yields results that are in accordance with our Lagrangian analysis.
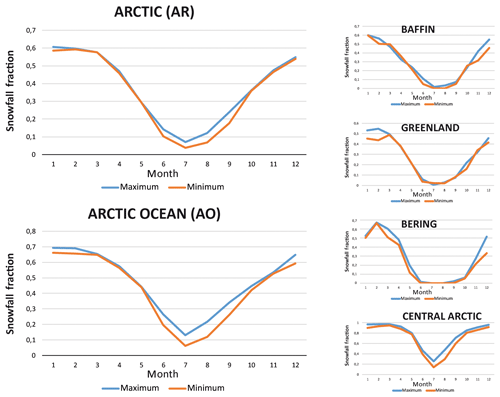
Figure 10Snowfall fraction taken from the ERA-Interim reanalysis by month for the AR, the AO, and the four more important AO subregions as a percentage of MTP as identified by Gimeno-Sotelo et al. (2018): Baffin, Greenland, Bering, and central Arctic. The blue line represents the fraction for high-SIE years and the red line for low-SIE years, with the snowfall fraction being higher for high years in almost all months but especially in summer.
4.2 The role of extreme events of moisture transport for precipitation on the seasonal cycle of the Arctic sea ice extent
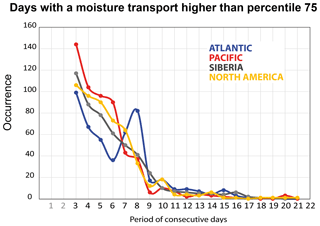
An extreme event of MTP for each of the four moisture sources is defined when there are at least 3 consecutive days with MTP higher than the 75th percentile for the corresponding month. Figure 7 shows histograms of the MTP extremes for each source according to their duration. The highest numbers of events are distributed at the “short” end of the duration, i.e. 3–4 days. This is about 40 % of them, with 35 % having Atlantic sources (the minimum) and 44 % having the Pacific source (the maximum). The number of events decreases significantly as the duration increases, although events lasting a week or more are not infrequent, representing percentages of 16 %, 7 %, 14 %, and 10 % for the Atlantic, Pacific, Siberian, and North American sources, respectively.
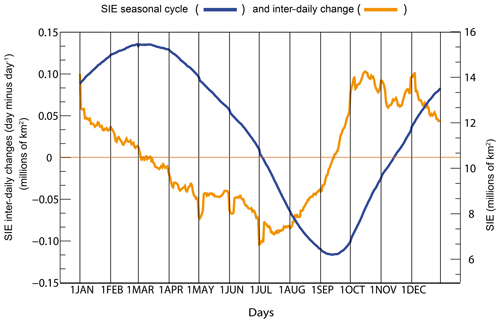
In this paper, a global extreme MTP event (Ext-MTP) takes place when there is temporal concurrence (at least 1 day) of MTP extreme events from the four main sources of moisture for the Arctic. A list of all these events is displayed in Table S2. Because of the marked seasonal cycle of the Arctic SIE (Fig. 8, blue line with a maximum in mid-March and a minimum in mid-September), the effect of Ext-MTP on this is more evident in the inter-daily change in SIE over 2 consecutive days (Fig. 8, orange line), with negative values from mid-March to mid-September peaking in mid-July and positive values from mid-September to mid-March peaking in mid-October.
Figure 9 shows four cases of Ext-MTP, one for each season. Figure 9a shows the daily change in SIE together with the extreme MTP periods for each of the sources, shown as horizontal bars in colour. The periods when these extreme events coincide for three of the sources are shown with a light brown vertical bar, and the period when all four coincide is shown as a dark brown vertical bar; this defines our Ext-MTP. The green horizontal bars denote the average daily change in SIE before, during, and after the period spanning the moment when the first extreme of MTP begins for one of the sources and when the last one ends. The effect that the Ext-MTP has on the daily change in SIE is very clear, producing an increase in winter and a decrease in spring and summer and to a lesser degree in autumn. Figure 9b shows the vertical integrated moisture flux for the day on which the Ext-MTP occurred, and it is clear that the great increase in moisture transport from the four sources to some Arctic subregions is notably higher than the monthly average (Fig. 2). Figure S4 in the Supplement shows the results for the 17 Ext-MTP events detected and supports conclusions generally similar to those reached for the four example cases.
The impact of MTP on the Arctic SIE is complex and should be understood in terms of the way changes in precipitation can cause different changes in ice cover associated with different fusion mechanisms depending on the form of precipitation (rain or snow), as well as its intensity and seasonality. The main contrasting mechanisms are shown in Table 1 according to season.
Table 1Summary of the main contrasting mechanisms of the impact of precipitation on ice cover. Those mechanisms favouring ice melting are shown in bold and those favouring ice growth are shown in italics.
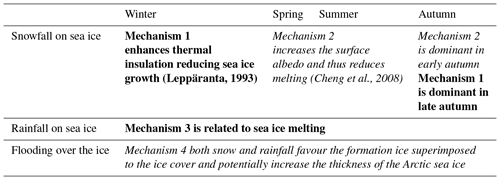
Figure 10 shows the snowfall fraction obtained from the ERA-Interim reanalysis by month for the Arctic region, the Arctic Ocean, and the four most important Arctic Ocean subregions in terms of percentage of MTP as identified by Gimeno-Sotelo et al. (2018): Baffin, Greenland, Bering, and central Arctic. The blue line represents the fraction for high-SIE years and the red line for low-SIE years, with the snowfall fraction being higher for high years in almost all months but especially in summer. The average snow fraction for the year is about 0.3 for AR and 0.4 for AO, with these values being higher than for the same average for the period from November to May. Regarding the AO subregions, the highest average snow fraction is in the central Arctic, with almost 100 % of the precipitation in the form of snow throughout the winter and a good part of the autumn and spring. The lowest proportion occurs in Greenland, where only the winter sees ratios greater than 50 %. Therefore, we can say that mechanisms 1 and 2 in Table 1 relating to precipitation in the form of snow dominate from November to May, and mechanism 3 relating to precipitation in the form of rain dominates from June to October. We are unable to specify the contribution of mechanism 4 relating to the intensity of precipitation and flooding without more detailed data. Albeit in simplistic terms, these essential mechanistic arguments are in agreement with the results presented earlier, suggesting that ice melting over the two timescales studied here is favoured by an increase in moisture transport in summer, and to a lesser degree in autumn and winter, and a decrease in spring.
In a previous work, Gimeno-Sotelo et al. (2018) analysed how the patterns of moisture transport for precipitation varied with the dramatic long-term decline in Arctic ice extent. Using the same region and methodology, we first investigated how the changes in this pattern are linked to the inter-annual fluctuations that occur in the Arctic ice, superimposed on this decline. The results suggest that ice melting at this timescale (inter-annual fluctuations against the trend) is favoured by an increase in moisture transport in summer, and to a lesser degree in autumn and winter, and a decrease in spring. The pattern differs considerably from that found to be linked to decline (Gimeno-Sotelo et al., 2018), especially in summer when it is opposed to it. Then, by exploring the role of extreme MTP events in the Arctic sea ice extent (SIE) we considered what happens to the daily march of the Arctic SIE when extreme MTP arrives simultaneously from the four main moisture regions for the Arctic. The results suggest that on a daily basis the extreme humidity transport for precipitation increases the formation of ice in winter and reduces it in spring, summer, and autumn, contributing to melting of the Arctic sea ice in these three seasons. It is noteworthy that at this timescale, considering the daily change in ice extent, the effect of the MTP on the SIE in summer and autumn is more similar in terms of its effect at the inter-annual fluctuation scale than at the long-range scale (Gimeno-Sotelo et al., 2018). Thus, in these seasons when the minimum SIE is reached, the ice melting seems to be favoured by large contributions of MTP at the inter-daily and inter-annual fluctuation scale, but not at the long-range scale, suggesting different physical mechanisms that require much deeper study.
The results of both this and our previous article (Gimeno-Sotelo et al., 2018) must be interpreted with care, given that there is no single cause of the variability of the ice extent, and it could be the case that just as changes in the same direction as the MTP do not influence the extent of the ice through a single mechanism, so the MTP could have an influence through changes in precipitation but also through changes in the wind forcing of the ice, leading to a northward movement of the edge of the ice, with consequent changes in the extent of the sea ice in the Arctic. A more detailed analysis to try to isolate regions and situations in which a particular mechanism predominates could help to understand the causes of variations in SIE with respect to the trend of interest, with important implications for improving forecasting (Hamilton and Stroeve, 2016).
No public data are derived from this research. For further information, please contact the corresponding author.
The supplement related to this article is available online at: https://doi.org/10.5194/esd-10-121-2019-supplement.
LGS performed the calculations and wrote the article, RN designed and made the figures, MV provided the MTP data, LG designed the study and wrote the article, and all authors contributed to the interpretation and discussion of the results.
The authors declare that they have no conflict of interest.
This article is part of the special issue “The 8th EGU Leonardo Conference: From evaporation to precipitation: the atmospheric moisture transport”. It is a result of the 8th EGU Leonardo Conference, Ourense, Spain, 25–27 October 2016.
The authors acknowledge the award by the Spanish government EVOCAR
(CGL2015-65141-R) project, which is additionally funded by the European
Regional Development Fund (FEDER).
Edited by: Ricardo Trigo
Reviewed by: two anonymous referees
Baggett, C., Lee, S., and Feldstein, S.: An investigation of the presence of atmospheric rivers over the North Pacific during planetary-scale wave life cycles and their role in Arctic warming, J. Atmos. Sci., 73, 4329–4347, https://doi.org/10.1175/JAS-D-16-0033.1, 2016.
Barnston, A. G. and Livezey, R. E.: Classification, seasonality and persistence of low-frequency atmospheric circulation patterns, Mon. Weather Rev., 115, 1083–1126, https://doi.org/10.1175/1520-0493(1987)115<1083:CSAPOL>2.0.CO;2, 1987.
Cheng, B., Zhang, Z., Vihma, T., Johansson, M., Bian, L., Li, Z., and Wu, H.: Model experiments on snow and ice thermodynamics in the Arctic Ocean with CHINARE2003 data, J. Geophys. Res., 113, C09020, https://doi.org/10.1029/2007JC004654, 2008.
Dee, D. P., Uppala, S. M., Simmons, A. J., Berrisford, P., Poli, P., Kobayashi, S., and Vitart, F.: The ERA-Interim reanalysis: Configuration and performance of the data assimilation system, Q. J. Roy. Meteor. Soc., 137, 553–597, https://doi.org/10.1002/qj.828, 2011.
Dufour, A., Zolina, O., and Gulev, S. K.: Atmospheric Moisture Transport to the Arctic: Assessment of Reanalyses and Analysis of Transport Components, J. Climate, 29, 5061–5081, https://doi.org/10.1175/JCLI-D-15-0559.1, 2016.
Fetterer, F., Knowles, K., Meier, W., and Savoie, M.: Sea Ice Index, Version 2, 1979–2016, NSIDC: National Snow and Ice Data Center, Boulder, Colorado, USA, https://doi.org/10.7265/N5736NV7, 2016.
Fettweis, X., Mabille, G., Erpicum, M., Nicolay, S., and Van den Broeke, M.: The 1958–2009 Greenland ice sheet surface melt and the mid-tropospheric atmospheric circulation, Clim. Dynam., 36, 139–159, https://doi.org/10.1007/s00382-010-0772-8, 2011.
Gimeno, L., Drumond, A., Nieto, R., Trigo, R. M., and Stohl, A.: On the origin of continental precipitation, Geophys. Res. Lett., 37, L13804, https://doi.org/10.1029/2010GL043712, 2010.
Gimeno, L., Stohl, A., Trigo, R. M., Dominguez, F., Yoshimura, K., Yu, L., Drumond, A., Durán-Quesada, A. M., and Nieto, R.: Oceanic and Terrestrial Sources of Continental Precipitation, Rev. Geophys., 50, RG4003, https://doi.org/10.1029/2012RG000389, 2012.
Gimeno, L., Nieto, R., Drumond, A., Castillo, R., and Trigo, R. M.: Influence of the intensification of the major oceanic moisture sources on continental precipitation, Geophys. Res. Lett., 40, 1443–1450,, https://doi.org/10.1002/grl.50338, 2013.
Gimeno, L., Dominguez, F., Nieto, R., Trigo, R. M., Drumond, A., Reason, C., and Marengo, J.: Major Mechanisms of Atmospheric Moisture Transport and Their Role in Extreme Precipitation Events, Annu. Rev. Env. Resour., 41, 117–141, https://doi.org/10.1146/annurev-environ-110615-085558, 2016.
Gimeno-Sotelo, L., Nieto, R., Vázquez, M., and Gimeno, L.: A new pattern of the moisture transport for precipitation related to the drastic decline in Arctic sea ice extent, Earth Syst. Dynam., 9, 611–625, https://doi.org/10.5194/esd-9-611-2018, 2018.
Graversen, R. G., Mauritsen, T., Drijfhout, S., Tjernström, M., and Mårtensson, S.: Warm winds from the Pacific caused extensive Arctic sea-ice melt in summer 2007, Clim. Dynam., 36, 2103–2112, https://doi.org/10.1007/s00382-010-0809-z, 2011.
Hamilton, L. C. and Stroeve. J.: 400 predictions: The SEARCH Sea Ice Outlook 2008–2015, Polar Geography, 39, 274–287, https://doi.org/10.1080/1088937X.2016.1234518, 2016.
IPCC: Climate Change: The physical science basis, in: Contribution of working group 1 to the fifth assessment report of the intergovernmental panel on climate change, edited by: Stocker, T. F., Qin, D., Planttner, G. K., Tignor, M., Allen, S. K., Boschung, J., Nauels, A., Xia, Y., Bex, V., and Midgley, P. M., Cambridge University Press, Cambridge, UK and New York, NY, USA, 2013.
Jakobson, E., Vihma, T., Palo, T., Jakobson, L., Keernik, H., and Jaagus, J.: Validation of atmospheric reanalyses over the central Arctic Ocean, Geophys. Res. Lett., 39, L10802, https://doi.org/10.1029/2012GL051591, 2012.
Kapsch, M.-L., Graversen, R. G., and Tjernstrom, M.: Springtime atmospheric energy transport and the control of Arctic summer sea-ice extent, Nat. Clim. Change, 3, 744–748, https://doi.org/10.1038/nclimate1884, 2013.
Leppäranta, M.: A review of analytical models of sea-ice growth, Atmos. Ocean, 31, 123–138, https://doi.org/10.1080/07055900.1993.9649465, 1993.
Lorenz, C. and Kunstmann, H.: The hydrological cycle in three state-of-the-art reanalyses: Intercomparison and performance analysis, J. Hydrometeorol., 13, 1397–1420, https://doi.org/10.1175/JHM-D-11-088.1, 2012.
Numaguti, A.: Origin and recycling processes of precipitating water over the Eurasian continent: Experiments using an atmospheric general circulation model, J. Geophys. Res.-Atmos., 104, 1957–1972, https://doi.org/10.1029/1998JD200026, 1999.
Oshima, K. and Yamazaki, K.: Atmospheric hydrological cycles in the Arctic and Antarctic during the past four decades, Czech Polar Reports, 7, 169–180, https://doi.org/10.5817/CPR2017-2-17, 2017.
Park, H.-S., Lee, S., Son, S.-W., Feldstein, S. B., and Kosaka, Y.: The impact of poleward moisture and sensible heat flux on Arctic winter sea ice variability, J. Climate, 28, 5030–5040, https://doi.org/10.1175/JCLI-D-15-0074.1, 2015.
Philipp, A., Bartholy, J., Beck, C., Erpicum, M., Esteban, P., Fettweis, X., and Tymvios, S.: COST733CAT – a database of weather and circulation type classifications, Phys. Chem. Earth, 35, 360–373, https://doi.org/10.1016/j.pce.2009.12.010, 2010.
Roberts, A., Cassano, J., Döscher, R., Hinzman, L., Holland, M., Mitsudera, H., Sumi, A., Walsh, J. E., Alessa, L., Alexeev, V., Arendt, A., Altaweel, M., Bhatt, U., Cherry, J., Deal, C., Elliot, S., Follows, M., Hock, R., Kliskey, A., Lantuit, H., Lawrence, D., Maslowski, W., McGuire, A. D., Overduin, P. P., Overeem, I., Proshutinsky, A., Romanovsky, V., Sushama, L., and Truffer, M.: A Science Plan for Regional Arctic System Modeling: A Report to the National Science Foundation from the International Arctic Science Community, International Arctic Research Center (IARC), University of Alaska, Fairbanks, AK, USA, 2010.
Stohl, A. and James, P.: A Lagrangian analysis of the atmospheric branch of the global water cycle. Part I: Method description, validation, and demonstration for the August 2002 flooding in central Europe, J. Hydrometeorol., 5, 656–678, https://doi.org/10.1175/1525-7541(2004)005<0656:ALAOTA>2.0.CO;2, 2004.
Stohl, A. and James, P.: A Lagrangian analysis of the atmospheric branch of the global water cycle. Part II: Moisture transports between the Earth's ocean basins and river catchments, J. Hydrometeorol., 6, 961–984, https://doi.org/10.1175/JHM470.1, 2005.
Vázquez, M., Nieto, R., Drumond, A., and Gimeno, L.: Moisture transport into the Arctic: Source-receptor relationships and the roles of atmospheric circulation and evaporation, J. Geophys. Res.-Atmos., 121, 13493–13509, https://doi.org/10.1002/2016JD025400, 2016.
Vihma, T., Screen, J., Tjernström, M., Newton, B., Zhang, X., Popova, V., Deser, C., Holland, M., and Prowse, T.: The atmospheric role in the Arctic water cycle: A review on processes, past and future changes, and their impacts, J. Geophys. Res.-Biogeo., 121, 586–620, https://doi.org/10.1002/2015JG003132, 2016.
Woods, C. and Caballero R.: The role of moist intrusions in winter Arctic warming and sea ice decline, J. Climate, 29, 4473–4485, https://doi.org/10.1175/JCLI-D-15-0773.1, 2016.
Woods, C., Caballero, R., and Svensson, G.: Large-scale circulation associated with moisture intrusions into the Arctic during winter, Geophys. Res. Lett., 40, 4717–4721, https://doi.org/10.1002/grl.50912, 2013.
Yang, W. and Magnusdottir, G.: Springtime extreme moisture transport into the Arctic and its impact on sea ice concentration, J. Geophys. Res.-Atmos., 122, 5316–5329, https://doi.org/10.1002/2016JD026324, 2017.
Zhang, X., He, J., Zhang, J., Polyakov, I., Gerdes, R., Inoue, J., and Wu, P.: Enhanced poleward moisture transport and amplified northern high-latitude wetting trend, Nat. Clim. Change, 3, 47–51, https://doi.org/10.1038/nclimate1631, 2012.
- Abstract
- Introduction
- Data and methods
- Overview of the effects of changes in moisture on the Arctic sea ice and the moisture transport to the Arctic
- Results
- Links with different fusion mechanisms
- Concluding remarks
- Data availability
- Author contributions
- Competing interests
- Special issue statement
- Acknowledgements
- References
- Supplement


