the Creative Commons Attribution 4.0 License.
the Creative Commons Attribution 4.0 License.
 | 27 Sep 2018
Pipes to Earth's subsurface: the role of atmospheric conditions in controlling air transport through boreholes and shafts
Elad Levintal
Nadav G. Lensky
Amit Mushkin
Understanding air exchange dynamics between underground cavities (e.g., caves, mines, boreholes, etc.) and the atmosphere is significant for the exploration of gas transport across the Earth–atmosphere interface. Here, we investigated the role of atmospheric conditions in controlling air transport inside boreholes using in situ field measurements. Three geometries were explored: (1) a narrow and deep shaft (0.1 m wide and 27 m deep), ending in a large underground cavity; (2) the same shaft after the pipe was lowered and separated from the cavity; and (3) a deep large-diameter borehole (59 m deep and 3.4 m wide). Absolute humidity was found to be a reliable proxy for distinguishing between atmospheric and cavity air masses (mainly during the winter and spring seasons) and thus to explore air transport through the three geometries. Airflow directions in the first two narrow-diameter geometries were found to be driven by changes in barometric pressure, whereas airflow in the large-diameter geometry was correlated primarily with the diurnal cycles of ambient atmospheric temperature. CO2 concentrations of ∼2000 ppm were found in all three geometries, indicating that airflow from the Earth's subsurface into the atmosphere may also be significant in the investigation of greenhouse gas emissions.
- Article
(3525 KB) - Full-text XML
-
Supplement
(942 KB) - BibTeX
- EndNote


Understanding air transport between the Earth's subsurface and the atmosphere is a key element in the study of surface and near-surface biological, chemical, and physical processes. Air transport between the Earth and the atmosphere is commonly driven by diffusive and advective mechanisms (Choi and Smith, 2005; Ganot et al., 2014; Hillel, 1998; Kawamoto et al., 2006; Kuang et al., 2013; Noronha et al., 2017; Sánchez-Cañete et al., 2013) and has mainly been studied within soils (e.g., Allaire et al., 2009; Bayer et al., 2017; Choi and Smith, 2005; Zeng et al., 2017). However, as different types of natural or artificial boreholes and shafts also exist (e.g., Berthold and Börner, 2008; Kang et al., 2014, 2015), understanding the mechanisms that govern air and greenhouse gas (GHG) transport in such conduits is also important (Berthold and Börner, 2008; Perrier et al., 2005).
Boreholes and shafts are abundant discontinuities crossing the Earth's surface that commonly function as conduits between the ambient atmosphere and underground cavities (e.g., James et al., 2015; Moore et al., 2011; Pla et al., 2016; Steinitz and Piatibratova, 2010). These underground cavities can be more than 1 order of magnitude larger than the connecting conduit. Advective air transport in such boreholes or shafts can be governed mainly by (1) barometric pumping (BP), which is the inflow and outflow motion of subsurface air due to pressure gradients governed by changes in barometric pressure (Ellerd et al., 1999; Neeper, 2002; Neeper and Stauffer, 2012; Perina, 2014; Perrier and Le Mouël, 2016; Rossabi and Falta, 2002; Thorstenson et al., 1998), and (2) density-induced convection (DIC), which develops when there are unstable density gradients resulting from temperature and air composition differences between the atmospheric air and the borehole or underground cavity (Ganot et al., 2012; Nachshon et al., 2008; Perrier et al., 2002; Weisbrod et al., 2009; Weisbrod and Dragila, 2006).
BP will initiate airflow when pore pressure in the surrounding rock–soil differs from the pressure within the borehole or the underground cavity, which is considered as equal to atmospheric pressure (Kuang et al., 2013; Neeper, 2003; You et al., 2010). BP is dependent on the surrounding rock–soil depth and permeability and on the barometric pressure changes (Massmann et al., 2000). A water table at the lower boundary is considered to be impermeable to BP (You et al., 2010).
The onset of DIC is typically primarily determined by temperature differences within the borehole or shaft and between them and the atmosphere above. Temperature differences can differ between locations and depend on several parameters, such as the surrounding rock–soil thermal properties, the geometry of the borehole, or the atmosphere temperature cycles (e.g., Eppelbaum and Kutasov, 2011; Klepikova et al., 2011; You and Zhan, 2012). Although air density depends mainly on temperature, it also depends on the air humidity and to a lesser degree on the air's gas composition (Kowalski and Sánchez-Cañete, 2010). The integration of these three effects (temperature, relative humidity, and air composition) into a single parameter called virtual temperature (Tv) was proposed by Sánchez-Cañete et al. (2013). In environments of high CO2 concentrations compared to the atmosphere, the importance of the gas composition in the Tv becomes more pronounced. Such underground environments can be karstic areas of carbonate rocks (Sanchez-Cañete et al., 2011), caves (Denis et al., 2005; Guillon et al., 2015), and soils (Amundson and Davidson, 1990) in which CO2 concentrations can be very high, ranging as high as 100 000 ppm and above. For a given altitude, the differences in Tv will determine the onset of DIC.
Each of the above advective mechanisms was studied individually. However, to the best of our knowledge, no comparative research has been conducted to determine which mechanisms dominate different borehole and shaft geometries, e.g., different borehole diameters. Therefore, the relative contribution of each mechanism to the overall air transport within boreholes or shafts under different environmental conditions remains loosely constrained.
Here, we investigated the role of atmospheric conditions in the air transport mechanisms inside three borehole geometries: (1) a narrow-diameter shaft (0.1 m) with a PVC pipe opening into a large underground cavity (defined hereafter as “shaft” geometry); (2) the same shaft after the pipe was lowered and the link between the shaft and the underground cavity was blocked (“borehole” geometry); and (3) a borehole with a larger diameter of 3.4 m (“large-diameter borehole” geometry). Specifically, we aimed to assess the air inflow and outflow events by quantifying the oscillation of physical parameters, mainly temperature and relative humidity (RH) along the boreholes, and relate the flow events to the atmospheric forcing conditions.
We examined two sites: (1) a narrow-diameter (0.1 m) 27 m deep borehole that reaches a large underground cavity located above the local water table of the southern part of the Israeli coastal aquifer and (2) a large-diameter (3.4 m) 59 m deep borehole that reaches the local aquifer near the Nabatean archaeological site of Avdat in the Negev highlands of southern Israel. The distance between these sites is ∼60 km.
The first borehole was drilled into a sequence of alternating layers of sand, sandstone, and silt comprising the unsaturated zone of the Israeli coastal aquifer (Goren et al., 2014; Schwarz et al., 2016). A PVC pipe (case) was inserted into the narrow-diameter borehole to prevent potential soil collapse. The pipe reached the top of the underground cavity, which is at least 2 orders of magnitudes larger in volume than the pipe and is located well above the local groundwater level of ∼80 m below the ground. The measurements lasted 46 days during the spring–summer of 2016 with only one rainy day during that period (13 April 2016). During the first 42 days of measurement (5 April–16 May 2016), the underground cavity was connected to the atmosphere only by the PVC pipe (shaft geometry). Then, for an additional 4 days, the PVC pipe was lowered such that the end of the pipe touched the cavity floor, effectively disconnecting the underground cavity from the borehole and the atmosphere (borehole geometry). Therefore, we could distinguish between airflow when (1) the borehole connects between the ambient atmosphere and the deep cavity and (2) the borehole is disconnected from an underground reservoir and only connected to the ambient atmosphere.
The second borehole site (large-diameter borehole) is an archaeological site that was excavated into Eocene chalk formations with an upper part of loess soil (Nativ et al., 2003; Shentsis et al., 1999). The water table in this site is at a depth of ∼55.5 m with small seasonal changes of less than 1 m; thus, the 59 m deep borehole reached the local water table. The borehole did not have casings except for a few meters in the upper parts of the loess soil, and it was open to the atmosphere. The measurements at this site lasted for 1 week (20–26 April 2017). The three geometries are illustrated in Fig. 1a.
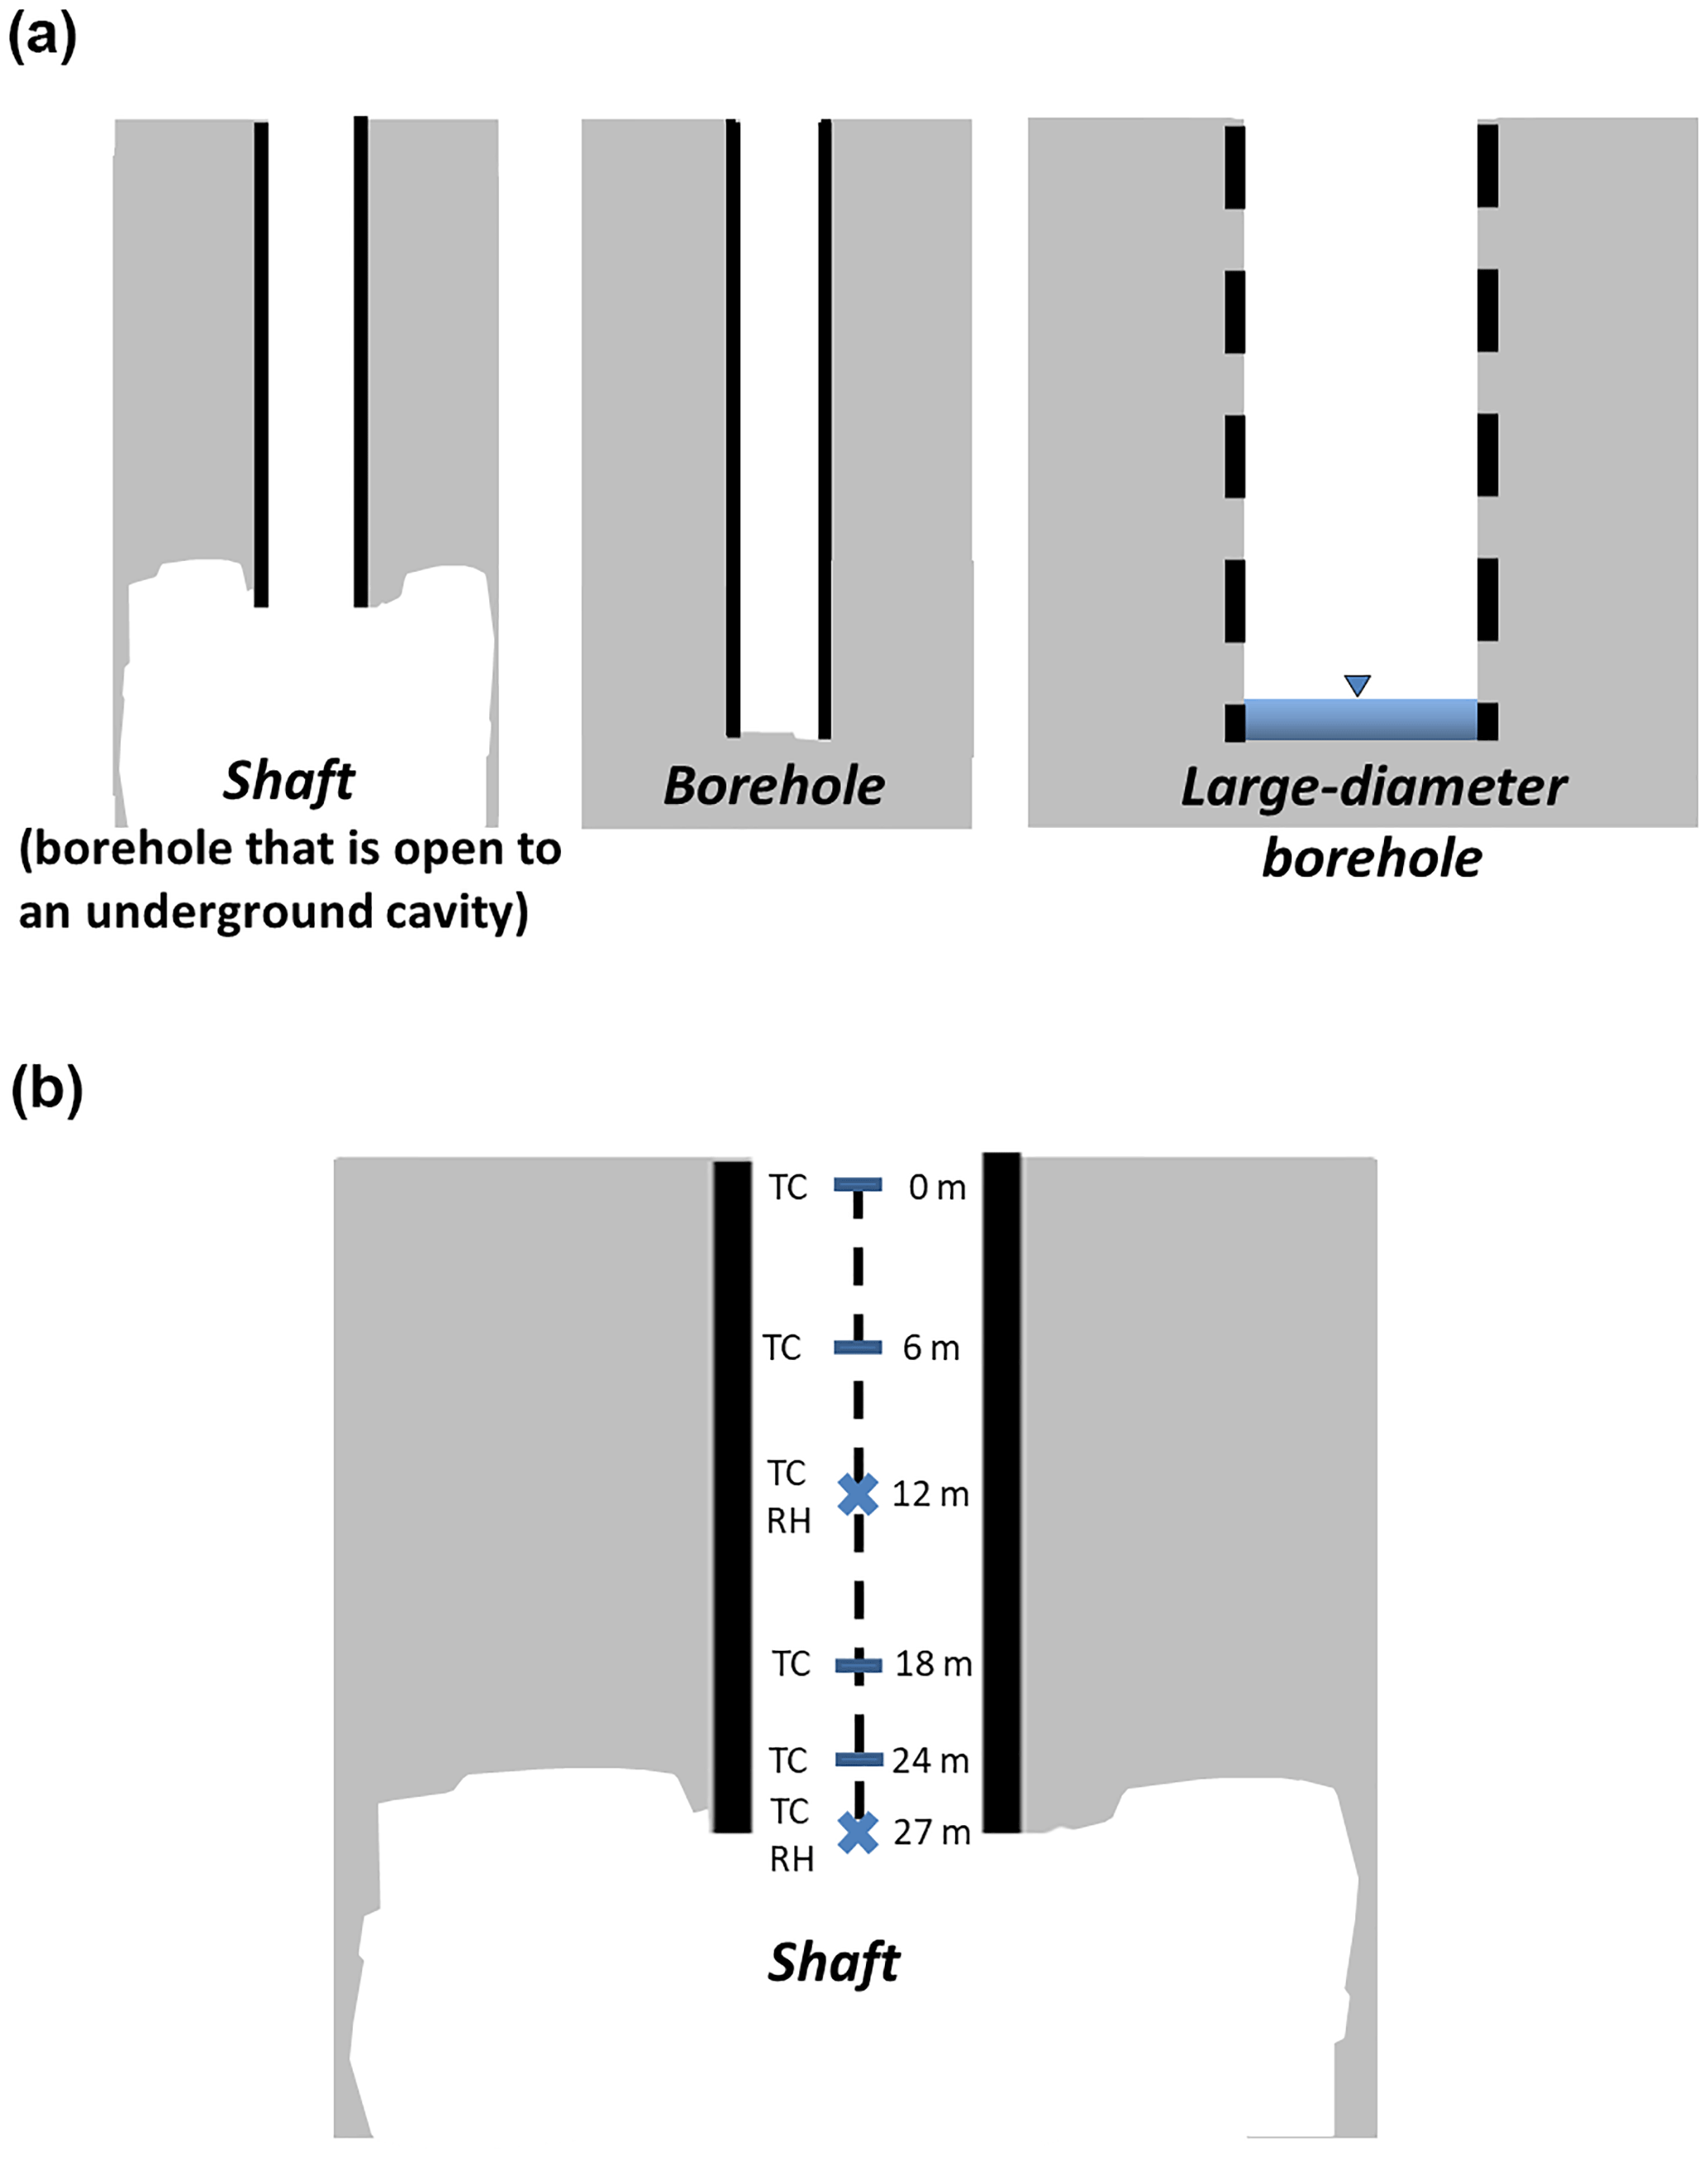
Figure 1Schematic illustration of the three studied geometries (a) and an example of the sensor locations within the shaft (b). The sensor locations within the shaft included four thermocouples at depths of 0, 6, 18, and 24 m and two RH–temperature sensors at the lower part of the shaft at its connection point to the cavity (27 m of depth).
Sensors installed at the first site included four thermocouples (type T, Omega Engineering, UK) at depths of 0, 6, 18, and 24 m and two RH–temperature sensors (Hygroclip 2, Rotronic AG, Switzerland) at a depth of 12 m and at the lower part of the borehole at its connection point to the cavity (27 m of depth); see Fig. 1b for an example of sensor locations. Outside the borehole, a meteorological station was installed at 2 m aboveground, including the following sensors: (1) wind velocity and direction (WindSonic, Gill Instruments, UK); (2) barometric pressure (CS106, Vaisala, Finland); and (3) RH–temperature (same type as within the borehole). Data from all sensors were measured at 5 s intervals and averaged and logged at 10 min intervals (CR1000, Campbell Scientific, UT, USA). In addition, a televiewer was lowered into the pipe to verify that the pipe was intact and was either connected to or disconnected from the underground cavity in the shaft or borehole, respectively. Measurements at the second site included a similar RH–temperature sensor at the depth of 10 m and a temperature sensor at 59 m.
Absolute humidity (AH) was used as a tracer for the air transport within the three geometries and was calculated from the measured temperature and RH data using Eq. (1) (Hall et al., 2016):
where ρv is AH in g m−3, T is temperature in ∘C, and U is RH in %. The use of AH as a tracer was previously suggested by Neeper (2003). The calculation of Tv for the onset of DIC between the borehole and atmosphere was done according to Sánchez-Cañete et al. (2013).
3.1 Shaft geometry
A 1-week time series of results from the shaft is shown in Fig. 2a. Atmospheric temperature and RH presented typical daily cycles, as expected. During daytime, atmosphere air temperatures were higher with lower RH values (25–3 ∘C, 20 %–50 %, respectively) compared to nighttime (10–15 ∘C, 80 %–100 %, respectively) (Fig. 2a nos. 1 and 2, black lines). In contrast, air temperature and RH changes inside the shaft did not follow the daily cycle (Fig. 2a nos. 1 and 2, purple and green lines). Measured temperatures at 12 and 27 m were 23.7±0.7 and 24.7±0.6 ∘C, respectively, with similar amplitudes. The RH sensors showed similar values at 12 and 27 m (Fig. 2a no. 2, purple and green lines, respectively): from the overall 6048 measurements (42 days) at 12 and 27 m, 79 and 76 % of the RH values were above 90 %, respectively. The remainder of the measurements were no lower than a minimum of ∼50 % RH (Fig. S1 in the Supplement).
Barometric pressure typically varied with two diurnal cycles; the average barometric pressure was 1008.68±3.2 mbar (Fig. S1) with a rate of change ranging from to mbar min−1 (Fig. 2a no. 4). For the majority of the time (80 %) the Tv values at the lower part of the shaft (depths of 12 and 27 m) were higher than those measured in the atmospheric air with an average Tv difference of 4.0±5.4 ∘C (Fig. 2a no. 5). Wind velocity at 2 m aboveground was mostly calm (1–2 m s−1) with daily peaks of 7–10 m s−1 in the afternoon corresponding to the Mediterranean sea breeze (13:00–18:00 LT, Fig. 2a no. 6) (Lensky and Dayan, 2012).
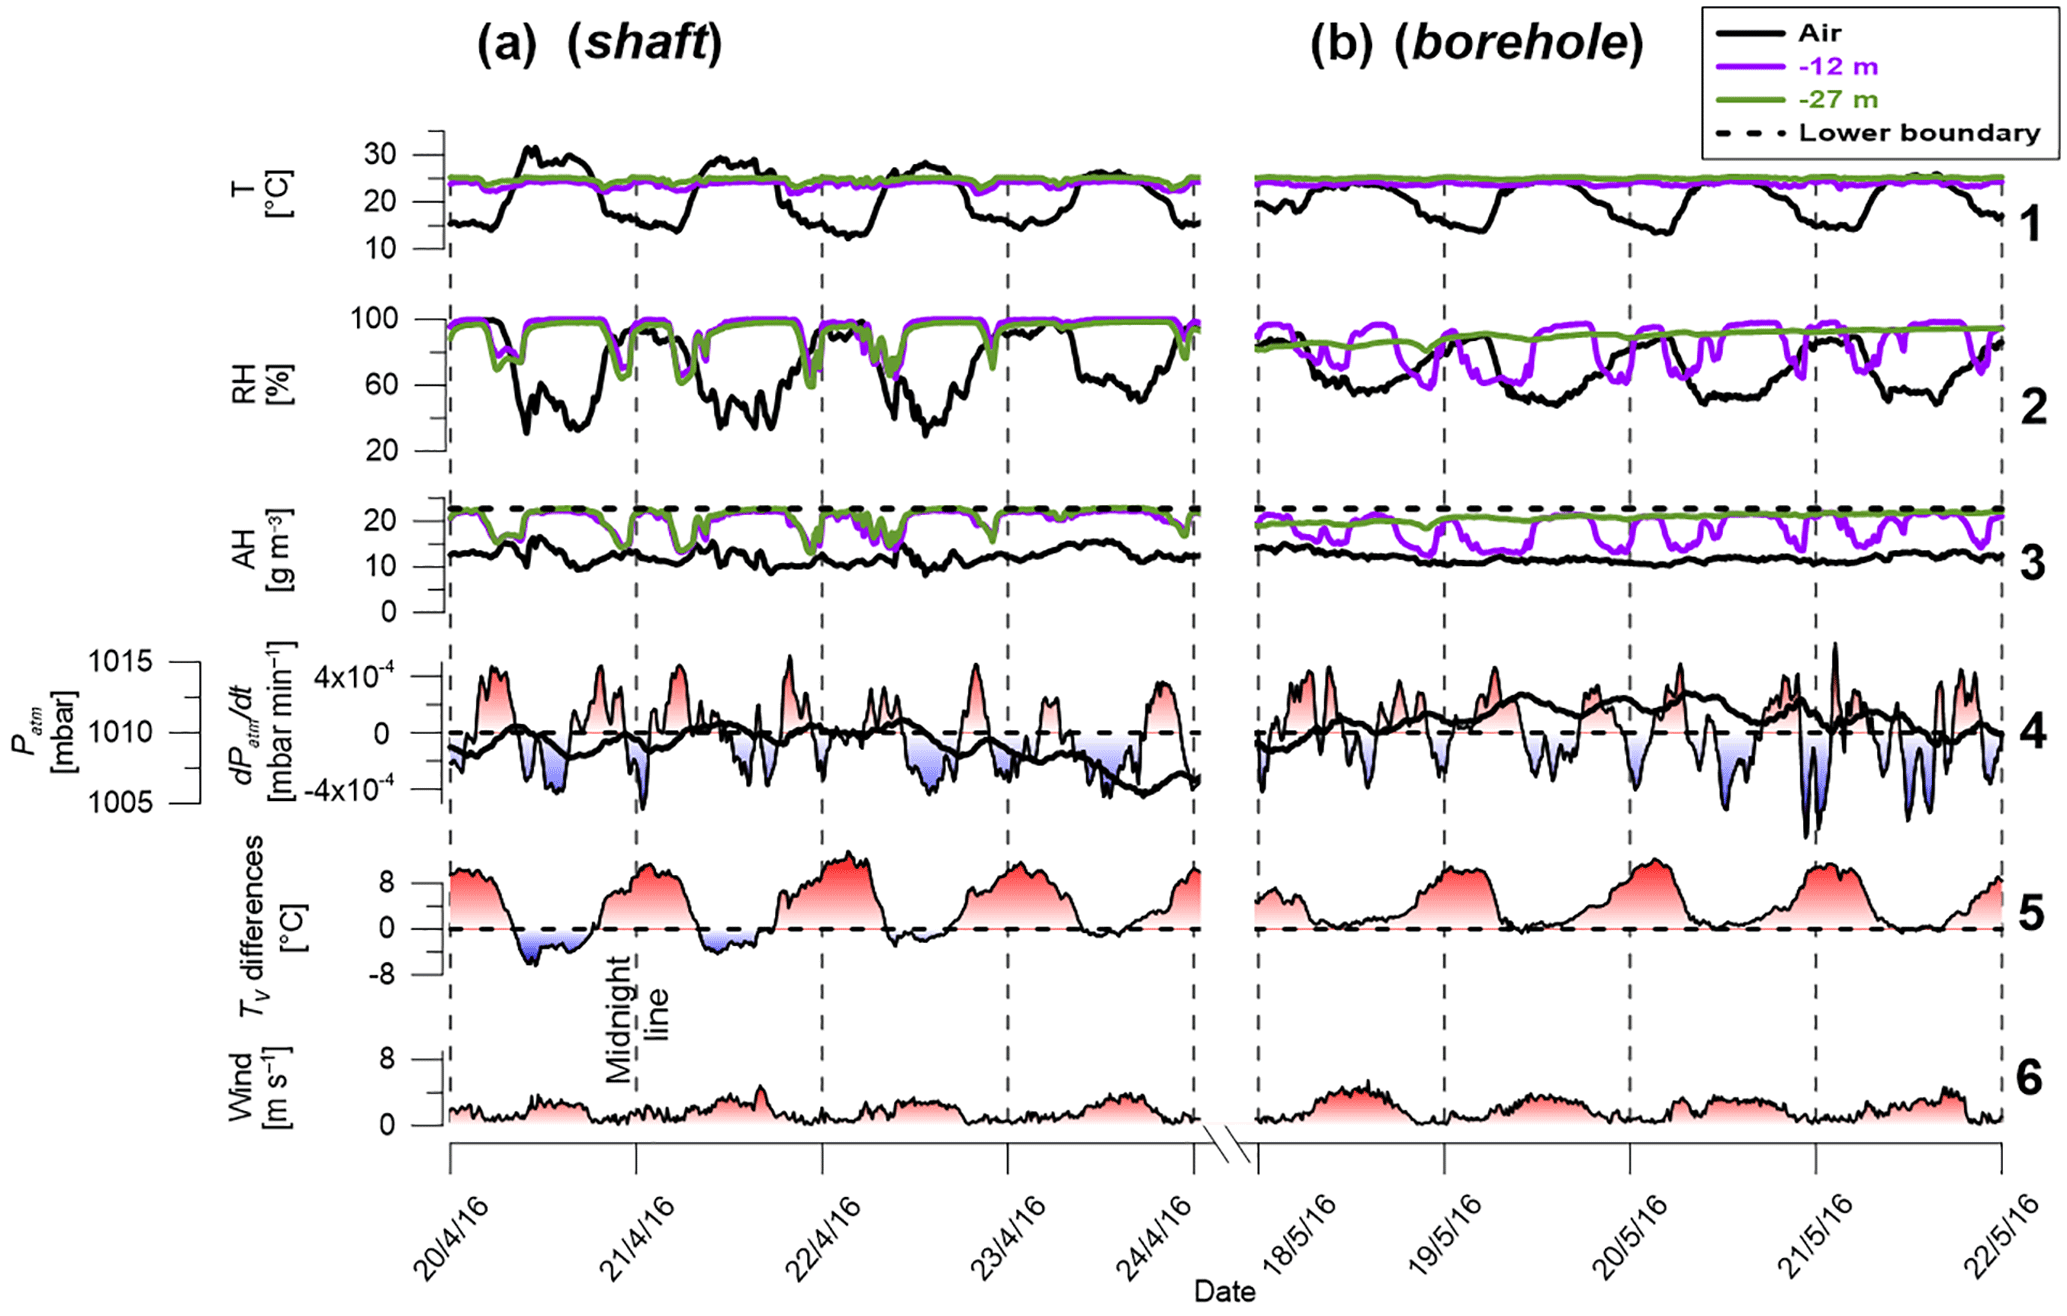
Figure 2Time series results from four representative days for the shaft (a) and borehole (b). For simplicity, results from only four continuous days are shown and the complete data from the 42 days of measurements are shown in Fig. S1. Absolute humidity (AH) values were calculated using Eq. (1). The lower boundary (black dashed line in no. 3) was approximated as constant with T=24.7 ∘C and RH =100 % and for the case of the borehole represents the values at the soil–borehole interface. Tv difference values (Eq. 5) represent the Tv differences between 12 m of depth and the air aboveground. Tv values were calculated according to Sánchez-Cañete et al. (2013) using CO2 concentrations of 2000 and 400 ppm for 12 m of depth and air aboveground, respectively. The CO2 value used for 12 m was obtained from 2 weeks of measurements within the borehole during the winter of 2017, during which the CO2 did not exceed 2000 ppm.
Atmospheric AH was stable during the measurement period and values ranged between 10 and 15 g m−3. Contrastingly, the AH at the underground cavity boundary was considered as a constant value of 22.7 g m−3 according to T=24.7 ∘C (the measured temperature at the shaft–cavity interface) and RH =100 % (representing saturation conditions as suggested for underground cavities by Bourges et al., 2014, and Perrier et al., 2005). AH values inside the shaft fluctuated between these two end values (cavity at the bottom and atmosphere at the top). Most of the time shaft AH values at 12 and 27 m reflected cavity values (>20 g m−3) and ∼10 % of the time shaft AH values reflected atmospheric values below 15 g m−3 (Fig. 2a no. 3, purple and green lines). No marked difference was observed between the 12 and 27 m values. Considering the shaft's impermeable perimeter (i.e., the PCV pipe), AH changes in the shaft necessarily indicate inflow–outflow from the shaft's lower and upper boundaries (i.e., the atmosphere or cavity air). We therefore regard low and high AH values in the shaft as indicators of down-welling mass flow (inflow) and upwelling mass flow (outflow), respectively. The use of AH as a proxy for airflow direction is suitable mainly for the winter and spring seasons when the atmospheric AH is lower compared to AH within underground cavities (Figs. S2 and S3). During the summer season, there are periods in which atmosphere and cavity AH are in equilibrium, and thus the use of AH as a proxy for airflow directions would not be reliable (see the Supplement for AH sensitivity analysis).
To quantitatively define each inflow or outflow event, a classification algorithm was built and solved for the 42-day data using MATLABTM software. The 12 m AH vector was transformed to a dρv∕dt vector and then two conditions were defined as “must” so that an event is classified as an “inflow” or an “outflow” event: (1) dρv∕dt < threshold value for an inflow event or dρv∕dt > threshold value for an outflow event; and (2) the first condition (1) is met for at least two continuous readings (≥20 min). In other words, the dρv∕dt inside the shaft represented the AH changes in the shaft over time. This AH change was controlled by the air inflow or outflow from the upper or lower boundary, respectively. Therefore, dρv∕dt was used to classify the airflow direction. The threshold value that was found optimal to classify airflow was 50 % of the dρv∕dt standard deviation. Using greater threshold values resulted in an underestimation of the number of both the inflow and outflow events and vice versa for the case of lower threshold values. As an example for the classification algorithm, the results from the inflow and outflow classification for eight arbitrarily selected representative days (from Fig. 2) are shown in Fig. 3.
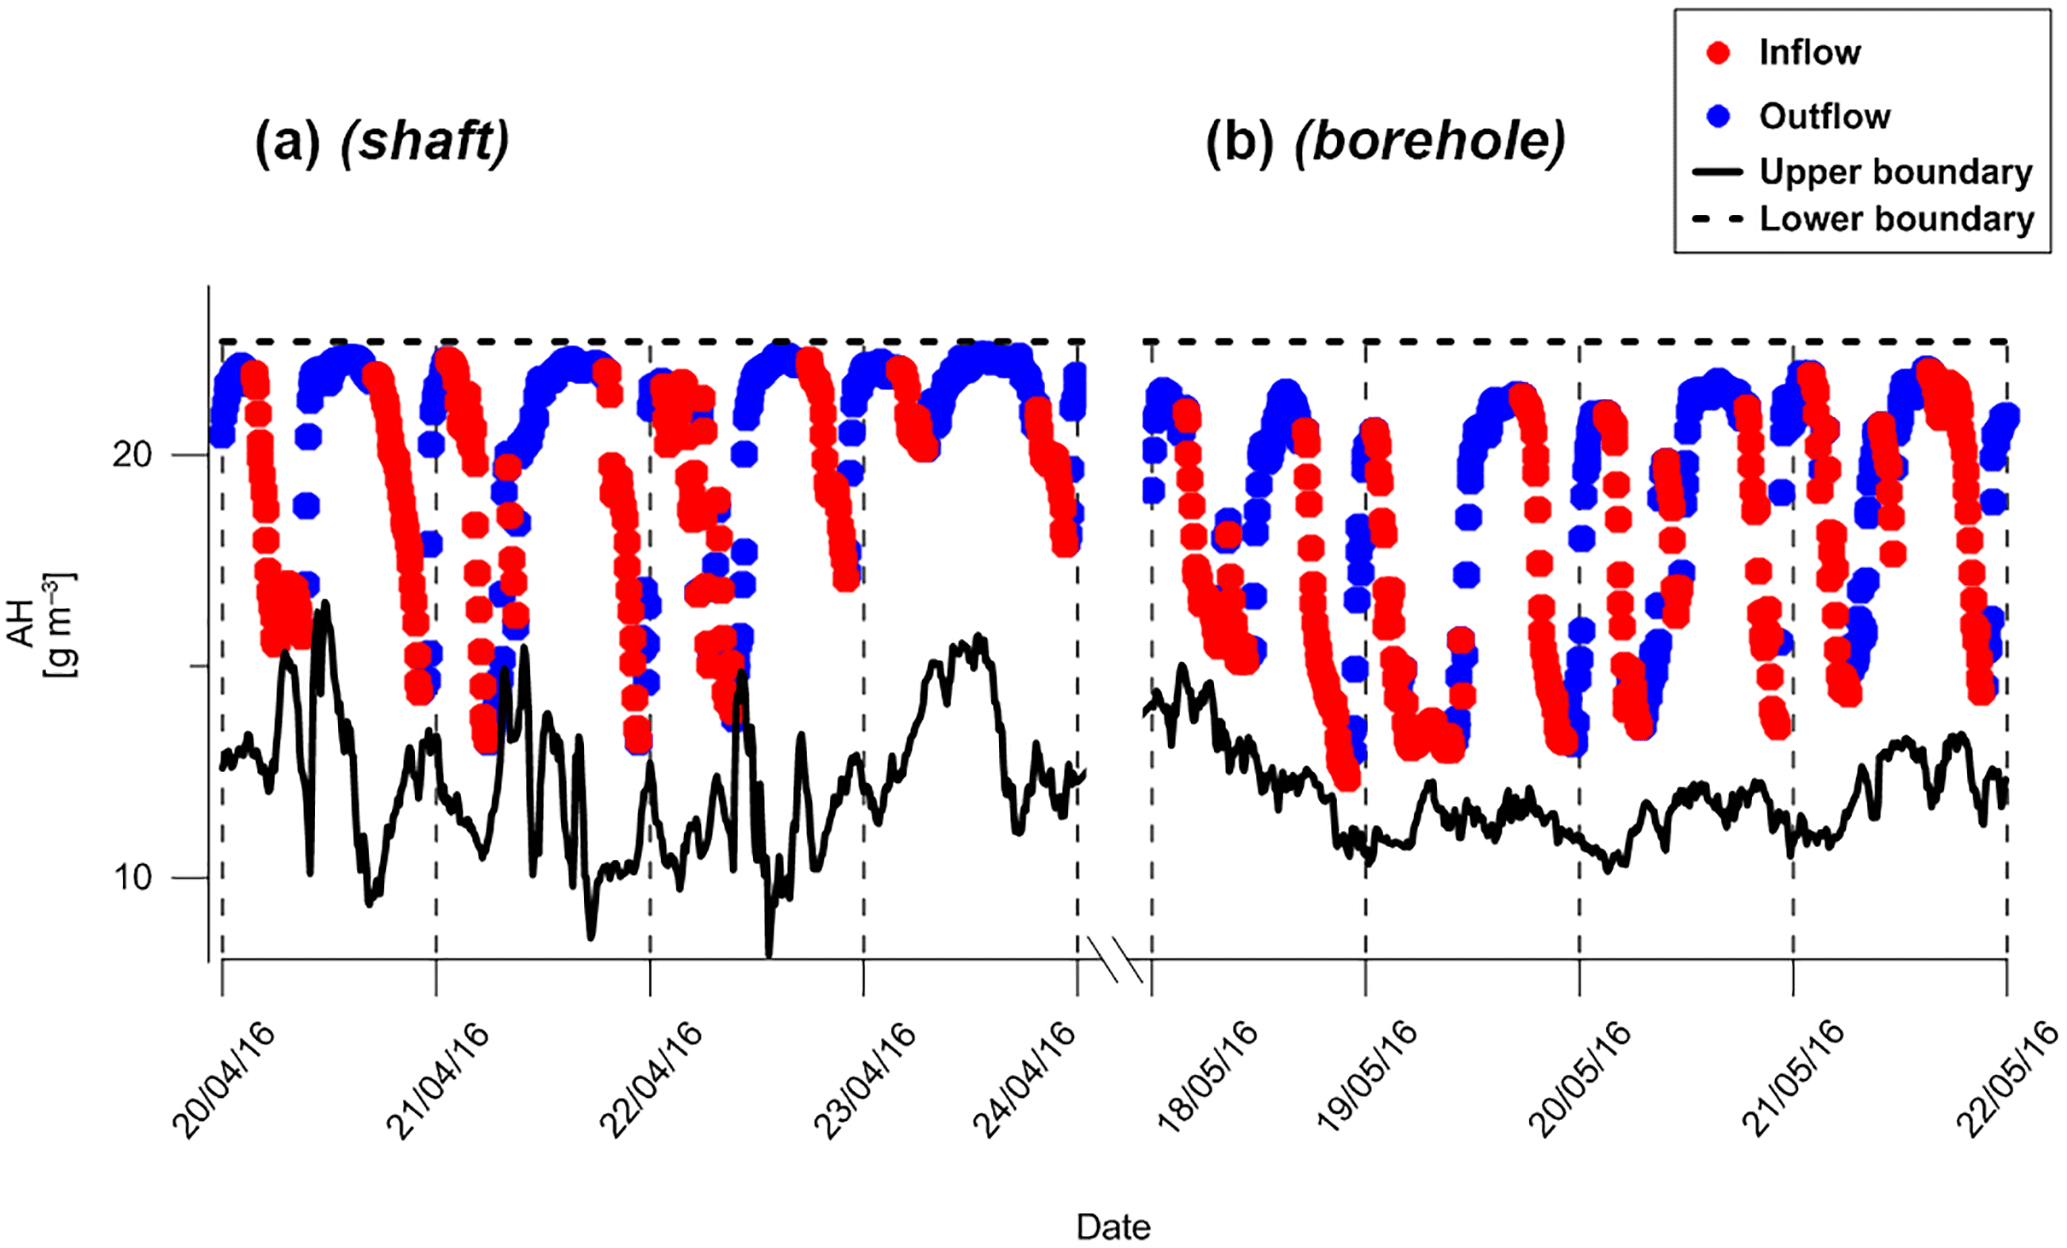
Figure 3Classification of inflow and outflow transition events at 12 m of depth for the shaft (a) and borehole (b). The upper boundary represents the AH values according to the temperature and RH measured at 2 m aboveground; the lower boundary represents the AH values in the underground cavity (shaft) or the soil–borehole interface (borehole). Point intervals are at 10 min each.
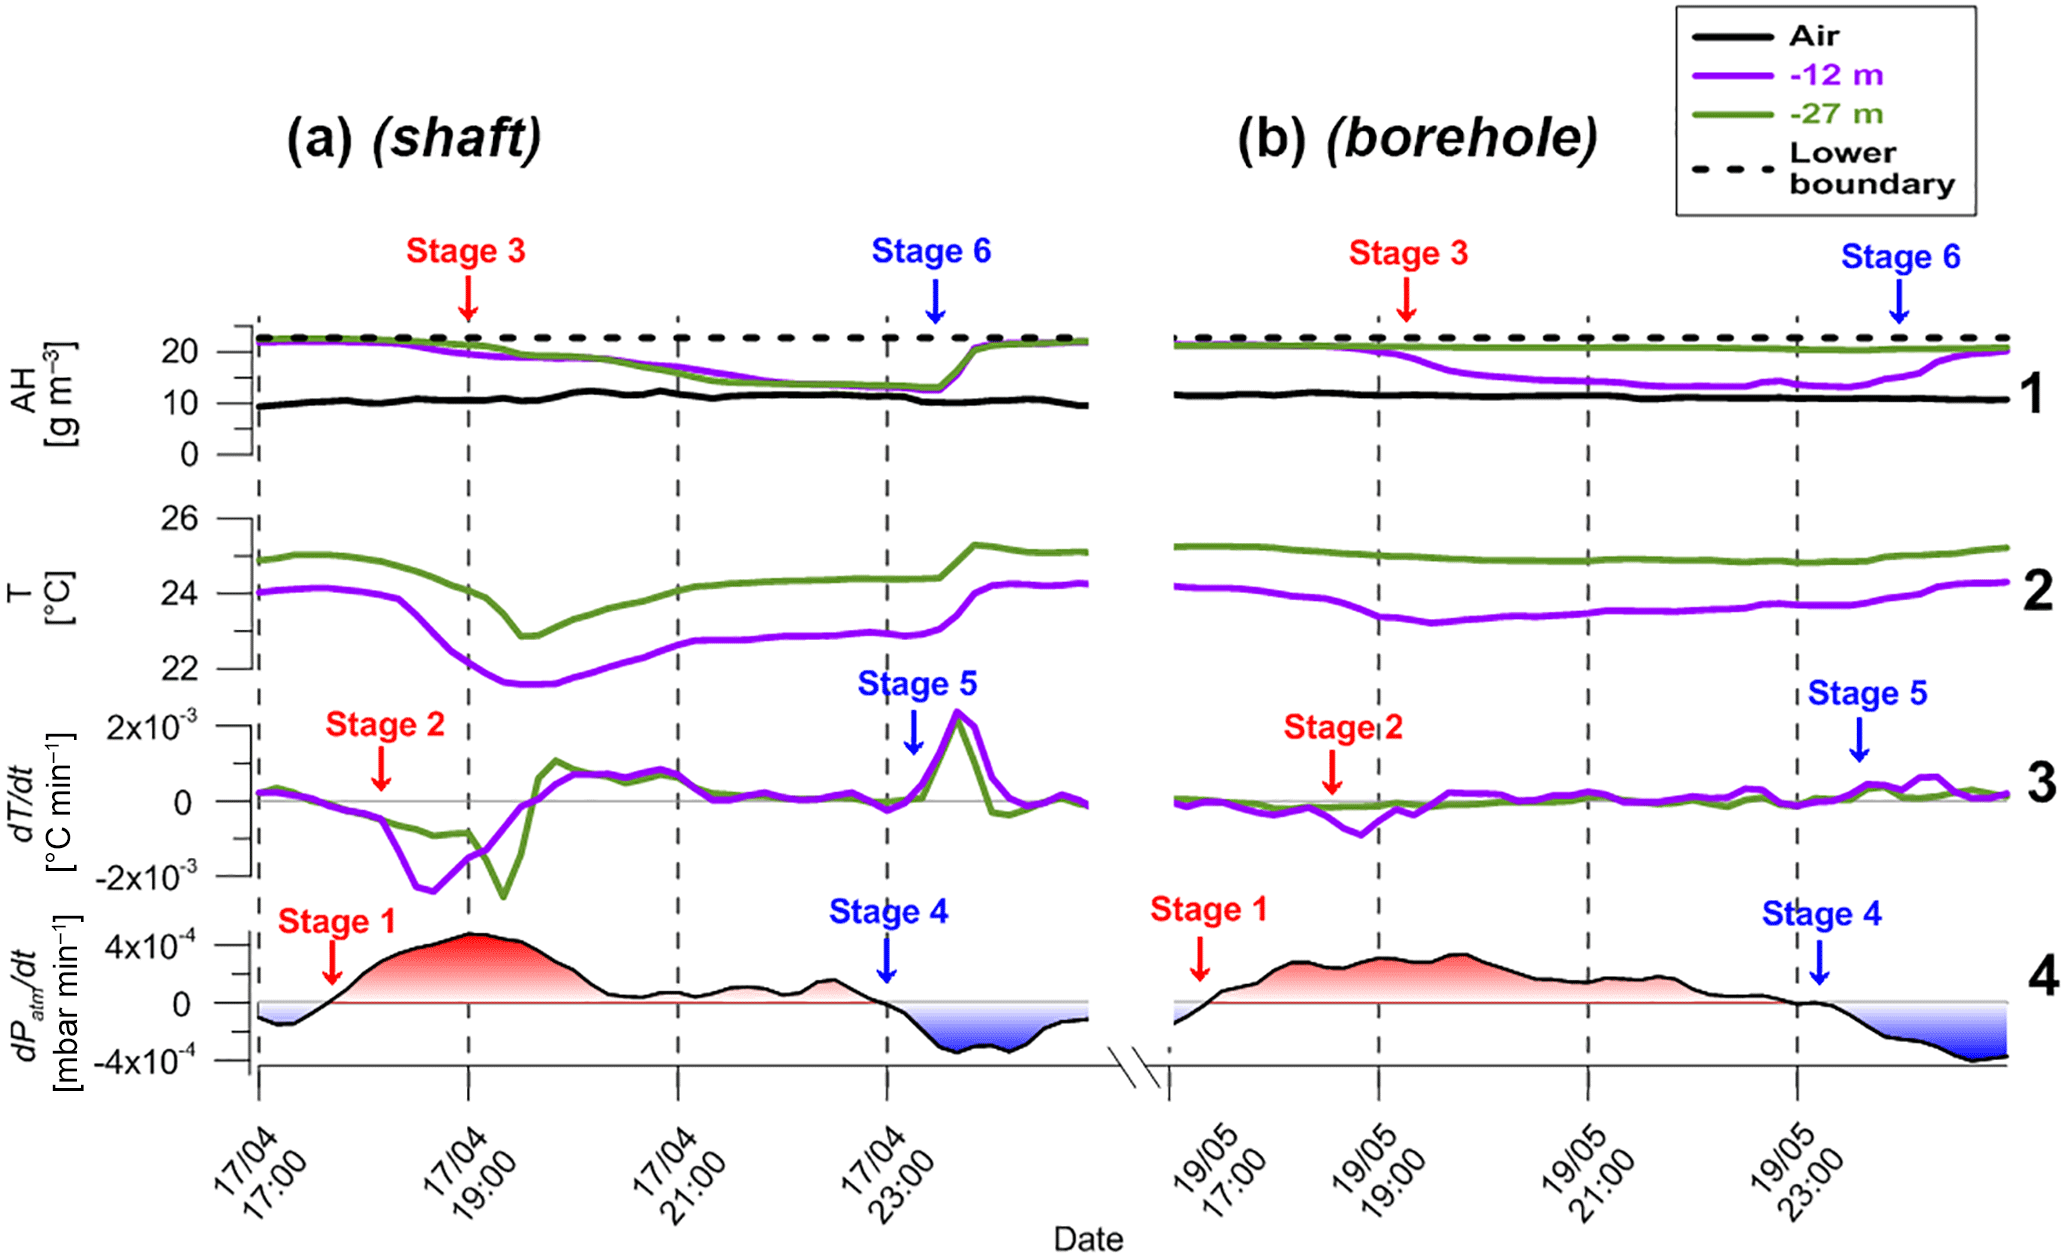
Figure 4Time series results from a single transition event. Panels (a) and (b) represent the shaft and borehole results, respectively. The red and blue text fonts represent stages in the inflow and outflow events, respectively. dT∕dt values were derived from the temperature values in line 2.
To identify the physical parameters that control the transition between air inflow and outflow events, we focused on and analyzed in detail single events, one of them given as an example in Fig. 4. In a typical event, with both inflow and outflow, three stages were observed: (1) transition of dPatm∕dt (i.e., changes in barometric pressure over time) from negative to positive values (stage 1), (2) followed by a momentary decrease in temperature in the shaft observed by the temperature sensors at depths of 12 and 27 m (stage 2), and (3) finally inflow of air from the ambient atmosphere downward into the shaft that reduced the AH (stage 3). These stages were repeated in reverse in an outflow event (stages 4–6). The time lags between the changes in dPatm∕dt (stage 1) and the start of inflow–outflow events (stage 3) were similar in 60 % of the events (≤20 min). In the remaining 40 % of events, time lags were greater than 20 min (20–60 min; Fig. 5). The middle stage of a momentary temperature change inside the shaft (stages 2 and 5 in Fig. 4) was previously reported by Perrier et al. (2002), who attributed these temperature changes to vertical movements of cold air plumes. In addition, these changes also provide further indication of the airflow origin. In an inflow event, it is expected that the sensor located closer to the atmosphere will respond before the lower one and the opposite in a case of outflow from the cavity. Indeed, in an inflow event the negative dT∕dt peak occurs at a depth of 12 m before 27 m and vice versa in an outflow event (Fig. 4a no. 3). Stages 2 and 4 in Fig. 4 are valid mainly during winter and spring nighttimes when atmospheric temperatures are lower than within the borehole.
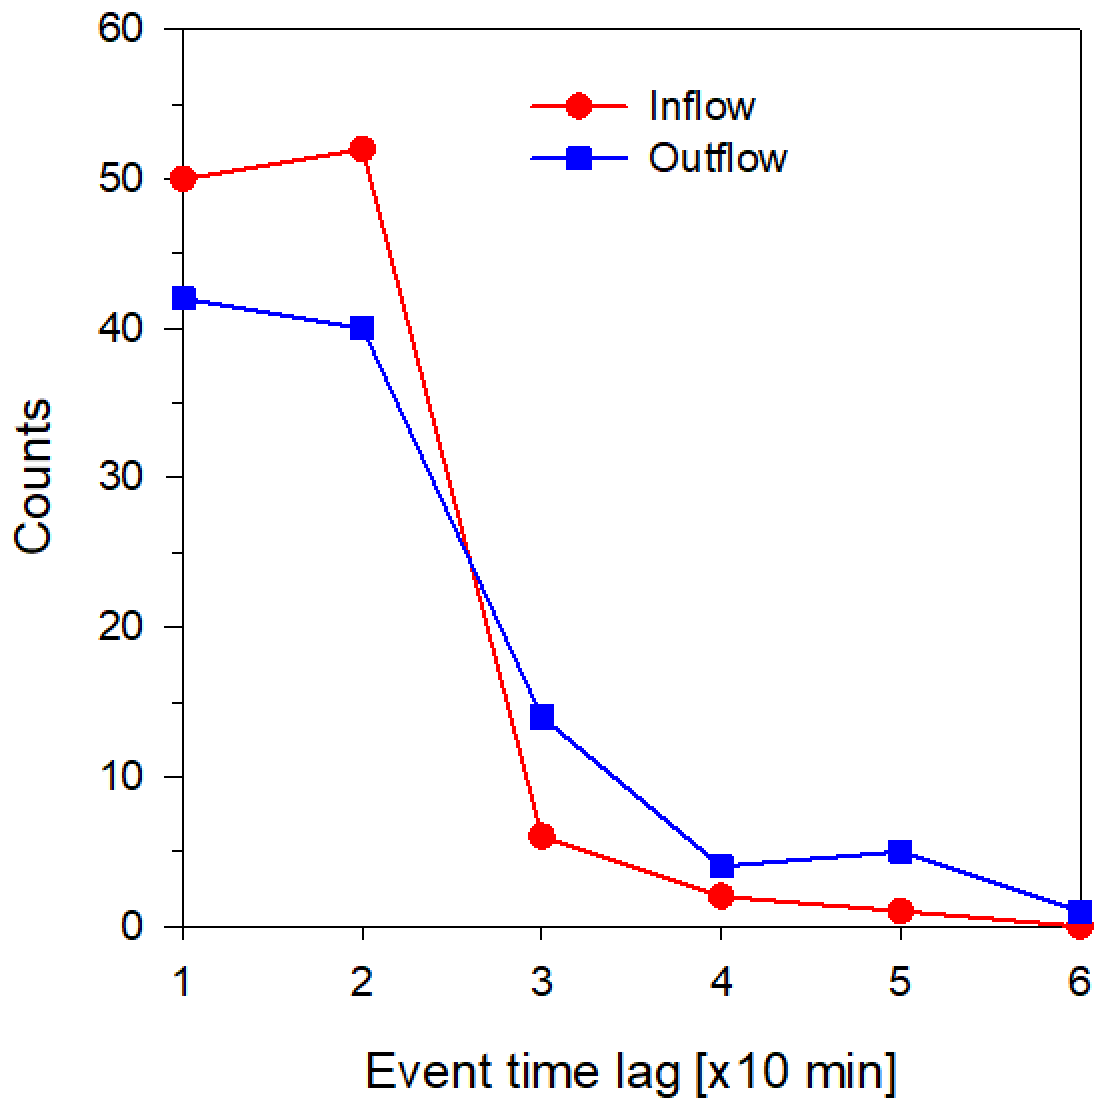
Figure 5Time lags between changes in dPatm∕dt (i.e., changes in barometric pressure over time) and the start of inflow–outflow events. Event classification was done automatically using the data from the 12 m depth sensors. Red symbols represent the time lag between the transition of dPatm∕dt from negative to positive values and the start of an inflow event (stages 1 and 3 in Fig. 4). Blue symbols represent the time lag between the transition of dPatm∕dt from positive to negative values and the start of an outflow event (stages 4 and 6 in Fig. 4).
Figure 6 examines the correlation between the direction of air transport (inflow–outflow) and the atmospheric forcing, i.e., changes in barometric pressure and thermal stability. The general distribution of dPatm∕dt in the 42 days of measurements was defined as a normal distribution with an average dPatm∕dt∼0 (Fig. 6a). However, when analyzing only the dataset from the inflow–outflow events there was a clear trend in the dPatm∕dt distribution. As expected, an inflow event (i.e., stage 3 of AH decrease) occurred when barometric pressure increased, dPatm∕dt>0 (Fig. 6b), whereas an outflow event (i.e., stage 6 of AH increase) occurred when barometric pressure decreased, dPatm∕dt<0 (Fig. 6c). A similar analysis was done to check whether there is a correlation between the shaft–atmosphere Tv differences and the direction of air transport (i.e., AH changes). In this case, no significant changes were observed between the distribution in an inflow or outflow event (Fig. 6e and f) and the general distribution over the 42 days (Fig. 6d). The finding that dPatm∕dt rather than Tv differences explains a very large portion of the air transport polarity variance implies that the inflow–outflow changes inside the shaft were due to atmospheric barometric pressure changes and not due to thermal instability (i.e., DIC) inside the shaft. It is noteworthy that because of the time lag (about 20 min) between the changes in dPatm∕dt and the initiation of the inflow–outflow events, it is expected that not all inflow–outflow events will be explained by the dPatm∕dt distribution analysis in Fig. 6. Previous studies in which DIC was found to be the governing convective air movement mechanism in the subsurface were focused on shallow systems (1–2 m of depth; Ganot et al., 2012, 2014; Levintal et al., 2017; Weisbrod et al., 2009). Here, we focus on deeper settings in which barometric pressure variations appear to be more important than DIC for the development of convective air movement.
Our results indicate that changes in atmosphere barometric pressure determine the advective airflow direction. This is presumably due to the difference between the barometric pressure and the cavity pressure caused by the vertical propagation of the barometric pressure (Neeper, 2003; Neeper and Stauffer, 2012; Perina, 2014; You et al., 2011). In the case of positive barometric pressure changes (i.e., increase in barometric pressure over time), the barometric pressure will be greater than the cavity pressure and thus inflow of air will develop. In contrast, outflow of air will start when negative pressure changes occur (i.e., decrease in barometric pressure over time).
3.2 Borehole geometry
Atmospheric conditions during the borehole measurements presented daily temperature and RH cycles (Fig. 2b nos. 1 and 2, black lines). During daytime, air temperatures and RH values were 20–25 ∘C and 50 %–70 %, respectively, compared to nighttime values of 15–18 ∘C and 80 %–90 %. At a depth of 12 m, the average temperature, RH, and AH were 23.9±0.3 ∘C, 83.7 %±13.0 %, and 18.2±3.0 g m−3, respectively (Fig. 2b nos. 1–3, purple lines). In contrast, at a depth of 27 m, measurements were significantly more stable than at 12 m: temperature, RH, and AH averages values were 25.1±0.2 ∘C, 90.0 %±3.6 %, and 20.8±0.9 g m−3, respectively (Fig. 2b nos. 1–3, green lines).
In the inflow events the AH values in the middle borehole sensor (12 m) were similar to the upper atmospheric values (Fig. 2b no. 3, purple and black lines), whereas in the outflow events they equalled those in the lower part of the borehole (Fig. 2b no. 3, purple and black dash lines). Nonetheless, the airflow effect was observed only at the 12 m depth and not at 27 m (Fig. 2b no. 3, green line). Therefore, we conclude that inflow events reached the depth of 12 m but did not reach depths of 27 m.
3.3 Comparison between shaft and borehole geometries
While all shaft and borehole parameters at site 1, other than the connection to the lower cavity, were identical and the atmospheric conditions in the two measurement periods were similar, there were still clear differences between the two geometries. The borehole temperature readings at 12 m exhibited only half of the standard deviation compared to the same depth in the shaft (±0.3 ∘C compared to ±0.7 ∘C). At 27 m, the differences between the two geometries were even more pronounced (Fig. 2a nos. 1 and 2; compare to Fig. 2b nos. 1 and 2, green lines). No significant changes in temperature or RH along the measurement period were measured at 27 m for the borehole, while there were changes observed in the shaft (e.g., shaft RH at 27 m fluctuated between 60 and 100 %).
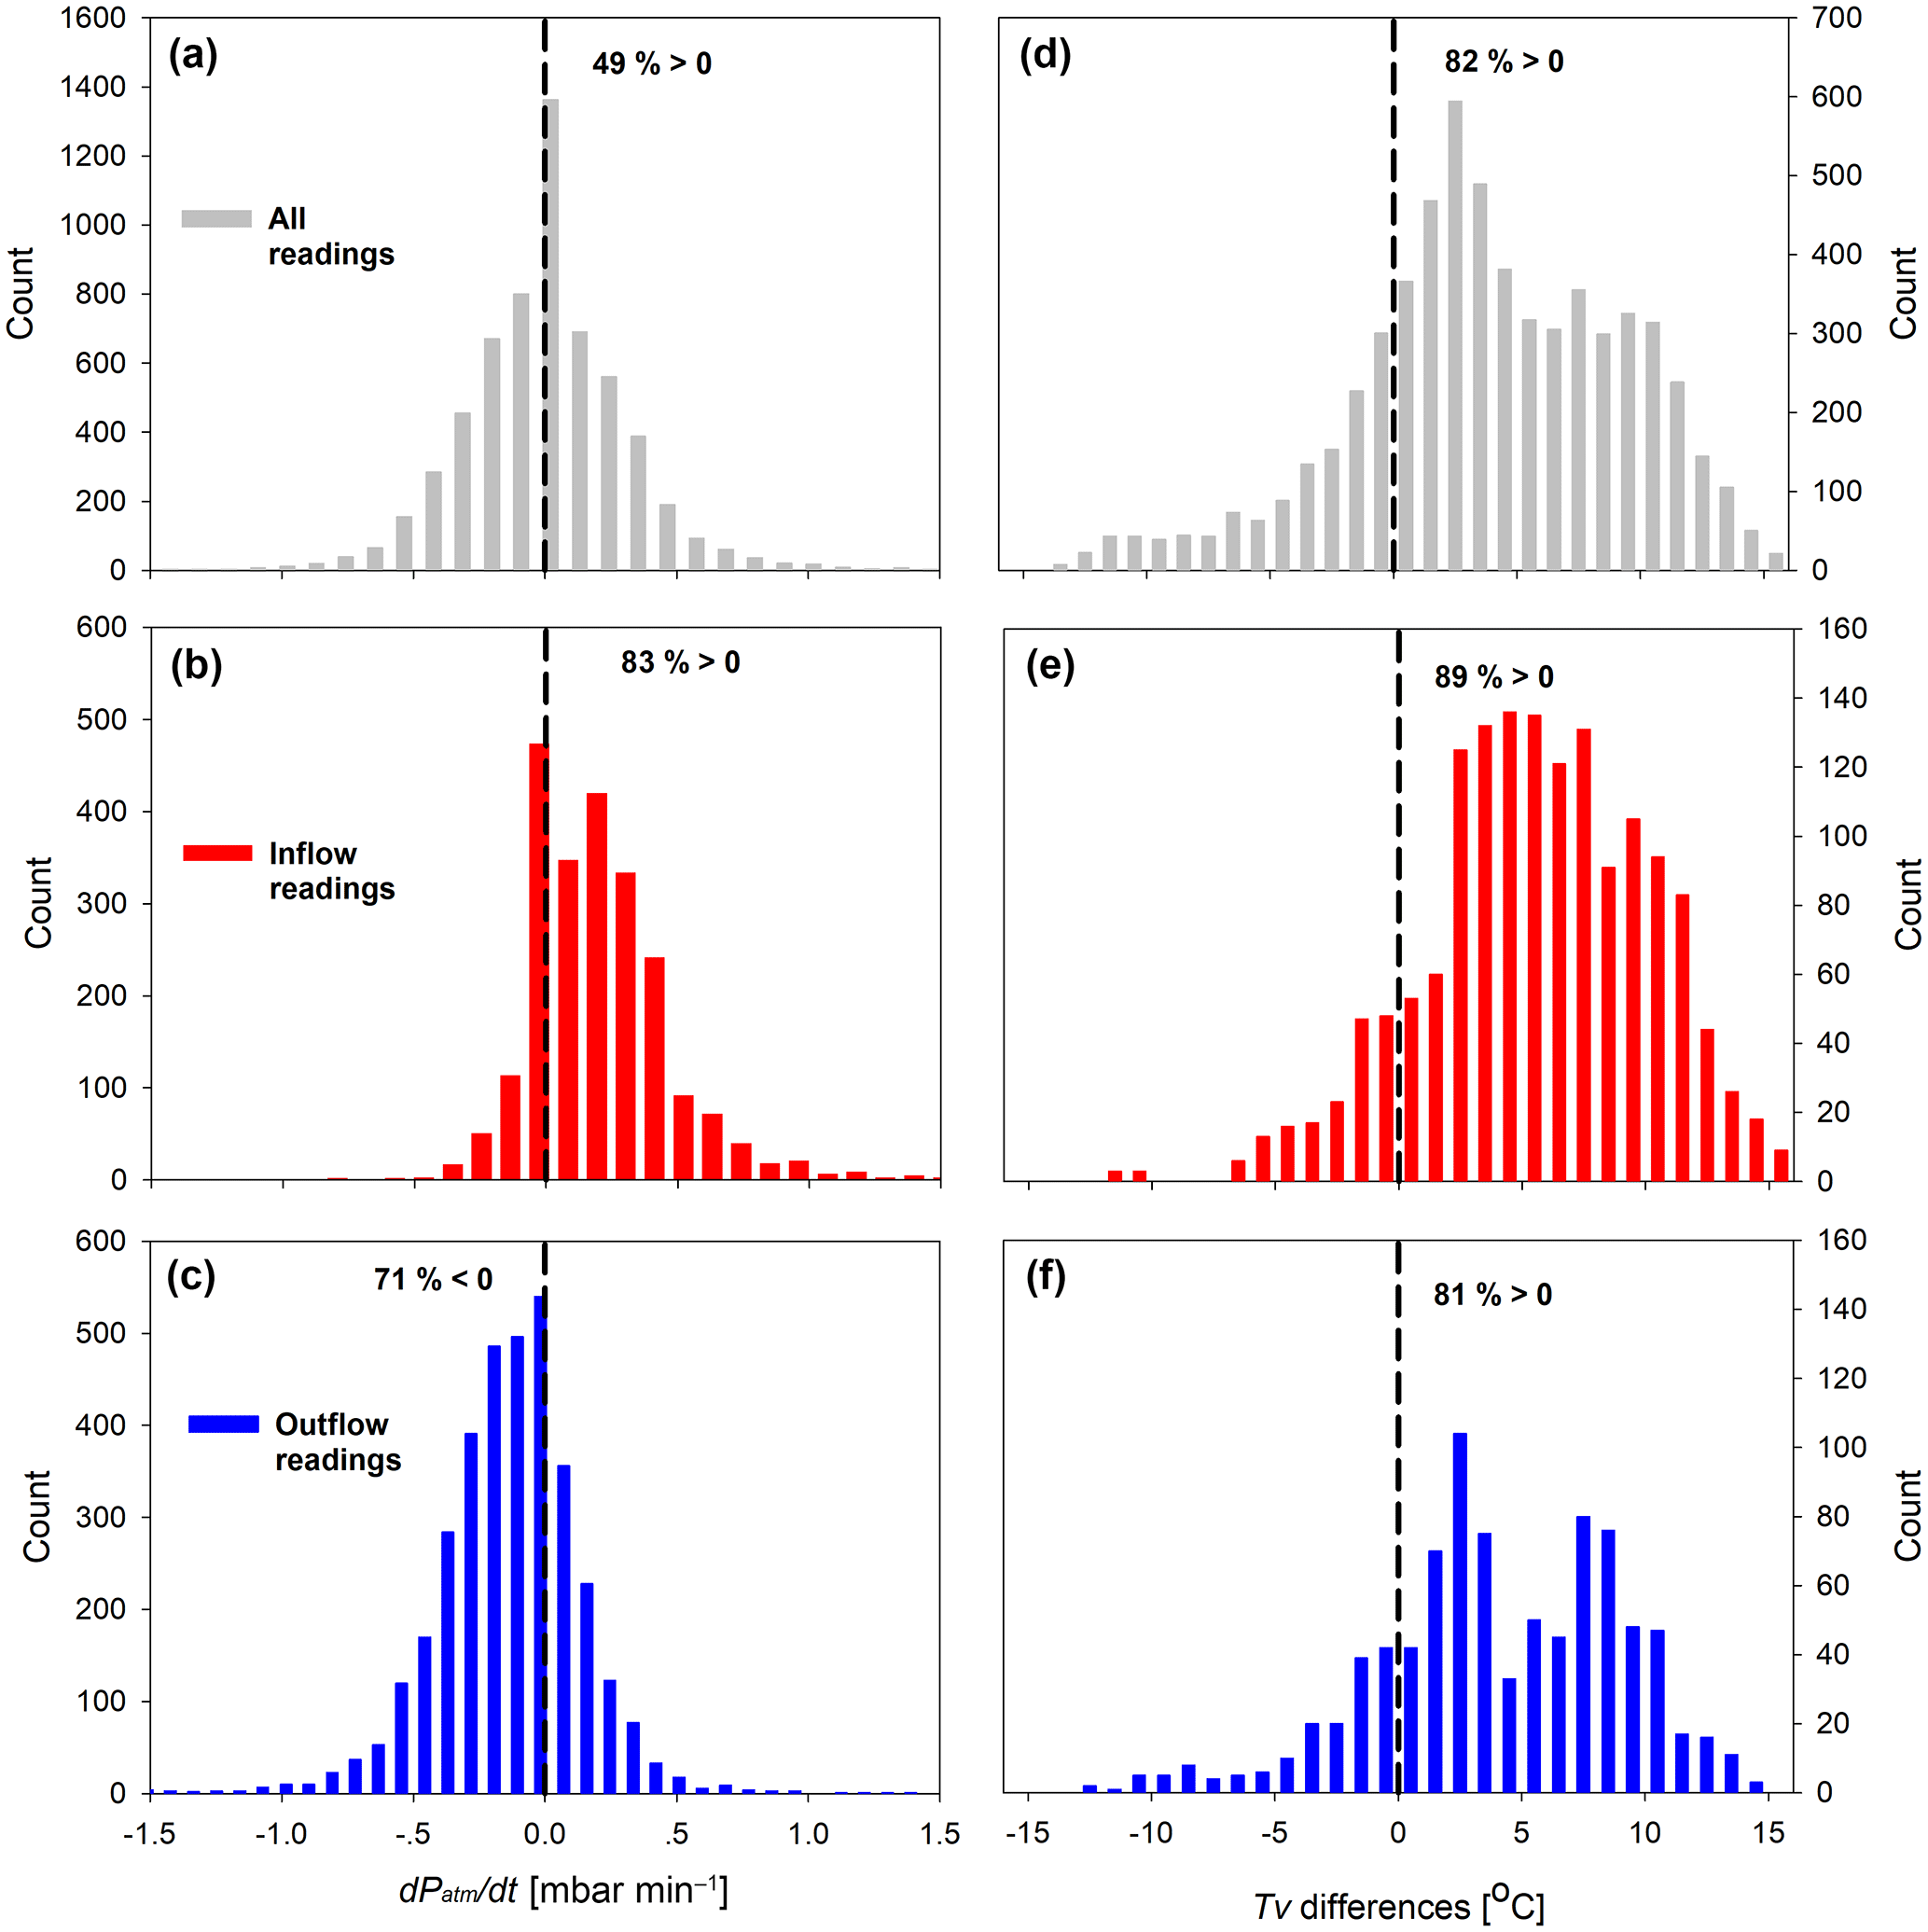
Figure 6Histograms of changes in atmospheric barometric pressure (dPatm∕dt) and Tv difference between the shaft and the atmosphere. The gray color (a, d) represents data from all 42 days of measurement. Red (b, e) and blue (c, f) represent data from the inflow and outflow events, respectively. Positive values of dPatm∕dt can drive inflow events from the atmosphere into the underground cavity, whereas negative values can drive outflow events. Tv differences (x axis) are between 12 m deep inside the shaft and the atmosphere.
The shaft–borehole differences at the 27 m sensor can be explained using a simple two-reservoir model. In the case of the shaft, we can define both the atmosphere and the cavity as two infinite air reservoirs connected via a finite-volume shaft. Therefore, air transport between the two reservoirs is unlimited and controlled only by the boundary conditions (i.e., barometric pressure). In this case, all sensors throughout the shaft will show similar AH decrease and increase, as evident from the similar changes in the purple and green lines in Fig. 2a no. 3. On the other hand, in the borehole, there is only one upper infinite reservoir (i.e., the atmosphere) and each inflow air transport is limited by the soil resistivity at the lower boundary (i.e., the soil capability to enable penetration of air inflow events – the soil permeability and porosity). Here, the effect of AH decreases with depth and indeed the deepest sensor of 27 m showed no change in AH compared to the changes in AH at the 12 m depth (Fig. 2b no. 3).
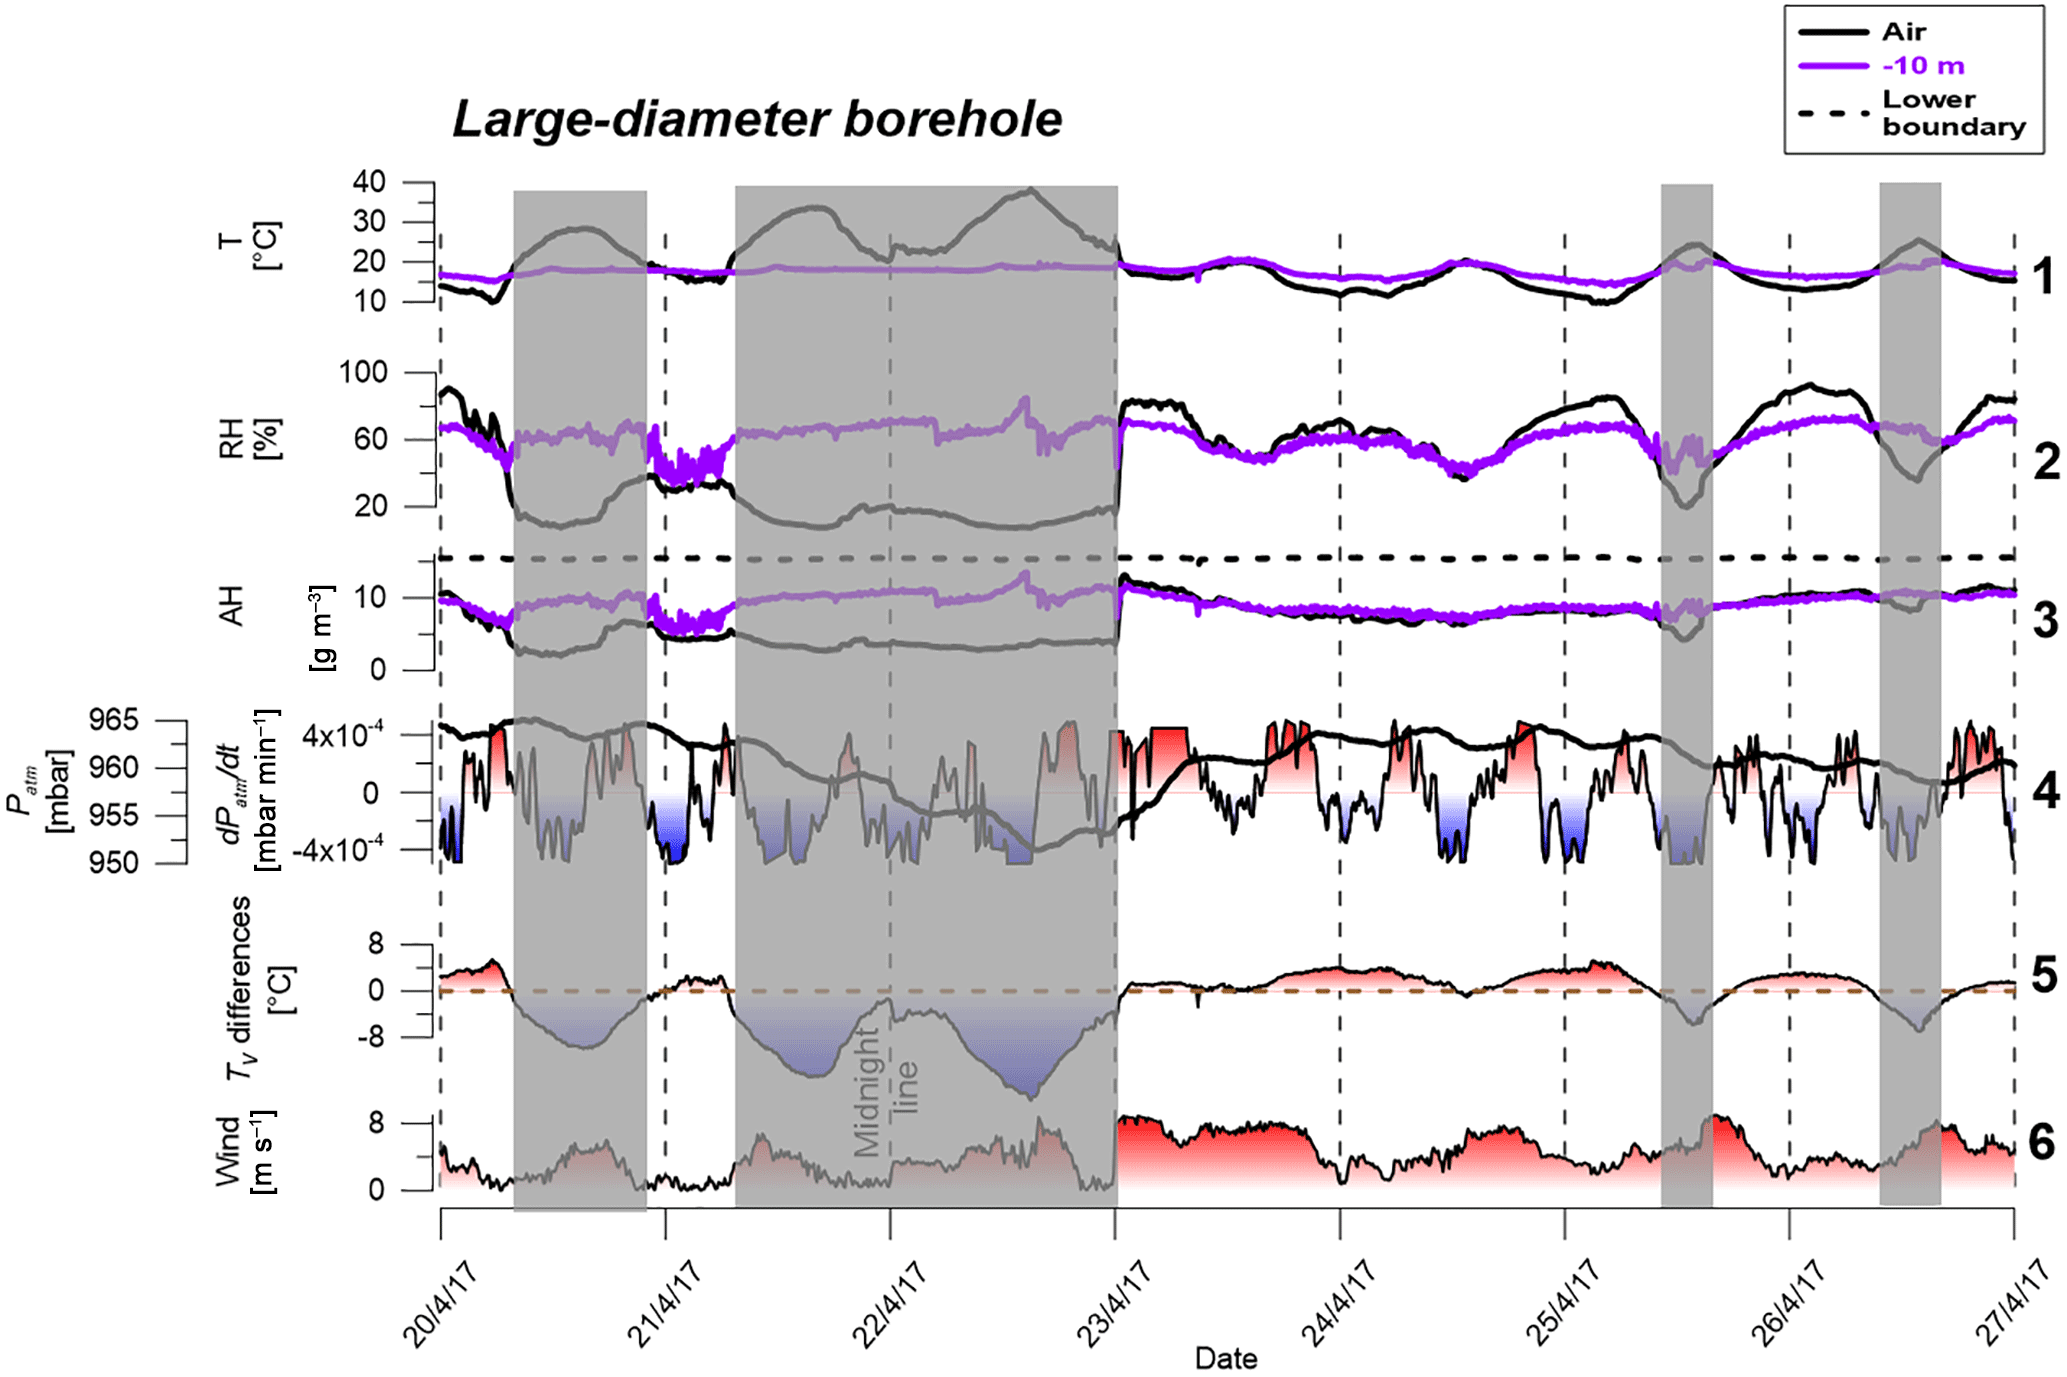
Figure 7Time series results from the large-diameter borehole for 1 week. Gray columns represent periods of thermal stability inside the large-diameter borehole. Values in line 5 represent Tv differences between 10 m of depth and the air aboveground. Tv values were calculated according to Sánchez-Cañete et al. (2013) using CO2 concentrations of 2000 and 400 ppm for 10 m of depth and air aboveground, respectively.
3.4 Comparison between shaft–borehole geometries and large-diameter borehole
Results from the large-diameter borehole are presented in Fig. 7. In contrast to the shaft–borehole, AH changes inside this large-diameter borehole (measured at 10 m of depth) were correlated with the Tv differences between 10 m of depth and the atmosphere and not with the barometric pressure changes. No barometric pressure effect on the AH was observed, and during most of the measurement period the atmospheric AH and that at 10 m were similar (Fig. 7a no. 3, purple and black lines). This was because thermal instability inside the large-diameter borehole (i.e., cold atmospheric air above warm borehole air) initiated DIC mixing with the atmosphere. The cases of AH increase at 10 m occurred when stratification controlled the air movement inside the large-diameter borehole, and only then did AH at 10 m increase to the saturation conditions that characterize the lower boundary (marked as gray columns in Fig. 7a). The correlation between the positive Tv differences and the decrease in AH in this large-diameter borehole (3.4 m), which was not found in the small-diameter shaft–borehole (0.1 m), clearly indicated that DIC was the controlling mechanism for advective air movement in the large-diameter borehole. Furthermore, the fact that changes in barometric pressure did not lead to changes in AH, e.g., from 23 to 25 April (Fig. 7a no. 4), suggests that BP was not the dominant driving force as in the small-diameter shaft–borehole.
We posit that the main parameter controlling which transport mechanisms govern advective air movement is the borehole or shaft diameter. A small borehole diameter will decrease the magnitude of the DIC. This is because DIC magnitude in a cylinder geometry is positively proportional by the fourth power of the cylinder radius (e.g., Berthold, 2010; Berthold and Börner, 2008; Berthold and Resagk, 2012; Rayleigh, 1916). Therefore, in our case of a small-diameter borehole of 0.1 m, DIC had a minor influence on air transport inside the shaft–borehole. The following equations provide the theoretical basis for our conclusion that borehole diameter (r) impacts the airflow within boreholes.
For BP, under the assumption of unidimensional cylindrical flow, the volume flow rate per unit length (A) is approximately proportional to one-sixth the power of the borehole radius (Eq. 2) such that increasing r by a factor of 10 will only increase A by 41 % (Neeper, 2003):
where r is the borehole diameter (m) and A is the volume flow rate per unit length (m3 m −1 s−1). Because Q is proportional to A, we can also define
where Q is the borehole total volume rate to the atmosphere (m3 s−1). For a cylindrical flow the air velocity (u) is defined as
where u is the air velocity (m s−1). Thus, from Eqs. (3) and (4), we can conclude that the proportion between u and r is
Equation (5) implies that u is inversely correlated with r.
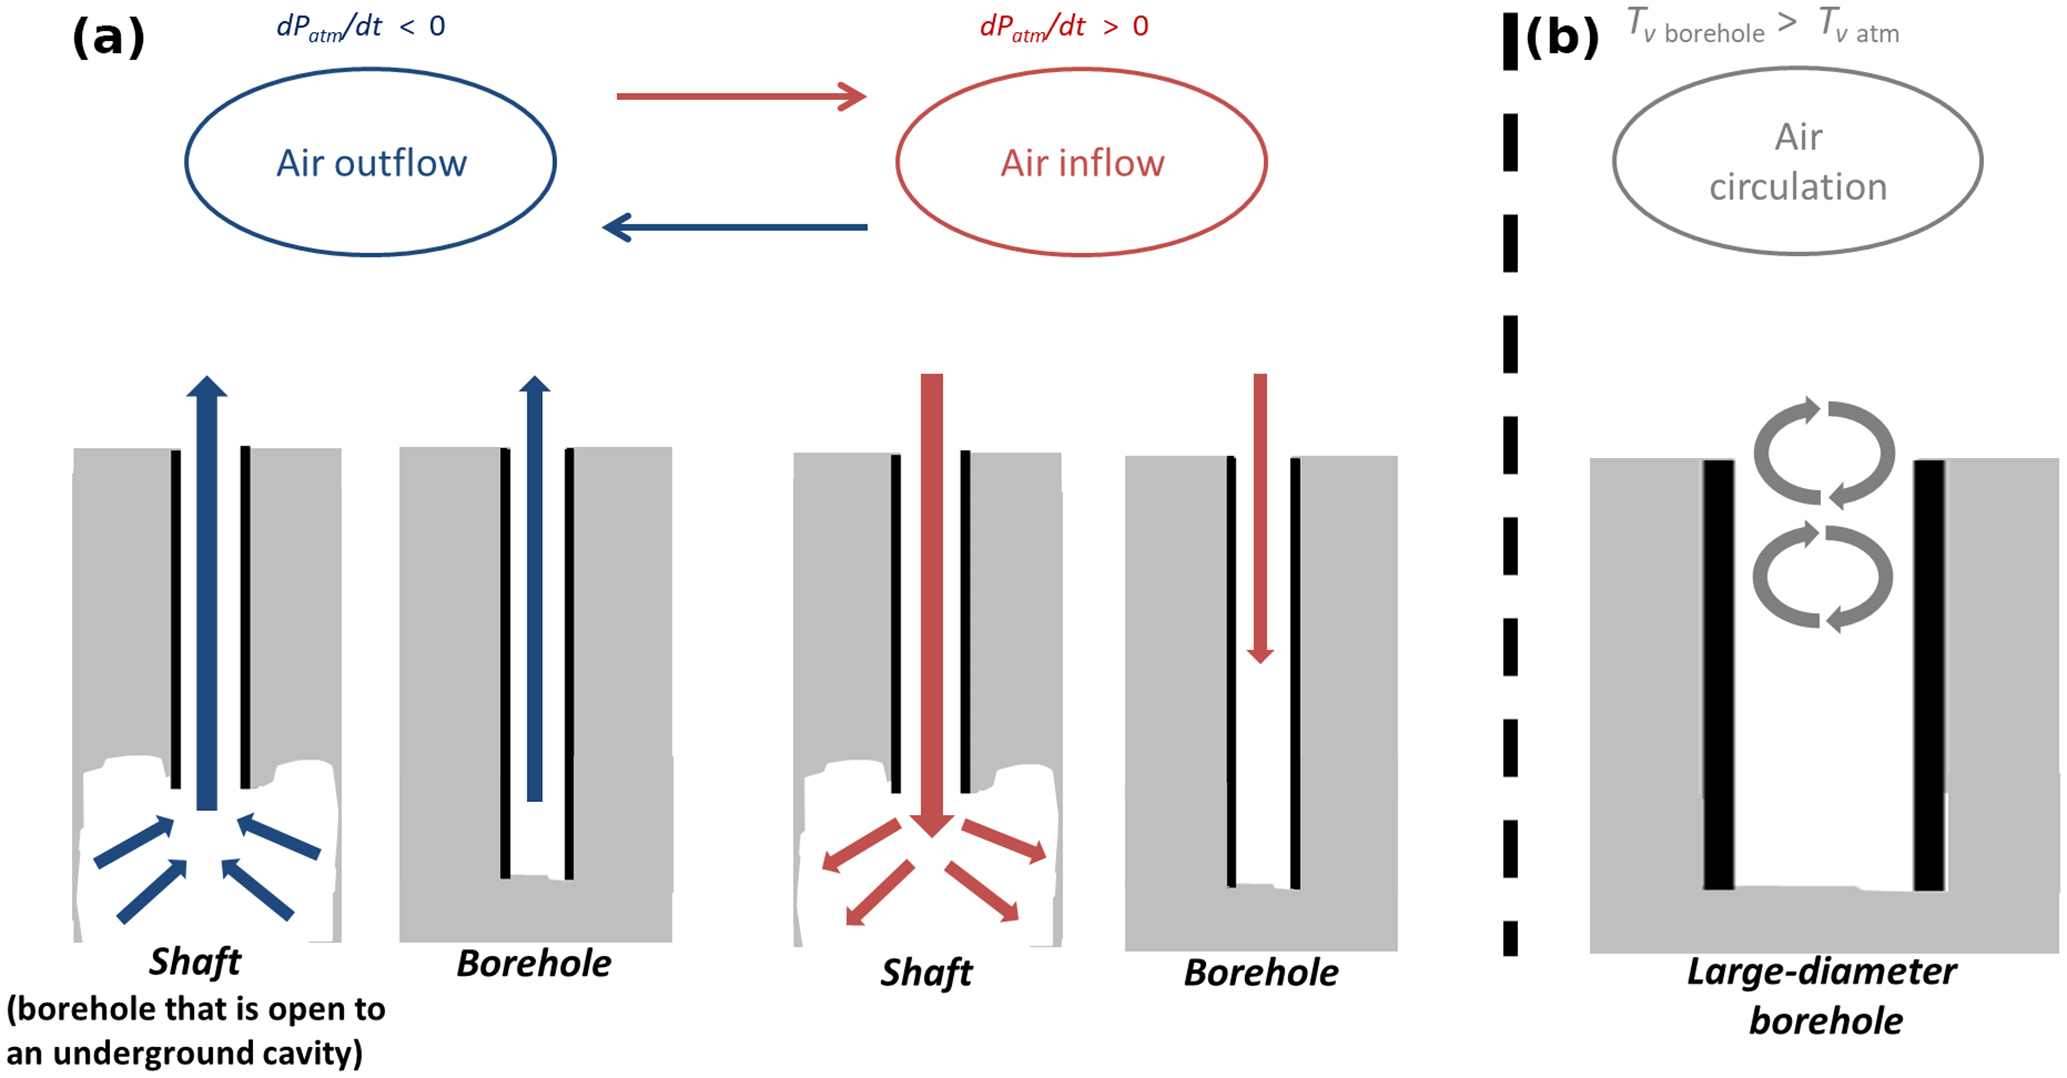
Figure 8Conceptual model for airflow inside boreholes and shafts. Panel (a) represents the shaft–borehole and panel (b) represents the large-diameter borehole. Blue arrows illustrate the air outflow events in which air flows from the bottom cavity (shaft) or the bottom borehole–soil interface (borehole) to the atmosphere, whereas red arrows illustrate the air inflow events in the opposite direction. For example, as the red arrows indicate, air from the atmosphere will enter the cavity, equalling the absolute humidity (AH) values throughout the shaft to the atmospheric values. In contrast, in the borehole, this stage will only be effective to a certain depth and the bottom borehole–soil interface will not be significantly affected. In the large-diameter borehole, gray arrows illustrate the circulation of air from the atmosphere into the large-diameter borehole due to the thermal instability that initiates DIC. The diameter will define which advective transport mechanism is more significant: at a small diameter of 0.1 m, BP controls gas transport (a), whereas at a larger diameter of 3.4 m, DIC is the dominant mechanism (b).
For the case of DIC, the thermal instability number (Ra), which is an indicator for u, is proportional to the temperature gradient (dT∕dz) and to r by the fourth power (Berthold, 2010; Berthold and Resagk, 2012; Rayleigh, 1916):
where Ra is dimensionless (–), DT is the thermal diffusivity (m2 s−1), α is the thermal expansion coefficient (1/K), g is the gravitational acceleration (m s−2), r is the characteristic length dependent on the geometry, also defined as the radius of the borehole (m), and ν is the kinematic viscosity of the air (m2 s−1). Applying Rayleigh–Bénard models to borehole geometry relates the Ra number to the Reynolds number (Re, Eq. 7) and to u (Eq. 8) (Grossmann and Lohse, 2000; Perrier et al., 2005):
where h is the characteristic length (m) equal to r. Substituting Eqs. (6) and (7) in Eq. (8) results in
and therefore u is correlated with r such that
Finally, when comparing the u dependency on r for the case of BP (Eq. 5) and DIC (Eq. 10) it is clear that an increase in r will have a contrasting effect on the airflow generated from DIC compared to the one generated from BP; an increase in r will increase the u generated from DIC while decreasing the u generated from BP. This quantitatively supports the conclusion from the field observations that in a large-diameter borehole DIC was more significant to the gas transport than BP.
The use of Eqs. (5) and (10) for comparison purposes cannot be addressed without considering the differences in u between BP and DIC due to the flow geometry. In BP u is unidirectional (inward or outward flow), whereas in DIC u represents a bidirectional flow (e.g., Eckert and Diaguila, 1955). Nevertheless, in both cases (BP and DIC) u describes the same physical meaning of air velocity magnitude. Thus, we still consider Eqs. (5) and (10) as a good first-order approximation for comparing the correlation between airflow and borehole radius for BP and DIC conditions.
It should be emphasized that the threshold value of r to determine when DIC dominates BP and vice versa cannot be considered as one absolute value. This is because atmospheric conditions differ between different sites, and thus the magnitude of dT∕dz and dPatm∕dt can change. For example, a tropical climate will exhibit a smaller diurnal temperature cycle, which will cause a lower dT∕dz. Therefore, DIC intensity will be markedly suppressed compared to the same borehole in an arid climate. An additional property that can also differ between sites and affect the air transport is the air viscosity, which is related to the air temperature (Finkelstein et al., 2006). Moreover, some of the parameters presented in Eqs. (2) to (10) can exhibit nonlinear behavior (Kardashov et al., 2000), mainly dT∕dz, which suggests that a comparison between sites is highly complex.
A conceptual model was developed to present the advective transport mechanisms of the three geometries (Fig. 8). The differences between the borehole and the shaft are illustrated in Fig. 8a and the differences between them and the large-diameter borehole in Fig. 8b. The borehole diameter will define which advective transport mechanism is more significant: at a small diameter of 0.1 m, BP controls gas transport (Fig. 8a), whereas at the large-diameter borehole of 3.4 m, DIC is the dominant mechanism (Fig. 8b).
3.5 Field implications
The mechanisms controlling the subsurface–atmosphere air exchange have several important implications. These include, for example, volatile organic compound (VOC) transport from the subsurface to the atmosphere in contaminated sites (Boothroyd et al., 2016), natural aeration (oxygen supply) of underground quarries or tunnels and the need for artificial, enhanced air exchange facilities in such environments, and changes in RH values in karst systems. For example, RH changes in a mine underground atmosphere have a great influence on the rock physico-mechanical parameters and stability (Auvray et al., 2008). Commonly used mine shafts can induce rapid RH changes at the shaft–cavity interface as presented above, which can then lead to rock stability problems. Shafts can also be used for the fast removal of water vapor from deep soil layers in order to lower its hydraulic conductivity and subsequently cease the downward transport of contaminants.
One of the important implications is the potential role of shafts and boreholes as conduits for air exchange to overall GHG emissions and related mechanisms such as carbon capture and storage (CCS) processes. Two basic assumptions are considered here: first, the BP air transport rate is up to a few orders of magnitude greater than diffusion (You et al., 2011), and second, these conduits can act as “pipes” to the Earth's subsurface, connecting elevated GHG sources to the atmosphere (e.g., Serrano-Ortiz et al., 2010).
One example of a significant GHG type emitted from boreholes is methane, whose emissions were quantified for 19 narrow boreholes in Pennsylvania (Kang et al., 2014, 2015). After upscaling their results to the state level, it was proposed that these borehole emissions represent 4 %–7 % of the total methane emissions in Pennsylvania. The research focused mainly on the production function of methane and not on the physical transport mechanism. Implementing our conclusion that BP was the main air transport mechanism can indicate that the methane emissions presented by Kang et al. (2014, 2015) likely occurred mainly during periods of dPatm∕dt<0.
Three borehole geometries were compared to explore air transport mechanisms under naturally variable atmospheric conditions. The first case was a 27 m vertical shaft with a 0.1 m diameter that connected a large underground cavity to the atmosphere; the second case was the same borehole but with a connection to the underground cavity that was blocked and the pipe ended in the unsaturated soil matrix. The third was a large-diameter borehole 3.4 m in diameter and 59 m deep. In the first two, the shaft and borehole, the air inflow and outflow at 12 m were found to be correlated with the changes in barometric pressure (BP). However, in the large-diameter borehole, the air transport at a similar depth (10 m) was correlated with density–instability (DIC) rather than barometric pressure.
Use of AH changes during the winter and spring seasons was shown as a practical tool to identify the source of air parcels within the three geometries, namely atmospheric vs. lower borehole–cavity, and thus to determine the direction and effect of the air transport. Water vapor concentrations in the atmosphere vary throughout the day, while they are almost constant in underground cavities and can therefore be used as a natural tracer for air source and flow directions without injecting additional gases.
A conceptual model is presented to describe the induced airflow in all three geometries. In the shaft, the atmospheric air entered through the shaft to the cavity and vice versa. In other words, the shaft connects between two large air sources, and inflow and outflow via the shaft is determined according to the barometric pressure changes. In the borehole, the atmospheric air entrance was limited by the soil resistivity at the lower boundary. Thus, the inflow of atmospheric air was observed only at 12 m of depth and not at the deeper 27 m sensor. BP was found to control air advective transport in both geometries. On the other hand, in the third geometry of a large-diameter borehole, thermal instability initiated DIC advection, while BP did not play a significant role. This caused the circulation of atmospheric air into the borehole to a depth of 10 m whenever the thermal instability occurred. This mechanistic explanation was validated using the winter and spring season dataset. Although we show that theoretically the transport mechanism observed for winter and spring should hold with reduced significance for summer and autumn, further data are needed to verify the theoretical calculation.
In summary, our observations improve the understanding of the governing mechanisms controlling air movement in boreholes and shafts as a function of their geometries and diameters as well as the ambient atmospheric conditions. In addition, our observations assist in better calculating GHG fluxes from these domains and estimating the time periods when these fluxes are enhanced.
The dataset used in the analyses can be found in the Supplement to this article.
The supplement related to this article is available online at: https://doi.org/10.5194/esd-9-1141-2018-supplement.
EL, NGL, AM, and NW performed the data analysis. EL and NW wrote the first draft of the paper and all authors contributed to the final version.
The authors declare that they have no conflict of interest.
This work was funded by the Bi-National Science Foundation (BSF), contract
number (2014220), the Israeli Ministry of Agriculture,
contract 857-0686-13, and the Israeli Science Foundation (ISF), contracts 678/11
and 1471/18. We also acknowledge the Sam Zuckerberg scholarship
provided to Elad Levintal and the fruitful comments provided by Andrew Kowalski and the two
anonymous reviewers who helped to improve this paper. The field
observations were conducted with the Geological Survey of Israel team:
Hallel Lutzky, Uri Malik, Haim Chemo, Ziv Mor, and Haggai Eyal, with Raz Amir
from the Ben-Gurion University of the Negev.
Edited by: Axel Kleidon
Reviewed by: Andrew Kowalski and two anonymous referees
Allaire, S. E., Roulier, S., and Cessna, A. J.: Quantifying preferential flow in soils: A review of different techniques, J. Hydrol., 378, 179–204, https://doi.org/10.1016/j.jhydrol.2009.08.013, 2009.
Amundson, R. G. and Davidson, E. A.: Carbon dioxide and nitrogenous gases in the soil atmosphere, J. Geoche. Explor., 38, 13–41, https://doi.org/10.1016/0375-6742(90)90091-N, 1990.
Auvray, C., Homand, F., and Hoxha, D.: The influence of relative humidity on the rate of convergence in an underground gypsum mine, Int. J. Rock Mech. Min. Sci., 45, 1454–1468, https://doi.org/10.1016/j.ijrmms.2008.02.008, 2008.
Bayer, A. D., Lindeskog, M., Pugh, T. A. M., Anthoni, P. M., Fuchs, R., and Arneth, A.: Uncertainties in the land-use flux resulting from land-use change reconstructions and gross land transitions, Earth Syst. Dynam., 8, 91–111, https://doi.org/10.5194/esd-8-91-2017, 2017.
Berthold, S.: Synthetic convection log – characterization of vertical transport processes in fluid-filled boreholes, J. Appl. Geophys., 72, 20–27, https://doi.org/10.1016/j.jappgeo.2010.06.007, 2010.
Berthold, S. and Börner, F.: Detection of free vertical convection and double-diffusion in groundwater monitoring wells with geophysical borehole measurements, Environ. Geol., 54, 1547–1566, https://doi.org/10.1007/s00254-007-0936-y, 2008.
Berthold, S. and Resagk, C.: Investigation of thermal convection in water columns using particle image velocimetry, Exp. Fluids, 52, 1465–1474, https://doi.org/10.1007/s00348-012-1267-7, 2012.
Boothroyd, I. M., Almond, S., Qassim, S. M., Worrall, F., and Davies, R. J.: Fugitive emissions of methane from abandoned, decommissioned oil and gas wells, Sci. Total Environ., 547, 461–469, https://doi.org/10.1016/j.scitotenv.2015.12.096, 2016.
Bourges, F., Genthon, P., Genty, D., Lorblanchet, M., Mauduit, E. and D'Hulst, D.: Conservation of prehistoric caves and stability of their inner climate: Lessons from Chauvet and other French caves, Sci. Total Environ., 493, 79–91, https://doi.org/10.1016/j.scitotenv.2014.05.137, 2014.
Choi, J.-W. and Smith, J. A.: Geoenvironmental Factors Affecting Organic Vapor Advection and Diffusion Fluxes from the Unsaturated Zone to the Atmosphere under Natural Conditions, Environ. Eng. Sci., 22, 95–108, https://doi.org/10.1089/ees.2005.22.95, 2005.
Denis, A., Lastennet, R., Huneau, F., and Malaurent, P.: Identification of functional relationships between atmospheric pressure and CO2 in the cave of Lascaux using the concept of entropy of curves, Geophys. Res. Lett., 32, 1–4, https://doi.org/10.1029/2004GL022226, 2005.
Eckert, E. R. G. and Diaguila, A. J.: Experimental investigation of free-convection heat transfer in vertical tube at large Grashof numbers, US Government printing office, Cleveland, Ohio, 1955.
Ellerd, M. G., Massmann, J. W., Schwaegler, D. P., and Rohay, V. J.: Enhancements for Passive Vapor Extraction: The Hanford Study, Ground Water, 37, 427–437, https://doi.org/10.1111/j.1745-6584.1999.tb01122.x, 1999.
Eppelbaum, L. V. and Kutasov, I. M.: Estimation of the effect of thermal convection and casing on the temperature regime of boreholes: a review, J. Geophys. Eng., 8, R1–R10, https://doi.org/10.1088/1742-2132/8/1/R01, 2011.
Finkelstein, M., Eppelbaum, L. V., and Price, C.: Analysis of temperature influences on the amplitude-frequency characteristics of Rn gas concentration, J. Environ. Radioact., 86, 251–270, https://doi.org/10.1016/j.jenvrad.2005.09.004, 2006.
Ganot, Y., Dragila, M. I., and Weisbrod, N.: Impact of thermal convection on air circulation in a mammalian burrow under arid conditions, J. Arid Environ., 84, 51–62, https://doi.org/10.1016/j.jaridenv.2012.04.003, 2012.
Ganot, Y., Dragila, M. I., and Weisbrod, N.: Impact of thermal convection on CO2 flux across the earth–atmosphere boundary in high-permeability soils, Agr. Forest Meteorol., 184, 12–24, https://doi.org/10.1016/j.agrformet.2013.09.001, 2014.
Goren, O., Burg, A., Gavrieli, I., Negev, I., Guttman, J., Kraitzer, T., Kloppmann, W., and Lazar, B.: Biogeochemical processes in infiltration basins and their impact on the recharging effluent, the soil aquifer treatment (SAT) system of the Shafdan plant, Israel, Appl. Geochem., 48, 58–69, https://doi.org/10.1016/j.apgeochem.2014.06.017, 2014.
Grossmann, S. and Lohse, D.: Scaling in thermal convection: a unifying theory, J. Fluid Mech., 407, 27–56, https://doi.org/10.1017/S0022112099007545, 2000.
Guillon, S., Agrinier, P., and Pili, É.: Monitoring CO2 concentration and δ13C in an underground cavity using a commercial isotope ratio infrared spectrometer, Appl. Phys. B, 119, 165–175, https://doi.org/10.1007/s00340-015-6013-4, 2015.
Hall, S. J., Learned, J., Ruddell, B., Larson, K. L., Cavender-Bares, J., Bettez, N., Groffman, P. M., Grove, J. M., Heffernan, J. B., Hobbie, S. E., Morse, J. L., Neill, C., Nelson, K. C., O'Neil-Dunne, J. P. M., Ogden, L., Pataki, D. E., Pearse, W. D., Polsky, C., Chowdhury, R. R., Steele, M. K., and Trammell, T. L. E.: Convergence of microclimate in residential landscapes across diverse cities in the United States, Landsc. Ecol., 31, 101–117, https://doi.org/10.1007/s10980-015-0297-y, 2016.
Hillel, D.: Environmental Soil Physics, Academic Press, San Diego, CA, available at: https://books.google.com.co/books?id=tP__y5xRd0oC (last access: 10 May 2014), 1998.
James, E. W., Banner, J. L., and Hardt, B.: A global model for cave ventilation and seasonal bias in speleothem paleoclimate records, Geochem. Geophy. Geosy., 16, 1044–1051, https://doi.org/10.1002/2014GC005658, 2015.
Kang, M., Kanno, C. M., Reid, M. C., Zhang, X., Mauzerall, D. L., Celia, M. A., Chen, Y., and Onstott, T. C.: Direct measurements of methane emissions from abandoned oil and gas wells in Pennsylvania, P. Natl. Acad. Sci. USA, 111, 18173–18177, https://doi.org/10.1073/pnas.1408315111, 2014.
Kang, M., Baik, E., Miller, A. R., Bandilla, K. W., and Celia, M. A.: Effective Permeabilities of Abandoned Oil and Gas Wells: Analysis of Data from Pennsylvania, Environ. Sci. Technol., 49, 4757–4764, https://doi.org/10.1021/acs.est.5b00132, 2015.
Kardashov, V. R., Eppelbaum, L. V., and Vasilyev, O. V.: The role of nonlinear source terms in geophysics, Geophys. Res. Lett., 27, 2069–2072, https://doi.org/10.1029/1999GL011192, 2000.
Kawamoto, K., Moldrup, P., Schjønning, P., Iversen, B. V., Rolston, D. E., and Komatsu, T.: Gas transport parameters in the vadose zone, Vadose Zone J., 5, 1194–1204, https://doi.org/10.2136/vzj2006.0014, 2006.
Klepikova, M. V., Le Borgne, T., Bour, O., and Davy, P.: A methodology for using borehole temperature-depth profiles under ambient, single and cross-borehole pumping conditions to estimate fracture hydraulic properties, J. Hydrol., 407, 145–152, https://doi.org/10.1016/j.jhydrol.2011.07.018, 2011.
Kowalski, A. S. and Sánchez-Cañete, E. P.: A New Definition of the Virtual Temperature, Valid for the Atmosphere and the CO2-Rich Air of the Vadose Zone, J. Appl. Meteorol. Clim., 49, 1692–1695, https://doi.org/10.1175/2010JAMC2534.1, 2010.
Kuang, X., Jiao, J. J., and Li, H.: Review on airflow in unsaturated zones induced by natural forcings, Water Resour. Res., 49, 6137–6165, https://doi.org/10.1002/wrcr.20416, 2013.
Lensky, I. M. and Dayan, U.: Continuous detection and characterization of the Sea Breeze in clear sky conditions using Meteosat Second Generation, Atmos. Chem. Phys., 12, 6505–6513, https://doi.org/10.5194/acp-12-6505-2012, 2012.
Levintal, E., Dragila, M. I., Kamai, T., and Weisbrod, N.: Free and forced gas convection in highly permeable, dry porous media, Agr. Forest Meteorol., 232, 469–478, https://doi.org/10.1016/j.agrformet.2016.10.001, 2017.
Massmann, J., Shock, S., and Johannesen, L.: Uncertainties in cleanup times for soil vapor extraction, Water Resour. Res., 36, 679–692, https://doi.org/10.1029/1999WR900305, 2000.
Moore, J. R., Gischig, V., Katterbach, M., and Loew, S.: Air circulation in deep fractures and the temperature field of an alpine rock slope, Earth Surf. Proc. Land., 36, 1985–1996, https://doi.org/10.1002/esp.2217, 2011.
Nachshon, U., Weisbrod, N., and Dragila, M. I.: Quantifying Air Convection through Surface-Exposed Fractures: A Laboratory Study, Vadose Zone J., 7, 948–956, https://doi.org/10.2136/vzj2007.0165, 2008.
Nativ, R., Adar, E., Assaf, L., and Nygaard, E.: Characterization of the hydraulic properties of fractures in chalk, Ground Water, 41, 532–543, https://doi.org/10.1111/j.1745-6584.2003.tb02387.x, 2003.
Neeper, D. A.: Investigation of the vadose zone using barometric pressure cycles, J. Contam. Hydrol., 54, 59–80, https://doi.org/10.1016/S0169-7722(01)00146-2, 2002.
Neeper, D. A.: Harmonic analysis of flow in open boreholes due to barometric pressure cycles, J. Contam. Hydrol., 60, 135–162, https://doi.org/10.1016/S0169-7722(02)00086-4, 2003.
Neeper, D. A. and Stauffer, P. H.: Transport by Oscillatory Flow in Soils with Rate-Limited Mass Transfer: 1. Theory, Vadose Zone J., 11, 2, https://doi.org/10.2136/vzj2011.0094, 2012.
Noronha, A. L., Hardt, B. F., Banner, J. L., Jenson, J. W., Partin, J. W., James, E. W., Lander, M. A., and Bautista, K. K.: Trade winds drive pronounced seasonality in carbonate chemistry in a tropical Western Pacific island cave-Implications for speleothem paleoclimatology, Geochem. Geophy. Geosy., 18, 384–399, https://doi.org/10.1002/2016GC006644, 2017.
Perina, T.: General well function for soil vapor extraction, Adv. Water Resour., 66, 1–7, https://doi.org/10.1016/j.advwatres.2014.01.005, 2014.
Perrier, F. and Le Mouël, J.-L.: Stationary and transient thermal states of barometric pumping in the access pit of an underground quarry, Sci. Total Environ., 550, 1044–1056, https://doi.org/10.1016/j.scitotenv.2016.01.125, 2016.
Perrier, F., Morat, P., and Le Mouël, J. L.: Dynamics of air avalanches in the access pit of an underground quarry, Phys. Rev. Lett., 89, 1–4, https://doi.org/10.1103/PhysRevLett.89.134501, 2002.
Perrier, F., Le Mouël, J.-L., Kossobokov, V., Crouzeix, C., Morat, P., and Richon, P.: Properties of turbulent air avalanches in a vertical pit, Eur. Phys. J. B, 46, 563–579, https://doi.org/10.1140/epjb/e2005-00289-9, 2005.
Pla, C., Cuezva, S., Garcia-Anton, E., Fernandez-Cortes, A., Cañaveras, J. C., Sanchez-Moral, S., and Benavente, D.: Changes in the CO2 dynamics in near-surface cavities under a future warming scenario: Factors and evidence from the field and experimental findings, Sci. Total Environ., 565, 1151–1164, https://doi.org/10.1016/j.scitotenv.2016.05.160, 2016.
Rayleigh, L.: LIX. On convection currents in a horizontal layer of fluid, when the higher temperature is on the under side, Philos. Mag. Ser., 32, 529–546, https://doi.org/10.1080/14786441608635602, 1916.
Rossabi, J. and Falta, R. W.: Analytical Solution for Subsurface Gas Flow to a Well Induced by Surface Pressure Fluctuations, Ground Water, 40, 67–75, https://doi.org/10.1111/j.1745-6584.2002.tb02492.x, 2002.
Sánchez-Cañete, E., Serrano-Ortiz, P., Domingo, F., and Kowalski, A.: Cave ventilation is influenced by variations in the CO2-dependent virtual temperature, Int. J. Speleol., 42, 1–8, https://doi.org/10.5038/1827-806X.42.1.1, 2013.
Sánchez-Cañete, E. P., Serrano-Ortiz, P., Kowalski, A. S., Oyonarte, C., and Domingo, F.: Subterranean CO2 ventilation and its role in the net ecosystem carbon balance of a karstic shrubland, Geophys. Res. Lett., 38, L09802, https://doi.org/10.1029/2011GL047077, 2011.
Schwarz, J., Bear, J., and Dagan, G.: Groundwater Development in Israel, Ground Water, 54, 143–148, https://doi.org/10.1111/gwat.12384, 2016.
Serrano-Ortiz, P., Roland, M., Sanchez-Moral, S., Janssens, I. A., Domingo, F., Goddéris, Y., and Kowalski, A. S.: Hidden, abiotic CO2 flows and gaseous reservoirs in the terrestrial carbon cycle: Review and perspectives, Agr. Forest Meteorol., 150, 321–329, https://doi.org/10.1016/j.agrformet.2010.01.002, 2010.
Shentsis, I., Meirovich, L., Ben-Zvi, A., and Rosenthal, E.: Assessment of transmission losses and groundwater recharge from runoff events in a wadi under shortage of data on lateral inflow, Negev, Israel, Hydrol. Process., 13, 1649–1663, https://doi.org/10.1002/(SICI)1099-1085(19990815)13:11<1649::AID-HYP834>3.0.CO;2-N, 1999.
Steinitz, G. and Piatibratova, O.: Radon signals at the Roded site, southern Israel, Solid Earth, 1, 99–109, https://doi.org/10.5194/se-1-99-2010, 2010.
Thorstenson, D. C., Weeks, E. P., Haas, H., Busenberg, E., Plummer, N., and Peters, C. A.: Chemistry of unsaturated zone gases sampled in open boreholes at the crest of Yucca Mountain, Nevada: Data and basic concepts of chemical and physical processes in the mountain, Water Resour. Res., 34, 1507–1529, https://doi.org/10.1029/98WR00267, 1998.
Weisbrod, N. and Dragila, M. I.: Potential impact of convective fracture venting on salt-crust buildup and ground-water salinization in arid environments, J. Arid Environ., 65, 386–399, https://doi.org/10.1016/j.jaridenv.2005.07.011, 2006.
Weisbrod, N., Dragila, M. I., Nachshon, U., and Pillersdorf, M.: Falling through the cracks: The role of fractures in Earth-atmosphere gas exchange, Geophys. Res. Lett., 36, L02401, https://doi.org/10.1029/2008GL036096, 2009.
You, K. and Zhan, H.: Can atmospheric pressure and water table fluctuations be neglected in soil vapor extraction?, Adv. Water Resour., 35, 41–54, https://doi.org/10.1016/j.advwatres.2011.10.008, 2012.
You, K., Zhan, H., and Li, J.: A new solution and data analysis for gas flow to a barometric pumping well, Adv. Water Resour., 33, 1444–1455, https://doi.org/10.1016/j.advwatres.2010.07.008, 2010.
You, K., Zhan, H., and Li, J.: Gas flow to a barometric pumping well in a multilayer unsaturated zone, Water Resour. Res., 47, W05522, https://doi.org/10.1029/2010WR009411, 2011.
Zeng, Y., Xie, Z., and Liu, S.: Seasonal effects of irrigation on land–atmosphere latent heat, sensible heat, and carbon fluxes in semiarid basin, Earth Syst. Dynam., 8, 113–127, https://doi.org/10.5194/esd-8-113-2017, 2017.