the Creative Commons Attribution 4.0 License.
the Creative Commons Attribution 4.0 License.
 | 03 Feb 2025
The European summer heatwave of 2019 – a regional storyline perspective
Patrick Ludwig
Antonio Sanchez-Benitez
Helge F. Goessling
Peter Braesicke
Joaquim G. Pinto
The number and intensity of heatwaves have increased in the recent past, along with anthropogenic climate change. This poses challenges to many communities and emphasises the need to develop adaptation measures based on more accurate information regarding regional-to-local changes in temperature extremes and their impacts. While the general increase in global mean temperature is well established, current global climate projections show a large model spread concerning possible future circulation changes. To isolate the more certain thermodynamic response from the less certain dynamical response to anthropogenic climate change, we employ an event-based storyline approach and focus the present study on the 2019 summer heatwaves that occurred over central Europe. Our approach comprises three steps. Firstly, the large-scale circulation in the free troposphere was spectrally nudged to the ERA5 reanalyses within the global coupled climate model AWI-CM-1.1-MR for the recent period of 2017–2022, corresponding to global warming of +1.4 K. This process was then repeated under pre-industrial conditions, as well as under +2, +3, and +4 K global-warming climates. Secondly, the global storylines were dynamically downscaled using the regional ICOsahedral Nonhydrostatic model in Climate Limited-area Mode (ICON-CLM) to a EURO-CORDEX domain with a horizontal resolution of 12 km, and, thirdly, they were downscaled to a central European (German) domain with a resolution of 3 km. We provide evidence that the downscaling of global storyline integrations significantly improved the representation of present-day temperature patterns and reduced errors in daily 2 m temperatures relative to observations from central Europe. The magnitude of the heatwave temperature response significantly exceeds the globally modelled background warming, with distinct spatial and temporal variations in the regional increments. Our simulations indicate a general linear dependence of the 2 m temperature response on global-warming levels: during the July 2019 heatwave, warming rates ranged between factors of 2 and 3 in central Europe, resulting in anthropogenic warming of 8 to 12 °C in the +4 K climate. The spatial extent and duration of the heatwave are also amplified in the warmer climates. With this three-step downscaling approach, we gain new insights into possible future changes in heat extremes in central Europe, which apparently surpass global-warming trends. Along with its scientific value, our method provides ways to facilitate the communication of regional climate change information to users.
- Article
(14872 KB) - Full-text XML
-
Supplement
(21223 KB) - BibTeX
- EndNote


Heatwaves are a major natural hazard worldwide, with the heatwaves of 2003, 2010, and 2018 serving as prominent examples for the European continent (e.g. Fink et al., 2004; Barriopedro et al., 2011; Miralles et al., 2014; Spensberger et al., 2020). In the last 2 decades, Europe has witnessed an increase in the frequency, duration, and intensity of extreme heat events, which, in turn, has led to an increase in mortality rates, food and water insecurity, and long-term economic and cultural stress (Robine et al., 2008; García-Herrera et al., 2010; Perkins-Kirkpatrick and Lewis, 2020; Becker et al., 2022; Calvin et al., 2023; Knutzen et al., 2025). The general effects of climate change on heatwave characteristics have been shown to be robust in recent studies, which are often aimed at estimating the impact of human-induced greenhouse gas (GHG) forcing on recent extreme events using observational records and at projecting future changes by means of climate modelling (e.g. Barriopedro et al., 2011, 2023). The traditional approaches, which commonly involve multi-model averaging and probabilistic event attribution, can provide estimates of trends in the frequency, intensity, and persistence of extreme events, but they lack clarity regarding the physical processes causing the changes (Shepherd, 2014).
One current scientific challenge involves disentangling the relative roles of dynamical and thermodynamic contributions to future heatwave characteristics in attribution and projection studies (Shepherd, 2014, 2021; Sousa et al., 2020; Sánchez-Benítez et al., 2018). Thermodynamic effects, such as near-surface warming, moistening of the atmosphere, and the partitioning of radiative and turbulent fluxes, show a relatively robust response to anthropogenic GHG forcing in models and generally tend to exhibit less internal variability (Deser et al., 2014; Wehrli et al., 2018). On the other hand, dynamic effects, which include changes in the position, strength, and meandering of the jet stream, as well as changes in the occurrence of weather regimes and more localised circulation patterns, are subject to larger uncertainties (Deser et al., 2014; Shepherd et al., 2018; Zappa, 2019). First, this is associated with inherent model uncertainties and differences in the parameterisation of unresolved processes in the models (Shepherd, 2014). Second, the internal variability in the dynamical component of the atmosphere is responsible for a low signal-to-noise ratio in studies aimed at quantifying the regional response of extreme events to global warming (Deser et al., 2014; Shepherd, 2014, 2021; Wehrli et al., 2018; Barriopedro et al., 2023).
An alternative to circumventing the uncertainties associated with different atmospheric-circulation changes under enhanced GHG forcing is to use an event-based storyline approach, in which the dynamical conditions are constrained to the present-day state in a specified way (Caviedes-Voullième and Shepherd, 2023). Along with the uncertainty in changing dynamics, the internal variability is considerably reduced in event-based storylines (Sánchez-Benítez et al., 2022), which improves the signal-to-noise ratio, providing us with the opportunity to better quantify the actual event-specific thermodynamic response. Assuming the robustness of this quantification, we improve our understanding of the potential impacts of future extreme events and communicate them to the public and authorities in a more understandable manner.
Constraining the dynamical conditions on a regional scale can be achieved with the pseudo-global-warming (PGW) approach, i.e. by perturbing boundary conditions obtained from reanalyses using the average climate change signal (deltas) from global climate models (GCMs) (Schär et al., 1996; Aalbers et al., 2023; Ludwig et al., 2023; Vries et al., 2024). As only smoothed, multi-year-averaged GCM fields are used to modify the boundary conditions, this method is computationally effective, representing a significant advantage for multi-model and multi-ensemble studies of regional thermodynamic responses to global warming (Brogli et al., 2023).
While the inter-annual variability in delta fields obtained from GCMs is intentionally suppressed in the PGW approach, it can be consistently taken into account in spectrally nudged storylines. In this storyline method, a GCM is run by nudging the upper-tropospheric winds to force the large-scale circulation to follow the reanalysis state, while the background climate corresponds to a specific warming level (Sánchez-Benítez et al., 2022; Athanase et al., 2024; van Garderen et al., 2021; Wehrli et al., 2020). If the GCM is a coupled model, as in Sánchez-Benítez et al. (2022), no assumptions about the deltas of sea surface temperature and sea ice content need to be made (van Garderen et al., 2021).
On the other hand, one advantage of the PGW approach over the nudged storyline approach is its potential for avoiding GCM-specific biases by repeating the experiment with deltas derived from multi-model ensemble means or different single-model multi-member ensemble means (see e.g. Aalbers et al., 2023; Vries et al., 2024). In our work, we follow the path prescribed by a single GCM. In the context of the storyline approach, this unfolding of events is physically self-consistent and plausible, adhering to the storyline definition introduced by Shepherd et al. (2018) and allowing for a process-oriented evaluation of the obtained responses.
Nevertheless, GCMs have difficulty representing regional climate means and variability due to unresolved orography and shortcomings in model parameterisations associated with their coarse horizontal resolution (Giorgi and Gutowski, 2015). For example, using global nudged storylines, Sánchez-Benítez et al. (2022) found a strong amplification of the July 2019 European heatwave under global warming; however, their global simulations underestimated the high-temperature extremes reached during the heatwave. An effective method for addressing the lack of precision in GCMs involves performing dynamical downscaling with a regional climate model (RCM) (Feser et al., 2011; Giorgi, 2019; Vautard et al., 2021). Commonly, the horizontal resolution of RCMs applied to the European domain is on the order of 10–12 km (e.g. Jacob et al., 2014; Giorgi and Gutowski, 2015). Being computationally efficient, this resolution allows for the production of large ensembles of simulations, significantly improving the representation of relevant climatological variables compared to GCMs (Vautard et al., 2021). Nevertheless, convective processes can only be resolved by regional convection-permitting models (CPMs) operating at resolutions finer than 4 km (Prein et al., 2015; Giorgi, 2019; Hundhausen et al., 2023). Associated with explicitly resolved deep convection and better-captured processes in regions with complex topography, CPMs have been shown to add further value to RCMs in their representation of precipitation and near-surface temperature, especially in regions with complex topography (Prein et al., 2015; Giorgi, 2019).
In this study, we go a step beyond the global storyline approach by providing a regional perspective on the heatwave that occurred in Europe during July 2019 and its unfolding in colder (pre-industrial) and warmer climates (see e.g. Sánchez-Benítez et al., 2022; Sousa et al., 2020). With this aim, we dynamically downscale the global spectrally nudged storylines for the summer 2019 heatwave across five different background climates, ranging from pre-industrial conditions to +4 K global warming, for (central) Europe. The approach utilises a global-to-regional (GCM–RCM–CPM) model chain comprising global spectrally nudged storyline simulations obtained from the Alfred Wegener Institute's global coupled climate model AWI-CM-1.1-MR (hereafter referred to as AWI-CM1; Semmler et al., 2020), with large-scale horizontal winds spectrally nudged to ERA5 (Hersbach et al., 2020), and the ICOsahedral Nonhydrostatic model in Climate Limited-area Mode (ICON-CLM) (Pham et al., 2021) for dynamical downscaling – first to a 12 km horizontal grid spacing over Europe and subsequently to a 3 km horizontal grid spacing over central Europe. This approach permits the derivation of climate data at a high resolution, thereby providing detailed information for attribution and impact studies.
We address the following research questions:
-
How accurately can a regional event-based storyline simulation represent a recent event, and what improvement does it offer compared to the global spectrally nudged storyline simulation?
-
What was the effect of climate change on the 2019 European heatwave based on regional and convection-permitting ICON-CLM simulations?
-
What local-to-regional extreme temperature scaling occurs in response to global warming for an event like the 2019 heatwave?
The paper is structured as follows. Section 2 describes the global and regional model setups, as well as the datasets used for model evaluation. The main results are presented in Sect. 3, with the first research question addressed in Sect. 3.1 and the regional storylines analysed in Sect. 3.2 and 3.3. Section 4 summarises and discusses the results, formulates the main conclusions for each research question, and provides future research ideas.
2.1 Global spectrally nudged storylines
The global spectrally nudged simulations are based on the global coupled climate model AWI-CM1 (Semmler et al., 2020). This model has contributed to the sixth phase of the Coupled Model Intercomparison Project (CMIP6; Eyring et al., 2016). It consists of the atmospheric model ECHAM6.3.04p1 from the Max Planck Institute for Meteorology (MPI-M) (Stevens et al., 2013), coupled with version 1.4 of the Finite-volumE Sea ice–Ocean Model (FESOM) for the ocean component (Wang et al., 2014). The atmospheric component is run at a T127L95 spectral resolution, i.e. with truncation at wavenumber 127, which corresponds to a horizontal resolution of about 100 km in the tropics and 95 vertical levels extending up to ∼0.01 hPa. The ocean model FESOM uses an unstructured mesh that allows for fine resolutions in energetically active areas such as the Gulf Stream (Sidorenko et al., 2015; Sein et al., 2017). Consequently, the horizontal resolution of the ocean ranges from 80 km in the subtropical Pacific to 8–10 km in the North Sea and 8–20 km in the Arctic (see Fig. 1 in Semmler et al., 2020).
In the storyline experiments, the evolution of the AWI-CM1 large-scale atmospheric circulation is constrained by spectrally nudging the model's vorticity and divergence (representing large-scale horizontal winds) to ERA5 reanalysis data (Hersbach et al., 2020), with an e-folding time of 24 h and a spectral truncation of 20 for zonal wavenumbers. Nudging is applied only to vertical levels between 700 and 100 hPa. This configuration has been shown to optimally constrain large-scale events, such as heatwaves (Sánchez-Benítez et al., 2022), warm and moist intrusions in the Arctic (Pithan et al., 2023), and marine heatwaves (Athanase et al., 2024), while preserving some freedom in the boundary layer and at small spatiotemporal timescales.
A series of nudged storyline simulations were conducted using ESM-Tools (Barbi et al., 2021) for a range of climate states based on the configuration described above. Specifically, nudging experiments were branched off from the historical CMIP6 runs (Semmler et al., 2020) for 1 January 1851 to produce pre-industrial climate conditions. Meanwhile, climate scenarios for the present day (+1.4 K) and for +2, +3, and +4 K (relative to pre-industrial) conditions were made by spawning the CMIP6 experiments corresponding to the Shared Socioeconomic Pathway scenario SSP370 (Semmler et al., 2019) on 1 January of the years 2017, 2038, 2065, and 2093, respectively. These years were selected based on when the global-warming levels were reached. Each of the storylines comprises five ensemble members, spawned from the five respective CMIP6 simulations and thus started using slightly different initial conditions. Each storyline is simulated continuously from 1 January 2017 to 30 September 2022. Throughout the text, for all storylines, we refer to the years corresponding to the present-day circulation inferred from ERA5 as the “dynamical years” of 2017–2022.
2.2 Dynamical downscaling with ICON-CLM
Next, data from the global spectrally nudged storylines described in Sect. 2.1 were used as initial and boundary conditions to drive version 2.6.5.1 of the ICON (ICOsahedral Nonhydrostatic) model (Zängl et al., 2015), implemented using a regional climate configuration known as ICON-CLM (Pham et al., 2021). We used the runtime environment “Starter Package for ICON-CLM Experiments” (SPICE v2.0) (Rockel and Geyer, 2022) to conduct all the simulations. For each storyline, we simulated the full 2017–2022 period, as described in Sect. 2.1. The downscaling was performed on a EURO-CORDEX domain (Jacob et al., 2014) with an R12B5 resolution, meaning that each edge of the base icosahedron was initially divided into 12 parts, followed by five bisections of each resulting triangle's edges. This corresponds to a horizontal grid spacing of 0.11° (or 12 km), hereafter referred to as EUR-12 (Fig. 1a; see e.g. Prill et al., 2023, for a description of icosahedral grid-spacing conventions). Subsequently, we ran a nested ICON-CLM simulation at an R13B7 resolution, corresponding to a horizontal grid spacing of 0.0275° (or 3 km), on ensemble member 1 for the extended German domain (hereafter referred to as GER-3), including the peripheral hydrological catchment areas (see Fig. 1b). In this study, we only focus on ensemble member 1 for the GER-3 domain. A detailed analysis of the full GER-3 ensemble is thus reserved for another study.
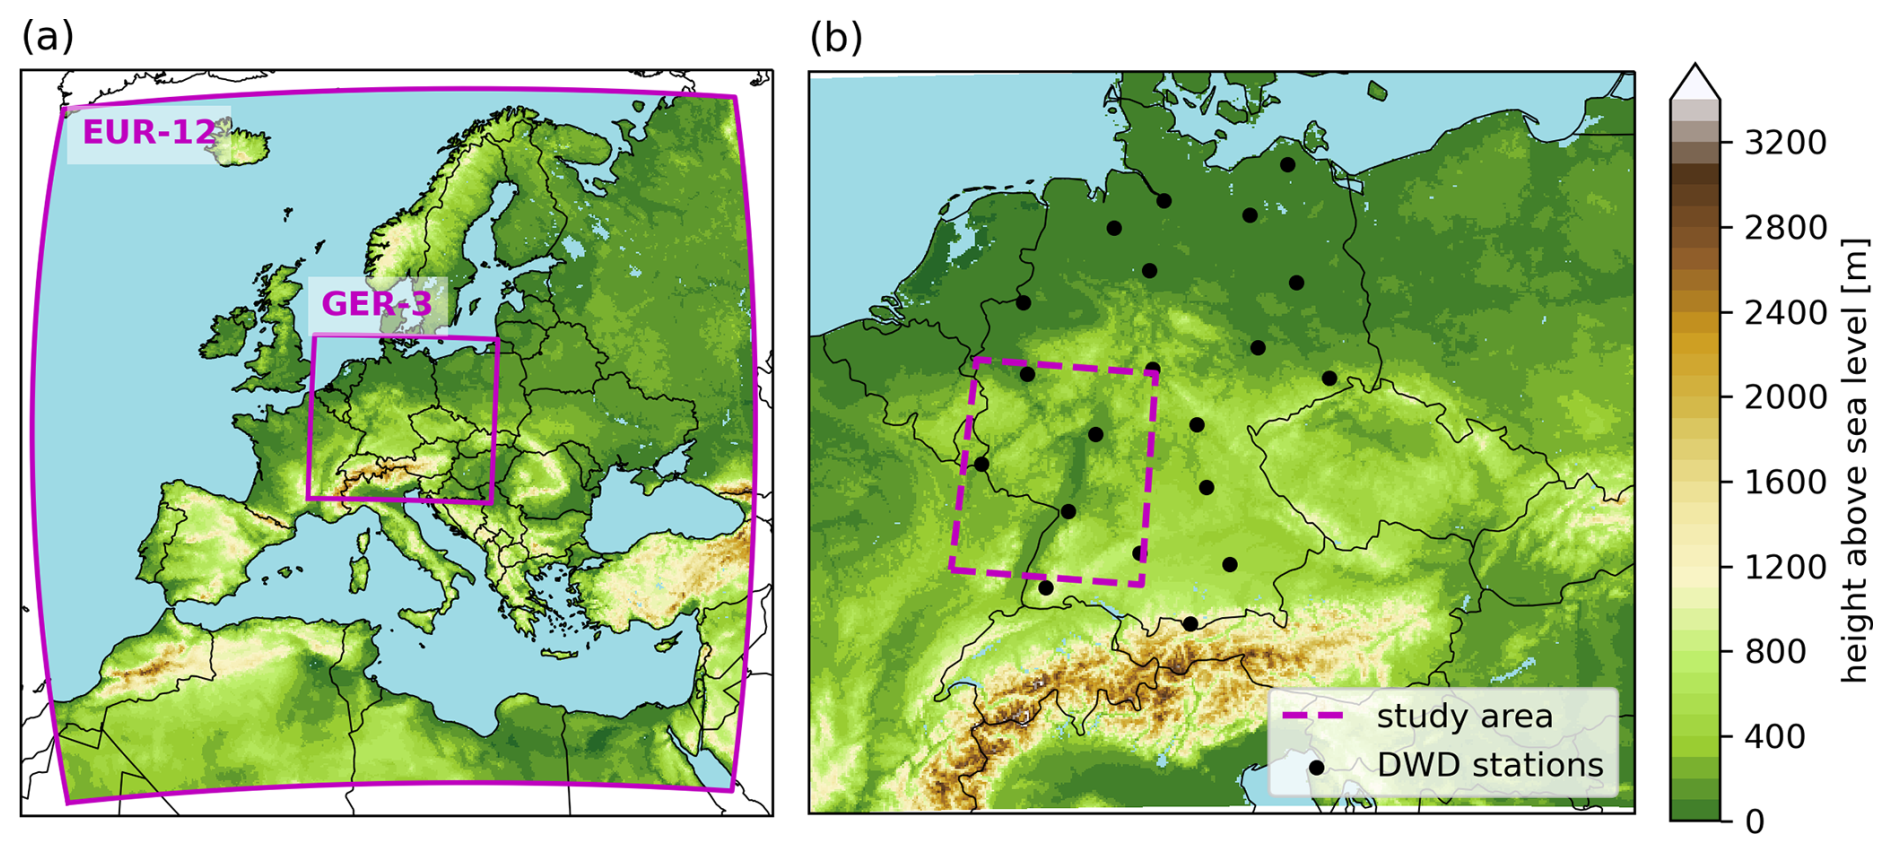
Figure 1(a) The EUR-12 and GER-3 domains used for downscaling the global AWI-CM1 storylines with ICON-CLM. (b) The GER-3 domain, showing the locations of the DWD (German Weather Service) observation stations and the area used for spatial averaging (48–51° N, 6–10° E). Colours correspond to the orography used in the simulations. The shown domains include the lateral boundary zone.
At the upper boundary, grid-point nudging was applied in the ICON-CLM simulations to maintain proximity to the present-time circulation represented by the global spectrally nudged AWI-CM1 runs. In ICON, this nudging was implemented as an additional forcing term, added to the prognostic equations at each fast-physics time step (Prill et al., 2023):
where ψbc(t) is the value of the prognostic variable ψ at time t, taken from the driving model; ψ∗ is the value of the variable ψ before the nudging; αnudge refers to the nudging strength; and Nds is the number of dynamics substeps per fast-physics step (Prill et al., 2023). Upper-boundary nudging is applied to a sponge layer of a chosen thickness, where the nudging strength increases quadratically with height, starting with zero at the nudging start height (zstart) and reaching the maximum nudging coefficient (B0) at the model's top height:
The nudging coefficient for the thermodynamic prognostic variables θv, ρ, and qv was set to zero to prevent overfitting and, even more importantly in this context, to allow for the free development of thermodynamics. Thus, upper-boundary nudging was applied only to the horizontal velocity. We kept the maximum coefficient (B0) at its default value of 0.04. The nudging start height (zstart) in the EUR-12 domain was set to 5000 m, while for the GER-3 domain, it was left at 10 500 m to prevent any interaction with deep convection. Further information can be found in Prill et al. (2023).
Soil temperature and soil moisture data from ERA5 were used for soil initialisation in all EUR-12 simulations due to the partial unavailability of soil temperature data in AWI-CM1 outputs. In ICON, the initialising soil data are pre-processed and remapped onto the eight-layer mesh by the built-in algorithm (Prill et al., 2023; Pham et al., 2021). To account for the possible discrepancy in soil types between ICON and ERA5, the volumetric soil moisture was transformed to align with the universal soil moisture index (SMI), making it independent of the soil type (Prill et al., 2023). For the present-time experiment, the initial simulation year (2017) was considered for spin-up. In the storyline simulations, an additional year was required for the soil to adapt to the warmer climate. Therefore, we ran the dynamical year 2017 twice. Additionally, the temperature of the bottom soil layer, which is not prognostic in the TERRA land module of ICON but is set to the climatological annual mean near-surface temperature (T_CL) based on Climate Research Unit data (Schulz et al., 2016; Mitchell and Jones, 2005), was adjusted to reflect the respective global-warming level for each storyline. The lower-boundary condition for soil moisture was provided by a free-drainage formulation and thus did not require additional adjustments (Prill et al., 2023; Chen et al., 2018; Zeng and Decker, 2009).
2.3 Model evaluation approach
We compare the obtained daily 2 m temperature fields to the ERA5 reanalyses (Hersbach et al., 2020; Hersbach et al., 2023) and to E-OBS (v28), a daily gridded, land-only observational dataset for Europe (see e.g. Cornes et al., 2018; Copernicus Climate Change Service, 2023). To evaluate the simulations at the station level, we use 20 stations from the German Weather Service (DWD) (DWD, 2023; Kaspar et al., 2013; see the full list in Table S1 in the Supplement). The root mean square difference (RMSD) corresponding to the observational datasets (DWD and E-OBS) and its change between simulations of different resolutions (ΔRMSD) are chosen as metrics to compare the representations of near-surface temperatures provided by the models in our GCM–RCM–CPM chain for the present-day storyline. The significance of ΔRMSD between ICON EUR-12 and GER-3 is computed with the paired-difference test (Rubin, 1973).
3.1 Evaluation of the present-day storylines
The results of the ICON regional model simulations are evaluated by comparing the model output with observational E-OBS and ERA5 reanalysis data. A comparison of the 2 m temperature fields and 500 hPa geopotential-height fields for the heatwave peaks of June and July 2019 shows good agreement between the ICON EUR-12 simulations (Fig. 2c and f) and ERA5 reanalyses (Fig. 2a and d). Furthermore, the ICON simulations show a clear improvement in the representation of daily 2 m temperature compared to the global AWI-CM1 simulations (Fig. 2b and e). A comparison of the daily temperature fields with E-OBS yielded similar results (see Fig. S1 in the Supplement).
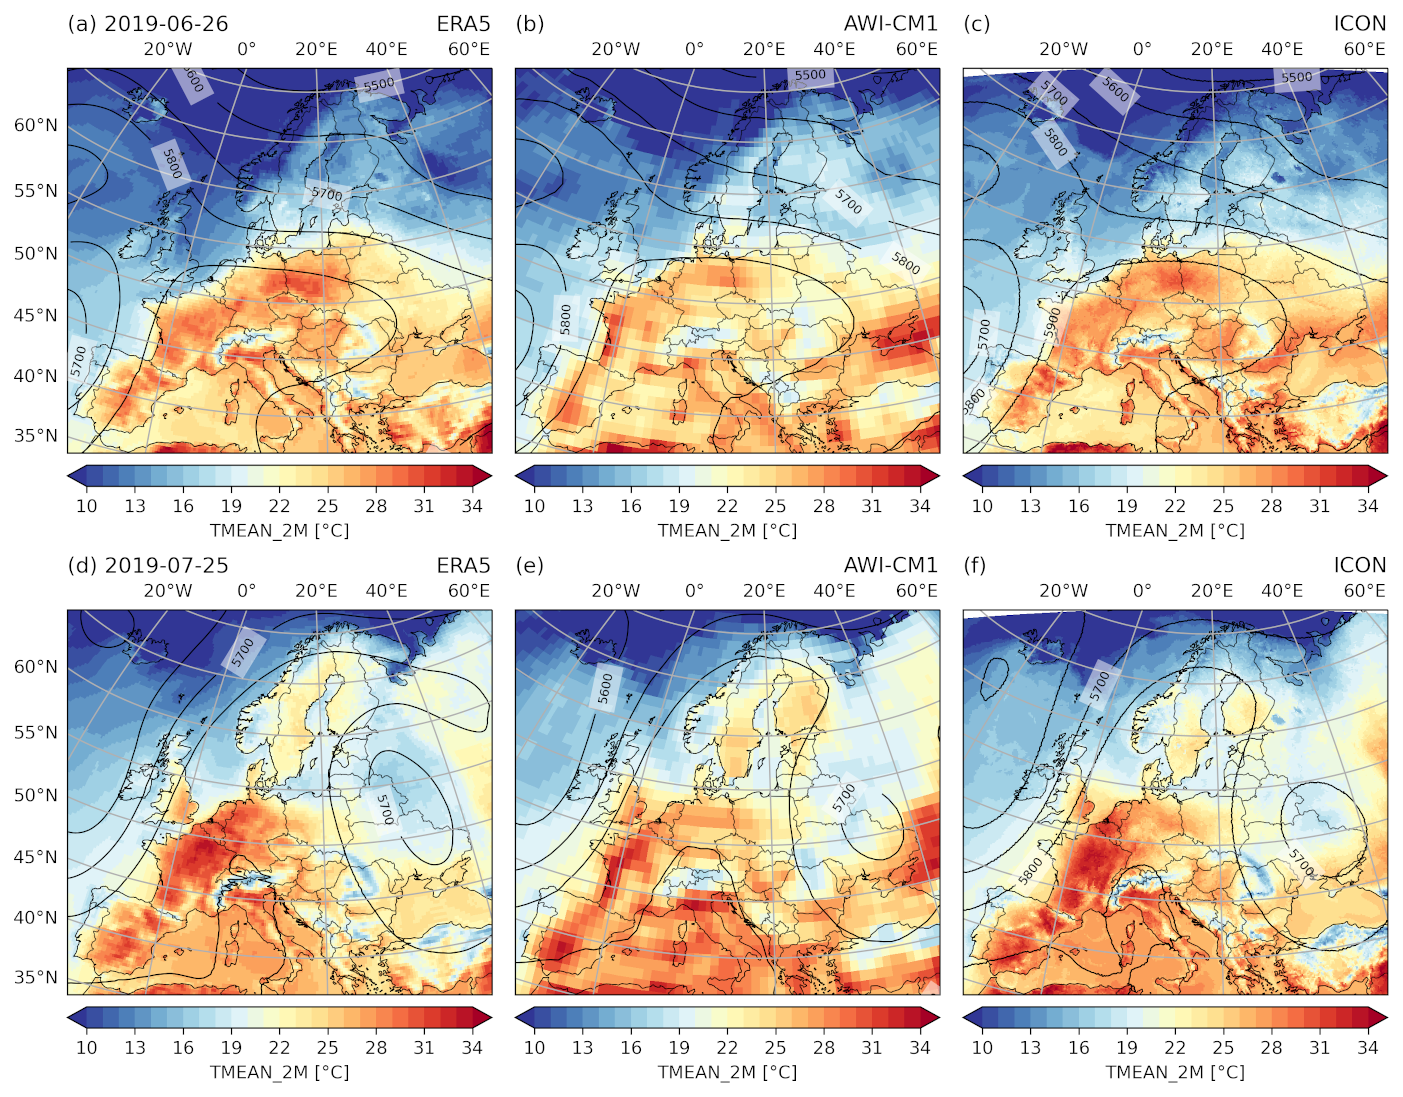
Figure 2Mean 2 m temperature (colours) and geopotential height at 500 hPa (contours) on 26 June 2019 (the first peak of the June heatwave) and 25 July 2019 (the peak of the July heatwave) for ERA5 (a, d), AWI-CM1 (b, e), and ICON EUR-12 (c, f).
In Fig. 3, time series of daily maximum, mean, and minimum 2 m temperatures are compared with E-OBS over a given latitude–longitude area (48–51° N, 6–10° E) to investigate the underestimation of maximum temperatures during the exceptionally hot periods of June and July 2019, as mentioned in Sánchez-Benítez et al. (2022). The ICON simulations show an improvement in both the daily maximum and minimum temperatures for July in this area. This indicates a more accurate representation of the diurnal temperature range in the regional ICON simulations.
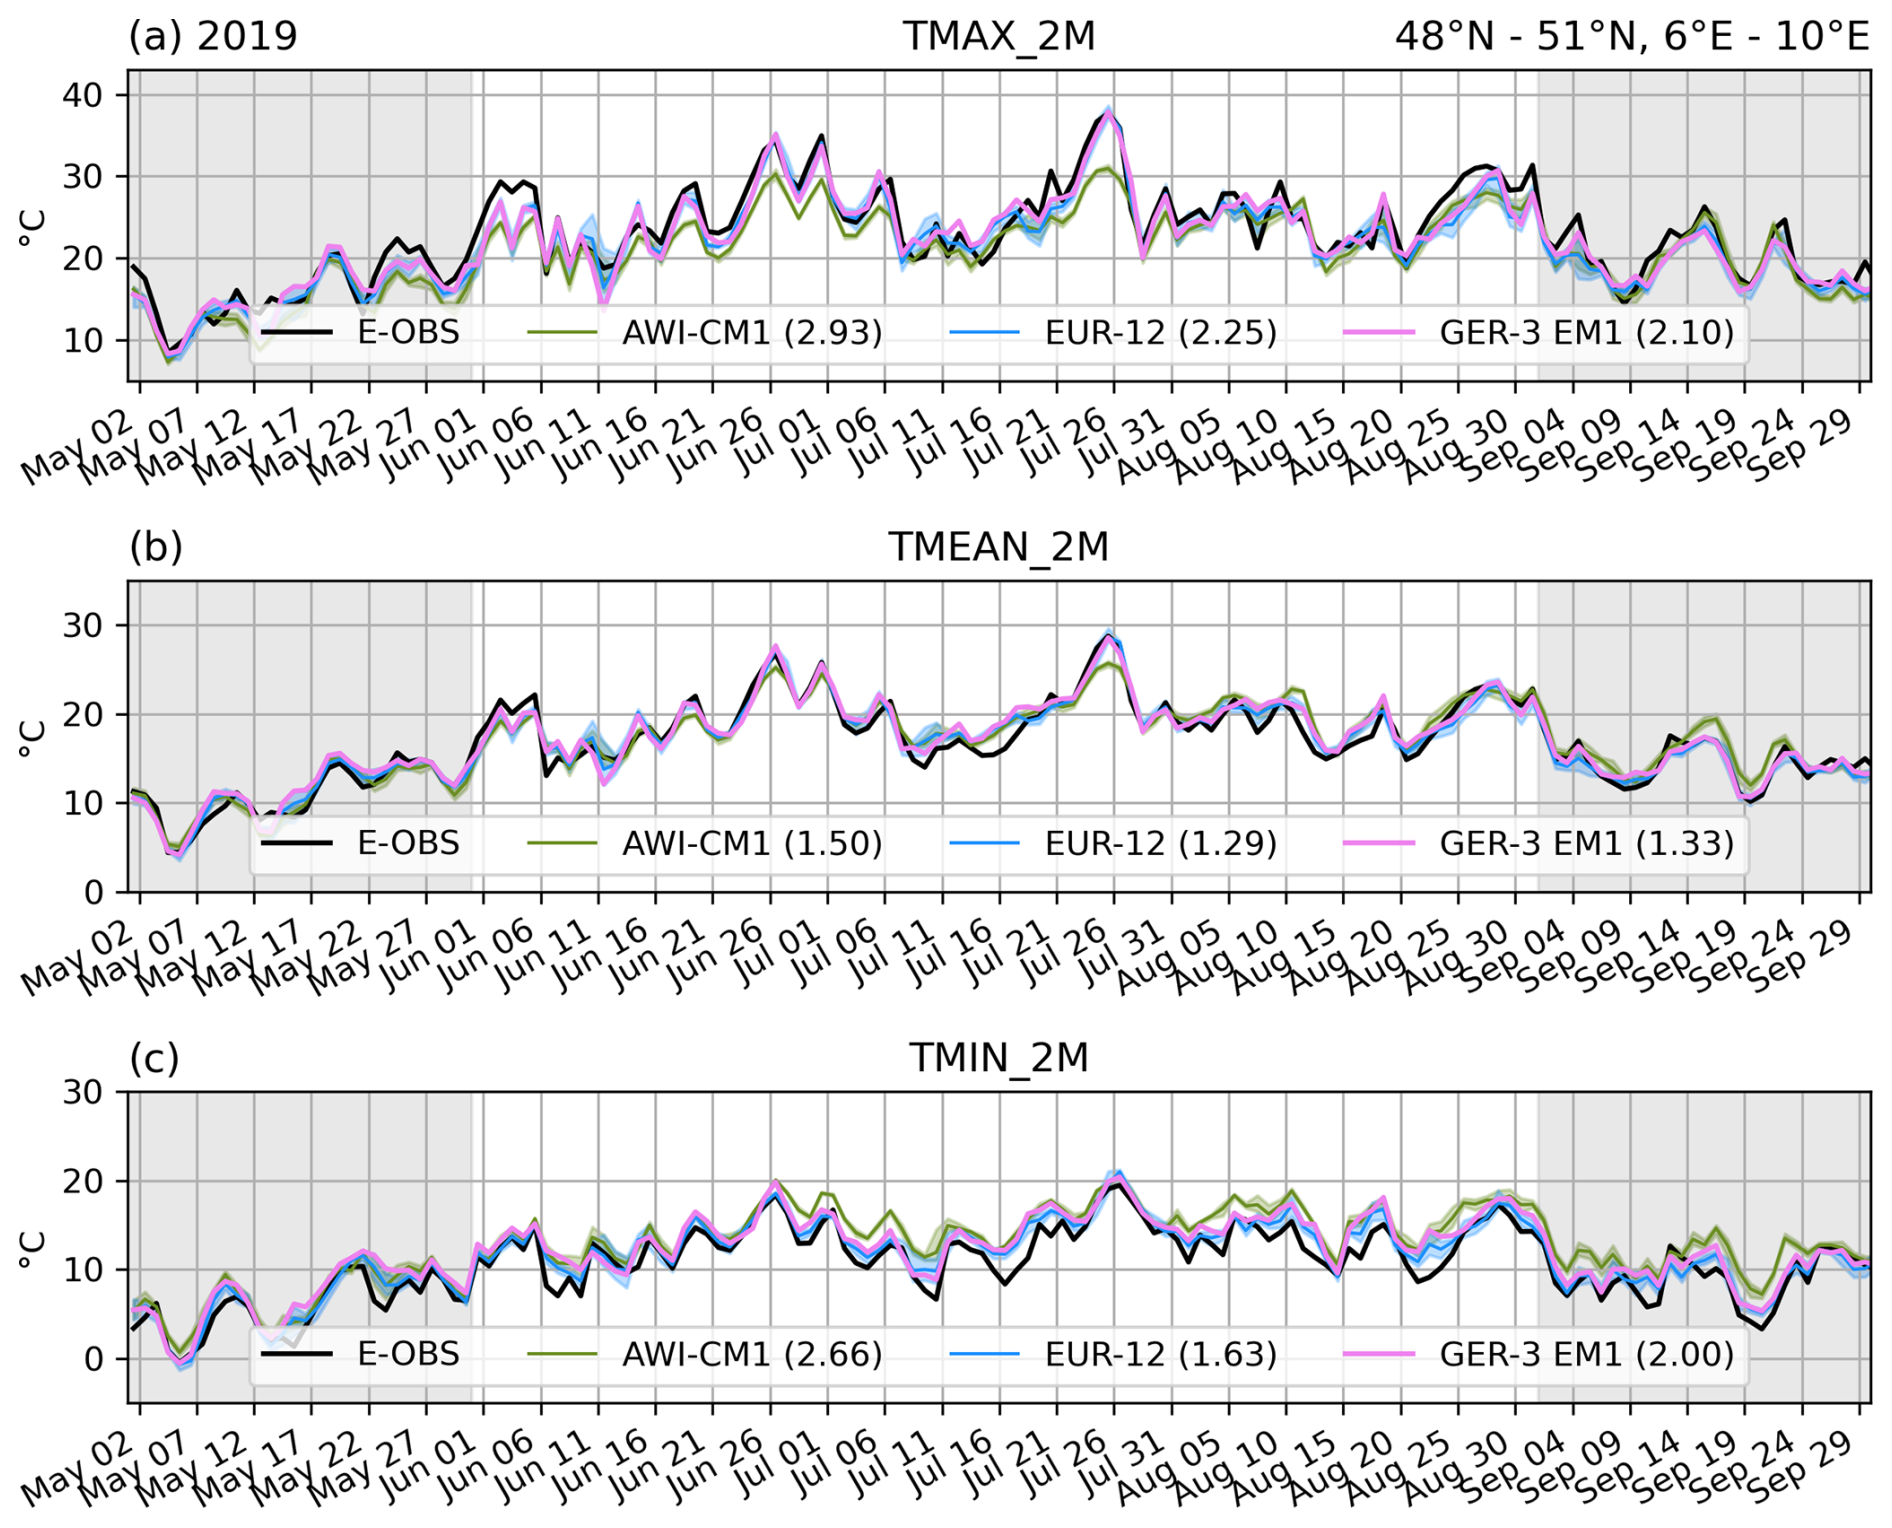
Figure 3Comparison with E-OBS of daily (a) maximum, (b) mean, and (c) minimum 2 m temperatures obtained with AWI-CM1, ICON EUR-12, and ICON GER-3 (ensemble member 1 – EM1), averaged across a latitude–longitude box with the following boundaries: 48–51° N, 6–10° E (dashed box in Fig. 1b). Shading indicates the minimum–maximum range of values obtained from the five-member ensembles. The numbers shown in brackets in the legends display the RMSD in ensemble member 1 relative to E-OBS for June, July, and August.
We compared the performance of the simulations within the model chain by calculating the root mean square difference (RMSD) between the simulated 2 m temperature and DWD observations (DWD, 2023) for June–August, using data from 20 selected stations (locations are shown in Fig. 1b, with the full list of stations given in Table S1). The RMSD is significantly reduced by the dynamical downscaling of AWI-CM1 data to the EUR-12 domain (see Table 1). In the case of the GER-3 simulation, a further reduction in the RMSD could only be achieved for the daily maximum 2 m temperatures, whereas the daily minimum and mean temperatures slightly deteriorated but remained clearly improved compared to those from AWI-CM1. A similar result can be obtained when the RMSD is calculated between the simulations and the E-OBS time series shown in Fig. 3 (see the RMSD values in the legend).
Table 1The root mean square differences (RMSDs), expressed in degrees Celsius, of daily maximum, mean, and minimum 2 m temperatures (TMAX_2M, TMEAN_2M, and TMIN_2M, respectively) relative to DWD station observations recorded during summer (June–August) 2019, averaged over 20 stations (for locations, see Fig. 1).
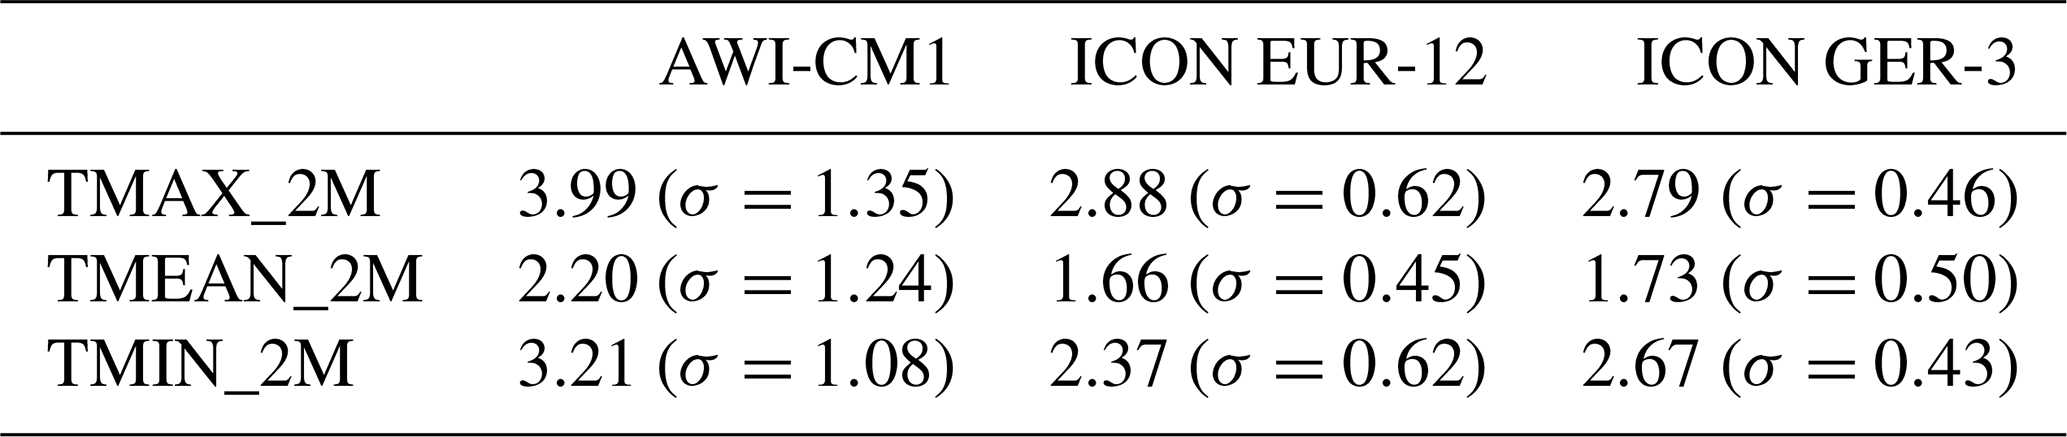
Figure 4a–c shows the spatial distribution of the RMSD between EUR-12 and E-OBS for the daily maximum, mean, and minimum temperatures corresponding to the summer of 2019. The RMSD varies between 1 and 2 °C in central Europe for daily mean temperatures and between 2 and 3.5 °C for daily minimum and maximum temperatures, which aligns with the values shown in Table 1. We interpolated the ICON EUR-12 data to the grid of AWI-CM1 and compared the RMSDs for both models to E-OBS. The green colours in Fig. 4d–f indicate an improvement in the performance of the regional simulations compared to the global AWI-CM1 simulation for the respective temperatures. The overall improvement in central and southern Europe is robust, with the exception of the maximum temperatures found along the coast of the Iberian Peninsula and north of the Black Sea.
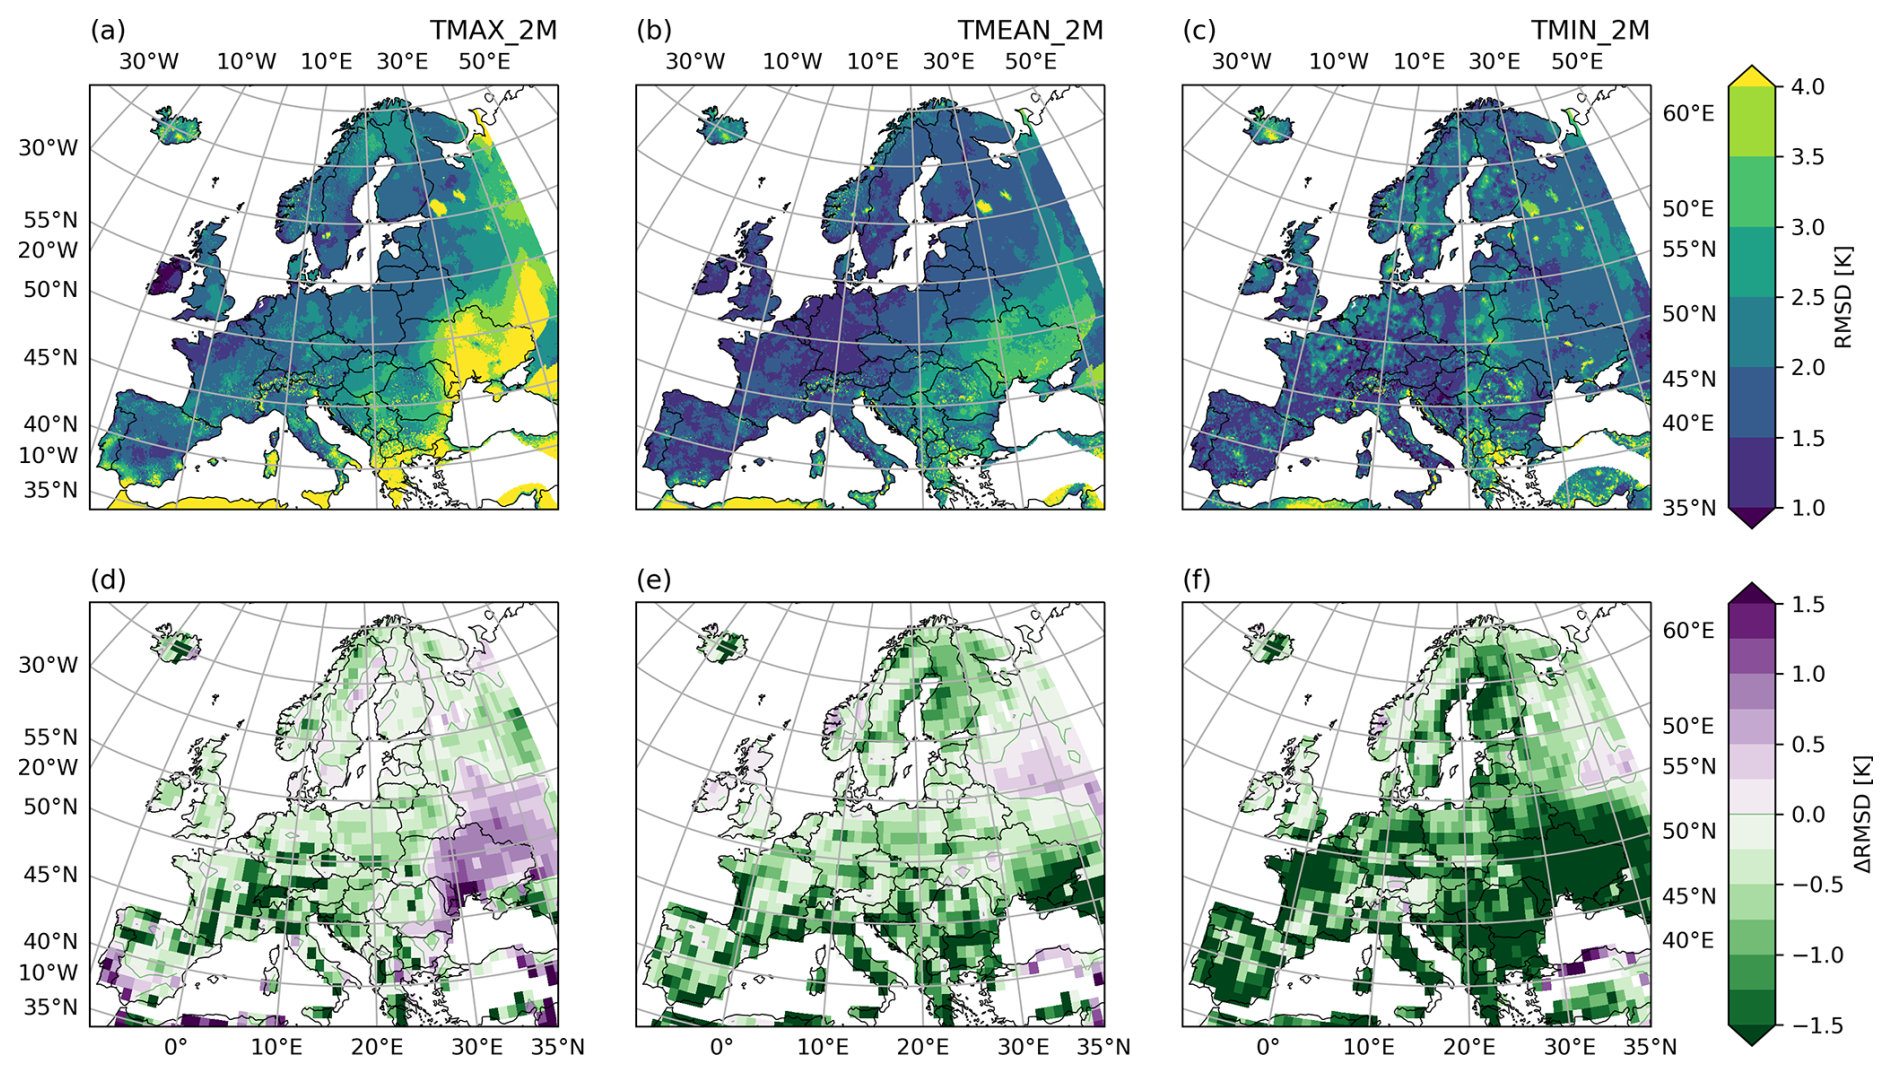
Figure 4Performance assessment of the ICON EUR-12 simulations for June, July, and August 2019 for daily (a, d) maximum, (b, e) mean, and (c, f) minimum 2 m temperatures. (a–c) Root mean square difference (RMSD) in the simulated daily 2 m temperatures from ICON EUR-12 relative to E-OBS. (d–f) Change in RMSD achieved by dynamical downscaling; the green colours correspond to the reduced squared error in daily temperatures.
To identify potential systematic biases, the observed E-OBS temperature fields were compared to the EUR-12 ones. From Figs. S2 and S3, it can be inferred that the negative bias in daily maximum temperatures in central Europe, introduced in the AWI-CM1 simulations, is reduced (see Fig. S3a and d), along with the positive bias in daily minimum temperatures (Fig. S3c and f). According to Fig. S3a and g, the increased error in daily maximum temperatures in western Iberia and eastern Europe, mentioned above, can be attributed to the positive bias introduced by ICON-CLM.
A similar comparison was conducted for all simulated summer seasons between 2018 and 2022 (Figs. S4 and S5). This comparison demonstrates that the bias patterns persist consistently across all the simulated summers, suggesting that the errors are not flow-dependent.
The nested convection-permitting GER-3 simulation was assessed by comparing the RMSD in the 2 m temperature to the RMSD corresponding to the driving EUR-12 simulation (see Fig. 5). To this end, both temperature datasets were interpolated to the E-OBS grid (0.1° horizontal resolution). We also evaluated the average bias between the nested simulations by subtracting the EUR-12 seasonal mean temperature fields from the GER-3 fields, which were coarsened to the EUR-12 domain (see Fig. S6a–c). The bias of the GER-3 fields relative to E-OBS is shown in Fig. S6d–f.
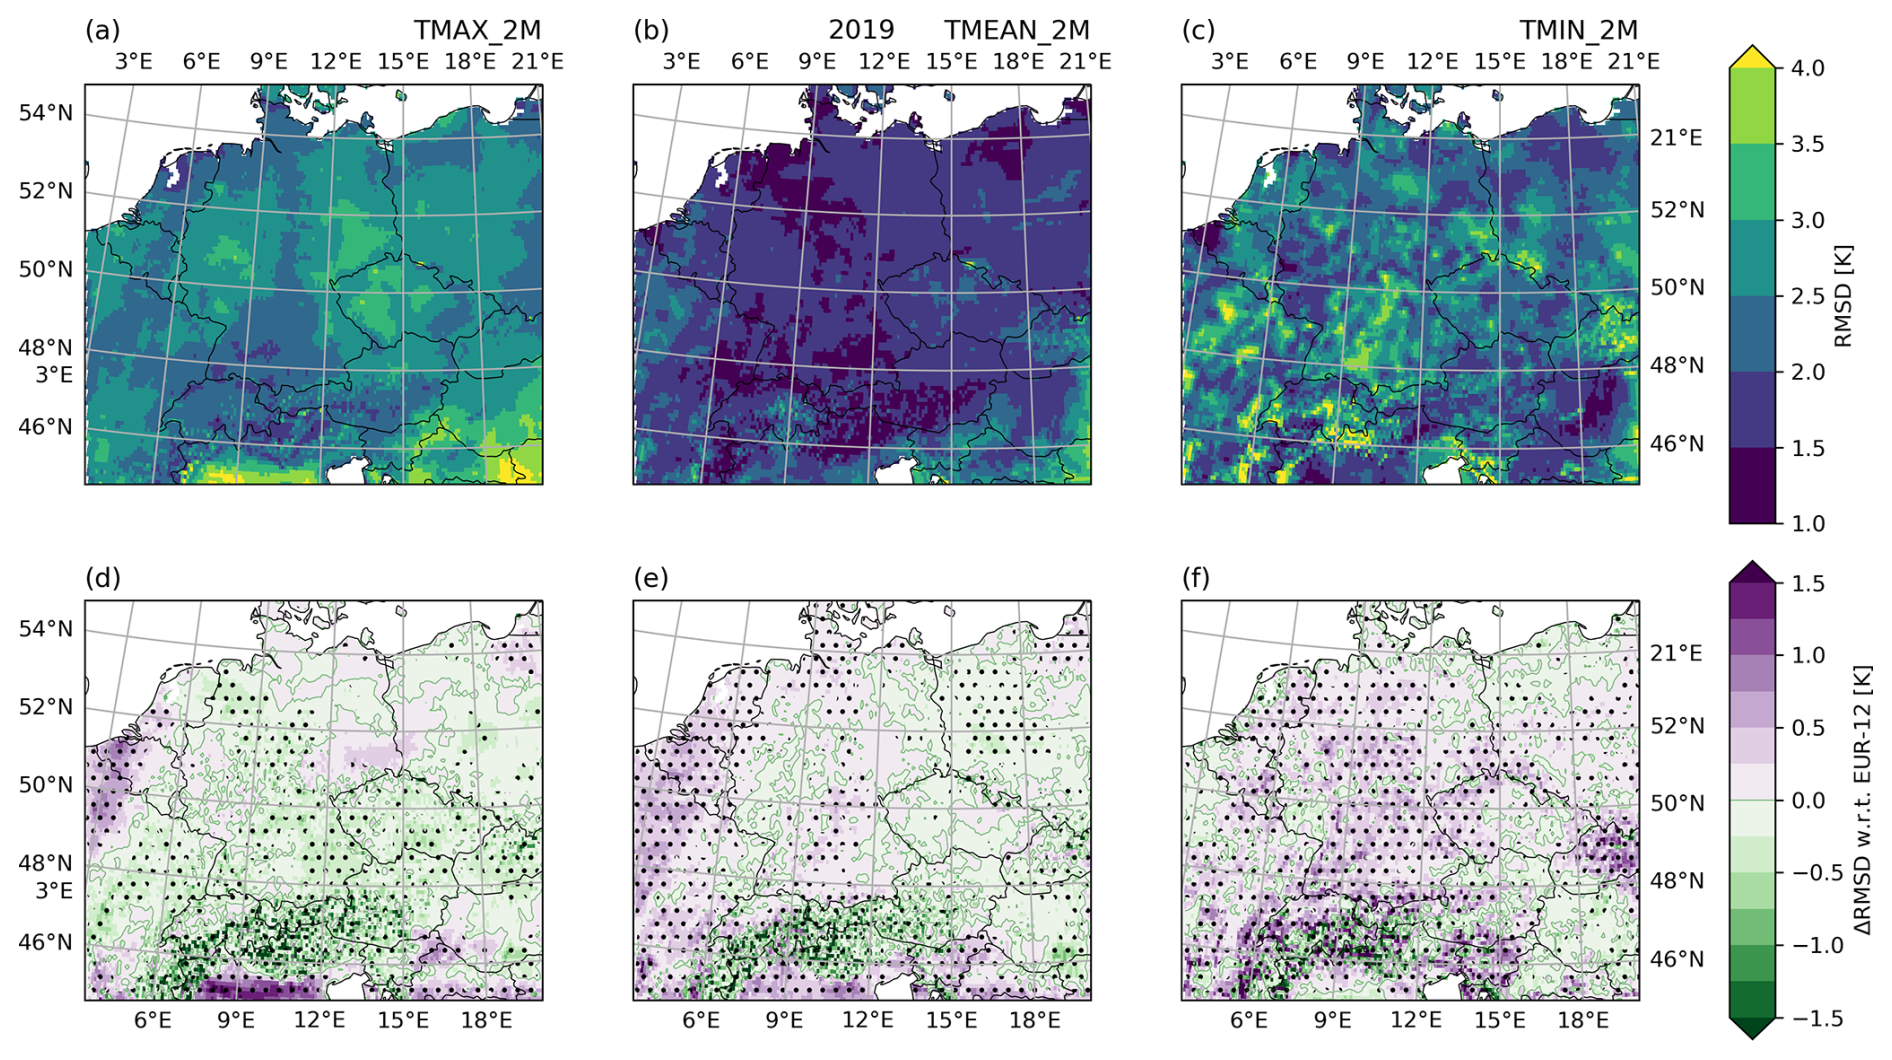
Figure 5Evaluation of the nested convection-permitting GER-3 simulations for June, July, and August 2019 for daily (a, d) maximum, (b, e) mean, and (c, f) minimum 2 m temperatures. (a–c) Root mean square difference (RMSD) in daily 2 m temperature relative to E-OBS for the GER-3 simulation. (d–f) Change in RMSD with respect to (w.r.t.) the EUR-12 simulation, with significant differences indicated by hatching (p<0.05).
The nested GER-3 simulation is between 0.5 and 2 K warmer than the EUR-12 simulation, which further reduces the negative bias in the daily maximum temperature over Germany. However, the positive bias in the daily minimum temperature increases, and the representation of the daily mean temperature shows no robust improvement over Germany. The most substantial bias in daily maximum temperature occurred in the Po Valley and in the westernmost parts of the domain over land. However, these areas are located within the lateral boundary zone and are not used in the analyses (see Fig. S6). Due to refined topography, the nesting significantly reduced the RMSD in maximum and mean 2 m temperatures over the Alps (see Fig. 5d–f).
Analogous to the assessment of the EUR-12 simulation, the evaluation of the GER-3 simulation over the full simulation period demonstrates that the patterns shown in Fig. 5 remain consistent over the years for all modelled summer seasons between 2018 and 2022 (see Figs. S7 and S8), with a more prominent improvement in the RMSD observed for the maximum temperatures (Figs. 5d and S7d).
3.2 Storylines for the summer 2019 heatwaves
Given the improved performance of dynamical downscaling with ICON-CLM under present-day conditions, we now analyse the regionalised past and future analogues of the July 2019 European heatwave.
We first consider the period corresponding to the peak of the July 2019 heatwave. According to Fig. 6, the maximum temperature on 25 July exceeds 40 °C over a considerable area of western Europe in a +4 K climate. The area affected by temperatures exceeding 40 °C is projected to increase significantly in the EUR-12 simulations, from 21 000 ± 14 000 km2 in the pre-industrial climate to 290 000 ± 40 000 km2 in the present-day climate and 1 110 000 ± 70 000 km2 in the +4 K climate (see Fig. S9). Moreover, the 45 °C threshold is projected to be surpassed across a large area of western France in the +3 K climate and across Benelux and the Rhine Valley in the +4 K warmer world (Fig. 6i and j).
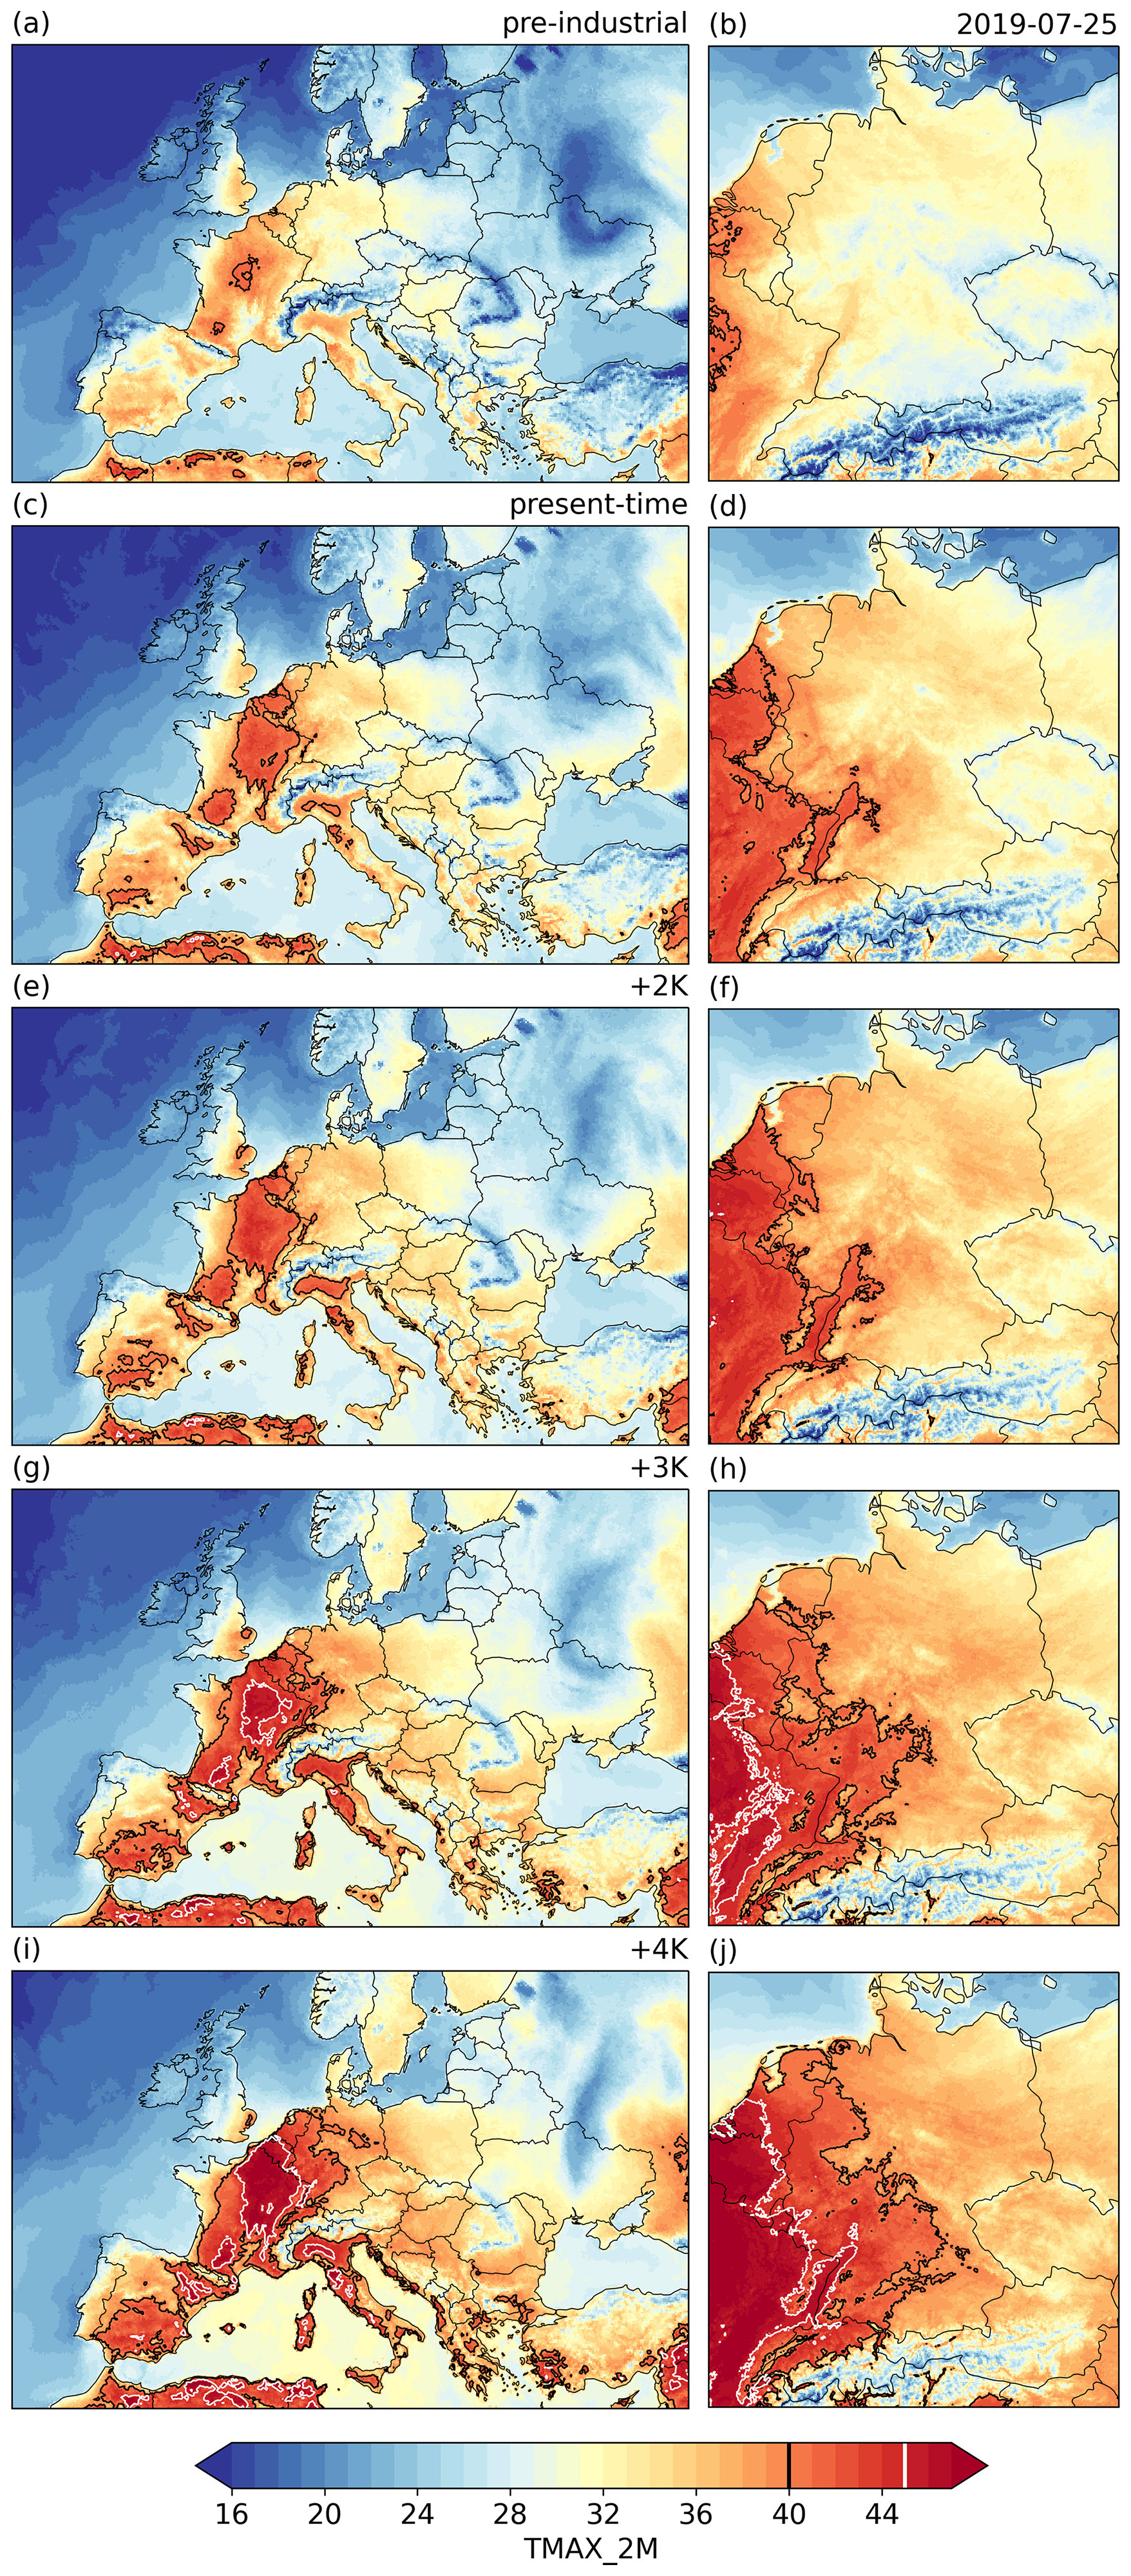
Figure 6Daily maximum 2 m temperatures on 25 July for the ICON EUR-12 simulations (a, c, e, g, i) and ICON GER-3 simulations (b, d, f, h, j) with respect to pre-industrial (a, b), present-time (c, d), +2 K (e, f), +3 K (g, h), and +4 K (i, j) climates (based on ensemble member 1). For the ensemble spread of the EUR-12 simulations, see Fig. S11.
The increase in 2 m temperature is not spatially homogeneous, with regions located outside of the heatwave's core experiencing stronger warming, thereby contributing to the increasing spatial extent of the heatwave. This is exemplified in Fig. S12, where the maximum temperature differences between the +4 K and pre-industrial climates reach 12 °C in Luxembourg, southern Belgium, western Germany, and the easternmost parts of France. The temperature increase in the core of the heatwave is close to 8 °C, which corresponds to a doubling of the global-warming level (+4 K).
Figure 7 displays the time series of daily maximum, mean, and minimum temperatures, averaged over the given latitude–longitude area (48–51° N and 6–10° E; depicted in Fig. 1b), for the extended summer season (May to September) of 2019. During July and August, an increase in spread is found between the temperature curves corresponding to the different warming levels. Conversely, the spread between the time series of temperatures is much smaller in May and early June. This finding was previously confirmed in the analyses of global storylines conducted by Sánchez-Benítez et al. (2022) and will be further explored in the following section. We also observe a larger spread in the daily maximum curves for July and August compared to the mean and minimum temperatures.
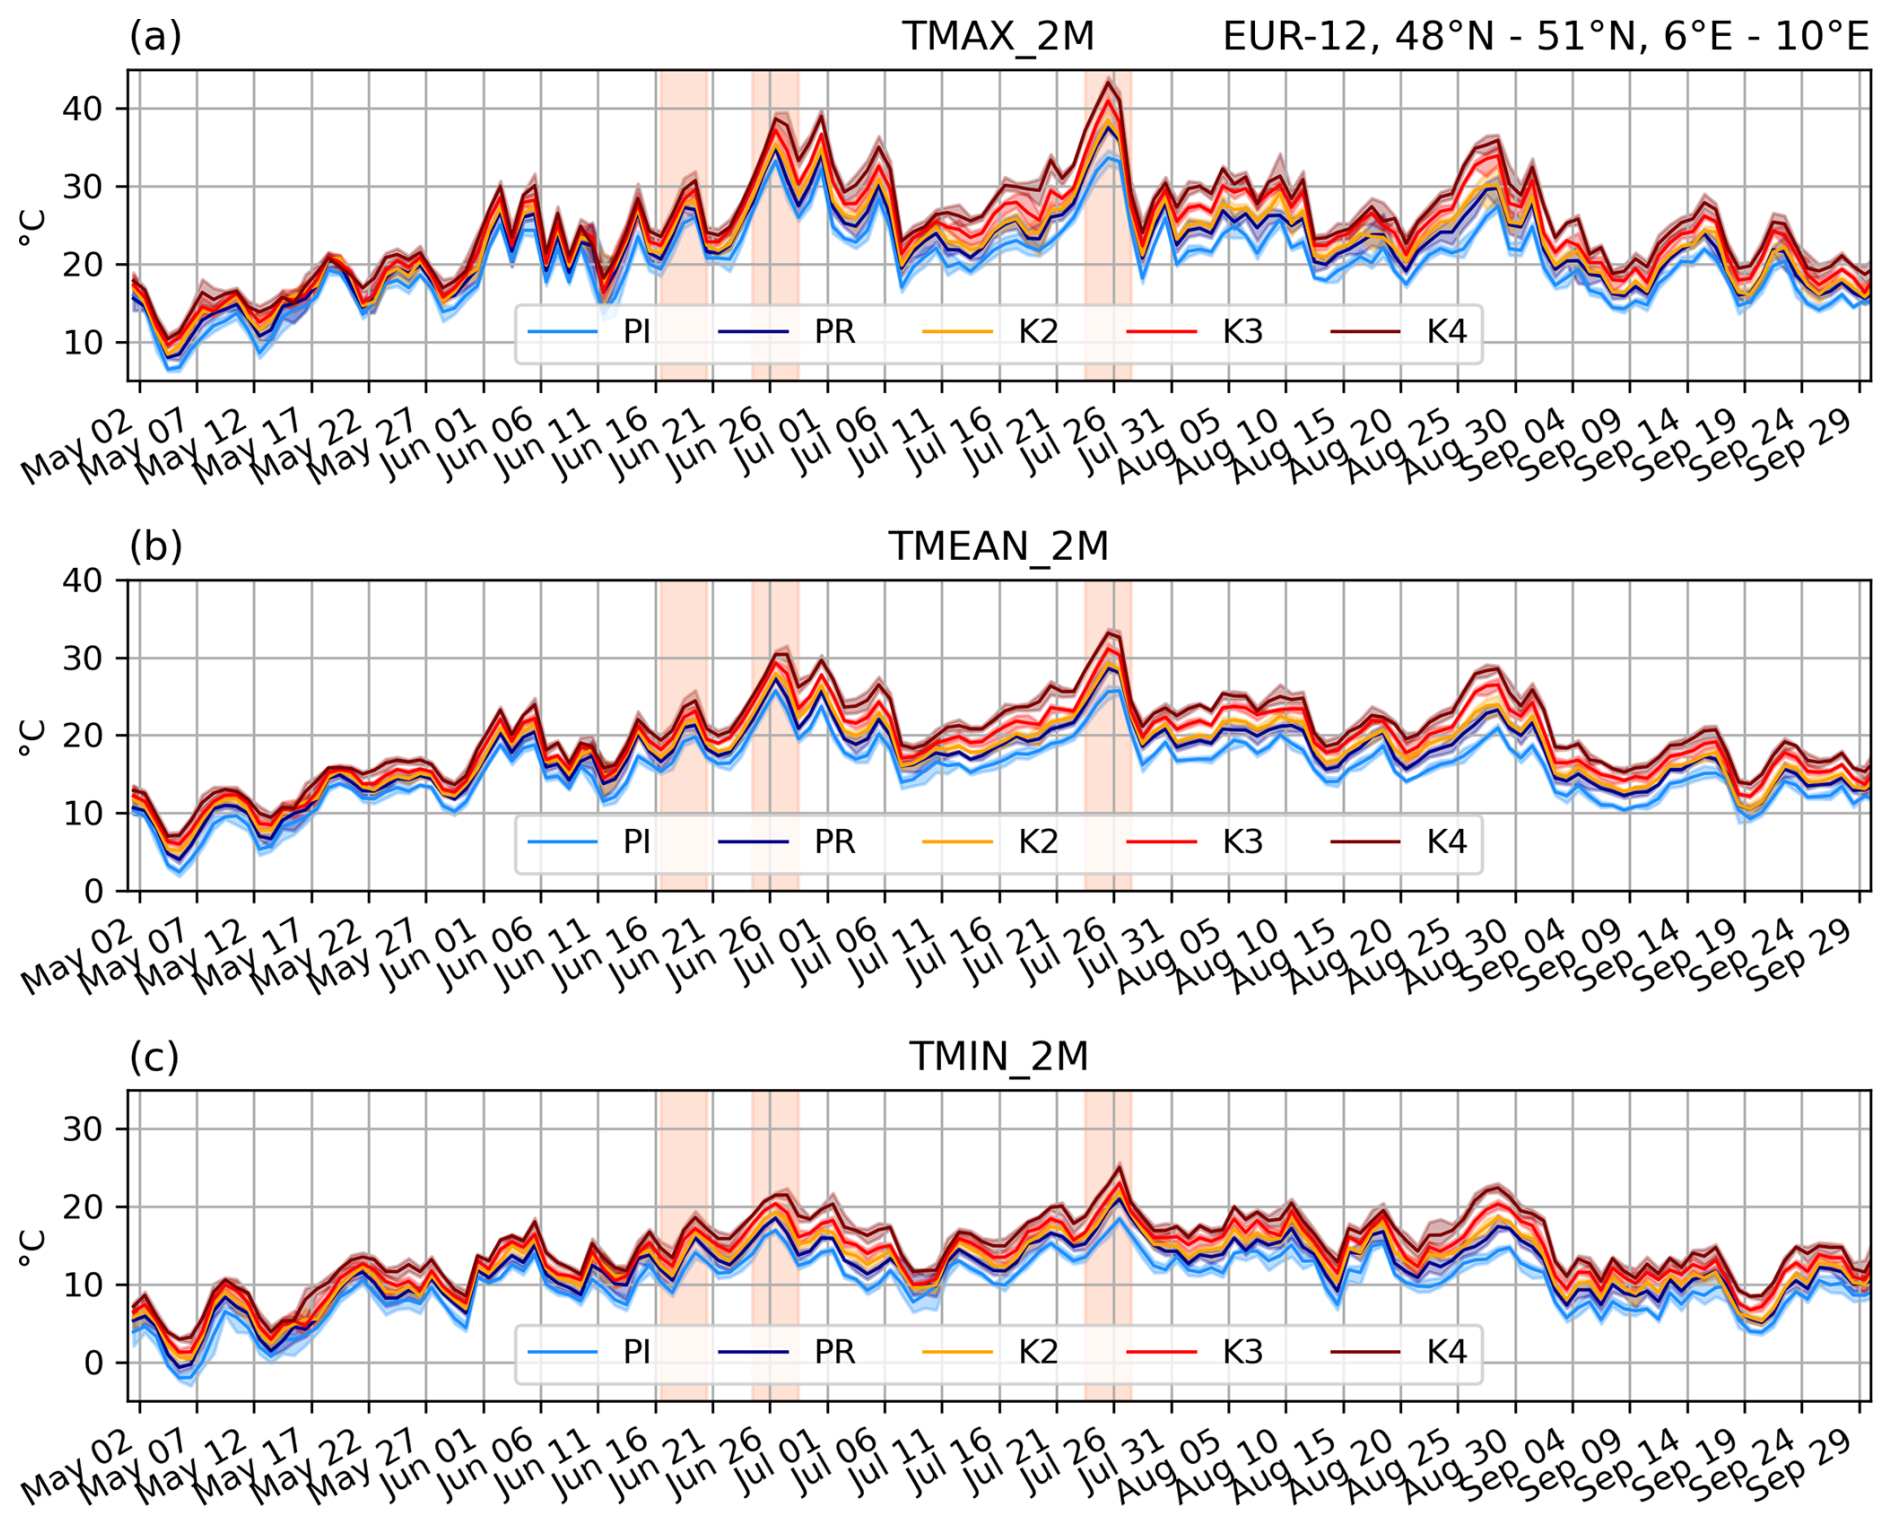
Figure 7Daily (a) maximum, (b) mean, and (c) minimum temperatures averaged over a given latitude–longitude box (48–51° N, 6–10° E; see Fig. 1b) for the May–September (MJJAS) period of 2019, based on the EUR-12 storyline simulations. Shading indicates the minimum–maximum range of values obtained from the five-member ensembles. The three highlighted periods (orange) are discussed in detail in Sect. 3.3. For the GER-3 simulations, see Fig. S13. PI: pre-industrial climate. PR: present-day climate. K2: +2 K climate. K3: +3 K climate. K4: +4 K climate.
3.3 Temperature scaling in response to global warming
In order to gain a deeper insight into the spread of temperature curves depicted in Fig. 7 and to address the question of temperature scaling in response to global warming, three 5 d periods were selected for detailed analysis (highlighted in orange in Fig. 7). The first period corresponds to mid-June, when no heatwave was observed; the second period corresponds to late June during the first heatwave; and the third period occurs around the peak of the July heatwave. The daily maximum, mean, and minimum 2 m temperatures – averaged spatially over the area 48–51° N, 6–10° E, and temporally over the aforementioned periods – show a clear linear dependence on the global-warming level (see Fig. 8a–c). Therefore, we express anthropogenic change in 2 m temperature per 1 °C of global warming as the slope of this line. This slope will be referred to in the following text as the “warming rate”.
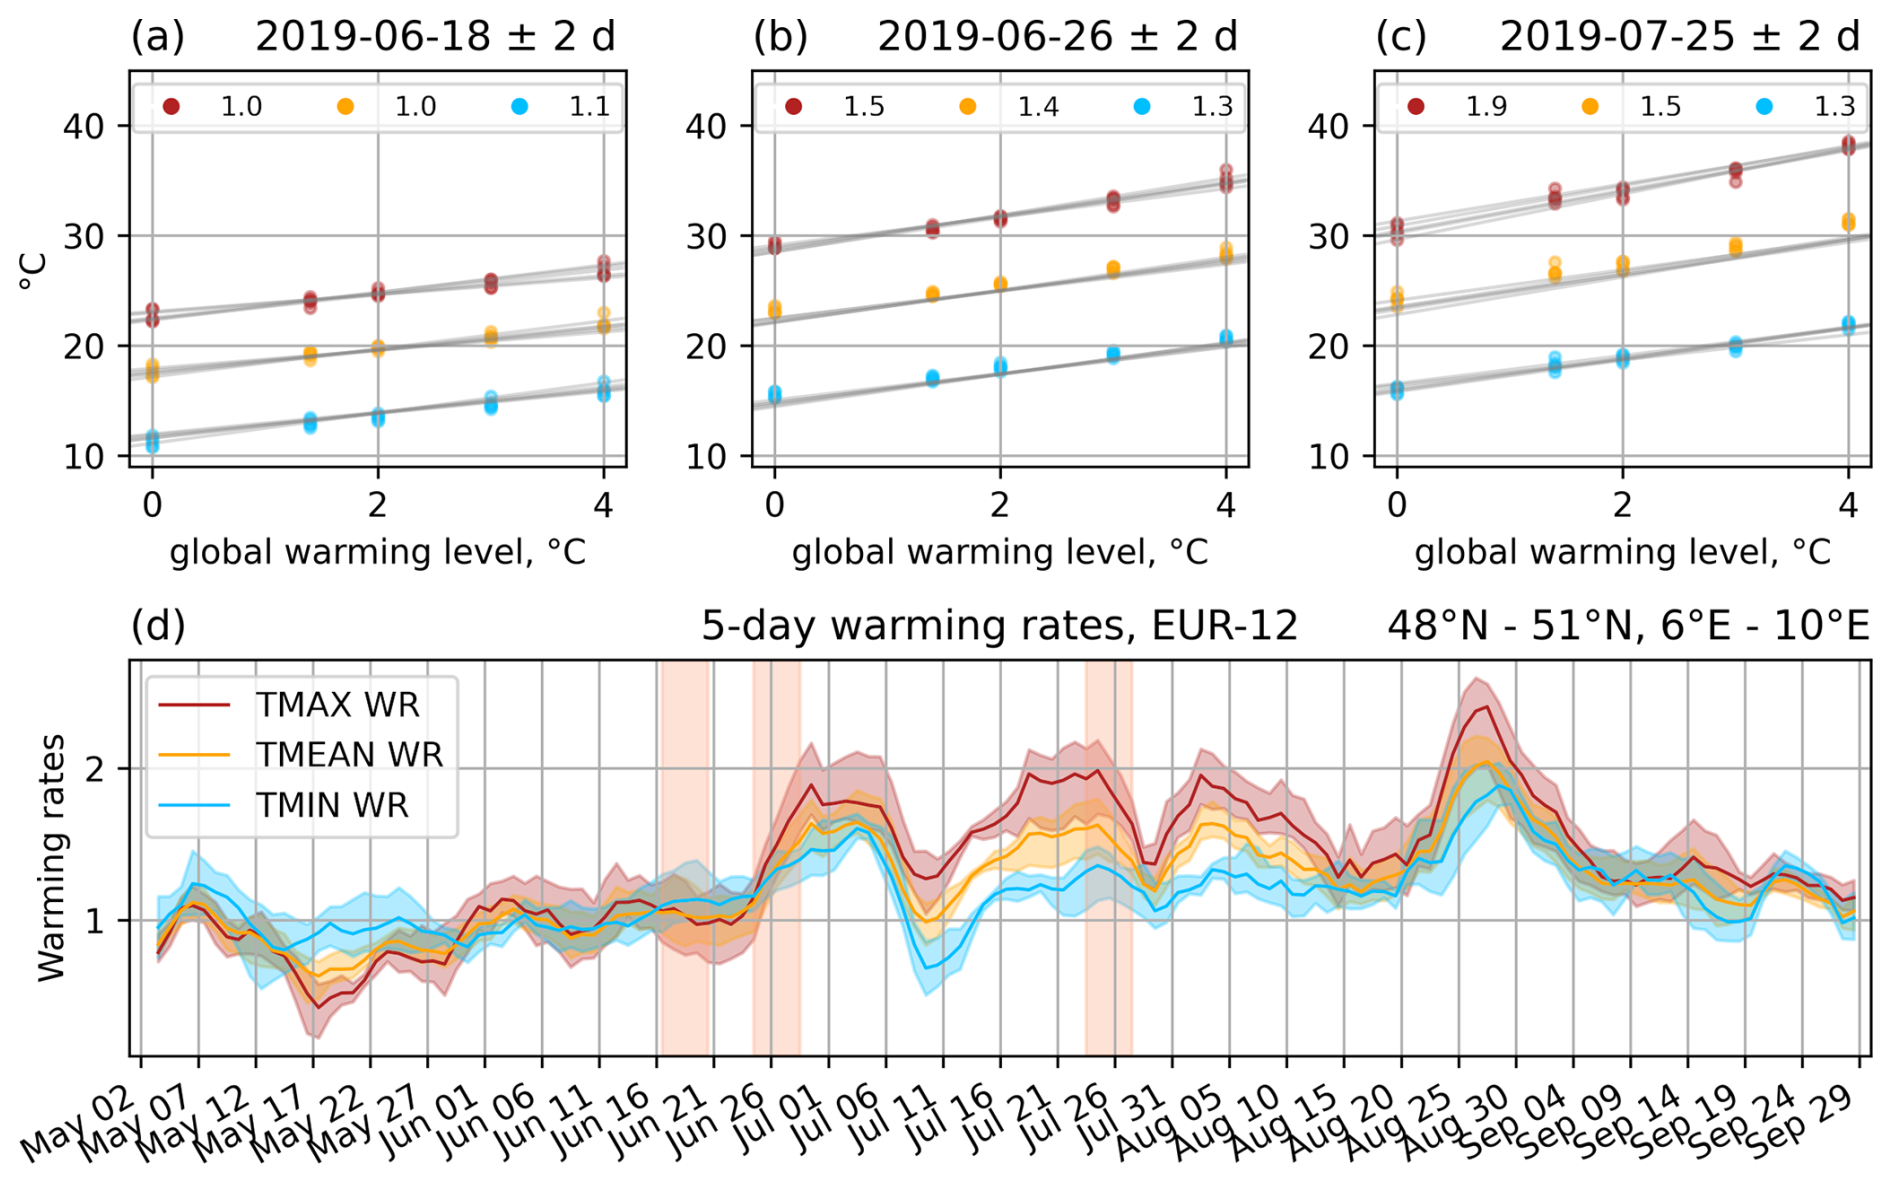
Figure 8(a–c) Daily maximum (red), mean (orange), and minimum (blue) 2 m temperatures over a given latitude–longitude box (48–51° N, 6–10° E), averaged over three 5 d periods and plotted against the global-warming level. The numbers in the legends represent the ensemble means of the slopes of the respective lines. (d) Warming rates for the rolling averages (5 d windows) of daily maximum, mean, and minimum temperatures over the same box. Shading indicates the minimum–maximum range of values obtained from the five-member ensembles. The three highlighted periods are discussed in detail in Sect. 3.3. This figure is based on the EUR-12 simulations. For the GER-3 simulations, see Fig. S14. WR: warming rate.
As shown in Fig. 8a, the average warming rate over the studied area is close to a factor of 1 in mid-June for all three curves. This indicates that the warming rate is comparable to the global-warming level in the absence of an extreme event in early summer. The warming rates increase during the first heatwave and approach or even exceed a factor of 2 for maximum temperatures during the July heatwave (Fig. 8b and c). This suggests that the expected differences in maximum temperature for a similar event in a future climate would be exacerbated and twice as high as the corresponding global-warming level.
Using this method, we computed the warming rates for 5 d running-mean maximum, mean, and minimum temperatures (see Fig. 8d) for the extended summer season of 2019. Between May and early June, the warming rates fluctuate around 1. The values increase with the onset of the first heatwave in late June, with the maximum temperature responding more strongly than the minimum temperature. Following a relative minimum in mid-July, the warming rates strongly increase before 25 July, reaching a factor of 2.2 for maximum temperatures ahead of and during the late July heatwave. After a short decrease immediately following the temperature maximum, the warming rates increase again to values over 2.0 at the beginning of August. This is followed by a gradual decrease before the last peak of the warming rates, which has an even higher magnitude and occurs in late August, showing a further temperature increase during the summer. We observe a general tendency for the warming rates to rise towards late summer, possibly associated with the gradual decrease in soil moisture. The increase in global-warming amplification in central Europe was also identified by Sánchez-Benítez et al. (2022) in both free and nudged AWI-CM1 simulations.
To comment on the broader warming-rate peak preceding the July heatwave seen in Fig. 8d, we estimate the duration of this heatwave across different climates based on the exceedance of the 90th percentile of the modelled maximum 2 m temperature, which is 30 °C when computed for all days in July over the simulated period of 2018–2022. According to our estimation, the duration of this heatwave would increase non-linearly from 4 d in the present-day climate to 5 d in the +3 K climate and 9 d in the +4 K warmer world (not shown).
While the response of the maximum temperature in May, June, and the second half of September is smaller or comparable to the response of the mean and minimum temperatures, the warming rate for the maximum temperature is very large during July and August. Thus, with global warming, the diurnal temperature range tends to increase during the mid- and late-summer periods of the dynamical year 2019. In contrast, the temperature response appears to be distributed more uniformly during the day in spring, early summer, and early autumn. We obtained similar behaviour in the other summer seasons (May–September) of the simulated period.
The warming rates are now computed for each grid point in the study area. Figure 9a displays the warming rates for the 5 d period around the peak of the heatwave in late July 2019 (the third shaded area in Fig. 7) at each grid point in both the EUR-12 and GER-3 domains. According to the goodness-of-fit maps in Fig. S15, the assumption of linear growth in the areas affected by the heatwave is valid in all cases. For comparability with the GER-3 simulations, Fig. 9 shows the warming rates obtained from ensemble member 1 for both domains. The ensemble mean of the temperature response in the EUR-12 simulations is shown in Fig. S16, which depicts similar patterns with small differences in detail.
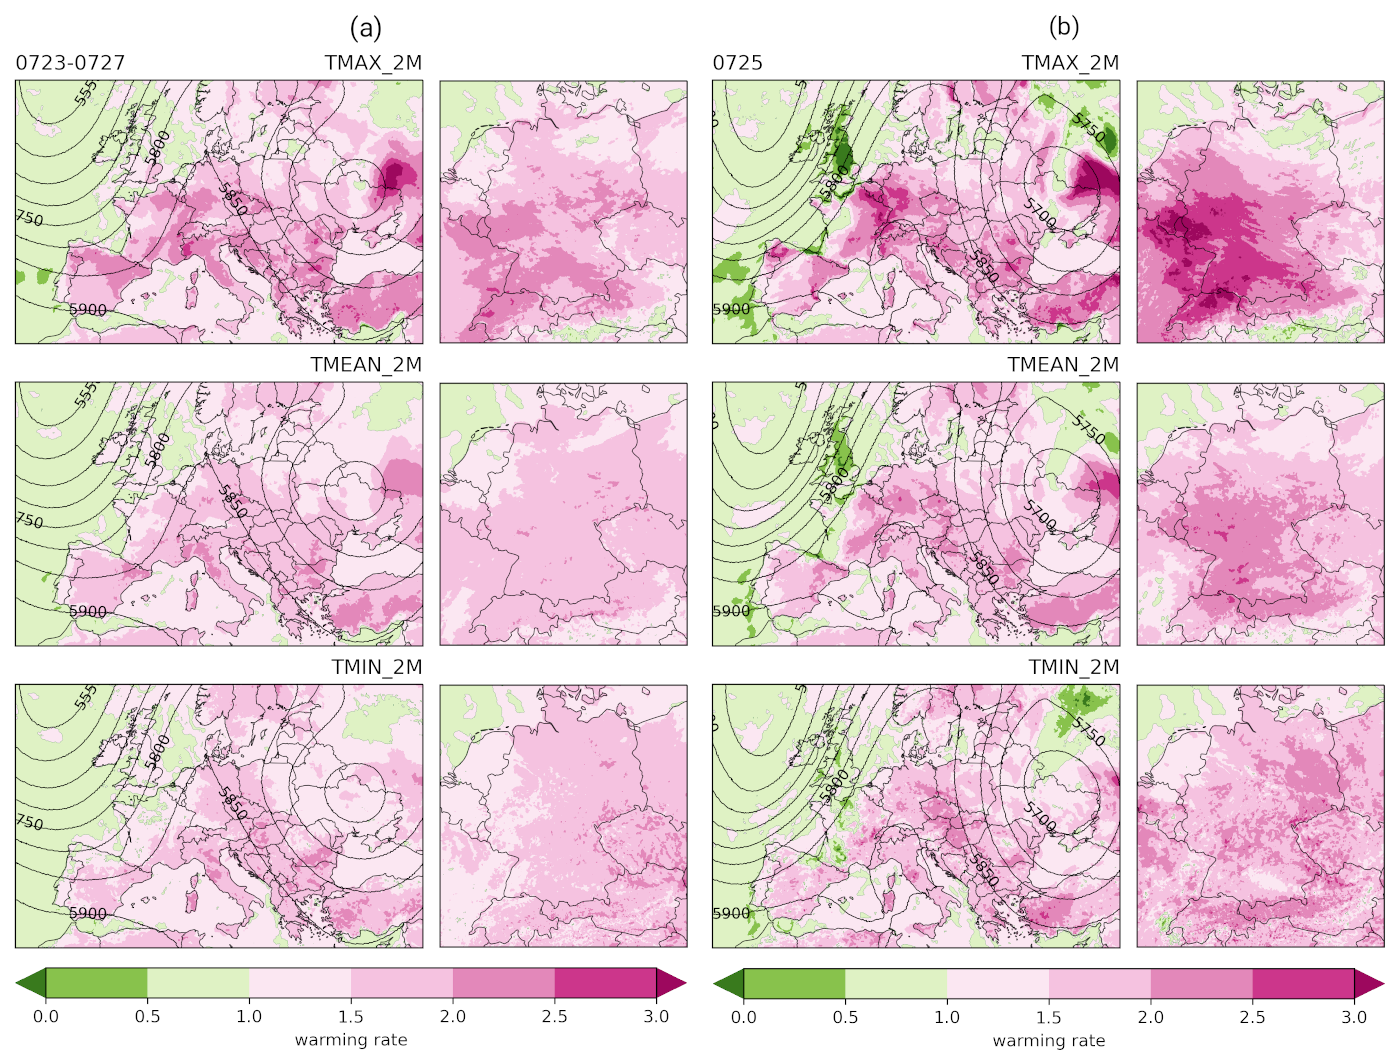
Figure 9(a) Warming rates for the period from 23 to 27 July 2019. (b) Warming rates for 25 July. The contours represent the geopotential heights from the EUR-12 simulations. This figure corresponds to ensemble member 1.
The warming rates for the daily maximum temperatures exceed a factor of 2 over large areas in central and southern Europe (see Fig. 9a). In contrast, the minimum temperatures increase at a comparatively lower rate. This also indicates the presence of an enhanced diurnal temperature range during extreme heat events, as discussed above. Consistent with the values shown in Fig. 8a, the warming rates for a “neutral” period in early summer are much lower and below a factor of 1 across central Europe (Fig. S17a).
A closer look at the response of the 2 m temperature on 25 July reveals that the warming rates during the peak of the event reached a factor of 3.0 east of the heatwave's core, underscoring the fact that these areas became up to 12 °C warmer in the +4 K climate compared to the pre-industrial conditions in our simulations (see Fig. 9b). The mean warming rates of the EUR-12 ensemble show a similar pattern: the black contour in Fig. S16, encompassing the core of the heatwave in the present-day climate, does not coincide with the 2.5 K K−1 contour of the temperature response. Accordingly, the spatial extent of the heatwave is expected to be subject to a rapid increase in future climates. As shown in Fig. S9, the area affected by maximum temperatures over 40 °C corresponding to 25 July grows with the global-warming level at an approximate rate of 270 000 ± 1300 km2 K−1, slightly accelerating towards the +4 K climate. The lack of warming over the British Isles may be associated with the fact that this area is surrounded by sea and located at the edge of the subtropical ridge triggering this event, making it less affected.
To compare the scaling of temperatures during the extreme event to the mean scaling, we estimated the average monthly response of the 2 m temperatures over Europe for five simulated summers from 2018 to 2022. According to Fig. 10, the warming rates are close to 1 in central Europe in June, increase to 1.5 in July, and approach 2.0 in August. Such an intensification of the temperature response towards late summer indicates a higher risk of heatwave development in a warmer world. This aspect was investigated in Hundhausen et al. (2023), where, based on an ensemble of regional high-resolution climate simulations, the probability of large heatwaves was found to gradually increase during the summer.
Comparing the mean scaling in Fig. 10 to the warming rates in Fig. 9b, we find that the scaling of the maximum temperature at the peak of the July 2019 heatwave is nearly twice as high in western France and eastern Germany. Nevertheless, it is worth mentioning that all the years of the simulated period fall within the span of the European multi-year drought and heat event of 2018–2022 (Knutzen et al., 2025). Thus, the average warming rates in Fig. 10 may differ from those for the years unaffected by severe drought conditions.
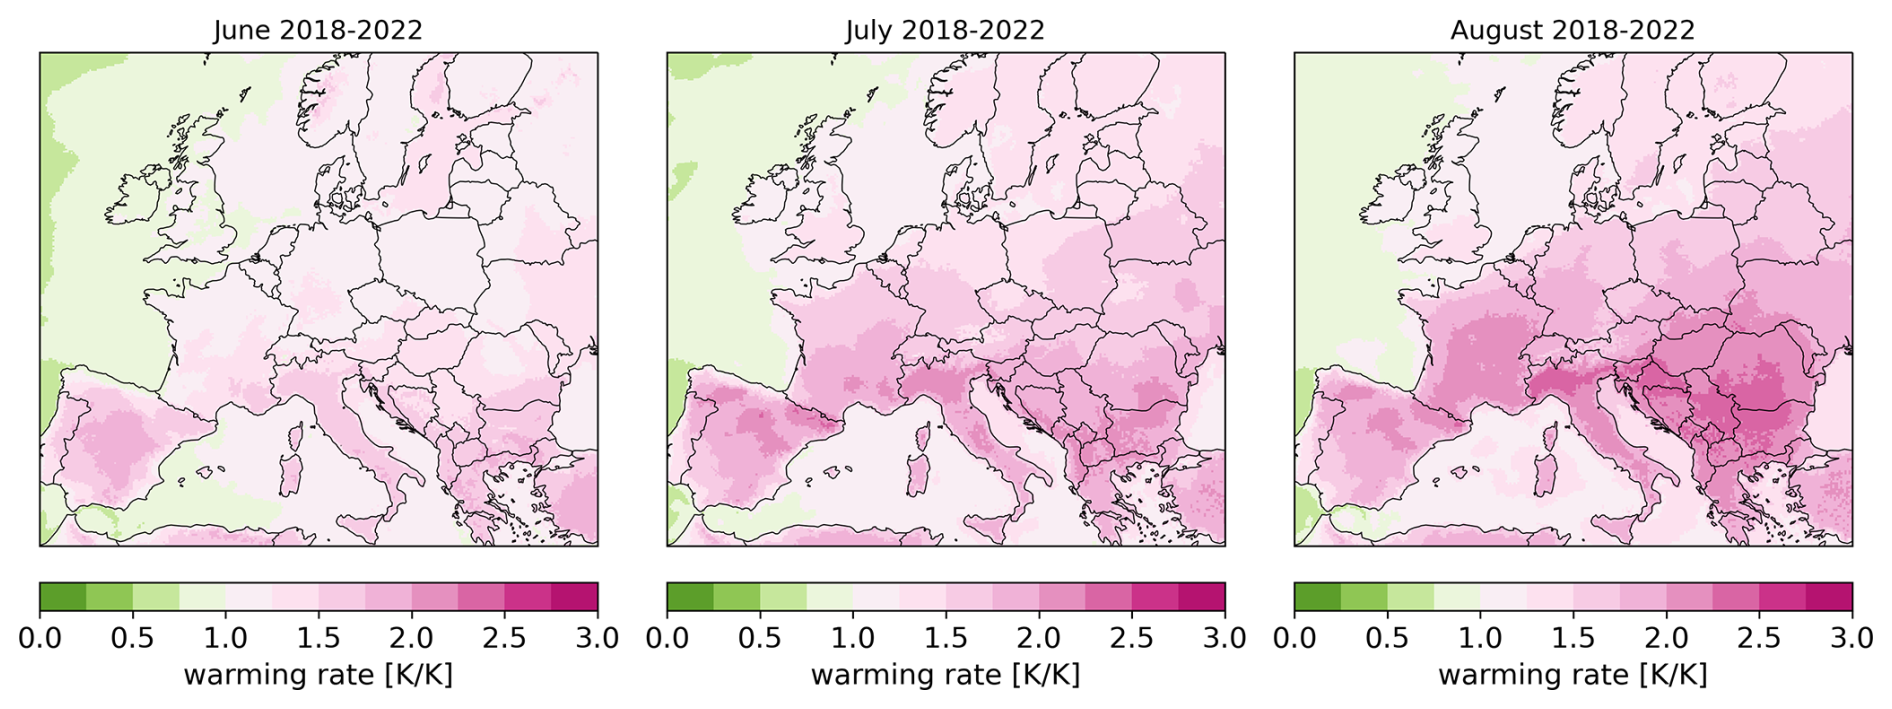
Figure 10Mean warming rates for maximum 2 m temperature with respect to June, July, and August 2018–2022, based on the EUR-12 storylines.
In this study, we follow an event-based storyline approach using a GCM–RCM–CPM model chain to analyse the thermodynamic response of the European summer heatwaves of 2019 to global warming. We obtained our storylines using global spectrally nudged AWI-CM1 simulations and subsequent dynamical downscaling with the regional model ICON-CLM to resolutions of 12 km (EUR-12) and 3 km (GER-3).
The outcomes of the simulations allow us to answer the three key research questions as follows:
-
How accurately can a regional event-based storyline simulation represent a recent event, and what improvement does it offer compared to the global spectrally nudged storyline simulation?
The daily spatial and temporal patterns of the 2 m temperature fields obtained with the AWI-CM1–ICON model chain show good agreement with ERA5, E-OBS, and DWD station observations for the summer of 2019. Compared to the driving AWI-CM1 simulations, the dynamical downscaling significantly reduced the RMSD in 2 m temperature over most of Europe (by about 1.5 °C in central Europe). The GER-3 simulation provides more spatial detail than the EUR-12 simulation for daily maximum temperatures; however, it does not necessarily improve the representation of daily minimum temperatures.
-
What was the effect of climate change on the 2019 European heatwave based on regional and convection-permitting ICON-CLM simulations?
Based on the simulations for our 2019 case study with different thresholds for global warming, the peak temperatures of the July heatwave increased significantly beyond the underlying global-warming level, with the magnitude of the temperature response depending on the location. The increments in daily maximum temperature in the +4 K climate, relative to the pre-industrial climate, vary between 8 °C (in the centre of the heatwave) and 12 °C (to the east of the heatwave), leading to an increased spatial extent of the heatwave in a warmer world. In the context of the present-day climate, where we took the 40 °C isoline as a benchmark, the affected area was encompassed by the 45 °C isoline in the +4 K world. Consequently, the areas affected by temperatures exceeding 40 °C experienced a significant expansion, exceeding 1×10⁶ km2 in the +4 K storyline. When considering the time series of 2 m temperature over an area ranging from 48–51° N, 6–10° E, for all five storylines, the spread between the curves appeared to be larger in the mid- and late-summer periods compared to early summer. This aligns with previous findings suggesting the intra-seasonal dependence of anthropogenic warming (intensification towards late summer; see e.g. Hundhausen et al., 2023), based not only on the nudged storylines but also on the free CMIP6 runs (Sánchez-Benítez et al., 2022).
-
What local-to-regional extreme temperature scaling occurs in response to global warming for an event like the 2019 heatwave?
Our findings reveal a linear dependence of the 2 m temperature response on the global-warming level, with the derived warming rate determined by the slope of the linear regression, demonstrating spatial and intra-seasonal variations. Quantifying the smaller spacing between the temperature curves mentioned above, the warming rates over the studied area in early summer fluctuate around 1, indicating that regional warming aligns with global warming during this period. However, in July and August, the warming rates for daily maximum temperatures vary between 1.5 and 2.5, reaching higher values with each successive heatwave during the study period (see Fig. 8d).
Furthermore, the broadening of the warming-rate peak during the July heatwave indicates an extension of the heatwave's duration in a warmer world. We also observe the broadening of the diurnal temperature range in future climates, which is indicated by much lower warming rates for the minimum temperature compared to those for the daily maximum. This difference does not occur in early summer and disappears by late September. Considering that the first heatwave in late June modified the soil moisture for the rest of the summer (Sousa et al., 2020; Sánchez-Benítez et al., 2022), this case exemplifies the dependence of global-warming amplification on the event-specific regional evolution of thermodynamic conditions.
On 25 July, the response of the maximum 2 m temperature (warming rate) reached a factor of 3 in some areas (Fig. 9b). However, the highest warming rates were not located over the heatwave centre but instead shifted eastwards (see Figs. S12 and S16). The areas less affected by unprecedented temperatures but still located within the influence of the event triggered by the subtropical ridge tend to experience stronger warming in a warmer world. Thus, along with the increasing duration, the area affected by the heatwave expands. While the GER-3 domain effectively captures the regions with the strongest temperature responses, it does not fully encompass the core area affected by the July heatwave. We admit that for a more comprehensive kilometre-scale investigation of this heatwave, this domain should have covered a larger fraction of France. Still, as this study is part of the InnoPool SCENIC (Storyline Scenarios of Extreme Weather, Climate, and Environmental Events along with their Impacts in a Warmer World) project (Helmholtz Changing Earth, 2024), which focuses on the impacts of climate change within Germany, our CPM simulations provide the necessary insights for this context.
Several factors may have influenced the spatially variable magnitude of the 2 m temperature response, as seen both for a single member (Fig. 9) and for all ensemble members (Fig. S16). One possible explanation for this behaviour is the heterogeneous response of the coupling between soil moisture and temperature within and outside the heatwave's core (see e.g. Gevaert et al., 2018; Miralles et al., 2014). We hypothesise that the overall amplification of the warming rates during heatwave events and the extension of the diurnal temperature range may have been exacerbated due to soil–atmosphere feedback. However, a dedicated and detailed analysis would be necessary to demonstrate or dismiss this hypothesis as other factors, such as small changes in atmospheric dynamics, may have also played an important role.
The same event was analysed by Vries et al. (2024) using a PGW approach, yielding similar temperature responses of 1.5 to 2.5 K K−1 during heatwaves. Both studies show an increased response of maximum temperatures compared to minimum temperatures. However, in contrast to our findings, Vries et al. (2024) observed no significant response dampening within the heatwave core. Nevertheless, both studies indicate that areas in France impacted by extreme temperatures on 25 July do not show higher scaling than the surrounding areas. While Vries et al. (2024) focus on the southeastern Netherlands, where higher temperatures yield stronger responses (see Fig. S10 in Vries et al., 2024), this relationship may not be directly applicable to central France for events as extreme as the July 2019 heatwave, given the region's distinct climate, and further investigation is needed to determine whether such scaling applies. The complementary results from both studies enrich our understanding of heatwave dynamics and provide a broader context for future investigations.
The aim of this study was to provide a regional perspective on global spectrally nudged storylines for the summer heatwaves of 2019 in central Europe. We addressed the unfolding of these heatwaves on regional-to-local spatial scales and followed the evolution of near-surface temperatures throughout the entire summer season in five dynamical analogues of the summer of 2019 using a dynamical downscaling approach. We observed that the late June heatwave triggered higher warming rates and an extension of the diurnal temperature range in a warmer world, continuing for the rest of the summer. Additionally, we identified higher warming rates over regions east of the centre of the July heatwave, as well as a broadening of the warming-rate peaks associated with both 2019 heatwaves. This demonstrates that our approach not only allows for the estimation of the possible impacts of extreme heat events in a warmer world but also facilitates the investigation of the mechanisms and conditions that lead to different rates of response to background warming.
Our regional storylines can be used to drive hydrology and land surface models, as well as other impact models, providing relevant information for developing adaptation measures. Finally, the insights gained from storyline-based regional impact studies are more tangible than probabilistic estimates and, thus, have the potential to raise public awareness about the significance of the effects of climate change at the community level.
The ICON model has been available as open-source code since January 2024 at https://gitlab.dkrz.de/icon/icon-model (ICON Development Team, 2024). The runtime environment SPICE v2.0 is available online at https://doi.org/10.5281/zenodo.6838984 (Rockel and Geyer, 2022). The simulations are stored on the supercomputer Levante at the German Climate Computing Center (DKRZ), Hamburg, and will be made available online upon completion of the data preparation. ERA5 data can be downloaded from the Copernicus Climate Change Service (C3S) Climate Date Store (https://doi.org/10.24381/cds.adbb2d47, Hersbach et al., 2023) and can be accessed at DKRZ by users of the Levante high-performance computing (HPC) system. The E-OBS dataset can be accessed via the website of the European Climate Assessment & Dataset project (https://surfobs.climate.copernicus.eu/dataaccess/access_eobs.php, Copernicus Climate Change Service, 2023). The DWD station data are freely available for research via the Open Data portal of the German Weather Service (DWD) (https://opendata.dwd.de; DWD, 2023).
The supplement related to this article is available online at: https://doi.org/10.5194/esd-16-239-2025-supplement.
TK, PL, and JGP conceived and designed the study. ASB computed the global AWI-CM1 simulations and provided the data and necessary instructions. PL took care of the pre-processing of the input data for ICON. TK performed the ICON simulations with the help of PL, performed the data analysis, and prepared the figures. HFG and PB contributed additional modelling expertise. TK wrote the initial draft of the paper. All authors discussed the results and contributed to paper revisions.
The contact author has declared that none of the authors has any competing interests.
Publisher's note: Copernicus Publications remains neutral with regard to jurisdictional claims made in the text, published maps, institutional affiliations, or any other geographical representation in this paper. While Copernicus Publications makes every effort to include appropriate place names, the final responsibility lies with the authors.
The authors thank the German Climate Computing Center (DKRZ), Hamburg, for providing computing and storage resources under project nos. 105 and 1264. The global AWI-CM1 simulations were performed using ESM-Tools (Barbi et al., 2021). The authors also thank Klaus Keuler for providing the ICON-CLM settings and domain grids used within the NUKLEUS project and Florian Ehmele for establishing the workflow for the dynamical downscaling and producing a set of preliminary simulations.
This research has been supported by funding from the Helmholtz research field “Earth & Environment” for the Innovation Pool project SCENIC. Joaquim G. Pinto received support from the AXA Research Fund.
The article processing charges for this open-access publication were covered by the Karlsruhe Institute of Technology (KIT).
This paper was edited by Gabriele Messori and reviewed by two anonymous referees.
Aalbers, E. E., van Meijgaard, E., Lenderink, G., de Vries, H., and van den Hurk, B. J. J. M.: The 2018 west-central European drought projected in a warmer climate: how much drier can it get?, Nat. Hazards Earth Syst. Sci., 23, 1921–1946, https://doi.org/10.5194/nhess-23-1921-2023, 2023. a, b
Athanase, M., Sánchez-Benítez, A., Goessling, H. F., Pithan, F., and Jung, T.: Projected amplification of summer marine heatwaves in a warming Northeast Pacific Ocean, Commun. Earth Environ., 5, 1–12, https://doi.org/10.1038/s43247-024-01212-1, 2024. a, b
Barbi, D., Wieters, N., Gierz, P., Andrés-Martínez, M., Ural, D., Chegini, F., Khosravi, S., and Cristini, L.: ESM-Tools version 5.0: a modular infrastructure for stand-alone and coupled Earth system modelling (ESM), Geosci. Model Dev., 14, 4051–4067, https://doi.org/10.5194/gmd-14-4051-2021, 2021. a, b
Barriopedro, D., Fischer, E. M., Luterbacher, J., Trigo, R. M., and García-Herrera, R.: The Hot Summer of 2010: Redrawing the Temperature Record Map of Europe, Science, 332, 220–224, https://doi.org/10.1126/science.1201224, 2011. a, b
Barriopedro, D., García-Herrera, R., Ordóñez, C., Miralles, D. G., and Salcedo-Sanz, S.: Heat Waves: Physical Understanding and Scientific Challenges, Rev. Geophys., 61, e2022RG000780, https://doi.org/10.1029/2022RG000780, 2023. a, b
Becker, F. N., Fink, A. H., Bissolli, P., and Pinto, J. G.: Towards a more comprehensive assessment of the intensity of historical European heat waves (1979–2019), Atmos. Sci. Lett., 23, e1120, https://doi.org/10.1002/asl.1120, 2022. a
Brogli, R., Heim, C., Mensch, J., Sørland, S. L., and Schär, C.: The pseudo-global-warming (PGW) approach: methodology, software package PGW4ERA5 v1.1, validation, and sensitivity analyses, Geosci. Model Dev., 16, 907–926, https://doi.org/10.5194/gmd-16-907-2023, 2023. a
Calvin, K., Dasgupta, D., Krinner, G., Mukherji, A., Thorne, P. W., Trisos, C., Romero, J., Aldunce, P., Barrett, K., Blanco, G., Cheung, W. W., Connors, S., Denton, F., Diongue-Niang, A., Dodman, D., Garschagen, M., Geden, O., Hayward, B., Jones, C., Jotzo, F., Krug, T., Lasco, R., Lee, Y.-Y., Masson-Delmotte, V., Meinshausen, M., Mintenbeck, K., Mokssit, A., Otto, F. E., Pathak, M., Pirani, A., Poloczanska, E., Pörtner, H.-O., Revi, A., Roberts, D. C., Roy, J., Ruane, A. C., Skea, J., Shukla, P. R., Slade, R., Slangen, A., Sokona, Y., Sörensson, A. A., Tignor, M., Van Vuuren, D., Wei, Y.-M., Winkler, H., Zhai, P., Zommers, Z., Hourcade, J.-C., Johnson, F. X., Pachauri, S., Simpson, N. P., Singh, C., Thomas, A., Totin, E., Arias, P., Bustamante, M., Elgizouli, I., Flato, G., Howden, M., Méndez-Vallejo, C., Pereira, J. J., Pichs-Madruga, R., Rose, S. K., Saheb, Y., Sánchez Rodríguez, R., Ürge Vorsatz, D., Xiao, C., Yassaa, N., Alegría, A., Armour, K., Bednar-Friedl, B., Blok, K., Cissé, G., Dentener, F., Eriksen, S., Fischer, E., Garner, G., Guivarch, C., Haasnoot, M., Hansen, G., Hauser, M., Hawkins, E., Hermans, T., Kopp, R., Leprince-Ringuet, N., Lewis, J., Ley, D., Ludden, C., Niamir, L., Nicholls, Z., Some, S., Szopa, S., Trewin, B., Van Der Wijst, K.-I., Winter, G., Witting, M., Birt, A., Ha, M., Romero, J., Kim, J., Haites, E. F., Jung, Y., Stavins, R., Birt, A., Ha, M., Orendain, D. J. A., Ignon, L., Park, S., Park, Y., Reisinger, A., Cammaramo, D., Fischlin, A., Fuglestvedt, J. S., Hansen, G., Ludden, C., Masson-Delmotte, V., Matthews, J. R., Mintenbeck, K., Pirani, A., Poloczanska, E., Leprince-Ringuet, N., and Péan, C.: IPCC, 2023: Climate Change 2023: Synthesis Report, Contribution of Working Groups I, II and III to the Sixth Assessment Report of the Intergovernmental Panel on Climate Change, edited by: [Core Writing Team, Lee, H., and Romero, J., IPCC, Geneva, Switzerland, Tech. rep., Intergovernmental Panel on Climate Change (IPCC), https://doi.org/10.59327/IPCC/AR6-9789291691647, 2023. a
Caviedes-Voullième, D. and Shepherd, T. G.: Climate storylines as a way of bridging the gap between information and decision-making in hydrological risk, PLOS Climate, 2, e0000270, https://doi.org/10.1371/journal.pclm.0000270, 2023. a
Chen, X., Liang, X., Xia, J., and She, D.: Impact of Lower Boundary Condition of Richards’ Equation on Water, Energy, and Soil Carbon Based on Coupling Land Surface and Biogeochemical Models, Pedosphere, 28, 497–510, https://doi.org/10.1016/S1002-0160(17)60371-0, 2018. a
Copernicus Climate Change Service: E-OBS: Daily gridded observational dataset (Version 28.0e), Copernicus Climate Data Store [data set], https://surfobs.climate.copernicus.eu/dataaccess/access_eobs.php (last access: 27 January 2025), 2023. a, b
Cornes, R. C., van der Schrier, G., van den Besselaar, E. J. M., and Jones, P. D.: An Ensemble Version of the E-OBS Temperature and Precipitation Data Sets, J. Geophys. Res.-Atmos., 123, 9391–9409, https://doi.org/10.1029/2017JD028200, 2018. a
Deser, C., Phillips, A. S., Alexander, M. A., and Smoliak, B. V.: Projecting North American Climate over the Next 50 Years: Uncertainty due to Internal Variability, J. Climate, 27, 2271–2296, https://doi.org/10.1175/JCLI-D-13-00451.1, 2014. a, b, c
DWD: Historical Daily Station Observations (Temperature, Pressure, Precipitation, Sunshine Duration, etc.) for Germany, Version v23.3, https://opendata.dwd.de/climate_environment/CDC/observations_germany/climate/daily/kl/historical/ (last access: 15 March 2024), 2023. a, b, c
Eyring, V., Bony, S., Meehl, G. A., Senior, C. A., Stevens, B., Stouffer, R. J., and Taylor, K. E.: Overview of the Coupled Model Intercomparison Project Phase 6 (CMIP6) experimental design and organization, Geosci. Model Dev., 9, 1937–1958, https://doi.org/10.5194/gmd-9-1937-2016, 2016. a
Feser, F., Rockel, B., Storch, H. v., Winterfeldt, J., and Zahn, M.: Regional Climate Models Add Value to Global Model Data: A Review and Selected Examples, B. Am. Meteor. Soc., 92, 1181–1192, https://doi.org/10.1175/2011BAMS3061.1, 2011. a
Fink, A. H., Brücher, T., Krüger, A., Leckebusch, G. C., Pinto, J. G., and Ulbrich, U.: The 2003 European summer heatwaves and drought-synoptic diagnosis and impacts, Weather, 59, 209–216, https://doi.org/10.1256/wea.73.04, 2004. a
García-Herrera, R., Díaz, J., Trigo, R. M., Luterbacher, J., and Fischer, E. M.: A Review of the European Summer Heat Wave of 2003, Critical Rev. Environ. Sci. Technol., 40, 267–306, https://doi.org/10.1080/10643380802238137, 2010. a
Gevaert, A. I., Miralles, D. G., de Jeu, R. a. M., Schellekens, J., and Dolman, A. J.: Soil Moisture-Temperature Coupling in a Set of Land Surface Models, J. Geophys. Res.-Atmos., 123, 1481–1498, https://doi.org/10.1002/2017JD027346, 2018. a
Giorgi, F.: Thirty Years of Regional Climate Modeling: Where Are We and Where Are We Going next?, J. Geophys. Res.-Atmos., 124, 5696–5723, https://doi.org/10.1029/2018JD030094, 2019. a, b, c
Giorgi, F. and Gutowski Jr., W. J.: Regional Dynamical Downscaling and the CORDEX Initiative, Annu. Rev. Environ. Resour., 40, 467–490, https://doi.org/10.1146/annurev-environ-102014-021217, 2015. a, b
Helmholtz Changing Earth: InnoPool Projects – SCENIC Project, https://earthenvironment.helmholtz.de/changing-earth/de/innopool-projects/ (accessed: 7 November 2024), 2024. a
Hersbach, H., Bell, B., Berrisford, P., Hirahara, S., Horányi, A., Muñoz-Sabater, J., Nicolas, J., Peubey, C., Radu, R., Schepers, D., Simmons, A., Soci, C., Abdalla, S., Abellan, X., Balsamo, G., Bechtold, P., Biavati, G., Bidlot, J., Bonavita, M., De Chiara, G., Dahlgren, P., Dee, D., Diamantakis, M., Dragani, R., Flemming, J., Forbes, R., Fuentes, M., Geer, A., Haimberger, L., Healy, S., Hogan, R. J., Hólm, E., Janisková, M., Keeley, S., Laloyaux, P., Lopez, P., Lupu, C., Radnoti, G., de Rosnay, P., Rozum, I., Vamborg, F., Villaume, S., and Thépaut, J.-N.: The ERA5 global reanalysis, Q. J. Roy. Meteor. Soc., 146, 1999–2049, https://doi.org/10.1002/qj.3803, 2020. a, b, c
Hersbach, H., Bell, B., Berrisford, P., Biavati, G., Horányi, A., Muñoz Sabater, J., Nicolas, J., Peubey, C., Radu, R., Rozum, I., Schepers, D., Simmons, A., Soci, C., Dee, D., and Thépaut, J.-N.: ERA5 hourly data on single levels from 1940 to present, Copernicus Climate Change Service (C3S) Climate Data Store (CDS) [data set], https://doi.org/10.24381/cds.adbb2d47, 2023. a, b
Hundhausen, M., Feldmann, H., Laube, N., and Pinto, J. G.: Future heat extremes and impacts in a convection-permitting climate ensemble over Germany, Nat. Hazards Earth Syst. Sci., 23, 2873–2893, https://doi.org/10.5194/nhess-23-2873-2023, 2023. a, b, c
ICON Development Team: ICON model, DKRZ GitLab [code], https://gitlab.dkrz.de/icon/icon-model (last access: 27 January 2025), 2024. a
Jacob, D., Petersen, J., Eggert, B., Alias, A., Christensen, O. B., Bouwer, L. M., Braun, A., Colette, A., Déqué, M., Georgievski, G., Georgopoulou, E., Gobiet, A., Menut, L., Nikulin, G., Haensler, A., Hempelmann, N., Jones, C., Keuler, K., Kovats, S., Kröner, N., Kotlarski, S., Kriegsmann, A., Martin, E., van Meijgaard, E., Moseley, C., Pfeifer, S., Preuschmann, S., Radermacher, C., Radtke, K., Rechid, D., Rounsevell, M., Samuelsson, P., Somot, S., Soussana, J.-F., Teichmann, C., Valentini, R., Vautard, R., Weber, B., and Yiou, P.: EURO-CORDEX: new high-resolution climate change projections for European impact research, Reg. Environ. Change, 14, 563–578, https://doi.org/10.1007/s10113-013-0499-2, 2014. a, b
Kaspar, F., Müller-Westermeier, G., Penda, E., Mächel, H., Zimmermann, K., Kaiser-Weiss, A., and Deutschländer, T.: Monitoring of climate change in Germany – data, products and services of Germany's National Climate Data Centre, Adv. Sci. Res., 10, 99–106, https://doi.org/10.5194/asr-10-99-2013, 2013. a
Knutzen, F., Averbeck, P., Barrasso, C., Bouwer, L. M., Gardiner, B., Grünzweig, J. M., Hänel, S., Haustein, K., Johannessen, M. R., Kollet, S., Müller, M. M., Pietikäinen, J.-P., Pietras-Couffignal, K., Pinto, J. G., Rechid, D., Rousi, E., Russo, A., Suarez-Gutierrez, L., Veit, S., Wendler, J., Xoplaki, E., and Gliksman, D.: Impacts on and damage to European forests from the 2018–2022 heat and drought events, Nat. Hazards Earth Syst. Sci., 25, 77–117, https://doi.org/10.5194/nhess-25-77-2025, 2025. a, b
Ludwig, P., Ehmele, F., Franca, M. J., Mohr, S., Caldas-Alvarez, A., Daniell, J. E., Ehret, U., Feldmann, H., Hundhausen, M., Knippertz, P., Küpfer, K., Kunz, M., Mühr, B., Pinto, J. G., Quinting, J., Schäfer, A. M., Seidel, F., and Wisotzky, C.: A multi-disciplinary analysis of the exceptional flood event of July 2021 in central Europe – Part 2: Historical context and relation to climate change, Nat. Hazards Earth Syst. Sci., 23, 1287–1311, https://doi.org/10.5194/nhess-23-1287-2023, 2023. a
Miralles, D. G., Teuling, A. J., van Heerwaarden, C. C., and Vilà-Guerau de Arellano, J.: Mega-heatwave temperatures due to combined soil desiccation and atmospheric heat accumulation, Nat. Geosci., 7, 345–349, https://doi.org/10.1038/ngeo2141, 2014. a, b
Mitchell, T. D. and Jones, P. D.: An improved method of constructing a database of monthly climate observations and associated high-resolution grids, Int. J. Climatol., 25, 693–712, https://doi.org/10.1002/joc.1181, 2005. a
Perkins-Kirkpatrick, S. E. and Lewis, S. C.: Increasing trends in regional heatwaves, Nat. Commun., 11, 3357, https://doi.org/10.1038/s41467-020-16970-7, 2020. a
Pham, T. V., Steger, C., Rockel, B., Keuler, K., Kirchner, I., Mertens, M., Rieger, D., Zängl, G., and Früh, B.: ICON in Climate Limited-area Mode (ICON release version 2.6.1): a new regional climate model, Geosci. Model Dev., 14, 985–1005, https://doi.org/10.5194/gmd-14-985-2021, 2021. a, b, c
Pithan, F., Athanase, M., Dahlke, S., Sánchez-Benítez, A., Shupe, M. D., Sledd, A., Streffing, J., Svensson, G., and Jung, T.: Nudging allows direct evaluation of coupled climate models with in situ observations: a case study from the MOSAiC expedition, Geosci. Model Dev., 16, 1857–1873, https://doi.org/10.5194/gmd-16-1857-2023, 2023. a
Prein, A. F., Langhans, W., Fosser, G., Ferrone, A., Ban, N., Goergen, K., Keller, M., Tölle, M., Gutjahr, O., Feser, F., Brisson, E., Kollet, S., Schmidli, J., van Lipzig, N. P. M., and Leung, R.: A review on regional convection-permitting climate modeling: Demonstrations, prospects, and challenges, Rev. Geophys., 53, 323–361, https://doi.org/10.1002/2014RG000475, 2015. a, b
Prill, F., Reinert, D., Rieger, D., and Zängl, G.: ICON Tutorial 2023: Working with the ICON Model, DWD, https://doi.org/10.5676/DWD_PUB/NWV/ICON_TUTORIAL2023, 2023. a, b, c, d, e, f, g
Robine, J.-M., Cheung, S. L. K., Le Roy, S., Van Oyen, H., Griffiths, C., Michel, J.-P., and Herrmann, F. R.: Death toll exceeded 70,000 in Europe during the summer of 2003, C. R. Biol., 331, 171–178, https://doi.org/10.1016/j.crvi.2007.12.001, 2008. a
Rockel, B. and Geyer, B.: SPICE (Starter Package for ICON-CLM Experiments), Zenodo [code], https://doi.org/10.5281/zenodo.6838984, 2022. a, b
Rubin, D. B.: Matching to Remove Bias in Observational Studies, Biometrics, 29, 159–183, https://doi.org/10.2307/2529684, 1973. a
Schulz, J.-P., Vogel, G., Becker, C., Kothe, S., Rummel, U., and Ahrens, B.: Evaluation of the ground heat flux simulated by a multi-layer land surface scheme using high-quality observations at grass land and bare soil, Meteorol. Z., 25, 607–620, https://doi.org/10.1127/metz/2016/0537, 2016. a
Schär, C., Frei, C., Lüthi, D., and Davies, H. C.: Surrogate climate-change scenarios for regional climate models, Geophys. Res. Lett., 23, 669–672, https://doi.org/10.1029/96GL00265, 1996. a
Sein, D. V., Koldunov, N. V., Danilov, S., Wang, Q., Sidorenko, D., Fast, I., Rackow, T., Cabos, W., and Jung, T.: Ocean Modeling on a Mesh With Resolution Following the Local Rossby Radius, J. Adv. Model. Earth Sy., 9, 2601–2614, https://doi.org/10.1002/2017MS001099, 2017. a
Semmler, T., Danilov, S., Rackow, T., Sidorenko, D., Barbi, D., Hegewald, J., Pradhan, H. K., Sein, D., Wang, Q., and Jung, T.: AWI AWI-CM1.1MR model output prepared for CMIP6 ScenarioMIP ssp370, Earth System Grid Federation, https://doi.org/10.22033/ESGF/CMIP6.2803, 2019. a
Semmler, T., Danilov, S., Gierz, P., Goessling, H. F., Hegewald, J., Hinrichs, C., Koldunov, N., Khosravi, N., Mu, L., Rackow, T., Sein, D. V., Sidorenko, D., Wang, Q., and Jung, T.: Simulations for CMIP6 With the AWI Climate Model AWI-CM-1-1, J. Adv. Model. Earth Sy., 12, e2019MS002009, https://doi.org/10.1029/2019MS002009, 2020. a, b, c, d
Shepherd, T. G.: Atmospheric circulation as a source of uncertainty in climate change projections, Nat. Geosci., 7, 703–708, https://doi.org/10.1038/ngeo2253, 2014. a, b, c, d
Shepherd, T. G.: Bringing physical reasoning into statistical practice in climate-change science, Clim. Change, 169, 2, https://doi.org/10.1007/s10584-021-03226-6, 2021. a, b
Shepherd, T. G., Boyd, E., Calel, R. A., Chapman, S. C., Dessai, S., Dima-West, I. M., Fowler, H. J., James, R., Maraun, D., Martius, O., Senior, C. A., Sobel, A. H., Stainforth, D. A., Tett, S. F. B., Trenberth, K. E., van den Hurk, B. J. J. M., Watkins, N. W., Wilby, R. L., and Zenghelis, D. A.: Storylines: an alternative approach to representing uncertainty in physical aspects of climate change, Clim. Change, 151, 555–571, https://doi.org/10.1007/s10584-018-2317-9, 2018. a, b
Sidorenko, D., Rackow, T., Jung, T., Semmler, T., Barbi, D., Danilov, S., Dethloff, K., Dorn, W., Fieg, K., Goessling, H. F., Handorf, D., Harig, S., Hiller, W., Juricke, S., Losch, M., Schröter, J., Sein, D. V., and Wang, Q.: Towards multi-resolution global climate modeling with ECHAM6-FESOM. Part I: model formulation and mean climate, Clim. Dynam., 44, 757–780, https://doi.org/10.1007/s00382-014-2290-6, 2015. a
Sousa, P. M., Barriopedro, D., García-Herrera, R., Ordóñez, C., Soares, P. M. M., and Trigo, R. M.: Distinct influences of large-scale circulation and regional feedbacks in two exceptional 2019 European heatwaves, Commun. Earth Environ., 1, 1–13, https://doi.org/10.1038/s43247-020-00048-9, 2020. a, b, c
Spensberger, C., Madonna, E., Boettcher, M., Grams, C. M., Papritz, L., Quinting, J. F., Röthlisberger, M., Sprenger, M., and Zschenderlein, P.: Dynamics of concurrent and sequential Central European and Scandinavian heatwaves, Q. J. Roy. Meteor. Soc., 146, 2998–3013, https://doi.org/10.1002/qj.3822, 2020. a
Stevens, B., Giorgetta, M., Esch, M., Mauritsen, T., Crueger, T., Rast, S., Salzmann, M., Schmidt, H., Bader, J., Block, K., Brokopf, R., Fast, I., Kinne, S., Kornblueh, L., Lohmann, U., Pincus, R., Reichler, T., and Roeckner, E.: Atmospheric component of the MPI-M Earth System Model: ECHAM6, J. Adv. Model. Earth Sy., 5, 146–172, https://doi.org/10.1002/jame.20015, 2013. a
Sánchez-Benítez, A., García-Herrera, R., Barriopedro, D., Sousa, P. M., and Trigo, R. M.: June 2017: The Earliest European Summer Mega-heatwave of Reanalysis Period, Geophys. Res. Lett., 45, 1955–1962, https://doi.org/10.1002/2018GL077253, 2018. a
Sánchez-Benítez, A., Goessling, H., Pithan, F., Semmler, T., and Jung, T.: The July 2019 European Heat Wave in a Warmer Climate: Storyline Scenarios with a Coupled Model Using Spectral Nudging, J. Climate, 35, 2373–2390, https://doi.org/10.1175/JCLI-D-21-0573.1, 2022. a, b, c, d, e, f, g, h, i, j, k
van Garderen, L., Feser, F., and Shepherd, T. G.: A methodology for attributing the role of climate change in extreme events: a global spectrally nudged storyline, Nat. Hazards Earth Syst. Sci., 21, 171–186, https://doi.org/10.5194/nhess-21-171-2021, 2021. a, b
Vautard, R., Kadygrov, N., Iles, C., Boberg, F., Buonomo, E., Bülow, K., Coppola, E., Corre, L., van Meijgaard, E., Nogherotto, R., Sandstad, M., Schwingshackl, C., Somot, S., Aalbers, E., Christensen, O. B., Ciarlo, J. M., Demory, M.-E., Giorgi, F., Jacob, D., Jones, R. G., Keuler, K., Kjellström, E., Lenderink, G., Levavasseur, G., Nikulin, G., Sillmann, J., Solidoro, C., Sørland, S. L., Steger, C., Teichmann, C., Warrach-Sagi, K., and Wulfmeyer, V.: Evaluation of the Large EURO-CORDEX Regional Climate Model Ensemble, J. Geophys. Res.-Atmos., 126, e2019JD032344, https://doi.org/10.1029/2019JD032344, 2021. a, b
Vries, H. D., Lenderink, G., Meijgaard, E. V., Ulft, B. V., and Rooy, W. D.: Western Europe's extreme July 2019 heatwave in a warmer world, Environmental Research: Climate, 3, 035005, https://doi.org/10.1088/2752-5295/ad519f, 2024. a, b, c, d, e, f
Wang, Q., Danilov, S., Sidorenko, D., Timmermann, R., Wekerle, C., Wang, X., Jung, T., and Schröter, J.: The Finite Element Sea Ice-Ocean Model (FESOM) v.1.4: formulation of an ocean general circulation model, Geosci. Model Dev., 7, 663–693, https://doi.org/10.5194/gmd-7-663-2014, 2014. a
Wehrli, K., Guillod, B. P., Hauser, M., Leclair, M., and Seneviratne, S. I.: Assessing the Dynamic Versus Thermodynamic Origin of Climate Model Biases, Geophys. Res. Lett., 45, 8471–8479, https://doi.org/10.1029/2018GL079220, 2018. a, b
Wehrli, K., Hauser, M., and Seneviratne, S. I.: Storylines of the 2018 Northern Hemisphere heatwave at pre-industrial and higher global warming levels, Earth Syst. Dynam., 11, 855–873, https://doi.org/10.5194/esd-11-855-2020, 2020. a
Zappa, G.: Regional Climate Impacts of Future Changes in the Mid-Latitude Atmospheric Circulation: a Storyline View, Current Climate Change Reports, 5, 358–371, https://doi.org/10.1007/s40641-019-00146-7, 2019. a
Zeng, X. and Decker, M.: Improving the Numerical Solution of Soil Moisture-Based Richards Equation for Land Models with a Deep or Shallow Water Table, J. Hydrometeorol., 10, 308–319, https://doi.org/10.1175/2008JHM1011.1, 2009. a
Zängl, G., Reinert, D., Rípodas, P., and Baldauf, M.: The ICON (ICOsahedral Non-hydrostatic) modelling framework of DWD and MPI-M: Description of the non-hydrostatic dynamical core, Q. J. Roy. Meteor. Soc., 141, 563–579, https://doi.org/10.1002/qj.2378, 2015. a