the Creative Commons Attribution 4.0 License.
the Creative Commons Attribution 4.0 License.
 | 21 Oct 2025
Permafrost response and feedback under temperature stabilization and overshoot scenarios with different global warming levels
Min Cui
Yangxin Chen
Permafrost in the northern high latitudes faces significant degradation risks under global warming and this threatens the achievement of global climate goals. This study explores the response and feedback of permafrost and the associated carbon loss under temperature stabilization scenarios, where the global mean temperature stabilizes at various global warming levels, and overshoot scenarios, and where the global mean temperature temporarily exceeds the 1.5 °C warming target. Under the 1.5 and 2 °C stabilization scenarios, permafrost area is projected to decrease by 4.6 (4.5 to 4.7) and 6.6 (6.4 to 6.8) million km2, respectively, from a pre-industrial level of 17.0 million km2. Corresponding permafrost carbon losses are estimated at 54 (32 to 79) and 72 (42 to 104) PgC, relative to a pre-industrial carbon stock of 484 (383 to 590) PgC. In overshoot scenarios, permafrost area shows effective recovery, with additional losses of only 0.6 (0.3 to 1.1) million km2 compared to the 1.5 °C stabilization scenario. In contrast, permafrost carbon loss remains largely irreversible, with additional loss of 24 (4 to 52) PgC compared to the 1.5 °C stabilization scenario. Both stabilization and overshoot scenarios show that additional warming due to permafrost carbon feedback rises with higher global warming levels, and the additional warming in overshoot scenarios becomes most pronounced during the cooling phase. The additional permafrost area loss due to permafrost carbon feedback, which accounts for 5 (2 to 11) % of the total loss, is influenced by both the magnitude of additional warming and the sensitivity of permafrost area to global warming. Moreover, the responses of permafrost area, permafrost carbon, and associated radiative forcing to a broad range of global warming exhibit near-linear relationships under stabilization scenarios. Based on the simulations presented, permafrost carbon feedback is unlikely to initiate a self-perpetuating global tipping process under both stabilization and overshoot scenarios. These findings have significant implications for long-term climate change and mitigation strategies.
- Article
(3618 KB) - Full-text XML
-
Supplement
(1420 KB) - BibTeX
- EndNote


Permafrost soils in the northern high latitudes contain an estimated 1100–1700 Pg of carbon, primarily in the form of frozen organic matter, which is roughly twice the amount of carbon in the atmosphere (Hugelius et al., 2014; Schuur et al., 2015). As the climate warms, both the gradual and abrupt permafrost thaw processes, along with subsequent microbial decomposition, would release carbon dioxide (CO2) and methane (CH4) into the atmosphere, thereby amplifying the warming effect (Koven et al., 2011; Feng et al., 2020; Smith et al., 2022). The positive feedback mechanism, combined with the fact that warming rates in the Arctic exceed the global average (Fyfe et al., 2013; Liang et al., 2022; Rantanen et al., 2022), underscores the critical role of permafrost as a key tipping element in the climate system (Armstrong McKay et al., 2022). However, current Earth system models inadequately represent or omit the permafrost carbon processes, which has become one of the largest sources of uncertainty in future climate projections (Schädel et al., 2024). Therefore, researching the permafrost carbon loss and its feedback on the climate system is crucial for accurately assessing climate risks and formulating effective emission reduction strategies.
The Paris Agreement aims to limit global average temperature rise to well below 2 °C above pre-industrial levels, with efforts to keep it below 1.5 °C. Despite these goals, global warming has already exceeded 1 °C and is on track to surpass 3 °C by the end of the 21st century, primarily due to increased anthropogenic CO2 emissions (Haustein et al., 2017; Hausfather and Peters, 2020). If current emission rates persist, the remaining carbon budgets compatible with the 1.5 °C target will be critically tight and likely exhausted within the next few years (Rogelj et al., 2015; Goodwin et al., 2018; Masson-Delmotte et al., 2018; Forster et al., 2023; Smith et al., 2023). It is unlikely that the 1.5 °C target set by the Paris Agreement will be met (Raftery et al., 2017). However, it might still be achievable after a period of temperature overshoot, by compensating for excessive past and near-term emissions with net-negative emissions at a later time – i.e., through on-site CO2 capture at emission sources and carbon dioxide removal from the atmosphere (Gasser et al., 2015; Sanderson et al., 2016; Seneviratne et al., 2018; Drouet et al., 2021; Schwinger et al., 2022).
Several existing studies have assessed the climate response to overshoot pathways. Many components of the physical climate system have been identified as reversible, although typically with some hysteresis behavior (Boucher et al., 2012; Wu et al., 2015; Tokarska and Zickfeld, 2015; Li et al., 2020; Cao et al., 2023). In this context, reversibility refers to a partial recovery of climate conditions in an overshoot scenario toward an Earth system state without overshoot. These studies demonstrate that global mean temperature, sea surface temperature, and permafrost area can recover within decades to centuries in response to net negative emissions. Carbon loss from permafrost has been shown to be irreversible on multi-decadal to millennial timescales (MacDougall et al., 2013; Schwinger et al., 2022). The presence or absence of hysteresis effect in the permafrost processes is influenced by multiple factors, including the thermal inertia of permafrost soils, potential shifts in vegetation composition, and the extent to which irreversible permafrost carbon losses are offset by gains in vegetation and non-permafrost (i.e. usual) soil carbon reservoirs (MacDougall, 2013; Schwinger et al., 2022). Furthermore, the soil carbon loss under overshoot scenarios significantly affects the hydrological and thermal properties of soils (Zhu et al., 2019), which in turn modulate the processes involved. The interactions between physical and biophysical processes can potentially stabilize the carbon, water, and energy cycles at distinct post-overshoot equilibria (de Vrese and Brovkin, 2021). Therefore, a temporary warming of the permafrost regions entails important legacy effects and lasting impacts on its physical state and carbon cycle. However, these existing studies have yet to assess permafrost carbon feedback under overshoot scenarios.
Few studies have examined permafrost carbon response and feedback under a long-term climate stabilization scenario, which have received less attention than overshoot scenarios. However, such stabilization scenarios could prove more realistic than overshoot scenarios if carbon dioxide removal ultimately falls short. Most carbon dioxide removal methods have not yet been proven at large scales (Anderson et al., 2023), and sustainability concerns further limit land-based carbon dioxide removal options (Deprez et al., 2024). Multi-model ensemble mean projections suggest that global temperature change following the cessation of anthropogenic greenhouse gas emissions will likely be close to zero in the following decades, although individual models show a range of temperature evolution after emissions cease from continued warming for centuries to substantial cooling (MacDougall et al., 2020; MacDougall, 2021; Jayakrishnan et al., 2024). MacDougall (2021) demonstrated that under a cumulative emission scenario of 1000 PgC, permafrost carbon feedback could raise global temperature by approximately 0.06 °C within 50 years after emissions cease. However, systematic research is still lacking on how permafrost carbon will be released and further amplify global warming under temperature stabilization scenarios, as well as how these processes differ from temperature overshoot scenarios reaching the same peak warming. Additionally, most post-Paris Agreement studies have focused on understanding the impacts of 1.5 and 2 °C global warming levels, with little attention given to the higher global warming levels (Rogelj et al., 2011; Comyn-Platt et al., 2018; King et al., 2024). Assessment of permafrost carbon feedback under various global warming levels would provide a more comprehensive understanding of the critical role of permafrost in the climate system.
This study aims to fill these gaps using an Earth system model of intermediate complexity to systematically assess the permafrost response and feedback under temperature stabilization or overshoot scenarios achieving various global warming levels. The structure of the remainder of this paper is as follows: Sect. 2 introduces the model description, design of temperature stabilization and overshoot scenarios at different global warming levels, as well as the methodology for perturbed parameter ensemble simulations. Section 3 provides the results of these simulations. Finally, Sect. 4 offers conclusions and discussion of our findings.
2.1 Model Description
This study uses the University of Victoria Earth System Climate Model version 2.10 (UVic ESCM v2.10), an intermediate-complexity Earth system model with a uniform horizontal resolution of 3.6° longitude by 1.8° latitude, to simulate permafrost carbon response and feedback under temperature stabilization and overshoot scenarios. The atmospheric component of UVic ESCM is a single layer moisture-energy balance model. The oceanic component incorporates a fully three-dimensional general circulation model, with a vertical resolution of 19 levels, coupled to a thermodynamic and dynamic sea-ice model. A more detailed description of UVic ESCM v2.10 can be found in Weaver et al. (2001) and Mengis et al. (2020).
The terrestrial component of UVic ESCM v2.10 uses the Top-down Representation of Interactive Foliage and Flora Including Dynamics (TRIFFID) vegetation model to describe the states of five plant functional types (PFT): broadleaf tree, needleleaf tree, C3 grass, C4 grass, and shrub (Cox, 2001; Meissner et al., 2003). A coupled photosynthesis-stomatal conductance model is used to calculate carbon uptake via photosynthesis, which is subsequently allocated to vegetation growth and respiration. The resulting net primary productivity drives changes in vegetation characteristics, including areal coverage, leaf area index, and canopy height for each PFT. The UVic ESCM v2.10 utilized in this study does not account for nutrient limitations in the terrestrial carbon cycle, leading to an overestimation of global gross primary productivity and an enhanced capacity of land to take up atmospheric carbon (De Sisto et al., 2023). However, the model reasonably represents the dominant PFTs of C3 grass, shrub, and needleleaf tree at northern high latitudes, although it underestimates vegetation carbon density over this area (Mengis et al., 2020).
The UVic ESCM v2.10 represents the terrestrial subsurface with 14 layers, extending to a total depth of 250.3 m to correctly capture the transient response of permafrost on centennial timescales. The top eight layers (10.0 m) are hydrologically active, while the deeper layers are modeled as impermeable bedrock (Avis et al., 2011). The carbon cycle is active in the top 6 layers (3.35 m), where organic carbon from litterfall, simulated by the TRIFFID vegetation model, is allocated to soil layers with temperatures above 1 °C according to an exponentially decreasing function with depth. If all soil layers are below 1 °C, the organic carbon is added to the top soil layer. The soil respiration is calculated for each layer individually as a function of temperature and moisture, but the respiration ceases when the soil layer temperature falls below 0 °C (Meissner et al., 2003; Mengis et al., 2020). In permafrost regions the model applies a revised diffusion-based cryoturbation scheme to redistribute soil carbon within the soil column. Compared to the original diffusion-based cryoturbation scheme proposed by Koven et al. (2009), the revised cryoturbation scheme calculates carbon diffusion using an effective carbon concentration that incorporates the volumetric porosity of the soil layer, rather than the actual carbon concentration, thereby resolving the disequilibrium problem of the permafrost carbon pool during model spin-up (MacDougall and Knutti, 2016). However, as the UVic ESCM v2.10 only simulates permafrost carbon in the top 3.35 m of soil, the current cryoturbation scheme cannot initiate the formation of Yedoma. As a result, soil carbon stored in deep deposits of Yedoma regions is omitted in our simulations. It is worth noting that the permafrost region for carbon-related variables is defined as the area where permafrost carbon exceeds zero. This differs from the permafrost area, which is defined as the area where soil temperature remains below 0 °C for at least two consecutive years.
In the UVic ESCM v2.10, the usual soil carbon and the permafrost carbon are depicted as two distinct depth-resolved carbon pools within the upper 6 soil layers. Soil carbon that is diffused downward and crosses the permafrost table (i.e. the depth of the active layer) is transformed into permafrost carbon. Conversely, permafrost carbon that is diffused upward and crosses the permafrost table is converted back into usual soil carbon. However, as the active layer deepens, thawed permafrost carbon is not transferred to the usual soil carbon pool; it remains in the permafrost carbon pool and decomposes at a rate distinct from that of usual soil carbon. The coexistence of thawed and frozen permafrost carbon is attributed to the depth-resolved soil carbon scheme. Permafrost carbon can only be decomposed into CO2, as the UVic ESCM v2.10 does not include a methane production module (MacDougall and Knutti, 2016). The permafrost carbon pool is characterized by four key parameters: (1) a decay rate constant; (2) the available fraction for decomposition, which represents the combined size of both the fast and slow carbon pools subject to decay; (3) a passive pool transformation rate, which governs the rate at which passive permafrost carbon transitions into the available fraction; and (4) a saturation factor used to calibrate the total size of the permafrost carbon pool, which is linked to soil mineral porosity and accounts for the decreasing concentration of soil carbon with depth in permafrost regions (Hugelius et al., 2014). These four key parameters determine the size and vulnerability to decay of the permafrost carbon pool. A more detailed description of the UVic ESCM's permafrost carbon parameterization scheme and its simulated permafrost carbon characteristics can be found in MacDougall and Knutti (2016).
As an Earth system model of intermediate complexity, the UVic ESCM offers relatively low computational costs and serves as an ideal instrument for performing a large number of simulations that are not yet feasible with state-of-the-art Earth system models (Weaver et al., 2001; MacIsaac et al., 2021). In recent years, the UVic ESCM has played a key role in assessments of carbon-climate feedbacks (Matthews and Caldeira, 2008; Matthews et al., 2009; Tokarska and Zickfeld, 2015; Zickfeld et al., 2016) and long-term climate change projection (Ehlert and Zickfeld, 2018; Mengis et al., 2020; MacDougall, 2021). UVic ESCM v2.10 realistically reproduces historical changes in temperature and carbon fluxes (Mengis et al., 2020), compared to the observation-based dataset for temperature change (Haustein et al., 2017) and Global Carbon Project 2018 for carbon fluxes (Le Quéré et al., 2018). Moreover, it has also been validated for simulating permafrost area and permafrost carbon stocks (Mengis et al., 2020).
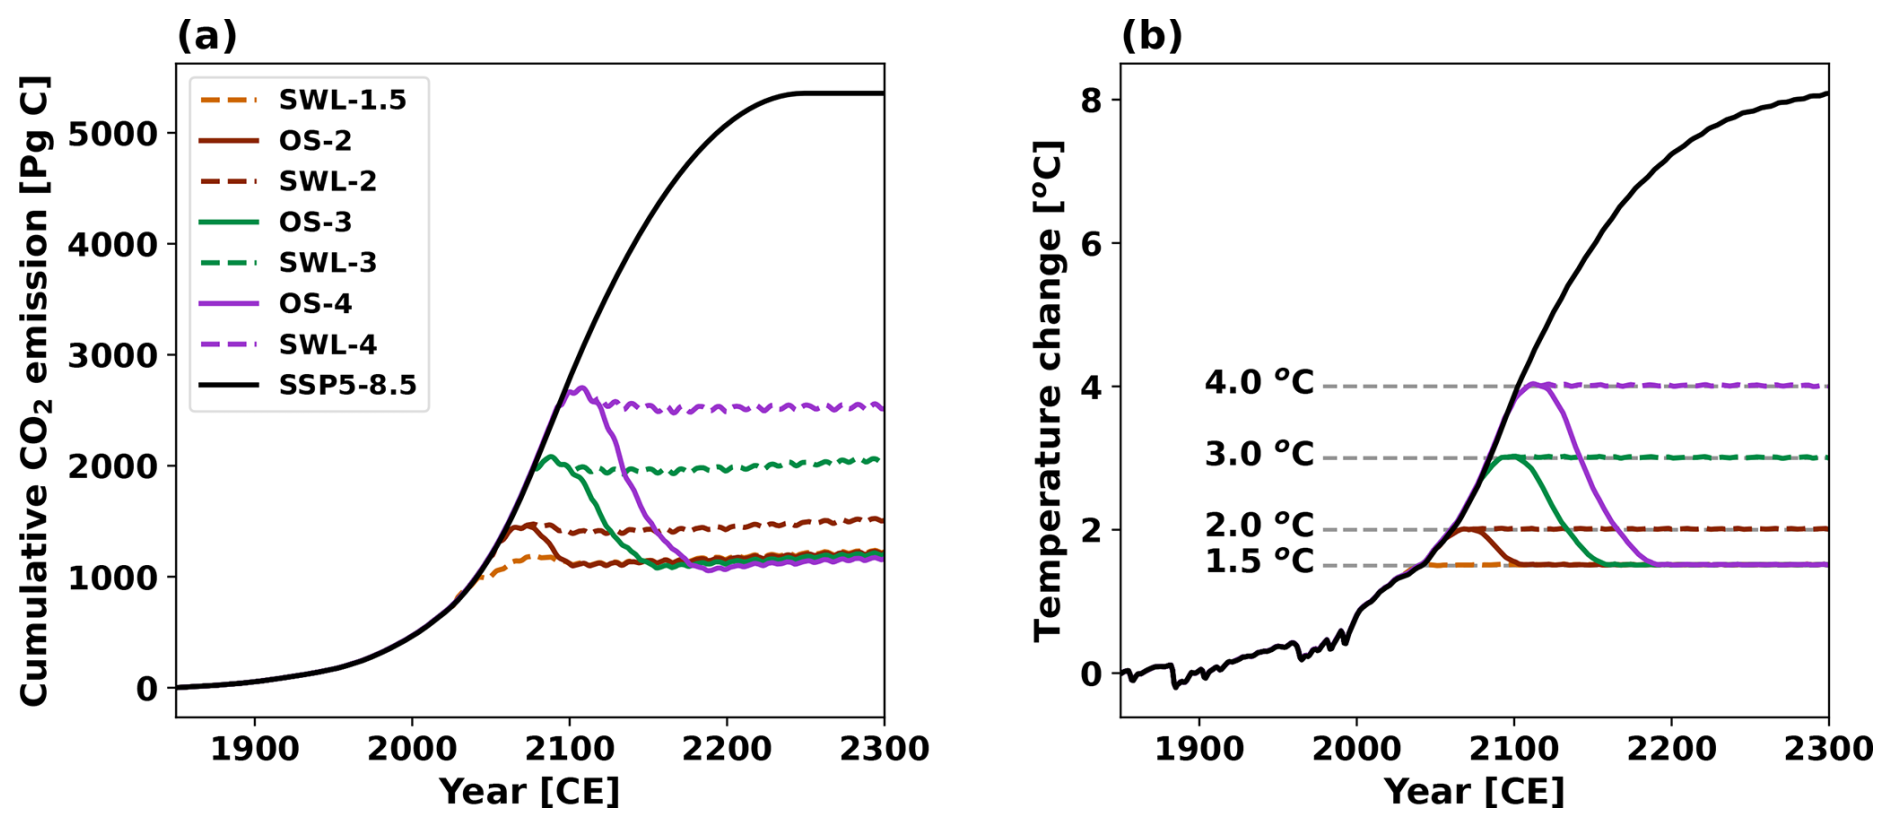
Figure 1Temperature stabilization and overshoot scenarios designed through a simple proportional control scheme (Zickfeld et al., 2009) with permafrost carbon module deactivated (corresponding to the NPFC simulations). (a) Cumulative CO2 emission and (b) temperature change relative to the pre-industrial levels (1850–1900), in the historical and SSP5-8.5 scenario (black), the stabilization (dashed lines) and overshoot (solid lines) scenarios for 1.5 °C (orange), 2.0 °C (brown), 3.0 °C (green), and 4.0 °C (purple) global warming levels.
2.2 Experimental Design
To quantify the impact of permafrost carbon response under different climate conditions, we designed a series of idealized climate scenarios, including four stabilized warming levels (SWL) and three overshoot (OS) trajectories, spanning a long period from 1850 to 2300. In these scenarios, the global mean temperature increases to a maximum of 1.5, 2.0, 3.0, and 4.0 °C above pre-industrial levels (1850–1900). Following this initial warming phase, the scenarios diverge into two groups following distinct temperature trajectories. In the stabilization scenarios, temperature stabilizes at the respective global warming levels and remains steady until 2300, referred to as SWL-1.5, SWL-2, SWL-3, and SWL-4. In contrast, the overshoot scenarios allow temperatures to temporarily reach these warming peaks before entering a cooling phase symmetrical to the warming phase, gradually reducing the global mean temperature to 1.5 °C above pre-industrial levels, where it remains steady until 2300. These overshoot pathways are referred to as OS-2, OS-3, and OS-4, respectively.
A simple proportional control scheme (Zickfeld et al., 2009) was used to derive the CO2 emissions pathway corresponding to each stabilization and overshoot scenarios, adjusting emissions to align the global mean temperature with the prescribed trajectory. The proportional control equation is given by:
Where Ei+1 represents the carbon emission at year i+1, Ti represents the simulated annual mean global mean temperature at year i, and Ti,goal represents the prescribed global mean temperature trajectory at year i for each scenario. The time-invariant coefficient kPE is set to 1515 Pg C K−1, ensuring that the control scheme responds neither too quickly nor too slowly to the diagnosed temperature derivation. Using the proportional control scheme, a set of emission trajectories were produced from initial simulations of stabilization and overshoot scenarios using the UVic ESCM v2.10 with the permafrost carbon module deactivated, thereby excluding the influence of permafrost carbon emissions. Specifically, all these initial simulations of stabilization and overshoot scenarios firstly follow a unified emissions trajectory, which is based on historical CO2 emissions (Friedlingstein et al., 2022) until 2021, and thereafter follow the emissions trajectory of the Shared Socioeconomic Pathway 5-8.5 (SSP5-8.5) (O'Neill et al., 2016) until the highest temperatures of each scenario are approached. As the highest temperatures of each scenario are approached, the proportional control gradually steps in to mediate CO2 emissions and realize the warming trajectory of each scenario. The CO2 emission trajectories obtained from these initial simulations were used later to drive formal emissions-driven simulations of stabilization and overshoot scenarios (Fig. 1a). Once these emission trajectories were established, there is no further application of the proportional control in the formal simulations.
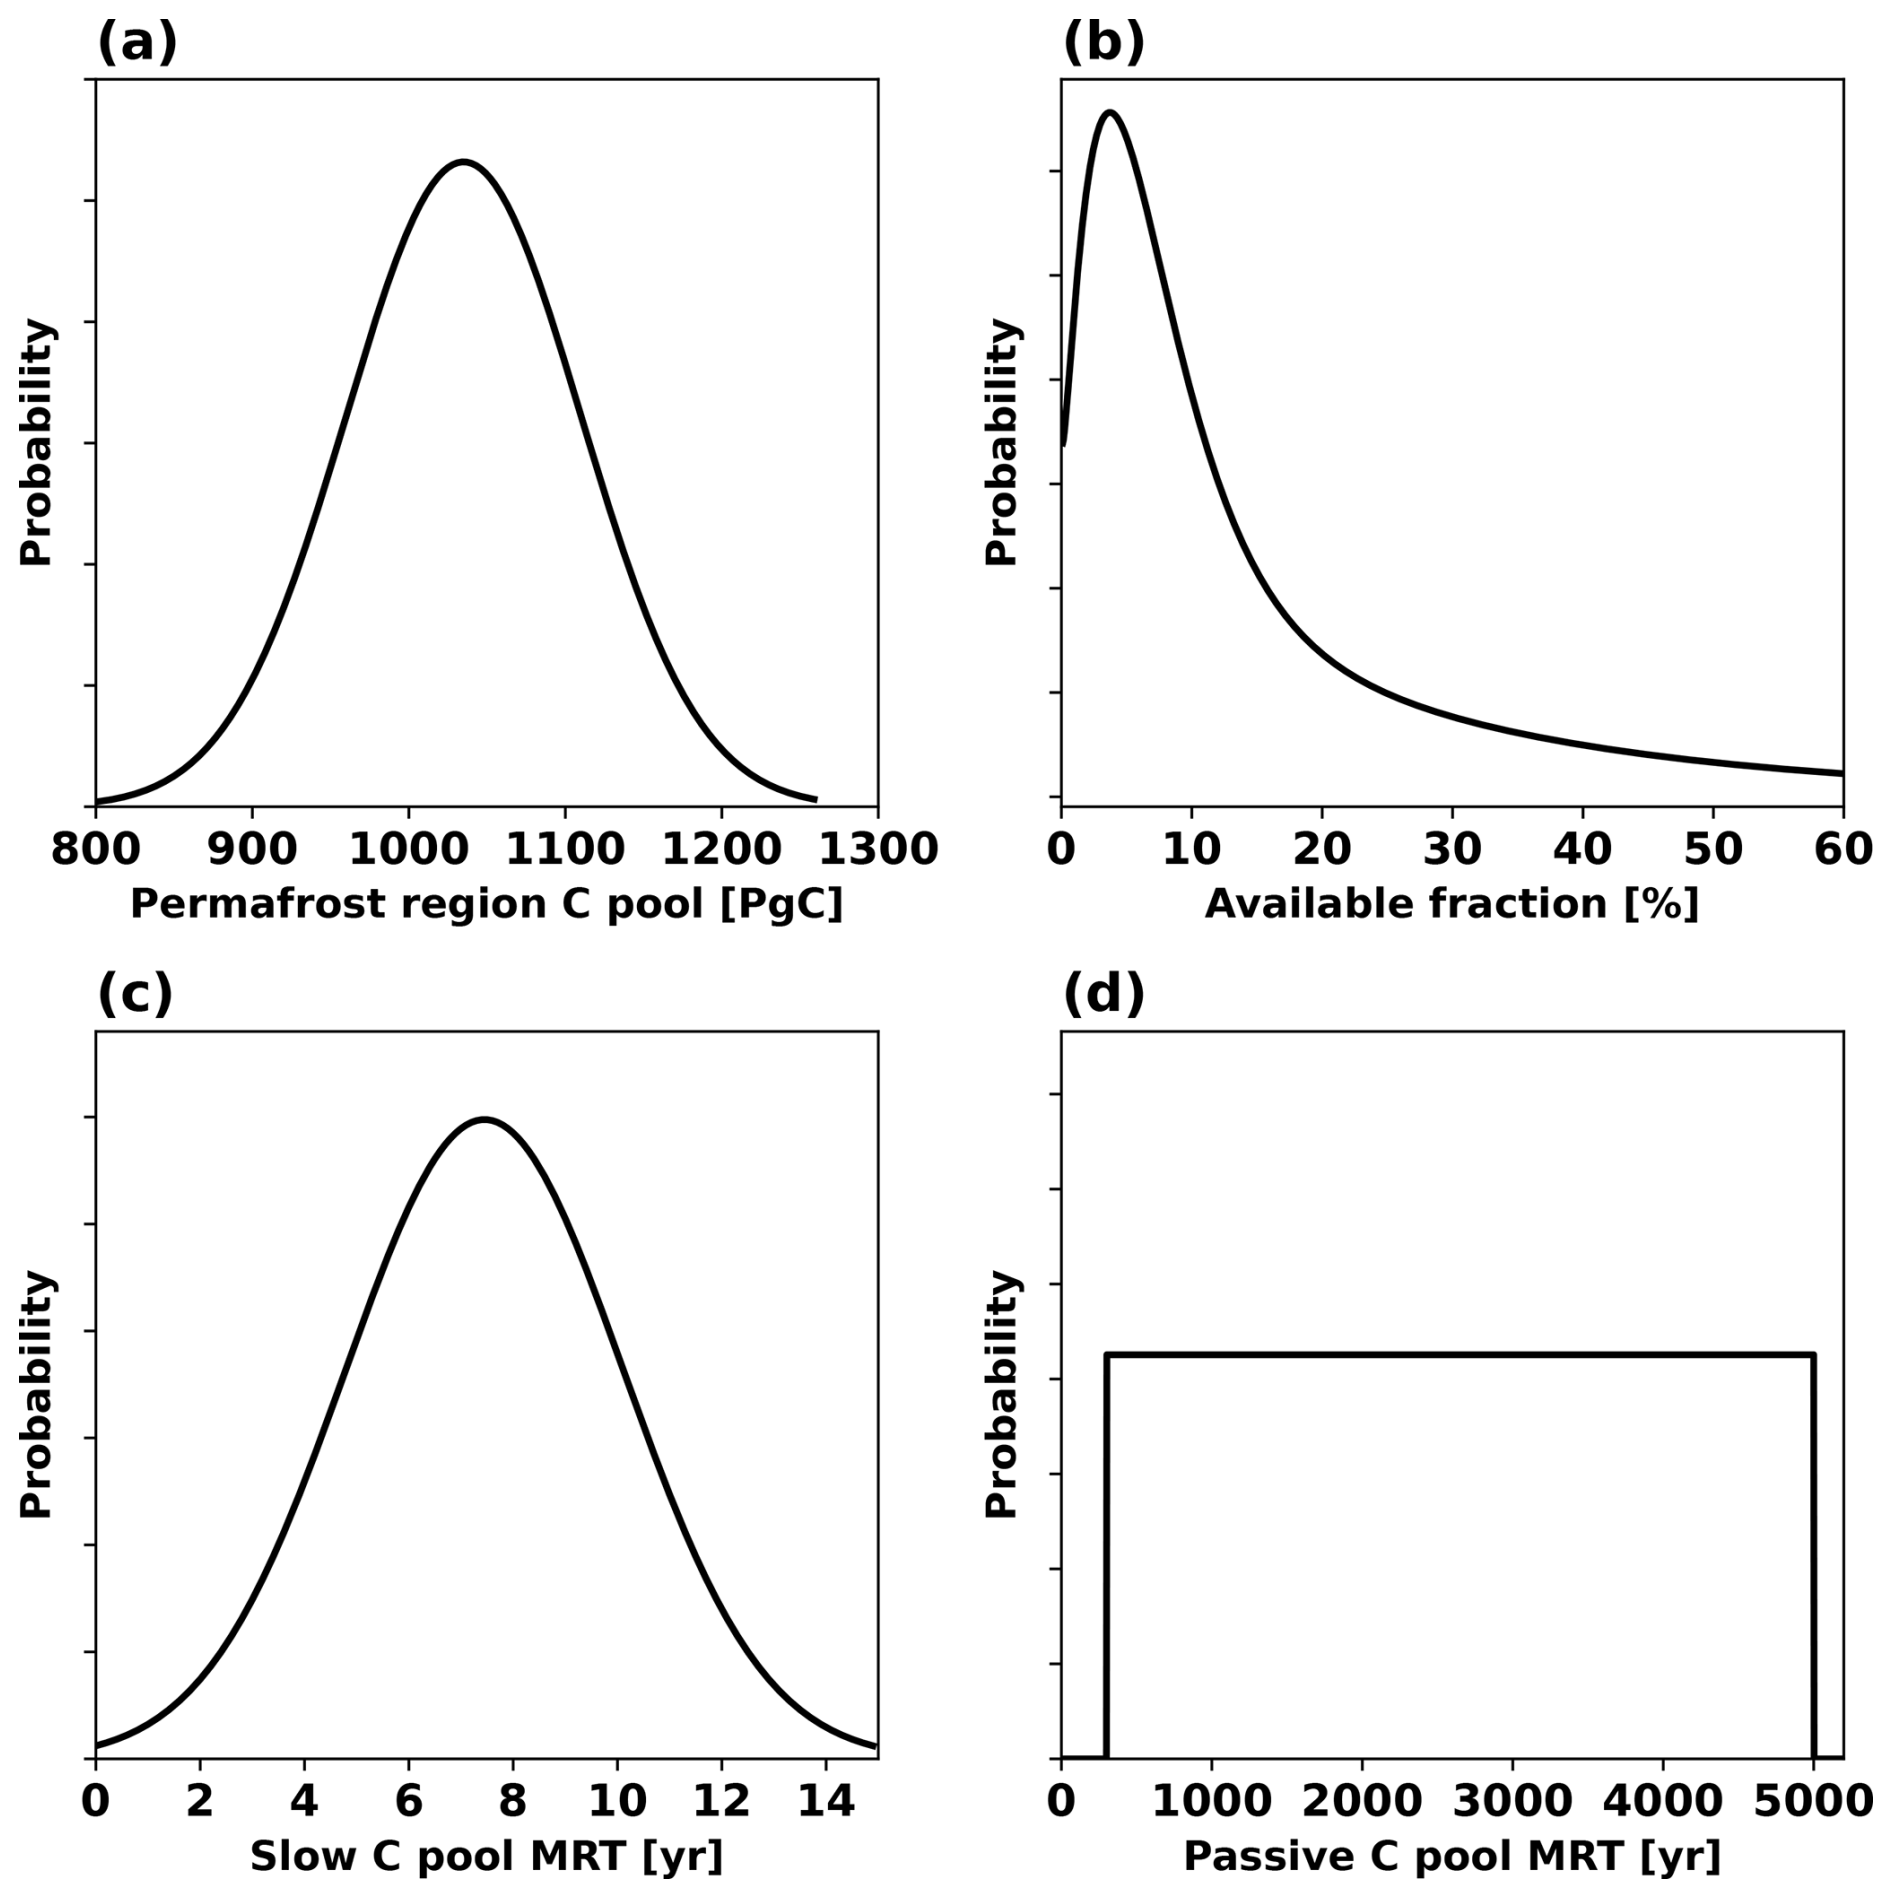
Figure 2Probability distribution functions of the four key permafrost carbon parameters perturbed in the UVic ESCM v2.10 to represent uncertainty in permafrost carbon response. This figure is adapted from MacDougall (2021).
To isolate the contribution of permafrost carbon feedback, two parallel sets of formal simulations were conducted for each scenario, both driven by the same CO2 emission trajectories obtained from the initial simulations. One set activated the permafrost carbon module and is referred to as PFC simulations, while the other set deactivated the permafrost carbon module and is referred to as NPFC simulations. Since the emission trajectories were obtained from the initial simulations in which the proportional control scheme was applied to achieve the desired temperature pathways, applying them in the formal NPFC simulations can effectively achieve the same temperature trajectories (Fig. 1b). However, applying the obtained emissions in the formal PFC simulations results in any permafrost carbon fluxes being effectively added on top of the applied emissions, thereby causing additional warming. In other words, to achieve the intended climate targets under the same emission pathways, removals equivalent to the permafrost carbon emissions would be required. Therefore, the comparison between the PFC and NPFC simulation sets provides a robust framework to isolate and quantify the additional warming and radiative forcing effects due to permafrost carbon emissions under stabilization and overshoot scenarios. Comparing the PFC simulations with the NPFC simulations, rather than with the initial simulations, eliminates any potential effects of the proportional control scheme. For comparison, two parallel simulations with permafrost carbon module activated or deactivated were also conducted for the high-emissions SSP5-8.5 scenario.
To evaluate the uncertainty in permafrost carbon response under stabilization and overshoot scenarios, we perturbed the four key permafrost carbon parameters following the methodologies of MacDougall and Knutti (2016) and MacDougall (2021). The permafrost carbon decay constant was derived from the mean residence time (MRT) of the slow soil carbon pool at 5 °C in permafrost soils and adjusted to reflect decay at 25 °C using the method proposed by Kirschbaum (2006). The probability distribution function of mean residence time was taken as a normal distribution with a mean of 7.45 years and a standard deviation of 2.67 years from Schädel et al. (2014). The available fraction of permafrost carbon for decomposition was derived from the size of the fast, slow, and passive soil organic carbon pools separately for organic, shallow mineral, and deep mineral soils measured by Schädel et al. (2014). The probability distribution function of available fraction of permafrost carbon for decomposition was described by weighted gamma distributions, with each distribution, respectively describing the probability distribution function of available fraction of permafrost carbon for decomposition in organic, shallow mineral, and deep mineral soils. The passive carbon pool transformation rate was estimated from the 14C age of the passive carbon pool in midlatitude soils (Trumbore, 2000). Its mean residence time at 5 °C is 300 to 5000 years, yielding a passive carbon pool transformation rate of 0.25 × 10⁻¹⁰ to 4 × 10⁻¹⁰ s−1 after adjustment to 25 °C. The mean residence time of the passive carbon pool was assumed to follow a uniform distribution (MacDougall and Knutti, 2016). For the initial quantity of total permafrost region soil carbon, its probability distribution function was taken as a normal distribution with a mean of 1035 PgC and a standard deviation of 75 PgC, informed by Hugelius et al. (2014). A series of 5000 year sensitivity runs were performed under preindustrial steady conditions with varying saturation factors to determine their relationship with the quantity of the total permafrost region soil carbon. This relationship was then utilized to tune the total permafrost region soil carbon pool, ensuring alignment with observational data (Hugelius et al., 2014). Figure 2 illustrates the probability distribution function for each perturbed parameter. MacDougall and Knutti (2016) and MacDougall (2021) additionally perturbed two physical climate parameters controlling climate sensitivity and Arctic amplification, but they are not perturbed in this study due to their limited influence on global mean temperature in stabilization scenarios.
The Latin hypercube sampling method (McKay et al., 1979) was used to explore the effects of parameter uncertainty on projections of permafrost carbon change. In this study, the probability distribution function of each key permafrost carbon parameter was divided into 25 intervals of equal probability. One value was randomly selected from each interval for a given parameter, and then randomly matched with values of the other three key parameters selected in the same manner to generate parameter sets. This sampling procedure was repeated 10 times, resulting in 250 unique parameter sets (i.e., 250 model variants). For each parameter set, the UVic ESCM v2.10 was first run through a 10 000 year spin-up phase under pre-industrial conditions to achieve a quasi-equilibrium state. For these spin-up runs, the atmospheric CO2 concentration was fixed at 284.7 ppm and the solar constant was set to 1360.747 W m−2. Following the spin-up, emission-driven transient simulations were conducted under the stabilization, overshoot, and SSP5-8.5 scenarios. The results are presented as the median across all model variants, with uncertainty quantified as the range between the 5th to the 95th percentiles.
The UVic ESCM v2.10 reliably simulates permafrost area, permafrost carbon, and total permafrost region soil carbon stocks. Under pre-industrial conditions, the simulated Northern Hemisphere permafrost area was 17.01 (17.00 to 17.04) million km2, the simulated total soil carbon stock in the permafrost regions was 1031 (915 to 1149) PgC, of which 484 (383 to 590) PgC was classified as permafrost carbon and 547 (533 to 559) PgC was classified as usual soil carbon. For the period 1960–1990, the model simulated Northern Hemisphere permafrost area at 16.8 (16.7 to 16.9) million km2, which falls within the reconstructed range from 12.0 to 18.2 million km2 (Chadburn et al., 2017) and the observation-based extent from 12.21 to 16.98 million km2 (Zhang et al., 2000). Additionally, the simulated total soil carbon stock in the permafrost regions for this same period was 1034 (919 to 1151) PgC, with 483 (382 to 587) PgC classified as permafrost carbon, accounting for 47 % (42 % to 51 %) of the total permafrost region soil carbon stock, in agreement with Hugelius et al. (2014). Notably, the area with non-zero permafrost carbon is 17.2 million km2 and changes only minimally throughout the simulations.
The UVic ESCM v2.10 also realistically simulates historical temperature changes and the partitioning of anthropogenic carbon emissions among the atmosphere, ocean and land. During the period 2011–2020, the model estimated a global mean temperature increase of 1.14 (1.13 to 1.15) °C relative to preindustrial levels, which is closely aligned with the observed rise of 1.09 (0.91 to 1.23) °C (Gulev et al., 2021). From 2010 to 2019, the model estimated that anthropogenic carbon emissions of 11 Pg C yr−1 were distributed as follows: 5.5 (5.4 to 5.6) Pg C yr−1 to the atmosphere, 3.0 (2.98 to 3.03) Pg C yr−1 to the ocean, and 2.5 (2.4 to 2.6) Pg C yr−1 to terrestrial ecosystems. These estimates are broadly consistent with the global anthropogenic CO2 budget assessment by the Global Carbon Project (GCP) with figures of 5.1 ± 0.02 Pg C yr−1 for the atmosphere, 2.5 ± 0.6 Pg C yr−1 for the ocean, and 3.4 ± 0.9 Pg C yr−1 for terrestrial ecosystems (Friedlingstein et al., 2020).
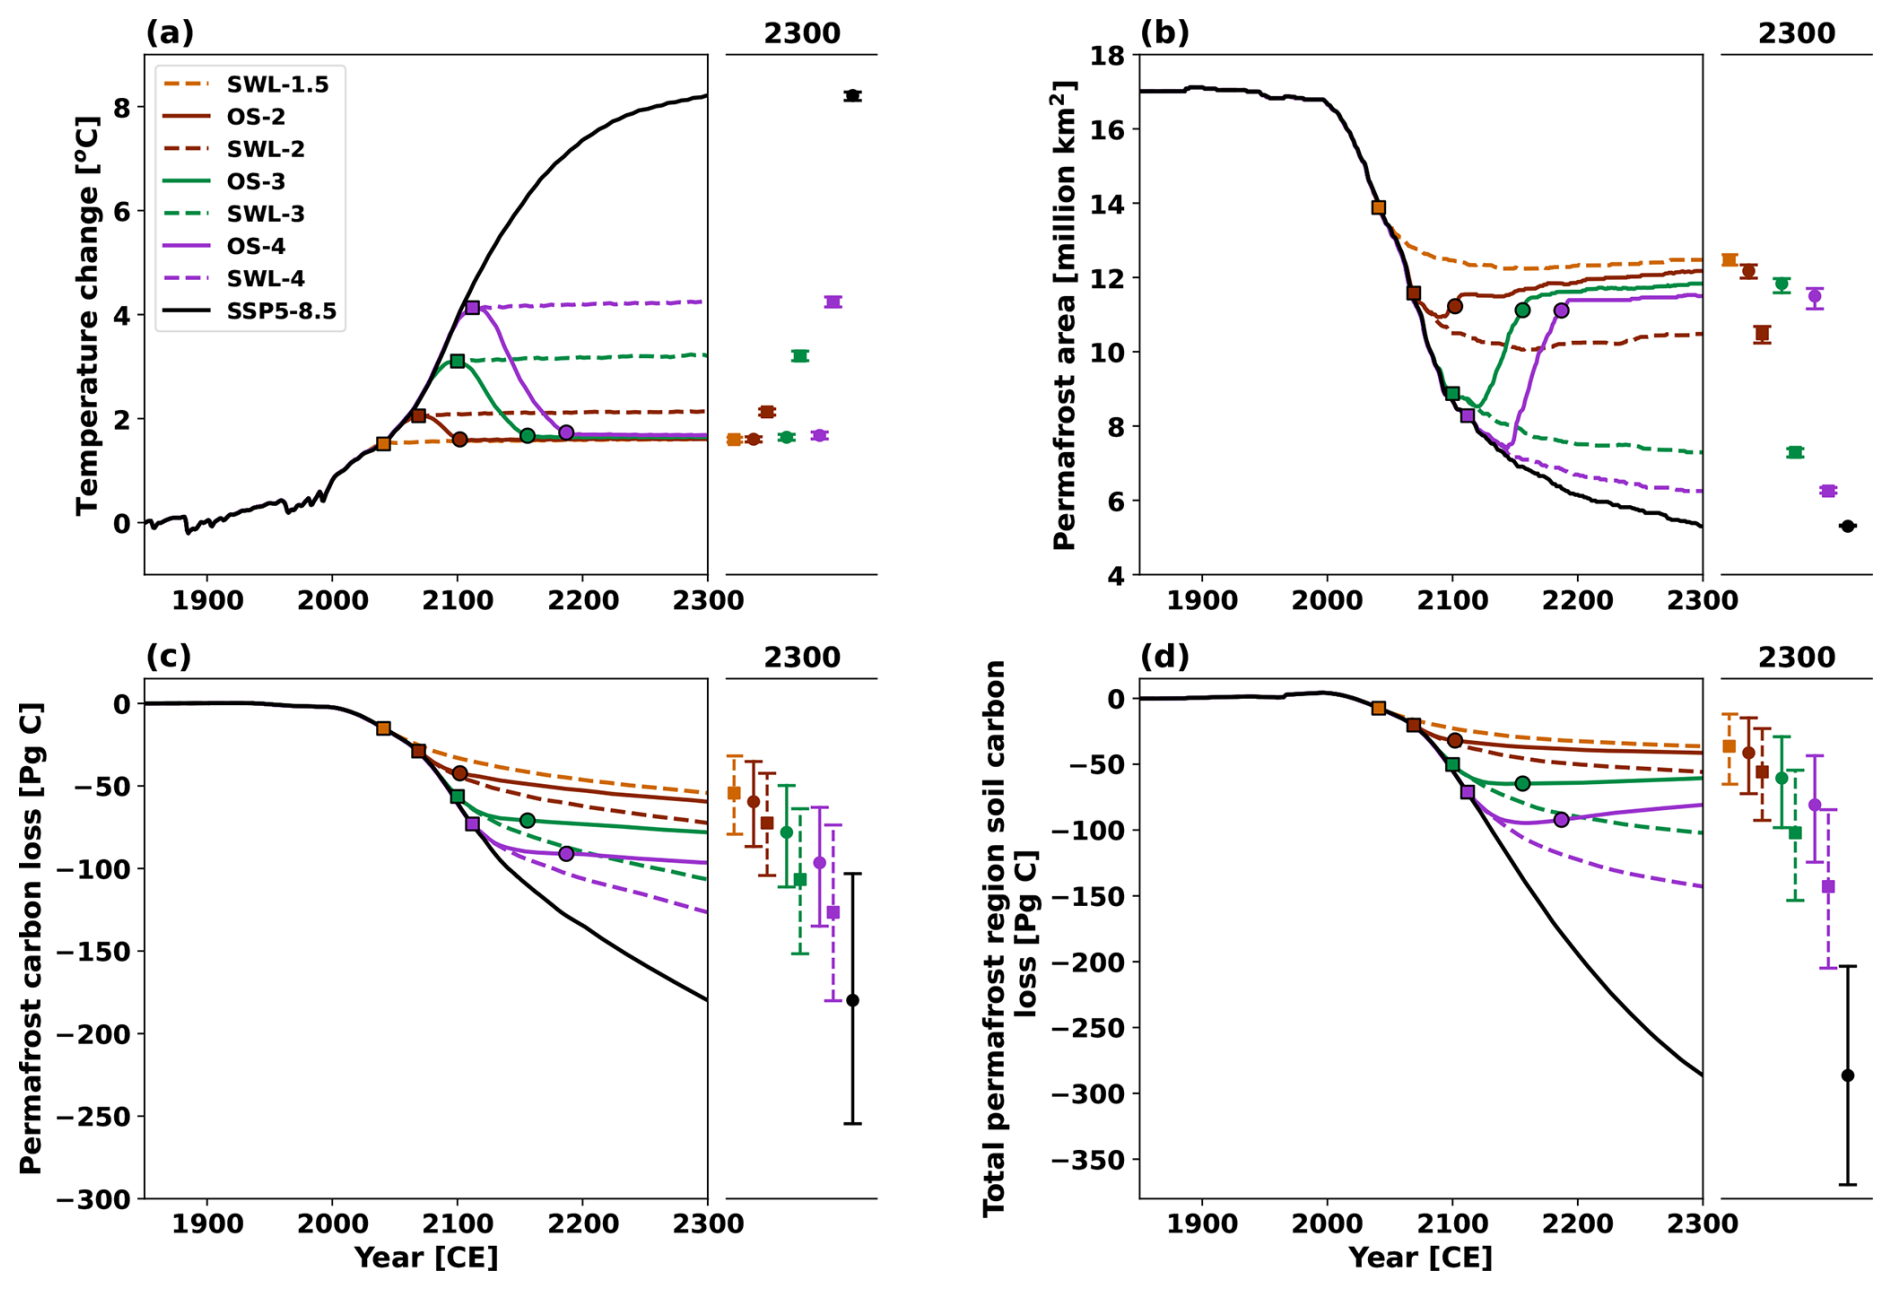
Figure 3Timeseries of annual mean (a) temperature change since 1850–1900, (b) permafrost area, (c) permafrost carbon loss since 1850–1900 and (d) total permafrost region soil carbon loss since 1850–1900 under stabilization (dashed lines) and overshoot (solid lines) scenarios at 1.5 °C (orange), 2.0 °C (brown), 3.0 °C (green), and 4.0 °C (purple) global warming levels, as well as the SSP5-8.5 scenario. Square markers indicate the time points when the temperature overshoot reaches its peak or stabilized warming begins, while circle markers indicate when the overshoot returns to 1.5 °C. All changes are relative to the pre-industrial period (1850–1900). Results represent the ensemble median of 250 simulations based on the PFC simulations. Dots on the adjacent right panels represent values in the year 2300, with uncertainty ranges estimated as the 5th to 95th percentiles. Notably, both permafrost carbon and total permafrost region soil carbon are calculated for the regions where the permafrost carbon is greater than zero.
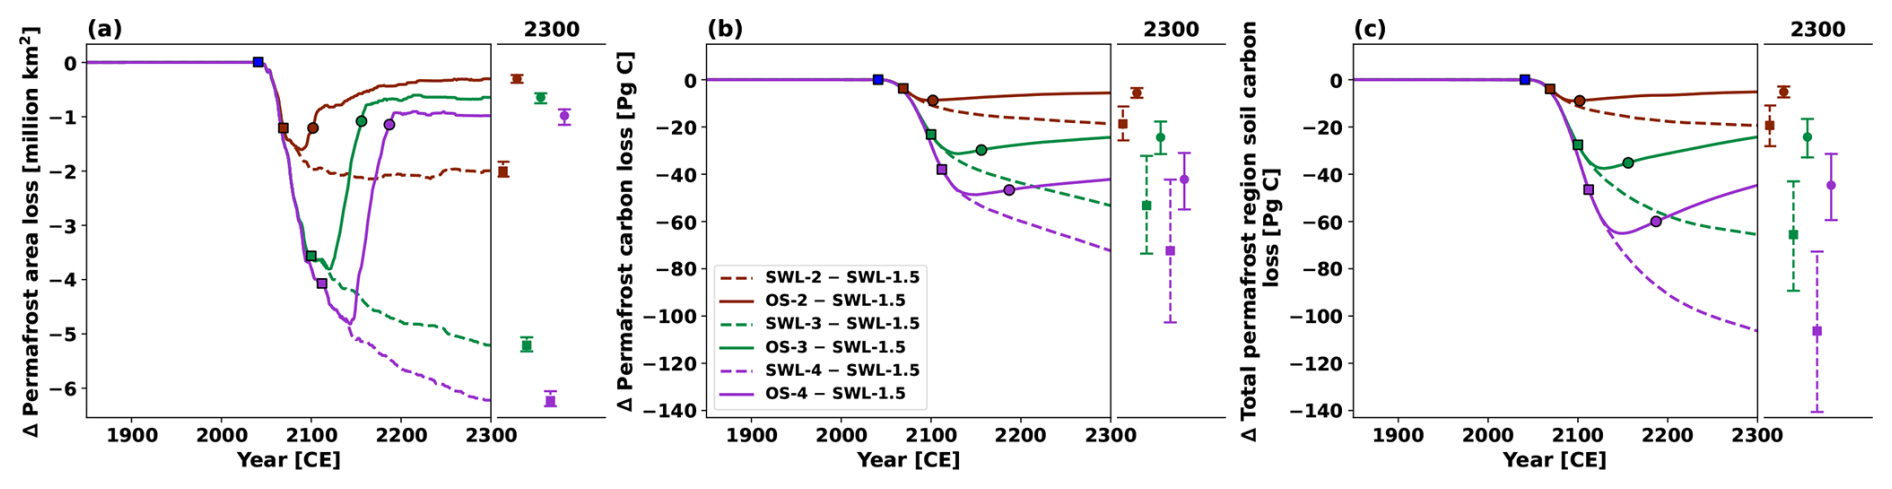
Figure 4Similar to Fig. 3, but showing timeseries of changes relative to the SWL-1.5 scenario in (a) permafrost area loss, (b) permafrost carbon loss, and (c) total permafrost region soil carbon loss under stabilization and overshoot scenarios for 2.0 °C (brown), 3.0 °C (green), and 4.0 °C (purple) global warming levels. Square markers indicate the time points when the temperature overshoot reaches its peak or stabilized warming begins, while circle markers indicate when the overshoot returns to 1.5 °C. Results represent the ensemble median of 250 simulations based on the PFC simulations. Dots on the adjacent right panels represent values in the year 2300, with uncertainty ranges estimated as the 5th to 95th percentiles.
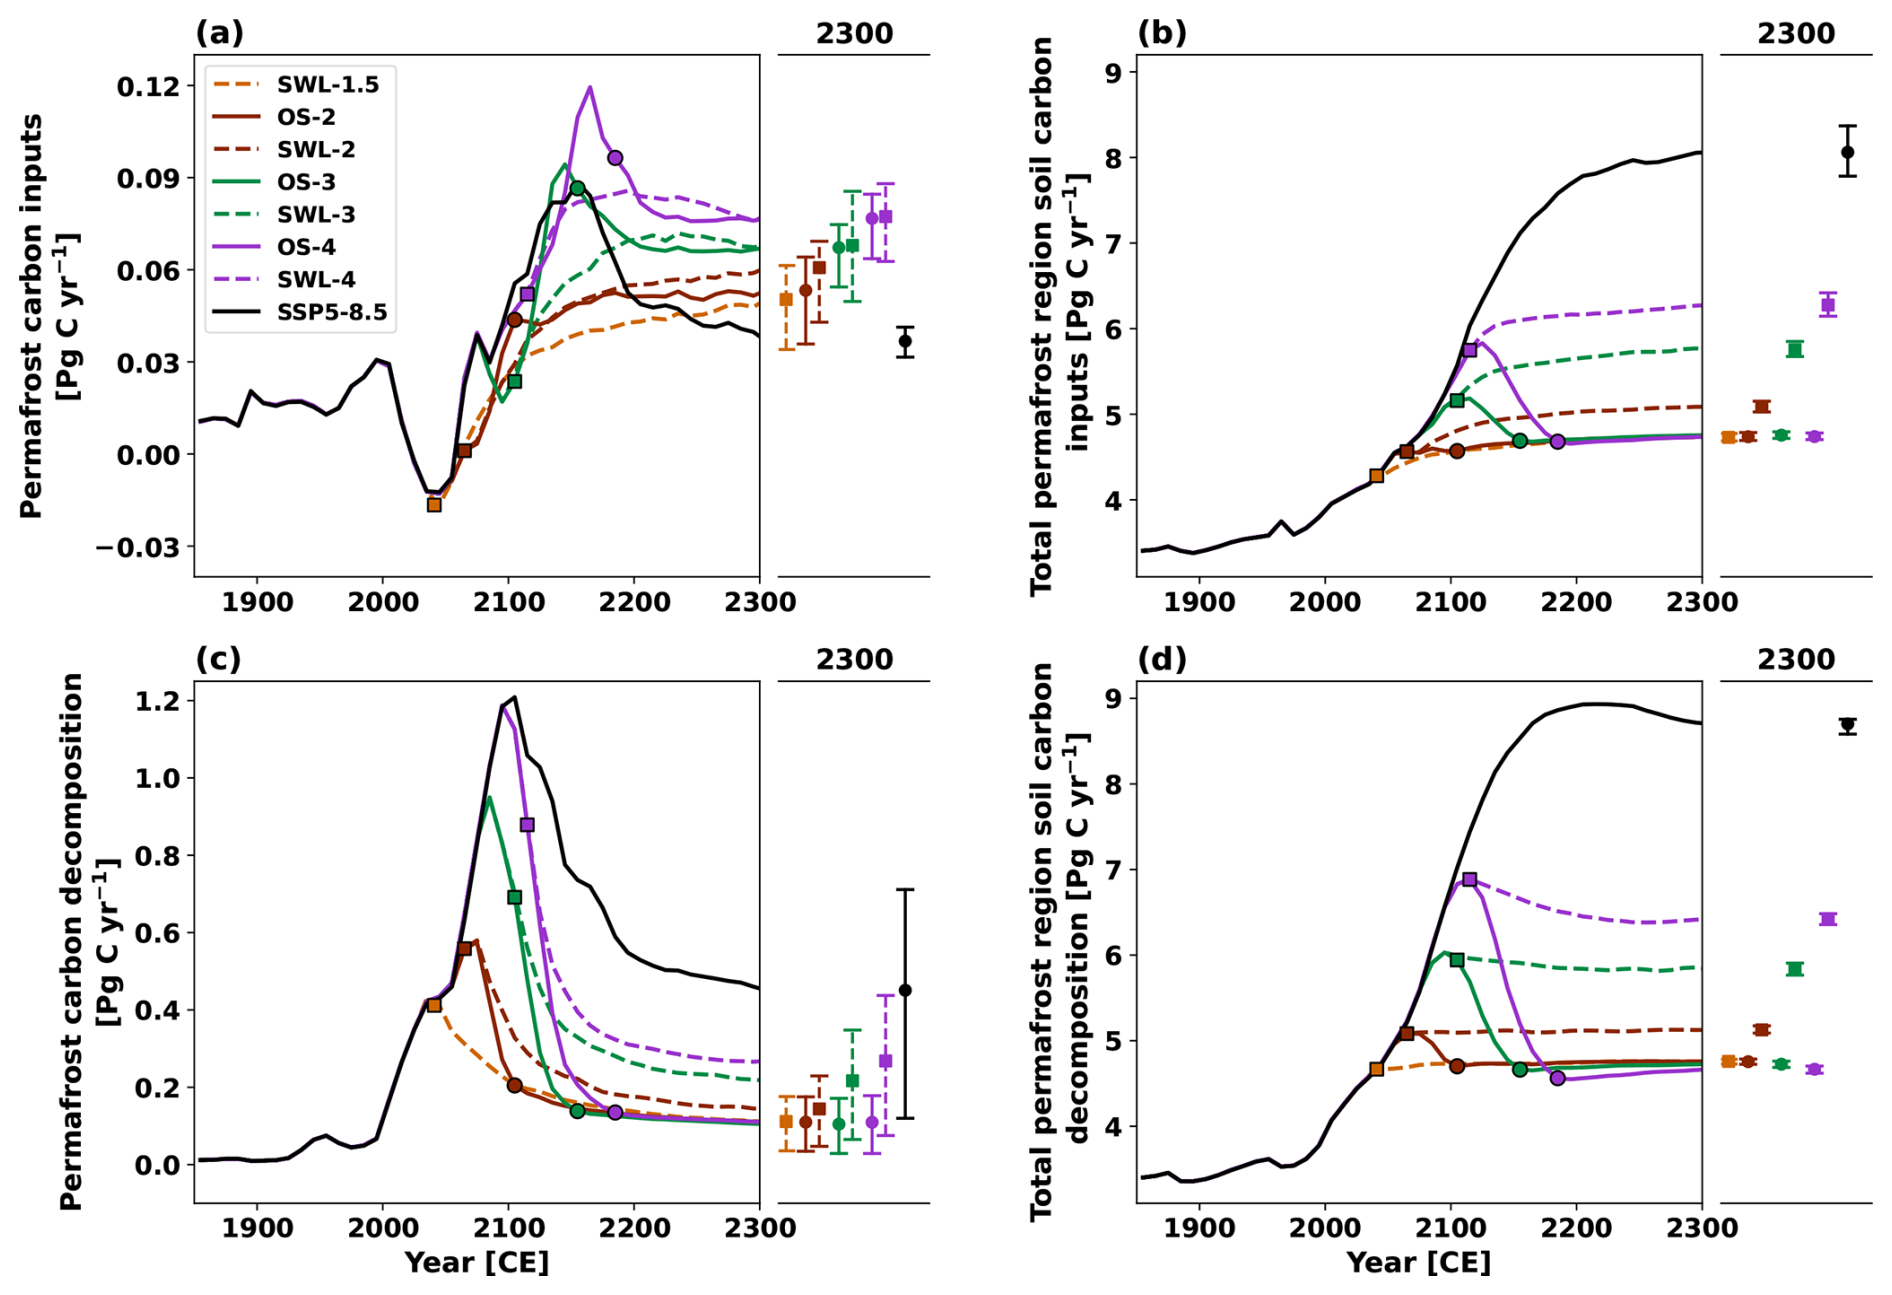
Figure 5Timeseries of changes in (a) permafrost carbon inputs, (b) total permafrost region soil carbon inputs, (c) permafrost carbon decomposition and (d) total permafrost region soil carbon decomposition, under the stabilization (dashed lines) and overshoot (solid lines) scenarios for 1.5 °C (orange), 2.0 °C (brown), 3.0 °C (green), and 4.0 °C (purple) global warming levels, along with the SSP5-8.5 scenario (black). Square markers indicate the time points when the temperature overshoot reaches its peak or stabilized warming begins, while circle markers indicate when the overshoot returns to 1.5 °C. Results represent the ensemble median of 250 simulations based on the PFC simulations. Dots on the adjacent right panels represent values in the year 2300, with uncertainty ranges estimated as the 5th to 95th percentiles.
3.1 Permafrost Response
The Northern Hemisphere high-latitude permafrost area is strongly correlated with changes in global mean temperature (Figs. 3a, b and S1a, b in the Supplement). As global warming increases from 1.5 to 4 °C, the permafrost area declines from 13.9 to 8.3 million km2 under the SSP5-8.5 scenario by year 2300. In the stabilization scenarios, when global warming is stabilized at the Paris Agreement targets of 1.5 or 2 °C, permafrost degradation is effectively suppressed compared to the SSP5-8.5 scenario. By 2300, permafrost area decreases by 4.6 (4.5 to 4.7) and 6.6 (6.4 to 6.8) million km2 from the pre-industrial level of 17.0 million km2 under SWL-1.5 and SWL-2 scenarios, respectively, accounting for 39 (38 to 40) % and 56 (54 to 58) % of the reduction observed under SSP5-8.5 scenario. The additional permafrost degradation under the SWL-3 compared to SWL-2 is significantly larger than that under SWL-4 compared to SWL-3. This is mainly because the remaining permafrost available for degradation becomes progressively limited under higher global warming levels, and the permafrost area under higher stabilization scenarios has not yet reached a steady state in our simulations. Additionally, the permafrost area under the SWL-3 and SWL-4 scenarios exceeds that under the SSP5-8.5 scenario by only 2.0 (1.9 to 2.1) and 0.9 (0.8 to 1.0) million km2 by 2300, respectively. This is primarily because the permafrost area in the SSP5-8.5 scenario is smaller and, as a transient simulation, is further from equilibrium compared to SWL-3 and SWL-4. However, during the cooling phase of the overshoot scenarios, as the global mean temperature returns to 1.5 °C above pre-industrial levels, the permafrost area gradually recovers to that under the SWL-1.5 scenario (Figs. 4a and S2a). By 2300, it converges to similar levels of 11.1–12.4 million km2 under the OS-2, OS-3 and OS-4 scenarios, with an additional loss of only 0.2–1.2 million km2 compared to the SWL-1.5 scenario. This indicates that permafrost area is nearly reversible and largely follows the global mean temperature trajectory, recovering as temperature reduction, consistent with previous studies (MacDougall, 2013; Lee et al., 2021; Schwinger et al., 2022). The incomplete recovery partly results from slightly higher regional temperatures in permafrost regions. By 2300, the northern high-latitude permafrost regions are 0.01–0.13 °C warmer compared to the SWL-1.5 scenario. It is noteworthy that permafrost area loss under overshoot scenarios typically exhibits a hysteresis effect (Boucher et al., 2012; MacDougall, 2013; Eliseev et al., 2014), peaking about 10–30 years after global mean temperature reaches its maximum in our simulations.
Under both temperature stabilization and overshoot scenarios, permafrost carbon declines monotonically over time (Figs. 3c and S1c), driven by the imbalance between weaker permafrost carbon inputs and relatively faster decomposition. The primary source of permafrost carbon input is a very slow physical process of downward diffusion through the permafrost table due to cryoturbation mixing effect (MacDougall and Knutti, 2016). As a result, the rates of permafrost carbon decomposition significantly exceed its inputs (Figs. 5a, c and S3a, c). Under the SWL-1.5, SWL-2, SWL-3, and SWL-4 scenarios, permafrost carbon losses are projected to be 54 (32 to 79), 72 (42 to 104), 106 (64 to 152), and 127 (74 to 180) PgC by 2300, respectively, while under the OS-2, OS-3, and OS-4 scenarios, the losses are 60 (35 to 87), 78 (50 to 111), and 97 (63 to 135) PgC. This indicates that despite global mean temperature returning to 1.5 °C in overshoot scenarios, considerable permafrost carbon losses still occur, accounting for 82 (80 to 85) %, 73 (71 to 78) %, and 76 (72 to 85) % of the losses in the corresponding stabilization scenarios achieving same global warming levels. Additionally, the extra permafrost carbon losses under the SWL-2, SWL-3, and SWL-4 scenarios relative to the SWL-1.5 scenario continue to increase over time; whereas in the overshoot scenarios, these additional losses decrease during the stabilization phase (Figs 4b and S2b) and reduce to 24 (4 to 52) PgC by 2300. This decrease occurs because, after temperature change stabilizes at 1.5 °C, the permafrost carbon decomposition rate under the overshoot scenarios closely aligns with that of the SWL-1.5 scenario, while the permafrost carbon inputs under the overshoot scenarios surpass that of the SWL-1.5 scenario.
Our simulations show that permafrost carbon inputs (Fig. 5a) do not follow the same trajectory as total permafrost region soil carbon inputs (Fig. 5b), especially under overshoot scenarios. Permafrost carbon inputs continue rising for some time after peak warming, whereas total permafrost region soil carbon inputs closely track the temperature trajectory (Fig. 3a). This partly stems from the unrealistic parameterization currently employed in the model. As noted in the model description (Sect. 2.1), litterfall is allocated to soil layers with temperatures above 1 °C according to an exponentially decreasing function of depth. When all soil layers are below 1 °C, organic carbon from the litterfall is added to the top soil layer. Meanwhile, permafrost carbon and usual soil carbon are both represented as depth-resolved carbon pools within the top 6 soil layers. The movement of permafrost carbon due to cryoturbation mixing is parameterized as being proportional to the gradient of total soil carbon with depth. Soil carbon that diffuses downward through the permafrost table is converted to permafrost carbon. During the cooling phase of overshoot scenarios, increased litterfall and a rising permafrost table lead to elevated carbon concentrations in surface soil layers, resulting in enhanced vertical diffusion and a surge in permafrost carbon inputs. Conversely, under the SSP5-8.5 scenario, permafrost carbon inputs exhibit only a minor peak around the 2150s, followed by a sharp decline (Figs. 5a and S3a). This is due to the continuous reduction in permafrost area and the deepening of the permafrost table, both of which reduce carbon concentrations in the upper soil layers and weaken vertical diffusion, despite the increasing litter flux under a strong CO2 fertilization background. We note that the approach adopted in the model may not accurately describe natural processes of vertical carbon movement, which are influenced by soil porosity heterogeneity, freeze-thaw cycles, and ice expansion upon freezing.
Total permafrost region soil carbon shows a strong tendency to recover after temperature overshoot (Fig. 3d). In contrast, total permafrost region soil carbon continues to decrease under temperature stabilization scenarios, but the rate of decrease is gradually slowing down. The total permafrost region soil carbon loss in the overshoot scenarios is significantly mitigated compared to stabilization scenarios at same global warming levels (Figs. 3d and S1d). By 2300, total permafrost region soil carbon losses under OS-2, OS-3, and OS-4 scenarios are projected to be 41 (15 to 72), 61 (29 to 98), and 81 (44 to 124) PgC, respectively, with reductions of 14 (8 to 21), 41 (25 to 57), and 62 (41 to 82) PgC compared to the SWL-2, SWL-3, and SWL-4 scenarios, respectively. During the stabilization phase in the overshoot scenarios, additional total permafrost region soil carbon losses compared to the SWL-1.5 scenario continue to decrease, but the total permafrost region soil carbon in the overshoot scenarios does not fully recover to the level under the SWL-1.5 scenario by 2300 (Figs. 4c and S2c). Notably, in all stabilization and overshoot scenarios simulated in this study, the permafrost region soil serves as a net cumulative carbon source for atmospheric CO2 by 2300. However, during the stabilization phase of OS-3 and OS-4, the permafrost region soil turns into a carbon sink, as soil carbon inputs surpass the reduced decomposition activity due to the depletion of soil carbon stocks and reduced warming levels. Total permafrost region soil carbon inputs primarily originate from processes related to vegetation litterfall, with their intensity influenced by warming levels and CO2 fertilization effects, while total permafrost region soil carbon decomposition is closely tied to global mean temperature. In the overshoot scenarios, the peak for total permafrost region soil carbon inputs occurs slightly later than the global mean temperature peak, whereas the peak for total permafrost region soil carbon decomposition happens marginally earlier than the global mean temperature peak (Figs. 5b, d and S3b, d).
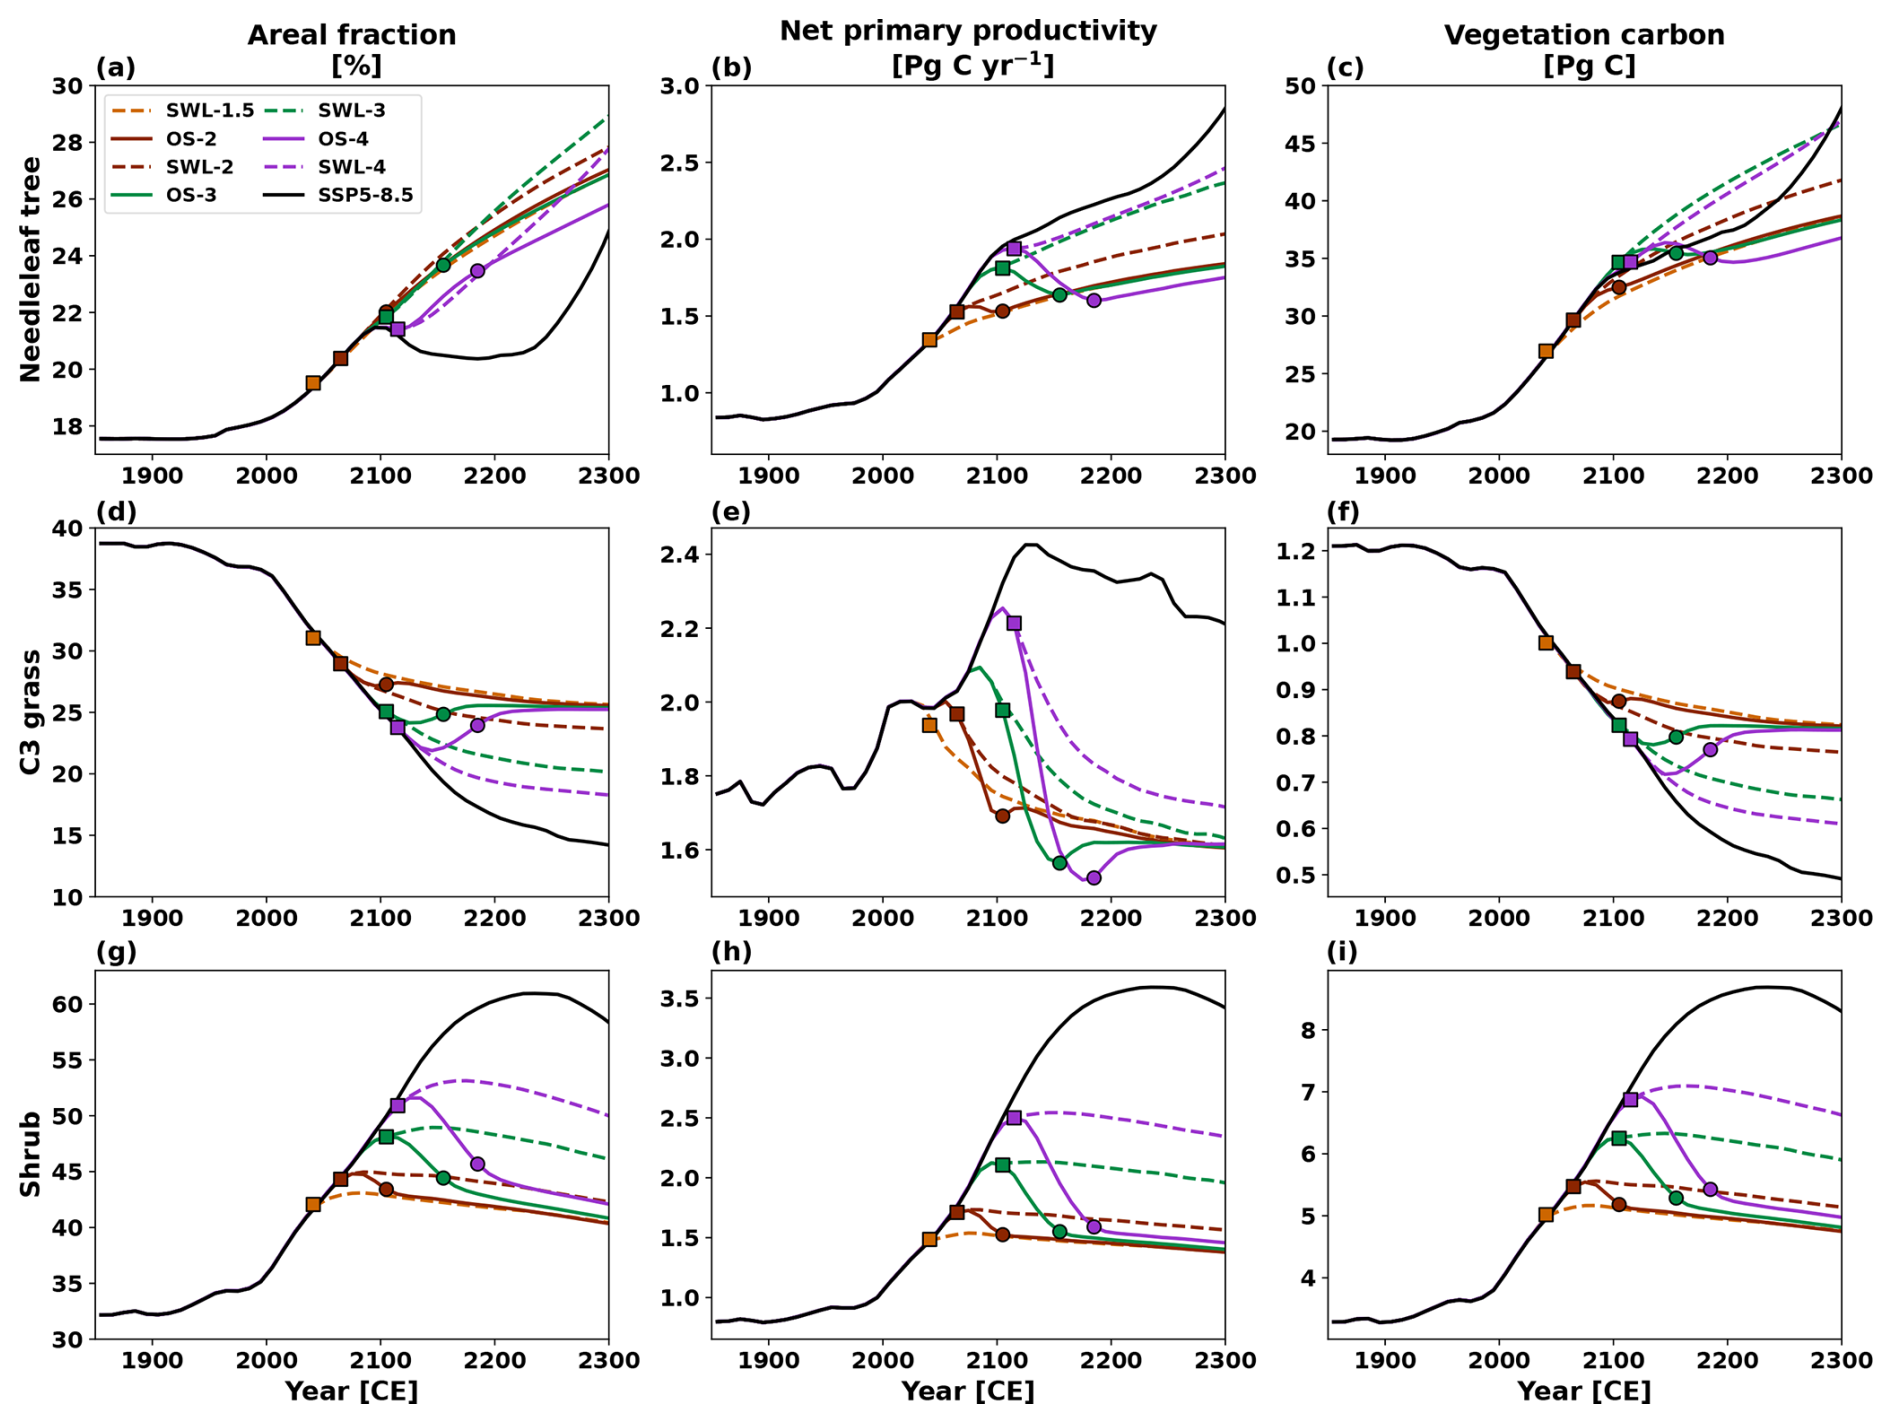
Figure 6Timeseries of annual mean areal fraction (left column; a, d, and g), net primary productivity (middle column; b, e, and h) and vegetation carbon (right column; c, f, and i) under stabilization (dashed lines) and overshoot (solid lines) scenarios for 1.5 °C (orange), 2.0 °C (brown), 3.0 °C (green), and 4.0 °C (purple) global warming levels, as well as the SSP5-8.5 scenario (black). Each row represents one of the three dominant plant functional type (PFT): (a–c) needleleaf tree, (d–f) C3 grass and (g–i) shrub. Square markers indicate the time points when the temperature overshoot reaches its peak or stabilized warming begins, while circle markers indicate when the overshoot returns to 1.5 °C. Results represent the ensemble median of 250 simulations based on the PFC simulations, and the shadings denote the 5th and 95th percentile uncertainty ranges. Notably, broadleaf trees and C4 grasses are not shown because their presence in the permafrost region is negligible.
The total permafrost region soil carbon inputs generally track the trajectory of litter flux across the same area, with an approximate delay of 10–20 years (not shown). To attribute the contribution of total permafrost region soil carbon inputs, we examined how dominant vegetation types (needleleaf tree, C3 grass and shrub) over the permafrost region adapt to temperature and atmospheric CO2 concentrations in both overshoot and stabilization scenarios (Fig. 6). Needleleaf trees expand slowly and continuously in the permafrost region in both overshoot and stabilization scenarios, whereas the expansion of shrubs closely follows the trajectory of global mean temperature. Upon 1.5 °C warming (projected for the 2040s relative to 1850–1900), trees and shrubs are projected to cover approximately 62 % of the area where permafrost carbon is non-zero, slightly higher than the 24 %–52 % range projected for 2050 using a statistical approach that links climate conditions to vegetation types under two distinct emission trajectories (Pearson et al., 2013). During the warming and cooling phases of overshoot scenarios, the expansion and reduction of shrubs correspond with the degradation and expansion of C3 grasses, respectively. Among the three dominant PFTs, only shrubs show a nearly reversible response in areal coverage, net primary productivity (NPP) and vegetation carbon with respect to global mean temperature under overshoot scenarios. In contrast, the continuous reduction of C3 grasses and the expansion of needleleaf trees suggest a degree of irreversibility in the structure and vegetation carbon density of northern high latitude terrestrial ecosystems under overshoot scenarios. Our results are in line with an earlier study by Tokarska and Zickfeld (2015), but contrast with Schwinger et al. (2022) who reported only minor differences in vegetation carbon after the overshoots compared to the reference simulation with no overshoot by prescribing vegetation distributions. In our study, the shifts in vegetation composition and changes in living biomass, especially those associated with woody vegetation, are key drivers of total permafrost region soil carbon inputs.
The uncertainty in total permafrost region soil carbon loss is nearly the same as that of permafrost carbon loss (Figs. 3c, d and S1c, d). For example, the 5th to 95th percentile range of total permafrost region soil carbon loss under the OS-2 and OS-4 scenarios is 58 and 81 PgC, respectively by 2300, compared to 52 and 72 PgC for permafrost carbon loss. This indicates that the uncertainty in total permafrost region soil carbon loss is largely driven by the uncertainty in permafrost carbon loss. Therefore, we evaluate the relative importance of perturbed permafrost carbon parameters on total permafrost region soil carbon loss under different temperature pathways through calculating their correlations across all ensemble simulations. The influence of model parameters on the uncertainty of permafrost carbon losses by 2300 is relatively consistent across the SSP5-8.5, OS-4, and SWL-4 scenarios, with the strongest correlations observed for the permafrost passive carbon pool transformation rate (R = 0.81–0.85), followed by the initial quantity of total permafrost region soil carbon (R = 0.55–0.61). This finding aligns with Ji et al. (2025), who highlights the critical role of these two parameters in the uncertainty of total permafrost region soil carbon loss under temperature overshoot and 1.5 °C warming stabilization scenarios.
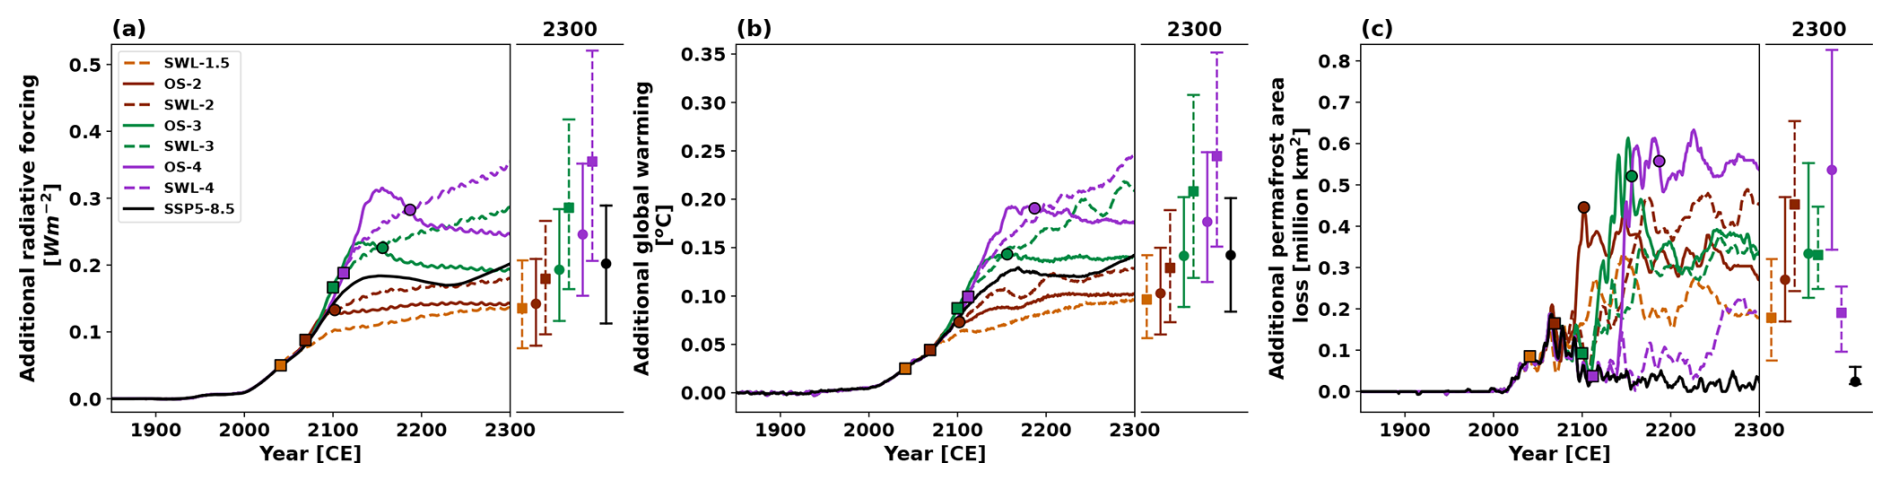
Figure 7Additional (a) radiative forcing, (b) global warming and (c) permafrost area loss due to permafrost carbon feedback, calculated as the difference between the PFC and NPFC simulations. Results are shown under stabilization (dashed lines) and overshoot (solid lines) scenarios for 1.5 °C (orange), 2.0 °C (brown), 3.0 °C (green), and 4.0 °C (purple) global warming levels, along with the SSP5-8.5 scenario (black). Square markers indicate the time points when the temperature overshoot reaches its peak or stabilized warming begins, while circle markers indicate when the overshoot returns to 1.5 °C. Results represent the ensemble median of 250 simulations. Dots on the adjacent right panels represent values in the year 2300, with uncertainty ranges estimated as the 5th to 95th percentiles. In panel (a), the additional radiative forcing is calculated using the simplified expressions (Etminan et al., 2016) based on simulated CO2 concentrations. In panel (c), the additional permafrost area loss is smoothed using a 5 year rolling average to eliminate interannual variability.
3.2 Radiative Impacts of Permafrost Carbon Loss
The permafrost carbon loss increases global mean radiative forcing and surface temperature. By comparing two parallel sets of simulations with the permafrost carbon module activated (PFC) or deactivated (NPFC), we were able to quantify the additional radiative forcing and warming caused by permafrost carbon loss. The time evolution of additional global warming closely resembles the additional radiative forcing (Figs. 7a, b and S4a, b) due to approximately linear relationship between radiative forcing and temperature change based on the energy balance of the climate system (Forster et al., 1997; Myhre et al., 2014). Both in the stabilization and overshoot scenarios, the magnitude of additional radiative forcing and warming increases with higher global warming levels. By 2300, the additional warming in the overshoot scenarios steadily rises from 0.10 (0.06 to 0.15) °C in OS-2 to 0.14 (0.09 to 0.20) °C in OS-3 and 0.18 (0.11 to 0.25) °C in OS-4. Similarly, in the stabilization scenarios, the additional warming increases from 0.10 (0.06 to 0.14) °C in SWL-1.5 to 0.13 (0.07 to 0.19) °C in SWL-2, 0.21 (0.12 to 0.31) °C in SWL-3, and 0.24 (0.15 to 0.35) °C in SWL-4. This is because higher global warming levels lead to more significant reductions in permafrost carbon and total permafrost region soil carbon, and further intensifying global warming. Furthermore, in the stabilization scenarios, the additional warming continues to increase over time due to delayed permafrost degradation and positive permafrost carbon feedback. In overshoot scenarios, the additional warming tends to stabilize once the temperature returns to 1.5 °C above pre-industrial levels. By 2300, the additional warming under SWL-2, SWL-3, and SWL-4 exceeds that of OS-2, OS-3, and OS-4 by 0.03 (0.01 to 0.04) °C, 0.07 (0.02 to 0.11) and 0.07 (0.03 to 0.10) °C, respectively, which is 22 % to 56 % higher than in the corresponding overshoot scenarios.
However, the additional warming during the cooling phase is most substantial in overshoot scenarios, and it is also significantly greater than that in stabilization scenarios over the same period. This is primarily due to the sustained reduction in atmospheric CO2 concentration during the cooling phase, which amplifies the radiative forcing caused by permafrost carbon loss. Specifically, because of the logarithmic relationship between CO2 concentration and radiative forcing (Etminan et al., 2016), the decline of background CO2 concentration to low levels causes the additional increases in CO2 concentration due to permafrost carbon loss to produce more significant changes in radiative forcing. Similarly, the global mean warming under the SSP5-8.5 scenario is 2.43 (2.41 to 2.44) °C higher than under the SWL-1.5 scenario by 2100, but the additional warming difference due to permafrost carbon loss is minimal at 0.01 (0 to 0.03) °C. Despite global mean warming reaching 8.20 (8.12 to 8.28) °C by 2300 in the SSP5-8.5 scenario, the additional warming is limited to 0.14 (0.08 to 0.20) °C due to the profoundly higher background CO2 concentration, the additional warming is only comparable to that of SWL-2 and OS-3 scenarios.
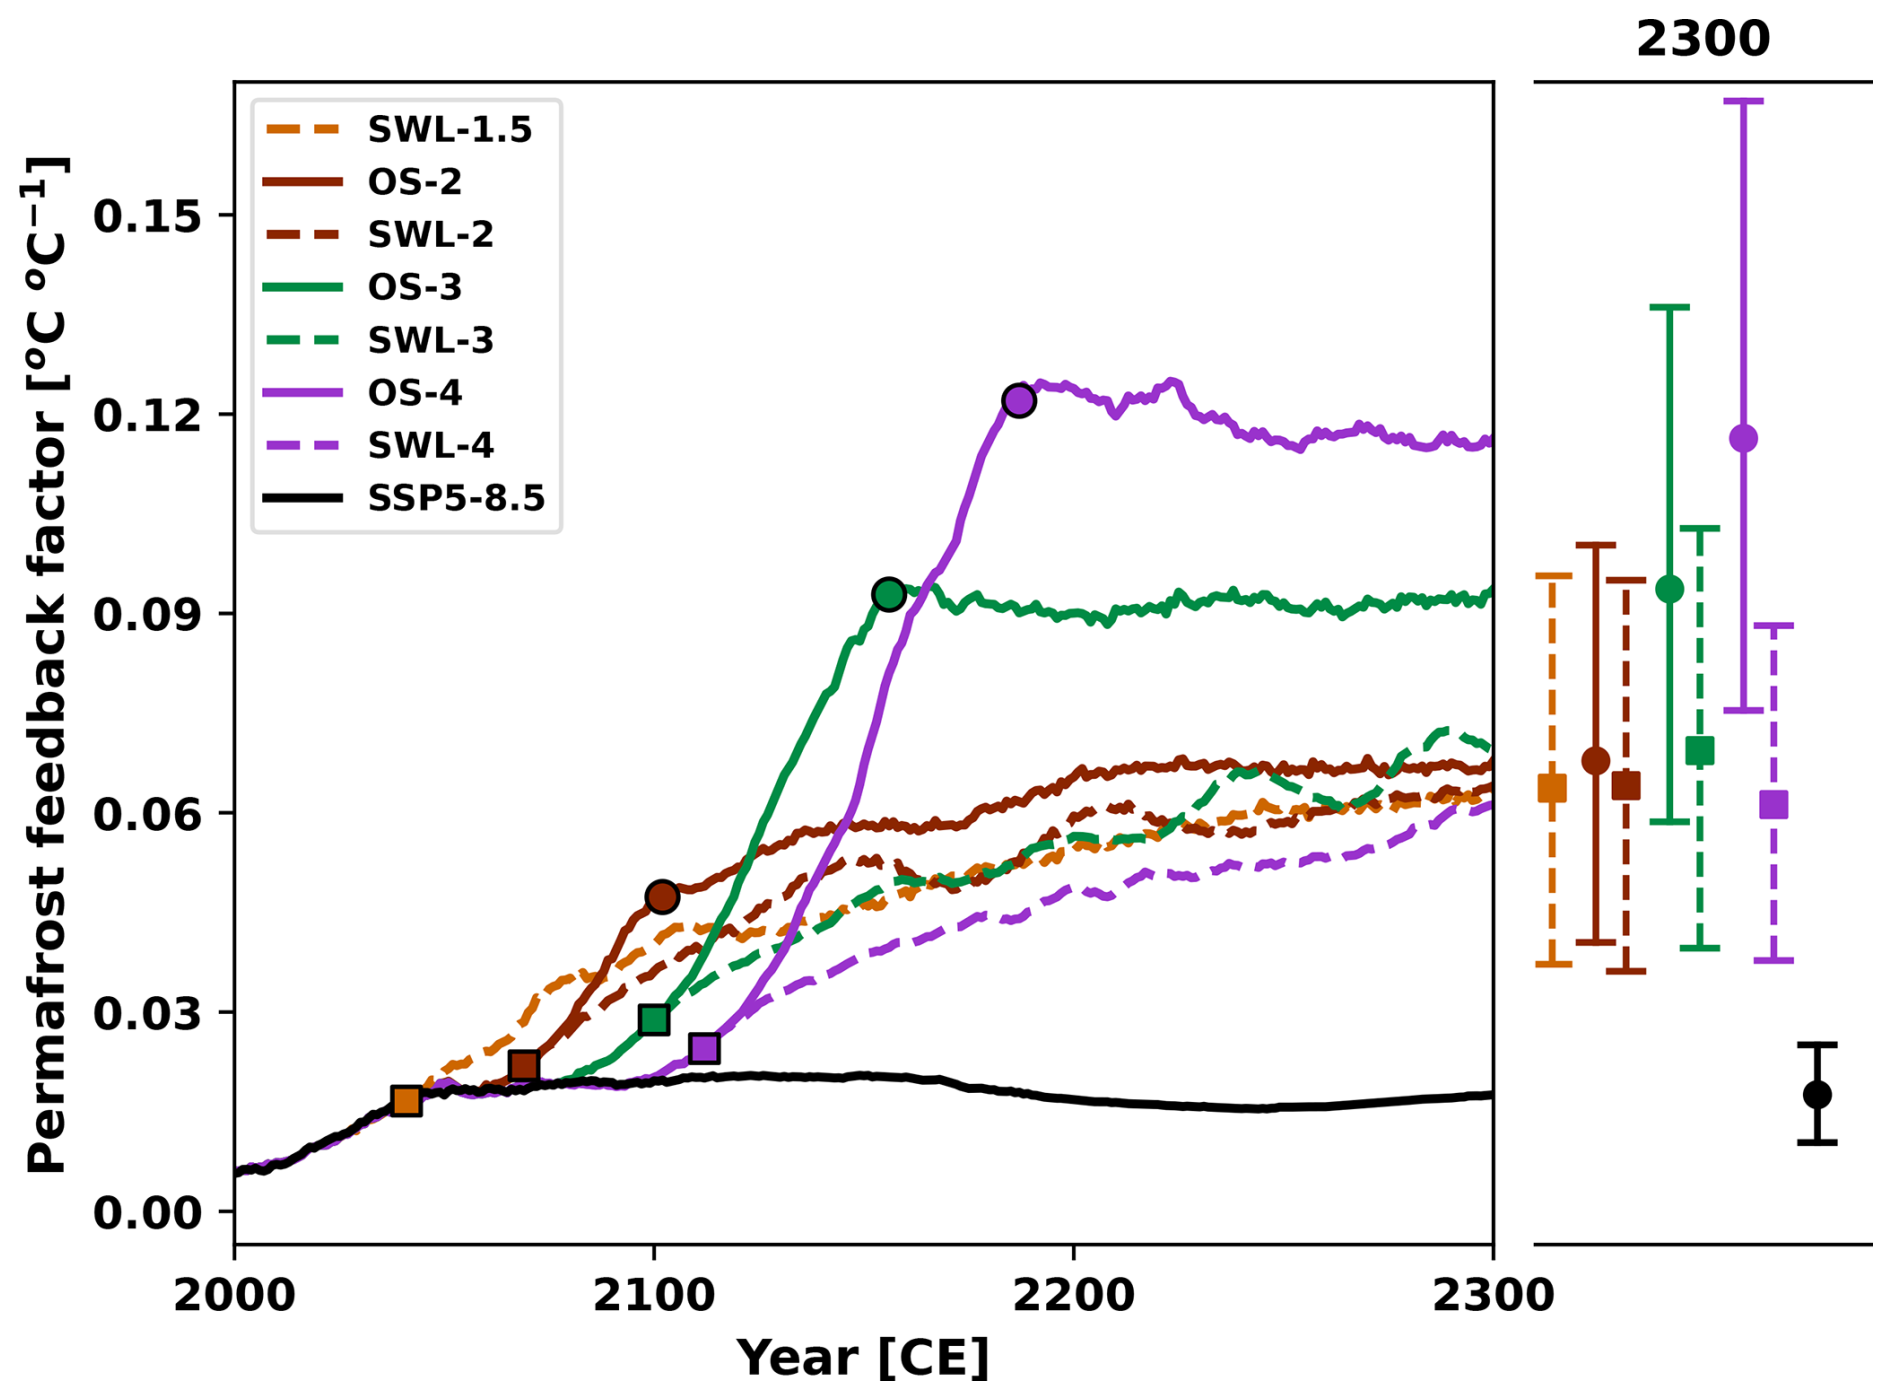
Figure 8Timeseries of permafrost feedback factor under stabilization (dashed lines) and overshoot (solid lines) scenarios for 1.5 °C (orange), 2.0 °C (brown), 3.0 °C (green), and 4.0 °C (purple) global warming levels, as well as the SSP5-8.5 scenario (black). Square markers indicate the time points when the temperature overshoot reaches its peak or stabilized warming begins, while circle markers indicate when the overshoot returns to 1.5 °C. Results represent the ensemble median of 250 simulations. Dots on the adjacent right panels represent values in the year 2300, with uncertainty ranges estimated as the 5th to 95th percentiles. The permafrost feedback factor is calculated as the ratio of additional global warming caused by the permafrost carbon feedback (i.e., the difference between the PFC and NPFC simulations) to the global mean temperature change in the NPFC simulations.
The additional warming caused by permafrost carbon loss can be utilized to assess whether the permafrost carbon feedback could be classified as a global tipping point process. This means it is not only positive but also sufficiently strong to sustain itself. To qualify, an initial rise in global mean temperature would need to trigger permafrost carbon emissions that result in a further increase in global mean temperature surpassing the initial warming. As a result, the positive permafrost carbon feedback would induce sufficient additional thawing to initiate a self-sustaining feedback loop (Nitzbon et al., 2024). We employed the permafrost feedback factor, which is defined as the ratio of the additional warming to the initial warming simulated with the permafrost carbon module deactivated, to determine if the permafrost carbon feedback can be considered as a global tipping process. In all perturbed parameter ensemble simulations for the stabilization, overshoot and SSP5-8.5 scenarios, the maximum permafrost feedback factor is 0.21 °C °C−1. By 2300, the permafrost feedback factor for the OS4 and SSP5-8.5 scenarios are estimated at 0.12 (0.08 to 0.17) and 0.02 0.01–0.03 °C °C−1, respectively. The permafrost feedback parameter is the highest under the OS4 scenario, while it is the lowest under the SSP5-8.5 scenario (Figs. 8 and S5). Interestingly, the feedback factors are quite similar across the stabilization scenarios, with values of 0.064 (0.037 to 0.096), 0.064 (0.036 to 0.095), 0.069 (0.040 to 0.103) and 0.061 (0.038 to 0.089) °C °C−1 for the SWL-1.5, SWL-2, SWL-3, and SWL-4 scenarios by 2300, respectively. Although the feedback factor in the overshoot scenarios is substantially larger than the recent estimate of 0.035 (0.004–0.110) °C °C−1 based on the Sixth Assessment Report of the Intergovernmental Panel on Climate Change (Nitzbon et al., 2024), our findings indicate that the positive permafrost carbon feedback is unlikely to result in enough additional thawing and corresponding carbon emissions to initiate a self-perpetuating tipping process. Since this study only models the gradual thawing of permafrost through the deepening of the active layer, we cannot rule out the possibility of tipping points associated with the abrupt thawing of talik development, thermokarst and thermo-erosion processes.
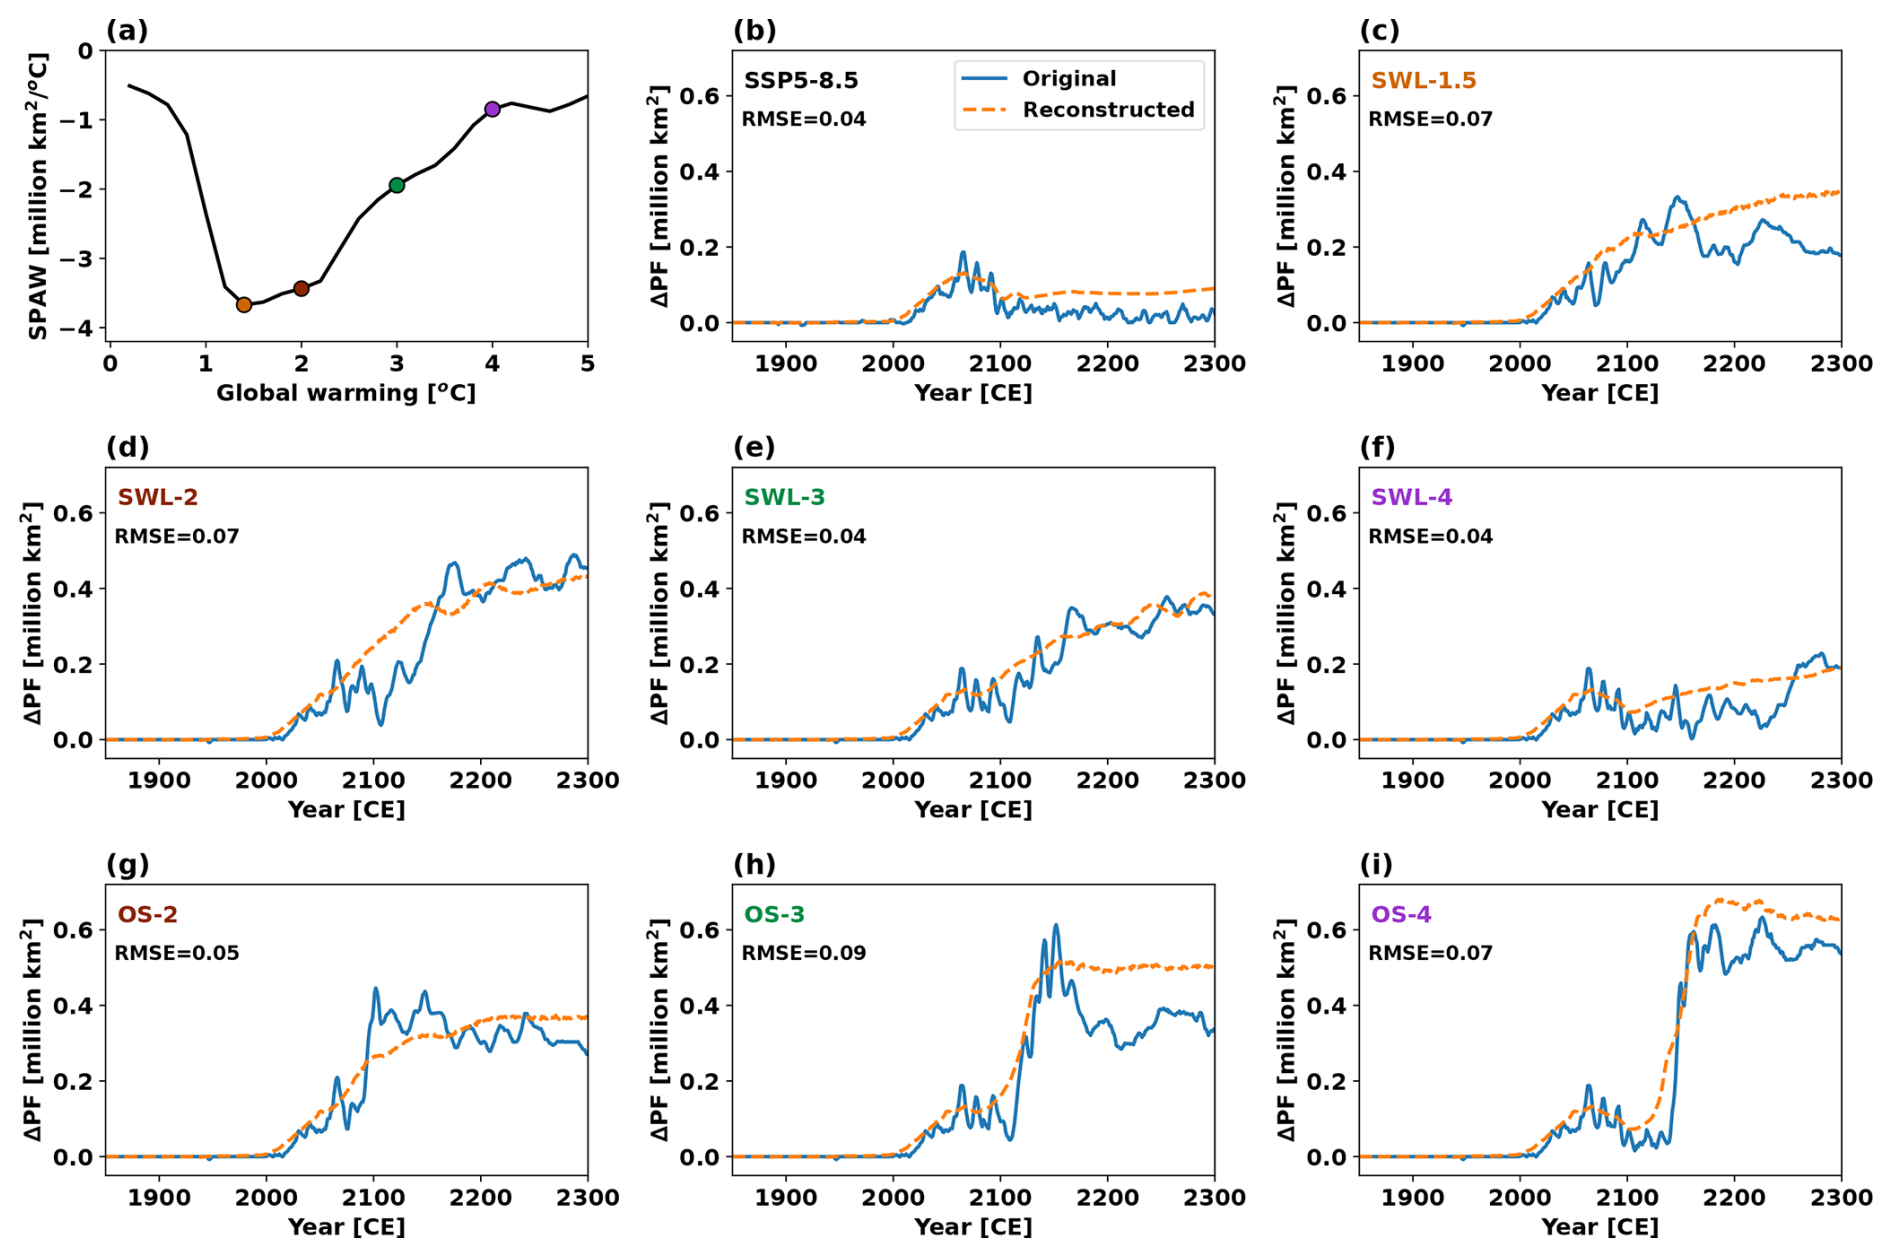
Figure 9(a) Relationship between SPAW and global warming derived from the SSP5-8.5 scenario based on the PFC simulations. Black curve represents SPAW calculated as the slope of a local regression (Cleveland, 1979; Cleveland and Devlin, 1988; Cleveland and Grosse, 1991) between changes in permafrost area and global mean temperature under the SSP5-8.5 scenario. Colored circle markers represent transient SPAW for 1.5 °C (orange), 2.0 °C (brown), 3.0 °C (green), and 4.0 °C (purple) global warming levels. (b-i) Time series of original (solid line) and reconstructed (dashed line) additional permafrost area loss (ΔPF) due to permafrost carbon feedback for each scenario. The constructed results are derived by multiplying the transient SPAW with the additional warming (Figs. 7b and S4b) under each scenario. Smaller RMSE values indicate higher reconstruction accuracy.
The permafrost carbon feedback also causes additional permafrost area loss under stabilization, overshoot and SSP5-8.5 scenarios. During the cooling phase of OS-2, OS-3, and OS-4, there is a significant additional permafrost area loss of 0.3 (0.1 to 0.4), 0.4 (0.2 to 0.6), and 0.5 (0.3 to 0.7) million km2, respectively (Figs. 7c and S4c), contributing 6 (2 to 8) %, 8 (4 to 12) % and 9 (5 to 12) % of total permafrost area loss by 2300. Although global warming has been identified as the primary driver of permafrost degradation (McGuire et al., 2016; Lawrence and Slater, 2005), the temporal evolution of additional permafrost area loss does not align with changes in the additional warming (Figs. 7b and S4b), particularly in the stabilization and SSP5-8.5 scenarios (Figs. 7c and S4c). To better understand this puzzle, we conducted sensitivity analysis based on the SSP5-8.5 scenario. The results show the sensitivity of permafrost area to global warming (SPAW, units of million km2 °C−1) is not constant. The maximal sensitivity occurs below a global warming level of 1.5 °C. The magnitude of SPAW decreases as global warming surpasses 1.5 °C (Fig. 9a), suggesting the response of permafrost area to rising temperature weakens and indicating a diminishing feedback effect. Interestingly, by multiplying transient SPAW by the additional warming, the temporal evolution of the additional permafrost area loss can be well reconstructed across various scenarios (Fig. 9b–i). The root mean square error (RMSE) between original and reconstructed additional permafrost area loss, ranging from 0.04 to 0.09 million km2, indicates high reconstruction accuracy.
Permafrost carbon feedback usually induces greater additional warming at higher global warming levels, but the lower SPAW diminishes its impact on permafrost area loss. Under the SSP5-8.5 scenario, the additional permafrost area loss peaks around the 2060s, reaching approximately 0.19 million km2, coinciding with a strong sensitivity of 3.4 million km2 °C−1. After this peak, despite continued rise in additional warming, the permafrost area loss declines notably due to the gradual weakening of SPAW. Similarly, in the stabilization scenario, SPAW decreases markedly at higher global warming levels, even as additional warming increases, preventing a positive correlation between the additional permafrost area loss and global warming levels (Figs. 7c and S4c). For example, the additional warming in the SWL-4 scenario reaches 0.24 (0.15 to 0.35) °C by 2300, nearly twice that of the SWL-2 scenario (0.13 (0.07 to 0.19) °C). However, due to its SPAW being only 0.8 million km2 °C−1, approximately one quarter of 3.4 million km2 °C−1 under SWL-2, the additional permafrost area loss under SWL-4 scenario is only 0.2 (0.1 to 0.3) million km2, significantly lower than 0.5 (0.2 to 0.7) million km2 under SWL-2. This suggests the maximal SPAW occurring near 1.5 and 2 °C global warming levels has significant implications for the Paris Agreement's targets of limiting global warming at the same levels.
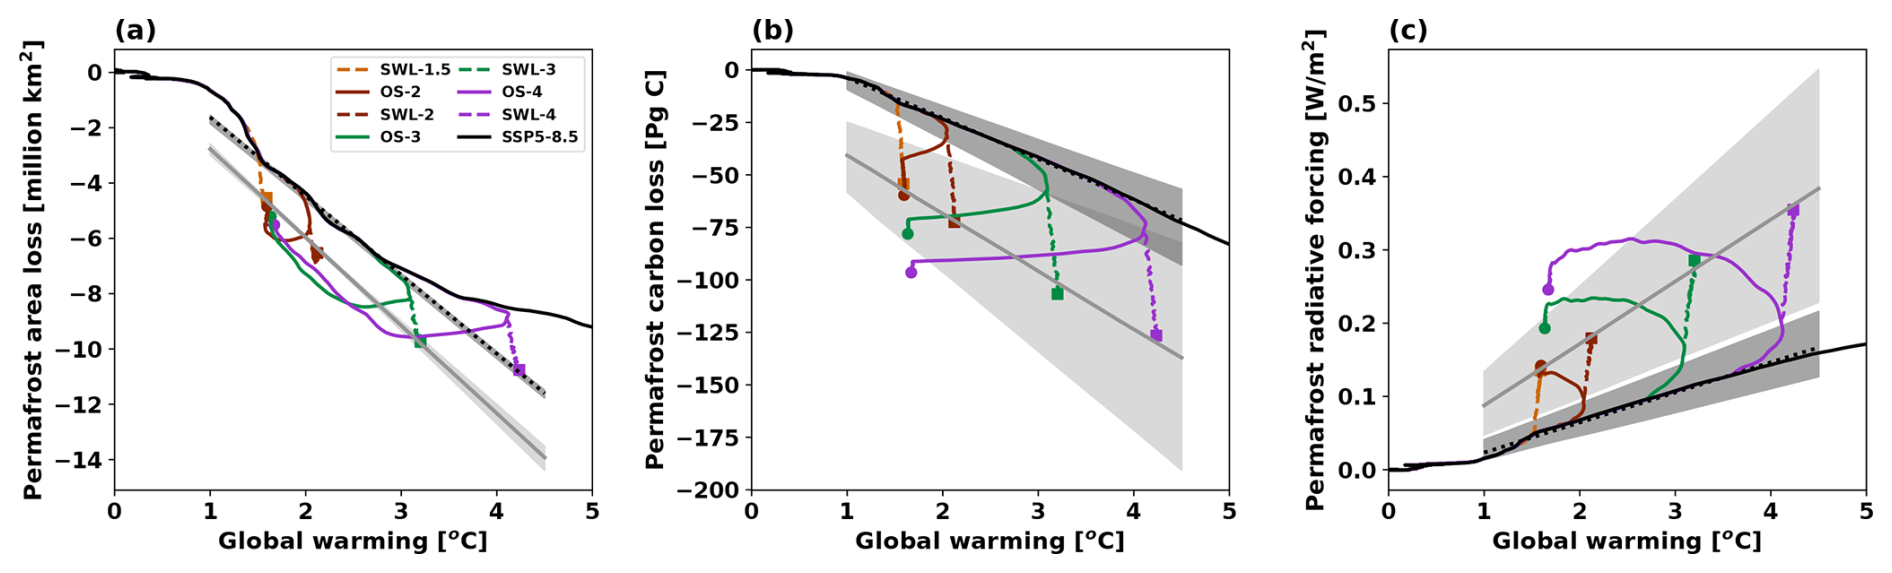
Figure 10Relationship between global warming levels and three permafrost metrics: (a) permafrost area loss, (b) permafrost carbon loss, and (c) permafrost radiative forcing in the stabilization (colored dashed lines) and overshoot (colored solid lines) scenarios for 1.5 °C (orange), 2.0 °C (brown), 3.0 °C (green), and 4.0 °C (purple) global warming levels, along with the SSP5-8.5 scenario (black). Square and circle markers indicate values in the year 2300 for the stabilization and overshoot scenarios, respectively. All results are based on the PFC simulations. Grey solid lines show linear fits of permafrost metrics to global warming levels in stabilization scenarios by 2300, while black dashed lines show corresponding fits for the SSP5-8.5 scenario. Note that in panel (a), both the stabilization scenarios and the corresponding SSP5-8.5 points included in the linear fit are limited to global warming levels between 1.5 and 3.0 °C, whereas in panels (b) and (c), the fits include points with global warming levels ranging from 1.5 to 4.0 °C. For stabilization scenarios, only the results from the year 2300 are used for fitting, while for the SSP5-8.5 scenario, all results within the specified global warming level ranges are used for fitting. Shaded regions represent the 5th to 95th percentile ranges across 250 ensemble simulations.
3.3 Linearity of Permafrost Response and Feedback
After exploring the response and feedback of permafrost under temperature stabilization and overshoot scenarios at various global warming levels, it is natural to question the linearity of these responses and feedbacks as functions of global warming levels. Our results show that the responses of permafrost area, permafrost carbon feedback and associated radiative forcing to a broad range of global warming are nearly linear (Fig. 10). The permafrost area change exhibits a strongly nonlinear relationship with global warming below 1.5 °C level, then a quasilinear relation between them in the global warming ranges from 1.5 to 3 °C. Above 3 °C global warming, the sensitivity of permafrost area to global warming decreases nonlinearly, and it is evident in both stabilization and SSP5-8.5 scenarios (Fig. 10a). In contrast, permafrost carbon loss and associated radiative forcing exhibit a nearly linear response to increasing global warming levels, especially above 1 °C, for both stabilization and SSP5-8.5 scenarios (Fig. 10b and c).
Meanwhile, the sensitivities of permafrost area, permafrost carbon loss, and associated radiative forcing to global warming under stabilization scenarios are all stronger than those under the SSP5-8.5 scenario. Specifically, based on the simulated permafrost area in the year 2300 under stabilization scenarios with global warming levels between 1.5 and 3 °C, the sensitivity of permafrost area to global warming is −3.19 (−3.01 to −3.36) million km2 °C−1. In comparison, a linear fit of permafrost area change against global warming levels over the same temperature range in the SSP5-8.5 scenario yields a sensitivity of −2.85 (−2.77 to −2.89) million km2 °C−1. Similarly, the permafrost carbon feedback per degree of global warming derived from a linear fit based on the total permafrost carbon loss in the year 2300 under stabilization scenarios, is −27.6 (−16.5 to −38.2) Pg C°C−1. In contrast, the corresponding value under the SSP5-8.5 scenario, estimated from a linear fit over the 1.5 to 4.0 °C warming range, is −19.3 (−15.7 to −24.1) Pg C°C−1. Applying the same approach, the associated radiative forcing per degree of global warming is estimated to be 0.08 (0.05 to 0.12) for the stabilization scenarios and 0.04 (0.03 to 0.05) for the SSP5-8.5. These differences between the stabilization and SSP5-8.5 scenarios are mainly attributable to the differing response time scales represented by the two scenarios: SSP5-8.5 reflects a typical transient response, while the stabilization scenarios maintain stabilized temperatures over extended periods and thus approximate a quasi-equilibrium response of the climate-carbon system. Furthermore, the smaller sensitivity of permafrost radiative forcing per degree of global warming under the SSP5-8.5 can be partially attributed to its higher background atmospheric CO2 concentration compared to the stabilization scenarios. The same amount of CO2 emissions would produce smaller additional radiative forcing under a higher background atmospheric CO2 concentration, due to the logarithmic relationship between CO2 concentration and radiative forcing (Etminan et al., 2016).
To a certain extent, our findings align with those of Nitzbon et al. (2024), who suggested that the accumulated response of Arctic permafrost to climate warming is approximately quasilinear. Nitzbon et al. (2024) reported a quasilinear decrease in the equilibrium permafrost extent to global warming, with a rate of approximately 3.5 million km2 °C−1. This quasilinear relation holds for global warming ranges from 0 to 4 °C, derived from the empirical relationship between the local permafrost fraction and the annual mean global temperature. However, when applying a local regression method across the full SSP5-8.5 trajectory (Fig. 9a), we find that the quasilinear relationship only holds between 1.5 and 2 °C. In contrast, when applying a simple linear regression, a quasilinear behavior still holds over the 1.5 to 3 °C warming range (Fig. 10a). Furthermore, the permafrost carbon feedback and the associated radiative forcing per degree of warming, as derived from our simulations of both stabilization and SSP5-8.5 scenarios, are within the ranges of −18 (−3.1 to −41) Pg C°C−1 and 0.09 (0.02 to 0.20) , respectively, reported by Canadell et al. (2021). Our estimates also align with the estimated range of equilibrium sensitivity of permafrost carbon decline to global warming, which is −21 (−4 to −48) Pg C°C−1 (Nitzbon et al., 2024). This may represent an upper bound on the permafrost carbon feedback per degree of global warming, as the estimate reflects the maximum amount of carbon that could be lost from frozen soils.
Under overshoot scenarios, permafrost area responds nearly reversibly and presents an almost closed loop (Fig. 10a). In contrast, permafrost carbon loss exhibits an open loop with respect to global warming levels. In other words, permafrost carbon loss does not reverse as temperatures decline, indicating irreversible permafrost carbon radiative forcing. Among the three metrics investigated here, only permafrost area exhibits strong reversibility under the overshoot scenarios. This also explains why, in Fig. 9a, the permafrost area sensitivity derived from the SSP5-8.5 scenario, when multiplied by additional warming, can reasonably reconstruct permafrost area loss in the stabilization and overshoot cases.
This study utilizes the intermediate-complexity Earth system model UVic ESCM v2.10 and perturbed parameter ensemble modelling approach to study the response and feedback of permafrost under temperature stabilization and overshoot scenarios across different global warming levels. The UVic ESCM v2.10 has been validated against observational and reconstructed datasets, demonstrating its ability to reproduce observation-based permafrost area and permafrost carbon stocks for the present day. In addition to presenting the changes in permafrost area, permafrost carbon, and total permafrost region soil carbon under various warming trajectories, this study also quantifies the additional radiative forcing, global warming, and permafrost area loss induced by permafrost carbon loss and suggests that permafrost carbon feedback is unlikely to initiate a self-perpetuating global tipping process under both stabilization and overshoot scenarios. In addition, this study reveals quasilinear responses of permafrost area, permafrost carbon, and associated radiative forcing over a broad range of global temperature change, providing insights into the implications of permafrost carbon feedback for long-term climate change and mitigation strategies.
Reductions in permafrost area and carbon exhibit a strong correlation with global warming for both stabilization and overshoot scenarios. In stabilization scenarios, lower global warming levels effectively mitigate permafrost degradation compared to the SSP5-8.5 scenario, whereas higher global warming levels lead to substantial permafrost degradation due to cumulative warming effects. In overshoot scenarios, permafrost area largely recovers as global warming returns to 1.5 °C levels, though this recovery is delayed by hysteresis effects, with degradation persisting for decades after temperature peaks. Permafrost carbon declines under both stabilization and overshoot scenarios, driven by the dynamic balance between soil carbon inputs and decomposition. The overshoot scenarios partially mitigate permafrost carbon losses compared to the stabilization scenarios at the same global warming levels. Significant carbon losses persist during the cooling and stabilization phases of overshoot scenarios, highlighting the essentially irreversible nature of this process. Total permafrost region soil carbon exhibits a certain degree of recovery under the overshoot scenarios. In fact, soil in these regions even transitions into a carbon sink during the stabilization phase of the overshoot scenarios with high global warming levels, supported by reduced decomposition rates and sustained inputs from vegetation litterfall. However, the higher the overshoot levels, the less recovery there is. These findings underscore the critical role of temporary temperature overshooting levels in affecting long-term permafrost carbon loss and recovery potential.
The responses of permafrost area, permafrost carbon, and associated radiative forcing to a broad range of global warming are nearly linear. The permafrost area and global mean temperature exhibit a quasilinear relation for the global warming ranges from 1.5 to 3 °C in both the stabilization and SSP5-8.5 scenarios. The permafrost carbon loss and associated radiative forcing exhibit a quasilinear relation to global warming ranges from 1 to 4 °C under the stabilization and SSP5-8.5 scenarios. The sensitivity of permafrost area to global warming derived from the stabilization and SSP5-8.5 scenarios is substantially higher than the estimates obtained using the Stefan solution (Peng et al., 2023), but our result is close to that derived from an observation-constrained equilibrium projection, approximately 3.5 million km2 °C−1 (Nitzbon et al., 2024) (See Fig. 9a). Nitzbon et al. (2024) noted that permafrost area decreases quasi-linearly with increasing global mean temperature. However, we found that this relationship holds most strongly within 1.5 to 3 °C global warming range when using a linear regression approach (Fig. 10a). According to the SSP5-8.5 simulations, the sensitivity of permafrost area to global warming reaches its peak below 1.5 °C global warming. It then decreases to a relatively stable level between 1.5 and 3 °C warming levels, and continues to decline beyond the 3 °C warming level. This is in line with Comyn-Platt et al. (2018), who found the feedback processes due to permafrost thaw respond more quickly at temperatures below 1.5 °C. The maximal sensitivity occurring just below 1.5 °C global warming level suggests the fastest permafrost degradation is anticipated to take place within Paris Agreement's warming levels. Our findings have significant implications for the development of mitigation and adaptation strategies addressing permafrost-thaw impacts consistent with keeping global warming at the Paris Agreement's levels.
Our study highlights the substantial permafrost carbon feedback during the cooling phase of overshoot scenarios. Permafrost carbon loss evidently increases global radiative forcing and amplifies global warming. The permafrost carbon feedback can be more profound in temperature stabilization and overshoot scenarios than in high-emissions scenarios. In stabilization scenarios, additional radiative forcing and warming from permafrost carbon loss continue to rise after temperature stabilizes, driven by delayed permafrost thaw and the resulting positive permafrost carbon feedback. In overshoot scenarios, additional warming almost stabilizes once global warming drops to 1.5 °C levels. During the cooling phase of overshoot scenarios, lower background CO2 concentrations amplify the warming effect of permafrost carbon loss. In contrast, under the high-emissions SSP5-8.5 scenario, the additional warming is limited due to higher background CO2 levels reducing the additional radiative forcing from permafrost carbon loss. The additional permafrost area loss due to permafrost carbon feedback is around 5 (2 to 11) % of the total loss by 2300 in the stabilization and overshoot scenarios. This additional permafrost area loss can be well explained by the sensitivity of permafrost area to global warming and the magnitude of additional warming. The complex interactions between global warming and permafrost degradation emphasize the importance of accounting for these nonlinear effects in climate projections, particularly at 1.5–2 °C global warming levels.
Our results show incomplete recovery of permafrost area under the overshoot scenarios, which is influenced by multiple factors: First, the additional permafrost carbon loss leads to greater additional warming under the overshoot scenarios than the SWL-1.5 scenario, causing additional permafrost degradation. Second, the thermal inertia of deep soil layers limits the rate of permafrost recovery. Even after global mean temperatures return to the 1.5 °C target, residual heat accumulated in deeper soil layers during temperature overshoot period continues to inhibit permafrost refreezing, preventing full restoration to its pre-overshoot state. Third, substantially greater soil carbon loss under overshoot scenarios than in the SWL-1.5 scenario alters the hydrological and thermal properties of soil, affecting the processes that govern carbon cycling (Zhu et al., 2019; Avis, 2012; Lawrence and Slater, 2008), which in turn affects the recovery of permafrost area. Moreover, irreversible shifts in vegetation composition of high-latitude terrestrial ecosystems also contribute to the incomplete recovery of permafrost area under overshoot scenarios. For instance, among the two dominant vegetation types, needleleaf trees continue to expand while C3 grasses decline, even after global temperatures return to the 1.5 °C warming level. These irreversible changes may stabilize the carbon, water, and energy cycles over the permafrost region at different equilibria after overshoot, through the interactions between physical and biophysical processes (de Vrese and Brovkin, 2021), thereby constraining the ability of permafrost to fully recover under the overshoot scenarios.
Although permafrost carbon loss is essentially irreversible, overshoot scenarios exhibit a certain degree of recovery relative to the SWL-1.5 stabilization scenario (Figs. 4b and S2b). It is therefore scientifically interesting to know whether permafrost carbon under overshoot scenarios will eventually converge with that under SWL-1.5. Our results show that permafrost carbon inputs are consistently higher under overshoot scenarios than under SWL-1.5, while permafrost carbon decomposition differ only slightly between the two (Figs. 5a, c and S3a, c). This tends to suggest that the smaller permafrost carbon stocks under overshoot scenarios by 2300 would eventually catch up to the levels under SWL-1.5. To assess this potential convergence, we extended our simulations of both SWL-1.5 and overshoot scenarios to the year 2400 (data not shown). Then we estimated the convergence time by calculating the ratio between the difference in permafrost carbon stocks and the difference in net permafrost carbon inputs (i.e., annual permafrost carbon inputs minus decomposition) for the overshoot scenarios relative to the SWL-1.5 scenario. Based on simulation results for the year 2300, the median estimated convergence times for OS-2, OS-3 and OS-4 are 1076, 1008 and 1433 years, respectively. When using results from the year 2400, the corresponding estimates increase to 1377, 1199 and 1568 years. This means that convergence would take even longer if estimated from later simulation results, mainly due to gradually weakened permafrost carbon inputs. The relatively larger permafrost carbon inputs under overshoot scenarios result mainly from increased litterfall during the overshoot phase. The extra litterfall during the overshoot phase gradually moves through the active layer and is transported to the permafrost zone. Over time, however, the effect of this extra litterfall gradually diminishes. Consequently, it may take extremely long timescales for the overshoot scenarios to fully converge with SWL-1.5 in terms of permafrost carbon stocks. In addition, due to incomplete recovery of permafrost area and persistent changes in surface climate and soil properties, the overshoot scenarios might ultimately fail to converge to SWL-1.5 scenario in terms of permafrost carbon stocks.
Different permafrost carbon loss and associated additional warming under overshoot scenarios confirm the path-dependent fate of permafrost region soil carbon (Kleinen and Brovkin, 2018) and the path-dependent reductions in CO2 emission budgets (MacDougall et al., 2015; Gasser et al., 2018). Since the permafrost carbon has accumulated very slowly during the last few tens of thousands of years, its loss would contribute to atmospheric CO2 burdens, and the resulting additional warming poses a challenge to achieving global climate goals by substantially reducing the remaining carbon budget compatible with the Paris Agreement (MacDougall et al., 2015; Natali et al., 2021). In the overshoot scenarios simulated in this study, permafrost carbon loss by 2300 ranges from 60 (35 to 87) to 97 (63 to 135) PgC. The resulting additional warming from the permafrost carbon loss ranges from 0.10 (0.06 to 0.15) to 0.18 (0.11 to 0.25) °C. This permafrost carbon feedback contributes a substantial addition on top of 1.5 °C warming target under overshoot scenarios, and the magnitude of this additional warming rises with the amplitude of overshoot. To accomplish the 1.5 °C target under the OS-2, OS-3, and OS-4 scenarios, anthropogenic carbon emissions would need to be reduced by amounts equivalent to the permafrost carbon loss. The proportion of carbon removal required to offset permafrost emissions corresponds to 27 (16 to 39) % under OS-2, 10 (6 to 15) % under OS-3, and 7 (4 to 9) % under OS-4, relative to the cumulative carbon removal from the peak warming to the 1.5 °C target sustained until 2300. Our findings are consistent with previous research utilizing the Monte Carlo ensemble method to evaluate the response of permafrost carbon and its influence on CO2 emission budgets under overshoot scenarios targeting a 1.5 °C warming limit (Gasser et al., 2018). Specifically, for overshoot amplitudes of 0.5 °C (peak warming of 2 and 1 °C (peak warming of 2.5 °C), the reductions in anthropogenic CO2 emissions due to permafrost are estimated to be 130 (with a range of 30–300) Pg CO2 and 210 (with a range of 50–430) Pg CO2, respectively, to meet the long-term 1.5 °C target (Gasser et al., 2018). These results are comparable to our estimates of 60 (35 to 87) PgC under OS-2 and 78 (50 to 111) PgC under OS-3. The differences between the two studies can be partly attributed to different warming trajectories to achieve the same 1.5 °C target. Our study further confirms that deploying negative CO2 emissions to reverse anthropogenic warming would be undermined by substantial post-peak warming arising from permafrost carbon loss, thereby diminishing their overall effectiveness (MacDougall, 2013; Tokarska and Zickfeld, 2015).
This study does not simulate the changes of deep Yedoma carbon under the temperature stabilization and overshoot scenarios. Yedoma deposits represent a significant deep carbon reservoir and are widespread across Siberia, Alaska, and the Yukon region of Canada, having primarily formed during the late Pleistocene, especially in the late glacial period. These deep, perennially frozen sediments are particularly ice-rich, and the freeze-locked organic matter in such deposits can be re-mobilized on short time-scales, representing one of the most vulnerable permafrost carbon pools under future warming scenarios (Schuur et al., 2015; Strauss et al., 2017). According to Zimov et al. (2006), these perennially frozen Yedoma sediments cover more than 1 million km2, with an average depth of approximately 25 m. Recent estimates place the organic carbon stock in Yedoma deposits at 213 ± 24 PgC, constituting a significant portion of the total permafrost carbon stocks (Strauss et al., 2017). However, the UVic ESCM v2.10 utilized in this study simulates permafrost carbon only within the top 3.35 m of soil, limiting our ability to directly assess the impacts of temperature overshoot on deep Yedoma carbon. Considering their ice-rich nature and potential susceptibility to rapid-thaw processes, we analyzed the average and maximum active layer thickness (ALT) in Yedoma regions (Strauss et al., 2021, 2022) under the simulated scenarios to approximate potential impacts. We find that the average ALT in Yedoma regions remains below 1 m in all stabilization and overshoot scenarios, while the maximum ALT rarely exceeds 3.35 m in overshoot scenarios but does exceed this depth in some stabilization scenarios. However, in all scenarios, the maximum ALT does not exceed 6 m, which is relatively shallow compared to the average depth (∼ 25 m) of Yedoma deposits (Fig. S6). Consequently, the impact on Yedoma is expected to be minimal in all scenarios, and the effect of overshoot scenarios on the deep Yedoma carbon is relatively minor compared to stabilization scenarios as well.
This study, like previous ones, uncovers considerable uncertainty in projections of permafrost carbon under global warming. The uncertainty represented by perturbed model parameters for each scenario can be interpreted as model uncertainty. We note that model uncertainty in permafrost carbon loss gradually increases with the peak warming level and the duration of overshoot for each scenario (Figs. 3c and S1c). However, the uncertainty ranges in permafrost carbon loss substantially overlap for overshoot and stabilization scenarios with adjacent warming levels, such as OS-2, SWL-1.5 and SWL-2. This is especially evident in low-level warming scenarios, where the uncertainty in projected permafrost carbon loss is mainly driven by model uncertainty due to parameter perturbations, rather than scenario-related uncertainty. Given the significant roles of the permafrost passive carbon pool transformation rate and the initial quantity of total permafrost region soil carbon in determining the uncertainty of total permafrost region soil carbon loss, it is expected that these two parameters contribute significantly to the overlapping uncertainty ranges of permafrost carbon and total permafrost region soil carbon losses across different warming levels. Due to the interaction with soil carbon inputs, the overlapping uncertainty in total permafrost region soil carbon loss tends to differ from that of permafrost carbon loss. For example, the uncertainty ranges in permafrost carbon loss under OS-4 and SSP5-8.5 scenarios show considerable overlap, but the same does not apply to total permafrost region soil carbon loss, which results from significant differences in soil carbon inputs under distinct CO2 fertilization backgrounds. The large overlapping uncertainty in projecting permafrost carbon loss under low-level warming scenarios, as shown in this study and in previous research (MacDougall et al., 2015; MacDougall and Knutti, 2016; Gasser et al., 2018), constitutes a significant challenge in accurately estimating the remaining carbon budgets consistent with temperature goals of the Paris Agreement.
This study aims to serve as a meaningful supplement to the limited existing research on permafrost response and feedback under temperature stabilization and overshoot scenarios. For example, CMIP6 includes only one overshoot scenario (SSP5-3.4-OS), which is insufficient for comprehensively analyzing the potential contribution of permafrost feedback under different global warming levels (Melnikova et al., 2021). The upcoming CMIP7 is planned to encompass a broader range of overshoot scenarios, from very low to medium and high overshoot scenarios. This expansion aims to delve into the potential for climate restoration, the feasibility of achieving Paris Agreement targets, and the risks of irreversibility and hysteresis in the slower components of the Earth system from beyond 2125 to 2300 (van Vuuren et al., 2025; Sanderson et al., 2024). Our study investigated the permafrost response and feedback under overshoot scenarios with varying levels of warming, which can be used for comparative analysis of the upcoming CMIP7 multi-model results. Additionally, research on permafrost changes under different climate stabilization scenarios is also limited. Some of existing studies are based on equilibrium permafrost models (e.g. Liu et al., 2021), which do not consider transient effects and cannot predict the timing of permafrost loss based on imposed warming scenarios (Smith et al., 2022). Our study utilizes a process-based model and provides insights into the relationship between permafrost degradation and global warming.
This study demonstrates a method to quantify the permafrost carbon feedback under specified global warming levels and warming trajectories with a fully coupled Earth system model driven by specified CO2 emission pathways. As permafrost carbon feedback is highly sensitive to permafrost states and processes, controlling global warming level or warming trajectory is beneficial to isolate individual contributions from physical climate and carbon cycle processes. Due to tight link between terrestrial carbon feedback and physical climate feedback, Goodwin (2019) found around half the uncertainty in derived terrestrial carbon feedback originates from uncertainty in the physical climate feedback. Therefore, controlling global warming level or warming trajectory is helpful to accurately assess a specific aspect of terrestrial carbon feedback by isolating the uncertainty from the physical climate feedback. We encourage the exploration of potential application for this method in quantifying other aspects of carbon-climate feedbacks. The findings of this study are based on a single Earth system model, and it motivates further studies aimed at comprehensively understanding of permafrost response and feedback.
The source code of the UVic ESCM version 2.10 can be downloaded from http://terra.seos.uvic.ca/model/2.10/ (last access: 18 October 2025). All simulation data utilized in this study are publicly accessible and can be obtained from https://doi.org/10.5281/zenodo.15148252 (Cui, 2024).
The supplement related to this article is available online at https://doi.org/10.5194/esd-16-1809-2025-supplement.
DJ designed the research and set up the simulation. MC conducted the simulation and interpreted the data. MC and DJ wrote the initial manuscript. DJ, MC and YC revised the manuscript.
The contact author has declared that none of the authors has any competing interests.
Publisher's note: Copernicus Publications remains neutral with regard to jurisdictional claims made in the text, published maps, institutional affiliations, or any other geographical representation in this paper. While Copernicus Publications makes every effort to include appropriate place names, the final responsibility lies with the authors. Views expressed in the text are those of the authors and do not necessarily reflect the views of the publisher.
The authors would like to thank the editor and two anonymous referees for their insightful and constructive comments, which have significantly improved the quality of this study. The authors would like to express their gratitude to the Super Computing Center of Beijing Normal University and the National Key Scientific and Technological Infrastructure project “Earth System Numerical Simulation Facility” (EarthLab) for providing the necessary computing resources.
This research has been supported by the National Natural Science Foundation of China (grant no. 41875126).
This paper was edited by Vivek Arora and reviewed by two anonymous referees.
Anderson, K., Buck, H. J., Fuhr, L., Geden, O., Peters, G. P., and Tamme, E.: Controversies of carbon dioxide removal, Nat. Rev. Earth Environ., 4, 808–814, https://doi.org/10.1038/s43017-023-00493-y, 2023.
Armstrong McKay, D. I., Staal, A., Abrams, J. F., Winkelmann, R., Sakschewski, B., Loriani, S., Fetzer, I., Cornell, S. E., Rockström, J., and Lenton, T. M.: Exceeding 1.5 °C global warming could trigger multiple climate tipping points, Science, 377, eabn7950, https://doi.org/10.1126/science.abn7950, 2022.
Avis, C. A.: Simulating the present-day and future distribution of permafrost in the UVic Earth system climate model, PhD thesis, University of Victoria, 2012.
Avis, C. A., Weaver, A. J., and Meissner, K. J.: Reduction in areal extent of high-latitude wetlands in response to permafrost thaw, Nat. Geosci., 4, 444–448, https://doi.org/10.1038/ngeo1160, 2011.
Boucher, O., Halloran, P. R., Burke, E. J., Doutriaux-Boucher, M., Jones, C. D., Lowe, J., Ringer, M. A., Robertson, E., and Wu, P.: Reversibility in an Earth System model in response to CO2 concentration changes, Environ. Res. Lett., 7, 024013, https://doi.org/10.1088/1748-9326/7/2/024013, 2012.
Canadell, J. G., Monteiro, P. M. S., Costa, M. H., Cotrim da Cunha, L., Cox, P. M., Eliseev, A. V., Henson, S., Ishii, M., Jaccard, S., Koven, C., Lohila, A., Patra, P. K., Piao, S., Rogelj, J., Syampungani, S., Zaehle, S., and Zickfeld, K.: Global carbon and other biogeochemical cycles and feedbacks, Chapter 5, in: Climate Change 2021: The Physical Science Basis. Contribution of Working Group I to the Sixth Assessment Report of the Intergovernmental Panel on Climate Change, edited by: Masson-Delmotte, V., Zhai, P., Pirani, A., Connors, S. L., Péan, C., Berger, S., Caud, N., Chen, Y., Goldfarb, L., Gomis, M. I., Huang, M., Leitzell, K., Lonnoy, E., Matthews, J. B. R., Maycock, T. K., Waterfield, T., Yelekçi, O., Yu, R., and Zhou, B., Cambridge University Press, Cambridge, United Kingdom and New York, NY, USA, https://doi.org/10.1017/9781009157896.007, 2021.
Cao, L., Jin, X.-Y., and Jiang, J.: Simulated carbon cycle and Earth system response to atmospheric CO2 removal, Advances in Climate Change Research, 14, 313–321, https://doi.org/10.1016/j.accre.2023.03.001, 2023.
Chadburn, S. E., Burke, E. J., Cox, P. M., Friedlingstein, P., Hugelius, G., and Westermann, S.: An observation-based constraint on permafrost loss as a function of global warming, Nat. Clim. Change, 7, 340–344, https://doi.org/10.1038/nclimate3262, 2017.
Cleveland, W. S.: Robust Locally Weighted Regression and Smoothing Scatterplots, Journal of the American Statistical Association, 74, 829–836, https://doi.org/10.1080/01621459.1979.10481038, 1979.
Cleveland, W. S. and Devlin, S. J.: Locally Weighted Regression: An Approach to Regression Analysis by Local Fitting, Journal of the American Statistical Association, 83, 596–610, https://doi.org/10.1080/01621459.1988.10478639, 1988.
Cleveland, W. S. and Grosse, E.: Computational methods for local regression, Statistics and Computing, 1, 47–62, https://doi.org/10.1007/BF01890836, 1991.
Comyn-Platt, E., Hayman, G., Huntingford, C., Chadburn, S. E., Burke, E. J., Harper, A. B., Collins, W. J., Webber, C. P., Powell, T., Cox, P. M., Gedney, N., and Sitch, S.: Carbon budgets for 1.5 and 2 °C targets lowered by natural wetland and permafrost feedbacks, Nat. Geosci., 11, 568–573, https://doi.org/10.1038/s41561-018-0174-9, 2018.
Cox, P.: Description of the TRIFFID dynamic global vegetation model, Hadley Centre Technical., 24, 1–16, 2001.
Cui, M.: The simulation data for paper: Permafrost response and feedback under temperature stabilization and overshoot scenarios with different global warming levels, Zenodo [data set], https://doi.org/10.5281/zenodo.15148252, 2024.
Deprez, A., Leadley, P., Dooley, K., Williamson, P., Cramer, W., Gattuso, J.-P., Rankovic, A., Carlson, E. L., and Creutzig, F.: Sustainability limits needed for CO2 removal, Science, 383, 484–486, https://doi.org/10.1126/science.adj6171, 2024.
De Sisto, M. L., MacDougall, A. H., Mengis, N., and Antoniello, S.: Modelling the terrestrial nitrogen and phosphorus cycle in the UVic ESCM, Geosci. Model Dev., 16, 4113–4136, https://doi.org/10.5194/gmd-16-4113-2023, 2023.
de Vrese, P. and Brovkin, V.: Timescales of the permafrost carbon cycle and legacy effects of temperature overshoot scenarios, Nat. Commun., 12, 2688, https://doi.org/10.1038/s41467-021-23010-5, 2021.
Drouet, L., Bosetti, V., Padoan, S. A., Aleluia Reis, L., Bertram, C., Dalla Longa, F., Després, J., Emmerling, J., Fosse, F., Fragkiadakis, K., Frank, S., Fricko, O., Fujimori, S., Harmsen, M., Krey, V., Oshiro, K., Nogueira, L. P., Paroussos, L., Piontek, F., Riahi, K., Rochedo, P. R. R., Schaeffer, R., Takakura, J., van der Wijst, K.-I., van der Zwaan, B., van Vuuren, D., Vrontisi, Z., Weitzel, M., Zakeri, B., and Tavoni, M.: Net zero-emission pathways reduce the physical and economic risks of climate change, Nat. Clim. Change, 11, 1070–1076, https://doi.org/10.1038/s41558-021-01218-z, 2021.
Ehlert, D. and Zickfeld, K.: Irreversible ocean thermal expansion under carbon dioxide removal, Earth Syst. Dynam., 9, 197–210, https://doi.org/10.5194/esd-9-197-2018, 2018.
Eliseev, A. V., Demchenko, P. F., Arzhanov, M. M., and Mokhov, I. I.: Transient hysteresis of near-surface permafrost response to external forcing, Clim. Dynam., 42, 1203–1215, https://doi.org/10.1007/s00382-013-1672-5, 2014.
Etminan, M., Myhre, G., Highwood, E. J., and Shine, K. P.: Radiative forcing of carbon dioxide, methane, and nitrous oxide: A significant revision of the methane radiative forcing, Geophysical Research Letters, 43, https://doi.org/10.1002/2016GL071930, 2016.
Feng, J., Wang, C., Lei, J., Yang, Y., Yan, Q., Zhou, X., Tao, X., Ning, D., Yuan, M. M., Qin, Y., Shi, Z. J., Guo, X., He, Z., Van Nostrand, J. D., Wu, L., Bracho-Garillo, R. G., Penton, C. R., Cole, J. R., Konstantinidis, K. T., Luo, Y., Schuur, E. A. G., Tiedje, J. M., and Zhou, J.: Warming-induced permafrost thaw exacerbates tundra soil carbon decomposition mediated by microbial community, Microbiome, 8, 3, https://doi.org/10.1186/s40168-019-0778-3, 2020.
Forster, P. M. F., Freckleton, R. S., and Shine, K. P.: On aspects of the concept of radiative forcing, Clim. Dynam., 13, 547–560, https://doi.org/10.1007/s003820050182, 1997.
Forster, P. M., Smith, C. J., Walsh, T., Lamb, W. F., Lamboll, R., Hauser, M., Ribes, A., Rosen, D., Gillett, N., Palmer, M. D., Rogelj, J., von Schuckmann, K., Seneviratne, S. I., Trewin, B., Zhang, X., Allen, M., Andrew, R., Birt, A., Borger, A., Boyer, T., Broersma, J. A., Cheng, L., Dentener, F., Friedlingstein, P., Gutiérrez, J. M., Gütschow, J., Hall, B., Ishii, M., Jenkins, S., Lan, X., Lee, J.-Y., Morice, C., Kadow, C., Kennedy, J., Killick, R., Minx, J. C., Naik, V., Peters, G. P., Pirani, A., Pongratz, J., Schleussner, C.-F., Szopa, S., Thorne, P., Rohde, R., Rojas Corradi, M., Schumacher, D., Vose, R., Zickfeld, K., Masson-Delmotte, V., and Zhai, P.: Indicators of Global Climate Change 2022: annual update of large-scale indicators of the state of the climate system and human influence, Earth Syst. Sci. Data, 15, 2295–2327, https://doi.org/10.5194/essd-15-2295-2023, 2023.
Friedlingstein, P., O'Sullivan, M., Jones, M. W., Andrew, R. M., Hauck, J., Olsen, A., Peters, G. P., Peters, W., Pongratz, J., Sitch, S., Le Quéré, C., Canadell, J. G., Ciais, P., Jackson, R. B., Alin, S., Aragão, L. E. O. C., Arneth, A., Arora, V., Bates, N. R., Becker, M., Benoit-Cattin, A., Bittig, H. C., Bopp, L., Bultan, S., Chandra, N., Chevallier, F., Chini, L. P., Evans, W., Florentie, L., Forster, P. M., Gasser, T., Gehlen, M., Gilfillan, D., Gkritzalis, T., Gregor, L., Gruber, N., Harris, I., Hartung, K., Haverd, V., Houghton, R. A., Ilyina, T., Jain, A. K., Joetzjer, E., Kadono, K., Kato, E., Kitidis, V., Korsbakken, J. I., Landschützer, P., Lefèvre, N., Lenton, A., Lienert, S., Liu, Z., Lombardozzi, D., Marland, G., Metzl, N., Munro, D. R., Nabel, J. E. M. S., Nakaoka, S.-I., Niwa, Y., O'Brien, K., Ono, T., Palmer, P. I., Pierrot, D., Poulter, B., Resplandy, L., Robertson, E., Rödenbeck, C., Schwinger, J., Séférian, R., Skjelvan, I., Smith, A. J. P., Sutton, A. J., Tanhua, T., Tans, P. P., Tian, H., Tilbrook, B., van der Werf, G., Vuichard, N., Walker, A. P., Wanninkhof, R., Watson, A. J., Willis, D., Wiltshire, A. J., Yuan, W., Yue, X., and Zaehle, S.: Global Carbon Budget 2020, Earth Syst. Sci. Data, 12, 3269–3340, https://doi.org/10.5194/essd-12-3269-2020, 2020.
Friedlingstein, P., O'Sullivan, M., Jones, M. W., Andrew, R. M., Gregor, L., Hauck, J., Le Quéré, C., Luijkx, I. T., Olsen, A., Peters, G. P., Peters, W., Pongratz, J., Schwingshackl, C., Sitch, S., Canadell, J. G., Ciais, P., Jackson, R. B., Alin, S. R., Alkama, R., Arneth, A., Arora, V. K., Bates, N. R., Becker, M., Bellouin, N., Bittig, H. C., Bopp, L., Chevallier, F., Chini, L. P., Cronin, M., Evans, W., Falk, S., Feely, R. A., Gasser, T., Gehlen, M., Gkritzalis, T., Gloege, L., Grassi, G., Gruber, N., Gürses, Ö., Harris, I., Hefner, M., Houghton, R. A., Hurtt, G. C., Iida, Y., Ilyina, T., Jain, A. K., Jersild, A., Kadono, K., Kato, E., Kennedy, D., Klein Goldewijk, K., Knauer, J., Korsbakken, J. I., Landschützer, P., Lefèvre, N., Lindsay, K., Liu, J., Liu, Z., Marland, G., Mayot, N., McGrath, M. J., Metzl, N., Monacci, N. M., Munro, D. R., Nakaoka, S.-I., Niwa, Y., O'Brien, K., Ono, T., Palmer, P. I., Pan, N., Pierrot, D., Pocock, K., Poulter, B., Resplandy, L., Robertson, E., Rödenbeck, C., Rodriguez, C., Rosan, T. M., Schwinger, J., Séférian, R., Shutler, J. D., Skjelvan, I., Steinhoff, T., Sun, Q., Sutton, A. J., Sweeney, C., Takao, S., Tanhua, T., Tans, P. P., Tian, X., Tian, H., Tilbrook, B., Tsujino, H., Tubiello, F., van der Werf, G. R., Walker, A. P., Wanninkhof, R., Whitehead, C., Willstrand Wranne, A., Wright, R., Yuan, W., Yue, C., Yue, X., Zaehle, S., Zeng, J., and Zheng, B.: Global Carbon Budget 2022, Earth Syst. Sci. Data, 14, 4811–4900, https://doi.org/10.5194/essd-14-4811-2022, 2022.
Fyfe, J. C., von Salzen, K., Gillett, N. P., Arora, V. K., Flato, G. M., and McConnell, J. R.: One hundred years of Arctic surface temperature variation due to anthropogenic influence, Sci. Rep., 3, 2645, https://doi.org/10.1038/srep02645, 2013.
Gasser, T., Guivarch, C., Tachiiri, K., Jones, C. D., and Ciais, P.: Negative emissions physically needed to keep global warming below 2 °C, Nat. Commun., 6, 7958, https://doi.org/10.1038/ncomms8958, 2015.
Gasser, T., Kechiar, M., Ciais, P., Burke, E. J., Kleinen, T., Zhu, D., Huang, Y., Ekici, A., and Obersteiner, M.: Path-dependent reductions in CO2 emission budgets caused by permafrost carbon release, Nat. Geosci., 11, 830–835, https://doi.org/10.1038/s41561-018-0227-0, 2018.
Goodwin, P.: Quantifying the Terrestrial Carbon Feedback to Anthropogenic Carbon Emission, Earths Future, 7, 1417–1433, https://doi.org/10.1029/2019EF001258, 2019.
Goodwin, P., Katavouta, A., Roussenov, V. M., Foster, G. L., Rohling, E. J., and Williams, R. G.: Pathways to 1.5 °C and 2 °C warming based on observational and geological constraints, Nat. Geosci., 11, 102–107, https://doi.org/10.1038/s41561-017-0054-8, 2018.
Gulev, S. K., Thorne, P. W., Ahn, J., Dentener, F. J., Domingues, C. M., Gerland, S., Gong, D., Kaufman, D. S., Nnamchi, H. C., Quaas, J., Rivera, J. A., Sathyendranath, S., Smith, S. L., Trewin, B., von Schuckmann, K., Vose, R. S., Allan, R., Collins, B., Turner, A., and Hawkins, E.: Changing state of the climate system, edited by: Masson-Delmotte, V., Zhai, P., Pirani, A., Connors, S. L., Péan, C., Berger, S., Caud, N., Chen, Y., Goldfarb, L., Gomis, M. I., Huang, M., Leitzell, K., Lonnoy, E., Matthews, J. B. R., Maycock, T. K., Waterfield, T., Yelekçi, O., Yu, R., and Zhou, B., Cambridge University Press, Cambridge, UK, 287–422, 2021.
Hausfather, Z. and Peters, G. P.: Emissions – the `business as usual' story is misleading, Nature, 577, 618–620, https://doi.org/10.1038/d41586-020-00177-3, 2020.
Haustein, K., Allen, M. R., Forster, P. M., Otto, F. E. L., Mitchell, D. M., Matthews, H. D., and Frame, D. J.: A real-time Global Warming Index, Sci. Rep., 7, 15417, https://doi.org/10.1038/s41598-017-14828-5, 2017.
Hugelius, G., Strauss, J., Zubrzycki, S., Harden, J. W., Schuur, E. A. G., Ping, C.-L., Schirrmeister, L., Grosse, G., Michaelson, G. J., Koven, C. D., O'Donnell, J. A., Elberling, B., Mishra, U., Camill, P., Yu, Z., Palmtag, J., and Kuhry, P.: Estimated stocks of circumpolar permafrost carbon with quantified uncertainty ranges and identified data gaps, Biogeosciences, 11, 6573–6593, https://doi.org/10.5194/bg-11-6573-2014, 2014.
Jayakrishnan, K. U., Bala, G., and Caldeira, K.: Dependence of Climate and Carbon Cycle Response in Net Zero Emission Pathways on the Magnitude and Duration of Positive and Negative Emission Pulses, Earths Future, 12, e2024EF004891, https://doi.org/10.1029/2024EF004891, 2024.
Ji, D., Cui, M., Chen, Y., and Dai, Y.: Permafrost Response in Northern High-Latitude Regions to 1.5 °C Warming and Overshoot Scenarios Achieved via Solar Radiation Modification, Journal of Geophysical Research: Atmospheres, 130, e2024JD041772, https://doi.org/10.1029/2024JD041772, 2025.
King, A. D., Ziehn, T., Chamberlain, M., Borowiak, A. R., Brown, J. R., Cassidy, L., Dittus, A. J., Grose, M., Maher, N., Paik, S., Perkins-Kirkpatrick, S. E., and Sengupta, A.: Exploring climate stabilisation at different global warming levels in ACCESS-ESM-1.5, Earth Syst. Dynam., 15, 1353–1383, https://doi.org/10.5194/esd-15-1353-2024, 2024.
Kirschbaum, M. U. F.: The temperature dependence of organic-matter decomposition—still a topic of debate, Soil Biology and Biochemistry, 38, 2510–2518, https://doi.org/10.1016/j.soilbio.2006.01.030, 2006.
Kleinen, T. and Brovkin, V.: Pathway-dependent fate of permafrost region carbon, Environmental Research Letters, 13, 094001, https://doi.org/10.1088/1748-9326/aad824, 2018.
Koven, C., Friedlingstein, P., Ciais, P., Khvorostyanov, D., Krinner, G., and Tarnocai, C.: On the formation of high-latitude soil carbon stocks: Effects of cryoturbation and insulation by organic matter in a land surface model, Geophysical Research Letters, 36, https://doi.org/10.1029/2009GL040150, 2009.
Koven, C. D., Ringeval, B., Friedlingstein, P., Ciais, P., Cadule, P., Khvorostyanov, D., Krinner, G., and Tarnocai, C.: Permafrost carbon-climate feedbacks accelerate global warming, Proceedings of the National Academy of Sciences USA, 108, 14769–14774, https://doi.org/10.1073/pnas.1103910108, 2011.
Lawrence, D. M. and Slater, A. G.: A projection of severe near-surface permafrost degradation during the 21st century, Geophysical Research Letters, 32, https://doi.org/10.1029/2005GL025080, 2005.
Lawrence, D. M. and Slater, A. G.: Incorporating organic soil into a global climate model, Clim. Dynam., 30, 145–160, https://doi.org/10.1007/s00382-007-0278-1, 2008.
Le Quéré, C., Andrew, R. M., Friedlingstein, P., Sitch, S., Hauck, J., Pongratz, J., Pickers, P. A., Korsbakken, J. I., Peters, G. P., Canadell, J. G., Arneth, A., Arora, V. K., Barbero, L., Bastos, A., Bopp, L., Chevallier, F., Chini, L. P., Ciais, P., Doney, S. C., Gkritzalis, T., Goll, D. S., Harris, I., Haverd, V., Hoffman, F. M., Hoppema, M., Houghton, R. A., Hurtt, G., Ilyina, T., Jain, A. K., Johannessen, T., Jones, C. D., Kato, E., Keeling, R. F., Goldewijk, K. K., Landschützer, P., Lefèvre, N., Lienert, S., Liu, Z., Lombardozzi, D., Metzl, N., Munro, D. R., Nabel, J. E. M. S., Nakaoka, S., Neill, C., Olsen, A., Ono, T., Patra, P., Peregon, A., Peters, W., Peylin, P., Pfeil, B., Pierrot, D., Poulter, B., Rehder, G., Resplandy, L., Robertson, E., Rocher, M., Rödenbeck, C., Schuster, U., Schwinger, J., Séférian, R., Skjelvan, I., Steinhoff, T., Sutton, A., Tans, P. P., Tian, H., Tilbrook, B., Tubiello, F. N., van der Laan-Luijkx, I. T., van der Werf, G. R., Viovy, N., Walker, A. P., Wiltshire, A. J., Wright, R., Zaehle, S., and Zheng, B.: Global Carbon Budget 2018, Earth Syst. Sci. Data, 10, 2141–2194, https://doi.org/10.5194/essd-10-2141-2018, 2018.
Lee, H., Muri, H., Ekici, A., Tjiputra, J., and Schwinger, J.: The response of terrestrial ecosystem carbon cycling under different aerosol-based radiation management geoengineering, Earth Syst. Dynam., 12, 313–326, https://doi.org/10.5194/esd-12-313-2021, 2021.
Li, X., Zickfeld, K., Mathesius, S., Kohfeld, K., and Matthews, J. B. R.: Irreversibility of Marine Climate Change Impacts Under Carbon Dioxide Removal, Geophysical Research Letters, 47, e2020GL088507, https://doi.org/10.1029/2020GL088507, 2020.
Liang, Y.-C., Polvani, L. M., and Mitevski, I.: Arctic amplification, and its seasonal migration, over a wide range of abrupt CO2 forcing, npj Clim. Atmos. Sci., 5, 1–9, https://doi.org/10.1038/s41612-022-00228-8, 2022.
Liu, L., Zhao, D., Wei, J., Zhuang, Q., Gao, X., Zhu, Y., Zhang, J., Guo, C., and Zheng, D.: Permafrost sensitivity to global warming of 1.5 °C and 2 °C in the Northern Hemisphere, Environ. Res. Lett., 16, 034038, https://doi.org/10.1088/1748-9326/abd6a8, 2021.
MacDougall, A. H.: Reversing climate warming by artificial atmospheric carbon-dioxide removal: Can a Holocene-like climate be restored?, Geophysical Research Letters, 40, 5480–5485, https://doi.org/10.1002/2013GL057467, 2013.
MacDougall, A. H.: Estimated effect of the permafrost carbon feedback on the zero emissions commitment to climate change, Biogeosciences, 18, 4937–4952, https://doi.org/10.5194/bg-18-4937-2021, 2021.
MacDougall, A. H. and Knutti, R.: Projecting the release of carbon from permafrost soils using a perturbed parameter ensemble modelling approach, Biogeosciences, 13, 2123–2136, https://doi.org/10.5194/bg-13-2123-2016, 2016.
MacDougall, A. H., Eby, M., and Weaver, A. J.: If Anthropogenic CO2 Emissions Cease, Will Atmospheric CO2 Concentration Continue to Increase?, Journal of Climate, 26, 9563–9576, https://doi.org/10.1175/JCLI-D-12-00751.1, 2013.
MacDougall, A. H., Zickfeld, K., Knutti, R., and Matthews, H. D.: Sensitivity of carbon budgets to permafrost carbon feedbacks and non-CO2 forcings, Environmental Research Letters, 10, 125003, https://doi.org/10.1088/1748-9326/10/12/125003, 2015.
MacDougall, A. H., Frölicher, T. L., Jones, C. D., Rogelj, J., Matthews, H. D., Zickfeld, K., Arora, V. K., Barrett, N. J., Brovkin, V., Burger, F. A., Eby, M., Eliseev, A. V., Hajima, T., Holden, P. B., Jeltsch-Thömmes, A., Koven, C., Mengis, N., Menviel, L., Michou, M., Mokhov, I. I., Oka, A., Schwinger, J., Séférian, R., Shaffer, G., Sokolov, A., Tachiiri, K., Tjiputra , J., Wiltshire, A., and Ziehn, T.: Is there warming in the pipeline? A multi-model analysis of the Zero Emissions Commitment from CO2, Biogeosciences, 17, 2987–3016, https://doi.org/10.5194/bg-17-2987-2020, 2020.
MacIsaac, A. J., Mengis, N., Zickfeld, K., and Nzotungicimpaye, C.-M.: New applications for an EMIC coupled to an atmospheric chemistry model – The University of Victoria Earth system climate model version 2.10 + FAIR chemistry module, EGU General Assembly 2021, online, 19–30 April 2021, EGU21-13072, https://doi.org/10.5194/egusphere-egu21-13072, 2021.
Masson-Delmotte, V., Zhai, P., Pörtner, H.-O., Roberts, D. C., Skea, J., Shukla, P. R., Pirani, A., Moufouma-Okia, W., Péan, C., Pidcock, R., Connors, S., Matthews, J. B. R., Yang, C., Zhou, X., and Steg, L.: Global warming of 1.5 °C: Summary for policy makers, IPCC – The Intergovernmental Panel on Climate Change, https://doi.org/10.1017/9781009157940.001, 2018.
Matthews, H. D. and Caldeira, K.: Stabilizing climate requires near-zero emissions, Geophysical Research Letters, 35, https://doi.org/10.1029/2007GL032388, 2008.
Matthews, H. D., Gillett, N. P., Stott, P. A., and Zickfeld, K.: The proportionality of global warming to cumulative carbon emissions, Nature, 459, 829–832, https://doi.org/10.1038/nature08047, 2009.
McGuire, A. D., Koven, C., Lawrence, D. M., Clein, J. S., Xia, J., Beer, C., Burke, E., Chen, G., Chen, X., Delire, C., Jafarov, E., MacDougall, A. H., Marchenko, S., Nicolsky, D., Peng, S., Rinke, A., Saito, K., Zhang, W., Alkama, R., Bohn, T. J., Ciais, P., Decharme, B., Ekici, A., Gouttevin, I., Hajima, T., Hayes, D. J., Ji, D., Krinner, G., Lettenmaier, D. P., Luo, Y., Miller, P. A., Moore, J. C., Romanovsky, V., Schädel, C., Schaefer, K., Schuur, E. A. G., Smith, B., Sueyoshi, T., and Zhuang, Q.: Variability in the sensitivity among model simulations of permafrost and carbon dynamics in the permafrost region between 1960 and 2009, Global Biogeochemical Cycles, 30, 1015–1037, https://doi.org/10.1002/2016GB005405, 2016.
McKay, M. D., Beckman, R. J., and Conover, W. J.: A Comparison of Three Methods for Selecting Values of Input Variables in the Analysis of Output from a Computer Code, Technometrics, 21, 239–245, https://doi.org/10.2307/1268522, 1979.
Melnikova, I., Boucher, O., Cadule, P., Ciais, P., Gasser, T., Quilcaille, Y., Shiogama, H., Tachiiri, K., Yokohata, T., and Tanaka, K.: Carbon Cycle Response to Temperature Overshoot Beyond 2 °C: An Analysis of CMIP6 Models, Earths Future, 9, e2020EF001967, https://doi.org/10.1029/2020EF001967, 2021.
Meissner, K. J., Weaver, A. J., Matthews, H. D., and Cox, P. M.: The role of land surface dynamics in glacial inception: a study with the UVic Earth System Model, Clim. Dynam., 21, 515–537, https://doi.org/10.1007/s00382-003-0352-2, 2003.
Mengis, N., Keller, D. P., MacDougall, A. H., Eby, M., Wright, N., Meissner, K. J., Oschlies, A., Schmittner, A., MacIsaac, A. J., Matthews, H. D., and Zickfeld, K.: Evaluation of the University of Victoria Earth System Climate Model version 2.10 (UVic ESCM 2.10), Geosci. Model Dev., 13, 4183–4204, https://doi.org/10.5194/gmd-13-4183-2020, 2020.
Myhre, G., Shindell, D., Bréon, F.-M., Collins, W., Fuglestvedt, J., Huang, J., Koch, D., Lamarque, J.-F., Lee, D., Mendoza, B., Nakajima, T., Robock, A., Stephens, G., Takemura, T., and Zhang, H.: Anthropogenic and Natural Radiative Forcing, in: Climate Change 2013 – The Physical Science Basis: Working Group I Contribution to the Fifth Assessment Report of the Intergovernmental Panel on Climate Change, Cambridge University Press, Cambridge, https://doi.org/10.1017/CBO9781107415324.018, 659–740, 2014.
Natali, S. M., Holdren, J. P., Rogers, B. M., Treharne, R., Duffy, P. B., Pomerance, R., and MacDonald, E.: Permafrost carbon feedbacks threaten global climate goals, Proceedings of the National Academy of Sciences USA, 118, e2100163118, https://doi.org/10.1073/pnas.2100163118, 2021.
Nitzbon, J., Schneider Von Deimling, T., Aliyeva, M., Chadburn, S. E., Grosse, G., Laboor, S., Lee, H., Lohmann, G., Steinert, N. J., Stuenzi, S. M., Werner, M., Westermann, S., and Langer, M.: No respite from permafrost-thaw impacts in the absence of a global tipping point, Nat. Clim. Change, 14, 573–585, https://doi.org/10.1038/s41558-024-02011-4, 2024.
O'Neill, B. C., Tebaldi, C., van Vuuren, D. P., Eyring, V., Friedlingstein, P., Hurtt, G., Knutti, R., Kriegler, E., Lamarque, J.-F., Lowe, J., Meehl, G. A., Moss, R., Riahi, K., and Sanderson, B. M.: The Scenario Model Intercomparison Project (ScenarioMIP) for CMIP6, Geosci. Model Dev., 9, 3461–3482, https://doi.org/10.5194/gmd-9-3461-2016, 2016.
Pearson, R. G., Phillips, S. J., Loranty, M. M., Beck, P. S. A., Damoulas, T., Knight, S. J., and Goetz, S. J.: Shifts in Arctic vegetation and associated feedbacks under climate change, Nat. Clim. Change, 3, 673–677, https://doi.org/10.1038/nclimate1858, 2013.
Peng, X., Zhang, T., Frauenfeld, O. W., Mu, C., Wang, K., Wu, X., Guo, D., Luo, J., Hjort, J., Aalto, J., Karjalainen, O., and Luoto, M.: Active Layer Thickness and Permafrost Area Projections for the 21st Century, Earths Future, 11, https://doi.org/10.1029/2023ef003573, 2023.
Raftery, A. E., Zimmer, A., Frierson, D. M. W., Startz, R., and Liu, P.: Less Than 2 °C Warming by 2100 Unlikely, Nat. Clim. Change, 7, 637–641, https://doi.org/10.1038/nclimate3352, 2017.
Rantanen, M., Karpechko, A. Y., Lipponen, A., Nordling, K., Hyvärinen, O., Ruosteenoja, K., Vihma, T., and Laaksonen, A.: The Arctic has warmed nearly four times faster than the globe since 1979, Commun. Earth Environ., 3, 1–10, https://doi.org/10.1038/s43247-022-00498-3, 2022.
Rogelj, J., Hare, W., Lowe, J., van Vuuren, D. P., Riahi, K., Matthews, B., Hanaoka, T., Jiang, K., and Meinshausen, M.: Emission pathways consistent with a 2 °C global temperature limit, Nat. Clim. Change, 1, 413–418, https://doi.org/10.1038/nclimate1258, 2011.
Rogelj, J., Meinshausen, M., Schaeffer, M., Knutti, R., and Riahi, K.: Impact of short-lived non-CO2 mitigation on carbon budgets for stabilizing global warming, Environ. Res. Lett., 10, 075001, https://doi.org/10.1088/1748-9326/10/7/075001, 2015.
Sanderson, B. M., O'Neill, B. C., and Tebaldi, C.: What would it take to achieve the Paris temperature targets?, Geophysical Research Letters, 43, 7133–7142, https://doi.org/10.1002/2016GL069563, 2016.
Sanderson, B. M., Booth, B. B. B., Dunne, J., Eyring, V., Fisher, R. A., Friedlingstein, P., Gidden, M. J., Hajima, T., Jones, C. D., Jones, C. G., King, A., Koven, C. D., Lawrence, D. M., Lowe, J., Mengis, N., Peters, G. P., Rogelj, J., Smith, C., Snyder, A. C., Simpson, I. R., Swann, A. L. S., Tebaldi, C., Ilyina, T., Schleussner, C.-F., Séférian, R., Samset, B. H., van Vuuren, D., and Zaehle, S.: The need for carbon-emissions-driven climate projections in CMIP7, Geosci. Model Dev., 17, 8141–8172, https://doi.org/10.5194/gmd-17-8141-2024, 2024.
Schädel, C., Schuur, E. A. G., Bracho, R., Elberling, B., Knoblauch, C., Lee, H., Luo, Y., Shaver, G. R., and Turetsky, M. R.: Circumpolar assessment of permafrost C quality and its vulnerability over time using long-term incubation data, Global Change Biology, 20, 641–652, https://doi.org/10.1111/gcb.12417, 2014.
Schädel, C., Rogers, B. M., Lawrence, D. M., Koven, C. D., Brovkin, V., Burke, E. J., Genet, H., Huntzinger, D. N., Jafarov, E., McGuire, A. D., Riley, W. J., and Natali, S. M.: Earth system models must include permafrost carbon processes, Nat. Clim. Change, 14, 114–116, https://doi.org/10.1038/s41558-023-01909-9, 2024.
Schuur, E. A. G., McGuire, A. D., Schädel, C., Grosse, G., Harden, J. W., Hayes, D. J., Hugelius, G., Koven, C. D., Kuhry, P., Lawrence, D. M., Natali, S. M., Olefeldt, D., Romanovsky, V. E., Schaefer, K., Turetsky, M. R., Treat, C. C., and Vonk, J. E.: Climate change and the permafrost carbon feedback, Nature, 520, 171–179, https://doi.org/10.1038/nature14338, 2015.
Schwinger, J., Asaadi, A., Steinert, N. J., and Lee, H.: Emit now, mitigate later? Earth system reversibility under overshoots of different magnitudes and durations, Earth Syst. Dynam., 13, 1641–1665, https://doi.org/10.5194/esd-13-1641-2022, 2022.
Seneviratne, S. I., Rogelj, J., Séférian, R., Wartenburger, R., Allen, M. R., Cain, M., Millar, R. J., Ebi, K. L., Ellis, N., Hoegh-Guldberg, O., Payne, A. J., Schleussner, C.-F., Tschakert, P., and Warren, R. F.: The many possible climates from the Paris Agreement's aim of 1.5 °C warming, Nature, 558, 41–49, https://doi.org/10.1038/s41586-018-0181-4, 2018.
Smith, S. L., O'Neill, H. B., Isaksen, K., Noetzli, J., and Romanovsky, V. E.: The changing thermal state of permafrost, Nat. Rev. Earth Environ., 3, 10–23, https://doi.org/10.1038/s43017-021-00240-1, 2022.
Smith, S., Geden, O., Nemet, G., Gidden, M., Lamb, W., Powis, C., Bellamy, R., Callaghan, M., Cowie, A., Cox, E., Fuss, S., Gasser, T., Grassi, G., Greene, J., Lueck, S., Mohan, A., Müller-Hansen, F., Peters, G., Pratama, Y., Repke, T., Riahi, K., Schenuit, F., Steinhauser, J., Strefler, J., Valenzuela, J., and Minx, J.: State of Carbon Dioxide Removal – 1st edn., University of Oxford, https://doi.org/10.17605/OSF.IO/W3B4Z, 2023.
Strauss, J., Schirrmeister, L., Grosse, G., Fortier, D., Hugelius, G., Knoblauch, C., Romanovsky, V., Schädel, C., Schneider von Deimling, T., Schuur, E. A. G., Shmelev, D., Ulrich, M., and Veremeeva, A.: Deep Yedoma permafrost: A synthesis of depositional characteristics and carbon vulnerability, Earth-Science Reviews, 172, 75–86, https://doi.org/10.1016/j.earscirev.2017.07.007, 2017.
Strauss, J., Laboor, S., Schirrmeister, L., Fedorov, A. N., Fortier, D., Froese, D., Fuchs, M., Günther, F., Grigoriev, M., Harden, J., Hugelius, G., Jongejans, L. L., Kanevskiy, M., Kholodov, A., Kunitsky, V., Kraev, G., Lozhkin, A., Rivkina, E., Shur, Y., Siegert, C., Spektor, V., Streletskaya, I., Ulrich, M., Vartanyan, S., Veremeeva, A., Anthony, K. W., Wetterich, S., Zimov, N., and Grosse, G.: Circum-Arctic Map of the Yedoma Permafrost Domain, Frontiers in Earth Science, 9, 758360, https://doi.org/10.3389/feart.2021.758360, 2021.
Strauss, J., Laboor, S., Schirrmeister, L., Fedorov, A. N., Fortier, D., Froese, D. G., Fuchs, M., Günther, F., Grigoriev, M. N., Harden, J. W., Hugelius, G., Jongejans, L. L., Kanevskiy, M. Z., Kholodov, A. L., Kunitsky, V., Kraev, G., Lozhkin, A. V., Rivkina, E., Shur, Y., Siegert, C., Spektor, V., Streletskaya, I., Ulrich, M., Vartanyan, S. L., Veremeeva, A., Walter Anthony, K. M., Wetterich, S., Zimov, N. S., and Grosse, G.: Database of Ice-Rich Yedoma Permafrost Version 2 (IRYP v2), PANGAEA, https://doi.org/10.1594/PANGAEA.940078, 2022.
Tokarska, K. B. and Zickfeld, K.: The effectiveness of net negative carbon dioxide emissions in reversing anthropogenic climate change, Environ. Res. Lett., 10, 094013, https://doi.org/10.1088/1748-9326/10/9/094013, 2015.
Trumbore, S.: Age of Soil Organic Matter and Soil Respiration: Radiocarbon Constraints on Belowground C Dynamics, Ecological Applications, 10, 399–411, https://doi.org/10.1890/1051-0761(2000)010[0399:AOSOMA]2.0.CO;2, 2000.
van Vuuren, D., O'Neill, B., Tebaldi, C., Chini, L., Friedlingstein, P., Hasegawa, T., Riahi, K., Sanderson, B., Govindasamy, B., Bauer, N., Eyring, V., Fall, C., Frieler, K., Gidden, M., Gohar, L., Jones, A., King, A., Knutti, R., Kriegler, E., Lawrence, P., Lennard, C., Lowe, J., Mathison, C., Mehmood, S., Prado, L., Zhang, Q., Rose, S., Ruane, A., Schleussner, C.-F., Seferian, R., Sillmann, J., Smith, C., Sörensson, A., Panickal, S., Tachiiri, K., Vaughan, N., Vishwanathan, S., Yokohata, T., and Ziehn, T.: The Scenario Model Intercomparison Project for CMIP7 (ScenarioMIP-CMIP7) , EGUsphere [preprint], https://doi.org/10.5194/egusphere-2024-3765, 2025.
Weaver, A. J., Eby, M., Wiebe, E. C., Bitz, C. M., Duffy, P. B., Ewen, T. L., Fanning, A. F., Holland, M. M., MacFadyen, A., Matthews, H. D., Meissner, K. J., Saenko, O., Schmittner, A., Wang, H., and Yoshimori, M.: The UVic earth system climate model: Model description, climatology, and applications to past, present and future climates, Atmosphere-Ocean, 39, 361–428, https://doi.org/10.1080/07055900.2001.9649686, 2001.
Wu, P., Ridley, J., Pardaens, A., Levine, R., and Lowe, J.: The reversibility of CO2 induced climate change, Clim. Dynam., 45, 745–754, https://doi.org/10.1007/s00382-014-2302-6, 2015.
Zhang, T., Heginbottom, J. A., Barry, R. G., and Brown, J.: Further statistics on the distribution of permafrost and ground ice in the Northern Hemisphere, Polar Geography, 24, 126–131, https://doi.org/10.1080/10889370009377692, 2000.
Zhu, D., Ciais, P., Krinner, G., Maignan, F., Jornet Puig, A., and Hugelius, G.: Controls of soil organic matter on soil thermal dynamics in the northern high latitudes, Nat. Commun., 10, 3172, https://doi.org/10.1038/s41467-019-11103-1, 2019.
Zickfeld, K., Eby, M., Matthews, H. D., and Weaver, A. J.: Setting cumulative emissions targets to reduce the risk of dangerous climate change, Proceedings of the National Academy of Sciences USA, 106, 16129–16134, https://doi.org/10.1073/pnas.0805800106, 2009.
Zickfeld, K., MacDougall, A. H., and Matthews, H. D.: On the proportionality between global temperature change and cumulative CO2 emissions during periods of net negative CO2 emissions, Environ. Res. Lett., 11, 055006, https://doi.org/10.1088/1748-9326/11/5/055006, 2016.
Zimov, S. A., Schuur, E. A. G., and Chapin, F. S.: Permafrost and the Global Carbon Budget, Science, 312, 1612–1613, https://doi.org/10.1126/science.1128908, 2006.