the Creative Commons Attribution 4.0 License.
the Creative Commons Attribution 4.0 License.
 | 09 Oct 2025
Eco-evolutionary modelling of global vegetation dynamics and the impact of CO2 during the late Quaternary: insights from contrasting periods
Jierong Zhao
Boya Zhou
Sandy P. Harrison
Colin Prentice
Changes in climate have had major impacts on global vegetation during the Quaternary. However, variations in CO2 levels also play a role in shaping vegetation dynamics by influencing plant productivity and water-use efficiency and consequently the relative competitive success of the C3 and C4 photosynthetic pathways. We use an eco-evolutionary optimality (EEO)-based modelling approach to examine the impacts of climate fluctuations and CO2-induced alterations on gross primary production (GPP). We considered two contrasting periods, the Last Glacial Maximum (LGM; 21 000 years before present) and the mid-Holocene (MH; 6000 years before present) and compared both to pre-industrial (PI) conditions. The LGM, characterized by generally colder and drier climate, had a CO2 level close to the minimum for effective C3 plant operation. In contrast, the MH had warmer summers and increased monsoonal rainfall in the Northern Hemisphere, although with a CO2 level still below the PI. We simulated vegetation primary production at the LGM and the MH compared to the PI baseline using a light-use efficiency model that simulates GPP coupled to an EEO model that simulates leaf area index (LAI) and C3 C4 competition. We found that low CO2 at the LGM was nearly as important as climate in reducing tree cover, increasing the abundance of C4 plants and lowering GPP. Global GPP in the MH was similar to the PI (although greater than the LGM), also reflecting CO2 constraints on plant growth despite the positive impacts of warmer and/or wetter climates experienced in the Northern Hemisphere and tropical regions. These results emphasize the importance of taking account of impacts of changing CO2 levels on plant growth to model ecosystem changes.
- Article
(7140 KB) - Full-text XML
-
Supplement
(8963 KB) - BibTeX
- EndNote


Vegetation regulates the exchanges of energy, water, and carbon dioxide between the land and the atmosphere (Williams and Torn, 2015; Forzieri et al., 2020; Hoek van Dijke et al., 2020). Gross primary production (GPP), defined as the carbon uptake by vegetation through photosynthesis at the ecosystem scale, determines the extent to which the terrestrial biosphere can mitigate CO2 emissions (Bonan, 2008; Zeng et al., 2017; Chen et al., 2019a). There is a tight coupling between CO2 uptake and water loss via stomata, such that, when ambient CO2 is high, water-use efficiency (the amount of water required for transpiration to achieve a unit of CO2 assimilation) is also high (Medlyn et al., 2017). Recent global greening trends are thought to reflect both changes in climate, particularly warming at high latitudes, and the effect of increasing CO2 on water-use efficiency (Cai and Prentice, 2020; Piao et al., 2020). However, there is still uncertainty about the relative importance of these two effects on recent changes in global GPP, in part because recent climate changes have largely been driven by the increase in CO2.
Past climate states provide opportunities to examine the role of climate and CO2 in modulating GPP when there is a greater de-coupling between changes in CO2 and climate. The contrast between glacial and interglacial states during the Late Quaternary offers an ideal opportunity to separate the impact of these two factors on vegetation. Glacial–interglacial shifts in climate are largely driven by changes in orbital configuration which resulted in changes in the seasonal and latitudinal patterns of incoming solar radiation (Berger, 1978; Berger and Loutre, 1991). The Last Glacial Maximum (LGM), ca. 21 000 years ago, had an orbital configuration similar to the present but was characterized by the presence of large continental ice sheets and generally colder and drier climates (Kageyama et al., 2021). The CO2 level was ca. 190 ppm, which is close to the minimum for effective C3 plant operation (Gerhart and Ward, 2010). The mid-Holocene (MH), ca. 6000 years ago, was characterized by a significantly different seasonal and latitudinal distribution of incoming solar radiation (a result of changes in obliquity and precession) which affected light availability for photosynthesis and produced warmer summers in the Northern Hemisphere and wetter conditions in the sub-tropics (Brierley et al., 2020). However, ambient CO2 was only ca. 264 ppm (Otto-Bliesner et al., 2017), somewhat lower than the pre-industrial (PI) period (285 ppm) and considerably lower than today.
Three sets of factors could potentially impact vegetation productivity changes between the LGM, MH, and pre-industrial periods: changes in climate, atmospheric CO2, and solar radiation. Several published studies have simulated LGM climate impacts on vegetation (and/or fire, interacting with vegetation), with (or without) consideration of the additional physiological effects of low CO2 on plants (Levis et al., 1999; Harrison and Prentice, 2003; Martin Calvo et al., 2014). Other studies have performed factorial experiments to more formally separate the effects of climate and CO2 (Woillez et al., 2011; O'ishi and Abe-Ouchi, 2013; Claussen et al., 2013; Martin Calvo and Prentice, 2015; Chen et al., 2019b; Haas et al., 2023).
Comparison among these studies of LGM–recent primary production shifts is approximate at best because they have used different climate models and experimental protocols. Some have used pre-industrial conditions as a reference; others have used modern (higher-CO2) conditions. However, they have all used land ecosystem models based on the plant functional type (PFT) concept. Uncertainty in the delimitation of PFTs and the parameter values assigned to them is endemic to this type of model, as the variation in quantitative traits within PFTs in the real world is generally much larger than variation between them (Kattge et al., 2011). In some cases, the model PFT representation has resulted in an unrealistic simulation of LGM vegetation patterns (e.g. Woillez et al., 2011). Here we use the P model (Stocker et al., 2020), which accounts for acclimation and adaptation to the environment independently of PFTs on the basis of universal eco-evolutionary optimality (EEO) hypotheses. The P model has been subject to extensive evaluation against worldwide data from eddy covariance flux towers across all biomes. We include an extension of the P model which simulates foliage cover and its seasonal cycle – also independently of PFTs. This extended model has been shown to reproduce foliage amounts and seasonal dynamics more accurately than any state-of-the-art vegetation model (Zhou et al., 2025). We use a simple process-based scheme to represent the relative competitive success of C3 versus C4 plants, which has been validated against worldwide soil carbon stable isotope data (Lavergne et al., 2024). This combination of three independently tested, PFT-independent modelling components enables us, for the first time, to apply an EEO-based approach to simulate LGM and recent vegetation function in a globally uniform way.
There has been some work on the implications of MH climate for biome distributions (e.g. Kaplan et al., 2003; Wohlfahrt et al., 2008) but little consideration of the impacts of climate and CO2 on global productivity changes since the MH (Foley, 1994; François et al., 1999). Here, we use the same consistent methodology that we apply to the LGM to estimate MH–pre-industrial changes in global GPP. Our analysis includes the effect of changes in the light regime, which are a necessary consequence of changes in the seasonal and latitudinal distribution of insolation due to orbital forcing, along with changes in cloud cover linked to monsoon shifts.
EEO-based modelling approaches provide parameter-sparse representations of plant and vegetation processes, thus considerably reducing uncertainties due to model parameterization (Harrison et al., 2021). They have been shown to perform as well as or better than more complex models under recent conditions (Cai et al., 2025; Zhou et al., 2025) and can thus provide a robust way of modelling vegetation changes under different climate regimes. We use a series of counter-factual experiments to examine the magnitude of changes due to individual drivers (climate parameters, solar radiation, and CO2) on the simulated GPP and to determine the regions where specific factors are most influential.
2.1 Modelling scheme
We simulated vegetation changes at the LGM and the MH compared to the pre-industrial (PI) state using a sequence of linked models that predict GPP, leaf area index (LAI), and C3 C4 competition based on EEO theory (Fig. 1). We firstly simulate potential GPP (equivalent to leaf-level photosynthesis) for C3 and C4 plants independently. These estimates are used to derive total potential GPP, allowing competition between C3 and C4 plants. Potential GPP is converted to actual GPP using a model that simulates the seasonal cycle of leaf area index (LAI), which is converted to the fraction of absorbed photosynthetically active radiation (fAPAR) using Beer's law. Finally, we use a soil water balance model to calculate soil moisture and then take account of the impact of low soil moisture on GPP using an empirical correction.
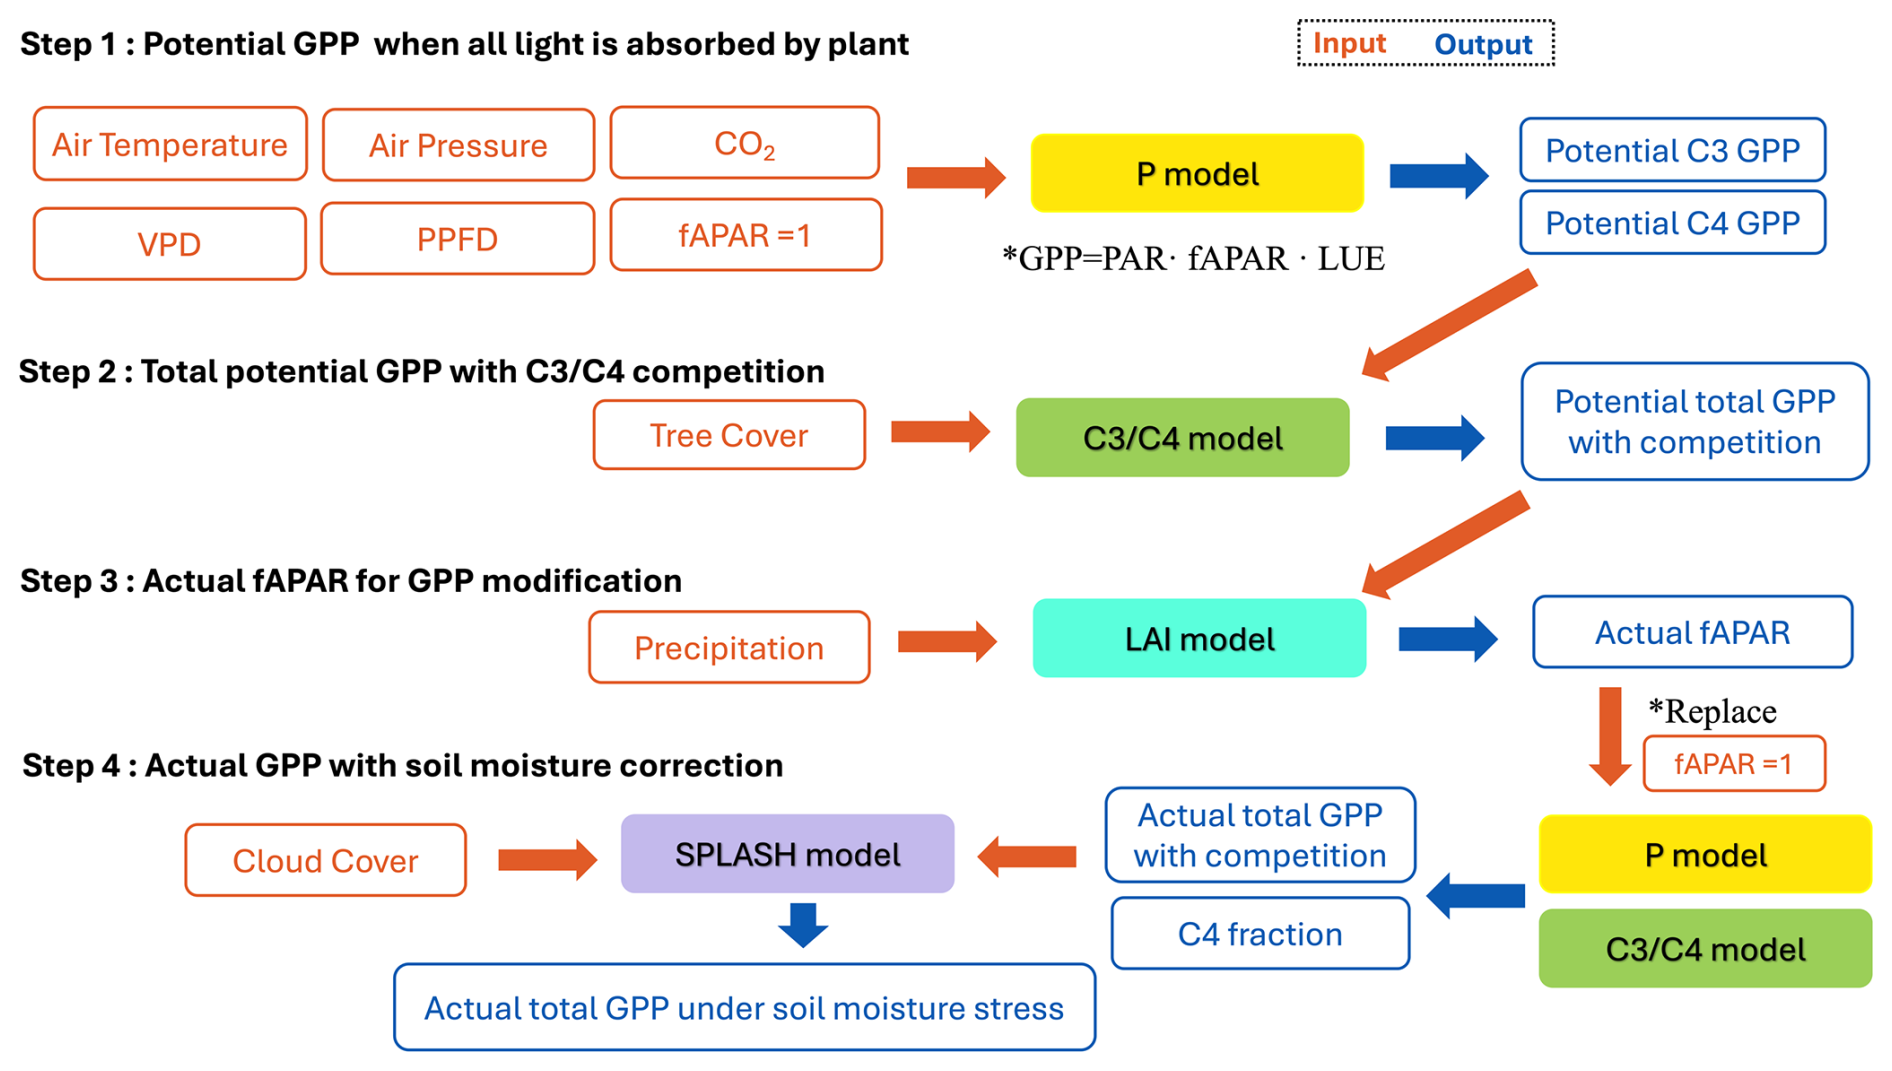
The P model (Wang et al., 2017; Stocker et al., 2020) is a light-use efficiency model that simulates GPP. It uses the Farquhar–von Caemmerer–Berry photosynthesis model (Farquhar et al., 1980) for instantaneous biochemical processes combined with two EEO hypotheses describing photosynthetic acclimation, the “coordination” and “least-cost” hypotheses (Prentice et al., 2014; Wang et al., 2017), to account for the spatial and temporal acclimation of carboxylation and stomatal conductance to environmental variations at weekly to monthly timescales. Although the P model simulates both C3 and C4 photosynthesis, it does not need to make any other distinctions between plant functional types. The required inputs to the model (Fig. 1) are air temperature (°C), vapour pressure deficit (VPD; Pa) derived from relative humidity, air pressure (Pa) to account for the effect of elevation on photosynthesis, incident photosynthetic photon flux density (PPFD; µmol m−2 s−1) estimated from short-wave solar radiation, and ambient CO2 concentration. The P model has been extensively validated and shown to predict the geographic patterns and seasonal cycles of GPP under modern conditions successfully (Wang et al., 2017; Stocker et al., 2020). Furthermore, it correctly predicts related physiological characteristics, including the global pattern of the maximum carboxylation (Vcmax) rate in relation to gradients in PPFD, temperature, and VPD (Smith et al., 2019); the seasonal variation in Vcmax in different biomes (Jiang et al., 2020) and its response to atmospheric CO2 (Smith and Keenan, 2020); and the variation in photosynthetic traits along elevational gradients (Peng et al., 2020). The responses of photosynthetic properties to enhanced CO2 as simulated by the P model have been validated against both Free Air Carbon dioxide Enrichment (FACE) experiments (Wang et al., 2017) and controlled-environment experiments (Smith and Keenan, 2020). Moreover, the model's implied response of photosynthetic capacity to CO2 has been validated by measurements on plants experimentally grown at low (160 ppm) CO2 (Harrison et al., 2021).
The P model firstly simulates potential GPP for C3 and C4 plants separately, without consideration of competition between them (Fig. 1). These estimates are fed into a simple model of C3 C4 competition based on the P model (Lavergne et al., 2024). The principle of the C3 C4 model is as follows. C4 plants (mainly grasses, some shrubs) have a higher rate of photosynthesis under hot and/or dry conditions, especially under low CO2, which reduces C3 photosynthesis. On the other hand, C4 plants can only become dominant or co-dominant if tree cover is limited because (C3) trees have the advantage in competition for light: C3 trees can outcompete C4 grasses through shading even where the C4 pathway would yield higher rates of photosynthesis. The relative photosynthetic advantage of C4 plants is estimated in the model as the difference between the monthly potential GPP for C3 and C4 plants, summed over the year. The C4 share of total GPP was then estimated based on a logistic relationship between the model-estimated C4 relative advantage and observed C4 abundance. An additional function relates the proportion of GPP from trees to total potential GPP based on the relationship between annual mean percentage tree cover and the simulated annual GPP of C3 plants. Thus, tree cover is an additional required input to the competition model (Fig. 1). The competition model also enforces a minimum temperature threshold to define conditions under which C4 plants cannot grow, where this limit is set to a minimum temperature of the coldest month of −24° based on experimental data. The competition model has been shown to reproduce global patterns in the relative abundance of C3 C4 plants and the observed rate of Δ13C in recent decades, as shown by independent atmospheric estimates (Lavergne et al., 2020).
To convert potential GPP to actual GPP, we used an LAI model (Fig. 1) that predicts the seasonal cycle of LAI based on environmental conditions and the P-model estimates of potential GPP, i.e. the GPP predicted when the fraction of absorbed photosynthetically active radiation, fAPAR, is set to 1 (Zhou et al., 2025). This model is based on the EEO hypothesis that seasonal variations in LAI are coordinated with variations in potential GPP because leaves are displayed at (or close to) the time when they are able to be most productive. A seasonal maximum LAI model was embedded in this model to provide an upper limit to the seasonal LAI predictions (Zhu et al., 2022; Cai et al., 2025). The calculation of seasonal maximum LAI incorporates a water–carbon trade-off and is defined as the lesser of an energy-limited and a water-limited estimate (Zhu et al., 2022; Cai et al., 2025). The model assumes that, under energy limitation, plants allocate carbon to leaves to maximize GPP after accounting for the costs of leaf construction and maintenance, including the costs of obtaining water and nutrients. This leads to a clear optimum because investing in leaf tissue yields diminishing returns due to mutual leaf shading. Under water limitation, the model assumes that plants adjust their rooting behaviour to extract a portion of annual precipitation from the soil, irrespective of its distribution throughout the year, and allocate carbon to leaves so that all this water is transpired, thereby maximizing GPP. There are inherent delays between the steady-state LAI and the real-time dynamic LAI because photosynthetic and phenological processes do not respond instantaneously to weather fluctuations: the allocation of photosynthate to leaves can take days to months. Thus, the seasonal dynamics of LAI were calculated using a moving average to represent the time lag between allocation to leaves and modelled steady-state LAI (Zhou et al., 2025). The model has been shown to capture observed LAI dynamics across all biomes at different temporal scales (weekly, seasonal, annual, and interannual variability) both at individual eddy covariance flux measurement sites and when compared to satellite-derived LAI (Zhou et al., 2025). Furthermore, it predicts both the multi-year average LAI and the annual trends in LAI better than the biosphere models used in the Trends and Drivers of Terrestrial Sources and Sinks of Carbon Dioxide (TRENDY) project (Zhou et al., 2025). The seasonal cycle of fAPAR is calculated from the seasonal cycle of LAI using Beer's law (Swinehart, 1962), and this is then used to calculate seasonal changes in actual GPP.
Finally, we apply an empirical soil moisture correction (Stocker et al., 2020) to account for the additional impact of soil moisture stress on GPP. This has the form of a quadratic expression applied when soil moisture is below a given threshold value, where the sensitivity of this relationship varies depending on aridity such that the decline in β(θ) with drying soils is steep in dry climates and less steep in wetter climates. The soil moisture stress function was developed by comparing simulations of GPP with flux tower data at sites across a range of climatic aridity (Stocker et al., 2020). Soil moisture was calculated using the Simple Process-Led Algorithms for Simulating Habitats (SPLASH) model (Davis et al., 2017), which is a generic soil water accounting model in which daily losses depend on potential evaporation, reduced in proportion to relative soil water content.
2.2 Derivation of LGM, MH, and PI climate and vegetation inputs
We use LGM, MH, and pre-industrial (PI) climate simulations (Table S1 of the Supplement) run using the low-resolution version of the Max Planck Institute Earth System Model (MPI-ESM1.2-LR; Mauritsen et al., 2019) made as part of the fourth phase of the Palaeoclimate Modelling Intercomparison Project (PMIP4; Kageyama et al., 2017; Otto-Bliesner et al., 2017). This model is amongst the best-performing of the PMIP models when evaluated using reconstructions of land and ocean climates (Brierley et al., 2020; Kageyama et al., 2021) and, uniquely, has archived all the necessary climate and vegetation outputs needed to run the EEO-based models (Fig. 1). The experiments were run following the PMIP4 protocols for each time period (Kageyama et al., 2017; Otto-Bliesner et al., 2017). The PI experiment was run for 1000 years using modern ice sheet and land–sea configurations and a CO2 level of 284.3 ppm (Table S1). The MH experiment uses the same ice sheet and land–sea configurations as the PI but uses appropriate changes in orbital parameters and a CO2 level of 264.4 ppm (Table S1). The MPI-ESM1.2-LR LGM experiment uses the ICE6G_C ice sheet and corresponding modification in land–sea geography, appropriate orbital parameters, and a CO2 level of 190 ppm (Table S1). The LGM simulation was re-started from a previous LGM simulation and then spun up for 3850 years.
The MPI-ESM1.2-LR model has a spectral resolution of T63 (192×96 longitude/latitude). The climate and tree cover outputs necessary to run the EEO-based models were downscaled to a resolution of 0.5° using spline interpolation. The daily data necessary to run the EEO-based models were obtained from monthly data, also using nearest-neighbour and bilinear interpolation. Although many previous vegetation modelling studies have used climate anomalies from a baseline experiment (e.g. LGM minus PI), here we used model outputs directly because, although the anomaly approach is well suited to adjusting climate variables, it cannot be used to adjust simulated tree cover.
2.3 Stein–Alpert decomposition
Climate, light availability, and atmospheric CO2 concentration have independent effects on plant growth. To evaluate the unique effects of these different factors, and potential synergies between them, on the changes in GPP between the PI and the LGM and MH experiments, we used the Stein–Alpert decomposition method (Stein and Alpert, 1993), an approach that has previously been shown to be useful in evaluating the impacts of different factors on past vegetation changes (e.g. Martin-Calvo and Prentice, 2015; Sato et al., 2021). We used the pre-industrial simulation as the reference case (f0) and ran a series of factorial experiments in which specific factors were changed to their LGM or MH conditions as follows:
-
Experiment f1: LGM (or MH) climate, PI CO2 and PPFD
-
Experiment f2: LGM (or MH) CO2, PI climate and PPFD
-
Experiment f3: LGM (or MH) PPFD, PI climate and CO2
-
Experiment f12: LGM (or MH) climate and CO2, PI PPFD
-
Experiment f13: LGM (or MH) climate and PPFD, PI CO2
-
Experiment f23: LGM (or MH) CO2 and PPFD, PI climate
-
Experiment f123: LGM (or MH) climate, CO2 and PPFD.
The impact of each factor or combination of factors was then calculated as follows:
-
-
-
-
-
-
-
,
where the first three experiments represent the influence of the single changed factor, the second three experiments represent synergies between pairs of factors, and the final experiment represents the three-way synergy between all three factors.
The comparisons can only be made for the common land area between the PI and each palaeoclimate experiment. The LGM factorial experiments therefore have a baseline GPP value for the f0 experiment that does not include the areas exposed by lowered sea level, although these are considered in the full LGM experiment. The full LGM and MH experiments include changes to both air pressure and tree cover; these are not considered in the factorial experiments because preliminary analyses indicated that the impact of these changes on simulated global GPP was less than 0.2 PgC yr−1 and therefore negligible.
Simulated global GPP at the LGM was 83.9 PgC yr−1 (Table 1), considerably lower than the simulated global value during the pre-industrial period (109.6 PgC yr−1). The largest reductions in GPP compared to the pre-industrial baseline were in the Northern Hemisphere extra-tropics (Fig. 2, Table 2), which experienced a more than 50 % reduction in GPP. There was a more modest decrease (13 %) in the southern extra-tropics and only a small decrease in the tropics (3 %). Part of the reduction (10.5 PgC yr−1) in global GPP reflects the loss of vegetation from areas that were covered by ice at the LGM; this was only partially compensated by vegetation growth on the continental shelves exposed by the reduced sea level (8.3 PgC yr−1). Although there was a reduction overall and across most of the world, some regions experienced a small increase in productivity at the LGM compared to the PI (Fig. 3). These are all in now-arid regions, and the increase therefore presumably reflects the fact that moisture constraints on vegetation growth were reduced in the colder climate of the LGM.
Table 1Contribution to global changes in gross primary production (GPP) in the Last Glacial Maximum (LGM), the mid-Holocene (MH), and the pre-industrial (PI) experiments. The table gives the global total in each experiment, the GPP of land exposed by lowered sea level at the LGM, the GPP of land that was covered by ice sheets at the LGM and was exposed in the MH and PI experiments, and GPP for the land area in common between all three experiments. n/a: not applicable.
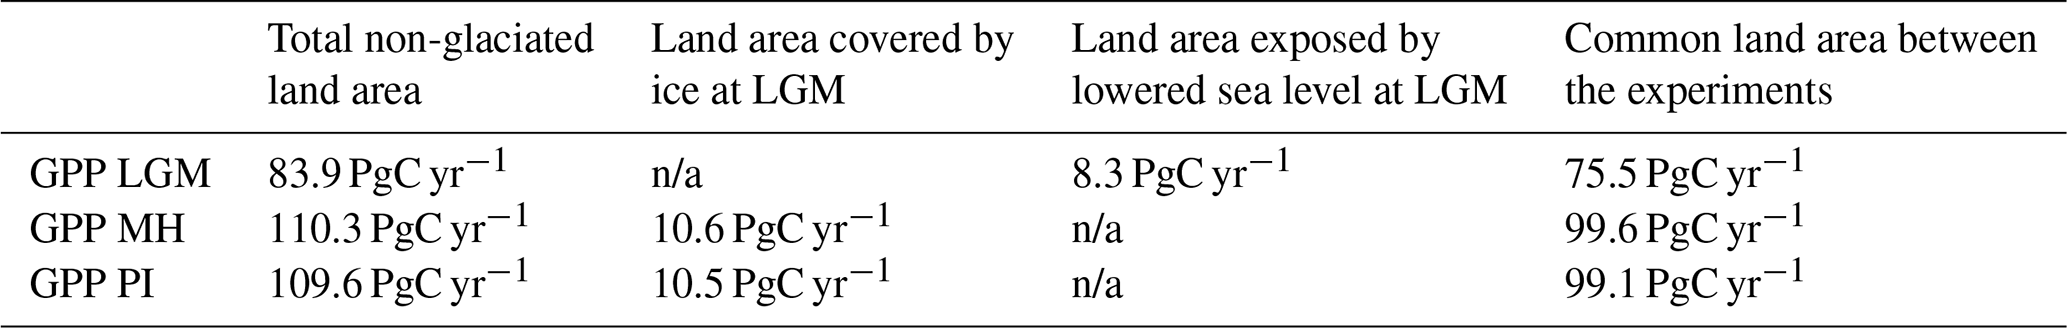
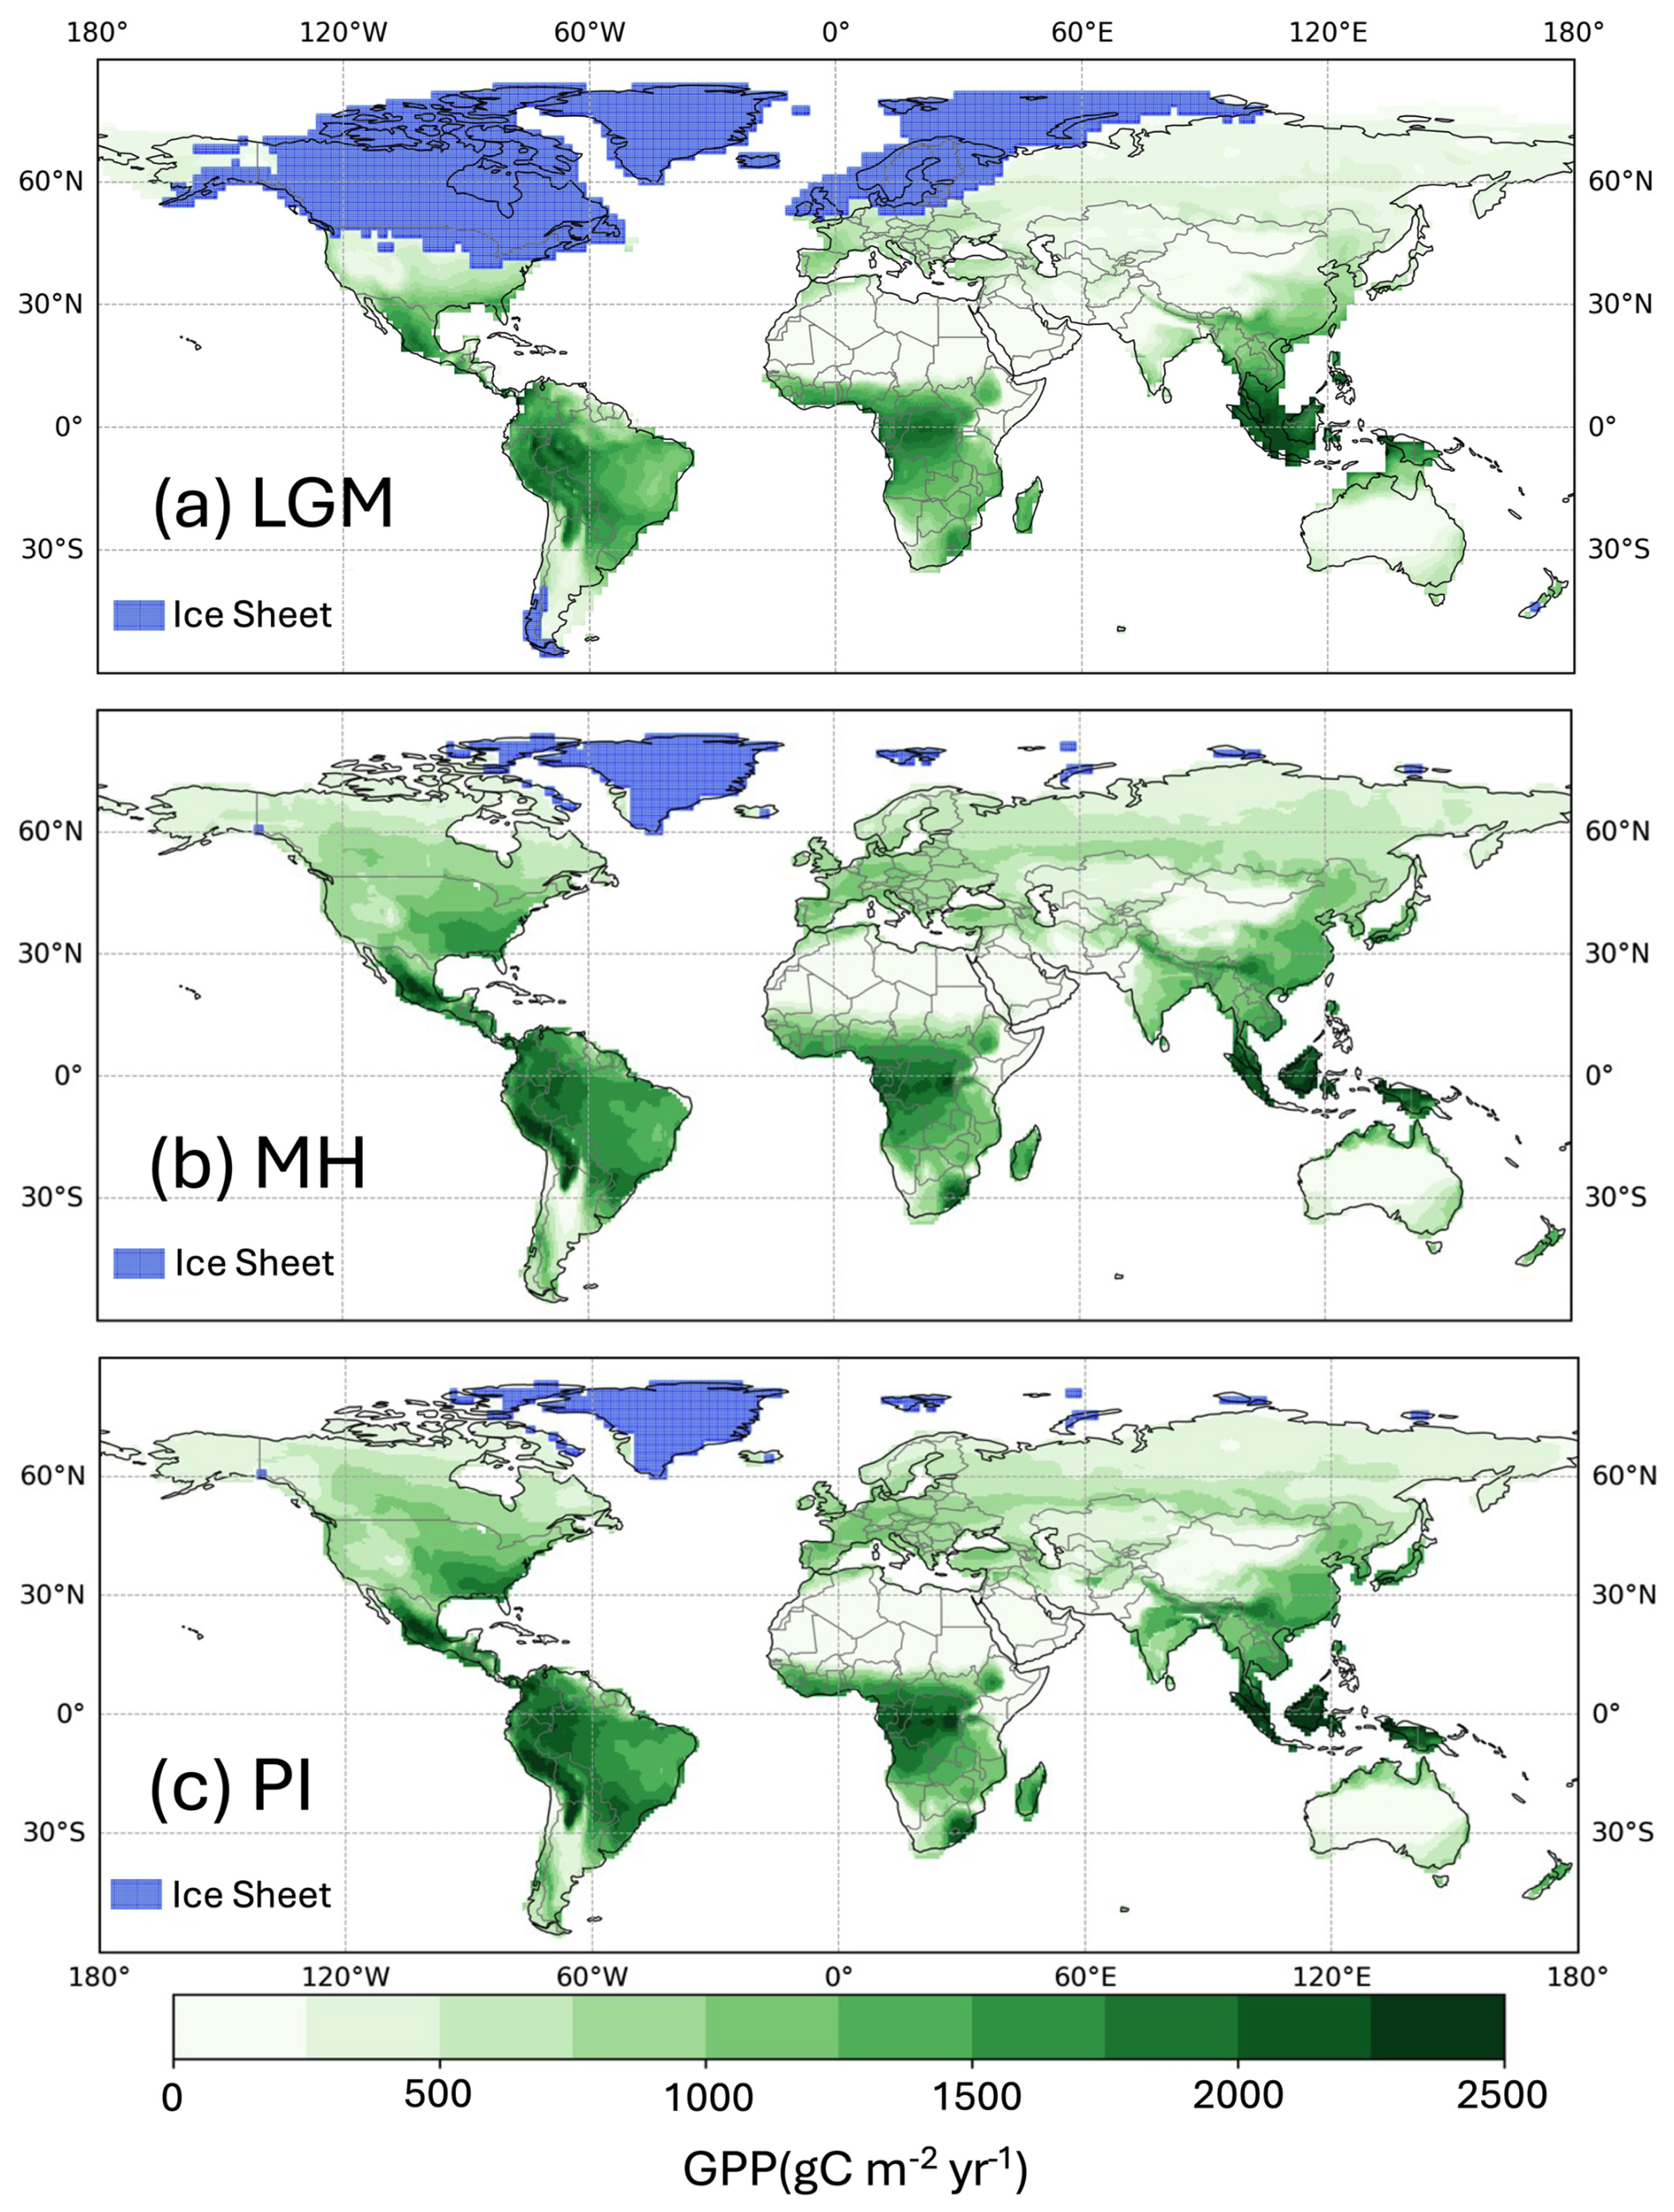
Figure 2Simulated total annual gross primary production (GPP). The plots show simulated GPP for (a) the Last Glacial Maximum (LGM), (b) the mid-Holocene (MH), and (c) the pre-industrial (PI).
Simulated GPP increased to 110.3 PgC yr−1 in the MH compared to 83.9 PgC yr−1 at the LGM. Part of this increase (10.6 PgC yr−1) was a result of vegetation growth in areas that were covered by ice sheets during the LGM. However, there were notable increases in the non-glaciated high latitudes (northern Siberia and Beringia), in tropical regions, and in areas influenced by MH monsoon expansion (Sahel, southeastern Asia, southern African savannahs, and the South American Cerrado) (Fig. 2). GPP increased in the common area between the LGM and MH experiments by ca. 32 % (Table 1), with the largest increase in the NET (Table 2). The transition from the MH to the PI resulted in a very small decrease in global GPP (Fig. 3). Simulated GPP in the MH was slightly higher (4 %) than in the PI experiment in the northern extra-topics, although still lower than in the PI in other regions (Table 2).
Table 2Regional contributions to total annual gross primary production (GPP) in the tropics, the northern extra-tropics (NET), and the southern extra-tropics (SET) in the Last Glacial Maximum (LGM), the mid-Holocene (MH), and the pre-industrial (PI) experiments.
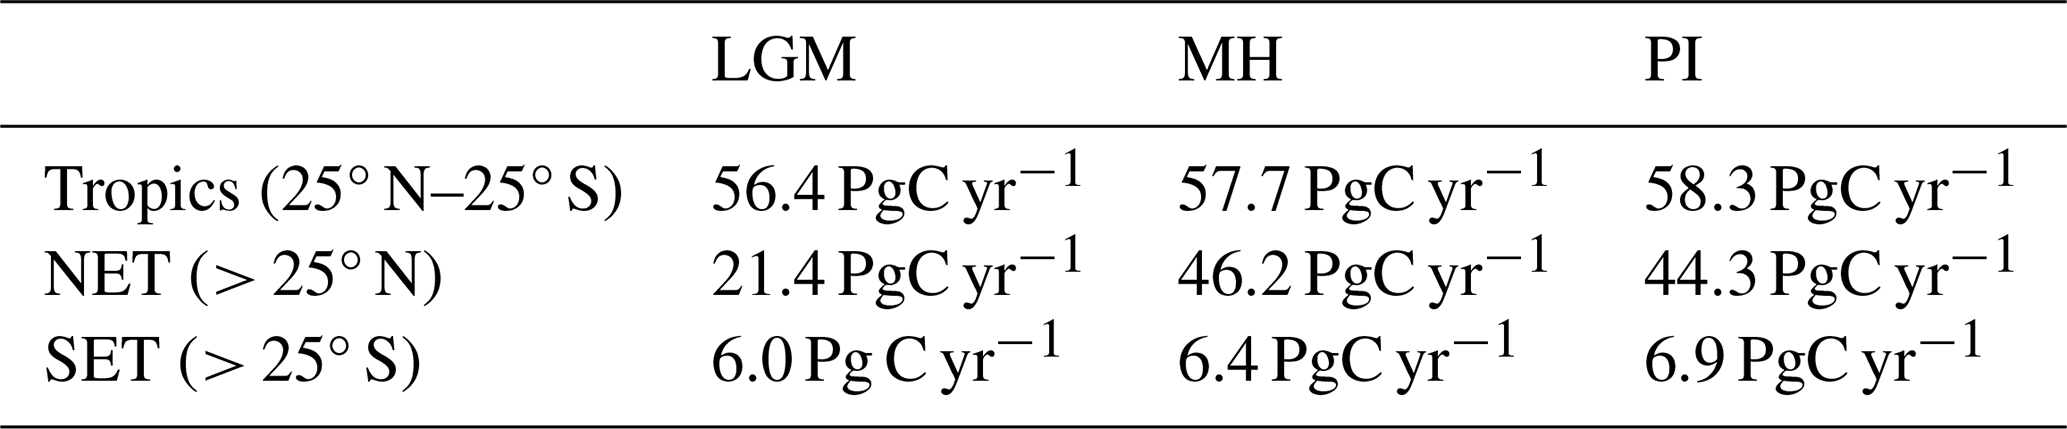
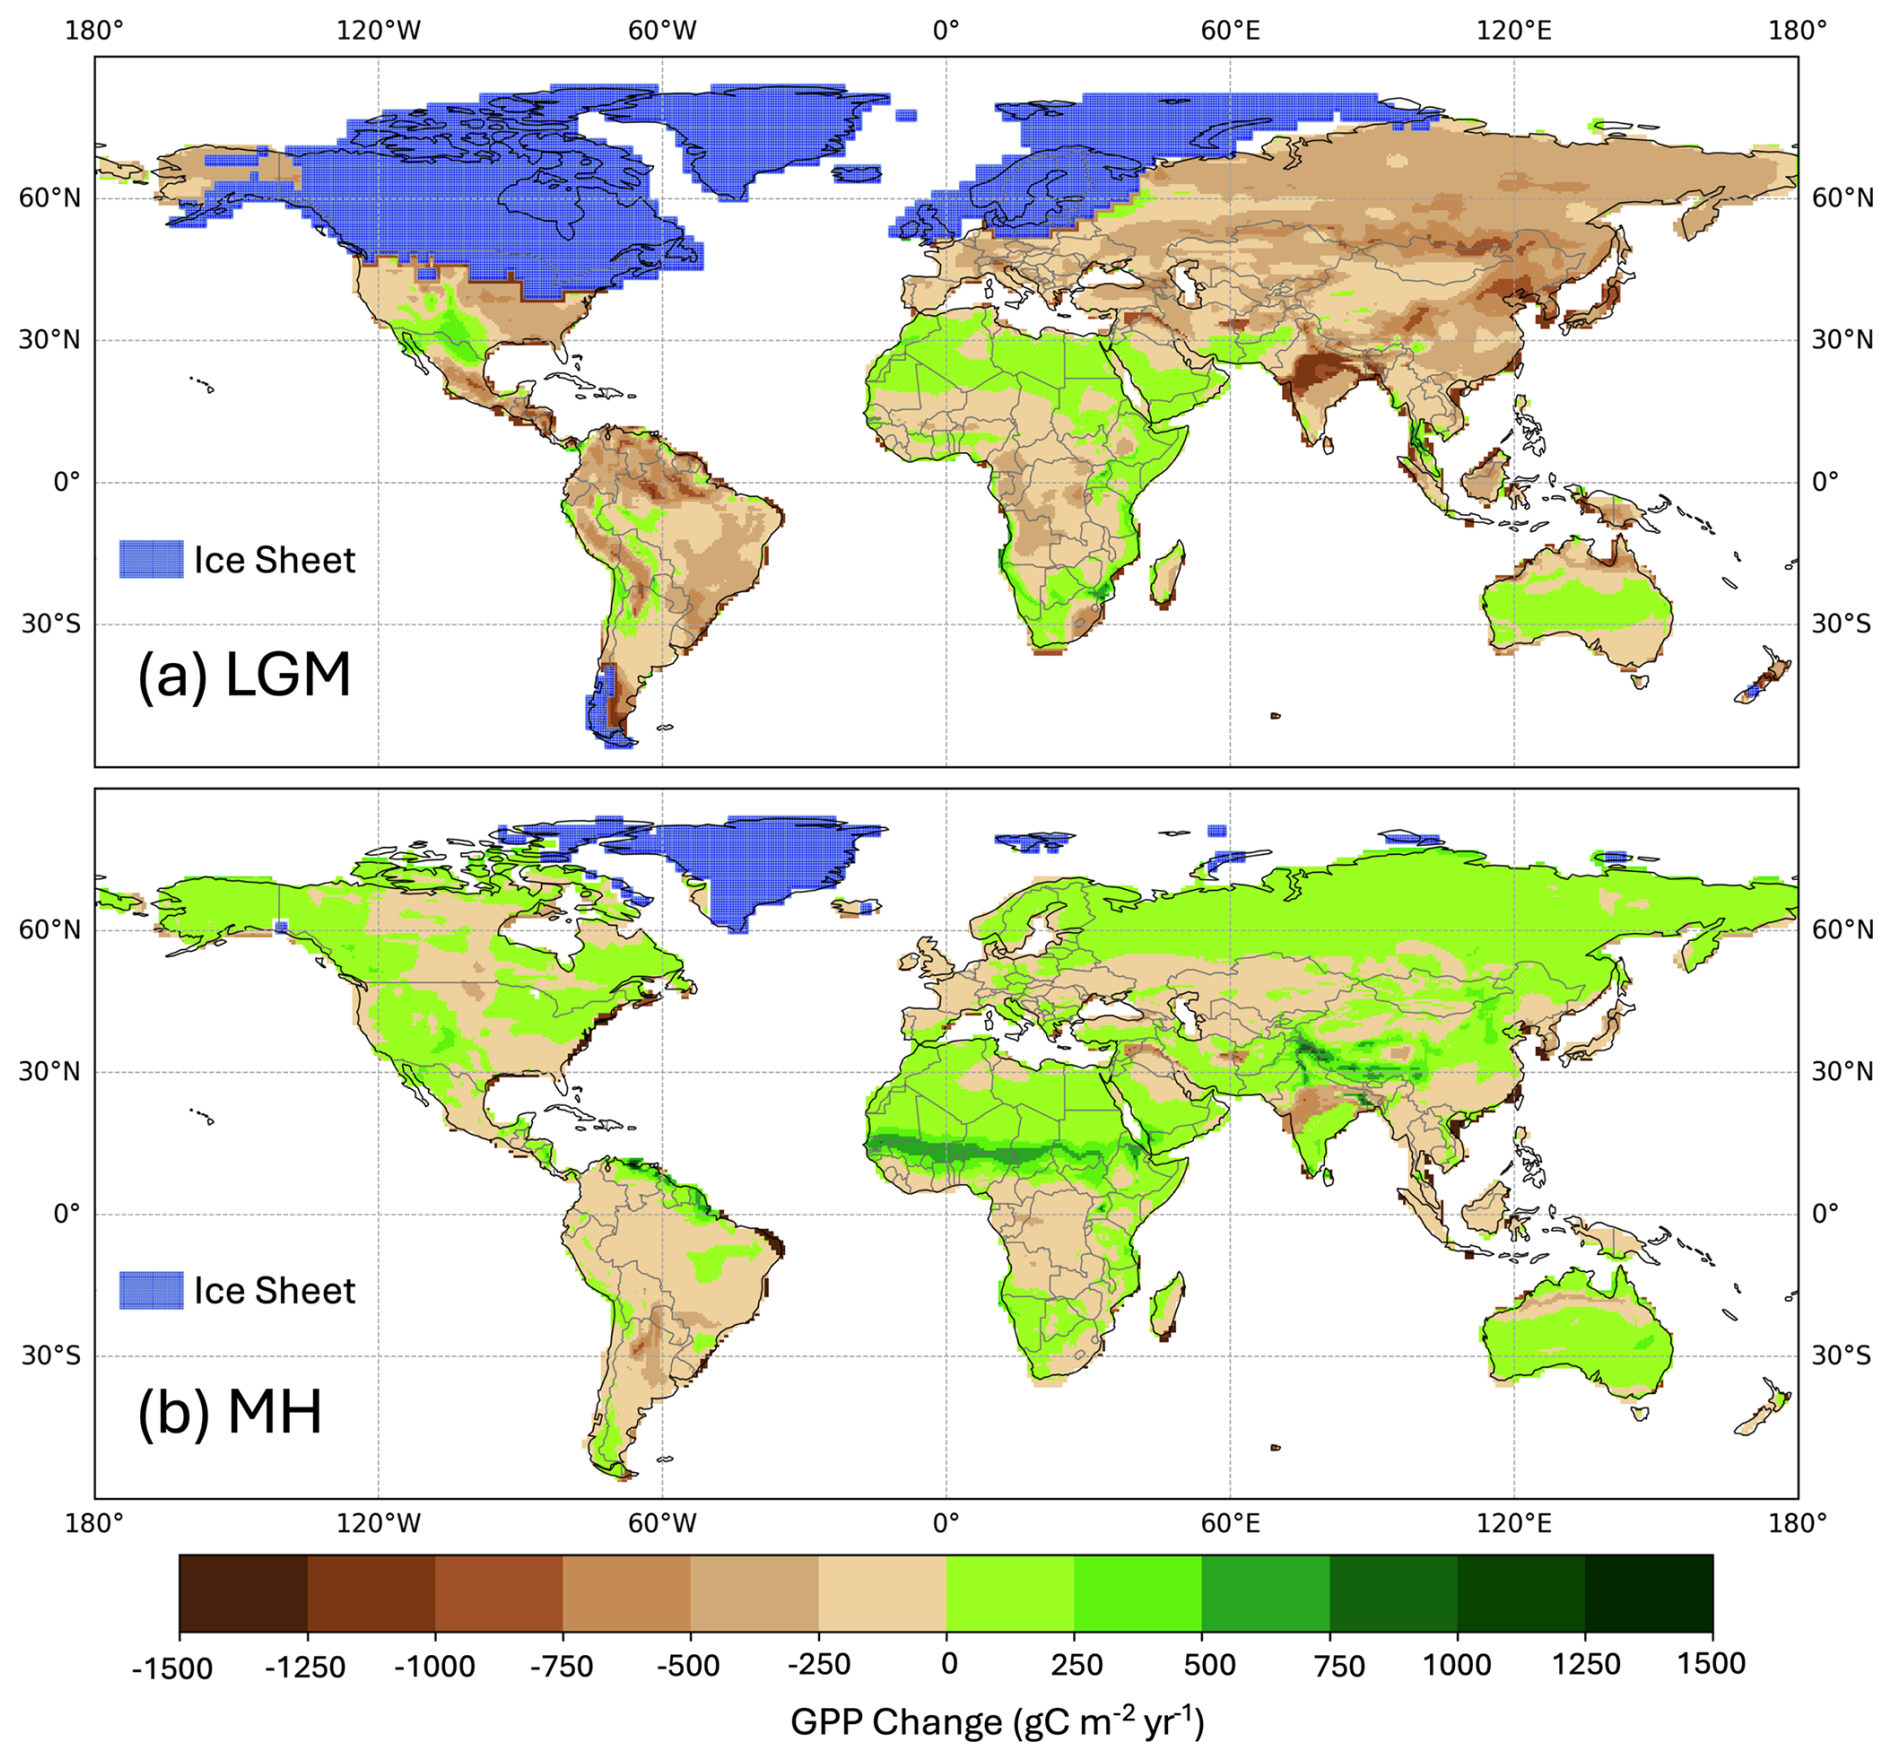
Figure 3Simulated change in total annual gross primary production (GPP) between the pre-industrial (PI) and (a) the Last Glacial Maximum (LGM) and (b) the mid-Holocene (MH).
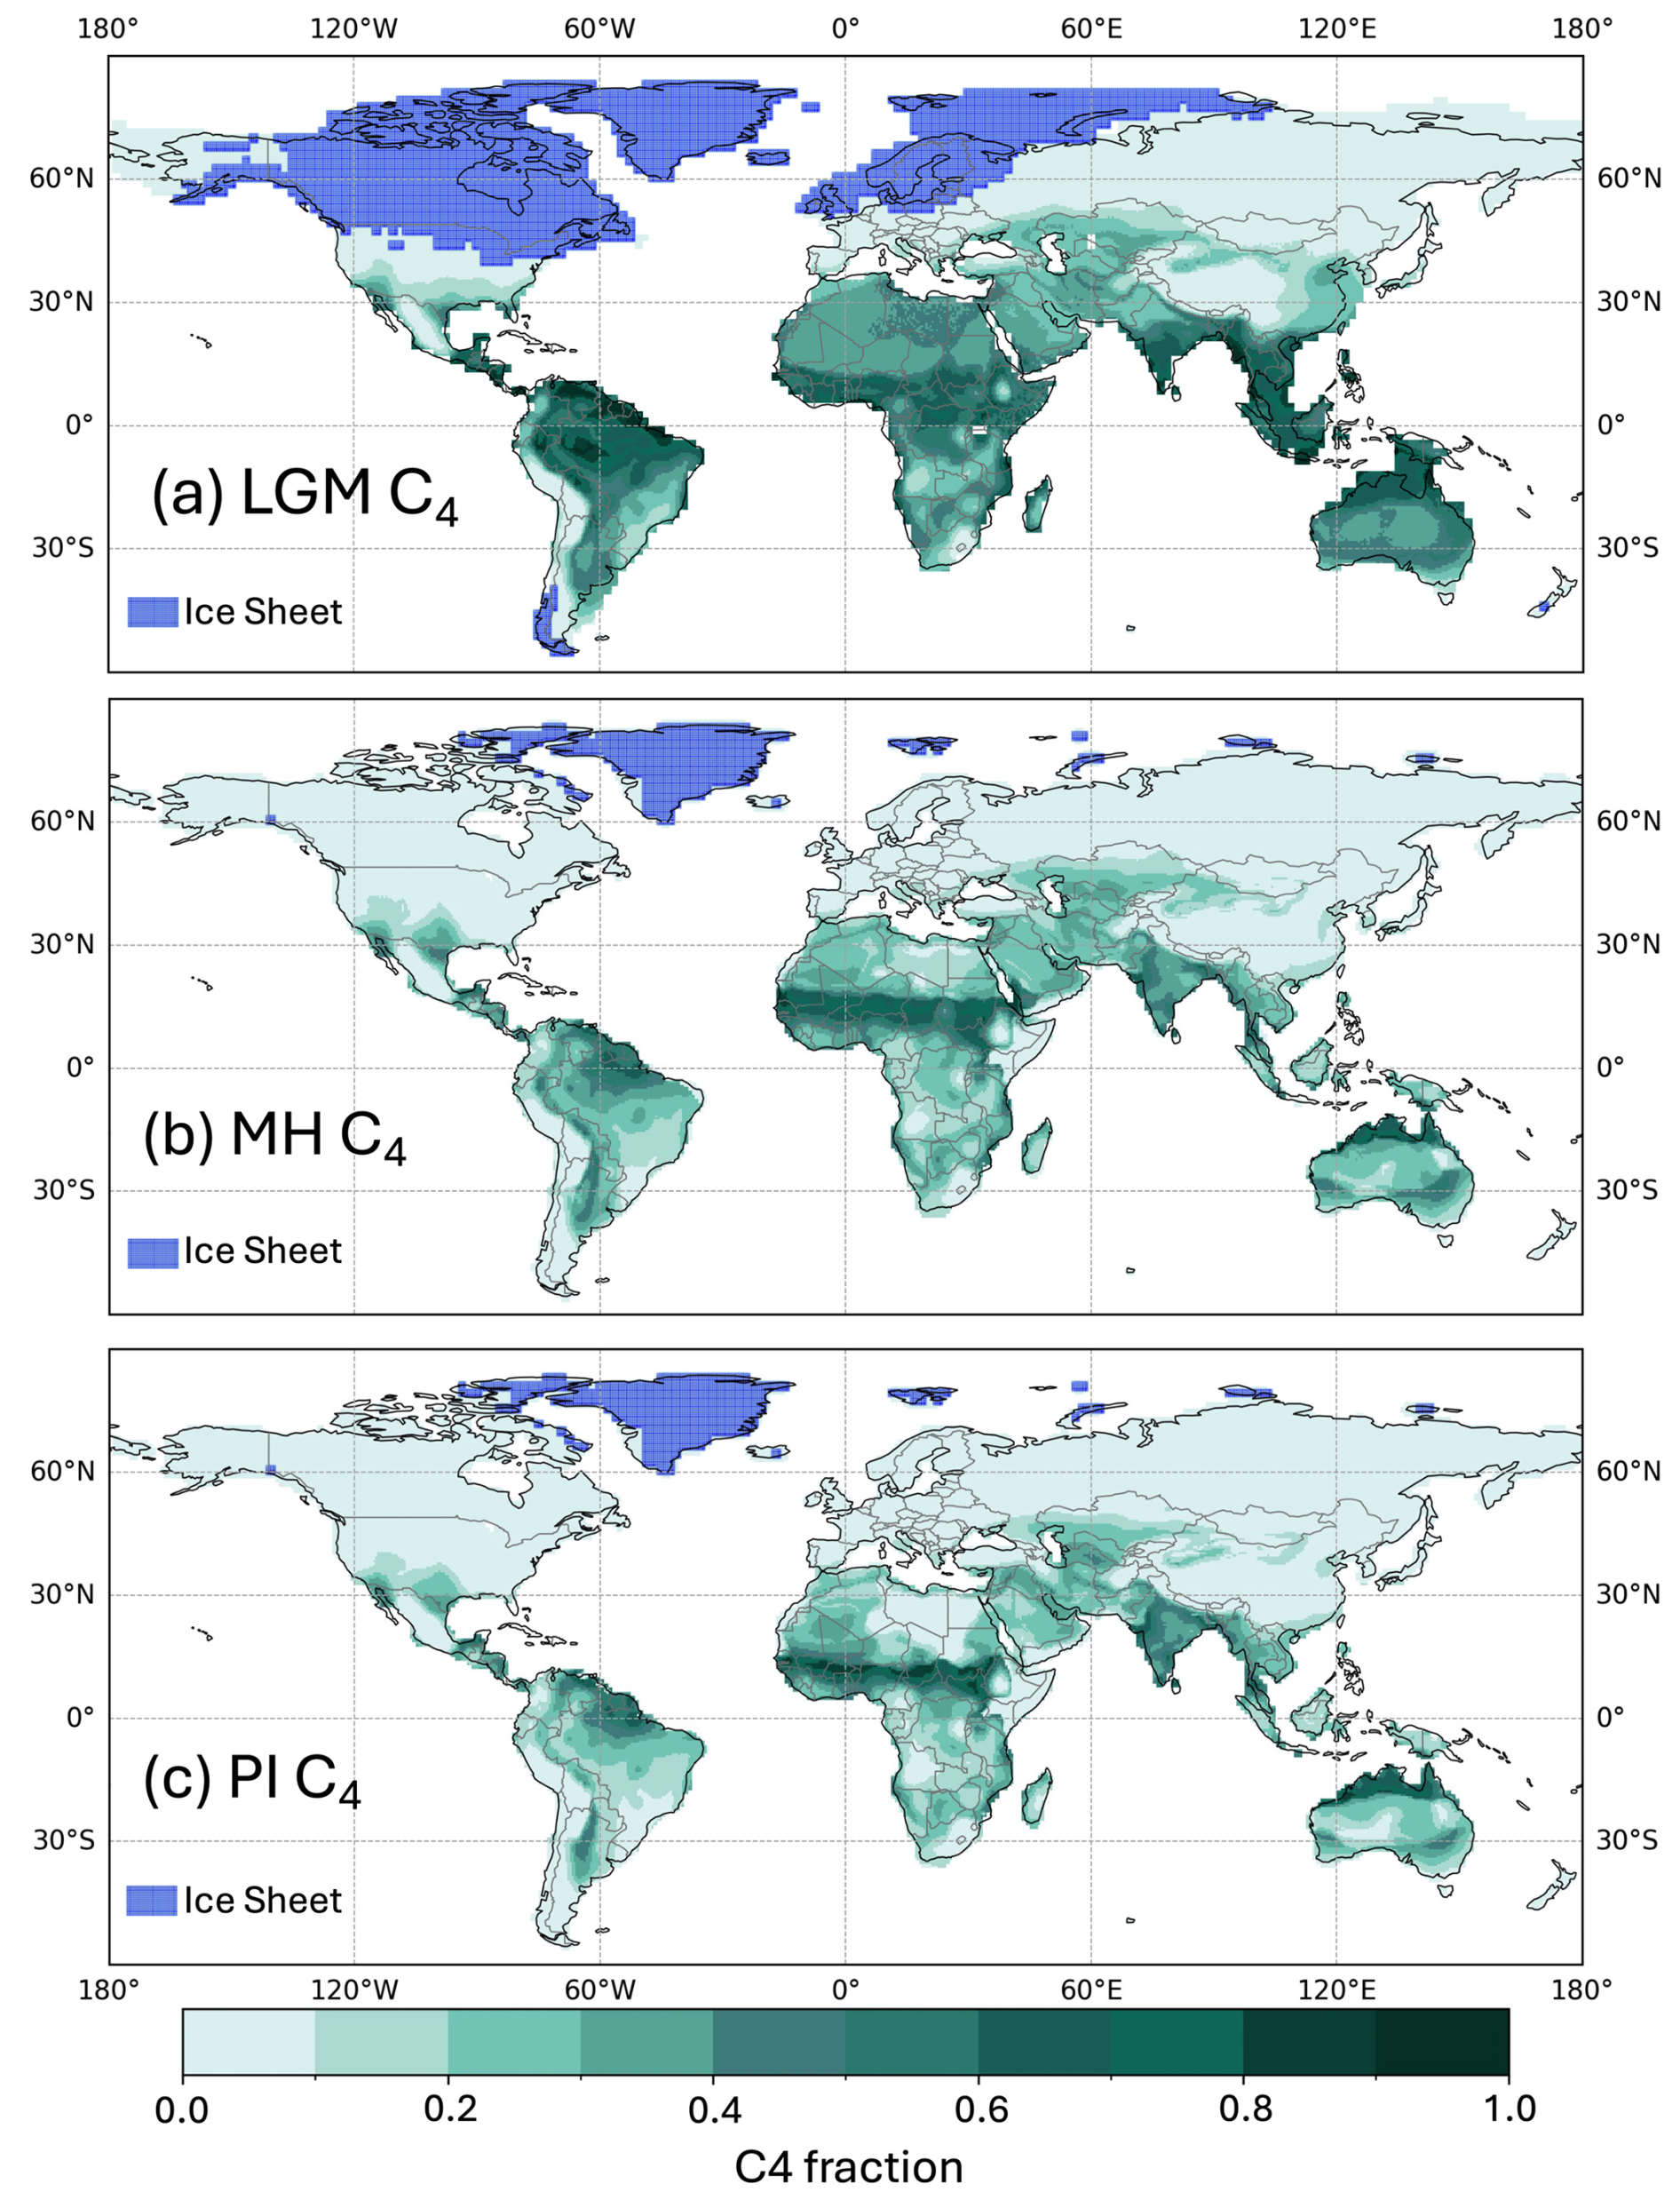
Figure 4Global C4 fraction distribution for (a) the Last Glacial Maximum (LGM), (b) the mid-Holocene (MH), and (c) the pre-industrial (PI).
These changes in GPP were accompanied by a shift in the relative importance of C3 and C4 plants (Table 3, Fig. 4). C4 plants represented 23 % and 25 % of the vegetation fraction in the PI and MH experiments, respectively, but 40 % of the vegetation fraction at the LGM. C4 plants were responsible for 56 % of the total GPP at the LGM compared to 25 % and 21 % in the MH and PI, respectively. The fraction of C4 plants increased across most regions of the world at the LGM (Supplement Fig. S1), but, in some regions, including the Central Great Plains of North America, the northern Sahel, and the Tibetan Plateau and part of the Loess Plateau in northeastern China, C4 plants were less abundant than in the PI. The areas where C4 plants were less abundant in the MH than in the PI were more extensive (Fig. S1) and are primarily in regions of northern Africa and Asia influenced by the expansion of the monsoons.
Table 3Changes in C3 C4 fraction and contribution of C3 C4 vegetation to total GPP.
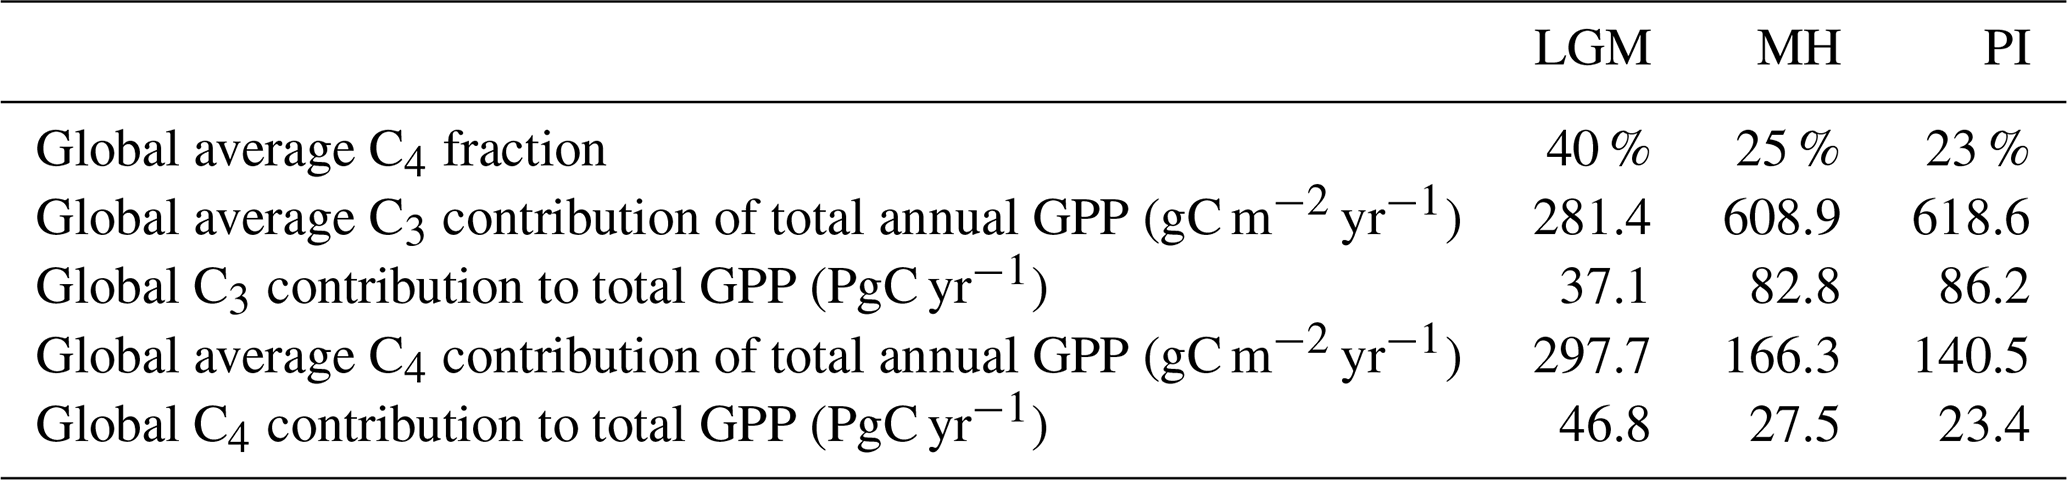
Table 4Stein–Alpert decomposition of the impact of changes in climate, CO2, and light (photosynthetic photon flux density, PPFD) and their synergies on gross primary production (GPP) at the Last Glacial Maximum (LGM) and in the mid-Holocene (MH) compared to the pre-industrial (PI) simulations. Note that the baseline GPP value for the LGM is for the common land area between this experiment and the PI simulation and is therefore smaller than the baseline GPP value for the MH decomposition.
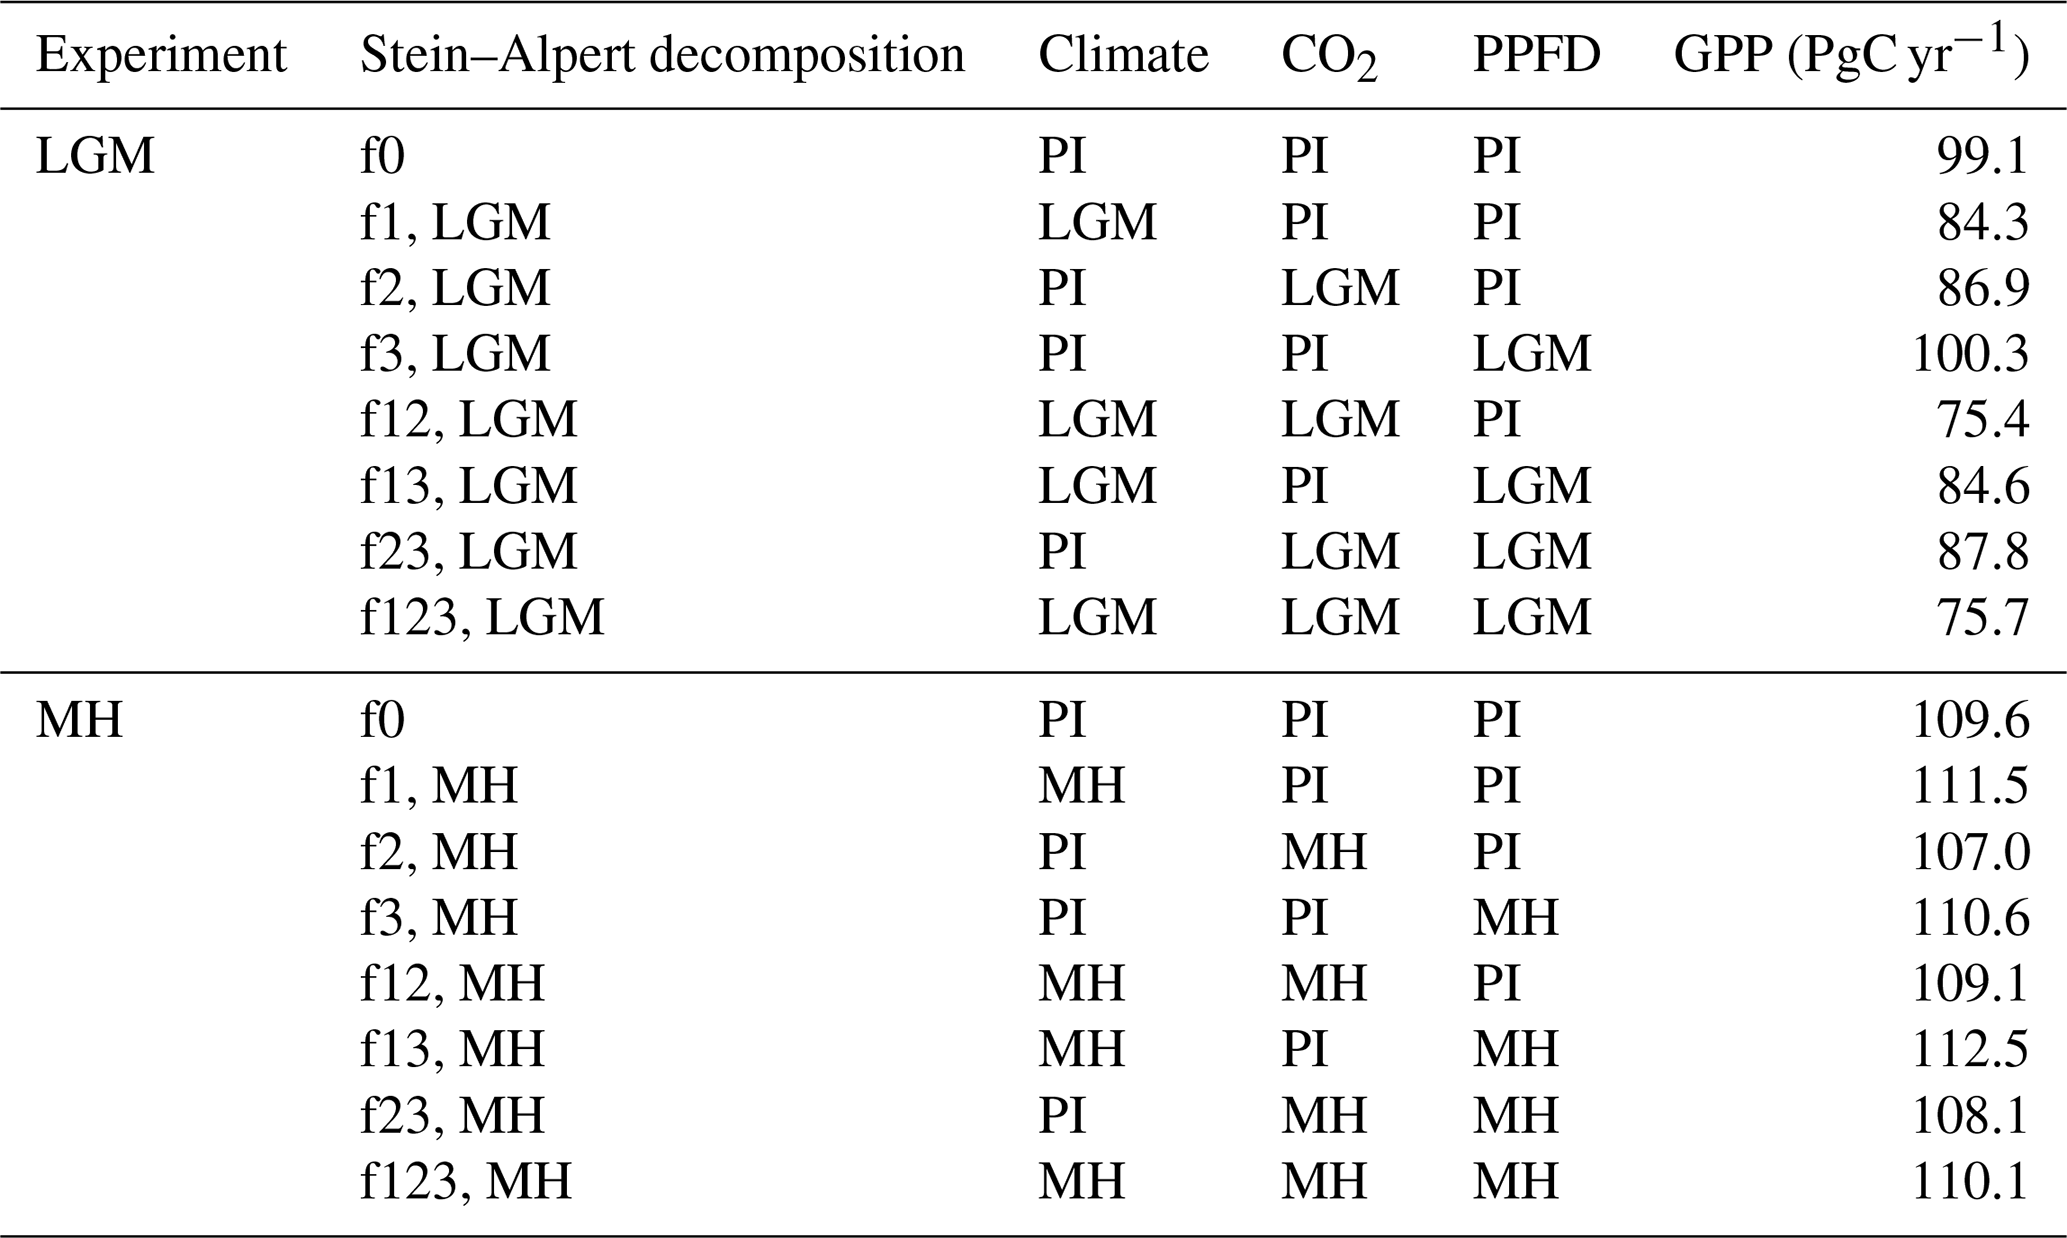
The factorial experiments showed that the changes in climate and CO2 had a large negative effect on GPP at the LGM, while light (PPFD) had a small positive effect (Table 4, Fig. 5). The shift to a colder, drier climate had a somewhat larger negative effect on plant productivity (−14.8 PgC yr−1) than the reduction in CO2 (−12.2 PgC yr−1). Climate has a major impact on reducing GPP in the high to mid-latitudes of North America and Eurasia (Figs. 6a, S2), but changes due to the lowering of CO2 were almost as important (Figs. 6b, S3). Changes in climate (Fig. S2: Table S2), most likely the overall reduction in precipitation (Fig. S5), was the most important factor causing reduced GPP in northern Amazonia, India, and northwestern China. However, the cooler climate had a positive effect on GPP in regions that are semi-arid today (Figs. S2, S5). Changes in PPFD were the dominant factor in increasing GPP at the margin at the northernmost edge of the vegetated zone downwind of the Scandinavian ice sheet and into Beringia (Fig. S4).
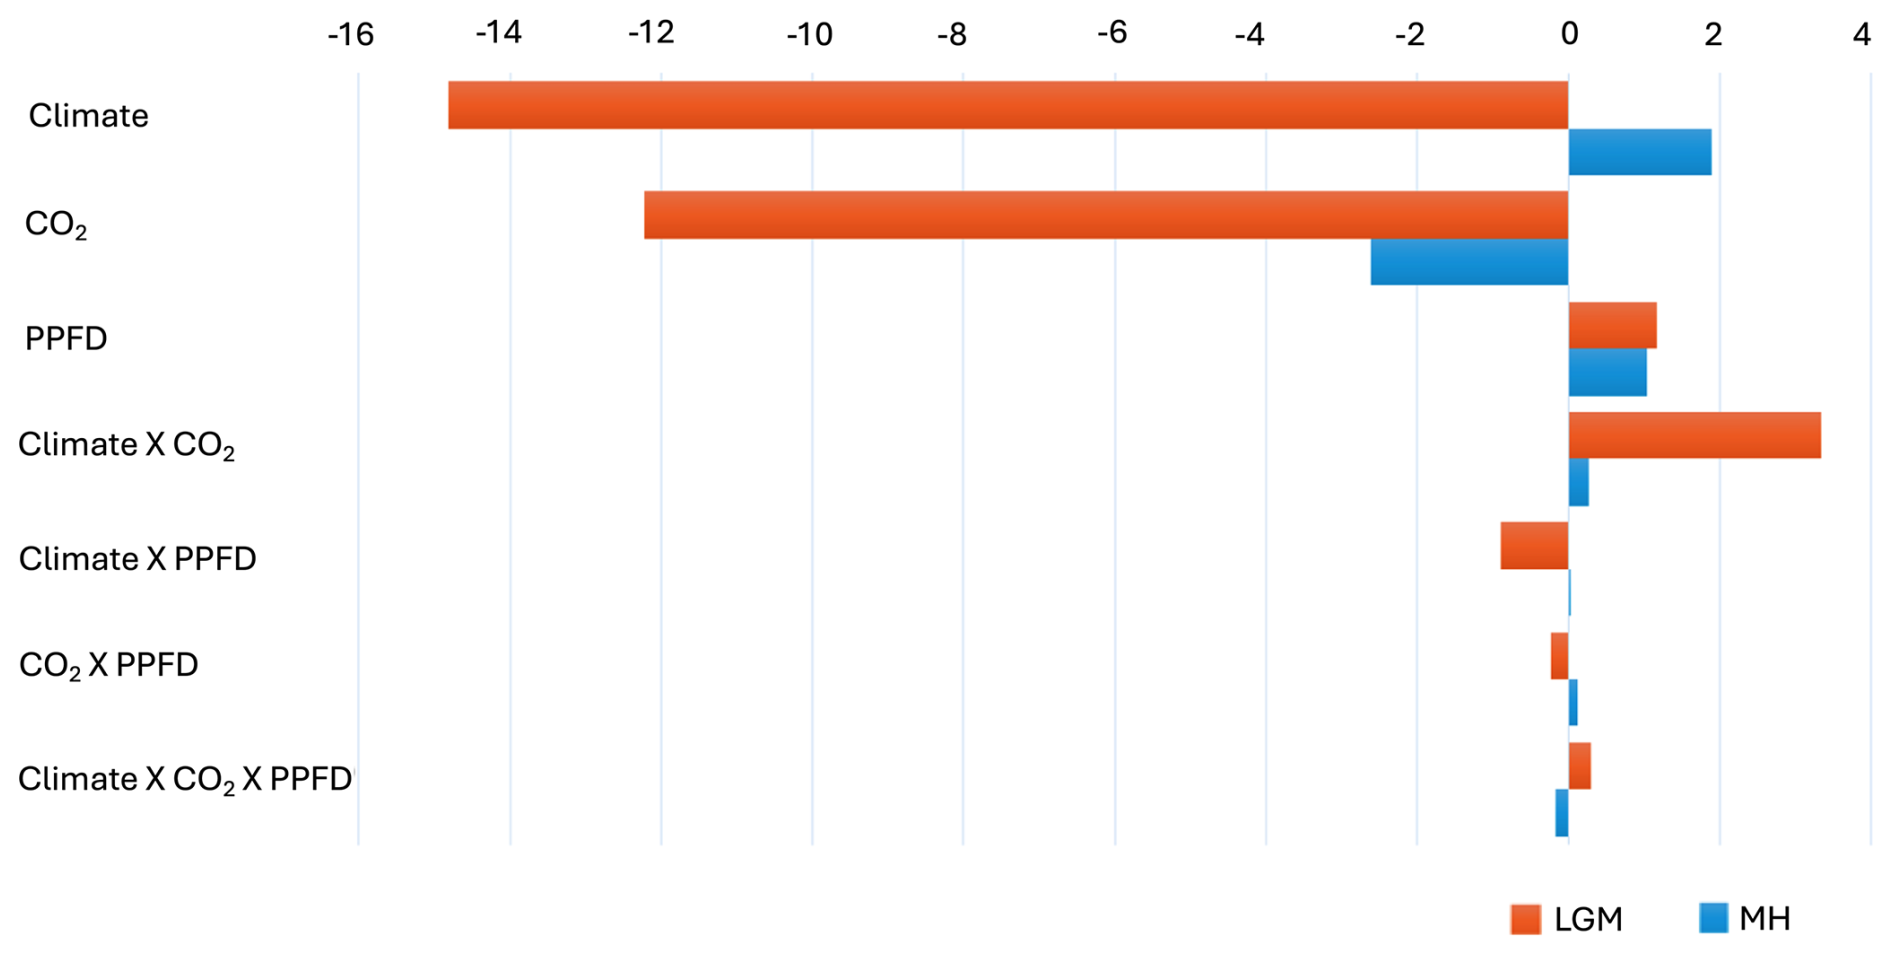
Figure 5Impact of climate, light, and CO2 on the changes in gross primary production (GPP, PgC) at the Last Glacial Maximum (LGM) and the mid-Holocene (MH) compared to the pre-industrial (PI) period. Note that the results are based on the common land area between each experiment and the PI simulation.
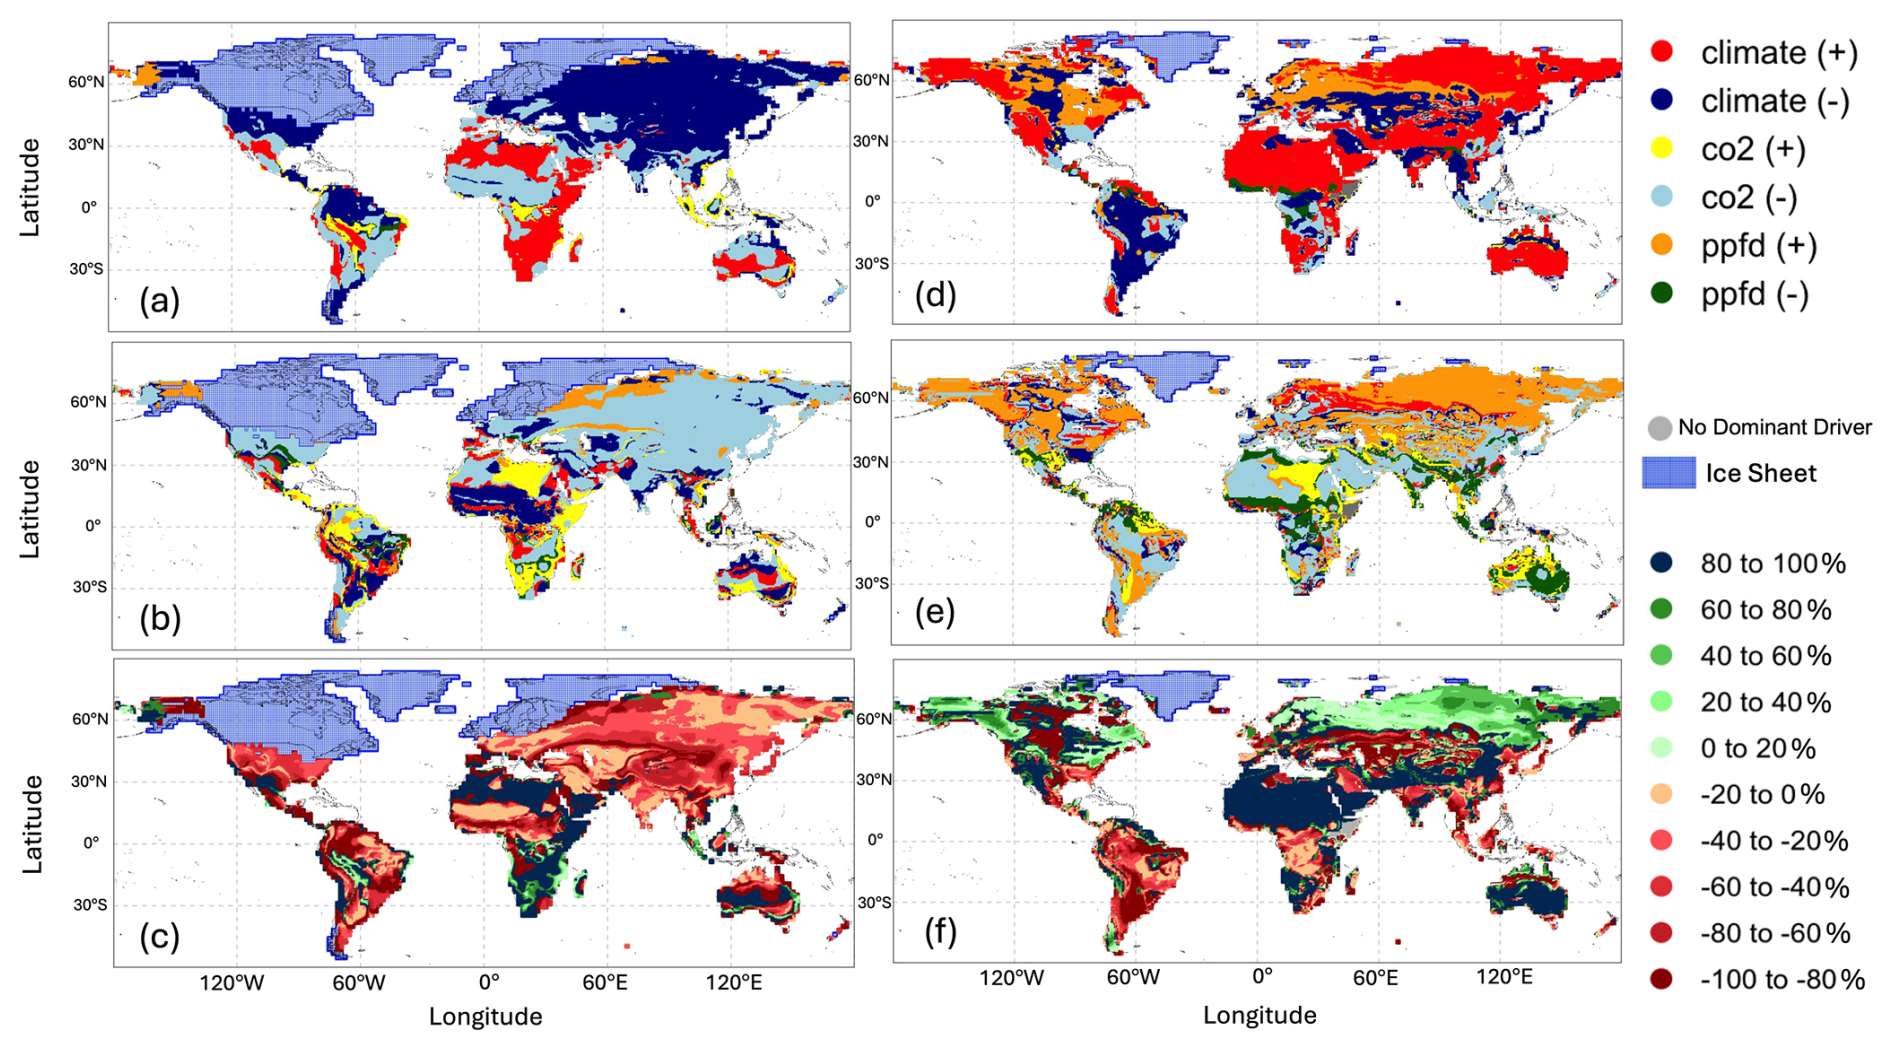
Figure 6Global distribution of (a) main drivers and constraints and (b) secondary drivers and constraints and (c) the proportional difference (percentage) of total change between the main driver and the secondary driver on gross primary production (GPP) at the Last Glacial Maximum (LGM) compared to the pre-industrial (PI) experiment; global distribution of (d) main drivers and constraints and (e) secondary drivers and constraints and (f) the proportional difference (percentage) of total change between the main driver and the secondary driver on gross primary production (GPP) in the Mid-Holocene (MH) compared to the pre-industrial (PI) experiment.
The two-way synergy between climate and CO2 was positive (Table 4, Fig. 5); i.e. the change in GPP is less than would be expected if the impacts were additive. This reflects the fact that, while lower temperatures favour C3 plants, lower CO2 offsets this and promotes the expansion of C4 plants over much of the globe (Figs. S6, S7). C4 plants were especially favoured in tropical regions, where the climate changes were relatively muted and the changes in CO2 were correspondingly more influential. The synergies of both climate and CO2 with PPFD, although small (0.9 and 0.2 PgC yr−1, respectively), are negative. The synergy between climate and PPFD probably reflects the reduced cloud cover in drier climates (Figs. S6, S8). The synergy between CO2 and PPFD stems from the fact that both low CO2 and high PPFD favour C4 plants, increasing GPP particularly in the extratropics (Figs. S7, S8).
Climate changes had a positive effect on GPP in the mid-Holocene (Table 4, Fig. 5). This likely reflects the impact of increased precipitation in regions that are now semi-arid due to monsoon expansion combined with warmer growing seasons in the high northern latitudes, both consequences of the orbitally induced changes in solar radiation (Fig. S5). These experiments also show that changes in PPFD have a positive effect on plant growth, particularly in the northern mid- to high latitudes and in now-arid regions (Fig. S4). The positive impact in northern mid- to high latitudes appears to be due to enhancement of growing season conditions for C3 plants, while the positive impact in now-arid regions reflects an increase in C4 plants (Fig. S8). However, the reduction in CO2 compared to the PI state (16 ppm) resulted in a much larger overall reduction in GPP than the enhancements due to climate or PPFD changes (Fig. S3). The impact of the lower CO2 in the mid-Holocene is the dominant factor causing reductions in GPP in southern China, in the Southern Hemisphere tropical and savannah regions in Africa, and in the Cerrado of South America (Fig. 6). The two-way synergies between the three drivers are all positive but small (Table 4, Fig. 5).
We have shown that the LGM was characterized by a large reduction in modelled GPP, while the mid-Holocene was characterized by a small increase in GPP compared to the pre-industrial state. Estimated GPP at the LGM was ca. 84 PgC yr−1 compared to ca. 110 PgC yr−1 in the PI. The simulated reduction at the LGM is consistent with previous model-based estimates (e.g. Francois et al., 1998; Prentice et al., 2011; Hoogakker et al., 2016), including those from the latest phase of the Coupled Model Intercomparison project (CMIP6/PMIP4; Table S3). However, previous estimates of GPP span a considerable range, from 40–110 PgC yr−1. This reflects differences in the boundary conditions used, differences in the vegetation models used and their sensitivity to changes in CO2, and differences in the structure and parameterizations of the climate models overall. Diagnosing the specific causes of this large range is therefore extremely difficult. The parameter-sparse nature of our EEO-based modelling approach, and the fact that the individual processes that give rise to the simulated GPP have been independently validated, suggests that our estimate of ca. 84 PgC yr−1 is more likely to be realistic than previous estimates. A limited number of studies have estimated GPP at the LGM by constraining model estimates using oxygen isotope records from ice cores (Landais et al., 2007; Ciais et al., 2011; Yang et al., 2022). The still-large range in simulated GPP (40–110 PgC yr−1) reflects, in part, uncertainties associated with estimating ocean productivity and respiration fractionation rates. Thus, although there is a consensus that GPP was considerably lower at the LGM than during pre-industrial times, and this is consistent with pollen evidence for a very large reduction in tree cover over much of the world (Prentice et al., 2000; Williams, 2003; Pickett et al., 2004; Marchant et al., 2009), the absolute magnitude of this change is uncertain. Nevertheless, since the climate simulated by the MPI ESM has been shown to reproduce pollen-based climate reconstructions better than most other CMIP6/PMIP4 models (Kageyama et al., 2021) and we use robust EEO models to estimate the change in GPP, the partitioning of the impacts of different factors in the simulated reduction in GPP is likely to be robust.
The modelled abundance of C4 plants was nearly double at the LGM compared to the pre-industrial era (40 % versus 23 % of the vegetation fraction), and C4 vegetation was responsible for 56 % of the total modelled GPP at that time. These changes are broadly consistent with pollen-based reconstructions, indicating a substantial reduction in tree cover at the LGM (Prentice et al., 2000). It is difficult to estimate the magnitude of this reduction because existing regional reconstructions have not been applied to the LGM (e.g. Zanon et al., 2018; Serge et al., 2023) and furthermore employ techniques that are based on modern calibrations and therefore do not account for the impact of CO2 on tree cover (Prentice et al., 2022). However, while pollen data can be used discriminate between trees (virtually all C3) and grasses, they cannot be used to infer changes in the importance of C3 and C4 grasses. Compound-specific δ13C analyses of leaf wax biomarkers provide evidence of the relative contribution of C3 and C4 plants (Eglinton and Eglinton, 2008; Diefendorf et al., 2010) and have shown that C4 plants were more abundant at the LGM than during the Holocene in many regions of the world, e.g. in southern Africa (Rommerskirchen et al., 2006; Vogts et al., 2012), eastern Africa (Sinninghe Damsté et al., 2011), the Himalayan Basin (Galy et al., 2008), southern China (Jiang et al., 2019), southwestern North America (Cotton et al., 2016), and northern South America (Makou et al., 2007), consistent with our simulations. There are a few regions where C4 plants were less abundant at the LGM than during the Holocene, including the Chinese Loess Plateau and the Great Plains of North America (Cotton et al., 2016). Both of these regions are identified as being characterized by reduced C4 abundance in our simulations. The consistency of the signs of the regional changes in the observed relative abundance of C3 to C4 plants to our simulated changes provides strong support for the model predictions. A number of modelling studies have shown that C4 plants were globally more abundant at the LGM (e.g. Harrison and Prentice, 2003; Bragg et al., 2013; Martin Calvo and Prentice, 2015) but did not quantify the relative contribution of C4 plants to global GPP. Thus, our analyses are consistent with previous studies of the nature of the shift in vegetation composition at the LGM and provide, for the first time, a quantitative estimate of the magnitude of this change.
Climate has a negative effect on GPP at the LGM but a positive effect in the MH. The LGM climate was globally colder and drier, although the largest changes in both temperature and precipitation were in the northern mid- to high latitudes (Kageyama et al., 2021). This is reflected in our simulations; the overall reduction in GPP compared to the pre-industrial baseline in the northern extra-tropics was 52 %, far larger than the reductions in the southern extra-tropics (13 %) or the tropics (3 %). The cooling in the ice-free regions of the northern extra-tropics reflects advection of cold air temperatures downwind from the ice sheets, while the drying largely reflects the temperature-induced reduction in evaporation and precipitation recycling (Izumi et al., 2013; Li et al., 2013; Kageyama et al., 2021). The positive effect of climate on GPP in the MH reflects changes in precipitation in regions of the sub-tropics that are now semi-arid as a result of the expansion of the Northern Hemisphere monsoons and a lengthening of the growing season in the northern mid- to high latitudes as a result of increased solar radiation in summer (Brierley et al., 2020). These changes in climate are reflected in our simulations; although the northern extra-tropics are the only region to show an overall increase in GPP compared to the pre-industrial (4 %), regions influenced by monsoon expansion, such as the Sahel and parts of Asia, also show increased GPP.
The modelled reduction in GPP by low LGM relative to pre-industrial CO2 was of similar magnitude (12 %) to that of LGM climate (15 %). Some other factorial model experiments (e.g. O'ishi and Abe-Ouchi, 2013; Claussen et al., 2013; Martin Calvo and Prentice, 2015; Chen et al., 2019b; Haas et al., 2023; see Table S4) have shown a larger impact of CO2 on primary production (either GPP or net primary production, NPP) relative to climate. For example, Claussen et al. (2013) showed reductions in NPP of 4 % due to climate and 45 % due to CO2, and Martin Calvo and Prentice (2015) showed reductions in NPP of 2 % due to climate and 23 % due to CO2. Some of differences among experiments may have been caused by differences in modelled climate (Haas et al., 2023), but changes in PFT abundance are likely to be an important additional source of uncertainty. Woillez et al. (2011) also indicate a dominant role for low glacial CO2 in reducing NPP at the LGM. In that analysis, however, a greater sensitivity of needleleaf PFTs to low CO2 compared to broadleaf PFTs was implied by choices of parameter values that were not necessarily well founded and led to an unrealistically large simulated extent of broad-leaved forests at the LGM.
In addition to the fact that these various experiments were based on different models of the LGM climate, they were also implemented using different biosphere models (Table S4), which may have different sensitivities to CO2 changes. Thus, although models agree that changes in CO2 contributed to the large observed differences between LGM and pre-industrial vegetation patterns, the magnitude of the impact of low CO2 on primary production is still uncertain. The modelled impact of lowered CO2 on GPP in the MH here is larger than the impact of climate, offsetting the positive impacts of climate change in the MH experiment. The importance of CO2 in driving vegetation changes has been widely commented on for the LGM (Polley et al., 1993; Jolly and Haxeltine, 1997; Cowling and Sykes, 1999; Harrison and Prentice, 2003; Flores et al., 2009; Prentice et al., 2011; Bragg et al., 2013; Martin Calvo and Prentice, 2015) and in the context of ongoing and future climate changes (Piao et al., 2006; Keenan et al., 2013; Archer et al., 2017; Haverd et al., 2020: Piao et al., 2020), but its role in offsetting the positive impacts of climate change in the MH has not been widely noted. The simulated overall change in GPP in the MH compared to the PI is small (< 1 PgC yr−1). Nevertheless, the changes in response to individual drivers are consistent with expectations: changes in climate and PPFD had a positive impact on GPP, while the reduction in CO2 in the MH compared to the PI had a negative impact on GPP. The positive effect of climate on GPP in the MH reflects changes in precipitation in regions of the sub-tropics that now semi-arid, as a result of the orbitally induced expansion of the Northern Hemisphere monsoons and the lengthening of the growing season in the northern mid- to high latitudes (Brierley et al., 2020). These changes in climate are reflected in our simulations. The northern extratropics are the only region to show an overall increase in GPP compared to the pre-industrial (4 %) when CO2 effects are included, but regions influenced by monsoon expansion, such as the Sahel and parts of southern and eastern Asia, also show a tendency to increased GPP due to the MH climate.
We have derived climate inputs from the MPI ESM. When compared to reconstructions of both marine and terrestrial climate variables, the MPI ESM has been shown to be among the best-performing models both for the LGM and for the mid-Holocene (Brierley et al., 2020; Kageyama et al., 2021). Nevertheless, the use of a single climate model is a limitation of this study. It would be useful to repeat these analyses with a wider range of models that have created palaeoclimate simulations of these two key periods, but the constraint is that most of these models do not provide information on changes in tree cover that is needed to run the C3 C4 competition model.
We have used a sequence of EEO-based models to simulate GPP and the relative contribution of C3 and C4 plants to overall productivity. Haas et al. (2023) also used the P model to simulate GPP at the LGM. Other studies of past vegetation changes have used models that simulate changes in past vegetation on the basis of the competition between PFTs. PFT-based models require key physiological parameters to be specified separately for each PFT. The EEO modelling approaches used here avoid this complexity, considerably reducing uncertainties due to model parameterization (Harrison et al., 2021) while at the same time representing the key processes of photosynthesis and plant growth accurately (Wang et al., 2017; Smith et al., 2019; Jiang et al., 2020; Lavergne et al., 2020; Peng et al., 2020; Smith and Keenan, 2020; Wang et al., 2020; Xu et al., 2021; Zhu et al., 2022). Furthermore, they capture recent trends in vegetation growth more accurately than the land-surface models used to predict the terrestrial carbon cycle (Cai et al., 2025; Zhou et al., 2025). Given their simplicity, the fact that the very few parameters required are well constrained from observations, and the demonstrated quality of their performance, EEO modelling holds considerable promise for understanding past vegetation changes and their impact on climate.
Eco-evolutionary optimality approaches provide a robust way of modelling vegetation changes under different climate regimes. We compared simulated changes in GPP and C3 C4 plant abundance in a cold glacial and a warm interglacial period relative to the pre-industrial state. We showed that the colder, drier climate at the LGM substantially decreases GPP and that the warmer, wetter climate of the MH increases GPP. Changes in vegetation productivity caused by the lower CO2 in both intervals compared to the pre-industrial contributed to the reduction in GPP at the LGM and was sufficient to annul the positive impacts of climate on GPP during the MH. These results point to the importance of a realistic treatment of the direct physiological impacts of CO2 on plant growth to simulate realistic ecosystem changes, both in the past and in the future.
The CMIP6 MPI-ESM1-2-LR outputs are accessible via the Earth System Grid Federation (ESGF) at http://esgf-node.llnl.gov/search/cmip6/ (Earth System Federation Grid, 2025). Interpolated input data and derived outputs related to this study are available at https://doi.org/10.5281/zenodo.14257604 (Zhao et al., 2024). The documentation for the P model, the C3 C4 competition model, and the SPLASH model can be found at https://doi.org/10.5281/zenodo.8366848 (Orme and Marion, 2023). The codes used for model coupling and experiment analysis used in this paper are available at https://doi.org/10.5281/zenodo.14257604 (Zhao et al., 2024).
The supplement related to this article is available online at https://doi.org/10.5194/esd-16-1655-2025-supplement.
JZ, SPH, and ICP designed the study. BZ provided model code. JZ ran the experiments. JZ and SPH conducted the analyses. SPH wrote the first version of the article, and all co-authors contributed to the final version.
The contact author has declared that none of the authors has any competing interests.
Publisher's note: Copernicus Publications remains neutral with regard to jurisdictional claims made in the text, published maps, institutional affiliations, or any other geographical representation in this paper. While Copernicus Publications makes every effort to include appropriate place names, the final responsibility lies with the authors. Views expressed in the text are those of the authors and do not necessarily reflect the views of the publisher.
Jierong Zhao and Sandy P. Harrison acknowledge NERC funding for the project “When and Why does it Rain in the Desert: Utilising unique stalagmite and dust records on the northern edge of the Sahara”. This work is a contribution to the Land Ecosystem Models based On New Theory, obseRvations and ExperimEnts (LEMONTREE) project (SPH, ICP). LEMONTREE research received support through Schmidt Sciences, LLC. Colin Prentice also acknowledges funding from the European Research Council for the project Re-inventing Ecosystem And Land-surface Models (REALM), grant no. 787203.
This research has been supported by the Natural Environment Research Council (grant no. NE/W00075X/1); Schmidt Sciences, LLC (grant no. 355); and the European Research Council, EU HORIZON EUROPE European Research Council (grant no. 787203).
This paper was edited by Anping Chen and reviewed by three anonymous referees.
Archer, S. R., Andersen, E. M., Predick, K. I., Schwinning, S., Steidl, R. J., and Woods, S. R.: Woody plant encroachment: Causes and consequences, in: Rangeland Systems, edited by: Briske, D., Springer Series on Environmental Management, Springer, Cham, https://doi.org/10.1007/978-3-319-46709-2_2, 2017.
Berger, A. L.: Long-term variations of caloric insolation resulting from the earth's orbital elements, Quat. Res., 9, 139–167, 1978.
Berger, A. and Loutre, M. F.: insolation values for the climate of the last 10 000 000 years, Quat. Sci. Rev., 10, 297–317, https://doi.org/10.1016/0277-3791(91)90033-q, 1991.
Bonan, G. B.: Forests and climate change: Forcings, feedbacks, and the climate benefits of forests, Science, 320, 1444–1449, 2008.
Bragg, F. J., Prentice, I. C., Harrison, S. P., Eglinton, G., Foster, P. N., Rommerskirchen, F., and Rullkötter, J.: Stable isotope and modelling evidence for CO2 as a driver of glacial–interglacial vegetation shifts in southern Africa, Biogeosciences, 10, 2001–2010, https://doi.org/10.5194/bg-10-2001-2013, 2013.
Brierley, C. M., Zhao, A., Harrison, S. P., Braconnot, P., Williams, C. J. R., Thornalley, D. J. R., Shi, X., Peterschmitt, J.-Y., Ohgaito, R., Kaufman, D. S., Kageyama, M., Hargreaves, J. C., Erb, M. P., Emile-Geay, J., D'Agostino, R., Chandan, D., Carré, M., Bartlein, P. J., Zheng, W., Zhang, Z., Zhang, Q., Yang, H., Volodin, E. M., Tomas, R. A., Routson, C., Peltier, W. R., Otto-Bliesner, B., Morozova, P. A., McKay, N. P., Lohmann, G., Legrande, A. N., Guo, C., Cao, J., Brady, E., Annan, J. D., and Abe-Ouchi, A.: Large-scale features and evaluation of the PMIP4-CMIP6 midHolocene simulations, Clim. Past, 16, 1847–1872, https://doi.org/10.5194/cp-16-1847-2020, 2020.
Cai, W. and Prentice, I.C.: Recent trends in gross primary production and their drivers: analysis and modelling at flux-site and global scales, Environ. Res. Lett., 15, 124050, https://doi.org/10.1088/1748-9326/abc64e, 2020.
Cai, W., Zhu, Z., Harrison, S. P., Ryu, Y., Wang, H., Zhou, B., and Prentice, I. C.: A unifying principle for global greenness patterns and trends, Nat. Comm. Environ., 6, 19, https://doi.org/10.1038/s43247-025-01992-0, 2025.
Chen, J. M., Ju, W., Ciais, P., Viovy, N., Liu, R., Liu, Y., and Lu, X.: Vegetation structural change since 1981 significantly enhanced the terrestrial carbon sink, Nat. Commun., 10, 4259, https://doi.org/10.1038/s41467-019-12257-8, 2019a.
Chen, W., Zhu, D., Ciais, P., Huang, C., Viovy, N., and Kageyama, M.: Response of vegetation cover to CO2 and climate changes between Last Glacial Maximum and pre- industrial period in a dynamic global vegetation model, Quat. Sci. Rev., 218, 293–305, https://doi.org/10.1016/j.quascirev.2019.06.003, 2019b.
Ciais, P., Tagliabue, A., Cuntz, M., Bopp, L., Scholze, M., Hoffmann, G., Lourantou, A., Harrison, S. P., Prentice, I. C., Kelley, D. I., Kovan, C., and Piao, S. L.: Large inert carbon pool in the terrestrial biosphere at the Last Glacial Maximum, Nature Geosci., 5, 74–79, https://doi.org/10.1038/NGEO1324, 2011.
Claussen, M., Selent, K., Brovkin, V., Raddatz, T., and Gayler, V.: Impact of CO2 and climate on Last Glacial maximum vegetation – a factor separation, Biogeosciences, 10, 3593–3604, https://doi.org/10.5194/bg-10-3593-2013, 2013.
Cotton, J. M., Cerling, T. E., Hoppe, K. A., Mosier, T. M., and Still, C. J.: Climate, CO2, and the history of North American grasses since the Last Glacial Maximum, Sci. Adv., 2, e1501346, https://doi.org/10.1126/sciadv.1501346, 2016.
Cowling, S. A. and Sykes, M. T.: Physiological significance of low atmospheric CO2 for plant-climate interactions, Quat. Res., 52, 237–242, 1999.
Davis, T. W., Prentice, I. C., Stocker, B. D., Thomas, R. T., Whitley, R. J., Wang, H., Evans, B. J., Gallego-Sala, A. V., Sykes, M. T., and Cramer, W.: Simple process-led algorithms for simulating habitats (SPLASH v.1.0): robust indices of radiation, evapotranspiration and plant-available moisture, Geosci. Model Dev., 10, 689–708, https://doi.org/10.5194/gmd-10-689-2017, 2017.
Diefendorf, A. F., Mueller, K. E., Wing, S. L., Koch, P. L., and Freeman, K. H.: Global patterns in leaf 13C discrimination and implications for studies of past and future climate, P. Natl. Acad. Sci. USA, 107, 5738–5743, 2010.
Earth System Federation Grid: CMIP6 MPI-ESM1-2-LR outputs, http://esgf-node.llnl.gov/search/cmip6/, last access: 2 December 2024.
Eglinton, T. I. and Eglinton, G.: Molecular proxies for paleoclimatology, Earth Planet. Sci. Lett., 275, 1–16, 2008.
Farquhar, G. D., von Caemmerer, S., and Berry, J. A.: A biochemical model of photosynthetic CO2 assimilation in leaves of C3 species, Planta, 149, 78–90, 1980.
Flores, O., Gritti, E. S., and Jolly, D.: Climate and CO2 modulate the C3 C4 balance and δ13C signal in simulated vegetation, Clim. Past, 5, 431–440, https://doi.org/10.5194/cp-5-431-2009, 2009.
Foley, J. A.: The sensitivity of the terrestrial biosphere to climatic change: A simulation of the Middle Holocene, Glob. Biogeochem. Cycles, 8, 505–525, https://doi.org/10.1029/94GB01636, 1994.
Forzieri, G., Miralles, D. G., Ciais, P., Alkama, R., Ryu, Y., Duveiller, G., Zhang, K., Robertson, E., Kautz, M., Martens, B., Jiang, C., Arneth, A., Georgievski, G., Li, W., Ceccherini, G., Anthoni, P., Lawrence, P., Wiltshire, A., Pongratz, J., Piao, S., Sitch, S., Goll, D. S., Arora, V. K., Lienert, S., Lombardozzi, D., Kato, E., Nabel, J. E. M. S., Tian, H., Friedlingstein, P., and Cescatti, A.: Increased control of vegetation on global terrestrial energy fluxes, Nature Clim. Change, 10, 356–362, https://doi.org/10.1038/s41558-020-0717-0, 2020.
François, L. M., Delire, C., Warnant, P., and Munhoven, G.: Modelling the glacial–interglacial changes in the continental biosphere, Glob. Planet. Change, 16–17, 37–52, https://doi.org/10.1016/S0921-8181(98)00005-8, 1998.
François, L. M., Goddéris, Y., Warnant, P., Ramstein, G., de Noblet, N., and Lorenz, S.: Carbon stocks and isotopic budgets of the terrestrial biosphere at mid-Holocene and last glacial maximum times, Chem. Geol., 159, 163–189, https://doi.org/10.1016/S0009-2541(99)00038-8, 1999.
Galy, V., François, L., France-Lanord, C., Faure, P., Kudrass, H., Palhol, F., and Singh, S. K.: C4 plants decline in the Himalayan basin since the Last Glacial Maximum, Quat. Sci. Rev., 27, 1396–1409, https://doi.org/10.1016/j.quascirev.2008.04.005, 2008.
Gerhart, L. M. and Ward, J. K.: Plant responses to low [CO2] of the past, New Phytol., 188, 674–695, https://doi.org/10.1111/j.1469-8137.2010.03441.x, 2010.
Haas, O., Prentice, I. C., and Harrison, S. P.: The response of wildfire regimes to Last Glacial Maximum carbon dioxide and climate, Biogeosciences, 20, 3981–3995, https://doi.org/10.5194/bg-20-3981-2023, 2023.
Harrison, S. P. and Prentice, I. C.: Climate and CO2 controls on global vegetation distribution at the last Glacial Maximum: analysis based on palaeovegetation data, biome modelling and palaeoclimate simulations, Glob. Chang. Biol., 9, 983–1004, 2003
Harrison, S.P., Cramer, W., Franklin, O., Prentice, I.C., Wang, H., Brännström, Å., de Boer, H., Dieckmann, U., Joshi, J., Keenan, T.F., Lavergne, A., Manzoni, S., Mengoli, G., Morfopoulos, C., Peñuelas, J., Pietsch, S., Rebel, K. T., Ryu, Y., Smith, N. G., Stocker, B. D., and Wright, I. J.: Eco-evolutionary optimality as a means to improve vegetation and land-surface models, New Phytol., 231, 2125–2141, https://doi.org/10.1111/nph.17558, 2021.
Haverd, V., Smith, B., Canadell, J. G., Cuntz, M., Mikaloff-Fletcher, S., Farquhar, G., Woodgate, W., Briggs, P. R., and Trudinger, C. M.: Higher than expected CO2 fertilization inferred from leaf to global observations, Glob. Chang. Biol. 26, 2390–2402, https://doi.org/10.1111/gcb.14950, 2020.
Hoek van Dijke, A. J., Mallick, K., Schlerf, M., Machwitz, M., Herold, M., and Teuling, A. J.: Examining the link between vegetation leaf area and land–atmosphere exchange of water, energy, and carbon fluxes using FLUXNET data, Biogeosciences, 17, 4443–4457, https://doi.org/10.5194/bg-17-4443-2020, 2020.
Hoogakker, B. A. A., Smith, R. S., Singarayer, J. S., Marchant, R., Prentice, I. C., Allen, J. R. M., Anderson, R. S., Bhagwat, S. A., Behling, H., Borisova, O., Bush, M., Correa-Metrio, A., de Vernal, A., Finch, J. M., Fréchette, B., Lozano-Garcia, S., Gosling, W. D., Granoszewski, W., Grimm, E. C., Grüger, E., Hanselman, J., Harrison, S. P., Hill, T. R., Huntley, B., Jiménez-Moreno, G., Kershaw, P., Ledru, M.-P., Magri, D., McKenzie, M., Müller, U., Nakagawa, T., Novenko, E., Penny, D., Sadori, L., Scott, L., Stevenson, J., Valdes, P. J., Vandergoes, M., Velichko, A., Whitlock, C., and Tzedakis, C.: Terrestrial biosphere changes over the last 120 kyr, Clim. Past, 12, 51–73, https://doi.org/10.5194/cp-12-51-2016, 2016.
Izumi, K., Bartlein, P. J., and Harrison, S. P.: Consistent behaviour of the climate system in response to past and future forcing, Geophys. Res. Lett., 40, 1817–1823, https://doi.org/10.1002/grl.50350, 2013.
Jiang, C., Ryu. Y., Wang, H., and Keenan, T. F.: An optimality-based model explains seasonal variation in C3 plant photosynthetic capacity, Glob. Change Biol., 26, 6493–6510, 2020.
Jiang, W., Wu, H., Li, Q., Lin, Y., and Yu, Y.: Spatiotemporal changes in C4 plant abundance in China since the Last Glacial Maximum and their driving factors, Palaeogeog. Palaeoclim. Palaeoecol., 518, 10–21, https://doi.org/10.1016/j.palaeo.2018.12.021, 2019.
Jolly, D. and Haxeltine, A.: Effect of low glacial atmospheric CO2 on tropical African montane vegetation, Science, 276, 786–788, 1997.
Kageyama, M., Albani, S., Braconnot, P., Harrison, S. P., Hopcroft, P. O., Ivanovic, R. F., Lambert, F., Marti, O., Peltier, W. R., Peterschmitt, J.-Y., Roche, D. M., Tarasov, L., Zhang, X., Brady, E. C., Haywood, A. M., LeGrande, A. N., Lunt, D. J., Mahowald, N. M., Mikolajewicz, U., Nisancioglu, K. H., Otto-Bliesner, B. L., Renssen, H., Tomas, R. A., Zhang, Q., Abe-Ouchi, A., Bartlein, P. J., Cao, J., Li, Q., Lohmann, G., Ohgaito, R., Shi, X., Volodin, E., Yoshida, K., Zhang, X., and Zheng, W.: The PMIP4 contribution to CMIP6 – Part 4: Scientific objectives and experimental design of the PMIP4-CMIP6 Last Glacial Maximum experiments and PMIP4 sensitivity experiments, Geosci. Model Dev., 10, 4035–4055, https://doi.org/10.5194/gmd-10-4035-2017, 2017.
Kageyama, M., Harrison, S. P., Kapsch, M.-L., Lofverstrom, M., Lora, J. M., Mikolajewicz, U., Sherriff-Tadano, S., Vadsaria, T., Abe-Ouchi, A., Bouttes, N., Chandan, D., Gregoire, L. J., Ivanovic, R. F., Izumi, K., LeGrande, A. N., Lhardy, F., Lohmann, G., Morozova, P. A., Ohgaito, R., Paul, A., Peltier, W. R., Poulsen, C. J., Quiquet, A., Roche, D. M., Shi, X., Tierney, J. E., Valdes, P. J., Volodin, E., and Zhu, J.: The PMIP4 Last Glacial Maximum experiments: preliminary results and comparison with the PMIP3 simulations, Clim. Past, 17, 1065–1089, https://doi.org/10.5194/cp-17-1065-2021, 2021.
Kaplan, J. O., Bigelow, N. H., Bartlein, P. J., Christensen, T. R., Cramer, W., Harrison, S. P., Matveyeva, N. V., McGuire, A. D., Murray, D. F., Prentice, I. C., Razzhivin, V. Y., Smith, B., Walker, D. A., Anderson, P. M., Andreev, A. A., Brubaker, L. B., Edwards, M. E., and Lozhkin, A. V.: Climate change and Arctic ecosystems II: Modeling, palaeodata-model comparisons, and future projections, J. Geophys. Res.-Atmos., 108, 8171, https://doi.org/10.1029/2002JD002559, 2003.
Kattge, J., Díaz, S., Lavorel, S., Prentice, I. C., Leadley, P., Bönisch, G., Garnier, E., Westoby, M., Reich, P. B., Wright, I. J., Cornelissen, J. H. C., Violle, C., Harrison, S. P., van Bodegom, P. M., Reichstein, M., Enquist, B. J., Soudzilovskaia, N. A., Ackerly, D. D., Anand, M., Atkin, O., Bahn, M., Baker, T. R., Baldocchi, D., Bekker, R., Blanco, C. C., Blonder, B., Bond, W. J., Bradstock, R., Bunker, D. E., Casanoves, F., Cavender-Bares, J., Chambers, J. Q., Chapin, F. S., Chave, J., Coomes, D., Cornwell, W. K., Craine, J. M., Dobrin, B. H., Duarte, L., Durka, W., Elser, J., Esser, G., Estiarte, M., Fagan, W. F., Fang, J., Fernández-Méndez, F., Fidelis, A., Finegan, B., Flores, O., Ford, H., Frank, D., Freschet, G. T., Fyllas, N. M., Gallagher, R. V., Green, W. A., Gutierrez, A. G., Hickler, T., Higgins, S. I., Hodgson, J. G., Jalili, A., Jansen, S., Joly, C. A., Kerkhoff, A. J., Kirkup, D., Kitajima, K., Kleyer, M., Klotz, S., Knops, J. M. H., Kramer, K., Kühn, I., Kurokawa, H., Laughlin, D., Lee, T. D., Leishman, M., Lens, F., Lenz, T., Lewis, S. L., Lloyd, J., Llusià, J., Louault, F., Ma, S., Mahecha, M. D., Manning, P., Massad, T., Medlyn, B. E., Messier, J., Moles, A. T., Müller, S. C., Nadrowski, K., Naeem, S., Niinemets, Ü., Nöllert, S., Nüske, A., Ogaya, R., Oleksyn, J., Onipchenko, V. G., Onoda, Y., Ordoñez, J., Overbeck, G., Ozinga, W. A., Patiño, S., Paula, S., Pausas, J. G., Peñuelas, J., Phillips, O. L., Pillar, V., Poorter, H., Poorter, L., Poschlod, P., Prinzing, A., Proulx, R., Rammig, A., Reinsch, S., Reu, B., Sack, L., Salgado-Negret, B., Sardans, J., Shiodera, S., Shipley, B., Siefert, A., Sosinski, E., Soussana, J.-F., Swaine, E., Swenson, N., Thompson, K., Thornton, P., Waldram, M., Weiher, E., White, M., White, S., Wright, S. J., Yguel, B., Zaehle, S., Zanne, A. E., and Wirth, C.: TRY – a global database of plant traits, Glob. Change Biol., 17, 2905–2935, https://doi.org/10.1111/j.1365-2486.2011.02451.x, 2011.
Keenan, T. F., Hollinger, D. Y., Bohrer, G., Dragoni, D., Munger, J. W., Schmid, H. P., and Richardson, A. D.: Increase in forest water-use efficiency as atmospheric carbon dioxide concentrations rise, Nature, 499, 324–327, 2013.
Landais, A., Lathière, J., Barkan, E., and Luz, B.: Reconsidering the change in global biosphere productivity between the Last Glacial Maximum and present day from the triple oxygen isotopic composition of air trapped in ice cores, Glob. Biogeochem. Cyc., 21, GB1025, https://doi.org/10.1029/2006GB002739, 2007.
Lavergne, A., Voelker, S., Csank, A., Graven, H., de Boer, H. J., Daux, V., Robertson, I., Dorado-Liñán, I., Martínez-Sancho, E., Battipaglia, G., Bloomfield, K. J., Still, C. J., Meinzer, F. C., Dawson, T. E., Camarero, J. J., Clisby, R., Fang, Y., Menzel, A., Keen, R. M., Roden, J. S., and Prentice, I. C.: Historical changes in the stomatal limitation of photosynthesis: empirical support for an optimality principle, New Phytol., 225, 2484–2497, https://doi.org/10.1111/nph.16314, 2020.
Lavergne, A., Harrison, S. P., Atsawawaranunt, K., Dong, N., and Prentice, I. C.: Recent C4 vegetation decline is imprinted in atmospheric carbon isotopes, Research Square [preprint], https://doi.org/10.21203/rs.3.rs-3966918/v1, 2024.
Levis, S., Foley, J. A., and Pollard, D.: CO2, climate, and vegetation feedbacks at the Last Glacial Maximum, J. Geophys. Res., 104, 31191–31198, 1999.
Li, G., Harrison, S. P., Bartlein, P. J., Izumi, K., and Prentice, I. C.: Precipitation scaling with temperature in warm and cold climates: an analysis of CMIP5 simulations, Geophys. Res. Lett., 40, 4018–4024, https://doi.org/10.1002/grl.50730, 2013.
Makou, M. C., Hughen, K. A., Xu, L., Sylva, S. P., and Eglinton, T. I.: Isotopic records of tropical vegetation and climate change from terrestrial vascular plant biomarkers preserved in Cariaco Basin sediments, Org. Geochem., 38, 1680–1691, https://doi.org/10.1016/j.orggeochem.2007.06.003, 2007.
Marchant, R., Cleef, A., Harrison, S. P., Hooghiemstra, H., Markgraf, V., van Boxel, J., Ager, T., Almeida, L., Anderson, R., Baied, C., Behling, H., Berrio, J. C., Burbridge, R., Björck, S., Byrne, R., Bush, M., Duivenvoorden, J., Flenley, J., De Oliveira, P., van Geel, B., Graf, K., Gosling, W. D., Harbele, S., van der Hammen, T., Hansen, B., Horn, S., Kuhry, P., Ledru, M.-P., Mayle, F., Leyden, B., Lozano-García, S., Melief, A. M., Moreno, P., Moar, N. T., Prieto, A., van Reenen, G., Salgado-Labouriau, M., Schäbitz, F., Schreve-Brinkman, E. J., and Wille, M.: Pollen-based biome reconstructions for Latin America at 0, 6000 and 18 000 radiocarbon years ago, Clim. Past, 5, 725–767, https://doi.org/10.5194/cp-5-725-2009, 2009.
Martin Calvo, M. and Prentice, I. C.: Effects of fire and CO2 on biogeography and primary production in glacial and modern climates, New Phytol., 208, 987–994, 2015.
Martin Calvo, M., Prentice, I. C., and Harrison, S. P.: Climate versus carbon dioxide controls on biomass burning: a model analysis of the glacial–interglacial contrast, Biogeosciences, 11, 6017–6027, https://doi.org/10.5194/bg-11-6017-2014, 2014.
Mauritsen, T., Bader, J., Becker, T., Behrens, J., Bittner, M., Brokopf, R., Brovkin, V., Claussen, M., Crueger, T., Esch, M., Fast, I., Fiedler, S., Fläschner, D., Gayler, V., Giorgetta, M., Goll, D. S., Haak, H., Hagemann, S., Hedemann, C., Hohenegger, C., Ilyina, T., Jahns, T., Jimenéz-de-la-Cuesta, D., Jungclaus, J., Kleinen, T., Kloster, S., Kracher, D., Kinne, S., Kleberg, D., Lasslop, G., Kornblueh, L., Marotzke, J., Matei, D., Meraner, K., Mikolajewicz, U., Modali, K., Möbis, B., Müller, W. A., Nabel, J. E. M. S., Nam, C. C. W., Notz, D., Nyawira, S. S., Paulsen, H., Peters, K., Pincus, R., Pohlmann, H., Pongratz, J., Popp, M., Raddatz, T. J., Rast, S., Redler, R., Reick, C. H., Rohrschneider, T., Schemann, V., Schmidt, H., Schnur, R., Schulzweida, U., Six, K. D., Stein, L., Stemmler, I., Stevens, B., von Storch J. S., Tian, F., Voigt, A., Vrese, P., Wieners, K. H., Wilkenskjeld, S., Winkler, A., Roeckner, E.: Developments in the MPI-M Earth System Model version 1.2 (MPI-ESM1.2) and its response to increasing CO2, J. Advan. Modeling Earth Systems, 11, 998–1038, https://doi.org/10.1029/2018MS001400, 2019.
Medlyn, B. E., De Kauwe, M. G., Lin, Y.-S., Knauer, J., Duursma, R. A., Williams, C. A., Arneth, A., Clement, R., Isaac, P., Limousin, J.-M., Linderson, M.-L., Meir, P., Martin-StPaul, N., and Wingate, L.: How do leaf and ecosystem measures of water-use efficiency compare?, New Phytol., 216, 758–770, https://doi.org/10.1111/nph.14626, 2017.
O'ishi, R. and Abe-Ouchi, A.: Influence of dynamic vegetation on climate change and terrestrial carbon storage in the Last Glacial Maximum, Clim. Past, 9, 1571–1587, https://doi.org/10.5194/cp-9-1571-2013, 2013.
Orme, D., and Marion, G.: ImperialCollegeLondon/pyrealm: v0.10.1 (0.10.1), Zenodo [code], https://doi.org/10.5281/zenodo.8366848, 2023.
Otto-Bliesner, B. L., Braconnot, P., Harrison, S. P., Lunt, D. J., Abe-Ouchi, A., Albani, S., Bartlein, P. J., Capron, E., Carlson, A. E., Dutton, A., Fischer, H., Goelzer, H., Govin, A., Haywood, A., Joos, F., LeGrande, A. N., Lipscomb, W. H., Lohmann, G., Mahowald, N., Nehrbass-Ahles, C., Pausata, F. S. R., Peterschmitt, J.-Y., Phipps, S., Renssen, H., and Zhang, Q.: The PMIP4 contribution to CMIP6 – Part 2: Two interglacials, scientific objective and experimental design for Holocene and Last Interglacial simulations, Geosci. Model Dev., 10, 3979–4003, https://doi.org/10.5194/gmd-10-3979-2017, 2017.
Piao, S., Friedlingstein, P., Ciais, P., Zhou, L., and Chen, A.: Effect of climate and CO2 changes on the greening of the Northern Hemisphere over the past two decades, Geophys. Res. Lett., 33, L23402, https://doi.org/10.1029/2006GL028205, 2006.
Piao, S., Wang, X., Park, T., Chen, C., Lian, X., He, Y., Bjerke, J. W., Chen, A., Ciais, P., Tømmervik, H., Nemani, R. R., and Myneni, R. B.: Characteristics, drivers and feedbacks of global greening, Nature Rev. Earth Environ., 1, 14–27, https://doi.org/10.1038/ s43017-019-0001-x, 2020.
Peng, Y., Bloomfield, K. J., and Prentice, I. C.: A theory of plant function helps to explain leaf-trait and productivity responses to elevation, New Phytol., 226, 1274–1284, 2020.
Pickett, E. J, Harrison, S. P., Hope, G. Harle, K., Dodson, J. R., Kershaw, A. P., Prentice, I. C., Backhouse, J., Colhoun, E. A., D'Costa, D., Flenley, J., Grindrod, J., Haberle, S., Hassell, C., Kenyon, C., Macphail, M., Martin, H., Martin, A. H., McKenzie, M., Newsome, J. C., Penny, D., Powell, J., Raine, J. I., Southern, W., Stevenson, J., Sutra, J. P., Thomas, I., van der Kaars, S., and Ward, J.: Pollen-based reconstructions of biome distributions for Australia, Southeast Asia and the Pacific (SEAPAC region) at 0, 6000 and 18,000 14C yr B.P., Journal of Biogeography, 31, 1381–1444, https://doi.org/10.1111/j.1365-2699.2004.01001.x, 2004.
Polley, H. W., Johnson, H. B., Marino, B. D., and Mayeux, H. S.: Increases in C3 plant water-use efficiency and biomass over glacial to present CO2 concentrations, Nature, 361, 61–64, 1993.
Prentice, I. C., Dong, N., Gleason, S. M., Maire, V., and Wright, I. J.: Balancing the costs of carbon gain and water transport: testing a new theoretical framework for plant functional ecology, Ecol. Lett., 17, 82–91, 2014.
Prentice, I. C., Harrison, S. P., and Bartlein, P. J.: Global vegetation and terrestrial carbon cycle changes after the last ice age, New Phytol., 189, 988–998, 2011.
Prentice, I. C., Jolly, D., and BIOME 6000 Participants: Mid-Holocene and glacial-maximum vegetation geography of the northern continents and Africa, J. Biogeog., 27, 507–519, 2000.
Prentice, I. C., Kelley, D. I., Foster, P. N. Friedlingstein, P., Harrison, S. P., and Bartlein, P. J.: Modeling fire and the terrestrial carbon balance, Glob. Biogeochem. Cycl., 25, GB3005, https://doi.org/10.1029/2010GB003906, 2011.
Prentice, I. C., Villegas-Diaz, R., and Harrison, S. P.: Accounting for atmospheric carbon dioxide variations in pollen-based reconstruction of past hydroclimates, Glob. Planet. Change, 211, 103790, https://doi.org/10.1016/j.gloplacha.2022.103790, 2022.
Rommerskirchen, F., Eglinton, G., Dupont, L., and Rullkötter, J.: Glacial/interglacial changes in southern Africa: Compound-specific δ13C land plant biomarker and pollen records from southeast Atlantic continental margin sediments, Geochem. Geophy. Geosy., 7, Q08010, https://doi.org/10.1029/2005GC001223, 2006.
Sato, H., Kelley, D. I., Mayor, S. J., Martin Calvo, M., Cowling, S. A., and Prentice, I. C.: Dry corridors opened by fire and low CO2 in Amazonian rainforest during the Last Glacial Maximum, Nat. Geosci., 14, 578–585, https://doi.org/10.1038/s41561-021-00777-2, 2021.
Serge, M., Mazier, F., Fyfe, R., Gaillard, M.-J., Klein, T., Lagnoux, A., Galop, D., Githumbi, E., Mindrescu, M., Nielsen, A. B., Trondman, A.-K., Poska, A., Sugita, S., Woodbridge, J., Abel-Schaad, D., Åkesson, C., Alenius, T., Ammann, B., Andersen, S. T., Anderson, R. S., Andrič, M., Balakauskas, L., Barnekow, L., Batalova, V., Bergman, J., Birks, H. J. B., Björkman, L., Bjune, A. E., Borisova, O., Broothaerts, N., Carrión, J., Caseldine, C., Christiansen, J., Cui, Q., Currás, A., Czerwiński, S., David, R., Davies, A. L., De Jong, R., Di Rita, F., Dietre, B., Dörfler, W., Doyen, E., Edwards, K. J., Ejarque, A., Endtmann, E., Etienne, D., Faure, E., Feeser, I., Feurdean, A., Fischer, E., Fletcher, W., Franco-Múgica, F., Fredh, E. D., Froyd, C., Garcés-Pastor, S., García-Moreiras, I., Gauthier, E., Gil-Romera, G., González-Sampériz, P., Grant, M. J., Grindean, R., Haas, J. N., Hannon, G., Heather, A.-J., Heikkilä, M., Hjelle, K., Jahns, S., Jasiunas, N., Jiménez-Moreno, G., Jouffroy-Bapicot, I., Kabailienė, M., Kamerling, I. M., Kangur, M., Karpińska-Kołaczek, M., Kasianova, A., Kołaczek, P., Lagerås, P., Latalowa, M., Lechterbeck, J., Leroyer, C., Leydet, M., Lindbladh, M., Lisitsyna, O., López-Sáez, J.-A., Lowe, J., Luelmo-Lautenschlaeger, R., Lukanina, E., Macijauskaitė, L., Magri, D., Marguerie, D., Marquer, L., Martinez-Cortizas, A., Mehl, I., Mesa-Fernández, J. M., Mighall, T., Miola, A., Miras, Y., Morales-Molino, C., Mrotzek, A., Muñoz Sobrino, C., Odgaard, B., Ozola, I., Pérez-Díaz, S., Pérez-Obiol, R. P., Poggi, C., Ramil Rego, P., Ramos-Román, M. J., Rasmussen, P., Reille, M., Rösch, M., Ruffaldi, P., Sánchez Goñi, M., Savukynienė, N., Schröder, T., Schult, M., Segerström, U., Seppä, H., Servera Vives, G., Shumilovskikh, L., Smettan, H. W., Stancikaite, M., Stevenson, A. C., Stivrins, N., Tantau, I., Theuerkauf, M., Tonkov, S., van der Knaap, W. O., van Leeuwen, J. F. N., Vecmane, E., Verstraeten, G., Veski, S., Voigt, R., von Stedingk, H., Waller, M., Wiethold, J., Willis, K. J., Wolters, S., Zernitskaya, V. P.: Testing the effect of relative pollen productivity on the REVEALS model: A validated reconstruction of Europe-wide Holocene vegetation, Land, 12, 986, https://doi.org/10.3390/land12050986, 2023.
Sinninghe Damsté, J. S., Verschuren, D., Ossebaar, J., Blokker, J., van Houten, R., Plessen, B., and Schouten, S.: A 25,000-year record of climate-induced changes in lowland vegetation of eastern equatorial Africa revealed by the stable carbon-isotopic composition of fossil plant leaf waxes, Earth Planet. Sci. Lett., 302, 236–246, 2011.
Smith, N. G. and Keenan, T. F.: Mechanisms underlying leaf photosynthetic acclimation to warming and elevated CO2 as inferred from least-cost optimality theory, Glob. Change Biol., 26, 5202–5216, 2020.
Smith, N. G., Keenan, T. F., Prentice, I. C., Wang, H., Wright, I. J., Niinemets, U., Crous, Y., Domingues, T. F., Guerrieri, R., Ishida, F. Y., Kattge, J., Kruger, E. L., Maire, V., Rogers, A., Serbin, S. P., Tarvainen, L., Togashi, H. F., Townsend, P. A., Wang, M., Weerasinghe, L. K., and Zhou, S.-X.: Global photosynthetic capacity is optimized to the environment, Ecol. Lett., 22, 506–517, 2019.
Stein, U. and Alpert, P.: Factor separation in numerical simulations, J. Atmos. Sci., 50, 2107–2115, 1993.
Stocker, B. D., Wang, H., Smith, N. G., Harrison, S. P., Keenan, T. F., Sandoval, D., Davis, T., and Prentice, I. C.: P-model v1.0: an optimality-based light use efficiency model for simulating ecosystem gross primary production, Geosci. Model Dev., 13, 1545–1581, https://doi.org/10.5194/gmd-13-1545-2020, 2020.
Swinehart, D. F.: The Beer-Lambert Law, J. Chem. Educ., 39, 333, https://doi.org/10.1021/ed039p333, 1962.
Vogts, A., Schefuß, E., Badewien, T., and Rullkötter, J.: n-alkane parameters derived from a deep-sea sediment transect off south-west Africa reflect continental vegetation and climate conditions, Org. Geochem., 47, 109–119, 2012.
Wang, H., Atkin, O. K., Keenan, T. F., Smith, N. G., Wright, I. J., Bloomfield, K. J., Kattge, J., Reich, P. B., and Prentice, I. C.: Acclimation of leaf respiration consistent with optimal photosynthetic capacity, Glob. Change Biol., 26, 2573–2583, 2020.
Wang, H., Prentice, I. C., Cornwell, W. M., Keenan, T. F., Davis, T. W., Wright, I. J., Evans, B. J., and Peng, C.: Towards a universal model for carbon dioxide uptake by plants, Nature Plants, 3, 734–741, 2017.
Williams, I. N. and Torn, M. S.: Vegetation controls on surface heat flux partitioning, and land-atmosphere coupling, Geophys. Res. Lett., 42, 9416–9424, https://doi.org/10.1002/2015GL066305, 2015.
Williams, J. W.: Variations in tree cover in North America since the last glacial maximum, Glob. Planet. Change, 35, 1–23, https://doi.org/10.1016/S0921-8181(02)00088-7, 2003.
Wohlfahrt, J., Harrison, S. P., Braconnot, P., Hewitt, C. D., Kutzbach, J. E., Kitoh, A., Mikolajewicz, U., Otto-Bliesner, B., and Weber, N.: Evaluation of coupled ocean-atmosphere simulations of northern hemisphere extratropical climates in the mid-Holocene, Clim. Dyn., 31, 871–890, https://doi.org/10.1007/s00382-008-0415-5, 2008.
Woillez, M.-N., Kageyama, M., Krinner, G., de Noblet-Ducoudré, N., Viovy, N., and Mancip, M.: Impact of CO2 and climate on the Last Glacial Maximum vegetation: results from the ORCHIDEE/IPSL models, Clim. Past, 7, 557–577, https://doi.org/10.5194/cp-7-557-2011, 2011.
Xu, H., Wang, H., Prentice, I. C., Harrison, S. P., Wang, G., and Sun, X.: Predictability of leaf traits with climate and elevation: a case study in Gongga Mountain, China, Tree Physiol., https://doi.org/10.1093/treephys/tpab003, 2021.
Yang, J-W., Brandon, M., Landais, A., Duchamp-Alphonse, S., Blunier, T., Prie, F., and Extier, T.: Global biosphere primary productivity changes during the past eight glacial cycles, Science, 375, 1145–115, https://doi.org/10.1126/science.abj8826, 2022.
Zanon, M., Davis, B. A. S., Marquer, L., Brewer, S., and Kaplan, J. O.: European forest cover during the past 12,000 years: A palynological reconstruction based on modern analogs and remote sensing, Front. Plant Sci., 9, 1–25, https://doi.org/10.3389/fpls.2018.00253, 2018.
Zeng, Z., Piao, S., Li, L. Zhou, L., Ciais, P., Wang, T., Li, Y., Lian, X., Wood, E. F., Friedlingstein, P., Mao, J., Estes, L. D., Myneni, R. B., Peng, S., Shi, X., Seneviratne, S. I., and Wang, Y.: Climate mitigation from vegetation biophysical feedbacks during the past three decades, Nature Clim. Change, 7, 432–436, https://doi. org/10.1038/nclimate3299, 2017.
Zhao, J., Zhou, B., Harrison, S., and Prentice, C.: Global Gross Primary Productivity of Vegetation During the Last Glacial Maximum, Mid-Holocene, and Pre-Industrial Period [Data set], Zenodo [data set], https://doi.org/10.5281/zenodo.14257604, 2024.
Zhou, B., Cai, W., Zhu, Z., Wang, H., Harrison, S. P., and Prentice, I. C.: A general model for the seasonal to decadal dynamics of leaf area, Glob. Change Biol., e70125, https://doi.org/10.1111/gcb.70125, 2025.
Zhu, Z., Wang, H., Harrison, S. P., Prentice, I. C., Qiao, S., and Tan, S.: Optimality principles explaining divergent responses of alpine vegetation to environmental change, Glob. Change Biol., 29, 126–142, 2022.