the Creative Commons Attribution 4.0 License.
the Creative Commons Attribution 4.0 License.
 | 21 Jul 2025
Leveraging the satellite-based climate data record CLARA-A3 to understand the climatic trend regimes relevant for solar energy applications over Europe
Abhay Devasthale
Sandra Andersson
Erik Engström
Frank Kaspar
Jörg Trentmann
Anke Duguay-Tetzlaff
Jan Fokke Meirink
Erik Kjellström
Tomas Landelius
Manu Anna Thomas
Karl-Göran Karlsson
Efficient transitioning to renewable energy requires a fundamental understanding of the past and future climate change. This is particularly true in the case of solar energy, since the surface incoming solar radiation (SIS) is heavily regulated by atmospheric essential climate variables (ECVs) such as aerosols and clouds. Given the complexity of the interactions and feedbacks in the Earth system, even small changes in ECVs could have large direct and indirect effects on SIS. The net efficacy of the solar energy systems designed therefore depends on how well we account for the role of ECVs in modulating SIS. In this study, by leveraging the satellite-based climate data record (CDR) CLARA-A3, we investigate the recent trends in SIS and cloud properties over Europe during the 1982–2020 period. Furthermore, we derive emerging climatic trend regimes that are relevant for solar energy applications. Results show a large-scale increase in SIS in spring and early summer over Europe, particularly noticeable in April and June. The corresponding trends in cloud fraction and cloud optical thickness and their correlation with SIS suggest an increasingly important role of clouds in defining the favourable and unfavourable conditions for solar energy applications. We also note a strong spatiotemporal variability in trends and correlations. The results provide valuable metrics for the evaluation of climate models that have a dynamically integrated solar energy component.
- Article
(4467 KB) - Full-text XML
- BibTeX
- EndNote


The share of renewable energy sources in the European Union has increased from 12.5 % in 2010 to 23 % in 2022 following the Renewable Energy Directive (2009/28/EC). The latest binding renewable energy target will increase that share to at least 42.5 % by 2030 (https://energy.ec.europa.eu/topics/renewable-energy/renewable-energy-directive-targets-and-rules/renewable-energy-directive_en, last access: 12 June 2024). The European Green Deal is paving the way for a faster transition towards cleaner energy. The transition to solar energy is happening at an even faster rate, with many EU member states projected to reach their 2030 targets well ahead of time according to the latest, revised National Energy and Climate Plans (NECP) (https://energy.ec.europa.eu/topics/energy-strategy/national-energy-and-climate-plans-necps_en, last access: 12 June 2024).
To facilitate more efficient transitioning to clean renewable energy, a better understanding of the past and future climate change is required (Jerez et al., 2015; Engeland et al., 2017; Grams et al., 2017; Gernaat et al., 2021; Hou et al., 2021; Dutta et al., 2022; Dong et al., 2023; Ha et al., 2023; Kapica et al., 2024). All three major sources of renewable energy (i.e. hydro, solar, and wind) are subjected to the influences from the changing essential climate variables (ECVs), such as surface incoming solar radiation (SIS), precipitation, winds, temperature, and humidity, to name a few. If we are to design solar energy systems that are highly efficient and reliable also in the near future, a detailed understanding of both past and future changes in incoming solar radiation at the surface and the drivers behind its spatiotemporal variability is of paramount importance.
Thanks to 40 years of near-continuous and global observations from the combined meteorological satellites of the US (NOAA) and Europe (MetOp), it is now possible to derive and use valuable, long-term information on cloud properties and surface solar radiation (Cano et al., 1986; Pfeifroth et al., 2018a, b; Devasthale et al., 2022; Devasthale and Karlsson, 2023; Karlsson et al., 2023a; Post and Aun, 2024; Urraca et al., 2024). Recent studies have demonstrated and argued the importance of satellite-based observations to support the transitioning to renewables in general (Kaspar et al., 2019; Drücke et al., 2021; Edwards et al., 2022) and to solar energy in particular (Hammer et al., 2003; Campana et al., 2020; Darragh and Fiedler, 2022). More importantly, there have also been significant improvements in the calibration and retrieval algorithms in the recent decades, elevating them to climate quality. This enables the derivation of more stable and mature climate data records (CDRs) of various ECVs that are increasingly suitable for climate change studies.
In light of the aspects mentioned above, the holistic purpose of the present study is to demonstrate how we can exploit the satellite-based CDRs to distil and convey information on surface solar radiation to help facilitate the transition to solar energy. In practice, we aim to answer the following three specific questions.
- a.
Can we derive user-friendly information on climatic trend regimes that are of relevance for solar energy applications over Europe?
-
This is a completely novel value addition. Here, we attempt to combine trends in surface solar radiation with trends in cloud properties and meteorological variables to distil useful information on spatiotemporal features in emerging climatic trend regimes potentially favourable or unfavourable for solar energy applications.
-
- b.
How well do cloud properties correlate with SIS?
-
This is also a novel aspect of the present study considering the spatiotemporal scales. Here, the aim is to assess the role of clouds as one of the main drivers of the spatiotemporal variability in SIS.
-
- c.
What are the recent trends in SIS and cloud properties?
-
This is a complementary assessment to previous studies in order to further deepen the understanding of spatiotemporal trends in SIS and cloud properties. The exact value addition of the present study will be to assess very detailed trends at the monthly scale and to use the most recent and longer-term information from a polar-orbiting-satellite-based CDR.
-
The third edition of the cloud, albedo, and surface radiation dataset of EUMETSAT's Satellite Application Facility on Climate Monitoring (CM SAF) from Advanced Very High Resolution Radiometer (AVHRR) data, CLARA-A3, provides the retrievals of incoming solar radiation at the surface (SIS), cloud fraction, and cloud physical properties (Karlsson et al., 2023a). The consistent retrievals of these variables provide a unique opportunity to use them in the context of solar energy applications. CLARA-A3 has a long history of dedicated and continuous developments since its inception 25 years ago in the framework of EUMETSAT's Satellite Application Facility on Climate Monitoring (CM SAF). Furthermore, CLARA-A3 offers substantial improvements to its previous version, CLARA-A2 (Karlsson et al., 2017). A number of previous studies have documented the theoretical basis, validations, and improvements in the CLARA-A3 climate data record.
In this specific study, we use the Level 3 monthly means of cloud and radiation products that are available at a 0.25° spatial resolution globally. The AVPOS version (i.e. AVHRRs on board polar-orbiting satellites) of this dataset is analysed here (https://www.cmsaf.eu/EN/Products/NamingConvention/Naming_Convention_node.html, last access: 12 June 2024). The AVPOS version refers to the fact that the Level 3 data are prepared using quality-controlled retrievals from AVHRR sensors flying on board all available polar-orbiting NOAA and MetOp satellites instead of using only one prime morning or afternoon NOAA and MetOp satellite at a time. The CLARA-A3 CDR currently covers the period from 1979 to 2020 with an Interim CDR thereafter. In this study, we use data from 1982 through 2020. The earliest data between 1979 and 1981 from TIROS-N and NOAA-6 show spurious behaviour and are deemed not suitable for trend analyses. We analyse SIS, daytime cloud fraction, and cloud optical thickness of liquid and ice clouds. We are thus leveraging the CLARA-A3 CDR by making maximum use of the valuable information on climate variables provided in this CDR.
2.1 Cloud property retrievals
CLARA-A3 contains a wide range of cloud properties. Cloud detection is based on Naïve Bayesian theory, employing global collocations between AVHRR and CALIPSO–CALIOP data for training. The algorithm yields a cloud probability that is reduced to a binary cloud mask (using a 50 % probability threshold) for downstream retrievals. Cloud top height, pressure, and temperature are derived using an artificial neural network, likewise trained with collocations between AVHRR and CALIPSO–CALIOP. Cloud phase is determined with a series of spectral tests applied to the AVHRR infrared channels. Cloud optical thickness and particle effective radius are simultaneously retrieved during the daytime using the classical Nakajima and King (1990) approach by fitting observed reflectances in a visible and shortwave-infrared channel pair to pre-calculated look-up tables of top-of-atmosphere reflectances for cloudy atmospheres. Further details can be found in Karlsson et al. (2023a) and references therein.
2.2 Retrievals of incoming solar radiation at the surface (SIS)
The estimation of the surface irradiance is based the probabilistic cloud mask and the top-of-the-atmosphere reflected solar radiation flux, both derived as part of the CLARA-A3 retrieval scheme (Karlsson et al., 2023a). The cloud mask is used to separate clear-sky pixels from those that contain clouds. For clear-sky pixels, the surface irradiance is derived using a clear-sky radiation transfer model (Mueller et al., 2009). For cloudy pixels, a look-up-table approach is used, which relates the surface radiation to the derived reflected solar flux (Mueller et al., 2009). Auxiliary data for the atmospheric columns of water vapour and ozone and for the surface albedo are taken from ERA5. For the aerosol information on optical depth, single-scattering albedo, and asymmetry parameter, a modified version of the climatological monthly mean aerosol fields from the GADS/OPAC climatology (Hess et al., 1998) has been used. Further details can be seen in the Algorithm Theoretical Basis Document: https://www.cmsaf.eu/SharedDocs/Literatur/document/2023/saf_cm_dwd_atbd_clara_rad_3_3_pdf.pdf?__blob=publicationFile&v=2 (last access: 12 June 2024). For the estimation of daily averages from the instantaneous satellite observations, the diurnal cycle of solar radiation is considered; the monthly averages are derived from the daily averages. More details can be found in Karlsson et al. (2023a).
2.3 Evaluation of SIS over Sweden
As mentioned in Sect. 2.2 above, the retrievals of SIS are validated over a large number of stations located in Europe, which is the focus region of this study (Riihelä et al., 2015; Urraca et al., 2017; Babar et al., 2019; Devasthale et al., 2022). Since we have in-house access to the SIS data from additional in situ measurements at SMHI, we carried out further evaluation of SIS retrievals over these Swedish stations. We not only evaluated the latest CLARA-A3 SIS CDR, but also compared it with its previous edition CLARA-A2 to highlight recent changes. The location of those Swedish stations is shown in Fig. 1. The details of the in situ stations and their quality-control and measurement principles can be found in Carlund (2011), Riihelä et al. (2015), and Devasthale et al. (2022). It is worth pointing out that these stations cover a wide range of topographical and meteorological conditions over Sweden, ranging from very cold, dry, high mountain locations in the north, over coastal regions and inland areas, to the warm and wet regions in the southwest. This provides a good opportunity to evaluate CLARA-A3 SIS retrievals under a range of surface and meteorological conditions.
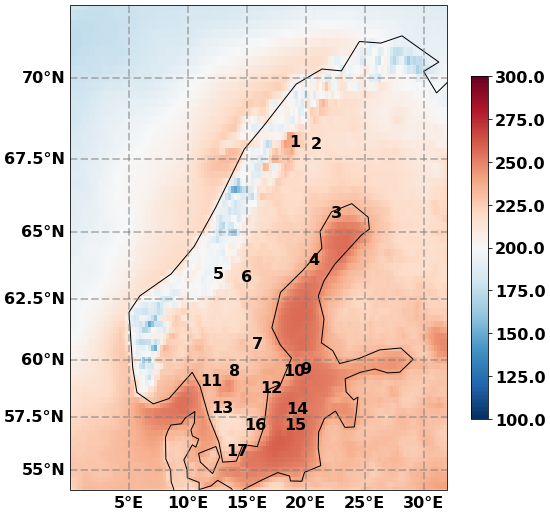
Figure 1The geographical positions of 17 Swedish SIS measurement stations used to evaluate SIS monthly means in the CLARA-A3 CDR. The background shows climatological mean SIS (in W m−2) for the month of June (1991–2020) based on CLARA-A3.
Figure 2 shows the results of SIS evaluations in terms of standard statistical metrics. It shows the Pearson correlation coefficient between the SIS measurements and CLARA-A2 and CLARA-A3 monthly means together with the mean difference, the standard deviation of the difference, and the root-mean-square difference for those 17 stations that have long-term, quality-controlled SIS measurements. It is evident in Fig. 2 that the correlations in CLARA-A3 have improved in all but one station. The most noticeable improvements are seen in stations 1, 2, 5, and 6. This is particularly encouraging, given the fact that stations 1 and 2 are located in the Swedish mountains, while stations 5 and 6 are also located well inland but in the lower mountainous regions. The terrain around these four stations is very heterogeneous with a mix of snow-covered and bare mountains with the surrounding vegetation. The mean difference has also decreased in CLARA-A3 for the majority of the stations. Stations 1, 2, 5, 6, 13, and 17 show significant reductions in the root-mean-square difference. These results indicate a clear improvement in the recent CLARA-A3 SIS CDR compared to its previous edition. Previous evaluations show that CLARA SIS tends to underestimate the magnitude of trends compared to the in situ measurements (Devasthale et al., 2022). Given the fact that we use only a binary outcome of trends (i.e. increasing or decreasing) and that the total cloudiness in CLARA-A3 satisfies the most stringent requirements of stability set by the World Meteorological Organization (WMO) Global Climate Observing System (GCOS) over most of Europe (Devasthale and Karlsson, 2023), our mapping of climatic trend regimes shown in Sect. 4 is expected to show robust spatial features.
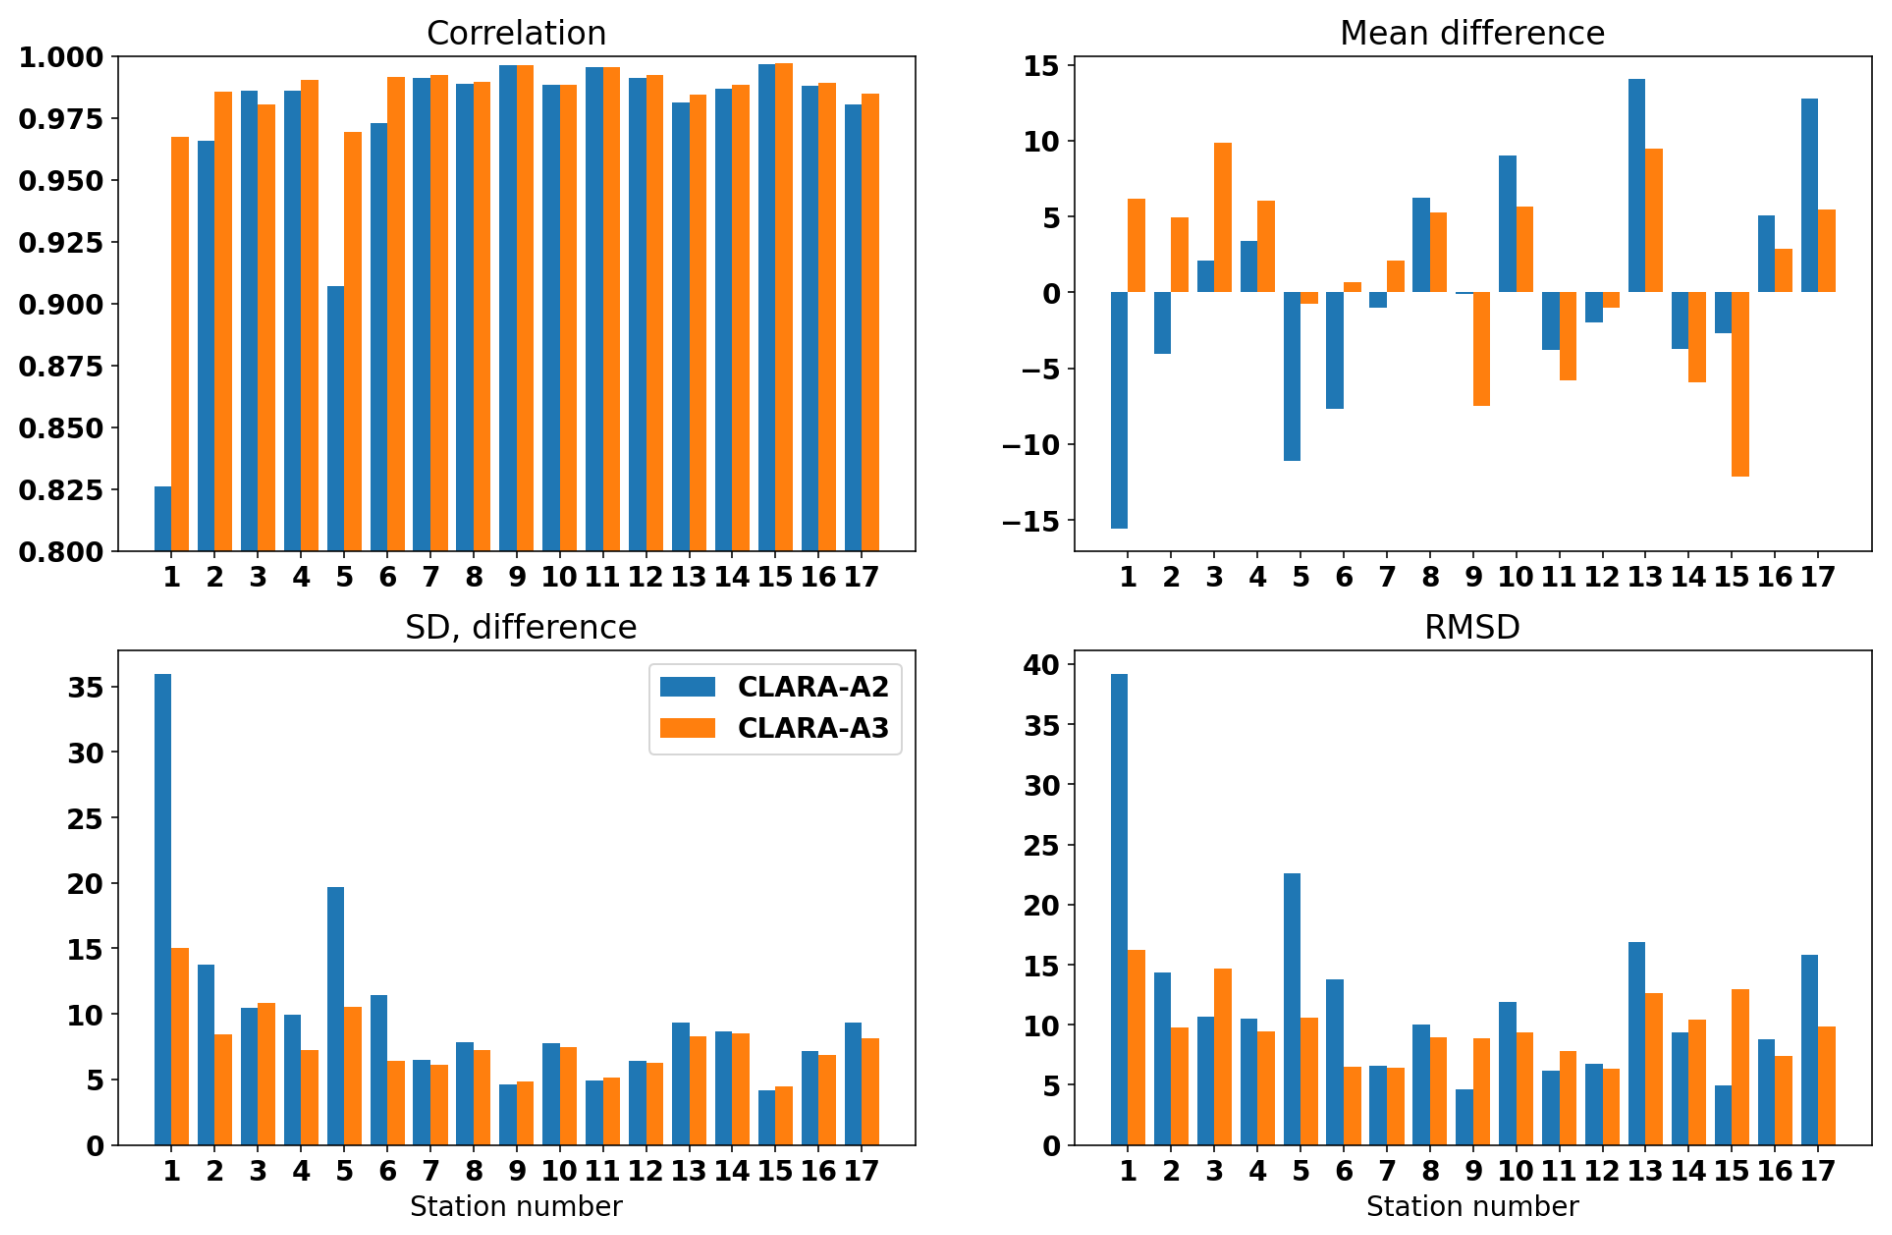
Figure 2Evaluation of CLARA-A2 and CLARA-A3 SIS against the Swedish in situ measurements. The figures show the correlation coefficients, the mean difference, the standard deviation of the difference, and the root-mean-square difference. The units are in W m−2.
To assess the emerging multivariate climatic trends that are relevant for solar energy applications, we first need to understand the absolute trends in the incoming solar radiation at the surface. Figure 3 shows the monthly trends in SIS over Europe based on the CLARA-A3 CDR covering the 1982–2020 period, during which a steady brightening was expected in Europe (Wild, 2009; Pfeifroth et al., 2018a, b; Schilliger et al., 2024; Urraca et al., 2024). To interpret these trends in SIS, Fig. 4 shows the corresponding trends in daytime cloud fraction. In January, the trends in SIS over most of Europe are either very weak or not statistically significant. In February, an interesting east–west feature is observed, in that eastern Europe has experienced a decrease in SIS, while western Europe and the Mediterranean Sea have experienced an increase in SIS. Although these trends are relatively weak, they are statistically significant. Furthermore, SIS values are smaller in winter, so any trend in absolute terms would also be smaller. The opposite trends in the eastern and western parts of Europe are also observed in daytime cloud fraction, and they anti-correlate strongly with the trends in SIS.
In March, all other European regions, except Spain, Portugal, the northern coast of Norway, and a few parts of eastern Europe and Russia, show increasing trends in SIS and decreasing daytime cloudiness. April shows very strong increases in SIS and decreases in daytime cloudiness over most of Europe. The strongest trends are observed over southern Scandinavia and parts of central and eastern Europe. The daytime cloud fraction over these areas has decreased by almost 5 % per decade in April, leading to a strong increase in SIS. The changes in cloudiness and SIS over northern Fennoscandia and the Iberian Peninsula are weaker, with reversed sign in some areas. The atmospheric circulation and changes therein can partly explain the trends in SIS and cloudiness (Pfeifroth et al., 2018a; Post and Aun, 2024). For example, a notable strong change in the European weather patterns in April was also discussed by Ionita et al. (2020) and Imbery et al. (2020), who investigated the possible reasons behind the increasingly drier conditions due to precipitation reduction in April in Germany and in other parts of central Europe. They showed that the decrease in the zonal temperature gradient between the Arctic and the midlatitudes, the northward shift in Atlantic storm tracks, and the increased frequency and persistence of high-pressure systems over the North Sea have led to significant precipitation reduction in April in recent decades. Kjellström et al. (2022) further showed that the changes in precipitation over Scandinavia cannot be explained only by the changes in large-scale circulation due to changes in the frequencies of different circulation types but that the changes also within the circulation types are required to explain the total change.
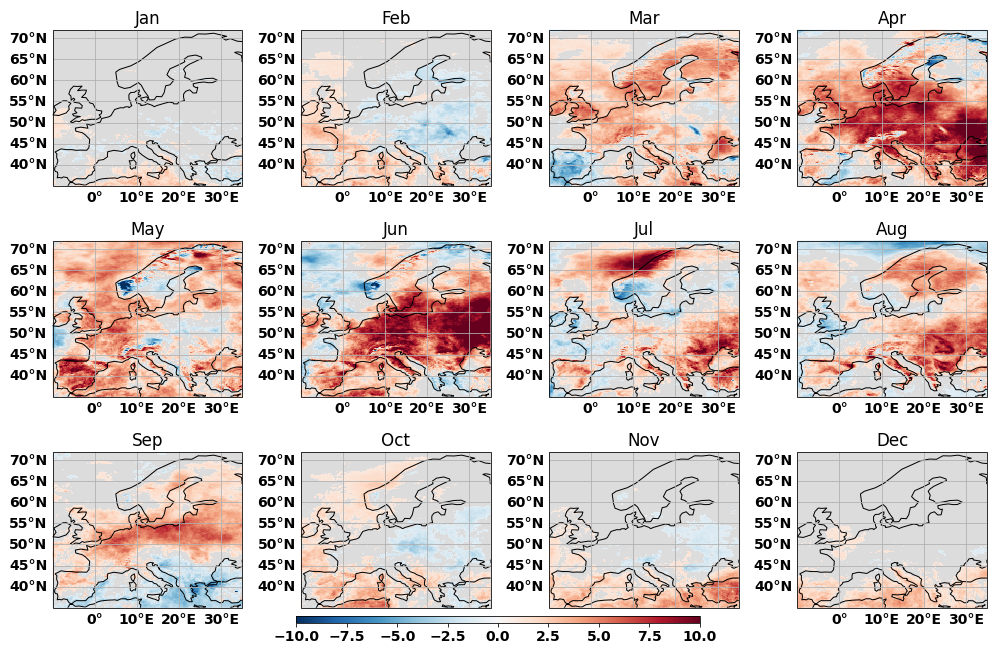
Figure 3The spatial trends in SIS (in W m−2 per decade) based on the CLARA-A3 CDR (1982–2020). Only those trends that are significant at the 90 % confidence interval are shown.
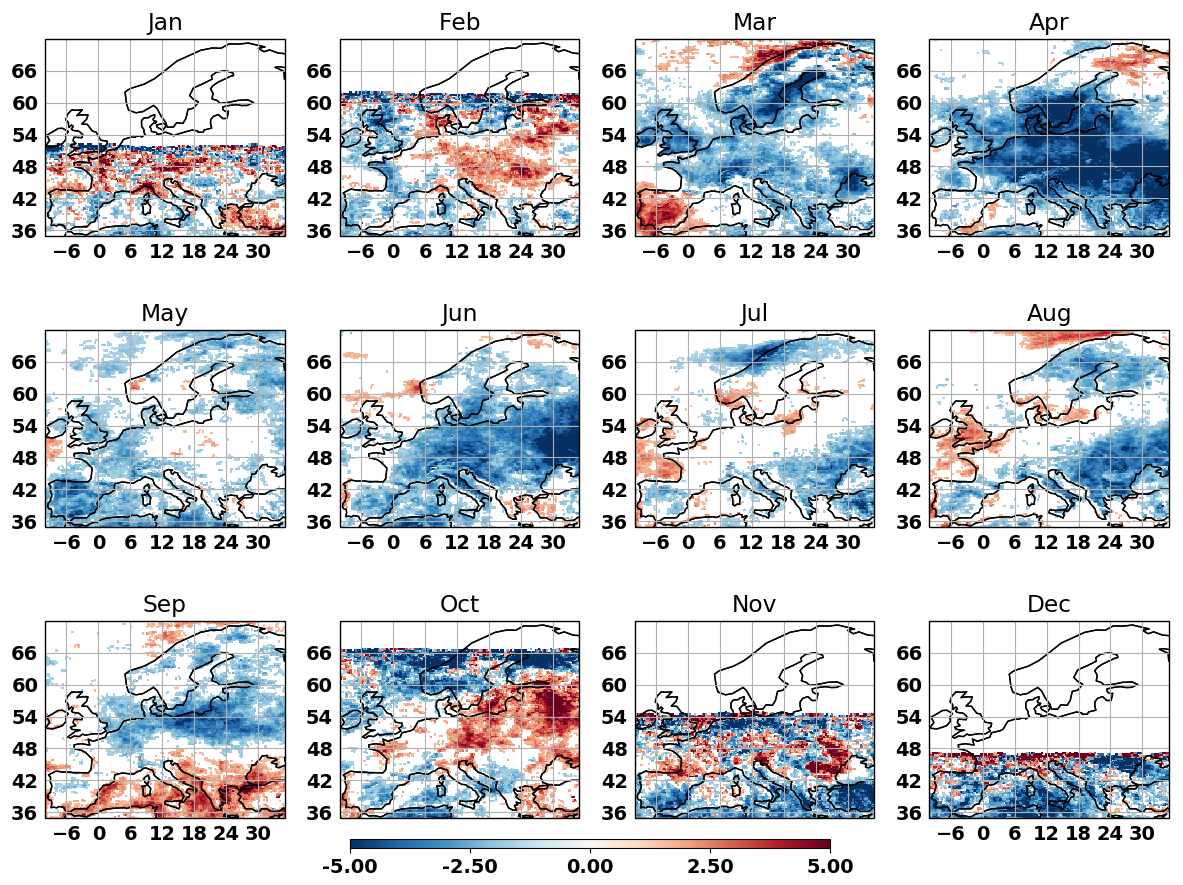
Figure 4The spatial trends in daytime cloud fraction (in % per decade) based on the CLARA-A3 CDR (1982–2020). Only those trends that are significant at the 90 % confidence interval are shown.
In May, the Iberian Peninsula shows a strong increase in SIS of more than 5 W m−2 per decade connected to a decrease in daytime cloudiness, especially along the entire northern and southeastern coasts. Also, other parts of western Europe, such as Germany, France, the Netherlands, and the United Kingdom, show increases in SIS. Over southern Scandinavia and eastern Europe, the trends are not statistically significant.
June shows the most striking increases in SIS over central and eastern Europe, reaching more than 6 W m−2 per decade over southern Scandinavia, Germany, Switzerland, Italy, Belarus, Ukraine, and western Russia. Large-scale decreases in daytime cloudiness are observed over the entire European continent in June. In July and August, the surface solar radiation has increased in southern regions of continental Europe. A very strong increase in SIS along the northern Norwegian coast and over the Norwegian Sea in July and a corresponding decrease in cloudiness are also noteworthy.
In September, northern continental Europe shows increasing trends in SIS, especially in the latitude band 48–55° N. The central parts of Fennoscandia also show a slight increase in SIS. The regions over and around the Mediterranean Sea show a small but statistically significant decrease in SIS in September. This is in slight contrast to October and November, when the Mediterranean regions show a small increase in SIS, while northern European regions show a small decrease or statistically insignificant changes. The changes in December are generally insignificant over much of Europe. It is to be noted that the spatial trends in daytime cloud fractions in November, December, and January are very heterogeneous and have larger uncertainties compared to the other sunlit months of the year due to limited sampling in these winter months, as the solar zenith angles are high.
Apart from clouds, the trends in SIS mentioned above are also regulated by other atmospheric components and their feedbacks in the backdrop of increasing greenhouse gases. Among them, the most important are aerosols, water vapour, and, to some extent, ozone (Wild, 2009). In Europe over the land regions, the primary sources of aerosols are anthropogenic. The large policy changes in the late 1980s and the early 1990s in Europe have led to decreases in aerosol precursor gases (Vestreng et al., 2007) and particulate matter over the last decades, as pointed out in many previous studies (Cherian and Quaas, 2020; Yang et al., 2020; Glantz et al., 2022; Quaas et al., 2022; Vautard et al., 2009). As a result, the brightening trends have been pointed out in a number of pioneering studies by Wild et al. (2005, 2021) and Wild (2009). Going forward, apart from the southern and eastern regions in Europe (Gutiérrez et al., 2020) that are episodically affected by desert dust outbreaks and biomass burning, the aerosols are not expected to play a seminal role in regulating SIS, especially in the northern parts of Europe, where SIS has much stronger seasonality (Drugé et al., 2021).
The changes in ozone paint a complex picture. After recovering for few decades following the international agreements to reduce ozone-depleting substances, the stratospheric ozone has again shown a slight decrease in recent years (Bognar et al., 2022; Villamayor et al., 2023). The research is currently ongoing to understand the drivers of this decrease, for example, the role of atmospheric dynamics and transport and the role of very short-lived halogens in the lower stratosphere. The observed changes in stratospheric ozone over Europe are, however, weaker. The tropospheric ozone shows statistically insignificant changes over Europe in the last few decades, as nitrogen dioxide and its derivatives have also decreased in Europe (Yan et al., 2018; Ziemke et al., 2019).
As aerosols and ozone are expected to have a relatively small role in future, changes in clouds and their opacity will have a much larger bearing on SIS. Recent studies have already pointed out an increasing role of clouds in regulating the past trends in SIS over Europe and Scandinavia (Pfeifroth et al., 2018b; Devasthale et al., 2022; Post and Aun, 2024; Schilliger et al., 2024). Even small, long-term changes in cloud cover and cloud optical thickness could have significant impacts on the efficacy of photovoltaic systems.
The purpose behind the analysis presented in this section is to capture the interplay among the trends in SIS, cloudiness, and cloud opacity so as to better inform ourselves about the spatiotemporal nature of emerging conditions relevant for solar energy applications. In practice, this is illustrated using the concept of climatic trend regimes, whereby we composite the combinations of the trend outcomes in SIS, daytime cloud fraction, and optical thickness. Each variable in question here (i.e. SIS, cloud cover, and cloud optical thickness) can have either a decreasing or an increasing trend. By combining these two possible trend outcomes of three variables, the composites of a number of combinations can be made for each grid point. We refer to each such composite as a climatic trend regime. Thus, these regimes, which are essentially based on the interplay of trends in SIS, cloudiness, and optical thickness, would be very relevant for solar energy applications. For example, a climatic trend regime, wherein SIS is increasing and cloudiness and cloud opacity are decreasing, is certainly very favourable for solar energy applications compared to a contrasting climatic trend regime, wherein SIS is decreasing and cloudiness and cloud opacity are increasing.
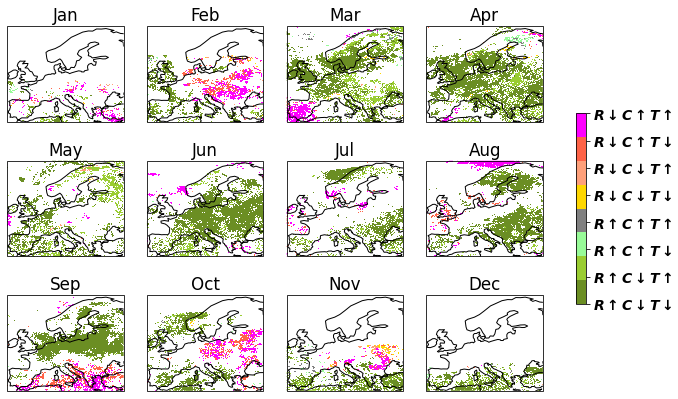
Figure 5The climatic trend regimes based on the combination of trends in surface solar radiation (R), daytime cloud fraction (C), and liquid cloud optical thickness (T). The arrows show either an increasing or decreasing trend in these variables. The white areas show the regions with missing data or where the trends in either of them are not statistically significant.
Figure 5 shows these various climatic trend regimes for each month. Here, together with the trends in SIS and daytime cloudiness, the trends in the in-cloud optical thickness of liquid-phase clouds are considered. Figure 6 further shows the same but when the trends in the optical thickness of ice-phase clouds are considered. Instead of using the total optical thickness, we choose to show the results separately for liquid and ice optical thicknesses due to the fact that the physical drivers and cloud-controlling factors for low-level liquid clouds and high-level ice clouds can be different. For example, the surface fluxes and boundary layer have a large impact on low-level clouds, especially in the summer months, while the large-scale dynamics influence high ice clouds more strongly. In interpreting the climatic trend regimes in Figs. 5 and 6, the trends in SIS and its co-variability with cloudiness and cloud optical thickness need to be considered. While the trends are already discussed in Figs. 3 and 4, Figs. 7–9 below show the correlations.
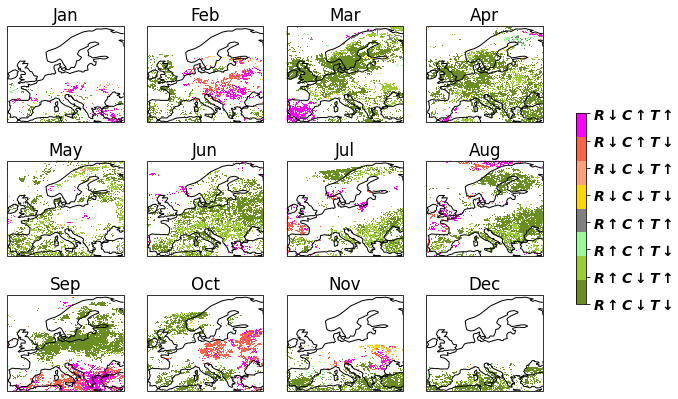
Figure 6Same as in Fig. 5 but when ice cloud optical thickness is considered while deriving the climatic trend regimes.
The greenest areas in Figs. 5 and 6 depict the climatic trend regime that is most favourable for solar energy applications. They show the regions where the surface radiation is increasing (R↑) but the cloudiness (C↓) and the optical thickness (T↓) are simultaneously decreasing. The existence of this regime is strongly evident in the months of April and June covering nearly the whole of Europe. The trends in SIS and cloudiness and the correlation among them are very strong in these months. This regime also dominates parts of central and eastern Europe and Scandinavia in March and September, as expected from Figs. 3–4 and 7–9. The next-lightest shade of green also shows a favourable climatic trend regime, wherein the surface radiation is increasing (R↑) and the cloudiness is decreasing (C↓) but the optical thickness is increasing (T↑). The cloud fraction and cloud optical thickness can be independently influenced by a number of factors, such as temperature, humidity, aerosol composition, size, number density, and atmospheric dynamics. In a warming world, the water-holding capacity of air also increases as the temperatures increase. Even though the cloudiness may decrease, the optical depth of clouds can have increasing trends under certain conditions. The existence of the regime is visible in the central and eastern parts of Europe in early spring in March and April in Fig. 5 when the liquid cloud and ice cloud optical thicknesses are considered and in southern Europe in June in Fig. 6 when the ice-phase optical thickness is considered. It is to be noted that, over almost all regions where the favourable and regimes are seen, the surface radiation is negatively correlated with the liquid cloud optical thickness more strongly than with the ice cloud optical thickness (Figs. 8–9). This means that the cloud thermodynamic phase also plays an important role in regulating the surface radiation.
The potentially unfavourable climatic trend regimes are depicted by the red shades in Figs. 5 and 6. In these regimes, surface radiation decreases (R↓) and cloudiness simultaneously increases (C↑). In the case of the most unfavourable climatic trend regime, the cloud optical thickness is also increasing (T↑). In this case, the atmospheric interference with the incoming solar radiation is strongest, mediated mainly through the changes in cloud properties. The existence of unfavourable regimes can be seen in parts of central and eastern Europe in February, in the Iberian Peninsula in March, in the Mediterranean region in September, and in parts of eastern Europe in October. The presence of unfavourable regimes is also seen over the United Kingdom in August.
There are further interesting features in Figs. 7–9 that are noteworthy. In general, the correlation of SIS is strongest with the daytime cloud fraction, followed by the liquid cloud and ice cloud optical thicknesses. There is also a strong seasonal and spatial character to these correlations. For example, the correlations are stronger during the summer half-year, and they are spatially very heterogeneous. The results presented in Figs. 3–9 show the complexity of interactions between clouds and surface radiation but nonetheless point out the increasing importance of cloud properties compared to aerosols in regulating the surface radiation over Europe.
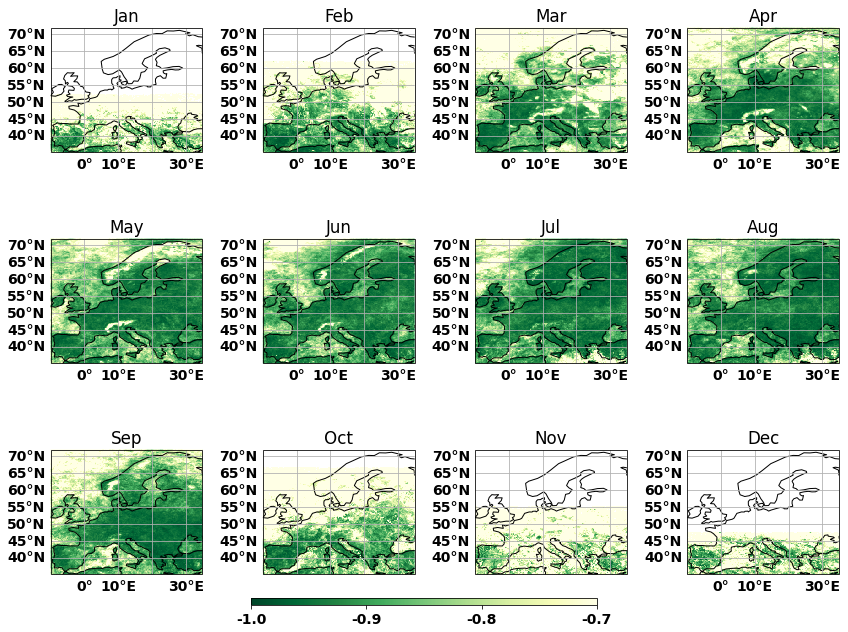
Figure 7The correlation between SIS and daytime cloud fraction. The white areas show regions where the daytime cloud fraction data are not available.
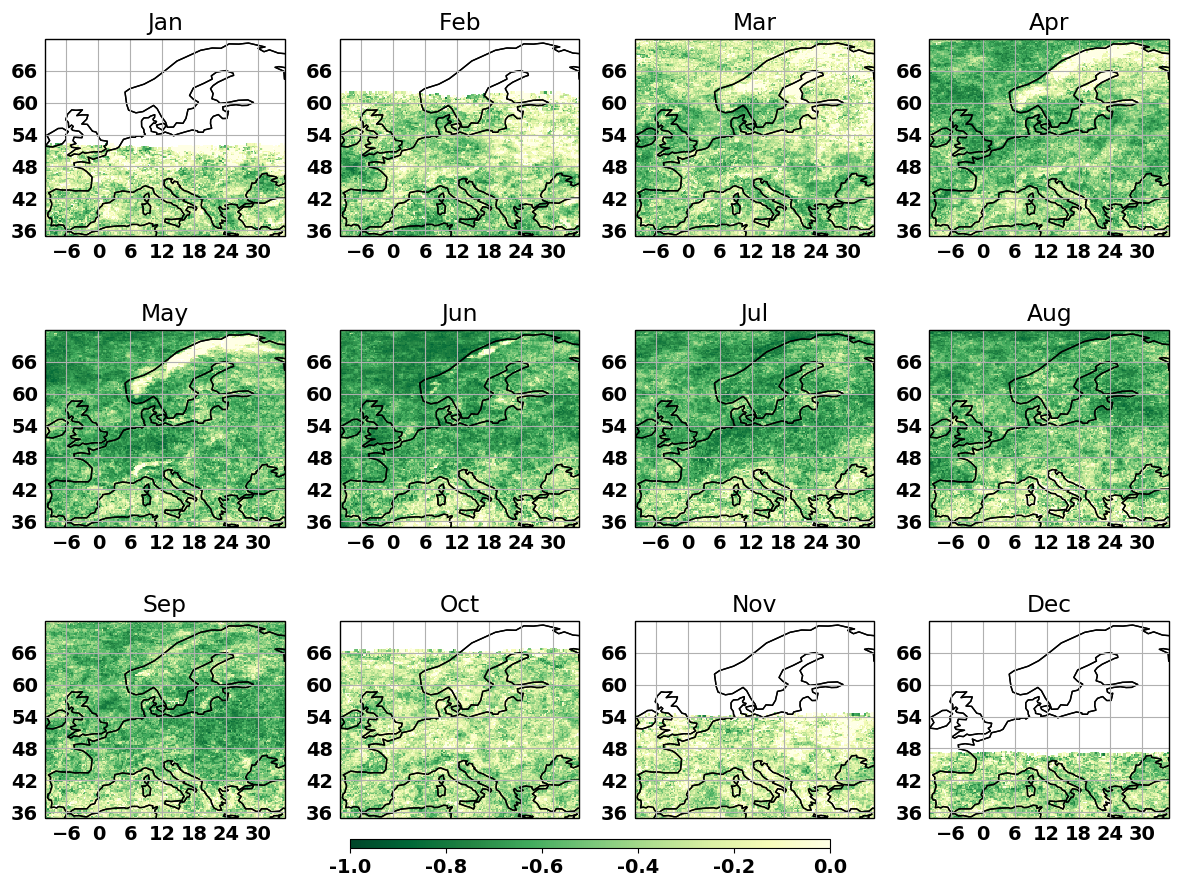
Figure 8The correlation between SIS and liquid cloud optical thickness.
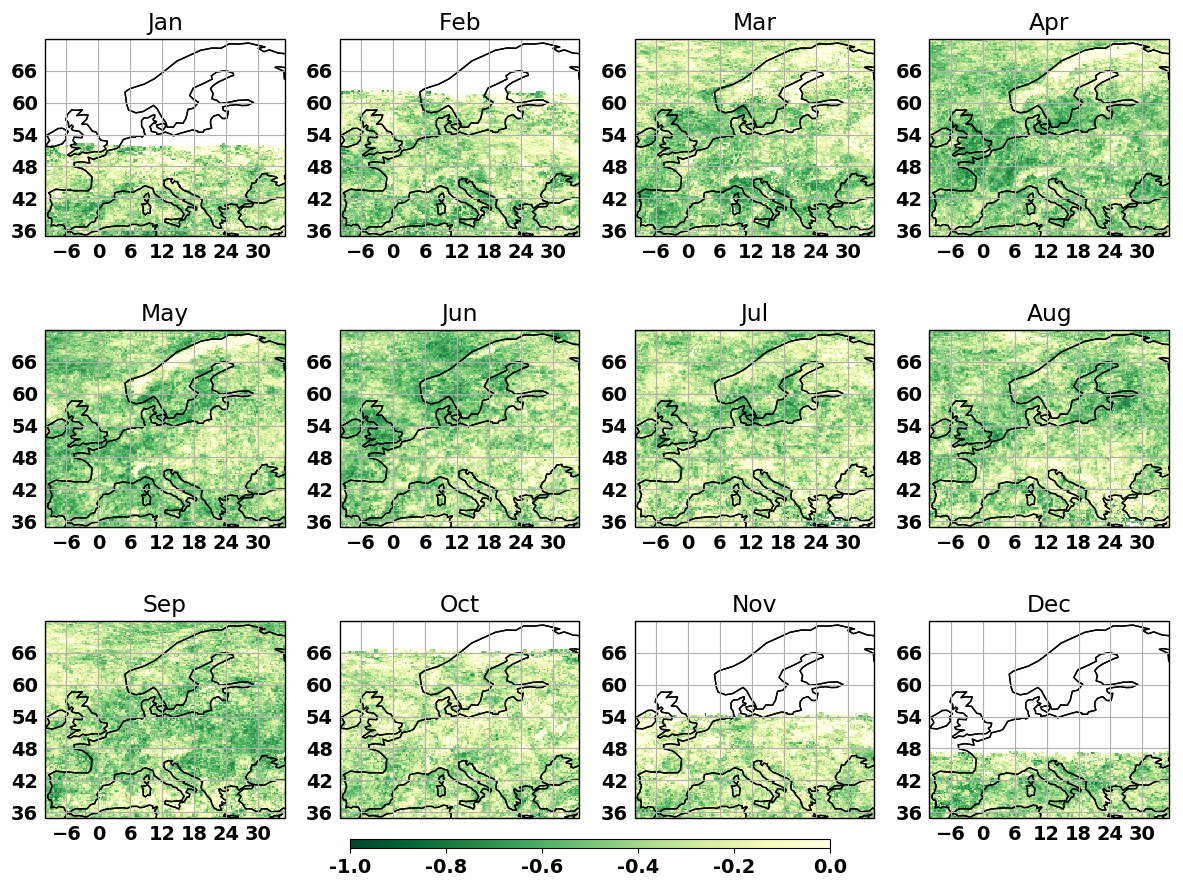
Figure 9The correlation between SIS and ice cloud optical thickness.
In addition to the atmospheric constituents, such as clouds, aerosols, and ozone, the meteorological context also plays an important role in determining the efficiency of the solar energy systems (Mockert et al., 2023). For example, warmer temperatures can reduce the net performance of the systems (Dubey et al., 2013; Driesse et al., 2022; Sengupta et al., 2024). Increased humidity can also reduce net uptake of solar radiation due to dew formation or a fogging effect or by physically degrading the solar system assembly. Figure 10 therefore shows the interplay among trends in surface solar radiation (R), total column water vapour (H), and surface temperature (T). The trends in total column water vapour and surface temperature are derived using the ERA5 reanalysis data (Hersbach et al., 2020).
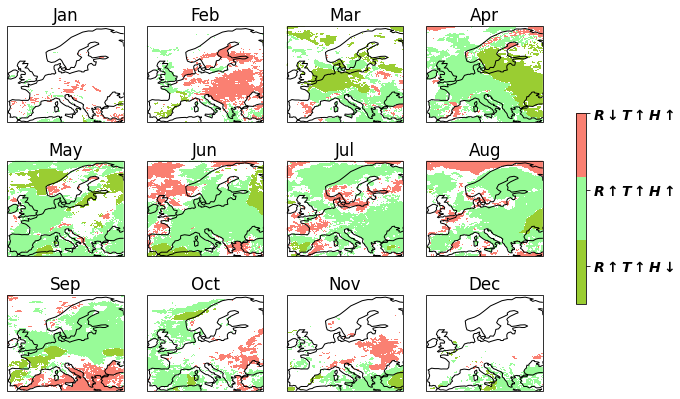
Figure 10The interplay among trends in surface solar radiation (R), surface temperature (T), and total column water vapour (H). The arrows show either an increasing or decreasing trend in these variables. The white areas show the regions where the trend in either of them is not statistically significant.
This interplay is dominated by three regimes. It is to be noted that T is increasing in all regimes due to the large-scale warming in nearly all months due to increasing global greenhouse gases. Therefore, the first regime (shown by the olive-green shade), where T is increasing, can still be regarded as the most favourable meteorological regime for solar energy applications, since R and H have trends that would help increase the net performance of the solar energy systems from early spring to late autumn. In the second regime, all three variables show increasing trends (shown by the light-green shade). Although the total column water vapour is increasing and will interfere with the incoming solar radiation, given the fact that the SIS is still increasing, this regime could also be regarded as favourable. The third regime dominating the interplay, shown by the orange shade, is probably the least favourable, wherein incoming surface radiation is decreasing and T and H are increasing.
The presence of the regime over northern central Europe in March and over southern Scandinavia and eastern Europe in April is noteworthy, indicating the emergence of favourable conditions early in the spring. The month of June stands out as the month when the regime dominates over the whole of Europe. The third regime, , is dominant in February in eastern and central Europe and in late autumn in October and November in parts of eastern Europe. Parts of southern Scandinavia in July and August and the United Kingdom in August show decreasing trends in the surface solar radiation, as can also be seen in Fig. 3. The trends in surface temperature and total column water vapour do not always agree with one another and are spatially heterogeneous. It is to be noted that the climatic trend regimes shown in Figs. 5 and 6 and the meteorological context presented in Fig. 10 show strong spatial coherence, meaning that they both agree on the emerging favourable conditions in time and space. This increases the usability of climatic trend regimes presented in Sect. 4.
Knowledge about ongoing climate change is important as we transition to renewable and strongly weather-dependent energy sources. A key aspect going forward is how to best improve this knowledge by utilizing the state-of-the-art observations. In this context, we set out to answer the following three questions.
- a.
Can we derive information on climatic trend regimes that is relevant for solar energy applications over Europe and that is also user-friendly and helpful to decision-makers?
-
We demonstrated that it is certainly possible to leverage modern climate data records to derive information that could be useful to decision- and policy-makers. The derivation of various climatic trend regimes should help in the assessment of the state of climate relevant for solar energy applications. The existence of favourable conditions over Europe shows promise in increasing the exploitation of solar energy during the spring and early summer months. It is clear that the satellite-based CDRs can only describe the recent past and not the near future. However, the recent state of the climate and changes therein often serve as predictors and a basis for policy-making in near future. This is one of the reasons the World Meteorological Organization (WMO) recommends computing climate normals (WMO, 2017; Devasthale et al., 2023). Given the urgency of energy transitioning in the coming few decades, the assessment of recent climatic trend regimes, such as the one presented here, is even more relevant. These climatic trend regimes could furthermore be used as evaluation metrics to investigate the fidelity of climate models in capturing the drivers behind the trends in SIS and cloud properties. As a result, the climate models could be used more reliably to project the climate trends that are favourable for designing and implementing solar energy systems in the near future.
-
- b.
How well do cloud properties correlate with SIS?
-
Our results showed very strong correlation of SIS with daytime cloud fraction, often exceeding 0.90 over large parts of Europe and during the summer half-year. The correlations with the liquid cloud optical thickness are also very strong, while the correlations with the ice cloud optical thickness are relatively weaker. There is a strong spatiotemporal variability in these correlations.
-
- c.
What are the recent trends in SIS and cloud properties?
-
The third edition of the CLARA CDR confirms the large-scale increase in SIS over much of Europe during spring and early summer, complementing earlier studies (Pfeifroth et al., 2018a, b; Devasthale et al., 2022; Schilliger et al., 2024). We further show that this SIS increase is accompanied by large-scale decreases in daytime cloud fraction and cloud opacity. The increasing trends in SIS for April and June stand out together with remarkable decrease in cloudiness in those months over the last 4 decades. The outstanding change in the European weather patterns in April was also discussed by Ionita et al. (2020) and Imbery et al. (2020).
-
All of the results presented above point to an increasing control of SIS by clouds. In future, this strong co-variability between SIS and cloud properties poses a number of challenges. Clouds are still notoriously difficult to represent in climate models (https://www.ipcc.ch/report/ar6/wg1/chapter/chapter-7, last access: 12 June 2024). They are often pointed out as the largest source of uncertainties, and the large spread in the equilibrium climate sensitivity is often attributed to our limited knowledge of future cloud feedbacks in the Earth system. This has direct implications for designing and implementing solar energy systems while using information of future cloud and radiation conditions from climate model projections. At the same time, it also implies that the satellite-based climate monitoring of co-variability between SIS and clouds would need to be strengthened even more to continue to provide a robust scientific basis for assessments that are of relevance for future solar energy applications.
All datasets used in the study are publicly available. The CLARA-A3 dataset can be accessed here: https://doi.org/10.5676/EUM_SAF_CM/CLARA_AVHRR/V003 (Karlsson et al., 2023b). SMHI station data can be accessed here: https://www.smhi.se/data/meteorologi/stralning (Carlund, 2011). ERA5 reanalysis data were obtained from the Copernicus Climate Data Store: https://doi.org/10.24381/cds.f17050d7 (Hersbach et al., 2023).
AD designed the study, carried out the analysis, and wrote the first draft. All authors contributed equally to the interpretation of results and writing thereafter.
The contact author has declared that none of the authors has any competing interests.
Publisher’s note: Copernicus Publications remains neutral with regard to jurisdictional claims made in the text, published maps, institutional affiliations, or any other geographical representation in this paper. While Copernicus Publications makes every effort to include appropriate place names, the final responsibility lies with the authors.
Abhay Devasthale would like to thank the CM SAF/EUMETSAT team.
This research has been supported by the Vetenskapsrådet (grant no. 2021-05143) and the Swedish Government's 2023 Climate Adaptation Grant 1:10 to SMHI.
The publication of this article was funded by the Swedish Research Council, Forte, Formas, and Vinnova.
This paper was edited by Daniel Kirk-Davidoff and reviewed by two anonymous referees.
Babar, B., Graversen, R., and Boström, T.: Solar radiation estimation at high latitudes: Assessment of the CMSAF databases, ASR and ERA5, Sol. Energy, 182, 397-411, https://doi.org/10.1016/j.solener.2019.02.058, 2019.
Bognar, K., Tegtmeier, S., Bourassa, A., Roth, C., Warnock, T., Zawada, D., and Degenstein, D.: Stratospheric ozone trends for 1984–2021 in the SAGE II–OSIRIS–SAGE III/ISS composite dataset, Atmos. Chem. Phys., 22, 9553–9569, https://doi.org/10.5194/acp-22-9553-2022, 2022.
Campana, P. E., Landelius, T., Andersson, S., Lundström, L., Nordlander, E., He, T., Zhang, J., Stridh, B., and Yan, J.: A gridded optimization model for photovoltaic applications, Sol. Energy, 202, 465–484, 2020.
Cano, D., Monget, J. M., Albuisson, M., Guillard, H., Regas, N., and Wald, L.: A method for the determination of the global solar radiation from meteorological satellite data, Sol. Energy, 37, 31–39, 1986.
Carlund, T.: Upgrade of SMHI's meteorological radiation network 2006–2007 – Effects on direct and global solar radiation, SMHI Meteorology Report 148, https://www.smhi.se/publikationer/upgrade-of-smhi-s-meteorological-radiation-network-2006-2007-effects-on-direct-and-global-solar-radiation-1.19033 (last access: 1 March 2021), 2011 (data available at: https://www.smhi.se/data/meteorologi/stralning, last access: 7 June 2021).
Cherian, R. and Quaas, J.: Trends in AOD, clouds, and cloud radiative effects in satellite data and CMIP5 and CMIP6 model simulations over aerosol source regions, Geophys. Res. Lett., 47, e2020GL087132, https://doi.org/10.1029/2020GL087132, 2020.
Darragh, K. and Fiedler, S.: Which gridded irradiance data is best for modelling photovoltaic power production in Germany? Solar Energy, 232, 444–458, 2022.
Devasthale, A., Carlund, T., and Karlsson, K.-G.: Recent trends in the agrometeorological climate variables over Scandinavia, Agr. Forest Meteorol., 316, https://doi.org/10.1016/j.agrformet.2022.108849, 2022.
Devasthale, A. and Karlsson, K.-G.: Decadal Stability and Trends in the Global Cloud Amount and Cloud Top Temperature in the Satellite-Based Climate Data Records, Remote Sens., 15, 3819, https://doi.org/10.3390/rs15153819, 2023.
Devasthale, A., Karlsson, K-G., Andersson, S., and Engström, E.: Difference between WMO Climate Normal and Climatology: Insights from a Satellite-Based Global Cloud and Radiation Climate Data Record, Remote Sens., 15, 5598, https://doi.org/10.3390/rs15235598, 2023.
Dong, B., Sutton, R. T., and Wilcox, L. J.: Decadal trends in surface solar radiation and cloud cover over the North Atlantic sector during the last four decades: drivers and physical processes, Clim. Dynam., 60, 2533–2546, https://doi.org/10.1007/s00382-022-06438-3, 2023.
Driesse, A., Theristis, M., and Stein, J. S.: PV Module Operating Temperature Model Equivalence and Parameter Translation, in: IEEE 49th Photovoltaics Specialists Conference (PVSC), Philadelphia, PA, 0172–0177, https://doi.org/10.1109/PVSC48317.2022.9938895, 2022.
Drücke, J., Borsche, M., James, P., Kaspar, F., Pfeifroth, U., Ahrens, B., and Trentmann, J.: Climatological analysis of solar and wind energy in Germany using the Grosswetterlagen classification, Renew. Energ., 164, 1254–1266, https://doi.org/10.1016/j.renene.2020.10.102, 2021.
Drugé, T., Nabat, P., Mallet, M., and Somot, S.: Future evolution of aerosols and implications for climate change in the Euro-Mediterranean region using the CNRM-ALADIN63 regional climate model, Atmos. Chem. Phys., 21, 7639–7669, https://doi.org/10.5194/acp-21-7639-2021, 2021.
Dubey, S., Sarvaiya, J. N., and Seshadri, B.: Temperature Dependent Photovoltaic (PV) Efficiency and Its Effect on PV Production in the World – A Review, Enrgy Proced., 33, 311–321, https://doi.org/10.1016/j.egypro.2013.05.072, 2013.
Dutta, R., Chanda, K., and Maity, R.: Future of solar energy potential in a changing climate across the world: A CMIP6 multi-model ensemble analysis, Renew. Energ., 188, 819–829, https://doi.org/10.1016/j.renene.2022.02.023, 2022.
Edwards, M. R., Holloway, T., Pierce, R. B., Blank, L., Broddle, M., Choi, E., Duncan, B. N., Esparza, Á., Falchetta, G., Fritz, M., Gibbs, H. K., Hundt, H., Lark, T., Leibrand, A., Liu, F., Madsen, B., Maslak, T., Pandey, B., Seto, K. C., and Stackhouse Jr, P. W.: Satellite Data Applications for Sustainable Energy Transitions, Front. Sustain., 3, 910924, https://doi.org/10.3389/frsus.2022.910924, 2022.
Engeland, K., Borga, M., Creutin, J.-D., François, B., Ramos, M.-H., and Vidal, J.-P.: Space-time variability of climate variables and intermittent renewable electricity production – A review, Renewable and Sustainable Energy Reviews, 79, 600–617, https://doi.org/10.1016/j.rser.2017.05.046, 2017.
Gernaat, D. E. H. J., de Boer, H. S., Daioglou, V., Yalew, S. G., Müller, C., and van Vuuren, D. P.: Climate change impacts on renewable energy supply, Nat. Clim. Change, 11, 119–125, https://doi.org/10.1038/s41558-020-00949-9, 2021.
Glantz, P., Fawole, O. G., Ström, J., Wild, M., and Noone, K. J.: Unmasking the effects of aerosols on greenhouse warming over Europe, J. Geophys. Res.-Atmos., 127, e2021JD035889, https://doi.org/10.1029/2021JD035889, 2022.
Grams, C., Beerli, R., Pfenninger, S., Staffel, I., and Wernli, H.: Balancing Europe's wind-power output through spatial deployment informed by weather regimes, Nat. Clim. Change 7, 557–562, https://doi.org/10.1038/nclimate3338, 2017.
Gutiérrez, C., Somot, S., Nabat, P., Mallet, M., Corre, L., van Meijgaard, E., Perpiñán, O., and Gaertner, M. A.: Future evolution of surface solar radiation and photovoltaic potential in Europe: investigating the role of aerosols, Environ. Res. Lett., 15, 034035, https://doi.org/10.1088/1748-9326/ab6666, 2020.
Ha, S., Zhou, Z., Im, E.-S., and Lee, Y.-M.: Comparative assessment of future solar power potential based on CMIP5 and CMIP6 multi-model ensembles, Renew. Energ., 206, 324–335, https://doi.org/10.1016/j.renene.2023.02.039, 2023.
Hammer, A., Heinemann, D., Hoyer, C., Kuhlemann, R., Lorenz, E., Müller, R., and Beyer, H. G.: Solar energy assessment using remote sensing technologies, Remote Sens. Environ., 86, 423–432, https://doi.org/10.1016/S0034-4257(03)00083-X , 2003.
Hersbach, H., Bell, B., Berrisford, P., Hirahara, S., Horányi, A., Muñoz-Sabater, J., Nicolas, J., Peubey, C., Radu, R., Schepers, D., Simmons, A., Soci, C., Abdalla, S., Abellan, X., Balsamo, G., Bechtold, P., Biavati, G., Bidlot, J., Bonavita, M., De Chiara, G., Dahlgren, P., Dee, D., Diamantakis, M., Dragani, R., Flemming, J., Forbes, R., Fuentes, M., Geer, A., Haimberger, L., Healy, S., Hogan, R. J., Hólm, E., Janisková, M., Keeley, S., Laloyaux, P., Lopez, P., Lupu, C., Radnoti, G., de Rosnay, P., Rozum, I., Vamborg, F., Villaume, S., and Thépaut, J.-N.: The ERA5 global reanalysis, Q. J. Roy. Meteor. Soc., 146, 1999–2049, https://doi.org/10.1002/qj.3803, 2020.
Hersbach, H., Bell, B., Berrisford, P., Biavati, G., Horányi, A., Muñoz Sabater, J., Nicolas, J., Peubey, C., Radu, R., Rozum, I., Schepers, D., Simmons, A., Soci, C., Dee, D., and Thépaut, J.-N.: ERA5 monthly averaged data on single levels from 1940 to present, Copernicus Climate Change Service (C3S) Climate Data Store (CDS) [data set], https://doi.org/10.24381/cds.f17050d7, 2023.
Hess, M., Koepke, P., and Schult, I.: Optical properties of aerosols and clouds: The software package OPAC, B. Am. Meteorol. Soc., 79, 831–844, https://doi.org/10.1175/1520-0477(1998)079<0831:OPOAAC>2.0.CO;2, 1998.
Hou, X., Wild, M., Folini, D., Kazadzis, S., and Wohland, J.: Climate change impacts on solar power generation and its spatial variability in Europe based on CMIP6, Earth Syst. Dynam., 12, 1099–1113, https://doi.org/10.5194/esd-12-1099-2021, 2021.
Imbery, F., Friedrich, K., Kaspar, F., Kaiser, J., Pfeifroth, U., Plückhahn, B., Koppe, C., Janssen, W., and Meinert, T.: Klimatologische Einordnung des Aprils 2020, Deutscher Wetterdienst, Offenbach, Germany, https://doi.org/10.13140/RG.2.2.20413.23524, 2020.
Ionita, M., Nagavciuc, V., Kumar, R., and Rakovec, O.: On the curious case of the recent decade, mid-spring precipitation deficit in central Europe, npj Clim. Atmos. Sci., 3, 49, https://doi.org/10.1038/s41612-020-00153-8, 2020.
Jerez, S., Tobin, I., Vautard, R., Montávez, J. P., López-Romero, J. M., Thais, F., Bartok, B., Christensen, O. B., Colette, A., Déqué, M., Nikulin, G., Kotlarski, S., van Meijgaard, E., Teichmann, C., and Wild, M.: The impact of climate change on photovoltaic power generation in Europe, Nat. Commun., 6, 10014, https://doi.org/10.1038/ncomms10014, 2015.
Kapica, J. Jurasz, J., Canales, F. A., Bloomfield, H., Guezgouz, M., De Felice, M., and Zbigniew, K.: The potential impact of climate change on European renewable energy droughts, Renewable and Sustainable Energy Reviews, 189, 114011, https://doi.org/10.1016/j.rser.2023.114011, 2024.
Karlsson, K.-G., Anttila, K., Trentmann, J., Stengel, M., Fokke Meirink, J., Devasthale, A., Hanschmann, T., Kothe, S., Jääskeläinen, E., Sedlar, J., Benas, N., van Zadelhoff, G.-J., Schlundt, C., Stein, D., Finkensieper, S., Håkansson, N., and Hollmann, R.: CLARA-A2: the second edition of the CM SAF cloud and radiation data record from 34 years of global AVHRR data, Atmos. Chem. Phys., 17, 5809–5828, https://doi.org/10.5194/acp-17-5809-2017, 2017.
Karlsson, K.-G., Stengel, M., Meirink, J. F., Riihelä, A., Trentmann, J., Akkermans, T., Stein, D., Devasthale, A., Eliasson, S., Johansson, E., Håkansson, N., Solodovnik, I., Benas, N., Clerbaux, N., Selbach, N., Schröder, M., and Hollmann, R.: CLARA-A3: The third edition of the AVHRR-based CM SAF climate data record on clouds, radiation and surface albedo covering the period 1979 to 2023, Earth Syst. Sci. Data, 15, 4901–4926, https://doi.org/10.5194/essd-15-4901-2023, 2023a.
Karlsson, K.-G., Riihelä, A., Trentmann, J., Stengel, M., Solodovnik, I., Meirink, J. F., Devasthale, A., Jääskeläinen, E., Kallio-Myers, V., Eliasson, S., Benas, N., Johansson, E., Stein, D., Finkensieper, S., Håkansson, N., Akkermans, T., Clerbaux, N., Selbach, N., Schröder, M., and Hollmann, R.: CLARA-A3: CM SAF cLoud, Albedo and surface RAdiation dataset from AVHRR data – Edition 3, Satellite Application Facility on Climate Monitoring [data set], https://doi.org/10.5676/EUM_SAF_CM/CLARA_AVHRR/V003, 2023b.
Kaspar, F., Borsche, M., Pfeifroth, U., Trentmann, J., Drücke, J., and Becker, P.: A climatological assessment of balancing effects and shortfall risks of photovoltaics and wind energy in Germany and Europe, Adv. Sci. Res., 16, 119–128, https://doi.org/10.5194/asr-16-119-2019, 2019.
Kjellström, E., Hansen, F. and Belušić, D., Contributions from Changing Large-Scale Atmospheric Conditions to Changes in Scandinavian Temperature and Precipitation Between Two Climate Normals', Tellus A, 74, 204–221, https://doi.org/10.16993/tellusa.49, 2022.
Mockert, F., Grams, C. M., Brown, T., and Neumann, F.: Meteorological conditions during periods of low wind speed and insolation in Germany: The role of weather regimes, Meteorol. Appl., 30, e2141, https://doi.org/10.1002/met.2141, 2023.
Mueller, R., Matsoukas, C., Gratzki, A., Behr, H., and Hollmann, R.: The CM-SAF operational scheme for the satellite based retrieval of solar surface irradiance – A LUT based eigenvector hybrid approach, Remote Sens. Environ., 113, 1012–1024, https://doi.org/10.1016/j.rse.2009.01.012, 2009.
Nakajima, T. and King, M. D.: Determination of the Optical Thickness and Effective Particle Radius of Clouds from Reflected Solar Radiation Measurements. Part I: Theory, J. Atmos. Sci., 47, 1878–1893, https://doi.org/10.1175/1520-0469(1990)047<1878:DOTOTA>2.0.CO;2, 1990.
Pfeifroth, U., Sanchez-Lorenzo, A., Manara, V., Trentmann, J., and Hollmann, R.: Trends and variability of surface solar radiation in Europe based on surface- and satellite-based data records, J. Geophys. Res.-Atmos., 123, 1735–1754, https://doi.org/10.1002/2017JD027418, 2018a.
Pfeifroth, U., Bojanowski, J. S., Clerbaux, N., Manara, V., Sanchez-Lorenzo, A., Trentmann, J., Walawender, J. P., and Hollmann, R.: Satellite-based trends of solar radiation and cloud parameters in Europe, Adv. Sci. Res., 15, 31–37, https://doi.org/10.5194/asr-15-31-2018, 2018b.
Post, P. and Aun, M.: Changes in cloudiness contribute to changing seasonality in the Baltic Sea region, Oceanologia, 66, 91–98, https://doi.org/10.1016/j.oceano.2023.11.004, 2024.
Quaas, J., Jia, H., Smith, C., Albright, A. L., Aas, W., Bellouin, N., Boucher, O., Doutriaux-Boucher, M., Forster, P. M., Grosvenor, D., Jenkins, S., Klimont, Z., Loeb, N. G., Ma, X., Naik, V., Paulot, F., Stier, P., Wild, M., Myhre, G., and Schulz, M.: Robust evidence for reversal of the trend in aerosol effective climate forcing, Atmos. Chem. Phys., 22, 12221–12239, https://doi.org/10.5194/acp-22-12221-2022, 2022.
Riihelä, A., Carlund, T., Trentmann, J., Müller, R., and Lindfors, A.V.: Validation of CM SAF Surface Solar Radiation Datasets over Finland and Sweden, Remote Sens., 7, 6663–6682, https://doi.org/10.3390/rs70606663, 2015.
Schilliger, L., Tetzlaff, A., Bourgeois, Q., Correa, L. F., and Wild, M.: An investigation on causes of the detected surface solar radiation brightening in Europe using satellite data, J. Geophys. Res.-Atmos., 129, e2024JD041101, https://doi.org/10.1029/2024JD041101, 2024.
Sengupta, M., Habte, A., Wilbert, S., Gueymard, C., Remund, J., Lorenz, E., van Sark, W., and Jensen, A R.: Best Practices Handbook for the Collection and Use of Solar Resource Data for Solar Energy Applications: Fourth Edition, National Renew. Energ. Laboratory, Golden, CO, NREL/TP-5D00-88300, https://doi.org/10.2172/2448063, 2024.
Urraca, R., Gracia-Amillo, A. M., Koubli, E., Huld, T., Trentmann, J., Riihelä, A., Lindfors, A. V., Palmer, D., Gottschalg, R., and Antonanzas-Torres, F.: Extensive validation of CM SAF surface radiation products over Europe, Remote Sens Environ., 199, 171–186, https://doi.org/10.1016/j.rse.2017.07.013, 2017.
Urraca, R., Trentmann, J., Pfeifroth, U., and Gobron, N.: Can satellite products monitor solar brightening in Europe?, Remote Sens. Environ., 315, 114472, https://doi.org/10.1016/j.rse.2024.114472, 2024.
Vautard, R., Yiou, P., and van Oldenborgh, G.: Decline of fog, mist and haze in Europe over the past 30 years, Nat. Geosci., 2, 115–119, https://doi.org/10.1038/ngeo414, 2009.
Vestreng, V., Myhre, G., Fagerli, H., Reis, S., and Tarrasón, L.: Twenty-five years of continuous sulphur dioxide emission reduction in Europe, Atmos. Chem. Phys., 7, 3663–3681, https://doi.org/10.5194/acp-7-3663-2007, 2007.
Villamayor, J., Iglesias-Suarez, F., Cuevas, C. A., Fernandez, R. P., Li, Q., Abalos, M., Hossaini, R., Chipperfield, M. P., Kinnison, D. E., Tilmes, S., Lamarque, J.-F., and Saiz-Lopez, A.: Very short-lived halogens amplify ozone depletion trends in the tropical lower stratosphere, Nat. Clim. Change, 13, 554–560, https://doi.org/10.1038/s41558-023-01671-y, 2023.
Wild, M.: Global dimming and brightening: A review, J. Geophys. Res.-Atmos., 114, D00D16, https://doi.org/10.1029/2008JD011470, 2009.
Wild, M., Gilgen, H., Roesch, A., Ohmura, A., Long, C. N., Dutton, E. C., Forgan, B., Kallis, A., Russak, V., and Tsvetkov, A.: From dimming to brightening: Decadal changes in solar radiation at Earth's surface, Science, 308, 847–850, https://doi.org/10.1126/science.1103215, 2005.
Wild, M., Wacker, S., Yang, S., and Sanchez-Lorenzo, A.: Evidence for Clear Sky Dimming and Brightening in Central Europe, Geophys. Res. Lett., 48, e2020GL0922162020GL092216, 2021.
WMO: WMO Guidelines on the Calculation of Climate Normals, 2017 Edition, WMO-No. 1203, WMOm Geneva, Switzerland, 1–18, https://library.wmo.int/viewer/55797?medianame=1203_en_#page=1&viewer=picture&o=bookmark&n=0&q= (last access: 11 November 2020), 2017.
Yan, Y., Pozzer, A., Ojha, N., Lin, J., and Lelieveld, J.: Analysis of European ozone trends in the period 1995–2014, Atmos. Chem. Phys., 18, 5589–5605, https://doi.org/10.5194/acp-18-5589-2018, 2018.
Yang, Y., Lou, S., Wang, H., Wang, P., and Liao, H.: Trends and source apportionment of aerosols in Europe during 1980–2018, Atmos. Chem. Phys., 20, 2579–2590, https://doi.org/10.5194/acp-20-2579-2020, 2020.
Ziemke, J. R., Oman, L. D., Strode, S. A., Douglass, A. R., Olsen, M. A., McPeters, R. D., Bhartia, P. K., Froidevaux, L., Labow, G. J., Witte, J. C., Thompson, A. M., Haffner, D. P., Kramarova, N. A., Frith, S. M., Huang, L.-K., Jaross, G. R., Seftor, C. J., Deland, M. T., and Taylor, S. L.: Trends in global tropospheric ozone inferred from a composite record of TOMS/OMI/MLS/OMPS satellite measurements and the MERRA-2 GMI simulation , Atmos. Chem. Phys., 19, 3257–3269, https://doi.org/10.5194/acp-19-3257-2019, 2019.
- Abstract
- Introduction
- Satellite-based cloud and radiation climate data record
- Trends in SIS and their drivers
- Climatic trend regimes relevant for solar energy
- The meteorological context
- Conclusions
- Code and data availability
- Author contributions
- Competing interests
- Disclaimer
- Acknowledgements
- Financial support
- Review statement
- References