the Creative Commons Attribution 4.0 License.
the Creative Commons Attribution 4.0 License.
 | 14 Jun 2024
Unveiling amplified isolation in climate networks due to global warming
Yifan Cheng
Panjie Qiao
Meiyi Hou
Yuan Chen
Wenqi Liu
Yongwen Zhang
Our study utilizes a global reanalysis of near-surface daily air temperature data spanning the years from 1949 to 2019 to construct climate networks. By employing community detection for each year, we reveal the evolving community structure of the climate network within the context of global warming. Our findings indicate significant changes in measures such as network modularity and the number of communities over the past 30 years. Notably, the community structure of the climate network has undergone a discernible transition since the early 1980s. We attribute this transition to the substantial increase in isolated nodes since the 1980s, primarily concentrated in equatorial ocean regions. Additionally, we demonstrate that nodes experiencing amplified isolation tend to diminish connectivity with other nodes globally, particularly those within the same oceanic basin, while showing a significant strengthening of connections with the Eurasian and North African continents. We deduce that the mechanism driving amplified isolation in the climate network may be comprehended through the weakening of tropical circulations, such as the Hadley cell and Walker circulation, in response to increasing greenhouse gases.
- Article
(3034 KB) - Full-text XML
-
Supplement
(3448 KB) - BibTeX
- EndNote


Since the 20th century, with the continuous increase in greenhouse gas emissions, the global climate system has been undergoing warming (IPCC, 2023; Christopher et al., 2012; Hallegatte et al., 2011; Hunt and Watkiss, 2011). Global warming has led to a significant increase in various extreme weather events, such as extreme heat waves, cold spells, heavy precipitation, droughts, and severe hurricanes. (Doney et al., 2009; Mondal and Mishra, 2021; Konapala et al., 2020; Mukherjee and Mishra, 2020). In addition, it has a serious impact on global air quality, food production, energy consumption, transportation, water resources, economies, and ecosystems. (Thomas et al., 2004; Salehyan and Hendrix, 2014; Nordhaus, 2017; Burke et al., 2015). Global warming has triggered significant transformations in atmospheric circulation and ocean circulation patterns, impacting the dynamics of the Earth's climate system (Shepherd, 2014; Vecchi and Soden, 2007). The rise in global temperatures is a key driver of alterations in atmospheric circulation patterns, especially in the tropical belt, influencing phenomena like the Hadley cell, Walker circulation, and Madden–Julian oscillation (Lu et al., 2007; Tokinaga et al., 2012; Hu et al., 2021; Chang et al., 2015). The expansion of the tropics and changes in the distribution of sea surface temperatures have contributed to shifts in the intensity and frequency of tropical cyclones and the behavior of the El Niño–Southern Oscillation (ENSO) (Emanuel, 2005; Kossin et al., 2020; Cai et al., 2021). These modifications in tropical circulations have widespread implications for precipitation patterns, extreme weather events, and regional climate variability. Additionally, the Atlantic Meridional Overturning Circulation (AMOC) may undergo a transition, with its potential collapse having severe impacts on the climate in the North Atlantic and regions of Europe (Rahmstorf et al., 2015; Boers, 2021). Previous studies have argued that the global climate experienced a shift in the 1970s (Graham, 1994; Tsonis et al., 2007; Swanson and Tsonis, 2009). Understanding these systematic changes is imperative for predicting future climate scenarios (e.g., those concerning precipitation, temperature, and wind) and formulating effective adaptation and mitigation strategies.
Faced with these systematic climatic changes, the adoption of complex network analysis has become increasingly essential in the realm of climate science. The climate system is intricately complex and marked by multivariable and multiscale nonlinear dynamics. Unveiling the internal structure of the climate system necessitates the application of sound research methods. Complex network analysis emerges as a potent tool for investigating the nonlinear dynamics and structural characteristics of complex systems (Newman, 2018; Zou et al., 2019). Over the past several years, complex network methodologies have gained widespread application in the realm of climate science. In the climate network, nodes represent geographical locations where time series data for temperature (or other climate variables) are accessible. Links are established through bivariate similarity measures, such as correlation, mutual information, or event synchronization between these time series (Tsonis and Roebber, 2004; Donges et al., 2009; Quiroga et al., 2002). Climate network techniques have proven effective in enhancing our understanding of various climate and weather phenomena, including ENSO, teleconnection patterns of weather, and atmospheric pollution (Tsonis and Swanson, 2008; Yamasaki et al., 2008; Fan et al., 2017; Kittel et al., 2021; Zhou et al., 2015; Boers et al., 2019; Di Capua et al., 2020; Zhang et al., 2019). Notably, complex network analysis has unveiled the weakening of tropical circulation in response to global warming (Geng et al., 2021; Fan et al., 2018). Furthermore, these techniques have demonstrated their utility in forecasting climate events (Boers et al., 2014; Ludescher et al., 2014, 2021; Meng et al., 2018).
Complex systems naturally partition into multiple modules or communities, which is a significant feature of complex networks (Palla et al., 2005). In the context of climate networks, each community serves as a representation of a climate subsystem, shedding light on the interrelationships between different components (Tsonis et al., 2011). Community detection algorithms, rooted in modularity maximization (Newman, 2006; Cherifi et al., 2019), have been pivotal in unveiling structures within climate networks. These algorithms have successfully identified community structures in diverse contexts, including rainfall networks (Agarwal et al., 2018), interaction networks of sea surface temperature observations (Tantet and Dijkstra, 2014), global climate responses to ENSO phases (Kittel et al., 2021), and the quantification of climate indices. Yet, scant attention has been given to the impact of global warming on the community structure of climate networks, particularly those of small sizes. This research endeavors to employ network analysis and community detection to investigate how global warming is reshaping the structure of the global temperature network. The ultimate goal is to deepen our understanding of climate change and inform strategies for addressing its impacts.
Therefore, based on the near-surface temperature structure of the climate network, this paper examines the impact of global warming on the climate network. Employing the Louvain community detection algorithm, it analyzes the evolution of network topology and reveals the underlying factors driving changes in the network structure. The main structure of this paper is as follows. Sections 2 and 3 introduce the data and methods, Sect. 4 shows the results of the evolution of climate network topology, and Sect. 5 summarizes the results.
This study utilizes daily air temperature reanalysis data from the National Centers for Environmental Prediction (NCEP) and the National Center for Atmospheric Research (NCAR) at a resolution of 2.5°×2.5°, spanning near-surface (sig995) temperatures from 1949 to 2019 (Kalnay et al., 1996). The dataset comprises 10 512 grid points globally. We select 726 nodes to construct the network and maintain the spatial density homogeneity within the climate network nodes in the sphere, as suggested in previous studies (Zhou et al., 2015; Guez et al., 2014). These nodes are strategically spaced to ensure uniform coverage of the Earth in Euclidean space, as depicted in Fig. S1a in the Supplement. The nodes are equally distributed, each approximately 850 km apart from its neighboring node, as illustrated in Fig. S1b.
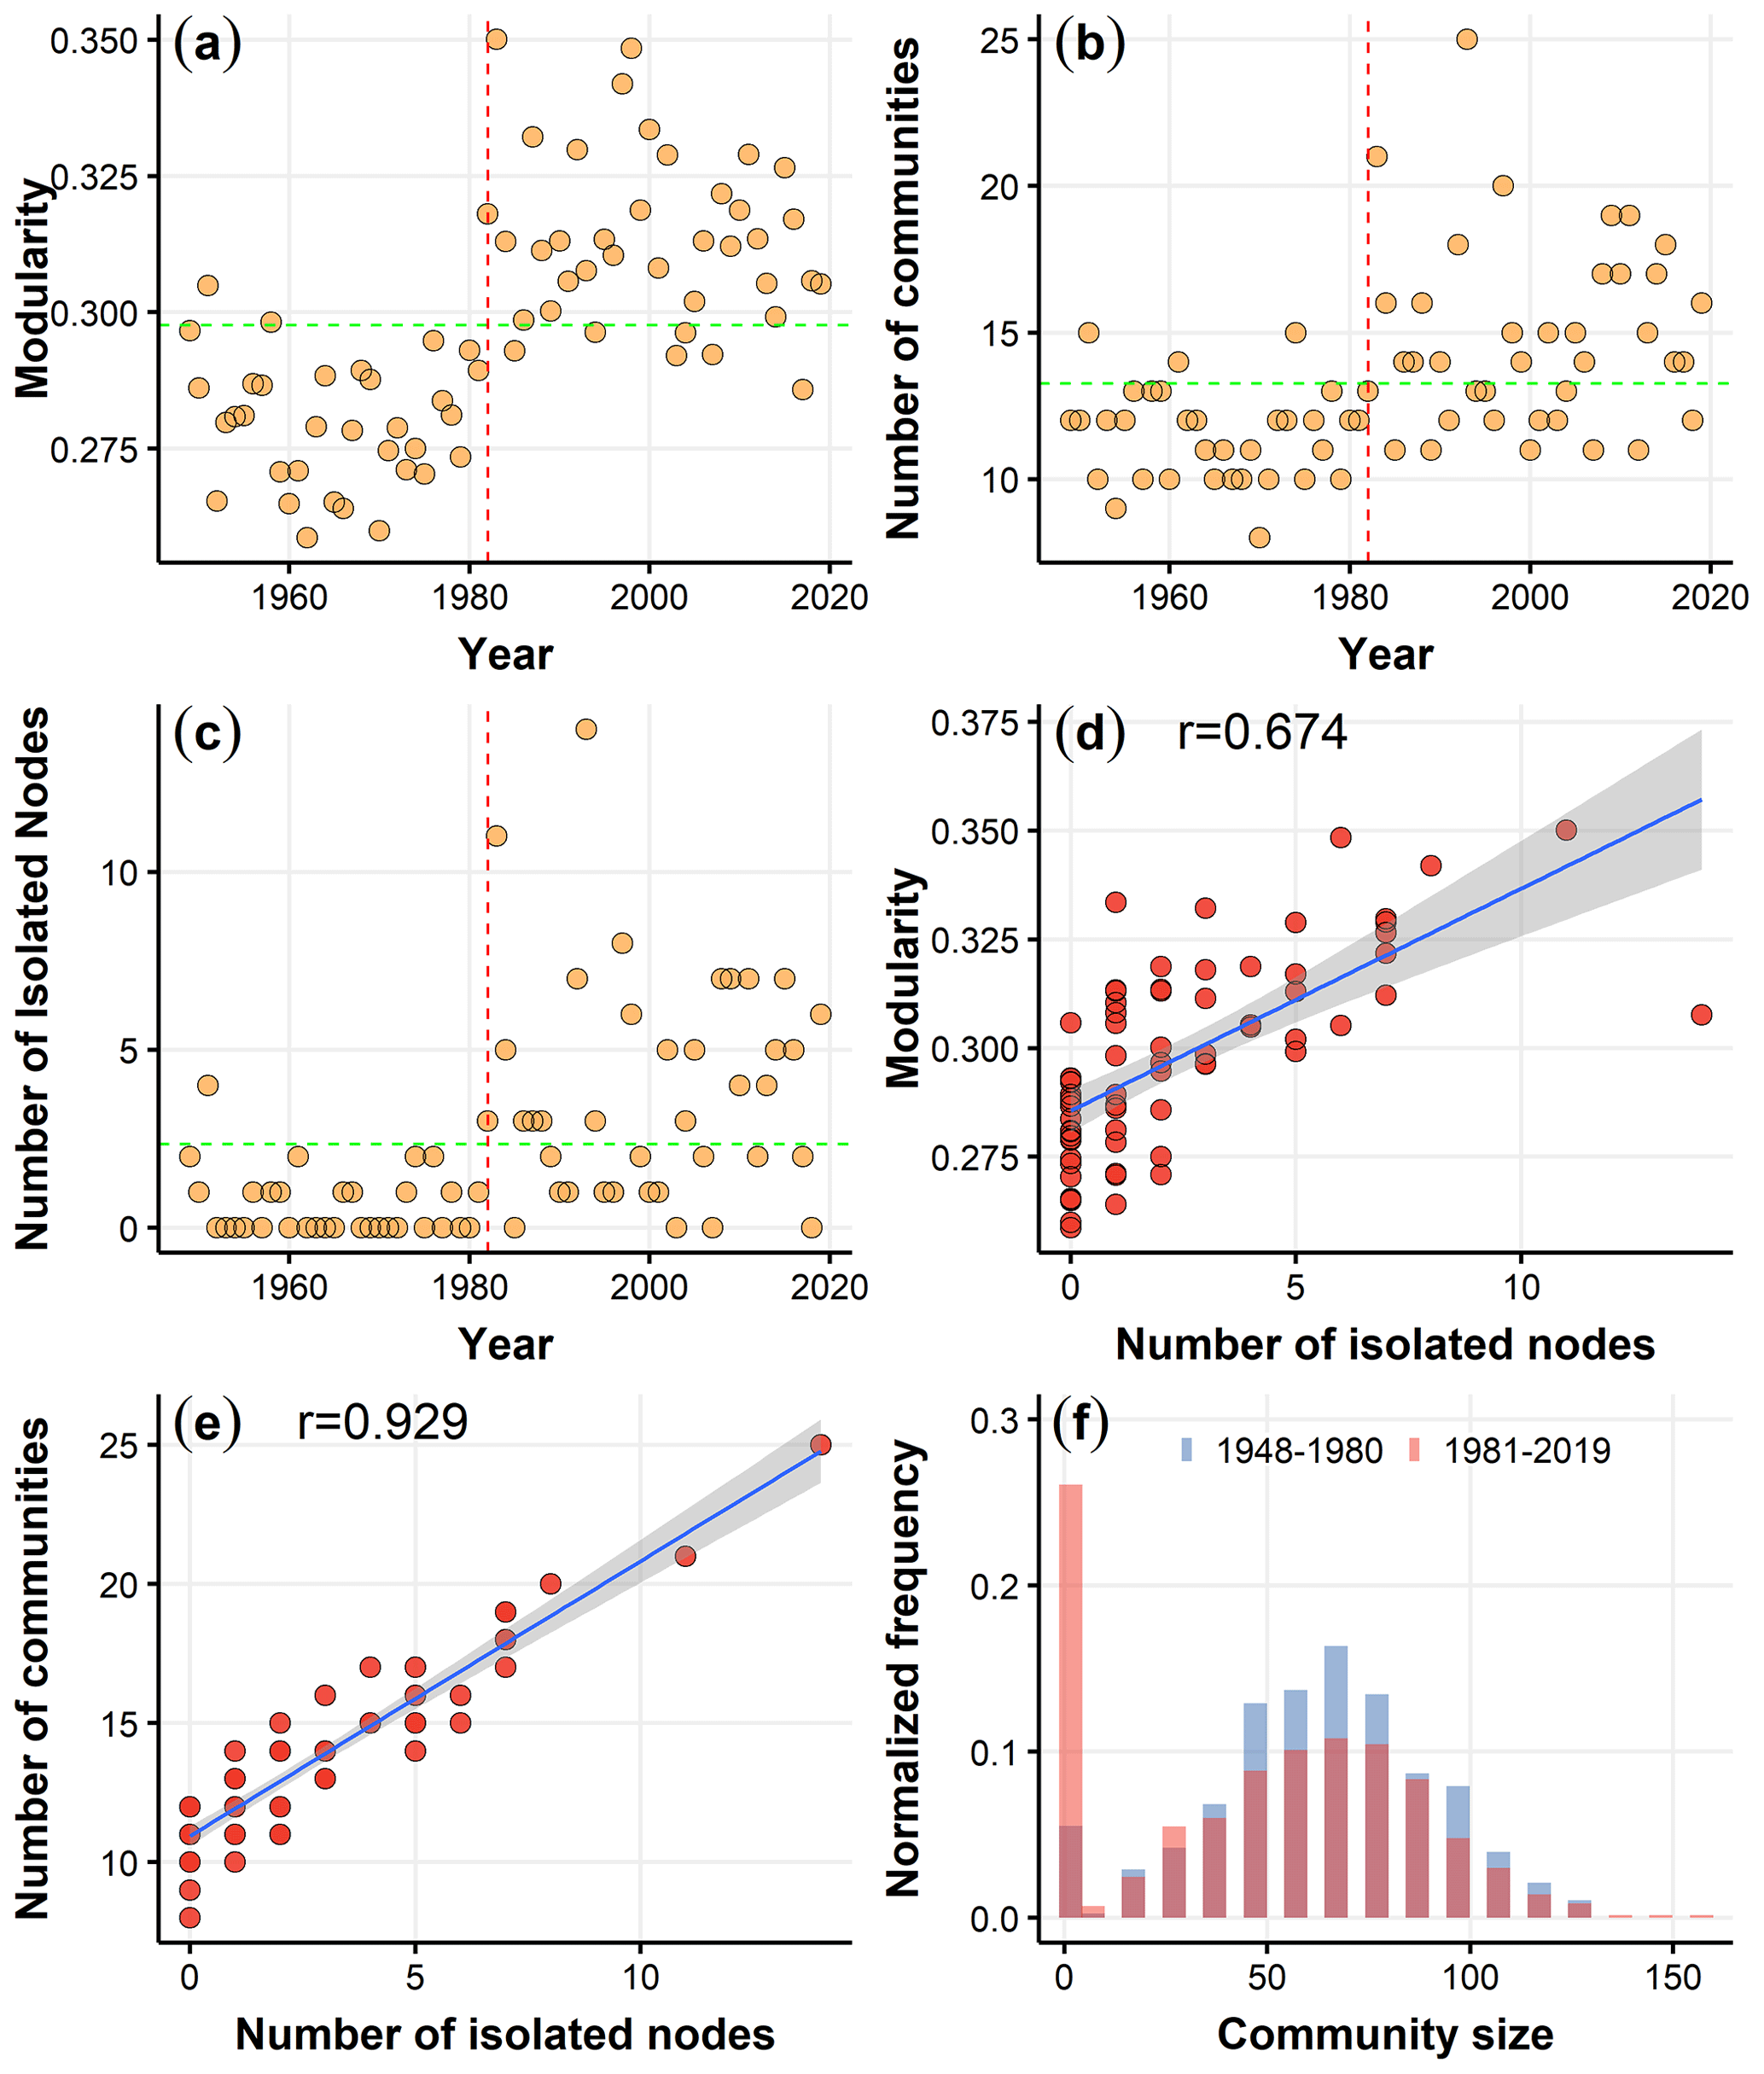
Figure 1Temporal evolution of (a) network modularity, (b) the number of communities, and (c) the number of isolated nodes from 1949 to 2019; the average level is indicated by the dashed green line, and the dashed red line represents the transition around 1982. Scatterplot illustrating (d) network modularity and (e) the number of communities versus the number of isolated nodes during the period 1949–2019. (f) Normalized frequencies of community size for the periods 1949–1981 and 1982–2019 (normalized by the total number of communities for each period), where the first bar represents the normalized frequency of the community with a node.
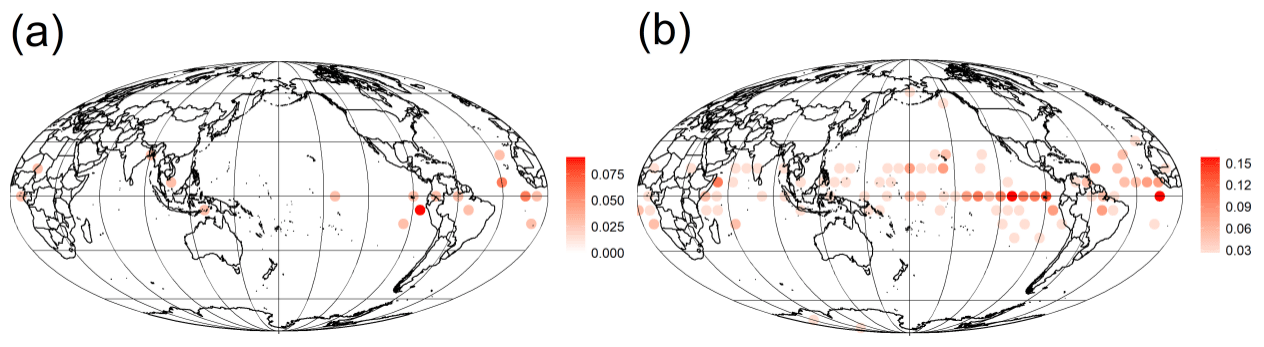
Figure 2Occurrence probability maps of isolated nodes for (a) 1949–1981 and (b) 1982–2019.
3.1 Constructing the climate network
Climate networks are constructed based on near-surface air temperature data for each year from 1949 to 2019, resulting in a total of 71 established climate networks. The time series of a node (denoted as i) undergoes deseasonalization by subtracting the average seasonal cycle and dividing the result by the standard deviation of the cycle, resulting in a temperature anomaly (denoted as , where y is the index of the year) (Fan et al., 2018). To obtain the link strength between each pair of nodes, i and j, we then calculate the time-lagged cross-correlation function (Fan et al., 2021), expressed as
where 〈〉 denotes the mean value, based on which represents time; and d denotes the time lag.
Therefore, the link strength between each pair of nodes in the network is denoted as follows:
In this context, “max”, “mean”, and “SD” denote the maximum value, mean, and standard deviation of the cross-correlation over all time lags from −200 to 200 d between nodes i and j. Strong autocorrelation can inflate the significance of cross-correlation. In contrast, the link strength, , is more effective in mitigating the effects of autocorrelation, offering a more reasonable reflection of the relationship between two nodes (Guez et al., 2014). This approach has proven valuable in predicting climate phenomena (Ludescher et al., 2021). To select meaningful links from the network and eliminate false associations, a threshold of θ=3.5, corresponding to a p value of 0.03 (Paluš and Novotná, 2011) and signifying that 97 % of the values in the shuffled data fall below this threshold (Fig. S2), is applied to obtain the adjacency matrix A (when , the element Aij=1; otherwise, the element Aij=0).
3.2 Community detection
Subsequently, the obtained sequence of climate networks underwent community detection using the Louvain community detection algorithm. The key steps of this method involve traversing each node in the network and attempting to relocate it to a neighboring node in a different community to optimize the modularity Q. If moving a node to another community increases modularity, the move is executed; otherwise, it remains unchanged. In other words, the process assesses whether the increment in modularity ΔQ resulting from the move is positive, and this procedure is repeated until no further node movements are possible. The formula for calculating modularity is expressed as follows (Blondel et al., 2008):
where and – these represent the number of links connected to the vertices (nodes) i and j. Moreover, ci represents the community to which node i belongs, δ(μv) = 1 if μ=v (otherwise δ(μv) = 0), and . Modularity has become a metric for assessing the quality of community divisions, with high modularity indicating strong internal connections within a community and weaker connections with other communities.
In order to investigate the evolution of the network's topology in the context of global warming, we construct a network for each year from 1949 to 2019 and apply community detection to the network. In Fig. 1a, we show that network modularity for the earlier years (1949–1981) is largely below the average level, while in the more recent years (1982–2019), network modularity remains consistently above the average level. There is a significant transition in modularity around 1982. Figure S3 illustrates the modularity values obtained by four distinct algorithms, as outlined in Kittel et al. (2021). The results highlight the robustness of the modularity transition around 1982 across different algorithms. Notably, the Louvain algorithm produces the highest modularity values, indicating its superior effectiveness in identifying community structures. Both the number of communities and modularity exhibit similar evolutionary patterns, as shown in Fig. 1b. Although the trend in the change in the number of communities is not as pronounced as the trend in network modularity, it is still evident that the number of communities was mostly below the average level in the first 33 years, while in the latter 38 years, most community numbers are above the average level (as shown in Fig. 1b). Figure 1c also shows the escalating count of isolated nodes since 1982. An isolated node is identified using a Louvain algorithm with a community size of 1, equivalent to a degree of zero (ki=0). The observed systematic change in community structure since the early 1980s may be linked to the reported climate shift, as indicated in previous studies (Graham, 1994; Tsonis et al., 2007; Swanson and Tsonis, 2009), in which both reanalysis data and climate simulations are used. The substantial increase in greenhouse gas emissions has contributed to a shift in the mean climate state since the 1980s in the tropical belt (Cai et al., 2021). This shift is further evident in the altered properties of El Niño since the early 1980s (Gan et al., 2023).
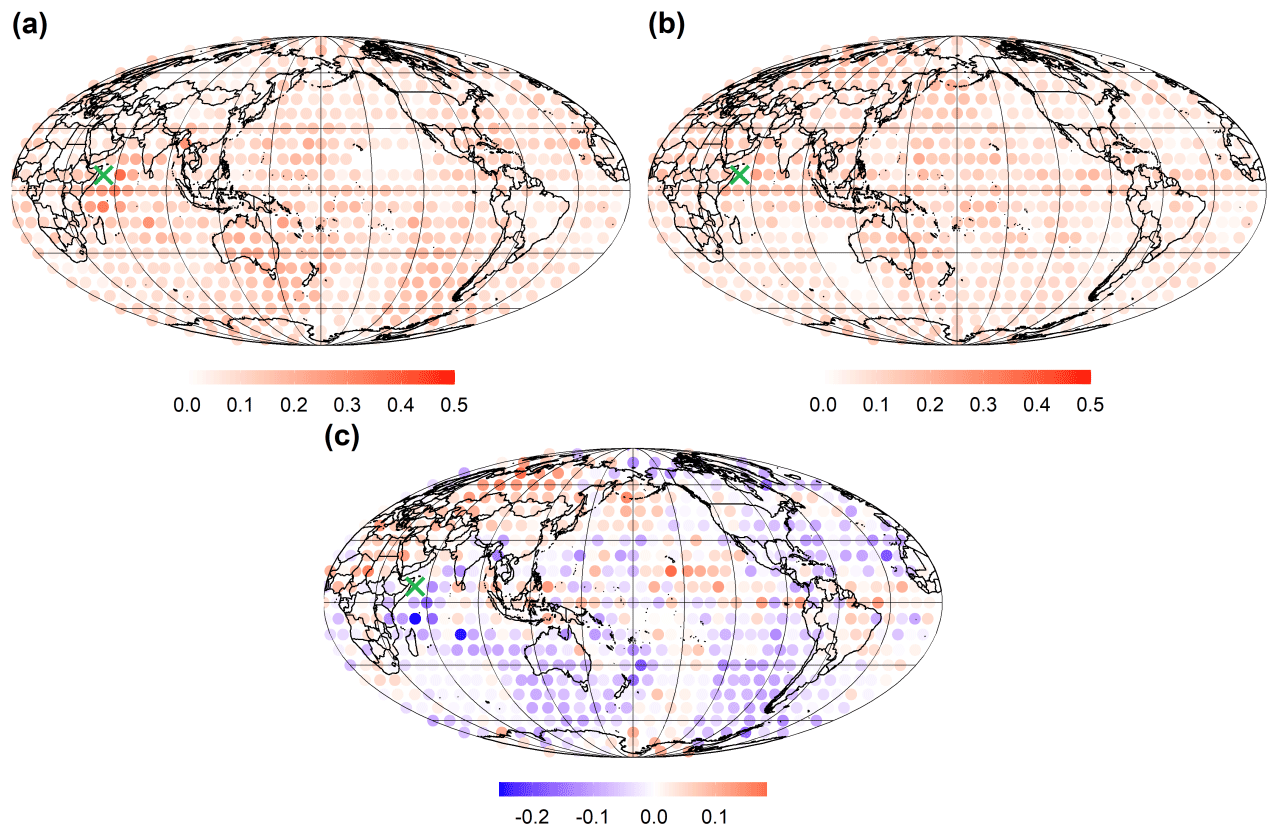
Figure 3Probability maps of the Indian Ocean node and other global nodes belonging to the same community illustrating (a) the period 1949–1981, the period (b) 1982–2019, and (c) the difference in probability between 1982–2019 and 1949–1981. The green cross symbol represents the selected Indian Ocean node.
Since 1982, the number of communities has been on the rise. This trend appears to be closely linked to the increasing count of isolated nodes. We observe the relationship between modularity and the number of isolated nodes and find a strong positive correlation, with a correlation coefficient of 0.674 (as shown in Fig. 1d). This strong correlation with network modularity indicates that the trend in the number of isolated nodes is consistent with changes in the network's topological structure. Furthermore, looking at Fig. 1e, we observe that the correlation between the number of isolated nodes and the number of communities reaches 0.929. This strong correlation with the number of communities suggests that the overall increase in the number of communities is driven by the increase in isolated nodes. To further strengthen the verification of whether the changes in the number of communities and network modularity since 1982 are related to the number of isolated nodes, we examine the normalized frequency of community sizes for the periods 1949–1981 and 1982–2019 (as shown in Fig. 1f). There are two peaks for the isolated node and the community with a size of around 60 for both 1949–1981 and 1982–2019. From 1949–1981, the proportion of isolated nodes in the overall community was not prominent. However, from 1982–2019, the proportion of isolated nodes dramatically increased and became the largest component in the community distribution. Therefore, the transition in modularity and the number of communities since 1982 can be attributed to the substantial increase in the number of isolated nodes.
Next, we will further study the relationship between changes in climate network structure and isolated nodes. The occurrence probability maps of isolated nodes for 1949–1981 and 1982–2019 are shown in Fig. 2. From 1949 to 1981, a few isolated nodes are distributed in the equatorial east Pacific and equatorial Atlantic oceans, with a low occurrence probability. However, from 1982 to 2019, the isolated nodes with higher occurrence probabilities appear almost everywhere in the equatorial regions, leading to an increase in the total number of communities. The occurrence probability of isolated nodes in the last 38 years is higher than the first 33 years and also covers a larger area than in the first 33 years. Thus, isolated nodes in the equatorial region have been systematically increasing since the early 1980s, resulting in changes to the climate network structure. To establish robustness, we conduct the analysis using different community detection algorithms, a maximum time lag of 365 d, shuffled nodes, and a 6-month shift for the time window. The obtained results are consistent, as illustrated in Figs. S3–S12.
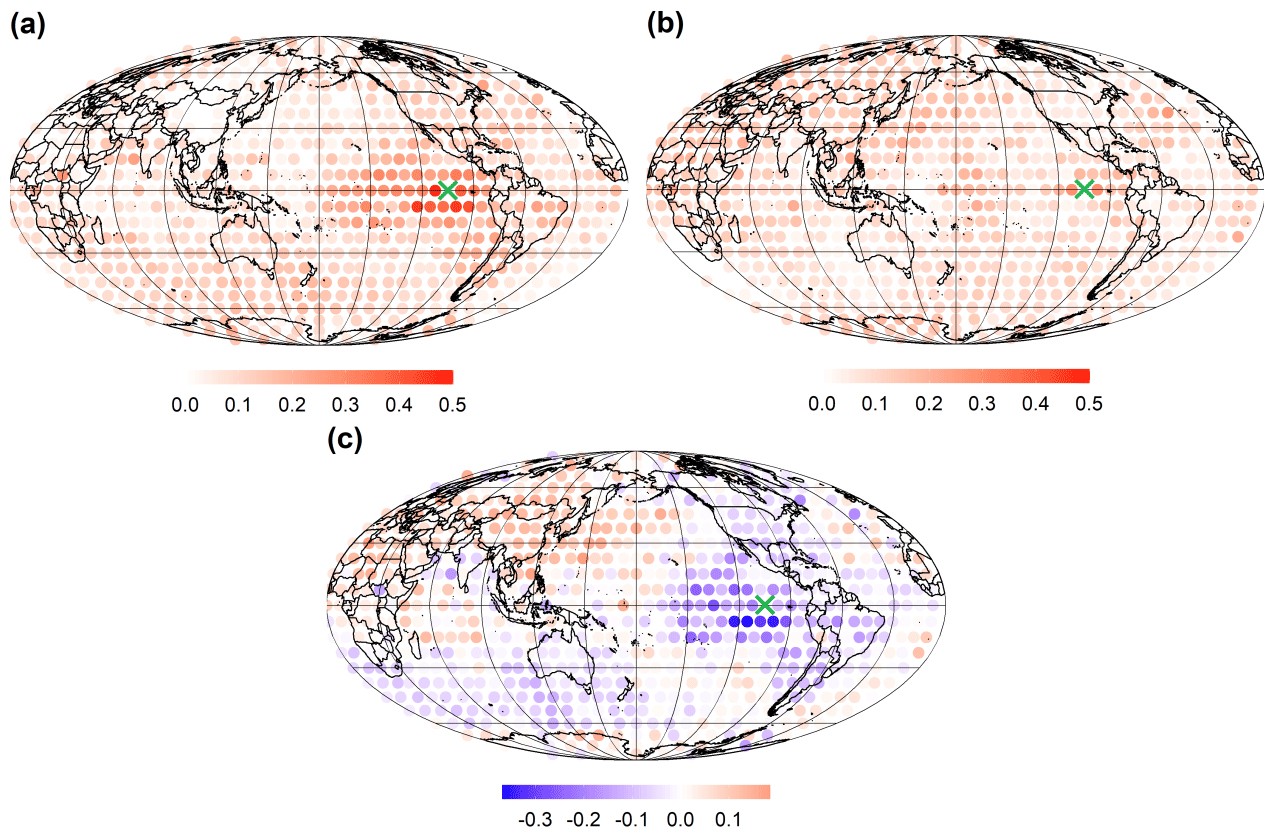
Figure 4Probability maps of the eastern Pacific Ocean node and other global nodes belonging to the same community illustrating (a) the period 1949–1981, (b) the period 1982–2019, and (c) the difference in probability between 1982–2019 and 1949–1981. The green cross symbol represents the selected eastern Pacific Ocean node.
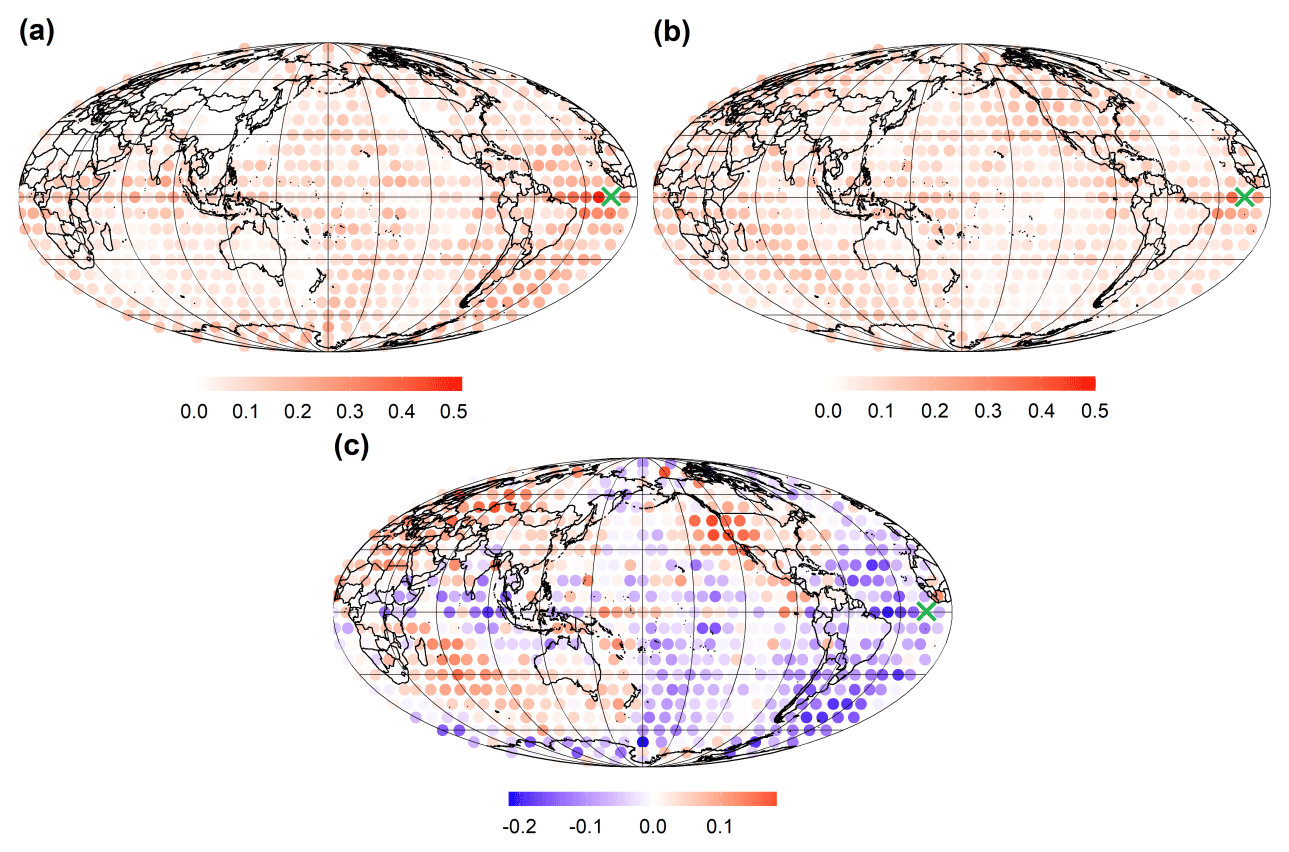
Figure 5Probability maps of the Atlantic Ocean node and other global nodes belonging to the same community illustrating (a) the period 1949–1981, (b) the period 1982–2019, and (c) the difference in the probability between 1982–2019 and 1949–1981. The green cross symbol represents the selected Atlantic Ocean node.
To gain a deeper understanding and verify how the isolation in climate networks is amplified in the equatorial regions, we select three nodes with the highest frequency of isolation in three regions – the Indian Ocean, the Pacific Ocean, and the Atlantic Ocean. We study the relationships between the three nodes and other nodes across the climate network structure. Specifically, we calculate the probability of the selected node and each of the other 725 nodes belonging to the same community for the time periods 1949–1981 and 1982–2019 and compute the difference between the two time periods. This probability can reflect which important region responds to the amplified isolation of the selected node.
In Fig. 3a, for 1949–1981, the selected Indian Ocean node exhibits high probability along with surrounding nodes belonging to the same community. However, for the 1982–2019 period in Fig. 3b, this probability is weakened, particularly with regard to the oceanic regions. The difference in probability between 1982–2019 and 1949–1981 is shown in Fig. 3c. Blue (red) points in Fig. 3c represent the decreased (increased) probability over time. In general, most areas show decreased probability. However, some areas (i.e., the Eurasian and North African continents) show an increased probability of connecting to the selected Indian Ocean node.
Since the 1980s, the probabilities of the nodes in the Pacific and the equatorial Pacific region belonging to the same community are noticeably diminished (as shown in Fig. 4). Examining the probability map of the selected Atlantic Ocean node and other global nodes belonging to the same community (Fig. 5), a similar behavior is observed. The selected three high-frequency isolated nodes are surrounded by relatively strong-connectivity regions during the first 33 years. However, these regions experience varying degrees of weakening in connectivity during the subsequent 38 years. It is worth noting that since the 1980s, the connectivity of high-frequency isolated nodes in the Indian Ocean, Atlantic Ocean, and Pacific Ocean with global oceanic regions has been diminishing, especially with regard to the strength of their connections with their respective oceanic regions, which has been significantly decreasing. However, the association with the Eurasian and North African continents is strengthening. Previous studies have suggested tropical circulations, such as the Hadley cell and Walker circulation, are weakening in response to increasing greenhouse gases (Lu et al., 2007; Tokinaga et al., 2012; Cai et al., 2021). This weakening may contribute to the amplified isolation of nodes in tropical oceans. Additionally, the weakened tropical circulation could potentially trigger extreme climate phenomena, such as the intensification of El Niño, with more pronounced teleconnection impacts on distant regions (Fan et al., 2017; Hu et al., 2021). This could, in turn, strengthen the linkage between equatorial regions and continents in climate networks.
In this investigation, we constructed a climate network using near-surface air temperature data spanning the years from 1949 to 2019. Our aim was to examine the evolution of climate network topology within the context of global warming. To explore how global warming affects the structure of the global climate network, we applied the Louvain community detection algorithm.
Notably, we observed that network modularity between 1949 and 1981 remained below the overall average, whereas between 1982 and 2019, it exceeded the overall average. Concurrently, the trend in the number of communities from 1949 to 2019 followed a similar pattern to that of modularity. Furthermore, the correlation coefficient between modularity and the number of isolated nodes was found to be 0.674, and the correlation between the number of isolated nodes and the number of communities reached 0.929 – both of these demonstrated statistical significance. Furthermore, we noted a substantial increase in the number of isolated nodes since 1982. Hence, the shift in modularity and the number of communities since 1982 is significantly associated with the notable surge in the number of isolated nodes. This systematic shift in community structure since the early 1980s could be related to the climate shift and the change in mean state associated with the altered properties of El Niño since the early 1980s (Graham, 1994; Tsonis et al., 2007; Swanson and Tsonis, 2009; Cai et al., 2021; Gan et al., 2023).
Between 1949 and 1981, isolated nodes were sporadic, dispersed, and mainly concentrated in the equatorial Pacific and equatorial Atlantic regions. However, from 1982 to 2019, isolated nodes were pervasive across the entire equatorial oceanic region. We further examined the relationship between the temperature network structure and isolated nodes in the context of global warming. By selecting key nodes with the highest frequency of isolation in the equatorial Pacific, equatorial Atlantic, and equatorial Indian Ocean regions, we investigated their likelihood of belonging to the same community as other nodes for the periods 1949–1981 and 1982–2019. Our findings suggested that the connectivity of highly isolated nodes along the Equator is decreasing, which is potentially associated with the weakening of tropical circulations, such as the Hadley cell and Walker circulation, in response to increasing greenhouse gases. This is particularly notable with regard to their associations with neighboring regions within the same oceanic basin. Simultaneously, their connections with certain continents have significantly strengthened.
Data that support the findings of this study are publicly available online; near-surface (sig995) daily air temperature reanalysis data from the NCEP/NCAR Reanalysis 1 project, provided by the National Oceanic and Atmosphere Administration Physical Sciences Laboratory (NOAA PSL), Boulder, Colorado, USA, can be accessed via the NOAA PSL website at https://psl.noaa.gov (Kalnay et al., 1996).
The supplement related to this article is available online at: https://doi.org/10.5194/esd-15-779-2024-supplement.
YiC: investigation, visualization, analysis, writing (original draft), reviewing, and editing. PQ: methodology, writing, reviewing, and editing. MH: methodology, writing, reviewing, and editing. YuC: methodology, writing, reviewing, and editing. WL: methodology, writing, reviewing, and editing. YZ: investigation, conceptualization, analysis, methodology, writing, reviewing, editing, and supervision.
The contact author has declared that none of the authors has any competing interests.
Publisher's note: Copernicus Publications remains neutral with regard to jurisdictional claims made in the text, published maps, institutional affiliations, or any other geographical representation in this paper. While Copernicus Publications makes every effort to include appropriate place names, the final responsibility lies with the authors.
We thank the National Natural Science Foundation of China (grant nos. 12305044 and 12371460) and the National Key Research and Development Program of China (grant no. 2023YFE0109000) for their financial support.
This research has been supported by the National Natural Science Foundation of China (grant nos. 12305044 and 12371460) and the National Key Research and Development Program of China (grant no. 2023YFE0109000).
This paper was edited by Ben Kravitz and reviewed by Reik Donner, Jingfang Fan, and one anonymous referee.
Agarwal, A., Marwan, N., Maheswaran, R., Merz, B., and Kurths, J.: Quantifying the roles of single stations within homogeneous regions using complex network analysis, J. Hydrol., 563, 802–810, https://doi.org/10.1016/j.jhydrol.2018.06.050, 2018.
Blondel, V. D., Guillaume, J. L., Lambiotte, R., and Lefebvre, E.: Fast unfolding of communities in large networks, J. Stat. Mech., 10, P10008, https://doi.org/10.1088/1742-5468/2008/10/P10008, 2008.
Boers, N.: Observation-based early-warning signals for a collapse of the Atlantic Meridional Overturning Circulation, Nat. Clim. Change, 11, 680–688, https://doi.org/10.1038/s41558-021-01097-4, 2021.
Boers, N., Bookhagen, B., Barbosa, H. M., Marwan, N., Kurths, J., and Marengo, J. A.: Prediction of extreme floods in the eastern Central Andes based on a complex networks approach, Nat. Commun., 5, 5199, https://doi.org/10.1038/ncomms6199, 2014.
Boers, N., Goswami, B., Rheinwalt, A., Bookhagen, B., Hoskins, B., and Kurths, J.: Complex networks reveal global pattern of extreme-rainfall teleconnections, Nature, 566, 373–377, https://doi.org/10.1038/s41586-018-0872-x, 2019.
Burke, M., Hsiang, S. M., and Miguel, E.: Global non-linear effect of temperature on economic production, Nature, 527, 235–239, https://doi.org/10.1038/nature15725, 2015.
Cai, W., Santoso, A., Collins, M., Dewitte, B., Karamperidou, C., Kug, J.-S., Lengaigne, M., McPhaden, M. J., Stuecker, M. F., Taschetto, A. S., Timmermann, A., Wu, L., Yeh, S.-W., Wang, G., Ng, B., Jia, F., Yang, Y., Ying, J., Zheng, X.-T., Bayr, T., Brown, J. R., Capotondi, A., Cobb, K. M., Gan, B., Geng, T., Ham, Y.-G., Jin, F.-F., Jo, H.-S., Li, X., Lin, X., McGregor, S., Park, J.-H., Stein, K., Yang, K., Zhang, L., and Zhong, W.: Changing El Niño–Southern Oscillation in a warming climate, Nat. Rev. Earth Environ., 2, 628–644, https://doi.org/10.1038/s43017-021-00199-z, 2021.
Cherifi, H., Palla, G., Szymanski, B. K., and Lu, X.: On community structure in complex networks: challenges and opportunities, Appl. Netw. Sci., 4, 117, https://doi.org/10.1007/s41109-019-0238-9, 2019.
Chang, C. W. J., Tseng, W. L., Hsu, H. H., Keenlyside, N., and Tsuang, B. J.: The Madden-Julian Oscillation in a warmer world, Geophys. Res. Lett., 42, 6034–6042, https://doi.org/10.1002/2015GL065095, 2015.
Christopher, B. F., Barros, V., Stocker, T. F., and Dahe, Q.: Managing the risks of extreme events and disasters to advance climate change adaptation: special report of the intergovernmental panel on climate change, CUP, Cambridge, UK, https://doi.org/10.1017/CBO9781139177245, 2012.
Di Capua, G., Kretschmer, M., Donner, R. V., van den Hurk, B., Vellore, R., Krishnan, R., and Coumou, D.: Tropical and mid-latitude teleconnections interacting with the Indian summer monsoon rainfall: a theory-guided causal effect network approach, Earth Syst. Dynam., 11, 17–34, https://doi.org/10.5194/esd-11-17-2020, 2020.
Doney, S. C., Fabry, V. J., Feely, R. A., and Kleypas, J. A.: Ocean Acidification: The other CO2 problem, Annu. Rev. Mar. Sci., 1, 169–192, https://doi.org/10.1146/annurev.marine.010908.163834, 2009.
Donges, J. F., Zou, Y., Marwan, N., and Kurths, J.: Complex networks in climate dynamics, Eur. Phys. J.-Spec. Top., 174, 157–179, https://doi.org/10.1140/epjst/e2009-01098-2, 2009.
Emanuel, K.: Increasing destructiveness of tropical cyclones over the past 30 years, Nature 436, 686–688, https://doi.org/10.1038/nature03906, 2005.
Fan, J., Meng, J., Ashkenazy, Y., Havlin, S., and Schellnhuber, H. J.: Network analysis reveals strongly localized impacts of El Niño, P. Natl. Acad. Sci. USA, 114, 7543–7548, https://doi.org/10.1073/pnas.1701214114, 2017.
Fan, J., Meng, J., Ashkenazy, Y., Havlin, S., and Schellnhuber, H. J.: Climate network percolation reveals the expansion and weakening of the tropical component under global warming, P. Natl. Acad. Sci. USA, 115, E12128–E12134, https://doi.org/10.1073/pnas.1811068115, 2018.
Fan, J., Meng, J., Ludescher, J., Li, Z., Surovyatkina, E., Chen, X., Kurths, J., and Schellnhuber, H. J.: Network-based approach and climate change benefits for forecasting the amount of Indian monsoon rainfalll, Am. Meteor. Soc., 35, 1009–1020, https://doi.org/10.1175/JCLI-D-21-0063.1, 2021.
Gan, R., Liu, Q., Huang, G., Hu, K., and Li, X.: Greenhouse warming and internal variability increase extreme and central Pacific El Niño frequency since 1980, Nat. Commun., 14, 394, https://doi.org/10.1038/s41467-023-36053-7, 2023.
Geng, Z., Zhang, Y., Lu, B., Fan, J., Zhao, Z., and Chen, X.: Network-Synchronization Analysis Reveals the Weakening Tropical Circulations, Geophys. Res. Lett., 48, e2021GL093582, https://doi.org/10.1029/2021GL093582, 2021.
Graham, N. E.: Decadal-scale climate variability in the tropical and North Pacific during the 1970s and 1980s: observations and model results, Clim. Dynam., 10, 135–162, https://doi.org/10.1007/BF00210626, 1994.
Guez, O. C., Gozolchiani, A., and Havlin, S.: Influence of autocorrelation on the topology of the climate network, Phys. Rev. E, 90, 062814, https://doi.org/10.1103/PhysRevE.90.062814, 2014.
Hallegatte, S., Przyluski, V., and Vogt-Schilb, A.: Building world narratives for climate change impact, adaptation and vulnerability analyses, Nat. Clim. Change, 1, 151–155, https://doi.org/10.1038/ nclimate1135, 2011.
Hu, K., Huang, G., Huang, P. et al.: Intensification of El Niño-induced atmospheric anomalies under greenhouse warming, Nat. Geosci., 14, 377–382, https://doi.org/10.1038/s41561-021-00730-3, 2021.
Hunt, A. and Watkiss, P.: Climate change impacts and adaptation in cities: a review of the literature, Clim. Change, 104, 13–49, https://doi.org/10.1007/s10584-010-9975-6, 2011.
Intergovernmental Panel on Climate Change (IPCC): Climate Change 2022-Impacts, Adaptation and Vulnerability: Working Group II Contribution to the Sixth Assessment Report of the Intergovernmental Panel on Climate Change, CUP, https://doi.org/10.1017/9781009325844, 2023.
Kalnay, E., Kanamitsu, M., Kistler, R., Collins, W., Deaven, D., Gandin, L., Iredell, M., Saha, S., White, G., Woollen, J., Zhu, Y., Chelliah, M., Ebisuzaki, W., Higgins, W., Janowiak, J., Mo, K. C., Ropelewski, C., Wang, J., Leetmaa, A., Reynolds, R., Jenne, R., and Joseph, D.: The Ncep/Ncar 40-Year reanalysis project, B. Am. Meteor. Soc.,, 77, 437–472, https://doi.org/10.4324/9781315793245, 1996 (data available at: https://psl.noaa.gov, last access: 13 June 2024).
Kittel, T., Ciemer, C., Lotfi, N., Peron, T., Rodrigues, F., Kurths, J., and Donner, R. V.: Evolving climate network perspectives on global surface air temperature effects of ENSO and strong volcanic eruptions, Eur. Phys. J.-Spec. Top., 230, 3075–3100, https://doi.org/10.1140/epjs/s11734-021-00269-9, 2021.
Konapala, G., Mishra, A. K., Wada, Y., and Mann, M. E.: Climate change will affect global water availability through compounding changes in seasonal precipitation and evaporation, Nat. Commun., 11, 3044, https://doi.org/10.1038/s41467-020-16757-w, 2020.
Kossin, J. P., Knapp, K. R., Olander, T. L., and Velden, C. S.: Global increase in major tropical cyclone exceedance probability over the past four decades, P. Natl. Acad. Sci. USA, 117, 11975–11980, https://doi.org/10.1073/pnas.1920849117, 2020.
Lu, J., Vecchi, G. A., and Reichler, T.: Expansion of the Hadley cell under global warming, Geophys. Res. Lett., 34, L06805, https://doi.org/10.1029/2006GL028443, 2007.
Ludescher, J., Gozolchiani, A., Bogachev, M. I., Bunde, A., Havlin, S., and Schellnhuber, H. J.: Very early warning of next El Niño, P. Natl. Acad. Sci. USA, 111, 2064–2066, https://doi.org/10.1073/pnas.1323058111, 2014.
Ludescher, J., Martin, M., Boers, N., Bunde, A., Ciemer, C., Fan, J., Havlin, S., Kretschmer, M., Kurths, J., Runge, J., Stolbova, V., Surovyatkina, E., and Schellnhuber, H. J.: Network-based forecasting of climate phenomena, P. Natl. Acad. Sci. USA, 118, e1922872118, https://doi.org/10.1073/pnas.1922872118, 2021.
Meng, J., Fan, J., Ashkenazy, Y., Bunde, A., and Havlin, S.: Forecasting the magnitude and onset of El Niño based on climate network, New J. Phys., 20, 043036, https://doi.org/10.1088/1367-2630/aabb25, 2018.
Mondal, S. and Mishra, A. K.: Complex networks reveal heatwave patterns and propagations over the USA, Geophys. Res. Lett., 48, e2020GL090411, https://doi.org/10.1029/2020GL090411, 2021.
Mukherjee, S. and Mishra, A. K.: Increase in compound drought and heatwaves in a Warming World, Geophys. Res. Lett., 48, e2020GL090617, https://doi.org/10.1029/2020GL090617, 2020.
Newman, M. E.: Modularity and community structure in networks, P. Natl. Acad. Sci. USA, 103, 8577–8582, https://doi.org/10.1073/pnas.0601602103, 2006.
Newman, M.: Networks, OUP, 2018.
Nordhaus, W. D.: Revisiting the social cost of carbon, P. Natl. Acad. Sci. USA, 114, 1518, https://doi.org/10.1073/pnas.1609244114, 2017.
Palla, G., Derényi, I., Farkas, I., and Vicsek, T.: Uncovering the overlapping community structure of complex networks in nature and society, Nature, 435, 814–818, https://doi.org/10.1038/nature03607, 2005.
Paluš, M. and Novotná, D.: Northern Hemisphere patterns of phase coherence between solar/geomagnetic activity and NCEP/NCAR and ERA40 near-surface air temperature in period 7–8 years oscillatory modes, Nonlin. Processes Geophys., 18, 251–260, https://doi.org/10.5194/npg-18-251-2011, 2011.
Quiroga, R. Q., Kreuz, T., and Grassberger, P.: Event synchronization: A simple and fast method to measure synchronicity and time delay patterns, Phys. Rev. E, 66, 041904, https://doi.org/10.1103/PhysRevE.66.041904, 2002.
Rahmstorf, S., Box, J. E., Feulner, G., Mann, M. E., Robinson, A., Rutherford, S., and Schaffernicht, E. J.: Exceptional twentieth-century slowdown in Atlantic Ocean overturning circulation, Nat. Clim. Change, 5, 475–480, https://doi.org/10.1038/nclimate2554, 2015.
Salehyan, I. and Hendrix, C. S.: Climate shocks and political violence, Global Environ. Chang., 28, 134–145, https://doi.org/10.1016/j.gloenvcha.2014.07.007, 2014.
Shepherd, T. G.: Atmospheric circulation as a source of uncertainty in climate change projections, Nat. Geosci., 7, 703–708, https://doi.org/10.1038/ngeo2253, 2014.
Swanson, K. L. and Tsonis, A. A.: Has the climate recently shifted?, Geophys. Res. Lett., 36, L06711, https://doi.org/10.1029/2008GL037022, 2009.
Tantet, A. and Dijkstra, H. A.: An interaction network perspective on the relation between patterns of sea surface temperature variability and global mean surface temperature, Earth Syst. Dynam., 5, 1–14, https://doi.org/10.5194/esd-5-1-2014, 2014.
Thomas, C. D., Cameron, A., Green, R. E., Bakkenes, M., Beaumont, L. J., and Collingham, Y. C., Erasmus, B. F. N., Ferreira de Siqueira, M., Grainger, A., Hannah, L., Hughes, L., Huntley, B., van Jaarsveld, A. S., Midgley, G. F., Miles, L., Ortega-Huerta, M. A., Peterson, A. T., Phillips, O. L., and Williams, S. E.: Extinction risk from climate change, Nature, 427, 145–148, https://doi.org/10.1038/nature02121, 2004.
Tokinaga, H., Xie, S. P., Deser, C., Kosaka, Y., and Okumura, Y. M.: Slowdown of the Walker circulation driven by tropical Indo-Pacific warming, Nature, 491, 439–443, https://doi.org/10.1038/nature11576, 2012.
Tsonis, A. A. and Roebber, P. J.: The architecture of the climate network, Physica A, 333, 497–504, https://doi.org/10.1016/j.physa.2003.10.045, 2004.
Tsonis, A. A. and Swanson, K. L.: Topology and Predictability of El Niño and La Niña Networks, Phys. Rev. Lett., 100, 228502, https://doi.org/10.1103/PhysRevLett.100.228502, 2008.
Tsonis, A. A., Swanson, K., and Kravtsov, S.: A new dynamical mechanism for major climate shifts, Geophys. Res. Lett., 34, L13705, https://doi.org/10.1029/2007GL030288, 2007.
Tsonis, A. A., Wang, G., Swanson, K. L., Rodrigues, F. A., and Costa, L. D. F.: Community structure and dynamics in climate networks, Clim. Dynam., 37, 933–940, https://doi.org/10.1007/s00382-010-0874-3, 2011.
Vecchi, G. A. and Soden, B. J.: Global warming and the weakening of the tropical circulation, J. Climate, 20, 4316–4340, https://doi.org/10.1175/JCLI4258.1, 2007.
Yamasaki, K., Gozolchiani, A., and Havlin, S.: Climate networks around the globe are significantly affected by El Niño, Phys. Rev. Lett., 100, 228501, https://doi.org/10.1103/PhysRevLett.100.228501, 2008.
Zhang, Y., Fan, J., Chen, X., Ashkenazy, Y., and Havlin, S.: Significant impact of Rossby waves on air pollution detected by network analysis, Geophys. Res. Lett., 46, 12476–12485, https://doi.org/10.1029/2019GL084649, 2019.
Zhou, D., Gozolchiani, A., Ashkenazy, Y., and Havlin, S.: Teleconnection paths via climate network direct link detection, Phys. Rev. Lett., 115, 268501, https://doi.org/10.1103/PhysRevLett.115.268501, 2015.
Zou, Y., Donner, R. V., Marwan, N., Donges, J. F., and Kurths, J.: Complex network approaches to nonlinear time series analysis, Phys. Rep., 787, 1–97, https://doi.org/10.1016/j.physrep.2018.10.005, 2019.