the Creative Commons Attribution 4.0 License.
the Creative Commons Attribution 4.0 License.
 | 11 Jun 2024
Intensified future heat extremes linked with increasing ecosystem water limitation
Jasper M. C. Denissen
Adriaan J. Teuling
Sujan Koirala
Markus Reichstein
Gianpaolo Balsamo
Martha M. Vogel
René Orth
Heat extremes have severe implications for human health, ecosystems, and the initiation of wildfires. While they are mostly introduced by atmospheric circulation patterns, the intensity of heat extremes is modulated by terrestrial evaporation associated with soil moisture availability. Thereby, ecosystems provide evaporative cooling through plant transpiration and soil evaporation, which can be reduced under water stress. While it has been shown that regional ecosystem water limitation is projected to increase in the future, the respective repercussions on heat extremes remain unclear.
In this study, we use projections from 12 Earth system models to show that projected changes in heat extremes are amplified by increasing ecosystem water limitation in regions across the globe. We represent the ecosystem water limitation with the ecosystem limitation index (ELI) and quantify temperature extremes through the differences between the warm-season mean and maximum temperatures. We identify hotspot regions in tropical South America and across Canada and northern Eurasia where relatively strong trends towards increased ecosystem water limitation jointly occur with amplifying heat extremes. This correlation is governed by the magnitude of the ELI trends and the present-day ELI which denotes the land–atmosphere coupling strength determining the temperature sensitivity to evaporative cooling. Many regions where ecosystem functioning is predominantly energy-limited or transitional in the present climate exhibit strong trends towards increasing the water limitation and simultaneously experience the largest increases in heat extremes. Sensitivity of temperature excess trends to ELI trends is highest in water-limited regions, such that in these regions relatively small ELI trends can amount to drastic temperature excess trends. Therefore, considering the ecosystem's water limitation is key for assessing the intensity of future heat extremes and their corresponding impacts.
- Article
(5962 KB) - Full-text XML
-
Supplement
(2722 KB) - BibTeX
- EndNote


Heat extremes affect ecosystems and society through their implications on human health, crop yields, and tree mortality, as well as the initiation of wildfires (Anderegg et al., 2013; Goulart et al., 2021; McDowell and Allen, 2015; O et al., 2020; Orth et al., 2022; Ruffault et al., 2020; Vogel et al., 2019). In the recent past, temperature extremes have increased in intensity, duration, and frequency; these changes are related to climate change (Seneviratne et al., 2021), and they have even accelerated in recent years in many regions (Seneviratne et al., 2014). In the future, heat extremes are projected to intensify further alongside the ongoing global warming (Seneviratne et al., 2021).
Hot temperatures can be fueled by dynamic and thermodynamic processes (Trenberth et al., 2015; Harrington et al., 2019). The relevance of atmospheric dynamics for recent heat waves has been highlighted for the case of large-scale blocking patterns which support heat accumulation across consecutive dry days (Cassou et al., 2005; Jézéquel et al., 2018), as well as the entrainment of warm air aloft (Miralles et al., 2014). Also, large-scale circulation patterns advecting warm air, or air from regions with dry soils, have been suggested to contribute to heat waves (Schumacher et al., 2019). Additionally, thermodynamic processes can amplify heat extremes; the land surface determines the partitioning of incoming radiative energy into sensible heating and latent heat (Seneviratne et al., 2010). Changes in this flux partitioning can be induced through soil moisture drying as water-stressed vegetation tends to reduce transpiration; in this way, a larger fraction of the incoming energy is available for sensible heating, which can lead to elevated temperatures (Budyko, 1974; Vogel et al., 2017; Denissen et al., 2021). As a consequence, circulation-induced rainfall deficits are translated by ecosystem water limitation to reduced evaporative cooling and amplified local temperatures (Miralles et al., 2012; Quesada et al., 2012; Teuling et al., 2010; Ukkola et al., 2018).
It has been shown that climate change may involve regional long-term trends in soil moisture and land–atmosphere coupling (Berg et al., 2017; Berg and Sheffield, 2018; Denissen et al., 2022; Seneviratne et al., 2021; Sippel et al., 2017) and that these can contribute to amplified heat extremes (Vogel et al., 2017; Lorenz et al., 2016; Seneviratne et al., 2006), especially in the case of the depletion of soil moisture preceding the warm season (Rasmijn et al., 2018; Stegehuis et al., 2021). In this study, we revisit and complement this previous research with novel indices and by analyzing output from the latest generation of Earth system models from the Coupled Model Intercomparison Project Phase 6 (CMIP6) (Eyring et al., 2016). In particular, we use (i) a recently introduced ecosystem water stress index, namely the ecosystem limitation index or ELI (Denissen et al., 2020). This is a correlative index that directly evaluates the importance of water versus energy stress for terrestrial evaporation, thereby moving beyond the nonlinear relationship between soil moisture and evaporative cooling alone. Furthermore, as this index directly captures evaporative cooling, it links more mechanistically with heat waves than general aridity or land–atmosphere coupling indices. Thereby, other factors affecting water limitation can be functionally addressed (e.g., groundwater, hydraulic failure as a lag effect, and CO2). Furthermore, the ELI can be used to pinpoint regime transitions, as positive values are indicative of water-limited conditions, while negative values denote ecosystem energy limitation. In addition, for analyzing heat extremes, we (ii) focus on the difference between warm-season mean and maximum temperatures, hereafter referred to as temperature excess. While temperature excess is known to be affected by land–atmosphere coupling (Vogel et al., 2017; Ukkola et al., 2018; Sippel et al., 2017; Lorenz et al., 2016; Dirmeyer et al., 2021; Donat et al., 2017; Seneviratne et al., 2006; Schwingshackl et al., 2018), the average temperature is largely driven by large-scale circulation (Cassou et al., 2005; Miralles et al., 2014; Schumacher et al., 2019). In this way, we assume that by focusing on the difference between mean and maximum temperatures, we can isolate the thermodynamic component from the dynamic component in heat wave development. As such, we jointly assess trends in ecosystem water limitation and heat extremes in fully coupled CMIP6 simulations from 12 state-of-the-art Earth system models at the monthly timescale and 2° × 2° spatial resolution from 1980–2100 (Eyring et al., 2016) in order to determine the thermodynamic contribution of the land surface for present and future heat extremes.
2.1 Ecosystem limitation index
The ecosystem limitation index (ELI), formerly referred to as the correlation difference metric (Denissen et al., 2020), is adapted as follows:
The prime denotes monthly anomalies of root zone soil moisture (SM), terrestrial evaporation (ET), air temperature (Ta), and incoming shortwave radiation (SWin). is a proxy for water limitation, whereas is a proxy for energy limitation. In this context, the | symbol indicates the use of either Ta or SWin anomalies in the second term on the right-hand side of Eq. (1), as ET in some regions is limited more strongly by the lack of incoming shortwave radiation (Nemani et al., 2003) and in other regions more strongly by cold temperatures. Therefore, we test for each grid cell which energy proxy yields the highest correlation with ET vs. and is hence the most relevant in this location in order to then use it in the computation of ELI in the respective grid cell (Fig. S1 in the Supplement). Between energy- and water-limited conditions, the ELI expresses different typical sensitivities to the energy and water supply. High and positive is indicative of energy-limited conditions, whereas high and positive indicates water-limited conditions. The ELI combines both the relevance of the energy and water supply for evaporative cooling by taking the difference between those two correlations so that positive values denote water-limited conditions and negative values indicate energy-limited conditions. Thereby, the ELI can be used to pinpoint transitional areas where regime shifts occur frequently, where ELI is approximately zero. Furthermore, in contrast to other traditional indices, such as the aridity index that rely on climatological means, the ELI can be used to study (parts of) the seasonal cycle. For a more extensive assessment of air temperature or incoming shortwave radiation and soil moisture as the choices for energy and water proxies, as well as a detailed elaboration on the interpretation of ELI, please refer to Denissen et al. (2022).
2.2 CMIP6 data
In this study, we use data from the Coupled Model Intercomparison Project (CMIP6) (Eyring et al., 2016), of which the most important information on the used data is summarized in Table 1. We only selected models that provide (i) historical (1980–2015) and “worst-case” SSP5-8.5 (2015–2100) (O'Neill et al., 2016) simulations, (ii) the necessary variables (Table 1), and (iii) sufficient spatial (2° × 2° or finer grid cell resolution) and temporal (monthly) resolutions. The maximum daily temperature denotes the maximum daily average temperature per month. By taking the SSP5-8.5 scenario, we intend to focus on the climate scenario most influenced by human activity and related emissions of greenhouse gases.
Table 1Overview of model details and model output used in this study. The following variables with abbreviated names that adhere to CMIP6 terminology have been downloaded from all the models at the monthly timescale: temperature (tas), the total water content per soil layer (mrsol), terrestrial evaporation (hfls), leaf area index (lai), maximum daily temperature (tasmax), and incoming and outgoing short- and longwave radiation (rsds, rsus, rlds, and rlus). Dynamic vegetation reflects whether or not plant functional traits (PFTs) can vary in time when responding to competition for resources. These resources could but do not necessarily include any combination of nitrogen, phosphorus, water, and energy. However, the resources considered in this context vary between models. As land use change forcing is identical for all models for the SSP5-8.5 scenario (O'Neill et al., 2016), this column only concerns historical simulations. For historical simulations, land use change forcing comes from the Land Use Harmonization (LUH) 2 v2h product (https://luh.umd.edu/data.shtml, last access: 4 June 2024) (Hurtt et al., 2011), unless otherwise specified. As land cover types might vary between models, land use change forcing effects might differ as well.
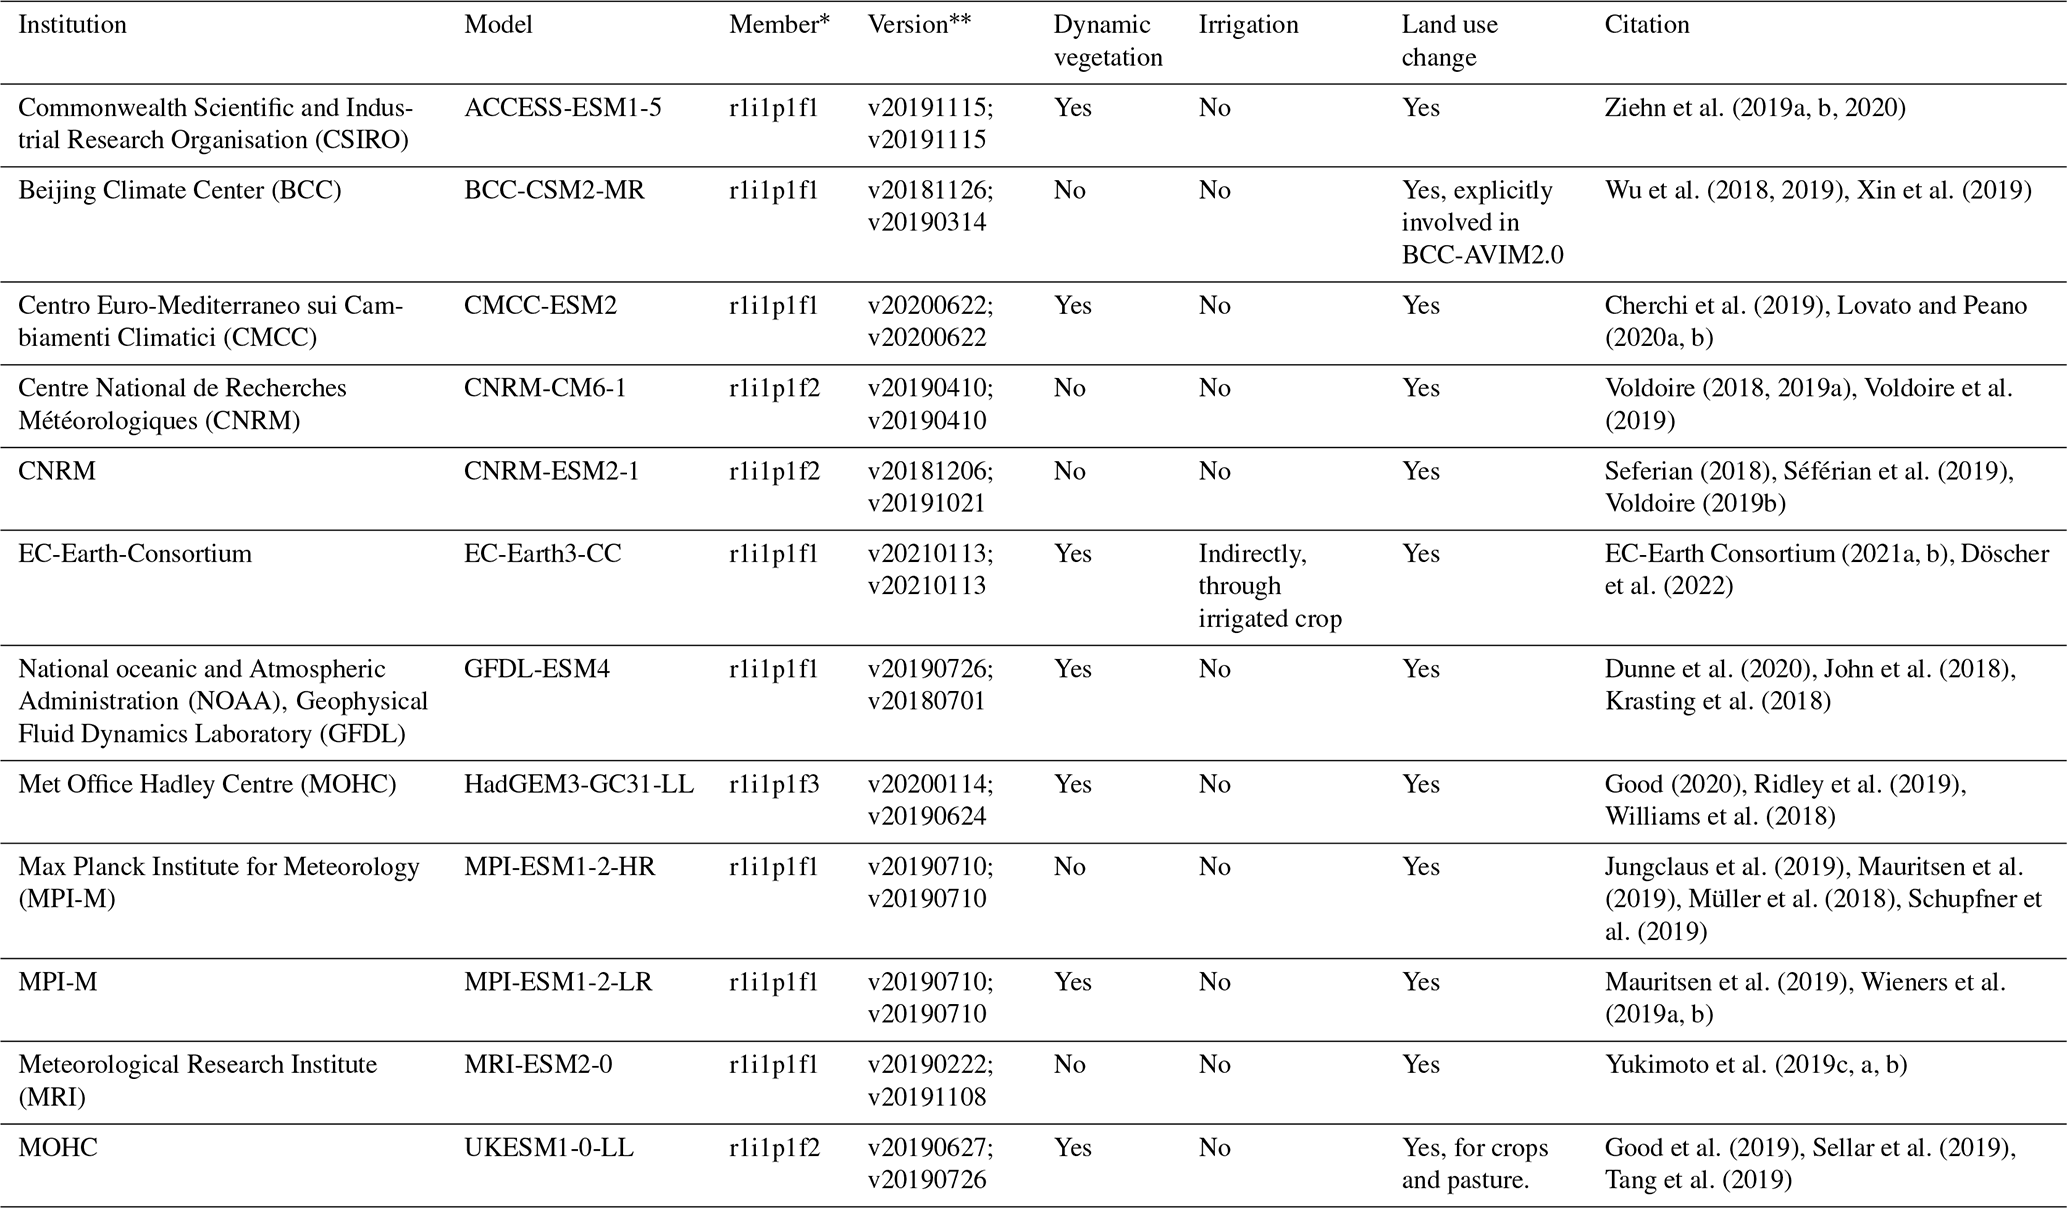
∗ In the CMIP6 members or variants, differences exist in the forcing index (f). This index number indicates the forcing used for the respective realization and can be used to distinguish between CMIP6-recommended or other forcing
datasets. Which forcing dataset the f index represents is defined per model. The first number denotes the version of the historical simulation, whereas the second number indicates the SSP5-8.5 simulation.
2.3 Pre-processing data
All data are regridded to a common 2° × 2° grid cell resolution using bilinear interpolation after applying a model-specific land–sea mask. After data acquisition, several steps are taken to assure a meaningful selection of data for the analysis. First, to pinpoint the hottest heat extremes, we focus on the 3 hottest months in a year (warm season), defined as the 3 months of year with the highest maximum daily temperature averaged decadally. The advantage of considering only the warm season lies in the comparison of concomitant trends of ELI, evaporative fraction (EF), and temperature excess, as these might be subject to seasonal variability. Second, to additionally assure that we are investigating the active vegetation periods during the warm season, which would elicit vegetation responses to anomalies in energy and water supply affecting the surface flux partitioning, all months with Ta < 10 °C and leaf area index (LAI) < 0.2 m2 m−2 are excluded from the analysis. Thereby, we disregard mainly grid cells in the most sparsely vegetated regions in northern Africa and western China and cold regions in the northern latitudes but retain major drylands including parts of the Sahel and the Australian interior (Fig. S2). This selection of data results in what we refer to in this work as the “warm vegetated land area”. Furthermore, root zone soil moisture is computed as a weighted average of the total water content per soil layer present in the top meter of soil. These data are then used to compute the decadal time series of the desired diagnostics, which are ELI, EF, and temperature excess. EF is computed as the fraction of the net surface radiation (the sum of all radiative components) that is used to evaporate water. Temperature excess is computed for each grid cell and decade as the difference between the means of (i) the 10 warm-season mean temperatures from the individual years and (ii) the 10 temperature maxima in the individual years. Next to this, we assess ecosystem water limitation with the ELI (Eq. 1) (Denissen et al., 2020).
2.4 ERA5-Land analysis
Reanalysis data, including the variables of 2 m temperature, soil moisture layers 1–3, latent heat flux, LAI for high and low vegetation, and downward solar radiation, from ERA5-Land from 1950–2020 were used to validate the CMIP6-based results (Muñoz Sabater, 2019; Muñoz-Sabater et al., 2021). All data have been aggregated to the monthly timescale and 2° × 2° spatial resolution. Maximum daily temperature was computed as the maximum average daily temperature per month. The root zone soil moisture encompasses the soil moisture in top meter of the soil and is computed as a weighted average of soil moisture layers 1 (0–7 cm), 2 (7–28 cm), and 3 (28–100 cm). The same methodology as applied to the CMIP6 data to compute temperature excess and ELI has been applied to the reanalysis data. Vegetated conditions were assumed when the LAI of either high or low vegetation > 0.2.
2.5 Computing Theil–Sen slopes and slope significance
The trends shown in Figs. 1, 2, and 6 and Figs. S3, S4, and S5 in the Supplement are based on Theil–Sen slopes (Sen, 1968; Theil, 1992). This approach is insensitive to statistical outliers, as the median slope from a range of slopes through all pairs of points is selected as the best fit. The significance of these slopes is determined based on Kendall's τ statistic from Mann–Kendall tests.
We identify increased temperature excess trends across over 75 % of the warm vegetated land area from 1980–2100 (Fig. 1a). Model confidence is higher for increasing than for decreasing temperature excess (inset plot Fig. 1a), as in almost half of the area with increasing temperature excess at least 8 out of 12 CMIP6 models agree, while this is much less for decreasing temperature excess (see also Fig. S3). This reveals high confidence in an accelerated increase in the heat extremes compared with warm-season mean temperatures.
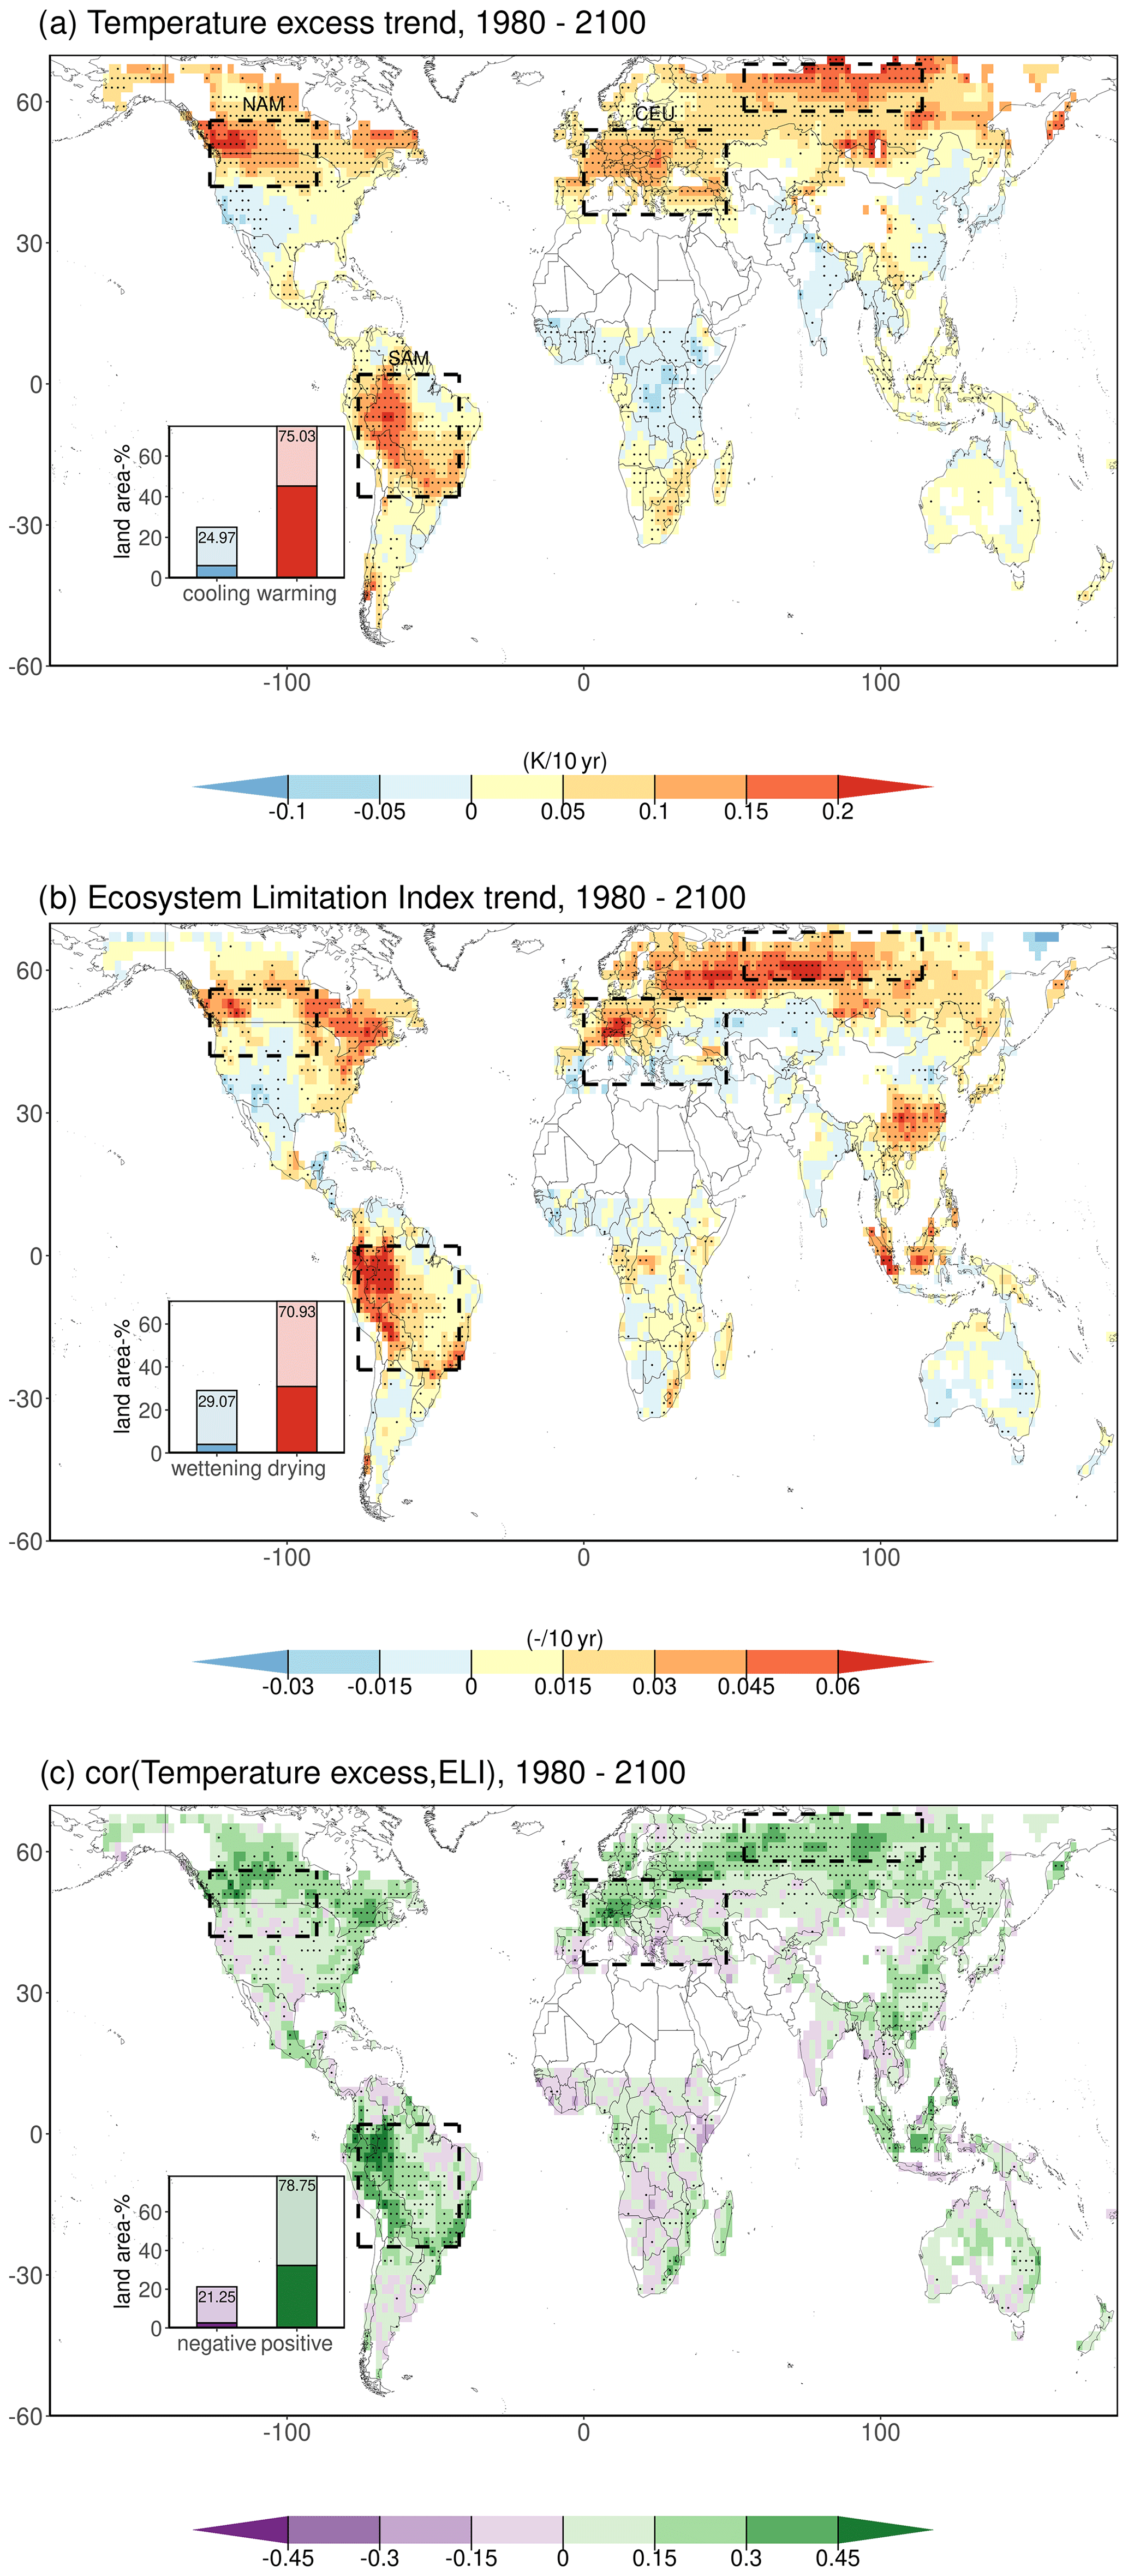
Figure 1Similarity of global patterns of change in temperature excess and ecosystem water limitation. Multi-model means of trends based on decadal time series per respective CMIP6 model of (a) temperature excess and (b) ecosystem limitation index (ELI). (c) Multi-model means of Kendall's rank correlation coefficient between model-specific time series of ELI and temperature excess. The insets display the fraction of the warm land area with positive or negative trends or correlations, respectively (at least 8 out of 12 models agreeing on the sign of the trend or correlation are hued darker). Stippling indicates that at least 8 out of 12 CMIP6 models agree on the sign of the trend or correlation. All trends and correlations are calculated over the warm season and are only displayed if at least 8 CMIP6 models have a full time series available, such that white areas denote regions with no or insufficient data. The dashed boxes indicate regions of interest, which are regions where temperature excess increases are particularly rapid and spatially coherent, namely North and South America (NAM and SAM), central Europe (CEU), and northern Asia (NAS).
There is a widespread increase in incoming shortwave radiation in about 71 % of the warm vegetated land area, with high inter-model agreement (Fig. S4) which can directly affect near-surface temperature through the surface energy balance. These trends could result from projected decreases in aerosol emissions (Nabat et al., 2014) or from changes in cloud cover. As daily maxima of incoming shortwave radiation roughly co-occur with daily temperature maxima, increased incoming shortwave radiation links more strongly to increased in maximum temperatures rather than mean temperatures (Qian et al., 2011), which are more strongly governed by the longwave radiation budget.
ELI increases in more than 71 % of the warm vegetated land area (Fig. 1b), signaling shifts towards water limitation. Generally, models particularly agree on the sign of the ELI increases (stippling in Fig. 1b), whereas more uncertainty exists with respect to the magnitude of ELI trends (Fig. S5). Furthermore, we note that in the mid- to high latitudes, ELI trends are generally temperature-controlled, whereas the tropics are more sensitive to incoming shortwave radiation (Fig. S1), thereby acknowledging and allowing that energy proxies can vary locally.
Spatial patterns of multi-model mean trends in temperature excess and ELI are very similar. Areas with the highest temperature excess trends (> 0.2 K per 10 years) are exclusively characterized by ELI increases. More importantly, also the temporal evolution of the decadal time series of temperature excess and ELI is similar in many regions. This is evidenced by significant correlations in many areas (Figs. 1c, S6), suggesting that increasing ELI contributes to hotter temperature extremes. As correlations cannot distinguish the direction of causality, we stress that hotter temperature extremes can in turn further dry out terrestrial vegetation, thereby increasing water limitation. Additionally, heat extremes and related hydraulic failure could lead to plant mortality (McDowell and Allen, 2015), limiting evaporative cooling even more. As such, these pathways further strengthen positive correlations between ELI and temperature excess. We also find regions with insignificant and even negative correlations, such as parts of the Sahel, Kazakhstan, the Balkans, North America, and Southern Africa. As plant transpiration scales with LAI, this limits the ability of the scarce vegetation present in such regions to provide sufficient evaporative cooling, possibly rendering correlations insignificant. Further deviations from a positive relationship between temperature excess and ELI might result from alternative processes such as (changes in) the advection of warm air masses through large-scale circulation patterns, while positive relationships could be exaggerated by changes in incoming shortwave radiation (Fig. S4).
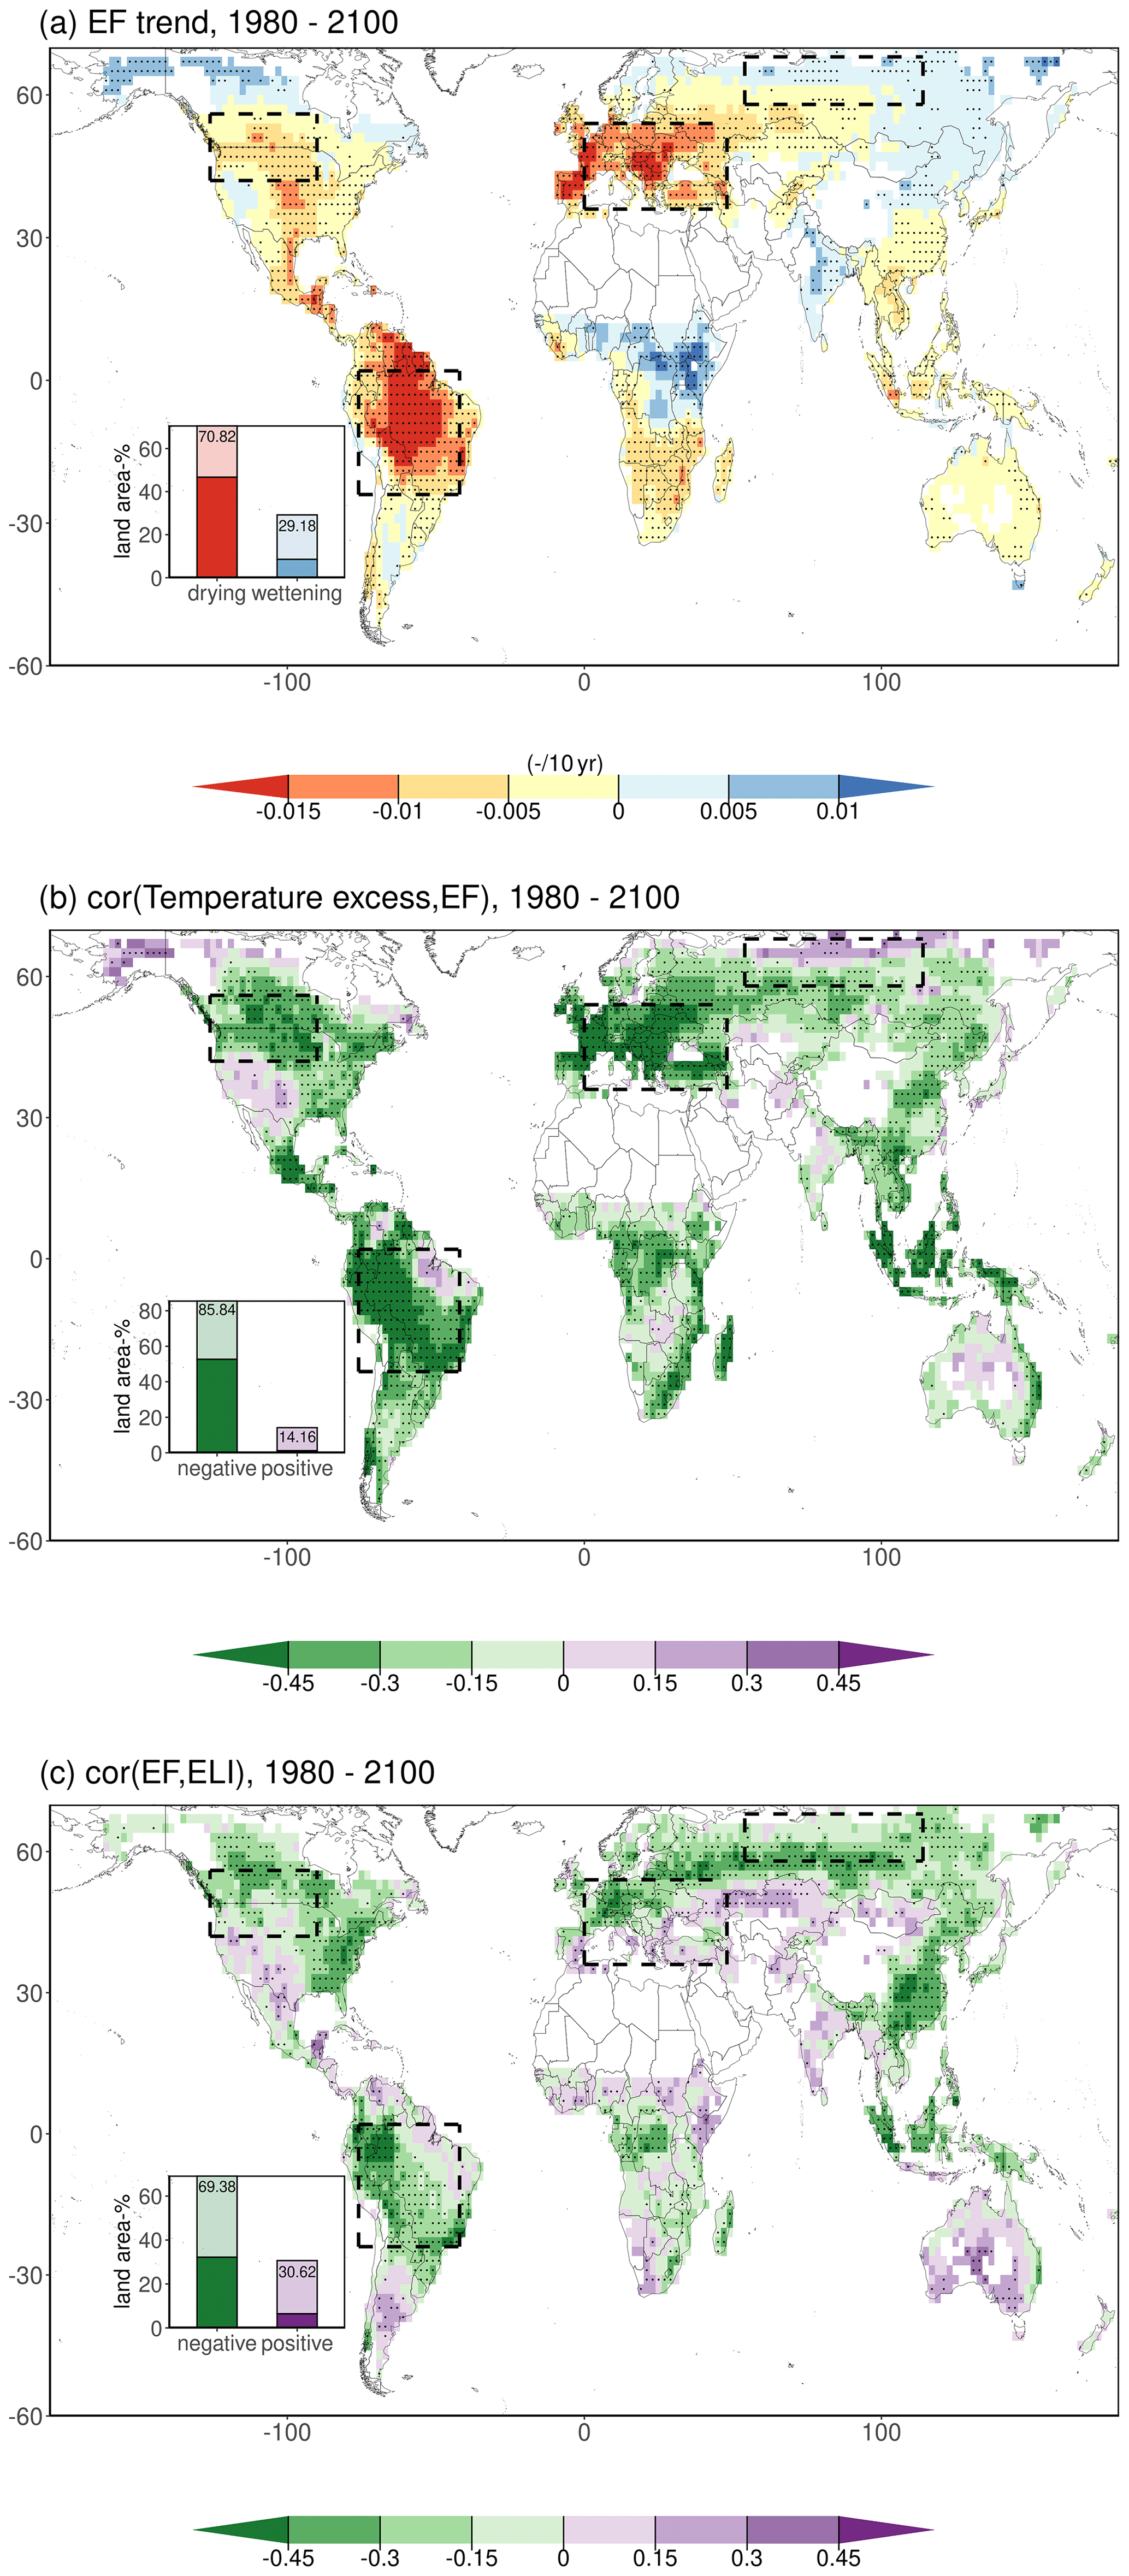
Figure 2Global multi-model mean distribution and trends of the evaporative fraction (EF). Multi-model mean of trends based on decadal time series per respective CMIP6 model of (a) EF and (b) ecosystem limitation index (ELI). (c) Multi-model mean of Kendall's rank correlation coefficient between the model-specific time series of ELI and temperature excess. The insets display the fraction of the warm land area with positive or negative trends or correlations, respectively (at least 8 out of 12 models agreeing on the sign of the trend or correlation are hued darker). Stippling indicates that at least 8 out of 12 CMIP6 models agree on the sign of the trend or correlation. All trends and correlations are calculated over the 3 hottest months of year, defined as the 3 months of year which have the highest average temperature over 1980–2100. The dashed boxes indicate regions of interest.
Furthermore, in order to illustrate the physical link between ELI and temperature excess, which presumably is through evaporative cooling, we analyze terrestrial evaporation normalized by net surface radiation. The resulting EF links the surface energy and water balances. The EF is decreasing in all regions of interest but northern Eurasia, with high agreement between individual models (Fig. 2a). Moreover, EF is generally significantly correlated with both temperature excess and ELI, respectively, suggesting the physical link between these quantities. In this way, in approximately 86 % of the warm vegetated land area, trends in the EF fraction are negatively correlated with temperature excess, meaning that a decreasing (increasing) trend in EF, renders more (less) energy available for sensible heating, which elevates (reduces) heat extremes (Fig. 2b). In about 69 % of the warm vegetated land area, the correlation between EF and ELI is negative (Fig. 2c), verifying that most shifts towards ecosystem water limitation jointly occur with the expected decreases in evaporative cooling. Some regions, such as central US, the Mediterranean, and northern Mongolia, exhibit insignificant or even positive correlations, possibly pointing to other processes such as irrigation and/or land use changes (Table 1).
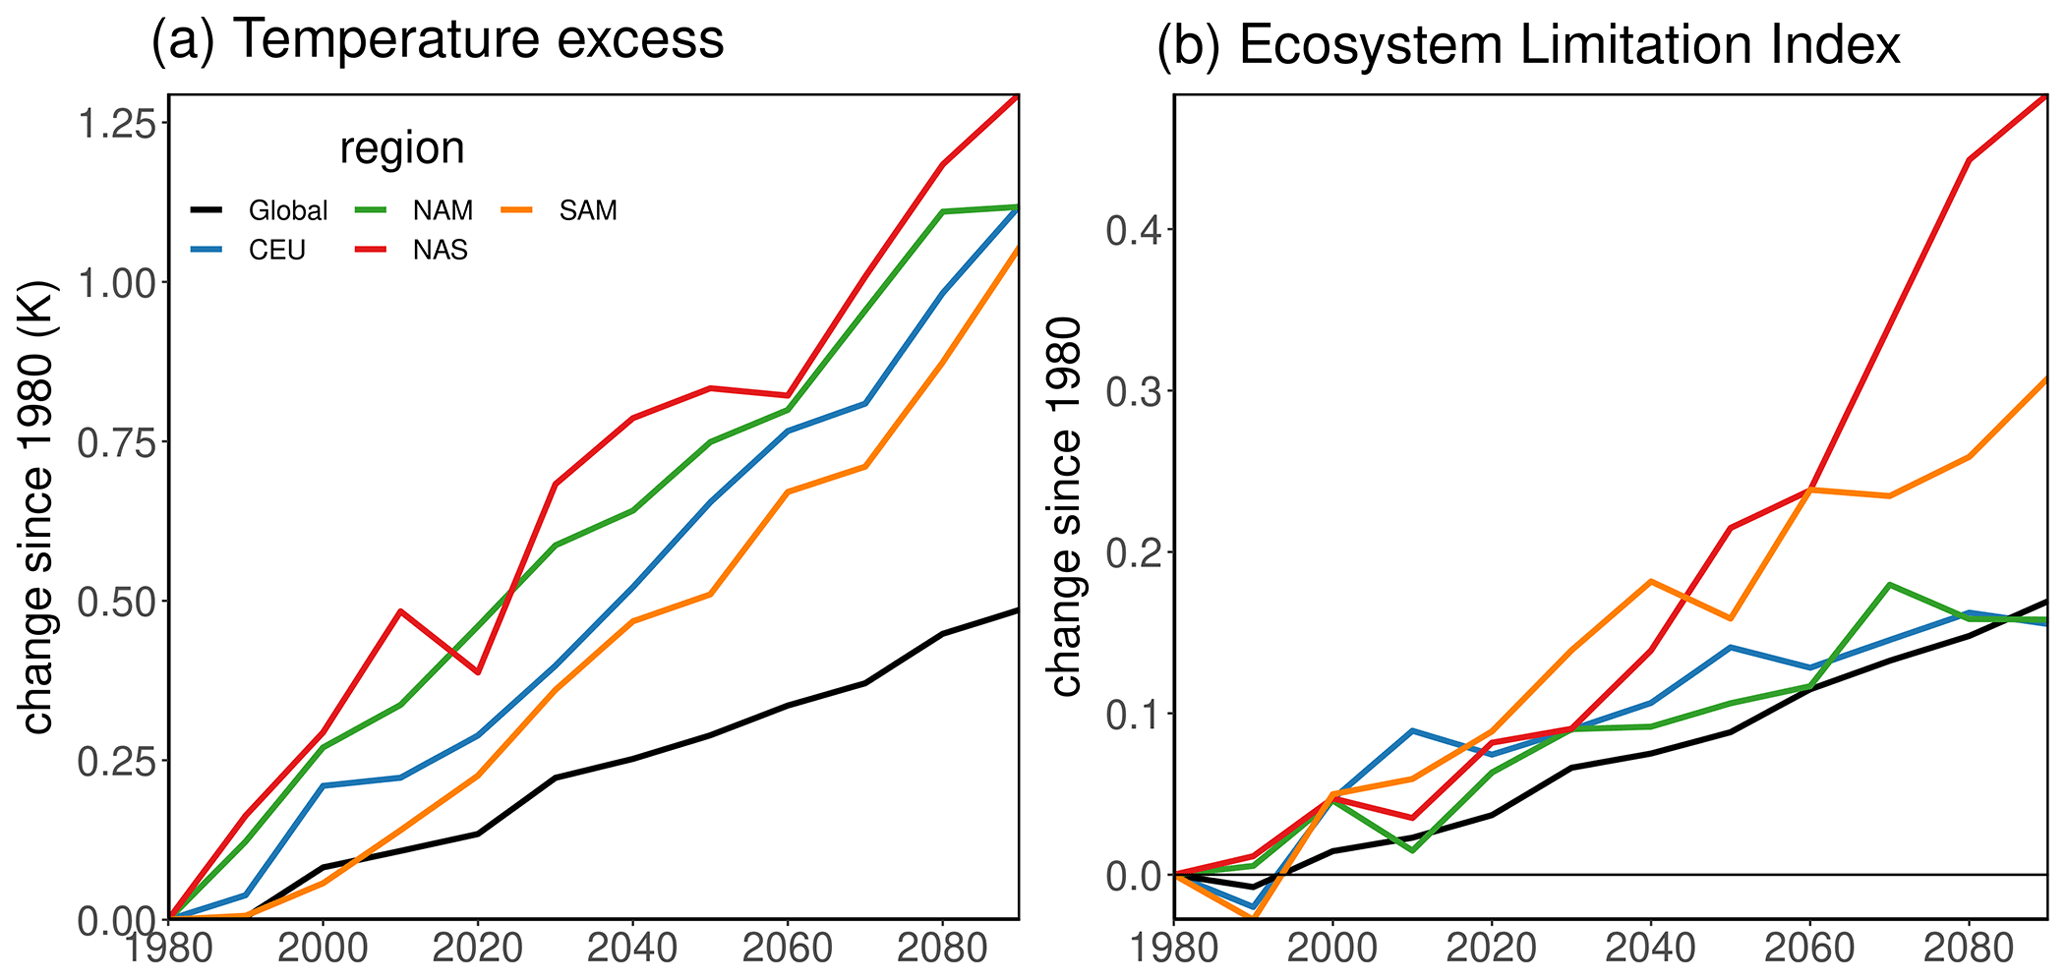
Figure 3Changes in global and regional temperature excess with increasing ecosystem water limitation. Temporal evolution of (a) temperature excess and of (b) ecosystem limitation index (ELI) globally and for the regions of interest. Solid lines depict multi-model mean time series. Global and regional averages are calculated over land grid cells that have complete time series for all models and variables and are weighted according to the surface area per grid cell.
Next, we compare the temporal evolution of temperature excess and ELI averaged across the regions of interest and the entire warm vegetated land area between historical and future time periods. Figure 3a shows a steady global increase in the temperature excess, with warm-season maximum temperature experiencing an additional 0.5 K warming with respect to the average warm-season temperature over 1980–2100. In all regions of interest, the temperature excess is increasing over twice as fast as the global average. Even though uncertainty in temperature excess exists between individual models (Figs. S3 and S7a), the majority of models agree both globally and regionally that temperature excess is significantly increasing.
ELI trends differ more strongly in magnitude across the regions of interest than the temperature excess trends (Fig. 3b). While underlying ELI trends from individual models generally tend to display positive ELI trends, there is a larger spread both in magnitude and in sign (Fig. S7b). This indicates different contributions of the ELI to the temperature excess trends between models (Fig. S6) and regions; while the ELI contribution is particularly strong in NAS and SAM, as can also be seen from the correlations in Fig. 1c, it is weaker but still considerable in CEU and NAM, where other processes probably play a role such as changes in large-scale circulation patterns or boundary layer dynamics. Furthermore, most significant trends in Fig. S7b are positive, underlining a higher confidence of the model ensemble to project increasing rather than decreasing ecosystem water limitation.
During 1980–2020, temperature excess computed from ERA5-Land data lies largely within the envelope of the individual CMIP6 models (Fig. 4a). As such, the temperature excess findings from individual CMIP6 models are not implausible. As the ERA5-Land dataset is supported by the comprehensive assimilation of available observations, the similarity of the CMIP6 model results in terms of temperature excess demonstrates a successful validation of the models considered here. This is further corroborated by surface air temperature extremes from CMIP5 and CMIP6 that compare well with observation-based datasets, although with model-specific performance that varies in space and time (Thorarinsdottir et al., 2020). At the same time, the CMIP6-based ELI is only partly corroborated by the ERA5-Land reanalysis data from 1980–2020 (Fig. 4b), as globally and in half the regions of interest the reanalysis-based ELI exceeds the CMIP6 envelope. In this historical time period and across most regions of interest, the CMIP6 trends for both temperature excess and ELI are generally more positive than negative, which corroborates a positive relationship between the two, as is also seen further into the future (Fig. 3). This relationship is weaker in the observation-based estimate from ERA5-Land, where temperature excess mostly stays within the multi-model envelope and only increases monotonically in SAM, while ELI exceeds the multi-model envelope and increases in all regions of interest except NAM. This indicates a different coupling between ELI and temperature excess in ERA5-Land than in the CMIP6 models, which should be further investigated in the future. Note that ERA5-Land is only indirectly supported by data assimilation, as meteorological forcing from ERA5 assimilates observations only for 2 m temperature, relative humidity, and surface soil moisture. Therefore, temperature excess benefits more directly from data assimilation than ELI, which is based on ET and (root zone) soil moisture which are not readily observed across the globe. In this way, ERA5-Land estimates of the global ELI evolution are subject to uncertainty, and while it provides an independent reference for comparing the CMIP6 model results, it is based on the land surface model dynamics underlying the ERA5-Land dataset. Moreover, differences could arise due to different land cover maps underlying respective simulations from ERA5-Land and the CMIP6 models.
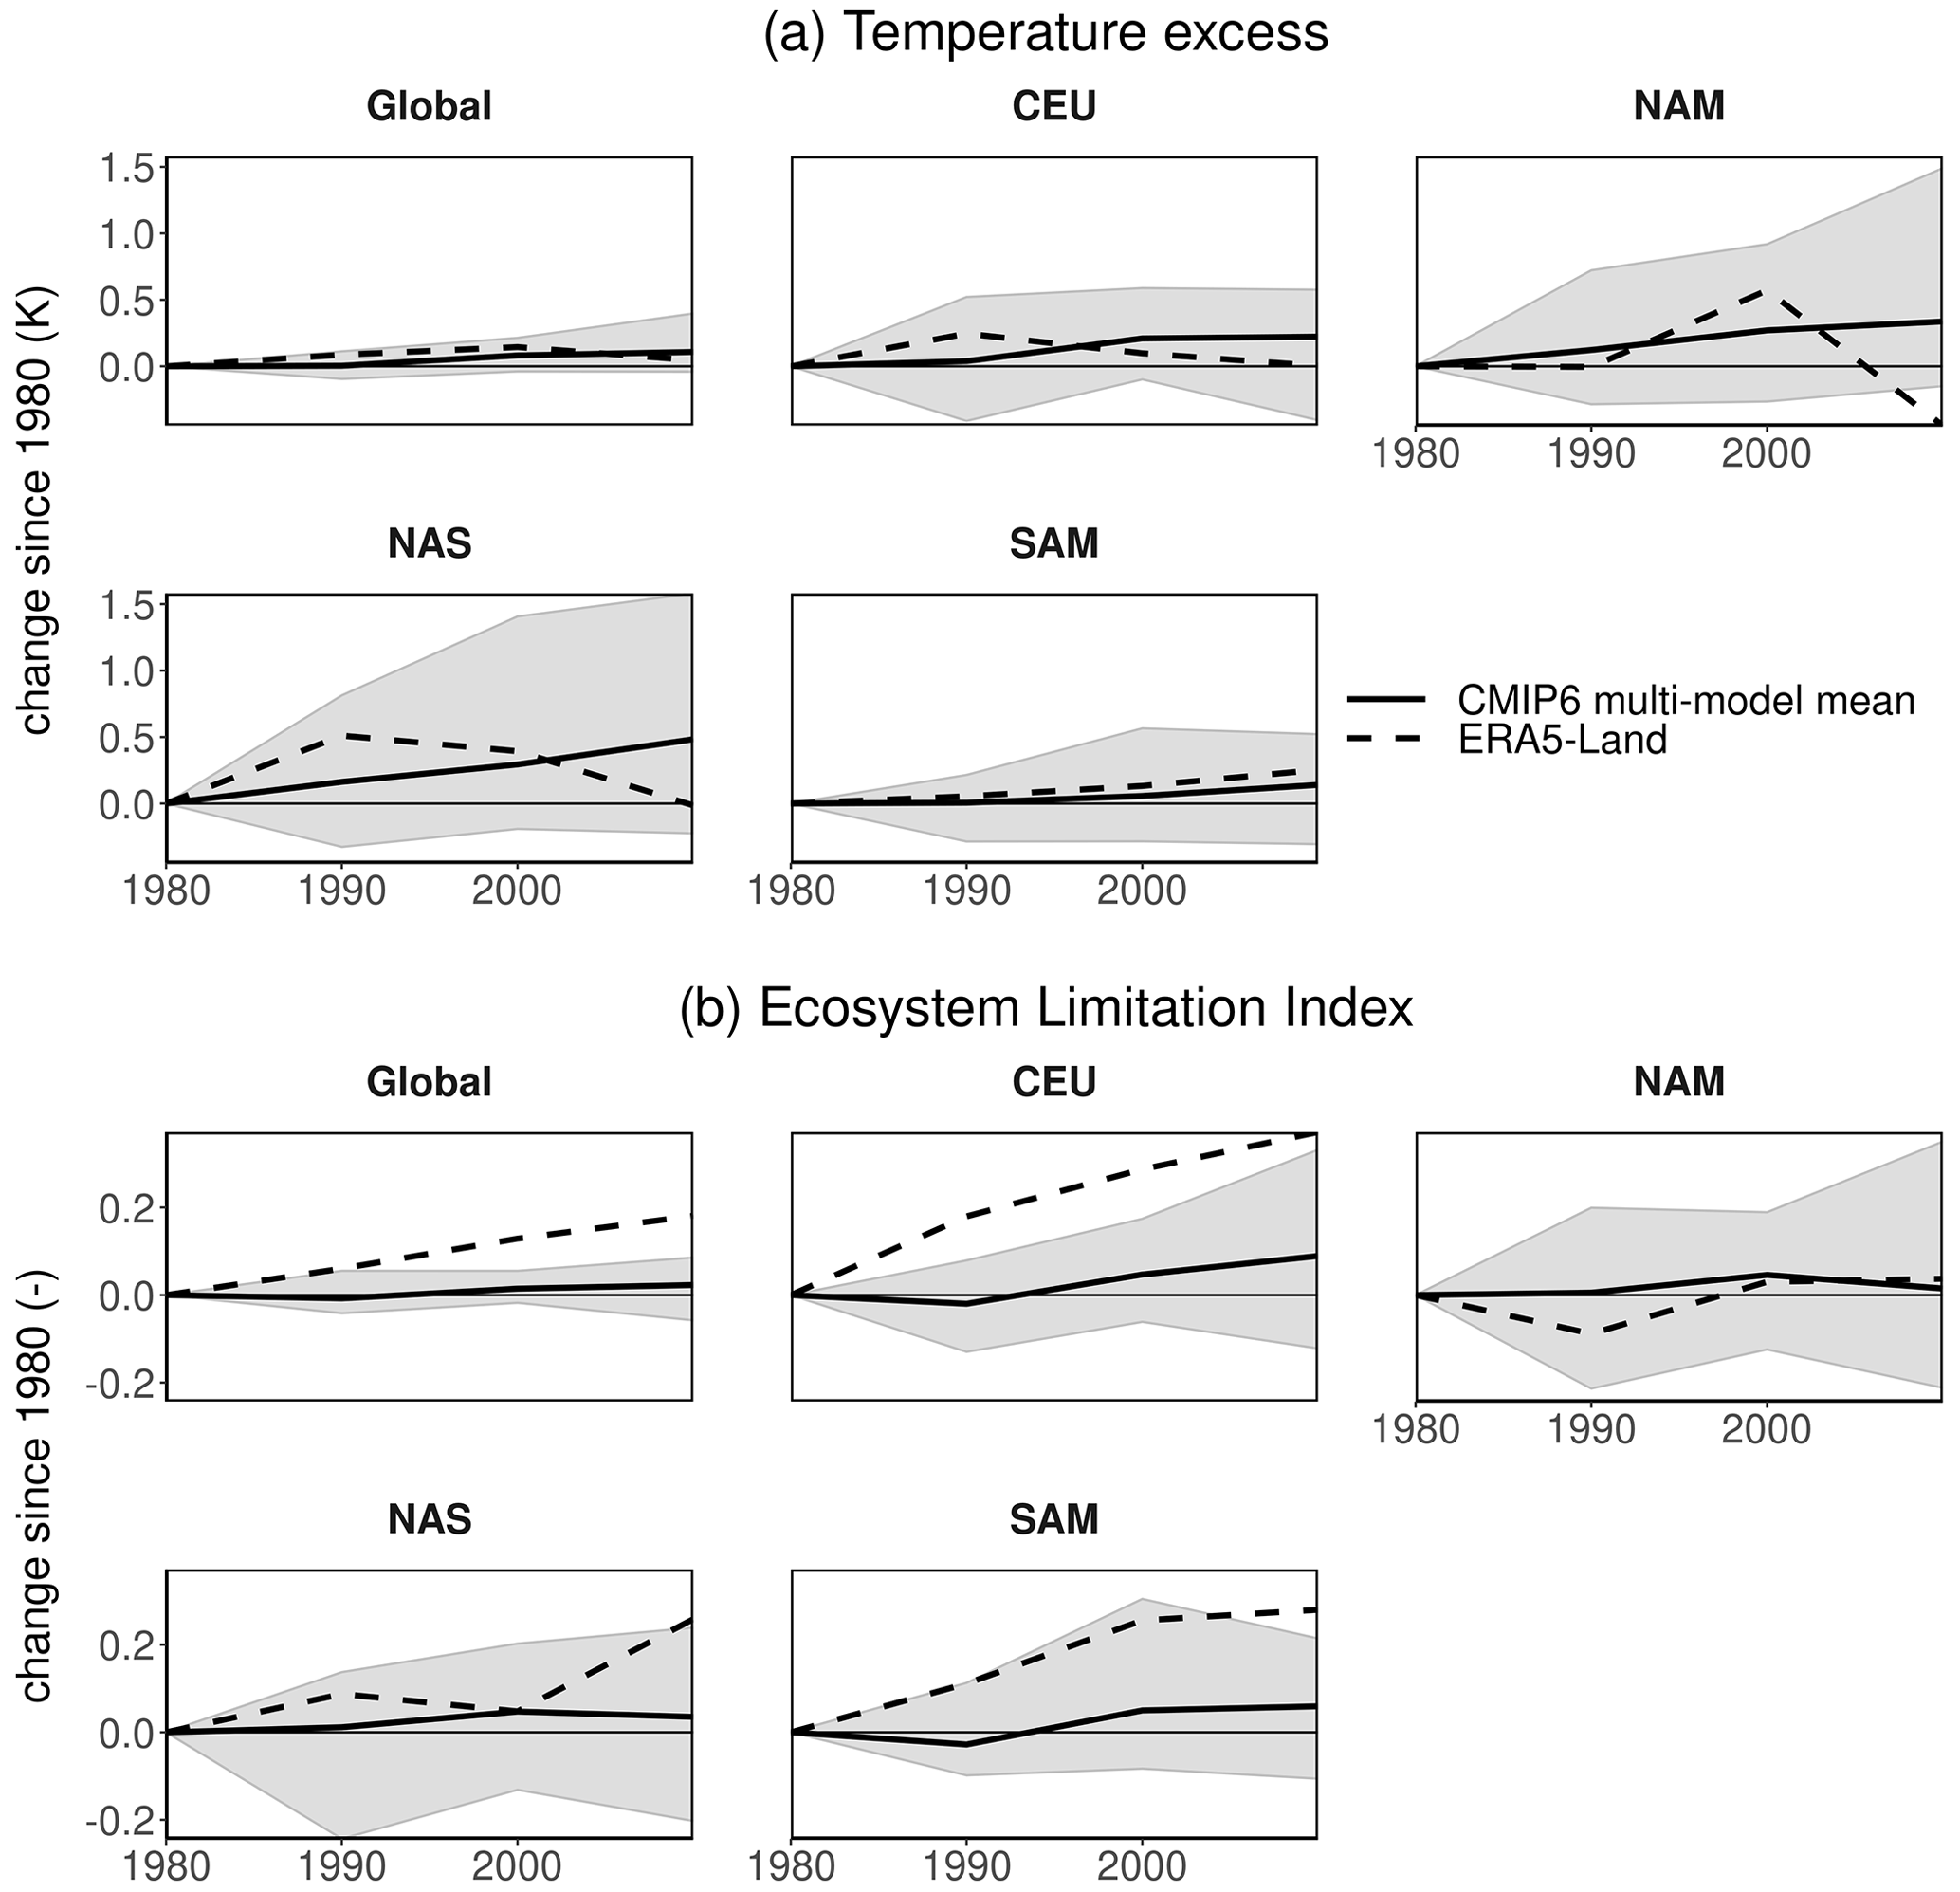
Figure 4Changes in global and regional temperature excess in concert with the increasing ecosystem water limitation from CMIP6 models and ERA5-Land. Temporal evolution of (a) temperature excess and of (b) ecosystem limitation index (ELI) globally and for the regions of interest. The solid black lines depict global and regional time series from the CMIP6 models, while the dashed black line represents ERA5-Land. The grey ribbon displays the envelope which encapsulates all the CMIP6 results. Global averages are calculated over land grid cells that have a complete time series for all models and variables and are weighted according to the surface area per grid cell. The same mask is applied for CMIP6 models and ERA5-Land.
The tendency of temperature excess to be elevated in response to increasing ecosystem water limitation becomes even clearer when only grid cells for which at least 8 out of 12 CMIP6 models agree on the sign of the temperature excess trends are included. This is evidenced by a stronger increase in the ELI in regions with robust temperature excess trends (Fig. S8). ELI trends are even larger for regions with robust and positive temperature excess trends. At the same time, no clear trends in ELI are found for regions with robust and negative temperature excess trends. This suggests that factors other than evaporative cooling, such as changes in circulation, render the temperature excess trends negative in these regions.
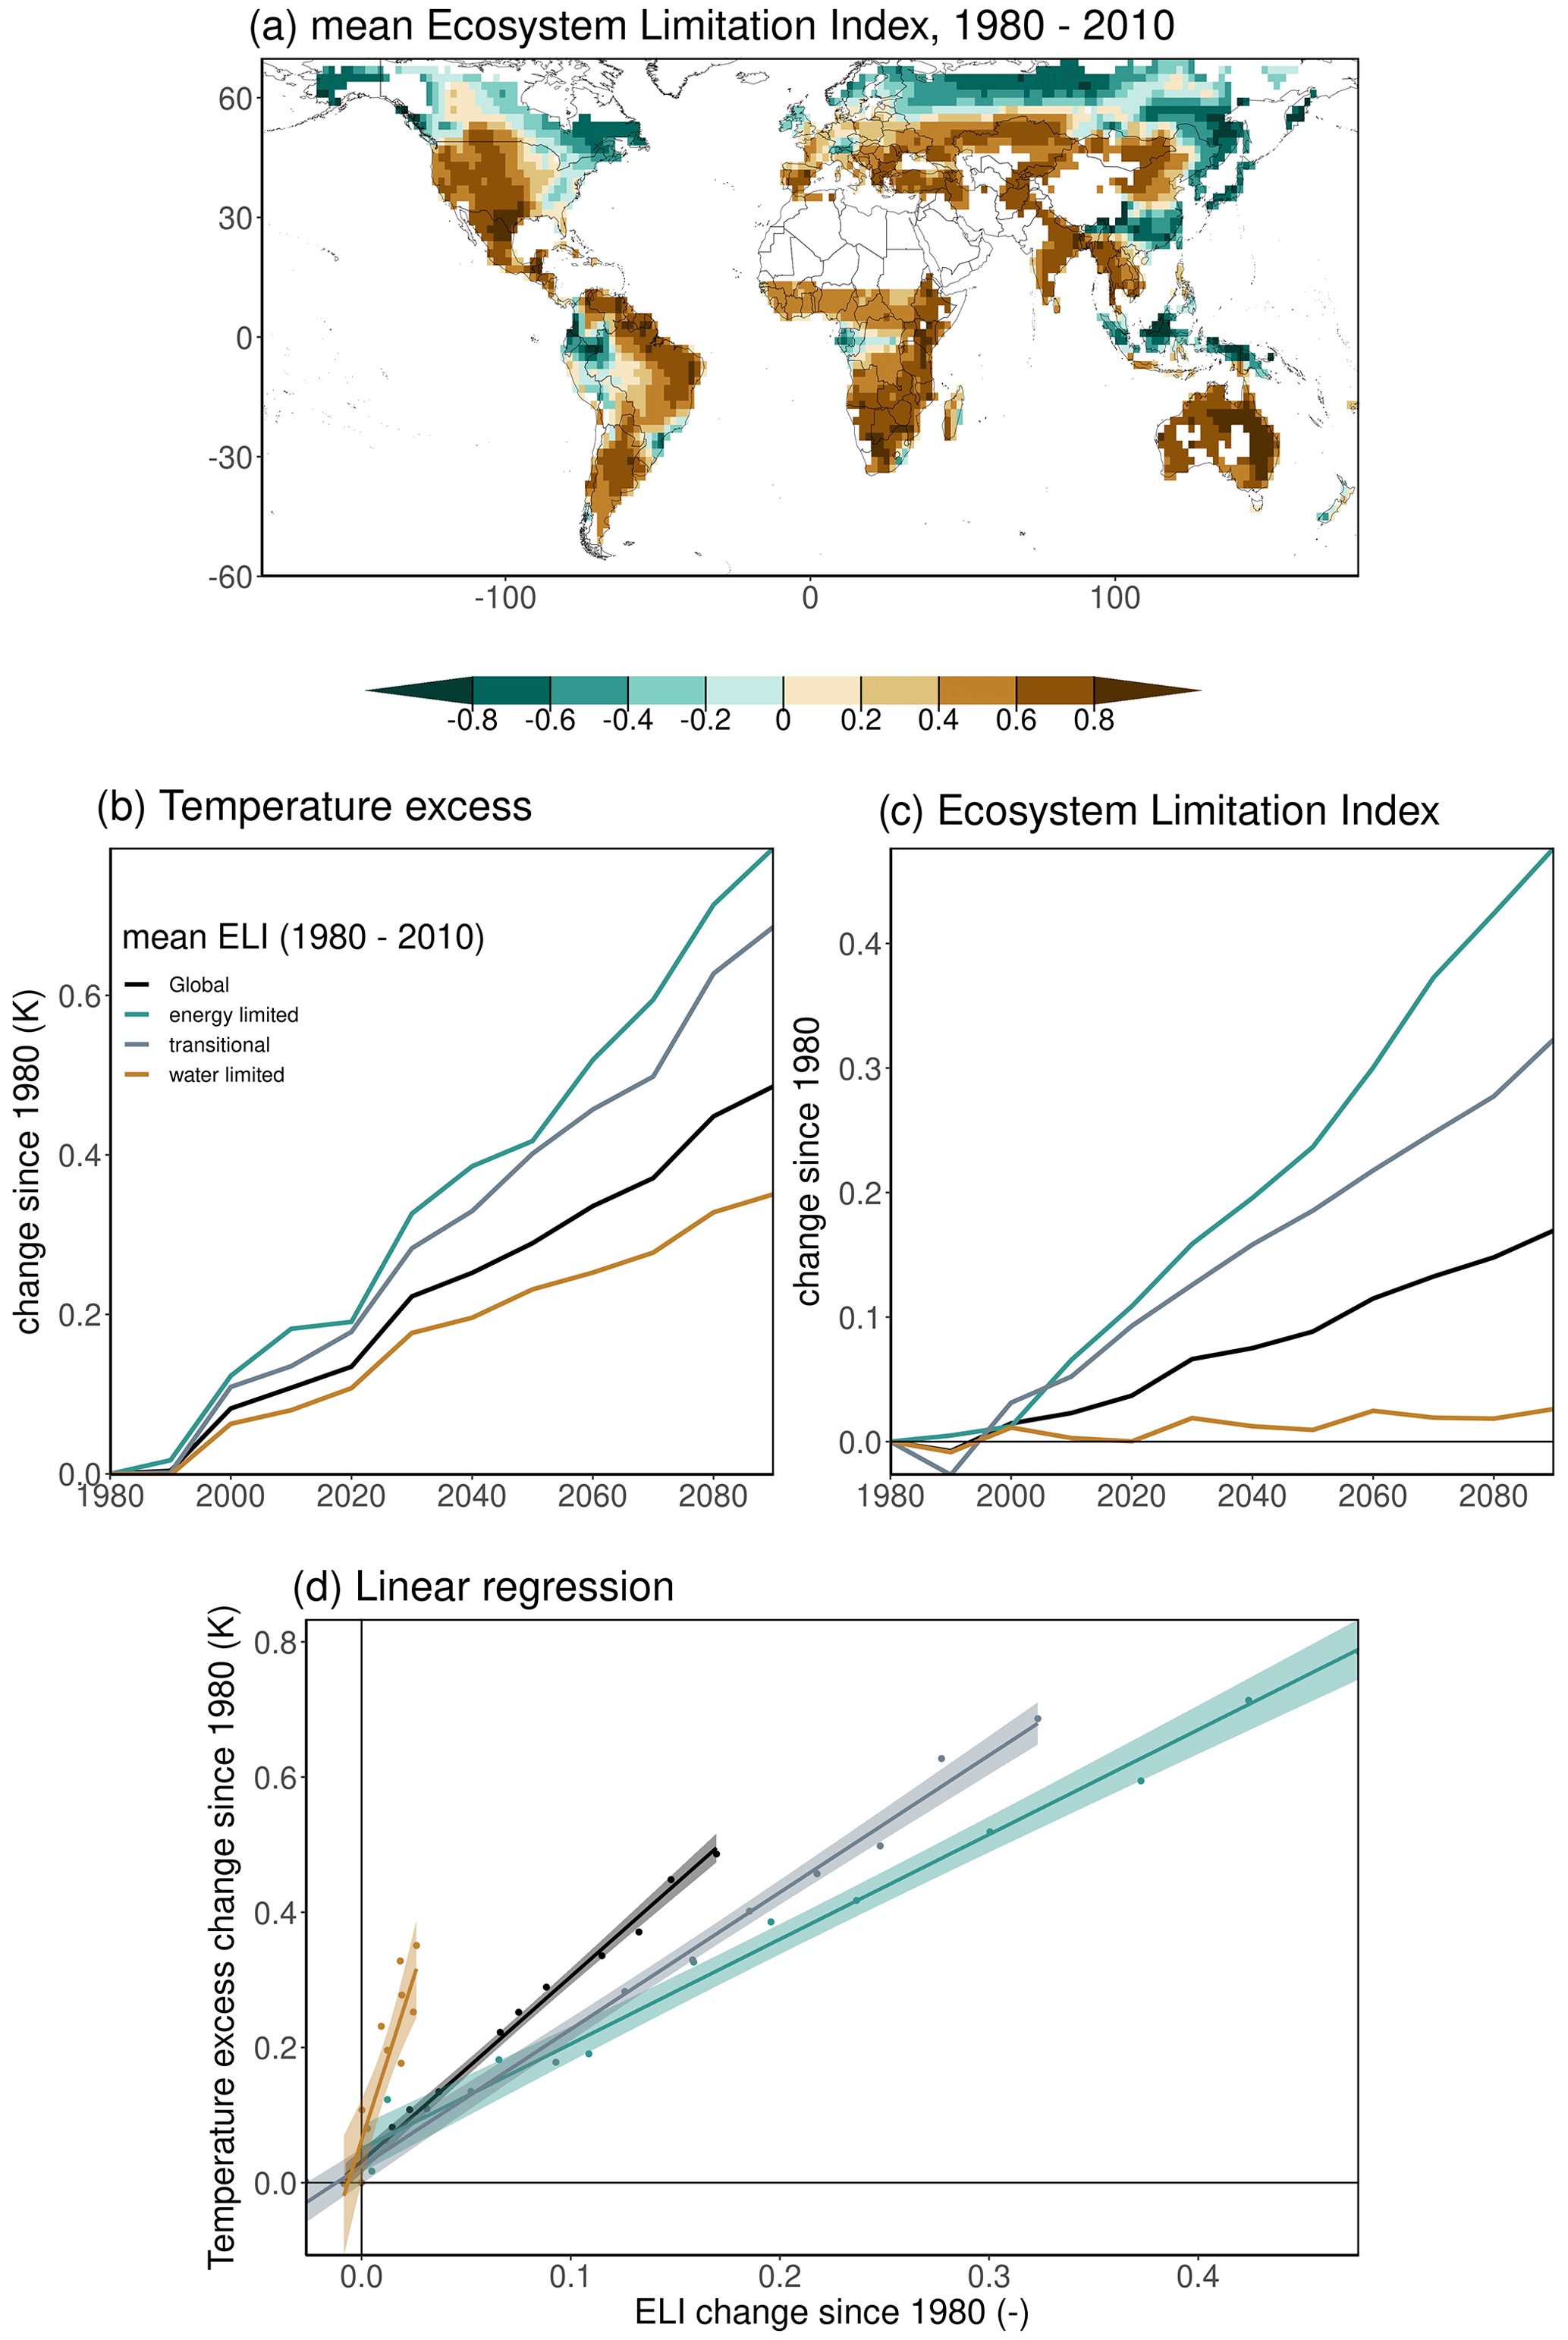
Figure 5Relation between temperature excess and ecosystem water limitation. (a) Multi-model mean ELI (1980–2010). Solid lines depict the time series of multi-model means inferred from globally (black) and regionally (colored) decadally averaged model simulations for (b) temperature excess and (c) ELI. The classification is defined based on the model-specific mean ELI over 1980–2010 (Fig. S9), namely energy-limited (ELI < −0.2), transitional (−0.2 < ELI < 0.2), and water-limited (ELI > 0.2). (d) Points denote the global (black) and regional (colored) decadal multi-model means of ELI (x axis) and temperature excess (y axis), expressed as having changed since 1980. The lines denote linear regressions with a shaded colored 95 % confidence interval. Land grid cells that do not have complete time series for all models are excluded (white regions; see Sect. 2). Global and regional averages are weighted according to the surface area per grid cell.
The sensitivity of temperature excess to ELI trends is expected to depend on the initial regime and can be explained through the nonlinear relationship between soil moisture and EF (Seneviratne et al., 2010; Denissen et al., 2022). In initially energy-limited grid cells (soil moisture exceeds critical soil moisture), ecosystems can sustain maximum EF, assuming sufficient available energy during the warm season. Hence, in such grid cells, shifts towards water limitation, expressed by positive ELI trends or soil drying, do not amount to large changes in surface flux partitioning or in temperature excess, resulting in low sensitivity between ELI and temperature excess trends. In initially water-limited grid cells (soil moisture below critical soil moisture), further soil drying, or shifts towards water limitation, can reduce EF. In this way, temperature excess trends are highly sensitive to ELI trends in water-limited grid cells. Transitional grid cells, which are characterized by a soil moisture regime that transitions periodically from below to above the critical moisture content, effectively switch between energy- and water-limited conditions frequently. As such, evaporative cooling and consequently temperature excess are periodically sensitive to increasing water limitation. In extremely dry and water-limited conditions where soil moisture values approach the wilting point, hardly any moisture can be extracted from the soil, thus rendering vegetation activity and associated EF too low to provide ample evaporative cooling. As such, shifts towards ecosystem water limitation should hardly decrease the evaporative cooling further in extremely water-limited grid cells. To test this hypothesis, we classify all grid cells based on their respective mean ELI over 1980–2010 (Fig. 5a) to define energy-limited (ELI < −0.2), transitional (−0.2 < ELI < 0.2), and water-limited (ELI > 0.2) conditions. We analyze temperature excess trends across these three regimes and find that over initially water-limited areas they are below the global average, while trends over initially transitional or energy-limited areas are above the global average (Fig. 5b). This is against our initial expectation but can be explained by the corresponding ELI trends which are much more pronounced in energy-limited regions (Fig. 5c), leading to more often occurring water-limited conditions in these areas. In initially water-limited regions, temperature excess increases despite only marginal ELI increases over the study period, possibly pointing a higher sensitivity of temperature excess to ELI increases in such regions. Moving beyond trends, we also analyze the sensitivity of decadal temperature excess with respect to ELI for energy-limited vs. transitional vs. water-limited areas and find the strongest relationship in the case of water-limited areas (Fig. 5d), as evidenced by the largest increase in temperature excess with ELI. This confirms that changes in water-limited area temperature excess trends are most sensitive to ELI trends. This stresses that evaporative cooling in already arid drylands is even further reduced, increasingly limiting their ability to mitigate future heat extremes (Feldman et al., 2023). Despite lower sensitivity in transitional and energy-limited regions, ELI trends and related reductions in evaporative cooling are much larger, amounting to larger temperature excess trends.
To quantify the strength of the relationships displayed in Fig. 5d, we compute correlations for the relationships shown for the three regimes, respectively (crosses in Fig. S10a). This suggests a more robust link between ELI and temperature excess in transitional and energy-limited areas resulting from the strong ELI trends moving these areas towards water limitation. To study the relevance of spatial variability across the grid cells that are initially energy- or water-limited or transitional for the correlation estimates, the grid-specific time series of temperature excess and ELI are bootstrapped and displayed as boxplots in Fig. S10a, with overall similar results. Whereas sensitivity in water-limited regions in Fig. 4d is higher, more uncertainty exists in its relationship, as evidenced by a larger spread of bootstrapped correlations. Substantial variability exists across model-specific correlations (Fig. S10b, c). Although the models generally agree on the signs of the correlations, the magnitudes of correlations differ strongly, possibly relating to different representations of land–atmosphere coupling and resulting differences in trends and initial ELI states (Figs. S5 and S9).
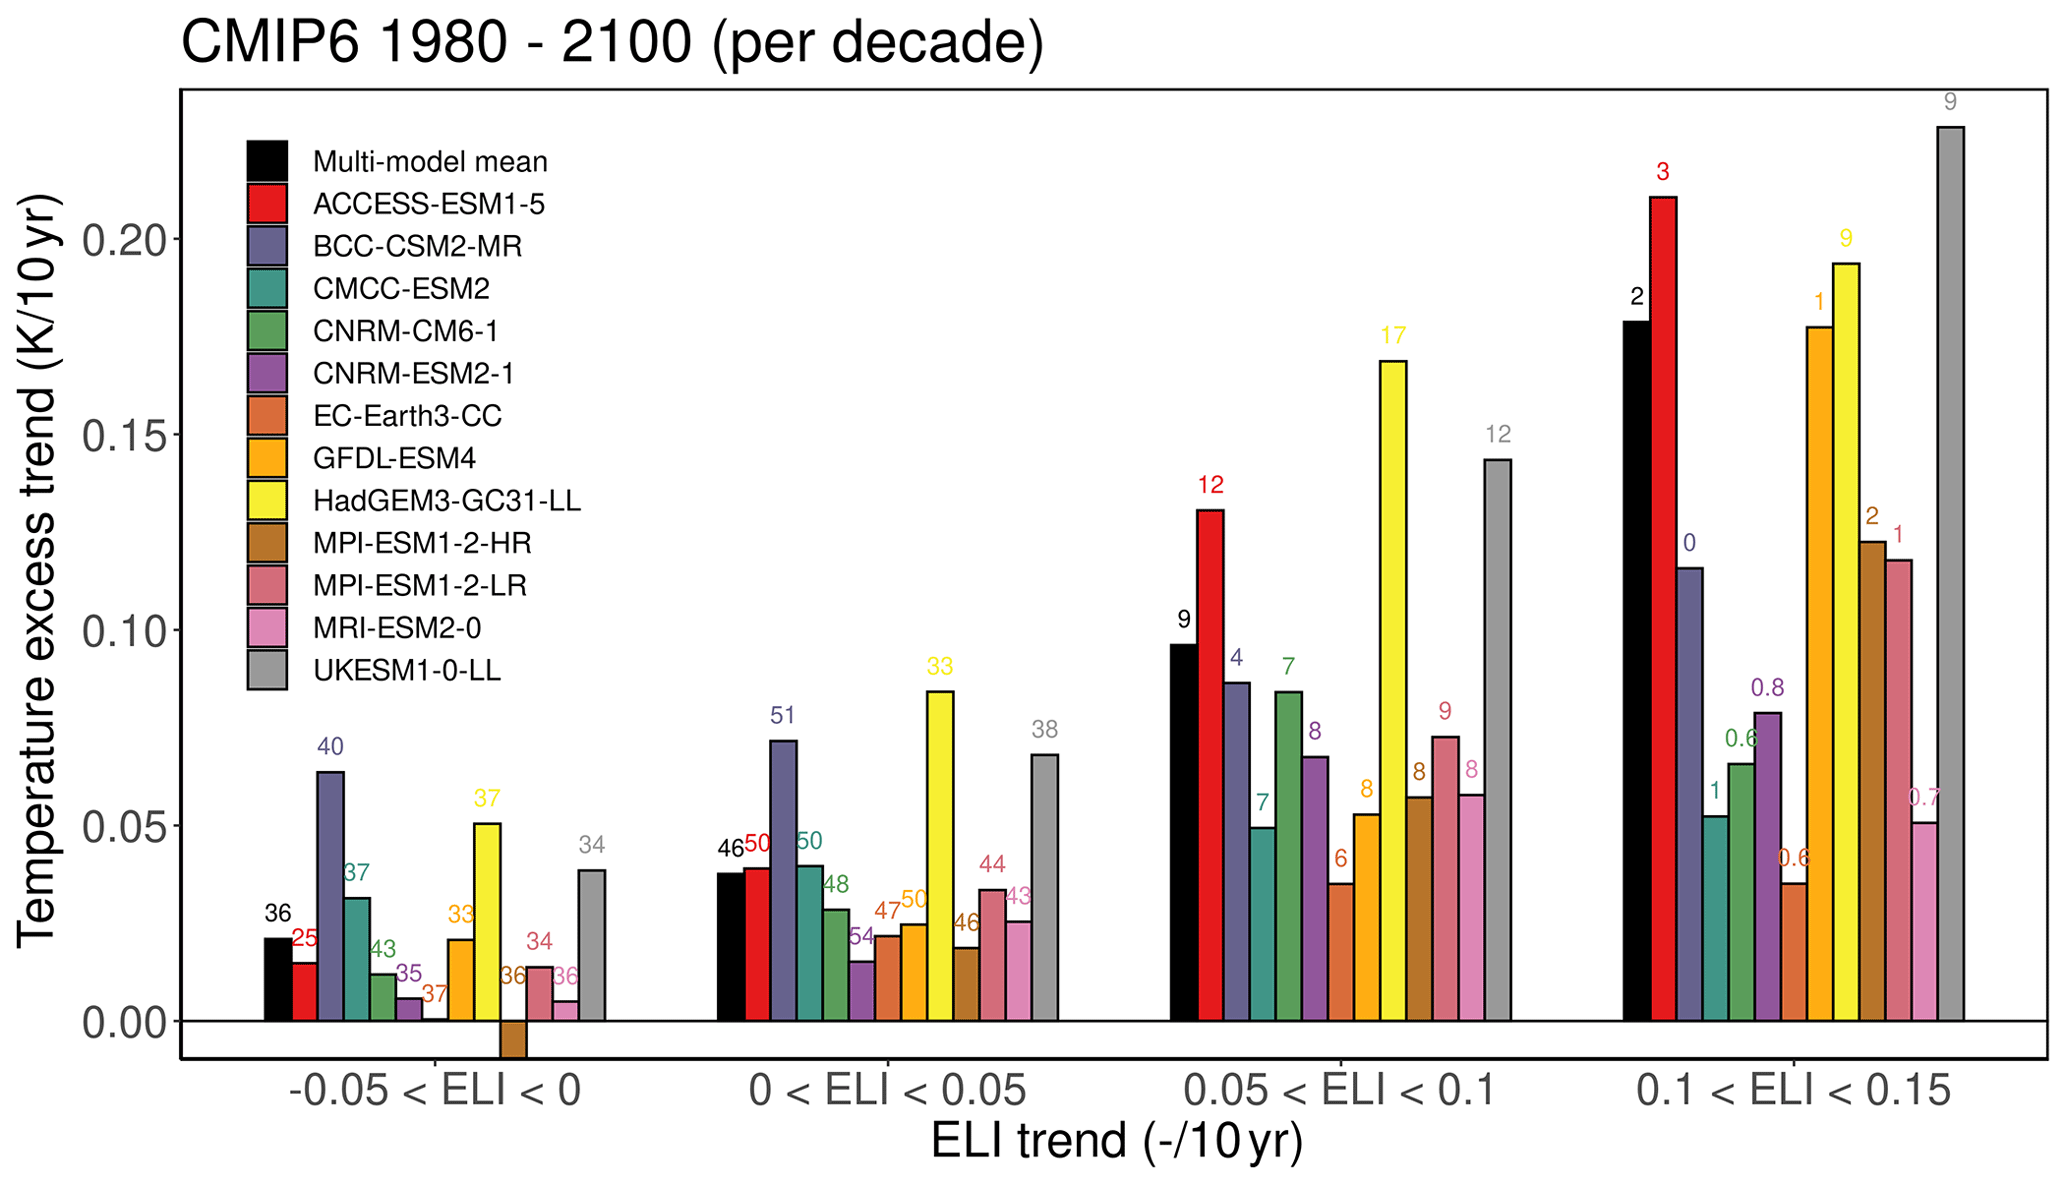
Figure 6Temperature excess trends increase with stronger trends in ecosystem water limitation. The bars denote the multi-model mean and model-specific temperature excess trends (y axis) binned according to their respective ELI trends (x axis) for the multi-model mean trends (black) and all individual models (colors). The numbers display the fraction of warm vegetated land area in which the respective temperature excess and ELI trends occur. These area fractions may not add up to 100 % because values outside of the defined bins on the x axis are possible.
In order to further analyze the role of the magnitude of ELI trends for the coinciding temperature excess trends, we group the global grid cells with respect to their ELI trends and show the multi-model mean and model-specific temperature excess trends (Fig. 6). Higher temperature excess trends correspond to stronger increasing ELI trends. Such strong increases in ELI indicate that water-limited conditions occur more often, potentially also during heat wave events, such that the temperature excess gets more sensitive to ELI. Analyzing results from individual models shows that stronger ELI trends are associated with stronger trends in the temperature excess in almost all models, although with substantial variability between individual models, owing to different representations and strength of land–atmosphere coupling.
Our findings corroborate earlier research which demonstrated the relevance of soil moisture to (future) heat extremes via its control on surface flux partitioning based on idealized Earth system model experiments in which long-term soil moisture trends are artificially removed (Fischer et al., 2007; Lorenz et al., 2016; Schwingshackl et al., 2018; Seneviratne et al., 2006; Vogel et al., 2017, 2018). While our correlative analysis cannot establish the causal link or disentangle the direction of causality between land surface dynamics and heat extremes to the same extent, it benefits from fully coupled simulations without artificial tweaking the water balances, such that it effectively complements the existing body of research. We note that temperature excess is not exclusively driven by land–atmosphere coupling, and the findings presented here merely stress the importance of considering ELI in this context.
While the correlation between ELI and heat wave temperatures is robust across models, we find substantial differences between individual models in terms of the strength of this link (e.g., Figs. 2, 6, S6, S7, and S10). This could be related to a different representation of land–atmosphere interactions in general, which could be due to, e.g., different soil moisture layers and depths, as well as different underlying soil and vegetation types. Additionally, models might use different vegetation water stress functions, some of which are poorly constrained by theory (De Kauwe et al., 2017; Martínez-de la Torre et al., 2019; Ukkola et al., 2016a). Furthermore, not all models include dynamic vegetation, irrigation, and land use change (Table 1). Another reason might be that measurements of soil moisture and terrestrial evaporation are scarce, such that large-scale observational constraints for these key quantities have been lacking and are only recently available following the advent of machine-learning techniques to efficiently interpolate global gridded datasets from the available in situ measurements (Jung et al., 2019; O and Orth, 2021). Additionally, the vegetation's response to soil moisture drying is difficult to capture due to heterogeneous soil and vegetation characteristics and limited observational constraints for rooting depths and soil moisture dynamics in respective soil layers. Next to those processes, the effects of ELI on temperature excess can be obscured by land use, circulation change, and trends in incoming shortwave radiation (Fig. S4). Although disentangling such effects would be insightful, we consider a comprehensible analysis out of scope for this study. At the same time, the findings in this study are based on model-specific assumptions. Therefore, we advocate the need to reproduce the main findings in this study (Fig. 1c, for example) with observation-based data to scrutinize the model-based findings in this study. However, despite apparent differences in processes represented in the models, we still find mostly significant positive correlations between temperature excess and ELI in most models (Fig. S6).
Furthermore, despite the apparent difficulty that Earth system models experience with representing soil moisture trends and related trends in land–atmosphere processes (Berg et al., 2017; Berg and Sheffield, 2018; Greve et al., 2019; Albergel et al., 2013), widespread shifts towards water limitation are robustly projected (Fig. 1) (Denissen et al., 2022; Teuling, 2018; Ukkola et al., 2018). In further highlighting the complex nature of land–atmosphere interactions, we note that ecosystem water limitation is not only affected by climate but also by changes in vegetation physiology (e.g., stomatal regulation) and structure (e.g., LAI) in response to increasing CO2 (CO2 fertilization) (Donohue et al., 2013; Ukkola et al., 2016b; Walker et al., 2021; Zhu et al., 2016), which has also been shown to modulate heat extremes (Lemordant and Gentine, 2019). In this way, changes in both CO2 and climate jointly affect ELI which in turn influences heat wave magnitudes. Given this situation, future research should focus on the link between ELI and heat wave intensities using observation-based datasets, particularly as longer-term interpolations or reconstructions of key variables become available. This can help to corroborate model-based findings and to constrain the variable relevance of ELI across models.
Finally, we focus on the intensity of the heat extremes by considering temperature only rather than more impact-relevant indices. Heat stress for humans is dependent not only on temperature but also on wind speed and humidity (Buzan and Huber, 2020; Matthews, 2018). Through reduced evaporative cooling and increased entrainment of dry air from above the atmospheric boundary layer, the lethality of heat extremes above dry soils can be reduced (Wouters et al., 2022). In this study, we find an increasing temperature excess alongside increasing EF in 14 % of the warm vegetated land area (Fig. 2b), which suggests potentially higher heat stress than reflected by temperature alone, as terrestrial evaporation can increase humidity and related lethality. On the other hand, combined hot and dry conditions can lead to increased wildfires (O et al., 2020) and can be associated with severe impacts on agriculture and infrastructure. From that perspective, our results on the correspondence between increased ecosystem water limitation and amplified heat waves confirm findings from Teuling (2018) which indicate that droughts in Europe will become hotter under future warming. This is in line with future projections, suggesting that concurrent hot and dry extremes will continue to increase in future (Seneviratne et al., 2021; Vogel et al., 2020).
In conclusion, we show the ability of the land surface to modulate the intensity of future heat extremes. We focus on novel indices by focusing on ecosystem water limitation and the temperature excess between warm-season mean and maximum temperatures. In this context, the ELI is used to represent the nonlinear relationship between soil moisture and evaporative cooling, as it considers the effect of hydrometeorological anomalies on ecosystem response. In this way, we find a widespread increase in temperature excess in ∼ 75 % of our study area. We identify several regions of interest where temperature excess is increasing more rapidly than the global mean. In large parts of these regions, these temperature excess increases jointly occur with trends towards ecosystem water limitation which lead to reduced evaporative cooling. Thereby, the relevance of trends in ecosystem water limitation for trends in temperature excess depends on (i) the magnitude of the ELI trends, which is largest in initially energy-limited and transitional areas, and (ii) the initial ELI regime, as (maximum) temperatures are more sensitive to evaporative cooling in initially water-limited regions.
Finally, identifying regions where ELI trends and related evaporative cooling are important for future heat extremes can inform long-term adaptation strategies. Human activities play a key role here, as we can implement agricultural practices and/or tillage, irrigation and land cover management, afforestation, and city greening to mitigate the impact of heat extremes (Schwaab et al., 2021; Sillmann et al., 2017).
The CMIP6 model simulation data are freely available from the Earth System Grid Federation (ESGF) public data at https://aims2.llnl.gov/search/?project=CMIP6/ (Cinquini et al., 2014). All the data used in this analysis are made publicly available in a data repository which can be accessed via Zenodo at https://doi.org/10.5281/zenodo.11072827 (Denissen, 2024a).
The scripts to acquire CMIP6 data are publicly available on Zenodo at https://doi.org/10.5281/zenodo.6559056 (Hassan, 2022). All of the codes written and used in this analysis are made available via a code repository on Zenodo at https://doi.org/10.5281/zenodo.11073163 (Denissen, 2024b).
The supplement related to this article is available online at: https://doi.org/10.5194/esd-15-717-2024-supplement.
RO, AJT, and JMCD jointly designed the study. JMCD performed the analyses. All authors contributed to the writing of the paper, the discussion, and the interpretation of the results.
The contact author has declared that none of the authors has any competing interests.
Publisher's note: Copernicus Publications remains neutral with regard to jurisdictional claims made in the text, published maps, institutional affiliations, or any other geographical representation in this paper. While Copernicus Publications makes every effort to include appropriate place names, the final responsibility lies with the authors.
René Orth has been supported through funding from the German Research Foundation (Emmy Noether, grant no. 391059971). We thank the respective climate modeling groups for making their model output available within the Coupled Model Intercomparison Project Phase 6 (CMIP6) ensemble. Furthermore, the authors wish to acknowledge the fruitful discussions within the Hydrosphere Biosphere Climate Interactions group in the Biogeochemical Integration Department of the Max Planck Institute for Biogeochemistry that have contributed to the interpretation of the results and design of the figures. We extend our gratitude to Sujan Koirala for making the scripts to download CMIP6 data from Google cloud CMIP6 public data publicly available and supporting whenever issues came up. Moreover, we also extend our gratitude to Ulrich Weber for downloading and aggregating the reanalysis data used in this study.
This research has been supported by the German Research Foundation (Emmy Noether, grant no. 391059971).
The article processing charges for this open-access publication were covered by the Max Planck Society.
This paper was edited by Roberta D'Agostino and reviewed by Dominik Schumacher and Andrew Feldman.
Albergel, C., Dorigo, W., Reichle, R. H., Balsamo, G., de Rosnay, P., Muñoz-Sabater, J., Isaksen, L., de Jeu, R., and Wagner, W.: Skill and Global Trend Analysis of Soil Moisture from Reanalyses and Microwave Remote Sensing, J. Hydrometeorol., 14, 1259–1277, https://doi.org/10.1175/JHM-D-12-0161.1, 2013.
Anderegg, W. R. L., Kane, J. M., and Anderegg, L. D. L.: Consequences of widespread tree mortality triggered by drought and temperature stress, Nat. Clim. Change, 3, 30–36, https://doi.org/10.1038/nclimate1635, 2013.
Berg, A. and Sheffield, J.: Climate Change and Drought: the Soil Moisture Perspective, Curr. Clim. Change Rep., 4, 180–191, https://doi.org/10.1007/s40641-018-0095-0, 2018.
Berg, A., Sheffield, J., and Milly, P. C. D.: Divergent surface and total soil moisture projections under global warming, Geophys. Res. Lett., 44, 236–244, https://doi.org/10.1002/2016GL071921, 2017.
Budyko, M. I.: Climate and life, Academic Press, ISBN 978-0-12-139450-9, 1974.
Buzan, J. R. and Huber, M.: Moist Heat Stress on a Hotter Earth, Annu. Rev. Earth Planet. Sci., 48, 623–655, https://doi.org/10.1146/annurev-earth-053018-060100, 2020.
Cassou, C., Terray, L., and Phillips, A. S.: Tropical Atlantic Influence on European Heat Waves, J. Climate, 18, 2805–2811, https://doi.org/10.1175/JCLI3506.1, 2005.
Cherchi, A., Fogli, P. G., Lovato, T., Peano, D., Iovino, D., Gualdi, S., Masina, S., Scoccimarro, E., Materia, S., Bellucci, A., and Navarra, A.: Global Mean Climate and Main Patterns of Variability in the CMCC-CM2 Coupled Model, J. Adv. Model. Earth Syst., 11, 185–209, https://doi.org/10.1029/2018MS001369, 2019.
Cinquini, L., Crichton, D., Mattmann, C., Harney, J., Shipman G., Wang, F., Ananthakrishnan, R., Miller, N., Denvil, S., Morgan, M., Pobre, Z., Bell, G. M., Doutriaux, C., Drach, R., Williams, D., Kershaw, P., Pascoe, S., Gonzalez, E., Fiore, S., and Schweitzer, R.: The Earth System Grid Federation: An open infrastructure for access to distributed geospatial data, Future Gener. Comp. Sy., 36, 400–417, https://doi.org/10.1016/j.future.2013.07.002, 2014 (data available at: https://aims2.llnl.gov/search/?project=CMIP6/, last access: 4 June 2024).
De Kauwe, M. G., Medlyn, B. E., Walker, A. P., Zaehle, S., Asao, S., Guenet, B., Harper, A. B., Hickler, T., Jain, A. K., Luo, Y., Lu, X., Luus, K., Parton, W. J., Shu, S., Wang, Y.-P., Werner, C., Xia, J., Pendall, E., Morgan, J. A., Ryan, E. M., Carrillo, Y., Dijkstra, F. A., Zelikova, T. J., and Norby, R. J.: Challenging terrestrial biosphere models with data from the long-term multifactor Prairie Heating and CO2 Enrichment experiment, Glob. Change Biol., 23, 3623–3645, https://doi.org/10.1111/gcb.13643, 2017.
Denissen, J.: Data_Denissen_et_al_2024_ESD, Zenodo [data set], https://doi.org/10.5281/zenodo.11072827, 2024a.
Denissen, J. M. C.: JasperMCDenissen/Denissen_etal_2024_ESD: Denissen_et_al_2024_ESD (Version v1), Zenodo [code], https://doi.org/10.5281/zenodo.11073163, 2024b.
Denissen, J. M. C., Teuling, A. J., Reichstein, M., and Orth, R.: Critical Soil Moisture Derived From Satellite Observations Over Europe, J. Geophys. Res.-Atmos., 125, e2019JD031672, https://doi.org/10.1029/2019JD031672, 2020.
Denissen, J. M. C., Orth, R., Wouters, H., Miralles, D. G., van Heerwaarden, C. C., Vilà-Guerau de Arellano, J., and Teuling, A. J.: Soil moisture signature in global weather balloon soundings, Npj Clim. Atmos. Sci., 4, 1–8, https://doi.org/10.1038/s41612-021-00167-w, 2021.
Denissen, J. M. C., Teuling, A. J., Pitman, A. J., Koirala, S., Migliavacca, M., Li, W., Reichstein, M., Winkler, A. J., Zhan, C., and Orth, R.: Widespread shift from ecosystem energy to water limitation with climate change, Nat. Clim. Change, 12, 677–684, https://doi.org/10.1038/s41558-022-01403-8, 2022.
Dirmeyer, P. A., Balsamo, G., Blyth, E. M., Morrison, R., and Cooper, H. M.: Land-Atmosphere Interactions Exacerbated the Drought and Heatwave Over Northern Europe During Summer 2018, AGU Adv., 2, e2020AV000283, https://doi.org/10.1029/2020AV000283, 2021.
Donat, M. G., Pitman, A. J., and Seneviratne, S. I.: Regional warming of hot extremes accelerated by surface energy fluxes, Geophys. Res. Lett., 44, 7011–7019, https://doi.org/10.1002/2017GL073733, 2017.
Donohue, R. J., Roderick, M. L., McVicar, T. R., and Farquhar, G. D.: Impact of CO2 fertilization on maximum foliage cover across the globe's warm, arid environments, Geophys. Res. Lett., 40, 3031–3035, https://doi.org/10.1002/grl.50563, 2013.
Döscher, R., Acosta, M., Alessandri, A., Anthoni, P., Arsouze, T., Bergman, T., Bernardello, R., Boussetta, S., Caron, L.-P., Carver, G., Castrillo, M., Catalano, F., Cvijanovic, I., Davini, P., Dekker, E., Doblas-Reyes, F. J., Docquier, D., Echevarria, P., Fladrich, U., Fuentes-Franco, R., Gröger, M., v. Hardenberg, J., Hieronymus, J., Karami, M. P., Keskinen, J.-P., Koenigk, T., Makkonen, R., Massonnet, F., Ménégoz, M., Miller, P. A., Moreno-Chamarro, E., Nieradzik, L., van Noije, T., Nolan, P., O'Donnell, D., Ollinaho, P., van den Oord, G., Ortega, P., Prims, O. T., Ramos, A., Reerink, T., Rousset, C., Ruprich-Robert, Y., Le Sager, P., Schmith, T., Schrödner, R., Serva, F., Sicardi, V., Sloth Madsen, M., Smith, B., Tian, T., Tourigny, E., Uotila, P., Vancoppenolle, M., Wang, S., Wårlind, D., Willén, U., Wyser, K., Yang, S., Yepes-Arbós, X., and Zhang, Q.: The EC-Earth3 Earth system model for the Coupled Model Intercomparison Project 6, Geosci. Model Dev., 15, 2973–3020, https://doi.org/10.5194/gmd-15-2973-2022, 2022.
Dunne, J. P., Horowitz, L. W., Adcroft, A. J., Ginoux, P., Held, I. M., John, J. G., Krasting, J. P., Malyshev, S., Naik, V., Paulot, F., Shevliakova, E., Stock, C. A., Zadeh, N., Balaji, V., Blanton, C., Dunne, K. A., Dupuis, C., Durachta, J., Dussin, R., Gauthier, P. P. G., Griffies, S. M., Guo, H., Hallberg, R. W., Harrison, M., He, J., Hurlin, W., McHugh, C., Menzel, R., Milly, P. C. D., Nikonov, S., Paynter, D. J., Ploshay, J., Radhakrishnan, A., Rand, K., Reichl, B. G., Robinson, T., Schwarzkopf, D. M., Sentman, L. T., Underwood, S., Vahlenkamp, H., Winton, M., Wittenberg, A. T., Wyman, B., Zeng, Y., and Zhao, M.: The GFDL Earth System Model Version 4.1 (GFDL-ESM 4.1): Overall Coupled Model Description and Simulation Characteristics, J. Adv. Model. Earth Syst., 12, e2019MS002015, https://doi.org/10.1029/2019MS002015, 2020.
EC-Earth Consortium (EC-Earth): EC-Earth-Consortium EC-Earth-3-CC model output prepared for CMIP6 CMIP historical, Earth System Grid Federation [data set], https://doi.org/10.22033/ESGF/CMIP6.4702, 2021a.
EC-Earth Consortium (EC-Earth): EC-Earth-Consortium EC-Earth3-CC model output prepared for CMIP6 ScenarioMIP ssp585, Earth System Grid Federation [data set], https://doi.org/10.22033/ESGF/CMIP6.15636, 2021b.
Eyring, V., Bony, S., Meehl, G. A., Senior, C. A., Stevens, B., Stouffer, R. J., and Taylor, K. E.: Overview of the Coupled Model Intercomparison Project Phase 6 (CMIP6) experimental design and organization, Geosci. Model Dev., 9, 1937–1958, https://doi.org/10.5194/gmd-9-1937-2016, 2016.
Feldman, A. F., Short Gianotti, D. J., Dong, J., Trigo, I. F., Salvucci, G. D., and Entekhabi, D.: Tropical surface temperature response to vegetation cover changes and the role of drylands, Glob. Change Biol., 29, 110–125, https://doi.org/10.1111/gcb.16455, 2023.
Fischer, E. M., Seneviratne, S. I., Lüthi, D., and Schär, C.: Contribution of land-atmosphere coupling to recent European summer heat waves, Geophys. Res. Lett., 34, L06707, https://doi.org/10.1029/2006GL029068, 2007.
Good, P.: MOHC HadGEM3-GC31-LL model output prepared for CMIP6 ScenarioMIP ssp585, Earth System Grid Federation [data set], https://doi.org/10.22033/ESGF/CMIP6.10901, 2020.
Good, P., Sellar, A., Tang, Y., Rumbold, S., Ellis, R., Kelley, D., Kuhlbrodt, T., and Walton, J.: MOHC UKESM1.0-LL model output prepared for CMIP6 ScenarioMIP, Earth System Grid Federation [data set], https://doi.org/10.22033/ESGF/CMIP6.1567, 2019.
Goulart, H. M. D., van der Wiel, K., Folberth, C., Balkovic, J., and van den Hurk, B.: Storylines of weather-induced crop failure events under climate change, Earth Syst. Dynam., 12, 1503–1527, https://doi.org/10.5194/esd-12-1503-2021, 2021.
Greve, P., Roderick, M. L., Ukkola, A. M., and Wada, Y.: The aridity Index under global warming, Environ. Res. Lett., 14, 124006, https://doi.org/10.1088/1748-9326/ab5046, 2019.
Harrington, L. J., Otto, F. E. L., Cowan, T., and Hegerl, G. C.: Circulation analogues and uncertainty in the time-evolution of extreme event probabilities: evidence from the 1947 Central European heatwave, Clim. Dynam., 53, 2229–2247, https://doi.org/10.1007/s00382-019-04820-2, 2019.
Hassan, T.: acccmip6: Python package for accessing and downloading CMIP6 data (v2.0.0), Zenodo [code], https://doi.org/10.5281/zenodo.6559056, 2022.
Hurtt, G. C., Chini, L. P., Frolking, S., Betts, R. A., Feddema, J., Fischer, G., Fisk, J. P., Hibbard, K., Houghton, R. A., Janetos, A., Jones, C. D., Kindermann, G., Kinoshita, T., Klein Goldewijk, K., Riahi, K., Shevliakova, E., Smith, S., Stehfest, E., Thomson, A., Thornton, P., van Vuuren, D. P., and Wang, Y. P.: Harmonization of land-use scenarios for the period 1500–2100: 600 years of global gridded annual land-use transitions, wood harvest, and resulting secondary lands, Clim. Change, 109, 117, https://doi.org/10.1007/s10584-011-0153-2, 2011.
Jézéquel, A., Cattiaux, J., Naveau, P., Radanovics, S., Ribes, A., Vautard, R., Vrac, M., and Yiou, P.: Trends of atmospheric circulation during singular hot days in Europe, Environ. Res. Lett., 13, 054007, https://doi.org/10.1088/1748-9326/aab5da, 2018.
John, J. G., Blanton, C., McHugh, C., Radhakrishnan, A., Rand, K., Vahlenkamp, H., Wilson, C., Zadeh, N. T., Dunne, J. P., Dussin, R., Horowitz, L. W., Krasting, J. P., Lin, P., Malyshev, S., Naik, V., Ploshay, J., Shevliakova, E., Silvers, L., Stock, C., Winton, M., and Zeng, Y.: NOAA-GFDL GFDL-ESM4 model output prepared for CMIP6 ScenarioMIP ssp585, Earth System Grid Federation [data set], https://doi.org/10.22033/ESGF/CMIP6.8706, 2018.
Jung, M., Koirala, S., Weber, U., Ichii, K., Gans, F., Camps-Valls, G., Papale, D., Schwalm, C., Tramontana, G., and Reichstein, M.: The FLUXCOM ensemble of global land-atmosphere energy fluxes, Sci. Data, 6, 74, https://doi.org/10.1038/s41597-019-0076-8, 2019.
Jungclaus, J., Bittner, M., Wieners, K.-H., Wachsmann, F., Schupfner, M., Legutke, S., Giorgetta, M., Reick, C., Gayler, V., Haak, H., de Vrese, P., Raddatz, T., Esch, M., Mauritsen, T., von Storch, J.-S., Behrens, J., Brovkin, V., Claussen, M., Crueger, T., Fast, I., Fiedler, S., Hagemann, S., Hohenegger, C., Jahns, T., Kloster, S., Kinne, S., Lasslop, G., Kornblueh, L., Marotzke, J., Matei, D., Meraner, K., Mikolajewicz, U., Modali, K., Müller, W., Nabel, J., Notz, D., Peters-von Gehlen, K., Pincus, R., Pohlmann, H., Pongratz, J., Rast, S., Schmidt, H., Schnur, R., Schulzweida, U., Six, K., Stevens, B., Voigt, A., and Roeckner, E.: MPI-M MPI-ESM1.2-HR model output prepared for CMIP6 CMIP historical, Earth System Grid Federation [data set], https://doi.org/10.22033/ESGF/CMIP6.6594, 2019.
Krasting, J. P., John, J. G., Blanton, C., McHugh, C., Nikonov, S., Radhakrishnan, A., Rand, K., Zadeh, N. T., Balaji, V., Durachta, J., Dupuis, C., Menzel, R., Robinson, T., Underwood, S., Vahlenkamp, H., Dunne, K. A., Gauthier, P. P., Ginoux, P., Griffies, S. M., Hallberg, R., Harrison, M., Hurlin, W., Malyshev, S., Naik, V., Paulot, F., Paynter, D. J., Ploshay, J., Reichl, B. G., Schwarzkopf, D. M., Seman, C. J., Silvers, L., Wyman, B., Zeng, Y., Adcroft, A., Dunne, J. P., Dussin, R., Guo, H., He, J., Held, I. M., Horowitz, L. W., Lin, P., Milly, P. C. D., Shevliakova, E., Stock, C., Winton, M., Wittenberg, A. T., Xie, Y., and Zhao, M.: NOAA-GFDL GFDL-ESM4 model output prepared for CMIP6 CMIP historical, Earth System Grid Federation [data set], https://doi.org/10.22033/ESGF/CMIP6.8597, 2018.
Lemordant, L. and Gentine, P.: Vegetation Response to Rising CO2 Impacts Extreme Temperatures, Geophys. Res. Lett., 46, 1383–1392, https://doi.org/10.1029/2018GL080238, 2019.
Lorenz, R., Argüeso, D., Donat, M. G., Pitman, A. J., van den Hurk, B., Berg, A., Lawrence, D. M., Chéruy, F., Ducharne, A., Hagemann, S., Meier, A., Milly, P. C. D., and Seneviratne, S. I.: Influence of land-atmosphere feedbacks on temperature and precipitation extremes in the GLACE-CMIP5 ensemble, J. Geophys. Res.-Atmos., 121, 607–623, https://doi.org/10.1002/2015JD024053, 2016.
Lovato, T. and Peano, D.: CMCC CMCC-CM2-SR5 model output prepared for CMIP6 CMIP historical, Earth System Grid Federation [data set], https://doi.org/10.22033/ESGF/CMIP6.3825, 2020a.
Lovato, T. and Peano, D.: CMCC CMCC-CM2-SR5 model output prepared for CMIP6 ScenarioMIP, Earth System Grid Federation [data set], https://doi.org/10.22033/ESGF/CMIP6.1365, 2020b.
Martínez-de la Torre, A., Blyth, E. M., and Robinson, E. L.: Evaluation of Drydown Processes in Global Land Surface and Hydrological Models Using Flux Tower Evapotranspiration, Water, 11, 356, https://doi.org/10.3390/w11020356, 2019.
Matthews, T.: Humid heat and climate change, Prog. Phys. Geogr. Earth Environ., 42, 391–405, https://doi.org/10.1177/0309133318776490, 2018.
Mauritsen, T., Bader, J., Becker, T., Behrens, J., Bittner, M., Brokopf, R., Brovkin, V., Claussen, M., Crueger, T., Esch, M., Fast, I., Fiedler, S., Fläschner, D., Gayler, V., Giorgetta, M., Goll, D. S., Haak, H., Hagemann, S., Hedemann, C., Hohenegger, C., Ilyina, T., Jahns, T., Jimenéz-de-la-Cuesta, D., Jungclaus, J., Kleinen, T., Kloster, S., Kracher, D., Kinne, S., Kleberg, D., Lasslop, G., Kornblueh, L., Marotzke, J., Matei, D., Meraner, K., Mikolajewicz, U., Modali, K., Möbis, B., Müller, W. A., Nabel, J. E. M. S., Nam, C. C. W., Notz, D., Nyawira, S.-S., Paulsen, H., Peters, K., Pincus, R., Pohlmann, H., Pongratz, J., Popp, M., Raddatz, T. J., Rast, S., Redler, R., Reick, C. H., Rohrschneider, T., Schemann, V., Schmidt, H., Schnur, R., Schulzweida, U., Six, K. D., Stein, L., Stemmler, I., Stevens, B., von Storch, J.-S., Tian, F., Voigt, A., Vrese, P., Wieners, K.-H., Wilkenskjeld, S., Winkler, A., and Roeckner, E.: Developments in the MPI-M Earth System Model version 1.2 (MPI-ESM1.2) and Its Response to Increasing CO2, J. Adv. Model. Earth Syst., 11, 998–1038, https://doi.org/10.1029/2018MS001400, 2019.
McDowell, N. G. and Allen, C. D.: Darcy's law predicts widespread forest mortality under climate warming, Nat. Clim. Change, 5, 669–672, https://doi.org/10.1038/nclimate2641, 2015.
Miralles, D. G., van den Berg, M. J., Teuling, A. J., and de Jeu, R. A. M.: Soil moisture-temperature coupling: A multiscale observational analysis, Geophys. Res. Lett., 39, L21707, https://doi.org/10.1029/2012GL053703, 2012.
Miralles, D. G., Teuling, A. J., van Heerwaarden, C. C., and Vilà-Guerau de Arellano, J.: Mega-heatwave temperatures due to combined soil desiccation and atmospheric heat accumulation, Nat. Geosci., 7, 345–349, https://doi.org/10.1038/ngeo2141, 2014.
Müller, W. A., Jungclaus, J. H., Mauritsen, T., Baehr, J., Bittner, M., Budich, R., Bunzel, F., Esch, M., Ghosh, R., Haak, H., Ilyina, T., Kleine, T., Kornblueh, L., Li, H., Modali, K., Notz, D., Pohlmann, H., Roeckner, E., Stemmler, I., Tian, F., and Marotzke, J.: A Higher-resolution Version of the Max Planck Institute Earth System Model (MPI-ESM1.2-HR), J. Adv. Model. Earth Syst., 10, 1383–1413, https://doi.org/10.1029/2017MS001217, 2018.
Muñoz Sabater, J.: ERA5-Land monthly averaged data from 2001 to present, Copernicus Climate Change Service (C3S) Climate Data Store (CDS) [data set], https://doi.org/10.24381/CDS.68D2BB30, 2019.
Muñoz-Sabater, J., Dutra, E., Agustí-Panareda, A., Albergel, C., Arduini, G., Balsamo, G., Boussetta, S., Choulga, M., Harrigan, S., Hersbach, H., Martens, B., Miralles, D. G., Piles, M., Rodríguez-Fernández, N. J., Zsoter, E., Buontempo, C., and Thépaut, J.-N.: ERA5-Land: a state-of-the-art global reanalysis dataset for land applications, Earth Syst. Sci. Data, 13, 4349–4383, https://doi.org/10.5194/essd-13-4349-2021, 2021.
Nabat, P., Somot, S., Mallet, M., Sanchez-Lorenzo, A., and Wild, M.: Contribution of anthropogenic sulfate aerosols to the changing Euro-Mediterranean climate since 1980, Geophys. Res. Lett., 41, 5605–5611, https://doi.org/10.1002/2014GL060798, 2014.
Nemani, R. R., Keeling, C. D., Hashimoto, H., Jolly, W. M., Piper, S. C., Tucker, C. J., Myneni, R. B., and Running, S. W.: Climate-Driven Increases in Global Terrestrial Net Primary Production from 1982 to 1999, Science, 300, 1560–1563, https://doi.org/10.1126/science.1082750, 2003.
O, S. and Orth, R.: Global soil moisture data derived through machine learning trained with in-situ measurements, Sci. Data, 8, 170, https://doi.org/10.1038/s41597-021-00964-1, 2021.
O, S., Hou, X., and Orth, R.: Observational evidence of wildfire-promoting soil moisture anomalies, Sci. Rep., 10, 11008, https://doi.org/10.1038/s41598-020-67530-4, 2020.
O'Neill, B. C., Tebaldi, C., van Vuuren, D. P., Eyring, V., Friedlingstein, P., Hurtt, G., Knutti, R., Kriegler, E., Lamarque, J.-F., Lowe, J., Meehl, G. A., Moss, R., Riahi, K., and Sanderson, B. M.: The Scenario Model Intercomparison Project (ScenarioMIP) for CMIP6, Geosci. Model Dev., 9, 3461–3482, https://doi.org/10.5194/gmd-9-3461-2016, 2016.
Orth, R., O, S., Zscheischler, J., Mahecha, M. D., and Reichstein, M.: Contrasting biophysical and societal impacts of hydro-meteorological extremes, Environ. Res. Lett., 17, 014044, https://doi.org/10.1088/1748-9326/ac4139, 2022.
Qian, Y., Leung, L. R., Ghan, S. J., and Giorgi, F.: Regional climate effects of aerosols over China: modeling and observation, Tellus B, 55, 914–934, https://doi.org/10.3402/tellusb.v55i4.16379, 2011.
Quesada, B., Vautard, R., Yiou, P., Hirschi, M., and Seneviratne, S. I.: Asymmetric European summer heat predictability from wet and dry southern winters and springs, Nat. Clim. Change, 2, 736–741, https://doi.org/10.1038/nclimate1536, 2012.
Rasmijn, L. M., van der Schrier, G., Bintanja, R., Barkmeijer, J., Sterl, A., and Hazeleger, W.: Future equivalent of 2010 Russian heatwave intensified by weakening soil moisture constraints, Nat. Clim. Change, 8, 381–385, https://doi.org/10.1038/s41558-018-0114-0, 2018.
Ridley, J., Menary, M., Kuhlbrodt, T., Andrews, M., and Andrews, T.: MOHC HadGEM3-GC31-LL model output prepared for CMIP6 CMIP historical, Earth System Grid Federation [data set], https://doi.org/10.22033/ESGF/CMIP6.6109, 2019.
Ruffault, J., Curt, T., Moron, V., Trigo, R. M., Mouillot, F., Koutsias, N., Pimont, F., Martin-StPaul, N., Barbero, R., Dupuy, J.-L., Russo, A., and Belhadj-Khedher, C.: Increased likelihood of heat-induced large wildfires in the Mediterranean Basin, Sci. Rep., 10, 13790, https://doi.org/10.1038/s41598-020-70069-z, 2020.
Schumacher, D. L., Keune, J., van Heerwaarden, C. C., Vilà-Guerau de Arellano, J., Teuling, A. J., and Miralles, D. G.: Amplification of mega-heatwaves through heat torrents fuelled by upwind drought, Nat. Geosci., 12, 712–717, https://doi.org/10.1038/s41561-019-0431-6, 2019.
Schupfner, M., Wieners, K.-H., Wachsmann, F., Steger, C., Bittner, M., Jungclaus, J., Früh, B., Pankatz, K., Giorgetta, M., Reick, C., Legutke, S., Esch, M., Gayler, V., Haak, H., de Vrese, P., Raddatz, T., Mauritsen, T., von Storch, J.-S., Behrens, J., Brovkin, V., Claussen, M., Crueger, T., Fast, I., Fiedler, S., Hagemann, S., Hohenegger, C., Jahns, T., Kloster, S., Kinne, S., Lasslop, G., Kornblueh, L., Marotzke, J., Matei, D., Meraner, K., Mikolajewicz, U., Modali, K., Müller, W., Nabel, J., Notz, D., Peters-von Gehlen, K., Pincus, R., Pohlmann, H., Pongratz, J., Rast, S., Schmidt, H., Schnur, R., Schulzweida, U., Six, K., Stevens, B., Voigt, A., and Roeckner, E.: DKRZ MPI-ESM1.2-HR model output prepared for CMIP6 ScenarioMIP ssp585, Earth System Grid Federation [data set], https://doi.org/10.22033/ESGF/CMIP6.4403, 2019.
Schwaab, J., Meier, R., Mussetti, G., Seneviratne, S., Bürgi, C., and Davin, E. L.: The role of urban trees in reducing land surface temperatures in European cities, Nat. Commun., 12, 6763, https://doi.org/10.1038/s41467-021-26768-w, 2021.
Schwingshackl, C., Hirschi, M., and Seneviratne, S. I.: A theoretical approach to assess soil moisture–climate coupling across CMIP5 and GLACE-CMIP5 experiments, Earth Syst. Dynam., 9, 1217–1234, https://doi.org/10.5194/esd-9-1217-2018, 2018.
Seferian, R.: CNRM-CERFACS CNRM-ESM2-1 model output prepared for CMIP6 CMIP historical, Earth System Grid Federation [data set], https://doi.org/10.22033/ESGF/CMIP6.4068, 2018.
Séférian, R., Nabat, P., Michou, M., Saint-Martin, D., Voldoire, A., Colin, J., Decharme, B., Delire, C., Berthet, S., Chevallier, M., Sénési, S., Franchisteguy, L., Vial, J., Mallet, M., Joetzjer, E., Geoffroy, O., Guérémy, J.-F., Moine, M.-P., Msadek, R., Ribes, A., Rocher, M., Roehrig, R., Salas-y-Mélia, D., Sanchez, E., Terray, L., Valcke, S., Waldman, R., Aumont, O., Bopp, L., Deshayes, J., Éthé, C., and Madec, G.: Evaluation of CNRM Earth System Model, CNRM-ESM2-1: Role of Earth System Processes in Present-Day and Future Climate, J. Adv. Model. Earth Syst., 11, 4182–4227, https://doi.org/10.1029/2019MS001791, 2019.
Sellar, A. A., Jones, C. G., Mulcahy, J. P., Tang, Y., Yool, A., Wiltshire, A., O'Connor, F. M., Stringer, M., Hill, R., Palmieri, J., Woodward, S., de Mora, L., Kuhlbrodt, T., Rumbold, S. T., Kelley, D. I., Ellis, R., Johnson, C. E., Walton, J., Abraham, N. L., Andrews, M. B., Andrews, T., Archibald, A. T., Berthou, S., Burke, E., Blockley, E., Carslaw, K., Dalvi, M., Edwards, J., Folberth, G. A., Gedney, N., Griffiths, P. T., Harper, A. B., Hendry, M. A., Hewitt, A. J., Johnson, B., Jones, A., Jones, C. D., Keeble, J., Liddicoat, S., Morgenstern, O., Parker, R. J., Predoi, V., Robertson, E., Siahaan, A., Smith, R. S., Swaminathan, R., Woodhouse, M. T., Zeng, G., and Zerroukat, M.: UKESM1: Description and Evaluation of the U.K. Earth System Model, J. Adv. Model. Earth Syst., 11, 4513–4558, https://doi.org/10.1029/2019MS001739, 2019.
Sen, P. K.: Estimates of the Regression Coefficient Based on Kendall's Tau, J. Am. Stat. Assoc., 63, 1379–1389, https://doi.org/10.1080/01621459.1968.10480934, 1968.
Seneviratne, S. I., Lüthi, D., Litschi, M., and Schär, C.: Land–atmosphere coupling and climate change in Europe, Nature, 443, 205–209, https://doi.org/10.1038/nature05095, 2006.
Seneviratne, S. I., Corti, T., Davin, E. L., Hirschi, M., Jaeger, E. B., Lehner, I., Orlowsky, B., and Teuling, A. J.: Investigating soil moisture–climate interactions in a changing climate: A review, Earth-Sci. Rev., 99, 125–161, https://doi.org/10.1016/j.earscirev.2010.02.004, 2010.
Seneviratne, S. I., Donat, M. G., Mueller, B., and Alexander, L. V.: No pause in the increase of hot temperature extremes, Nat. Clim. Change, 4, 161–163, https://doi.org/10.1038/nclimate2145, 2014.
Seneviratne, S. I., Zhang, X., Adnan, M., Badi, W., Dereczynski, C., Di Luca, A., Ghosh, S., Iskandar, I., Kossin, J., Lewis, S., Otto, F., Pinto, I., Satoh, M., Vicente-Serrano, S. M., Wehner, M., and Zhou, B.: Weather and Climate Extreme Events in a Changing Climate, in: Climate Change 2021: The Physical Science Basis. Contribution of Working Group I to the Sixth Assessment Report of the Intergovernmental Panel on Climate Change, edited by: Masson-Delmotte, V., Zhai, P., Pirani, A., Connors, S. L., Péan, C., Berger, S., Caud, N., Chen, Y., Goldfarb, L., Gomis, M. I., Huang, M., Leitzell, K., Lonnoy, E., Matthews, J. B. R., Maycock, T. K., Waterfield, T., Yelekçi, O., Yu, R., and Zhou, B., Cambridge University Press, Cambridge, United Kingdom and New York, NY, USA, 1513–1766, https://doi.org/10.1017/9781009157896.013, 2021.
Sillmann, J., Thorarinsdottir, T., Keenlyside, N., Schaller, N., Alexander, L. V., Hegerl, G., Seneviratne, S. I., Vautard, R., Zhang, X., and Zwiers, F. W.: Understanding, modeling and predicting weather and climate extremes: Challenges and opportunities, Weather Clim. Extrem., 18, 65–74, https://doi.org/10.1016/j.wace.2017.10.003, 2017.
Sippel, S., Zscheischler, J., Mahecha, M. D., Orth, R., Reichstein, M., Vogel, M., and Seneviratne, S. I.: Refining multi-model projections of temperature extremes by evaluation against land–atmosphere coupling diagnostics, Earth Syst. Dynam., 8, 387–403, https://doi.org/10.5194/esd-8-387-2017, 2017.
Stegehuis, A. I., Vogel, M. M., Vautard, R., Ciais, P., Teuling, A. J., and Seneviratne, S. I.: Early Summer Soil Moisture Contribution to Western European Summer Warming, J. Geophys. Res.-Atmos., 126, e2021JD034646, https://doi.org/10.1029/2021JD034646, 2021.
Tang, Y., Rumbold, S., Ellis, R., Kelley, D., Mulcahy, J., Sellar, A., Walton, J., and Jones, C.: MOHC UKESM1.0-LL model output prepared for CMIP6 CMIP historical, Earth System Grid Federation [data set], https://doi.org/10.22033/ESGF/CMIP6.6113, 2019.
Teuling, A. J.: A hot future for European droughts, Nat. Clim. Change, 8, 364–365, https://doi.org/10.1038/s41558-018-0154-5, 2018.
Teuling, A. J., Seneviratne, S. I., Stöckli, R., Reichstein, M., Moors, E., Ciais, P., Luyssaert, S., van den Hurk, B., Ammann, C., Bernhofer, C., Dellwik, E., Gianelle, D., Gielen, B., Grünwald, T., Klumpp, K., Montagnani, L., Moureaux, C., Sottocornola, M., and Wohlfahrt, G.: Contrasting response of European forest and grassland energy exchange to heatwaves, Nat. Geosci., 3, 722–727, https://doi.org/10.1038/ngeo950, 2010.
Theil, H.: A Rank-Invariant Method of Linear and Polynomial Regression Analysis, in: Henri Theil's Contributions to Economics and Econometrics: Econometric Theory and Methodology, edited by: Raj, B. and Koerts, J., Springer Netherlands, Dordrecht, 345–381, https://doi.org/10.1007/978-94-011-2546-8_20, 1992.
Thorarinsdottir, T. L., Sillmann, J., Haugen, M., Gissibl, N., and Sandstad, M.: Evaluation of CMIP5 and CMIP6 simulations of historical surface air temperature extremes using proper evaluation methods, Environ. Res. Lett., 15, 124041, https://doi.org/10.1088/1748-9326/abc778, 2020.
Trenberth, K. E., Fasullo, J. T., and Shepherd, T. G.: Attribution of climate extreme events, Nat. Clim. Change, 5, 725–730, https://doi.org/10.1038/nclimate2657, 2015.
Ukkola, A. M., Kauwe, M. G. D., Pitman, A. J., Best, M. J., Abramowitz, G., Haverd, V., Decker, M., and Haughton, N.: Land surface models systematically overestimate the intensity, duration and magnitude of seasonal-scale evaporative droughts, Environ. Res. Lett., 11, 104012, https://doi.org/10.1088/1748-9326/11/10/104012, 2016a.
Ukkola, A. M., Prentice, I. C., Keenan, T. F., van Dijk, A. I. J. M., Viney, N. R., Myneni, R. B., and Bi, J.: Reduced streamflow in water-stressed climates consistent with CO2 effects on vegetation, Nat. Clim. Change, 6, 75–78, https://doi.org/10.1038/nclimate2831, 2016b.
Ukkola, A. M., Pitman, A. J., Donat, M. G., De Kauwe, M. G., and Angélil, O.: Evaluating the Contribution of Land-Atmosphere Coupling to Heat Extremes in CMIP5 Models, Geophys. Res. Lett., 45, 9003–9012, https://doi.org/10.1029/2018GL079102, 2018.
Vogel, M. M., Orth, R., Cheruy, F., Hagemann, S., Lorenz, R., van den Hurk, B. J. J. M., and Seneviratne, S. I.: Regional amplification of projected changes in extreme temperatures strongly controlled by soil moisture-temperature feedbacks, Geophys. Res. Lett., 44, 1511–1519, https://doi.org/10.1002/2016GL071235, 2017.
Vogel, M. M., Zscheischler, J., and Seneviratne, S. I.: Varying soil moisture–atmosphere feedbacks explain divergent temperature extremes and precipitation projections in central Europe, Earth Syst. Dynam., 9, 1107–1125, https://doi.org/10.5194/esd-9-1107-2018, 2018.
Vogel, M. M., Zscheischler, J., Wartenburger, R., Dee, D., and Seneviratne, S. I.: Concurrent 2018 Hot Extremes Across Northern Hemisphere Due to Human-Induced Climate Change, Earths Future, 7, 692–703, https://doi.org/10.1029/2019EF001189, 2019.
Vogel, M. M., Hauser, M., and Seneviratne, S. I.: Projected changes in hot, dry and wet extreme events' clusters in CMIP6 multi-model ensemble, Environ. Res. Lett., 15, 094021, https://doi.org/10.1088/1748-9326/ab90a7, 2020.
Voldoire, A.: CMIP6 simulations of the CNRM-CERFACS based on CNRM-CM6-1 model for CMIP experiment historical, Earth System Grid Federation [data set], https://doi.org/10.22033/ESGF/CMIP6.4066, 2018.
Voldoire, A.: CNRM-CERFACS CNRM-CM6-1 model output prepared for CMIP6 ScenarioMIP ssp585, Earth System Grid Federation [data set], https://doi.org/10.22033/ESGF/CMIP6.4224, 2019a.
Voldoire, A.: CNRM-CERFACS CNRM-ESM2-1 model output prepared for CMIP6 ScenarioMIP ssp585, Earth System Grid Federation [data set], https://doi.org/10.22033/ESGF/CMIP6.4226, 2019b.
Voldoire, A., Saint-Martin, D., Sénési, S., Decharme, B., Alias, A., Chevallier, M., Colin, J., Guérémy, J.-F., Michou, M., Moine, M.-P., Nabat, P., Roehrig, R., Salas y Mélia, D., Séférian, R., Valcke, S., Beau, I., Belamari, S., Berthet, S., Cassou, C., Cattiaux, J., Deshayes, J., Douville, H., Ethé, C., Franchistéguy, L., Geoffroy, O., Lévy, C., Madec, G., Meurdesoif, Y., Msadek, R., Ribes, A., Sanchez-Gomez, E., Terray, L., and Waldman, R.: Evaluation of CMIP6 DECK Experiments With CNRM-CM6-1, J. Adv. Model. Earth Syst., 11, 2177–2213, https://doi.org/10.1029/2019MS001683, 2019.
Walker, A. P., De Kauwe, M. G., Bastos, A., Belmecheri, S., Georgiou, K., Keeling, R. F., McMahon, S. M., Medlyn, B. E., Moore, D. J. P., Norby, R. J., Zaehle, S., Anderson-Teixeira, K. J., Battipaglia, G., Brienen, R. J. W., Cabugao, K. G., Cailleret, M., Campbell, E., Canadell, J. G., Ciais, P., Craig, M. E., Ellsworth, D. S., Farquhar, G. D., Fatichi, S., Fisher, J. B., Frank, D. C., Graven, H., Gu, L., Haverd, V., Heilman, K., Heimann, M., Hungate, B. A., Iversen, C. M., Joos, F., Jiang, M., Keenan, T. F., Knauer, J., Körner, C., Leshyk, V. O., Leuzinger, S., Liu, Y., MacBean, N., Malhi, Y., McVicar, T. R., Penuelas, J., Pongratz, J., Powell, A. S., Riutta, T., Sabot, M. E. B., Schleucher, J., Sitch, S., Smith, W. K., Sulman, B., Taylor, B., Terrer, C., Torn, M. S., Treseder, K. K., Trugman, A. T., Trumbore, S. E., van Mantgem, P. J., Voelker, S. L., Whelan, M. E., and Zuidema, P. A.: Integrating the evidence for a terrestrial carbon sink caused by increasing atmospheric CO2, New Phytol., 229, 2413–2445, https://doi.org/10.1111/nph.16866, 2021.
Wieners, K.-H., Giorgetta, M., Jungclaus, J., Reick, C., Esch, M., Bittner, M., Legutke, S., Schupfner, M., Wachsmann, F., Gayler, V., Haak, H., de Vrese, P., Raddatz, T., Mauritsen, T., von Storch, J.-S., Behrens, J., Brovkin, V., Claussen, M., Crueger, T., Fast, I., Fiedler, S., Hagemann, S., Hohenegger, C., Jahns, T., Kloster, S., Kinne, S., Lasslop, G., Kornblueh, L., Marotzke, J., Matei, D., Meraner, K., Mikolajewicz, U., Modali, K., Müller, W., Nabel, J., Notz, D., Peters-von Gehlen, K., Pincus, R., Pohlmann, H., Pongratz, J., Rast, S., Schmidt, H., Schnur, R., Schulzweida, U., Six, K., Stevens, B., Voigt, A., and Roeckner, E.: MPI-M MPI-ESM1.2-LR model output prepared for CMIP6 CMIP historical, Earth System Grid Federation [data set], https://doi.org/10.22033/ESGF/CMIP6.6595, 2019a.
Wieners, K.-H., Giorgetta, M., Jungclaus, J., Reick, C., Esch, M., Bittner, M., Gayler, V., Haak, H., de Vrese, P., Raddatz, T., Mauritsen, T., von Storch, J.-S., Behrens, J., Brovkin, V., Claussen, M., Crueger, T., Fast, I., Fiedler, S., Hagemann, S., Hohenegger, C., Jahns, T., Kloster, S., Kinne, S., Lasslop, G., Kornblueh, L., Marotzke, J., Matei, D., Meraner, K., Mikolajewicz, U., Modali, K., Müller, W., Nabel, J., Notz, D., Peters-von Gehlen, K., Pincus, R., Pohlmann, H., Pongratz, J., Rast, S., Schmidt, H., Schnur, R., Schulzweida, U., Six, K., Stevens, B., Voigt, A., and Roeckner, E.: MPI-M MPI-ESM1.2-LR model output prepared for CMIP6 ScenarioMIP ssp585, Earth System Grid Federation [data set], https://doi.org/10.22033/ESGF/CMIP6.6705, 2019b.
Williams, K. D., Copsey, D., Blockley, E. W., Bodas-Salcedo, A., Calvert, D., Comer, R., Davis, P., Graham, T., Hewitt, H. T., Hill, R., Hyder, P., Ineson, S., Johns, T. C., Keen, A. B., Lee, R. W., Megann, A., Milton, S. F., Rae, J. G. L., Roberts, M. J., Scaife, A. A., Schiemann, R., Storkey, D., Thorpe, L., Watterson, I. G., Walters, D. N., West, A., Wood, R. A., Woollings, T., and Xavier, P. K.: The Met Office Global Coupled Model 3.0 and 3.1 (GC3.0 and GC3.1) Configurations, J. Adv. Model. Earth Syst., 10, 357–380, https://doi.org/10.1002/2017MS001115, 2018.
Wouters, H., Keune, J., Petrova, I. Y., van Heerwaarden, C. C., Teuling, A. J., Pal, J. S., Vilà-Guerau de Arellano, J., and Miralles, D. G.: Soil drought can mitigate deadly heat stress thanks to a reduction of air humidity, Sci. Adv., 8, eabe6653, https://doi.org/10.1126/sciadv.abe6653, 2022.
Wu, T., Chu, M., Dong, M., Fang, Y., Jie, W., Li, J., Li, W., Liu, Q., Shi, X., Xin, X., Yan, J., Zhang, F., Zhang, J., Zhang, L., and Zhang, Y.: BCC BCC-CSM2MR model output prepared for CMIP6 CMIP historical, Earth System Grid Federation [data set], https://doi.org/10.22033/ESGF/CMIP6.2948, 2018.
Wu, T., Lu, Y., Fang, Y., Xin, X., Li, L., Li, W., Jie, W., Zhang, J., Liu, Y., Zhang, L., Zhang, F., Zhang, Y., Wu, F., Li, J., Chu, M., Wang, Z., Shi, X., Liu, X., Wei, M., Huang, A., Zhang, Y., and Liu, X.: The Beijing Climate Center Climate System Model (BCC-CSM): the main progress from CMIP5 to CMIP6, Geosci. Model Dev., 12, 1573–1600, https://doi.org/10.5194/gmd-12-1573-2019, 2019.
Xin, X., Wu, T., Shi, X., Zhang, F., Li, J., Chu, M., Liu, Q., Yan, J., Ma, Q., and Wei, M.: BCC BCC-CSM2MR model output prepared for CMIP6 ScenarioMIP ssp370, Earth System Grid Federation [data set], https://doi.org/10.22033/ESGF/CMIP6.3035, 2019.
Yukimoto, S., Koshiro, T., Kawai, H., Oshima, N., Yoshida, K., Urakawa, S., Tsujino, H., Deushi, M., Tanaka, T., Hosaka, M., Yoshimura, H., Shindo, E., Mizuta, R., Ishii, M., Obata, A., and Adachi, Y.: MRI MRI-ESM2.0 model output prepared for CMIP6 CMIP historical, Earth System Grid Federation [data set], https://doi.org/10.22033/ESGF/CMIP6.6842, 2019a.
Yukimoto, S., Koshiro, T., Kawai, H., Oshima, N., Yoshida, K., Urakawa, S., Tsujino, H., Deushi, M., Tanaka, T., Hosaka, M., Yoshimura, H., Shindo, E., Mizuta, R., Ishii, M., Obata, A., and Adachi, Y.: MRI MRI-ESM2.0 model output prepared for CMIP6 ScenarioMIP ssp585, Earth System Grid Federation [data set], https://doi.org/10.22033/ESGF/CMIP6.6929, 2019b.
Yukimoto, S., Kawai, H., Koshiro, T., Oshima, N., Yoshida, K., Urakawa, S., Tsujino, H., Deushi, M., Tanaka, T., Hosaka, M., Yabu, S., Yoshimura, H., Shindo, E., Mizuta, R., Obata, A., Adachi, Y., and Ishii, M.: The Meteorological Research Institute Earth System Model Version 2.0, MRI-ESM2.0: Description and Basic Evaluation of the Physical Component, J. Meteorol. Soc. Jpn. Ser. II, 97, 931–965, https://doi.org/10.2151/jmsj.2019-051, 2019c.
Zhu, Z., Piao, S., Myneni, R. B., Huang, M., Zeng, Z., Canadell, J. G., Ciais, P., Sitch, S., Friedlingstein, P., Arneth, A., Cao, C., Cheng, L., Kato, E., Koven, C., Li, Y., Lian, X., Liu, Y., Liu, R., Mao, J., Pan, Y., Peng, S., Peñuelas, J., Poulter, B., Pugh, T. A. M., Stocker, B. D., Viovy, N., Wang, X., Wang, Y., Xiao, Z., Yang, H., Zaehle, S., and Zeng, N.: Greening of the Earth and its drivers, Nat. Clim. Change, 6, 791–795, https://doi.org/10.1038/nclimate3004, 2016.
Ziehn, T., Chamberlain, M., Lenton, A., Law, R., Bodman, R., Dix, M., Wang, Y., Dobrohotoff, P., Srbinovsky, J., Stevens, L., Vohralik, P., Mackallah, C., Sullivan, A., O'Farrell, S., and Druken, K.: CSIRO ACCESS-ESM1.5 model output prepared for CMIP6 CMIP historical, Earth System Grid Federation [data set], https://doi.org/10.22033/ESGF/CMIP6.4272, 2019a.
Ziehn, T., Chamberlain, M., Lenton, A., Law, R., Bodman, R., Dix, M., Wang, Y., Dobrohotoff, P., Srbinovsky, J., Stevens, L., Vohralik, P., Mackallah, C., Sullivan, A., O'Farrell, S., and Druken, K.: CSIRO ACCESS-ESM1.5 model output prepared for CMIP6 ScenarioMIP ssp585, Earth System Grid Federation [data set], https://doi.org/10.22033/ESGF/CMIP6.4333, 2019b.
Ziehn, T., Chamberlain, M. A., Law, R. M., Lenton, A., Bodman, R. W., Dix, M., Stevens, L., Wang, Y.-P., Srbinovsky, J., Ziehn, T., Chamberlain, M. A., Law, R. M., Lenton, A., Bodman, R. W., Dix, M., Stevens, L., Wang, Y.-P., and Srbinovsky, J.: The Australian Earth System Model: ACCESS-ESM1.5, J. South. Hemisphere Earth Syst. Sci., 70, 193–214, https://doi.org/10.1071/ES19035, 2020.