the Creative Commons Attribution 4.0 License.
the Creative Commons Attribution 4.0 License.
 | 14 Aug 2023
Evaluating nitrogen cycling in terrestrial biosphere models: a disconnect between the carbon and nitrogen cycles
Sian Kou-Giesbrecht
Vivek K. Arora
Christian Seiler
Almut Arneth
Stefanie Falk
Atul K. Jain
Fortunat Joos
Daniel Kennedy
Jürgen Knauer
Stephen Sitch
Michael O'Sullivan
Naiqing Pan
Hanqin Tian
Nicolas Vuichard
Sönke Zaehle
Terrestrial carbon (C) sequestration is limited by nitrogen (N), an empirically established constraint that could intensify under CO2 fertilization and future global change. The terrestrial C sink is estimated to currently sequester approximately a third of annual anthropogenic CO2 emissions based on an ensemble of terrestrial biosphere models, which have been evaluated in their ability to reproduce observations of the C, water, and energy cycles. However, their ability to reproduce observations of N cycling and thus the regulation of terrestrial C sequestration by N have been largely unexplored. Here, we evaluate an ensemble of terrestrial biosphere models with coupled C–N cycling and their performance at simulating N cycling, outlining a framework for evaluating N cycling that can be applied across terrestrial biosphere models. We find that models exhibit significant variability across N pools and fluxes, simulating different magnitudes and trends over the historical period, despite their ability to generally reproduce the historical terrestrial C sink. Furthermore, there are no significant correlations between model performance in simulating N cycling and model performance in simulating C cycling, nor are there significant differences in model performance between models with different representations of fundamental N cycling processes. This suggests that the underlying N processes that regulate terrestrial C sequestration operate differently across models and appear to be disconnected from C cycling. Models tend to overestimate tropical biological N fixation, vegetation C : N ratio, and soil C : N ratio but underestimate temperate biological N fixation relative to observations. However, there is significant uncertainty associated with measurements of N cycling processes given their scarcity (especially relative to those of C cycling processes) and their high spatiotemporal variability. Overall, our results suggest that terrestrial biosphere models that represent coupled C–N cycling could be overestimating C storage per unit N, which could lead to biases in projections of the future terrestrial C sink under CO2 fertilization and future global change (let alone those without a representation of N cycling). More extensive observations of N cycling processes and comparisons against experimental manipulations are crucial to evaluate N cycling and its impact on C cycling and guide its development in terrestrial biosphere models.
- Article
(8438 KB) - Full-text XML
- Companion paper
- BibTeX
- EndNote


The terrestrial biosphere is estimated by the Global Carbon Project (GCP) to currently sequester approximately a third of anthropogenic CO2 emissions (Friedlingstein et al., 2022). The GCP annually reports an estimate of the global carbon (C) budget, which includes an estimate of the atmosphere–land CO2 flux based on simulations of an ensemble of terrestrial biosphere models – the trends in the land carbon cycle project (TRENDY) ensemble. In recent years, the majority of the models within the TRENDY ensemble have incorporated a representation of coupled C and nitrogen (N) cycling given the empirically established importance of N limitation of vegetation growth (Elser et al., 2007; LeBauer and Treseder, 2008; Wright et al., 2018). Whereas only 4 out of 9 models represented coupled C–N cycling in the 2013 GCP, 11 out of 16 models represented coupled C–N cycling in the 2022 GCP (Fig. 1). Capturing N constraints on C cycling is critical for realistically simulating the terrestrial C sink, which arises from the combined effects of concurrently acting global change drivers that are each modulated by N. CO2 fertilization is limited by N (Terrer et al., 2019; S. Wang et al., 2020), intensifying N deposition increases N supply (O'Sullivan et al., 2019; Wang et al., 2017), rising temperature and varying precipitation modulate decomposition and soil N availability (Liu et al., 2017), and land use change and associated N fertilization regimes determine N supply to crops.
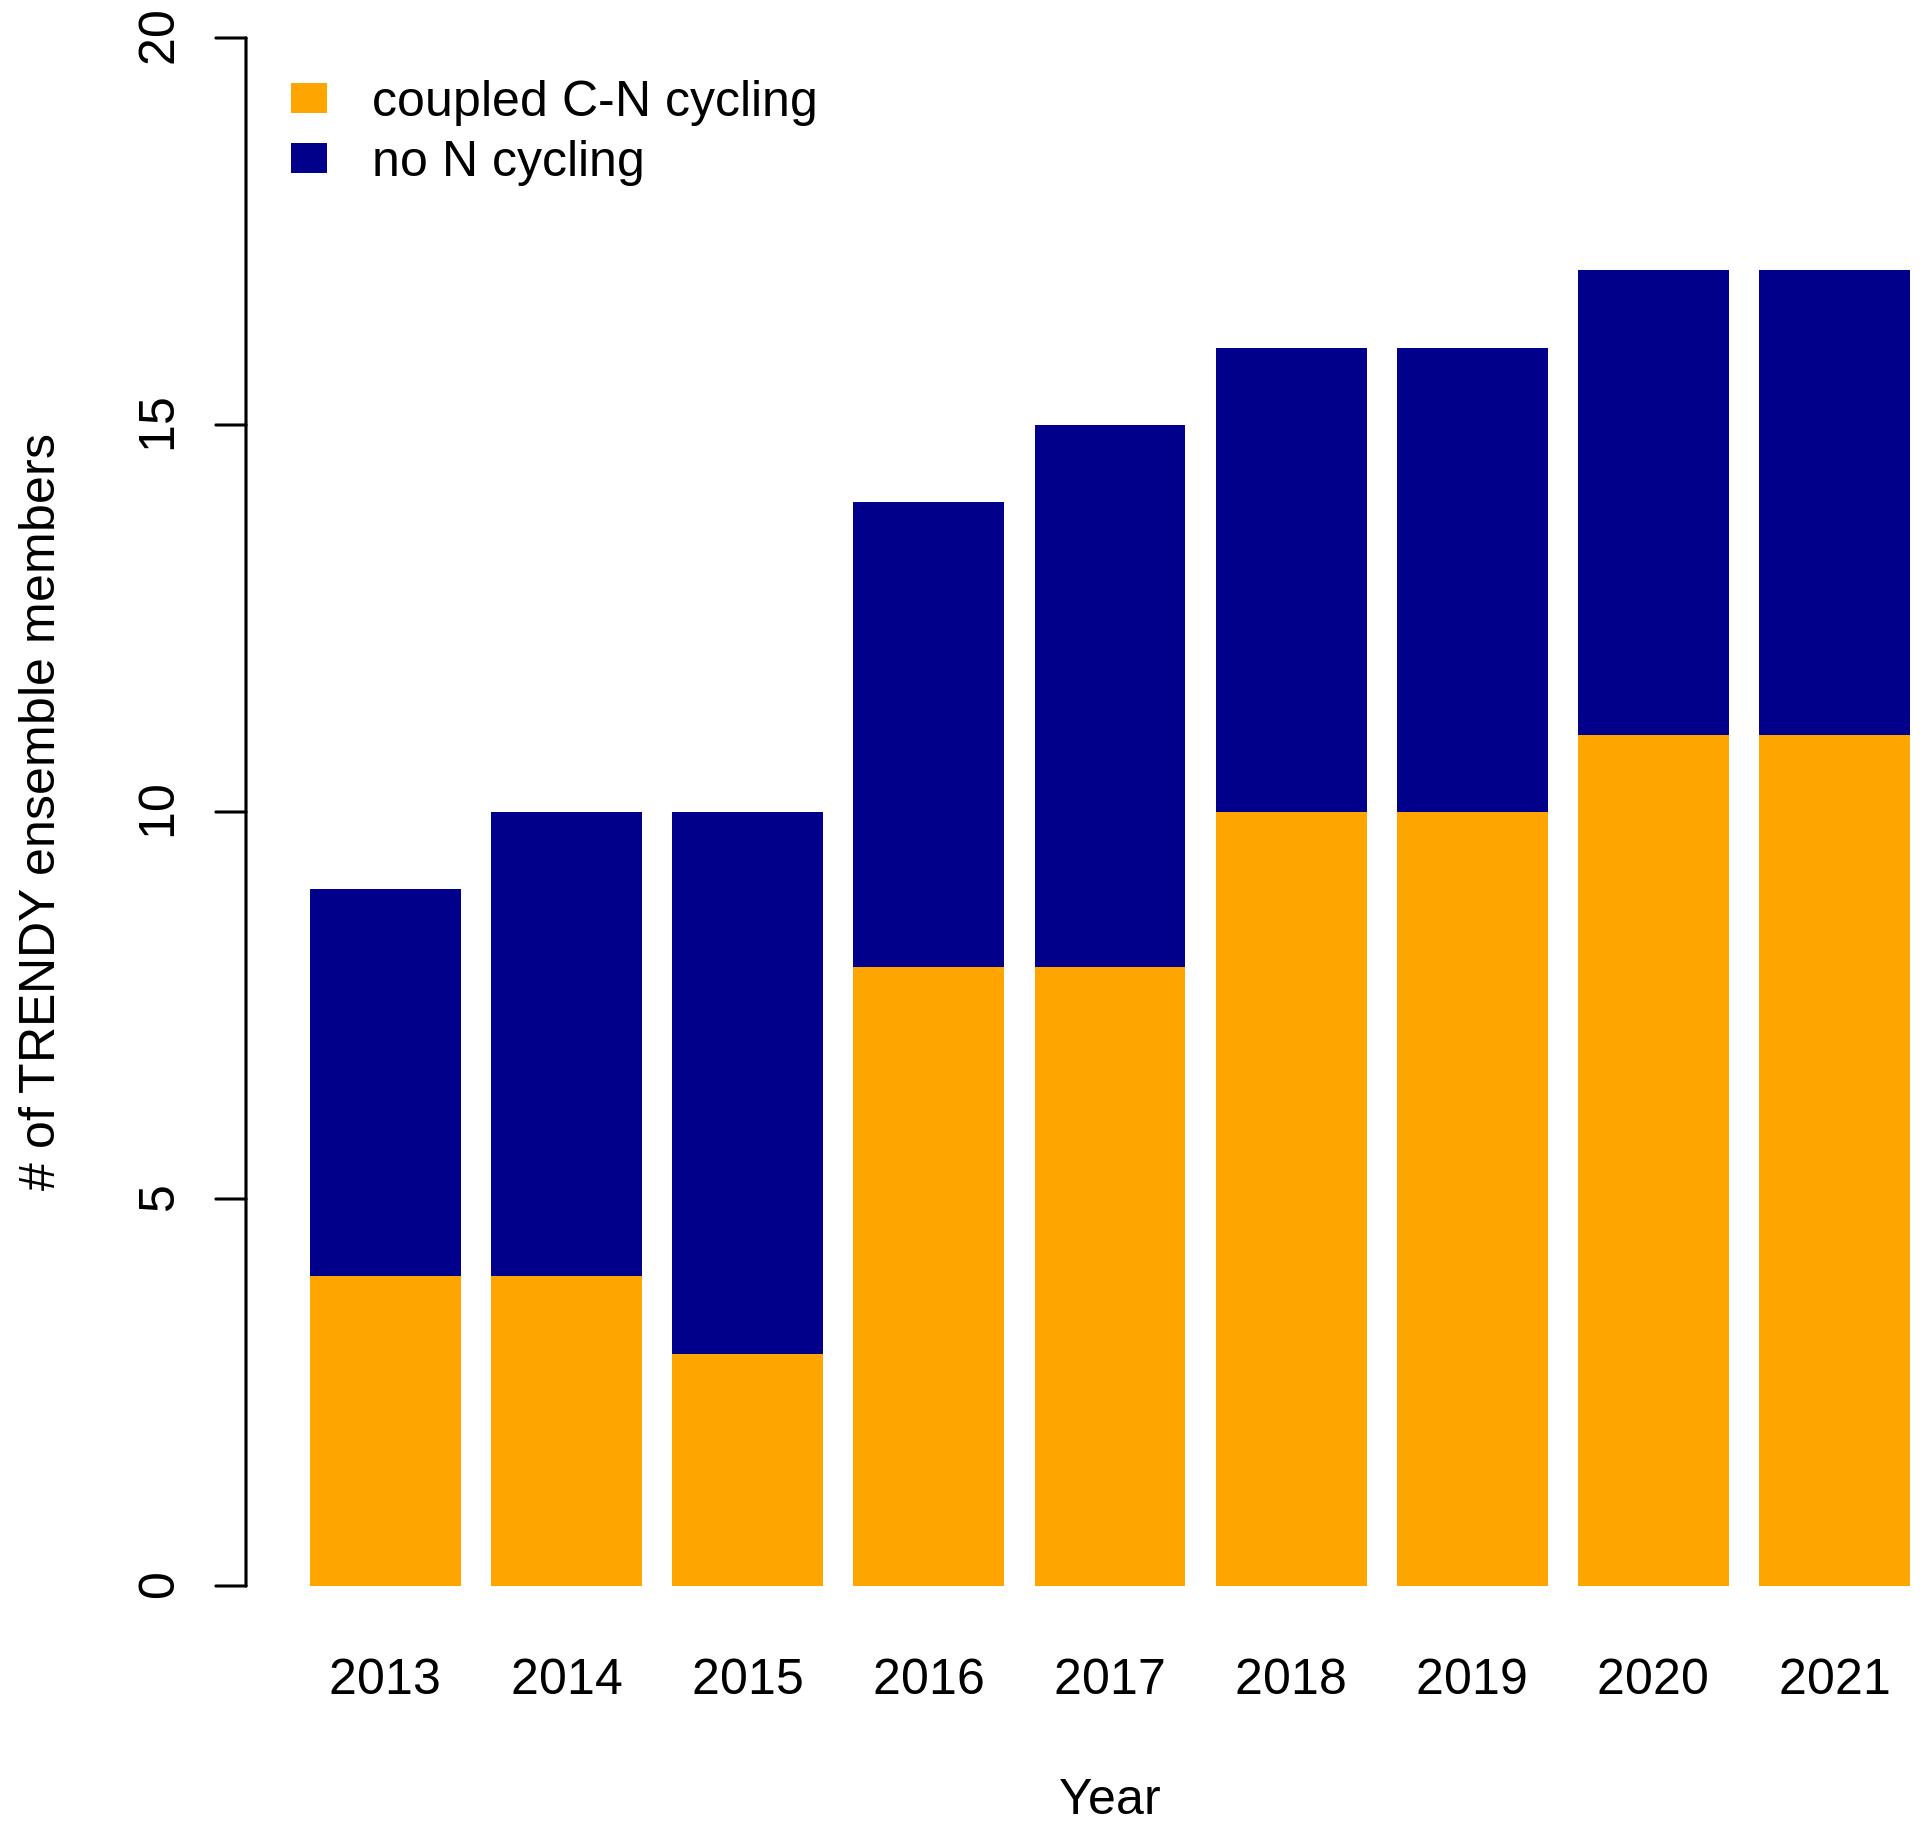
Figure 1Number of terrestrial biosphere models contributing to the Global Carbon Project (the TRENDY ensemble) with and without coupled C–N cycling.
The TRENDY ensemble has been extensively evaluated against observations of the C, water, and energy cycles (Collier et al., 2018; Friedlingstein et al., 2022; Seiler et al., 2022). Within the GCP itself, the primary simulated C pools, C fluxes, and water fluxes are evaluated using a skill score system developed by the International Land Model Benchmarking (ILAMB) project that quantifies model performance by comparing model simulations to observations (Collier et al., 2018; Friedlingstein et al., 2022). ILAMB scores encompass the mean and variability of a given variable (pool or flux) over monthly to decadal temporal scales and over grid cell to global spatial scales. However, despite its importance in regulating C cycling, N cycling has not been explicitly evaluated. This is in part due to the relatively recent incorporation of N cycling in terrestrial biosphere models (Fig. 1) (Fisher and Koven, 2020; Hungate et al., 2003) but also due to the paucity of global observation-based datasets of N cycling. N exists in many forms and is lost from terrestrial ecosystems via numerous pathways (emissions of NH3, N2O, NOx, and N2, as well as NO and NH leaching), N processes are generally not measured in situ in networks such as FLUXNET, and remote sensing methodologies for measuring N processes are still in their infancy. Additionally, N processes exhibit extremely high spatial and temporal variabilities and are thus challenging to measure. As such, N cycling has commonly been evaluated by comparing simulated N pools and fluxes to global totals based on a small number of observations that have been scaled up or averaged to yield a value with wide confidence intervals (Davies-Barnard et al., 2020).
N cycling is implicitly evaluated by comparing terrestrial biosphere models without N cycling to those with coupled C–N cycling in reproducing observations of the C, water, and energy cycles in the absence of N cycle observations. Results suggest that there are only minor differences between the performance of models with and without N cycling. There is no significant difference between the terrestrial C sink simulated by the TRENDY models with and without N cycling (Friedlingstein et al., 2022) or between the terrestrial C sink simulated by the models participating in the Multi-scale synthesis and Terrestrial Model Intercomparison Project (MsTMIP) with and without N cycling (Huntzinger et al., 2017). Comparing the mean score across all C, water, and energy cycle variables between TRENDY models with and without N cycling yielded no significant difference (Seiler et al., 2022). However, TRENDY models without N cycling had significantly higher scores for net biome productivity than TRENDY models with N cycling (although all other variables were not significantly different between TRENDY models with and without N cycling, including vegetation C, soil C, net biome productivity, leaf area index, latent heat flux, and runoff) (Seiler et al., 2022). Despite this seeming absence of a difference between models with and without coupled C–N cycling in simulating the current terrestrial C sink, it is imperative that N constraints on C cycling are properly represented by terrestrial biosphere models in order to realistically simulate the terrestrial C sink under future global change, which modifies the C–N balance through N limitation of CO2 fertilization and intensifying N deposition among other effects of global change. As such, explicitly evaluating N cycling processes themselves is necessary to assess the ability of terrestrial biosphere models to capture the underlying mechanisms that determine terrestrial C sequestration and thus to realistically project the future terrestrial C sink under global change.
Here, we synthesize the N pools and fluxes simulated by 11 terrestrial biosphere models in the TRENDY ensemble that participated in the 2022 GCP. We evaluate their performance in reproducing observations of three key variables of the N cycle: biological N fixation, vegetation C : N ratio, and soil C : N ratio. These three variables are critical to C cycling because (1) biological N fixation is the dominant natural N supply to terrestrial ecosystems, influencing the degree of N limitation of plant growth and thus terrestrial C sequestration, and (2) vegetation and soil C : N ratios reflect assimilated C per unit N and thus terrestrial C storage.
2.1 Simulation protocol
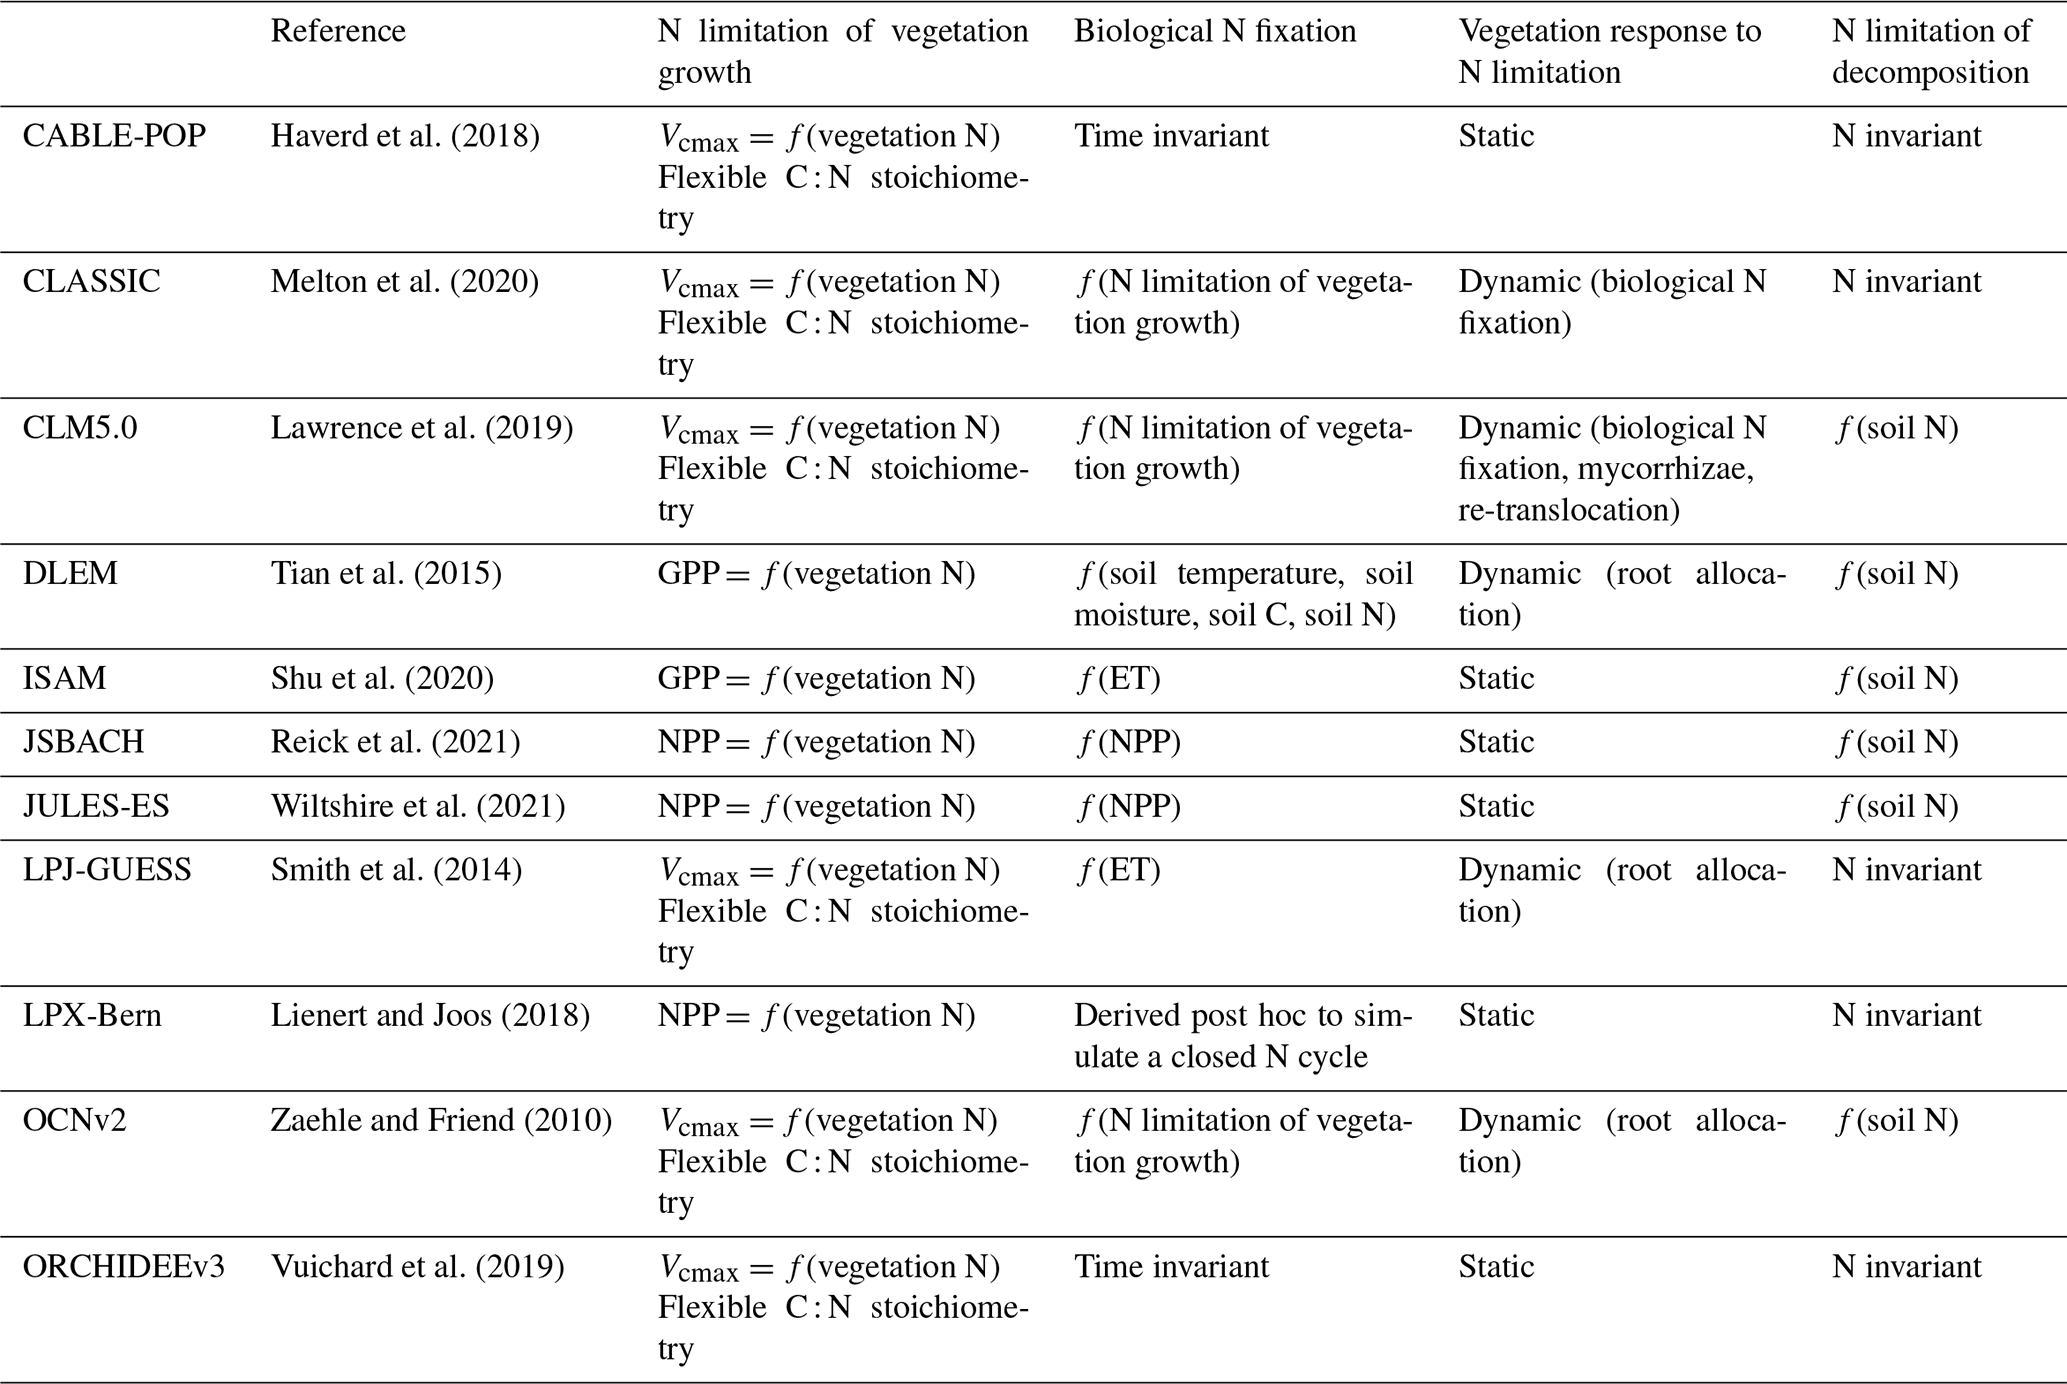
For the 2022 GCP (version 11), the TRENDY ensemble consisted of 16 terrestrial biosphere models, 11 of which represent N cycling (CABLE-POP, CLM5.0, DLEM, ISAM, JSBACH, JULES-ES, LPJ-GUESS, LPX-Bern, OCNv2, ORCHIDEEv3, and SDGVM). Although SDGVM includes a representation of N cycling, its representation is simplistic and was therefore not included. Additionally, CLASSIC contributed to the 2022 GCP without coupled C–N cycling; the S3 simulation from the TRENDY protocol was repeated by CLASSIC with coupled C–N cycling following the 2022 GCP protocol and was used here. Overall, we analysed 11 models with coupled C–N cycling (Table 1).
Table 1Terrestrial biosphere models in the TRENDY-N ensemble and descriptions of their representations of N limitation of vegetation growth, biological N fixation, vegetation response to N limitation (i.e., strategies in which vegetation invests C to increase N supply in N-limited conditions), and N limitation of decomposition.
We analysed the S3 simulation from the TRENDY protocol, which includes historical changes in atmospheric CO2, climate, N deposition, N fertilization, and land use from 1851 to 2021 (see Friedlingstein et al., 2022, for a full description of the simulation protocol). Briefly, models were forced with atmospheric CO2 from Dlugokencky and Tans (2022); the merged monthly Climate Research Unit (CRU), 6-hourly Japanese 55-year Reanalysis (JRA-55) dataset, or the monthly CRU dataset from Harris et al. (2020); N deposition from Hegglin et al. (2016) and Tian et al. (2022); N fertilization from the global N2O Model Intercomparison Project (NMIP) (Tian et al., 2018); and land use from the LUH2-GCB2022 (Land-Use Harmonization 2) dataset (Chini et al., 2021; Hurtt et al., 2020; Klein Goldewijk et al., 2017a, b). We interpolated outputs from all models to a common resolution of 1∘ × 1∘ using bilinear interpolation.
2.2 Terrestrial biosphere model descriptions
The terrestrial biosphere models in the TRENDY ensemble employ a wide variety of assumptions and formulations of N cycling processes, reflecting knowledge gaps and divergent theories (Table 1). Here we describe four fundamental aspects of N cycling for each terrestrial biosphere model: N limitation of vegetation growth, biological N fixation, the response of vegetation to N limitation (i.e., strategies in which vegetation invests C to increase N supply in N-limited conditions), and N limitation of decomposition. These have been identified as important challenges for representing N cycling in terrestrial biosphere models (Meyerholt et al., 2020; Peng et al., 2020; Stocker et al., 2016; Wieder et al., 2015a; Zaehle et al., 2015; Zaehle and Dalmonech, 2011).
Terrestrial biosphere models differ in how N limitation of vegetation growth is represented (Thomas et al., 2015). Some TRENDY models represent flexible C : N stoichiometry and modelled maximum carboxylation rate of photosynthesis (Vcmax) decreases with decreasing leaf N (CABLE-POP, CLASSIC, CLM5.0, LPJ-GUESS, OCNv2, ORCHIDEEv3) following empirical evidence (Walker et al., 2014). Other TRENDY models represent time-invariant C : N stoichiometry and modelled gross primary productivity (GPP) or net primary productivity (NPP) decreases with N limitation (DLEM, ISAM, JSBACH, JULES-ES, and LPX-Bern). Importantly, flexible vs. time-invariant C : N stoichiometry determines terrestrial C storage per unit N.
Biological N fixation is the dominant natural N supply to terrestrial ecosystems (Vitousek et al., 2013). In terrestrial biosphere models, biological N fixation has generally been represented phenomenologically as a function of either NPP or evapotranspiration (ET) (Cleveland et al., 1999). More recently, representations of biological N fixation have been updated such that it is up-regulated in N-limited conditions following empirical evidence (Menge et al., 2015; Vitousek et al., 2013; Zheng et al., 2019). The majority of TRENDY models represent biological N fixation phenomenologically (ISAM, JSBACH, JULES-ES, and LPJ-GUESS). Three TRENDY models (CLASSIC, CLM5.0, and OCNv2) represent biological N fixation mechanistically such that it increases with N limitation of vegetation and has an associated C cost per unit N fixed (Kou-Giesbrecht and Arora, 2022; Lawrence et al., 2019; Meyerholt et al., 2016; Shi et al., 2016; Fisher et al., 2010). These representations separate free-living biological N fixation (via soil microbes, epiphytic microbes, lichens, bryophytes, etc.; Reed et al., 2011) from symbiotic biological N fixation, which is regulated by N limitation of vegetation. DLEM derives biological N fixation as a function of soil temperature, soil moisture, soil C, and soil N. LPX-Bern derives biological N fixation post hoc to simulate a closed N cycle, implicitly including rock N sources (Joos et al., 2020). Finally, CABLE-POP and ORCHIDEEv3 represent biological N fixation as a specified time-invariant input over the historical period. Importantly, representing the regulation of biological N fixation by N limitation not only determines biological N fixation itself but also modulates terrestrial C sequestration: it enables vegetation to increase N uptake in N-limited conditions, reduce N limitation, and sustain terrestrial C sequestration. Some TRENDY models (DLEM, LPJ-GUESS, and OCNv2) also represent increasing C allocation to roots with increasing N limitation (Smith et al., 2014; Zaehle and Friend, 2010) following empirical evidence (Poorter et al., 2012). This enables vegetation to also increase root N uptake in N-limited conditions, reduce N limitation, and sustain terrestrial C sequestration. The response of vegetation to N limitation, which could also include increased C allocation to mycorrhizae (Phillips et al., 2013) (represented in CLM5.0) or increased re-translocation of N during tissue turnover (Du et al., 2020; Han et al., 2013; Kobe et al., 2005) (represented in CLM5.0), is important for determining terrestrial C sequestration.
The decomposition rate is controlled by soil temperature, soil moisture, and N content in litter, where increasing litter C : N ratio decreases the decomposition rate (Cotrufo et al., 2013). Some TRENDY models represent this reduction in decomposition rate with increasing litter C : N ratio (CLM5.0, DLEM, ISAM, JSBACH, JULES-ES, and OCNv2) following empirical evidence.
2.3 Observation-based datasets
We interpolated observation-based datasets to a common resolution of 1∘ × 1∘ using bilinear interpolation for comparison against model outputs. To compare model outputs against observation-based datasets we averaged model outputs over 1980–2021, which spans the period in which most measurements were made.
2.3.1 Biological N fixation
A biological N fixation observation-based dataset was derived from Davies-Barnard and Friedlingstein (2020), a global meta-analysis of field measurements of natural biological N fixation (free-living and symbiotic) that scales biome-specific means onto the Collection 5 MODIS Global Land Cover Type International Geosphere-Biosphere Programme (IGBP) product (Friedl et al., 2010). This dataset includes agricultural biological N fixation and assumes that crop biological N fixation rates are equivalent to those of grasses.
The score of LPX-Bern in simulating biological N fixation is not analysed because it implicitly includes rock N sources and is thus not directly comparable to the observation-based dataset.
2.3.2 Vegetation C : N ratio
A vegetation C : N ratio observation-based dataset was derived by scaling biome-specific means for vegetation C : N ratios from the TRY plant trait database (Kattge et al., 2020) onto the Collection 5 MODIS Global Land Cover Type IGBP product (Friedl et al., 2010) and combining it with the remote sensing leaf N content product from Moreno-Martínez et al. (2018). First, we obtained N content per dry mass for leaves, roots, and stems and C content per dry mass for leaves, roots, and stems from the TRY plant trait database. We selected entries that reported species. Second, we obtained the plant functional type (PFT) for each species from the TRY plant trait database. We categorized each PFT into the IGBP land cover types (Table A1 in the Appendix) and then used this to categorize each entry into the IGBP land cover types using species. We averaged across entries in each IGBP land cover type. Third, we divided mean tissue C content per tissue dry mass by mean tissue N content per tissue dry mass for each tissue and for each IGBP land cover type. Fourth, we weighed each tissue by its PFT-specific fraction of total biomass from Poorter et al. (2012) to obtain the total vegetation C : N ratio for each IGBP land cover type. Fifth, we scaled total vegetation C : N ratio and leaf N content per dry mass for each IGBP land cover type to the Collection 5 MODIS Global Land Cover Type IGBP product. Sixth, we multiplied derived total vegetation C : N ratio relative to leaf N content per dry mass by the remote sensing leaf N content per dry mass product (Moreno-Martínez et al., 2018) to obtain a vegetation C : N ratio observation-based dataset.
2.3.3 Soil C : N ratio
A soil C : N ratio observation-based dataset was derived from soil C and soil N products from SoilGrids (Poggio et al., 2021), which provides globally gridded datasets of soil organic C and total soil N at a 250 m × 250 m resolution for six layers up to a depth of 200 cm. These estimates are derived using machine learning methods and soil observations from 240 000 locations across the globe and over 400 environmental covariates. We summed soil C over all layers and soil N over all layers (using the bulk density and depth of each layer) and then obtained the soil C : N ratio.
2.3.4 C cycling variables
In addition to evaluating N cycling variables, we also evaluated the primary C cycling variables: GPP, net biome productivity (NBP), vegetation C (CVEG), soil C (CSOIL), and leaf area index (LAI). These variables have been previously evaluated in detail for the terrestrial biosphere models in the TRENDY ensemble in Seiler et al. (2022). Seiler et al. (2022) give further details on the observation-based datasets used to evaluate the primary C cycling variables. Briefly, we evaluated GPP against MODIS (Zhang et al., 2017), GOSIF (Li and Xiao, 2019), and FLUXCOM (Jung et al., 2020) products. We evaluated NBP against the CAMS (Agustí-Panareda et al., 2019), CarboScope (Rödenbeck et al., 2018), and CT2019 (Jacobson et al., 2020) products. We evaluated CVEG against the GEOCARBON (Avitabile et al., 2016; Santoro et al., 2015), Zhang and Liang (2020), and Huang et al. (2021) products. We evaluated LAI against Advanced Very High Resolution Radiometer (AVHRR; Claverie et al., 2016), Copernicus (Verger et al., 2014), and MODIS (Myneni et al., 2002) products. We evaluated CSOIL against Harmonized World Soil Database (HWSD; Todd-Brown et al., 2013; Wieder, 2014) and SoilGrids (Hengl et al., 2017) products. These observation-based products are globally gridded.
2.4 Model evaluation with the Automated Model Benchmarking R (AMBER) package
The Automated Model Benchmarking R (AMBER) package developed by Seiler et al. (2021) quantifies model performance in reproducing observation-based datasets using a skill score system that is based on ILAMB (Collier et al., 2018). Five scores assess the simulated time mean bias (Sbias), monthly centralized root-mean-square error (Srmse), seasonality (Sphase), inter-annual variability (Siav), and spatial distribution (Sdist) in comparison to the observation-based dataset. Scores are dimensionless and range from 0 to 1, where higher values indicate better model performance. The overall score for each variable (Soverall) is
We calculated the overall score for each C and N cycling variable. Because biological N fixation, vegetation C : N ratio, and soil C : N ratio datasets are representative of the present-day (as a single time point) values, Srmse, Sphase, and Siav are not defined and thus do not contribute to Soverall. This also holds for vegetation C and soil C. The calculation of each score is described in detail in Seiler et al. (2022).
2.5 Statistics
We used a Mann–Kendall trend test to assess the existence of a statistically significant trend in the time series over the historical period for simulated C and N cycling variables (Hipel and McLeod, 1994). We conducted two analyses to compare model performance in simulating C cycling vs. N cycling. First, we calculated Spearman's rank correlation coefficient to assess the existence of statistically significant correlations between overall scores, present-day global values, and Kendall's tau. Second, we used a t test or ANOVA (p value < 0.05) to assess the existence of statistically significant differences between overall scores, present-day global values, and Kendall's tau for models with different representations of N limitation of vegetation growth, biological N fixation, vegetation response to N limitation, and N limitation of decomposition (Table 1).
3.1 Net biome productivity
Figure 2 shows NBP simulated by the TRENDY ensemble models with coupled C–N cycling (hereafter referred to as the TRENDY-N ensemble). NBP is the difference between the net natural atmosphere–land flux of CO2 and land use change CO2 emissions. Positive values of NBP indicate a terrestrial C sink, whereas negative values of NBP indicate a terrestrial C source. All TRENDY-N ensemble models suggest a terrestrial C sink for the present day, agreeing with the global carbon budget constraint from the 2022 Global Carbon Budget with most models within 2 standard deviations of the mean (1.5±0.6 Pg C for 2012–2021) (Fig. 2a). The TRENDY-N ensemble agrees reasonably well with observations globally, agreeing somewhat better with CarboScope and CT2019 than with CAMS (Fig. 2b). However, the latitudinal distributions of the observation-based datasets display weak agreement among themselves with opposing signs in multiple regions due to differences in the inversion models and atmospheric CO2 measurements used in each dataset (Fig. 2b). The largest differences occur at southern latitudes and at high northern latitudes, and this is in part due to the smaller land area at these latitudes. The regions showing the strongest agreement are at middle to high northern latitudes, where both the TRENDY-N ensemble and observations suggest a terrestrial C sink (Fig. 2b).
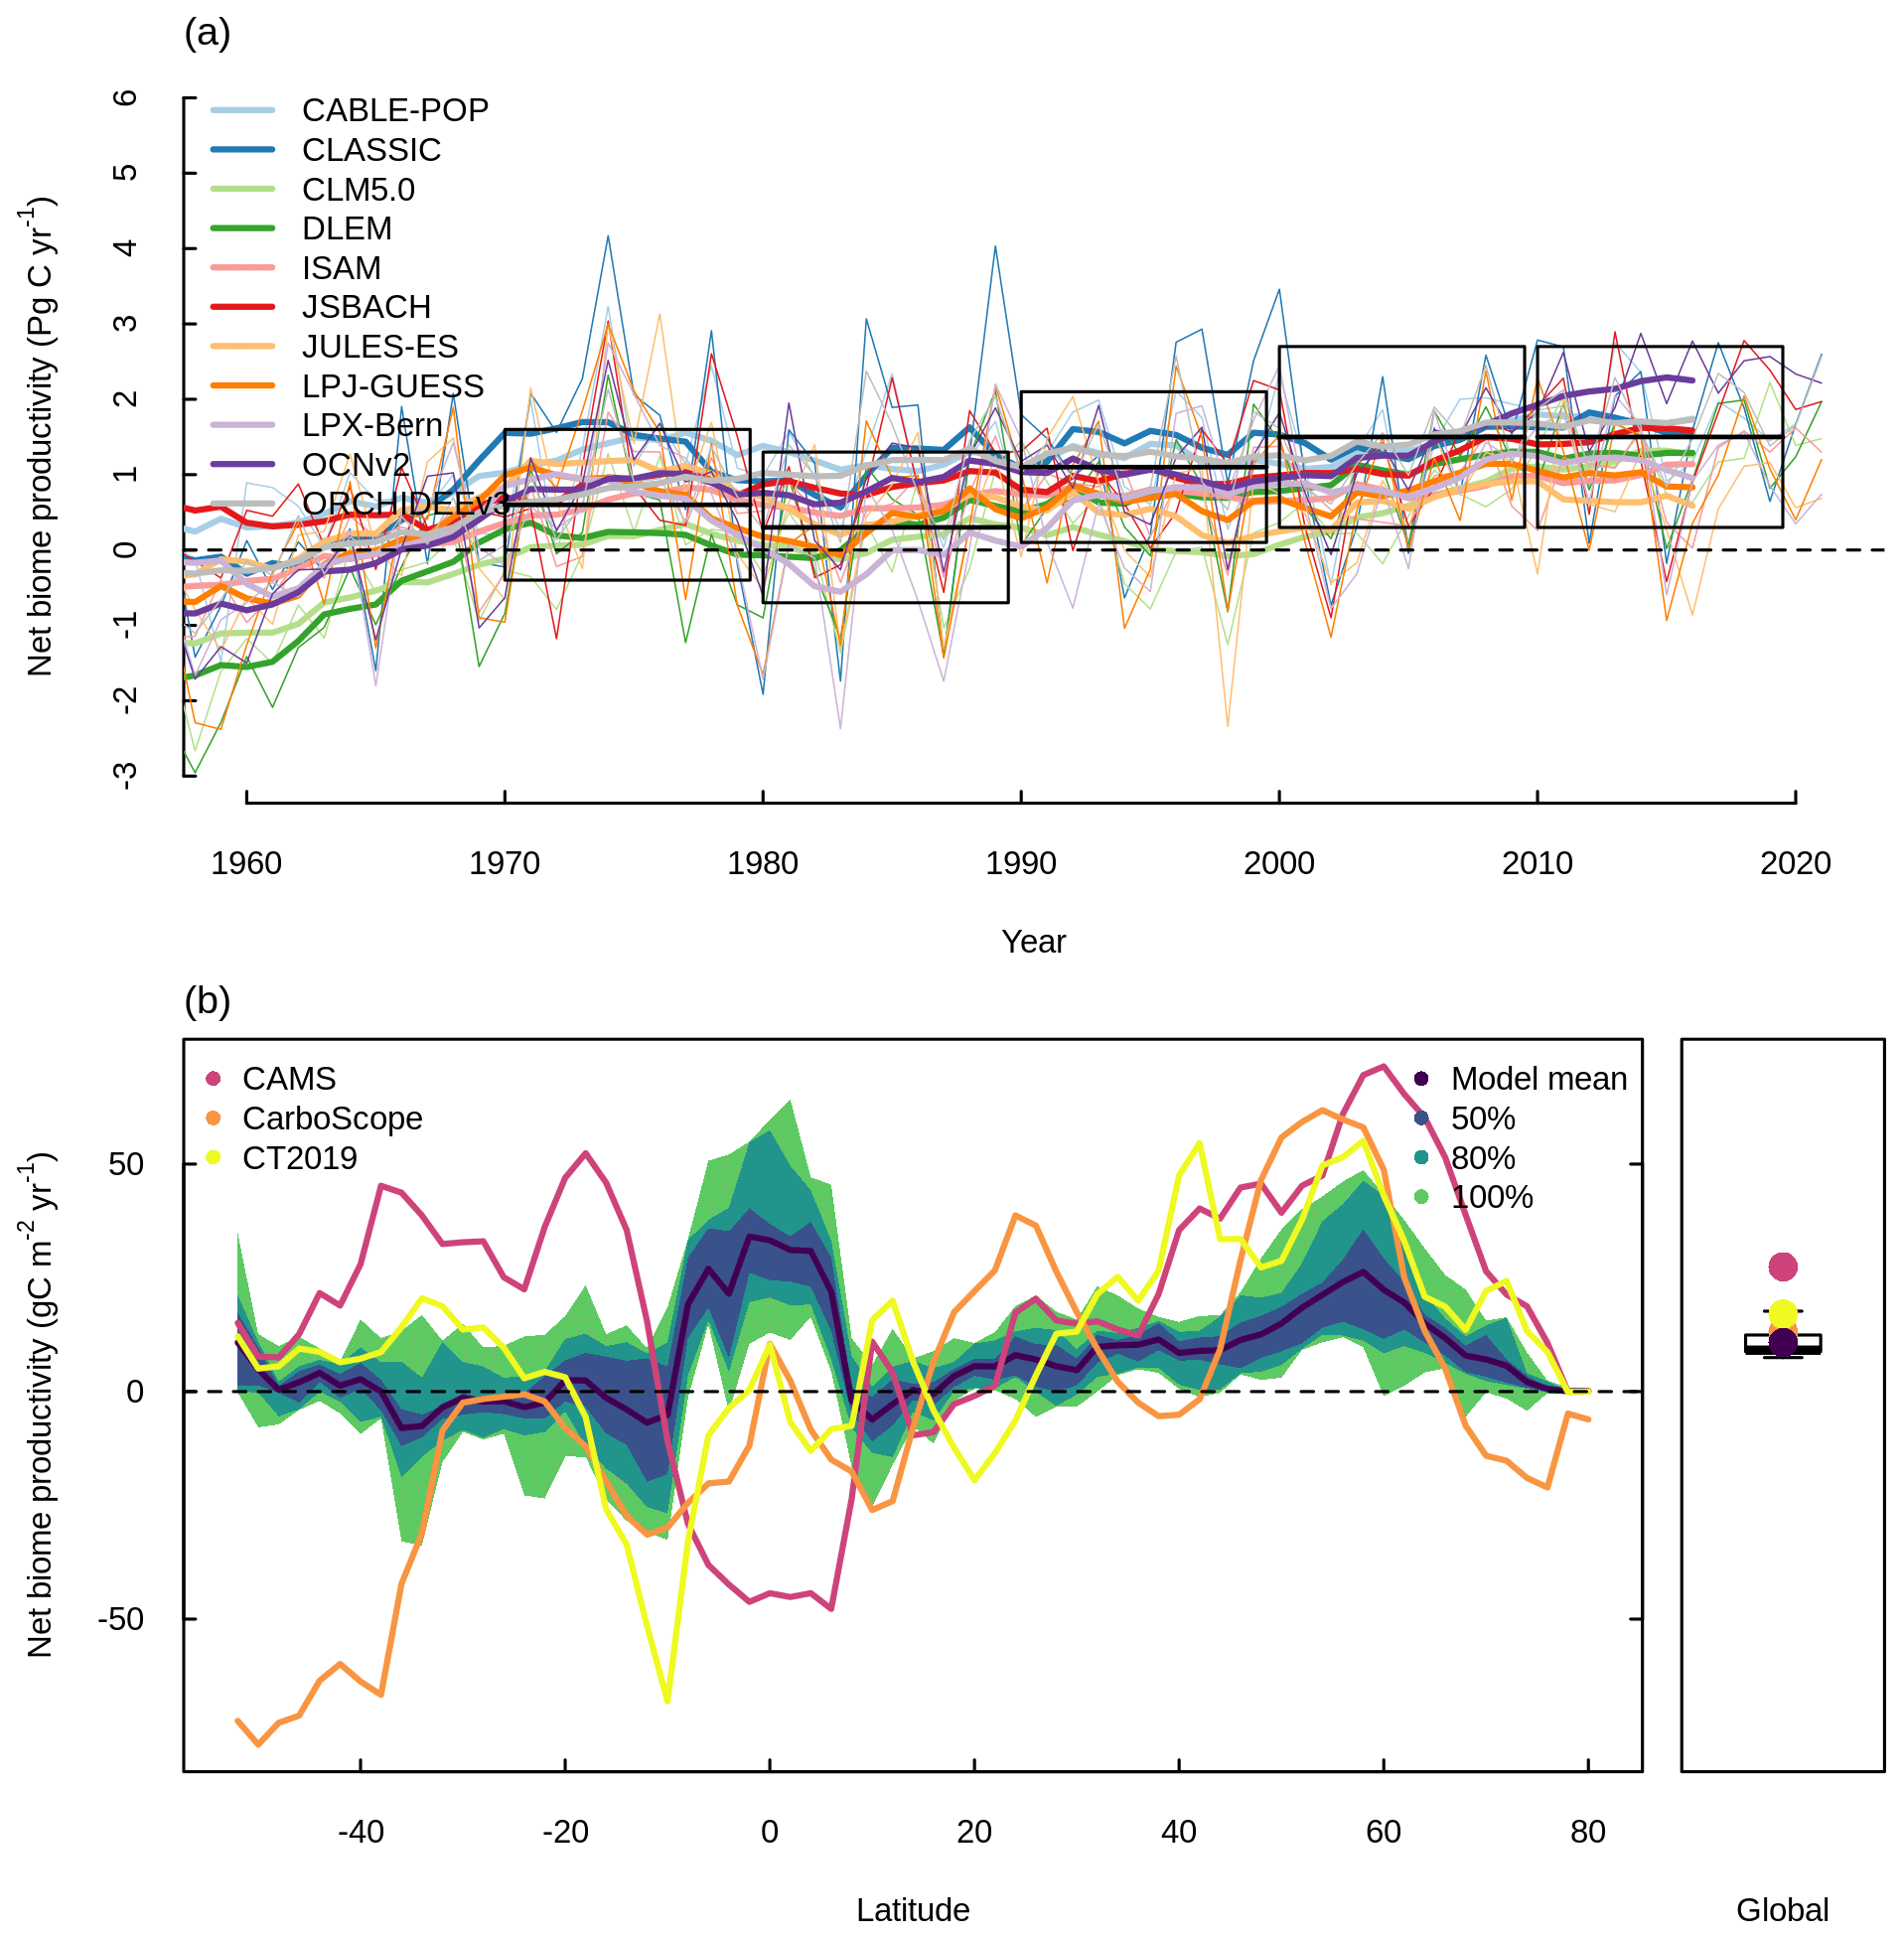
Figure 2Net biome productivity (NBP) simulated by the TRENDY-N ensemble. (a) Global NBP from 1960 to 2021. The boxes indicate the global C budget constraint (difference between fossil fuel CO2 emissions and the growth rate of atmospheric CO2 and the uptake of CO2 by oceans; mean ±2 standard deviation) from the 2022 Global Carbon Budget (Friedlingstein et al., 2022). Thick lines indicate the moving average over 10 years, and thin lines indicate the annual time series. (b) Latitudinal distribution and global mean of NBP (averaged over 1980–2021) in comparison to three datasets (CAMS, Agustí-Panareda et al., 2019; CarboScope, Rödenbeck et al., 2018; and CT2019, Jacobson et al., 2020). The boxplot shows the median, interquartile range (box), and 80 % percentiles (whiskers) of the global mean of NBP.
3.2 Overview of N cycling
Figure 3 shows a schematic of the N cycle alongside the primary N fluxes and C : N ratios of the primary pools simulated by the TRENDY-N ensemble for the present day (averaged over 1980–2021) and observation-based estimates for these variables that have previously been used for model evaluation (Davies-Barnard et al., 2020). Simulated biological N fixation ranged between 20 and 566 Tg N yr−1 (Table 2) in comparison to the observation-based estimate of 88 Tg N yr−1 (52–130 Tg N yr−1). Simulated N2O emissions ranged between 0.9 and 11.0 Tg N yr−1 (Table 2) in comparison to the observation-based estimate of 10.8 Tg N yr−1 (7.1–16.0 Tg N yr−1) (Tian et al., 2020). Simulated N losses (which include emissions of NH3, N2O, NOx, and N2, as well as NO and NH leaching) ranged between 87 and 603 Tg N yr−1 (Table 2) in comparison to the observation-based estimate of 293 Tg N yr−1 (Fowler et al., 2013). The simulated vegetation C : N ratio ranged between 103 and 222 (Table 2) in comparison to the observation-based estimate of 133 (Zechmeister-Boltenstern et al., 2015). The simulated combined litter–soil C : N ratio ranged between 10 and 64 (Table 2) in comparison to the observation-based estimate of 15 (Zechmeister-Boltenstern et al., 2015). Biological N fixation has the largest inter-model spread with a coefficient of variation of 1.06 (Table 2). Figure 4 shows the geographical distribution of the primary N pools and fluxes simulated by the TRENDY-N ensemble for the present day (averaged over 1980–2021), and variation across models is shown in Appendix Fig. A1.
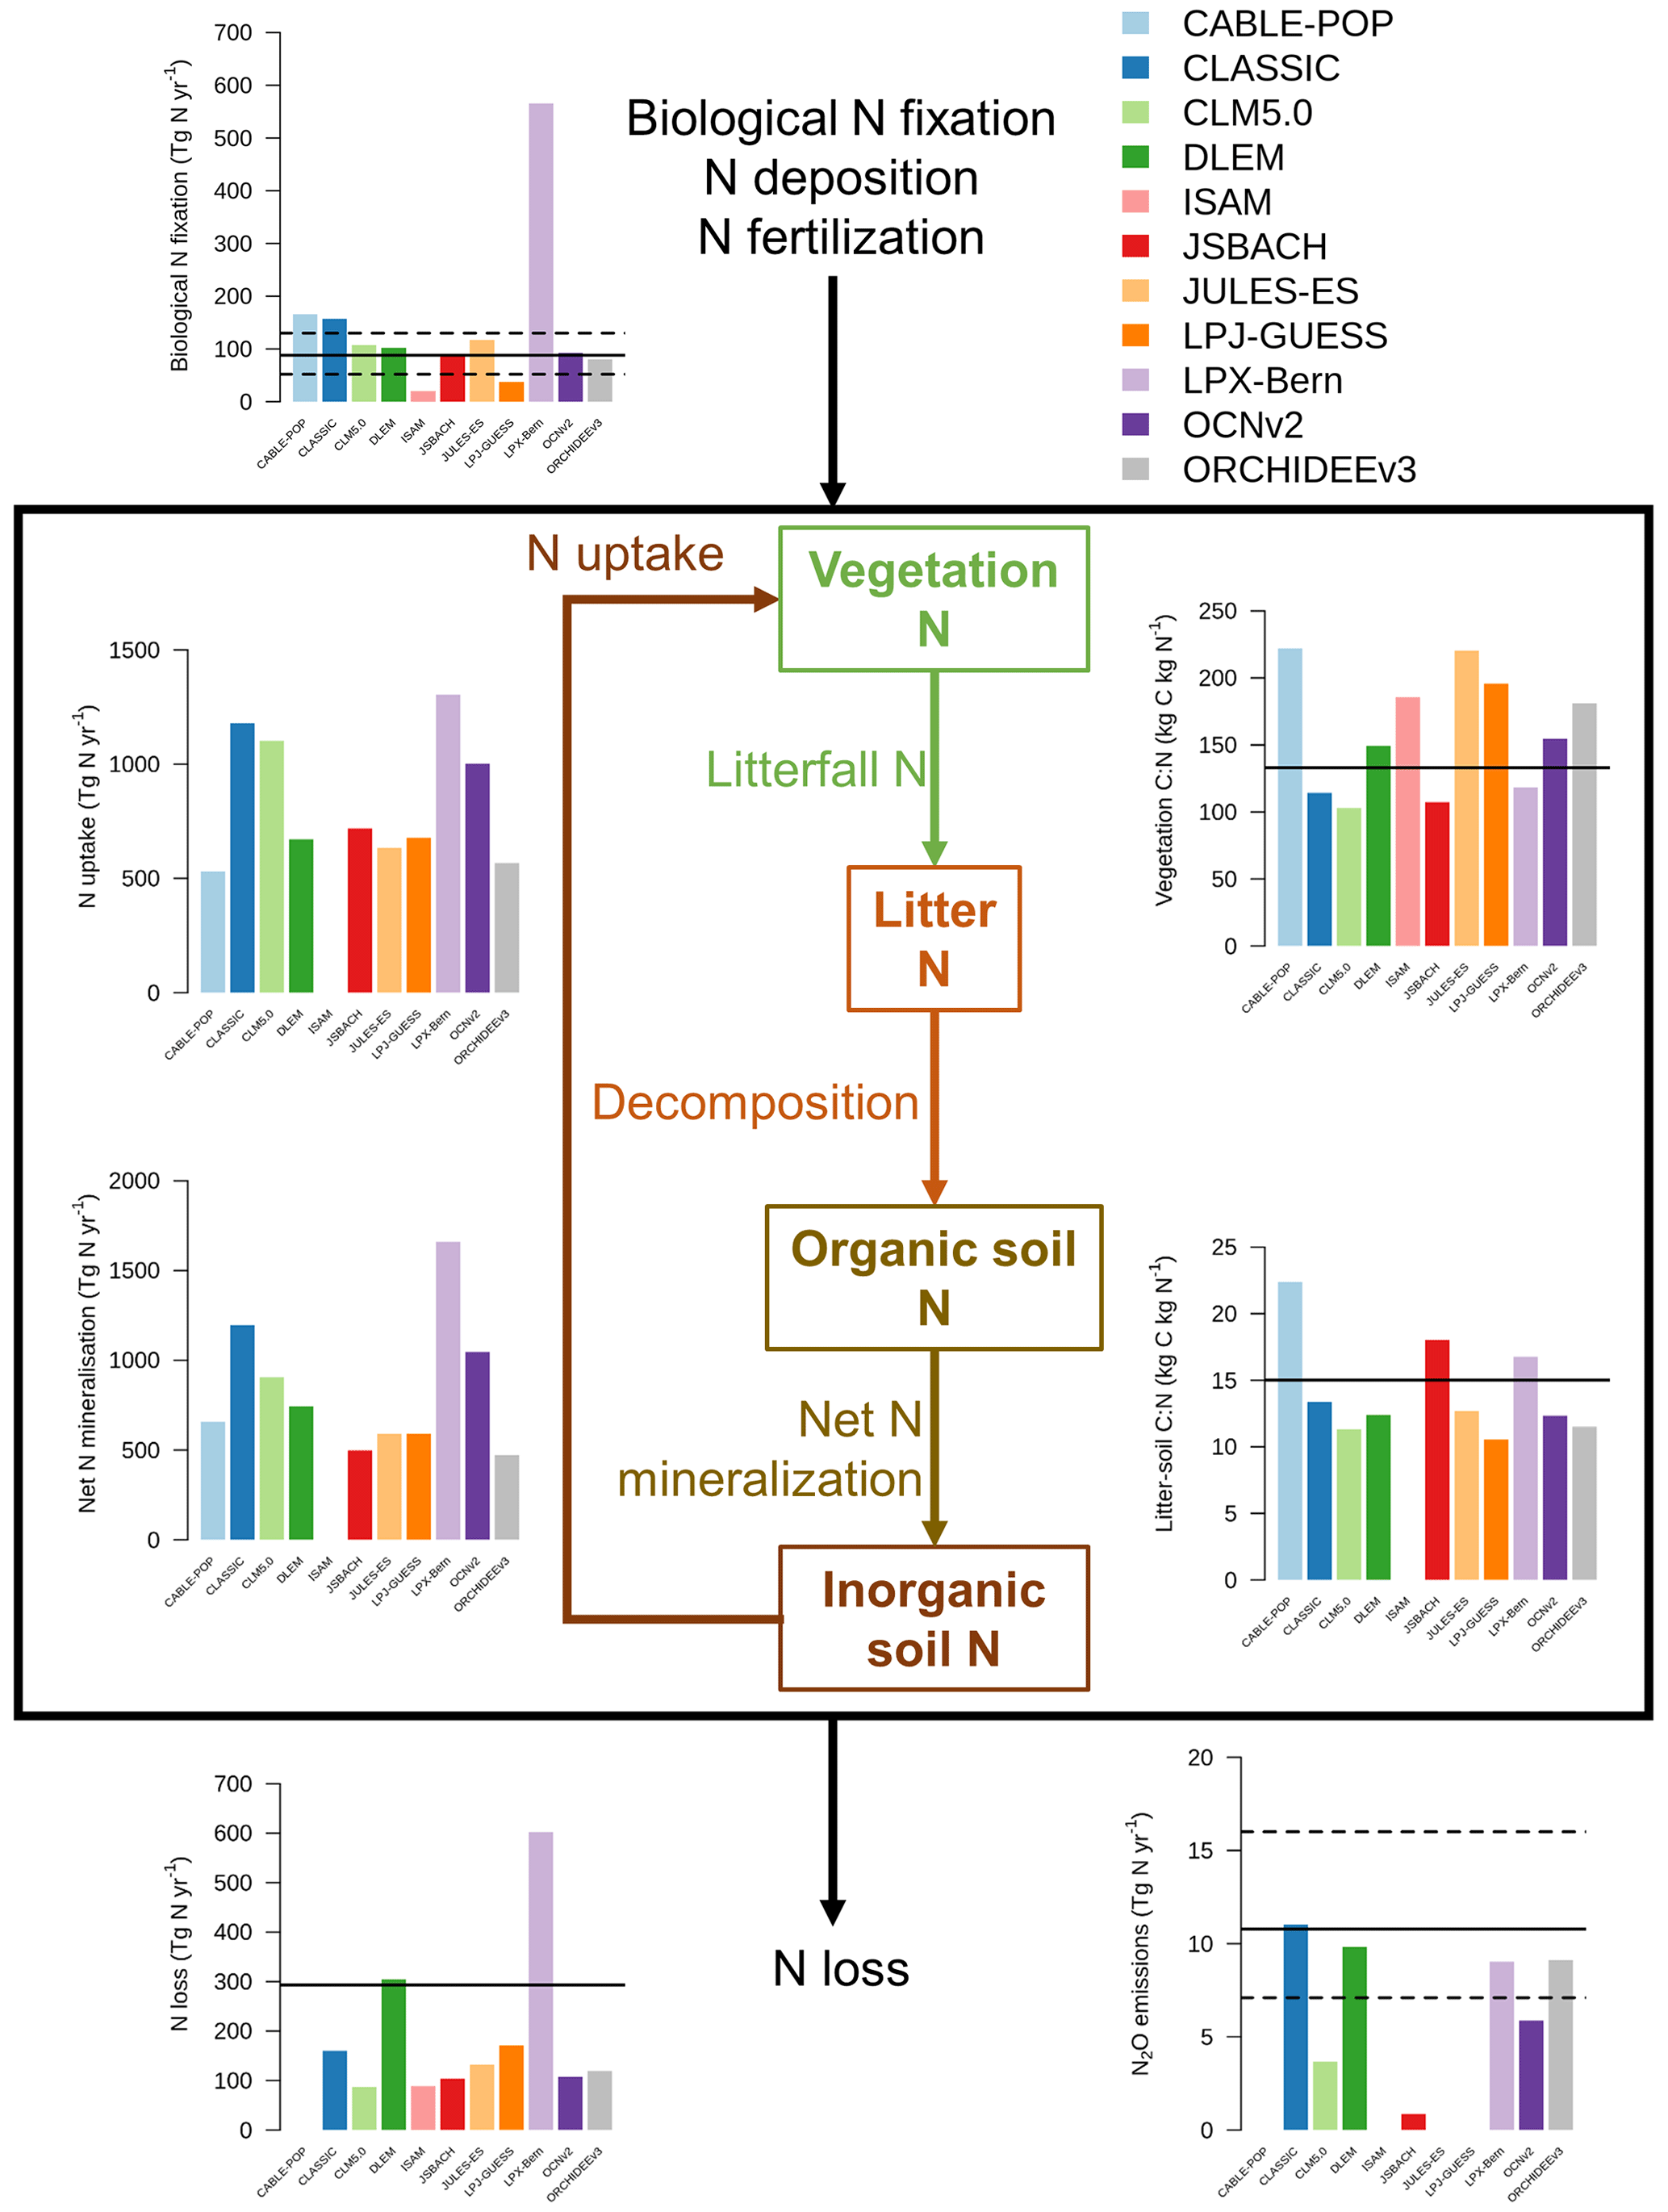
Figure 3The N cycle and the primary N pools and fluxes simulated by the TRENDY-N ensemble (averaged over 1980–2021). Horizontal black lines indicate observation-based estimates that have previously been used for model evaluation (biological N fixation from Davies-Barnard and Friedlingstein, 2020; vegetation and combined litter-soil C : N ratios from Zechmeister-Boltenstern et al., 2015; N2O emissions from Tian et al., 2020; and N losses from Fowler et al., 2013). The black box indicates the terrestrial biosphere. N enters the terrestrial biosphere via biological N fixation, N deposition, and N fertilization (entering the organic soil N pool, the inorganic soil N pool (ammonium (NH) or nitrate (NO), or the vegetation N pool). N is transferred from the inorganic soil N pool to the vegetation N pool via N uptake. N is transferred from the vegetation N pool to the litter N pool via N litterfall. N is transferred from the litter N pool to the organic soil N pool via decomposition. N is transferred from the organic soil N pool to the inorganic soil N pool via net N mineralization. N exits the terrestrial biosphere via N loss (which includes N leaching from soils and N2O, NOx, NH3, and N2 emissions from both soils and land use change). Not all models provide output for each N pool or flux. Note that biological N fixation simulated by LPX-Bern implicitly includes rock N sources.
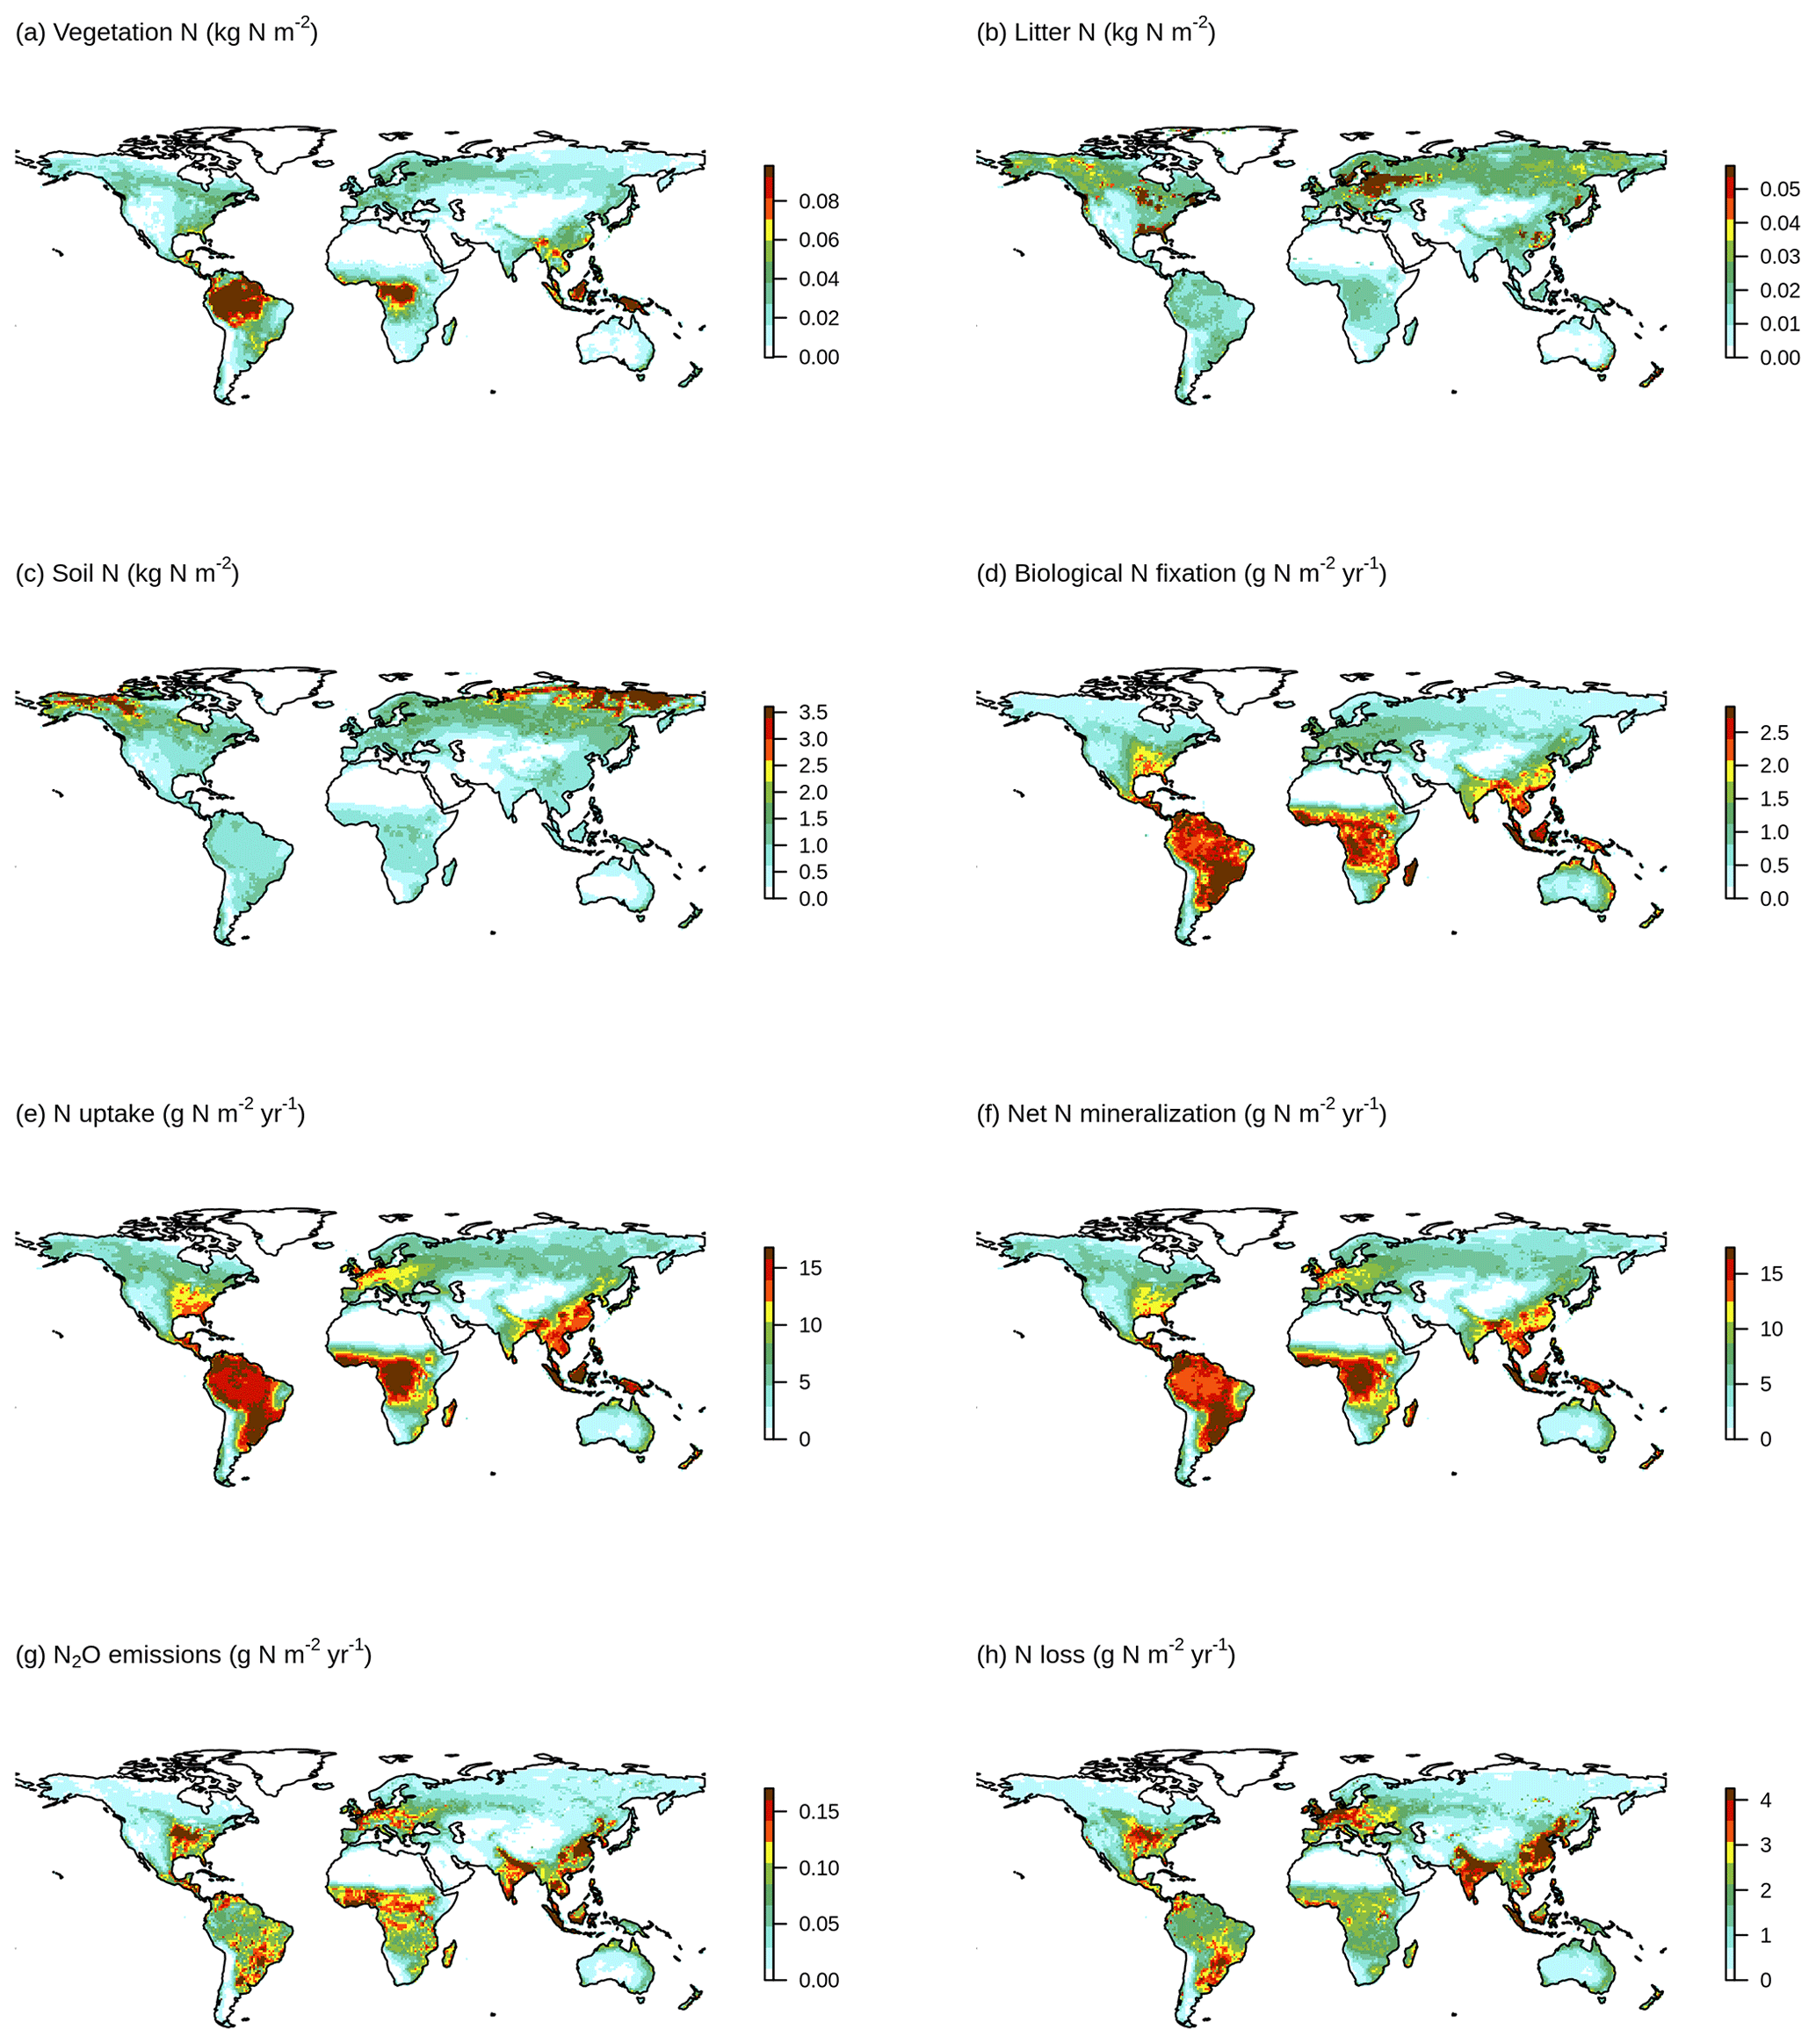
Figure 4Geographical distributions of (a) vegetation N, (b) litter N, (c) soil N, (d) biological N fixation, (e) N uptake, (f) net N mineralization, (g) N2O emissions, and (h) N loss simulated by the TRENDY-N ensemble (averaged across models over 1980–2021). Variation across models is shown in Fig. A1.
Table 2Global N pools, N fluxes, and C : N ratios simulated by the TRENDY-N ensemble (mean and coefficient of variation across models over 1980–2021).
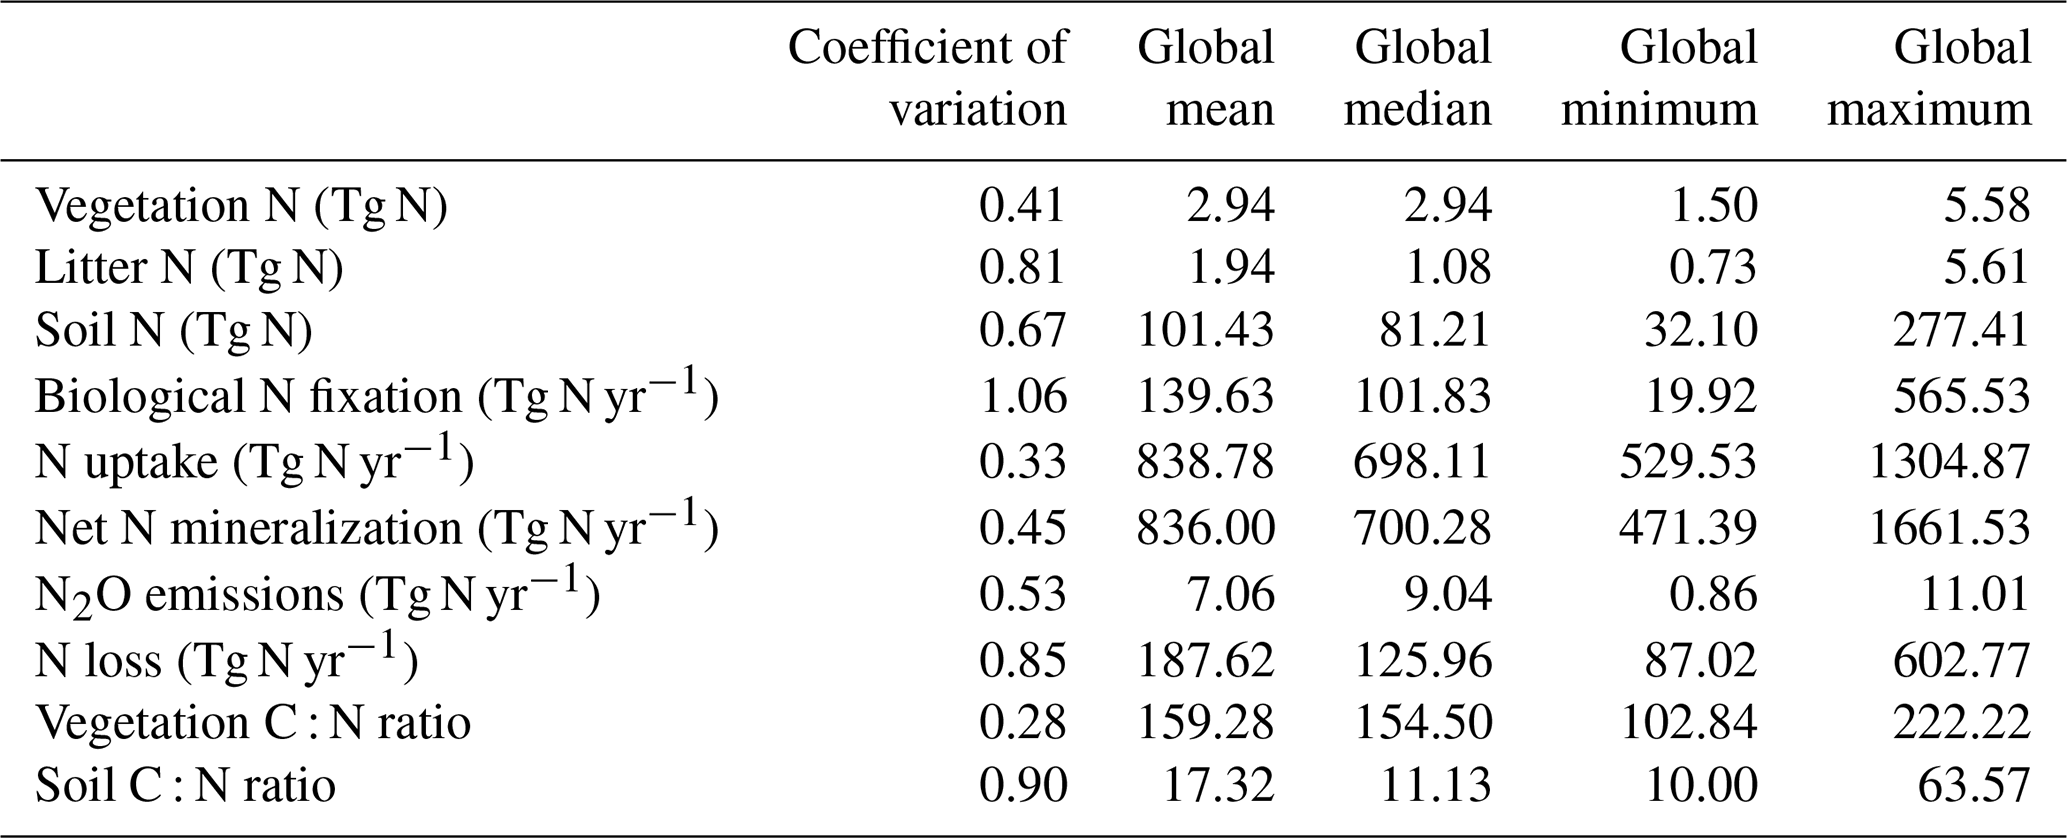
Figure 5 shows the time series of the change from pre-industrial levels of the primary N pools and fluxes from 1850 to 2021 simulated by the TRENDY-N ensemble. Figure 6 shows the corresponding Kendall's tau, which identifies the existence of a statistically significant trend (Table A2). Over the historical period, some models suggest decreasing vegetation N (6 out of 11 models), whereas other models suggest increasing vegetation N (2 out of 11 models) or no trend in vegetation N (3 out of 11 models). Some models suggest decreasing soil N (7 out of 11 models), whereas other models suggest increasing soil N (4 out of 11 models). Some models suggest increasing biological N fixation (7 out of 11 models), whereas other models suggest decreasing biological N fixation (2 out of 11 models) or no trend in biological N fixation (2 out of 11 models). All models suggest increasing N uptake (10 out of 10 models). Most models suggest increasing net N mineralization rate (9 out of 10 models) or no trend in N mineralization rate (1 out of 10 models). All models suggest increasing N2O emissions (7 out of 7 models) and increasing N loss (10 out of 10 models).
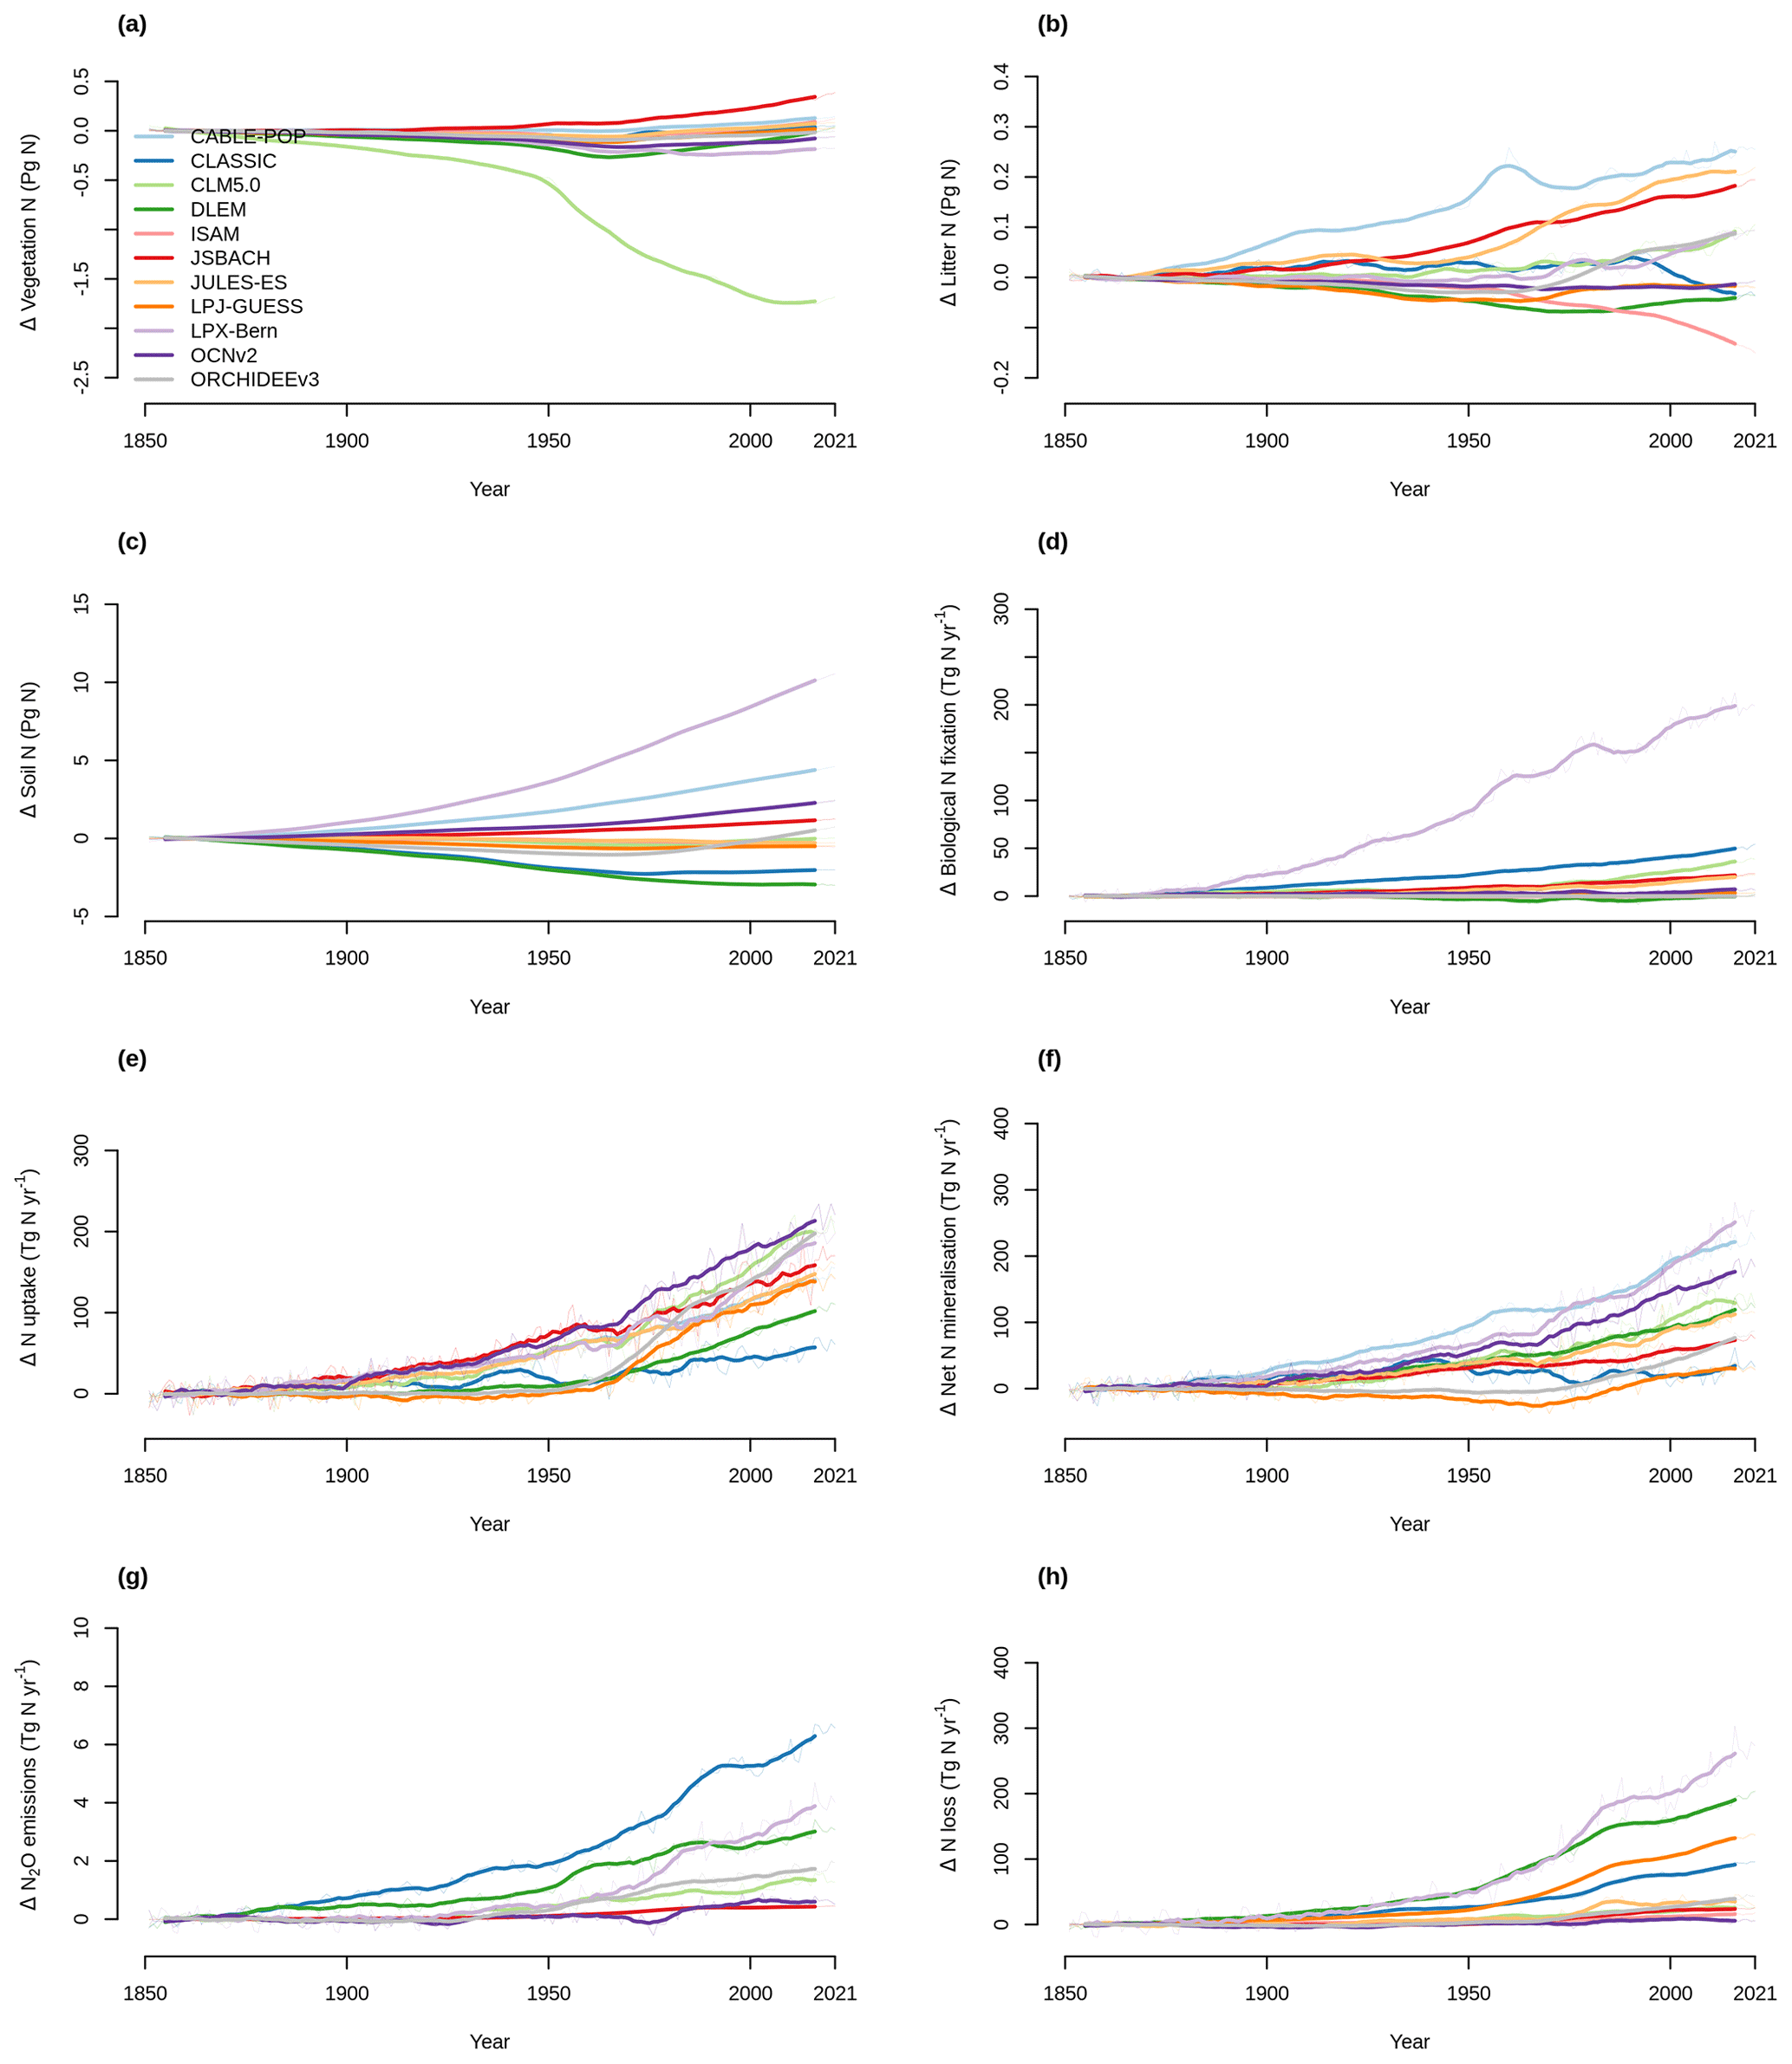
Figure 5Time series of the change from the pre-industrial level (averaged over 1850–1870) of (a) vegetation N, (b) litter N, (c) soil N, (d) biological N fixation, (e) N uptake, (f) net N mineralization, (g) N2O emissions, and (h) N loss simulated by the TRENDY-N ensemble from 1850 to 2021. Figure A5 shows the time series for each N pool and N flux simulated by the TRENDY-N ensemble from 1850 to 2021.
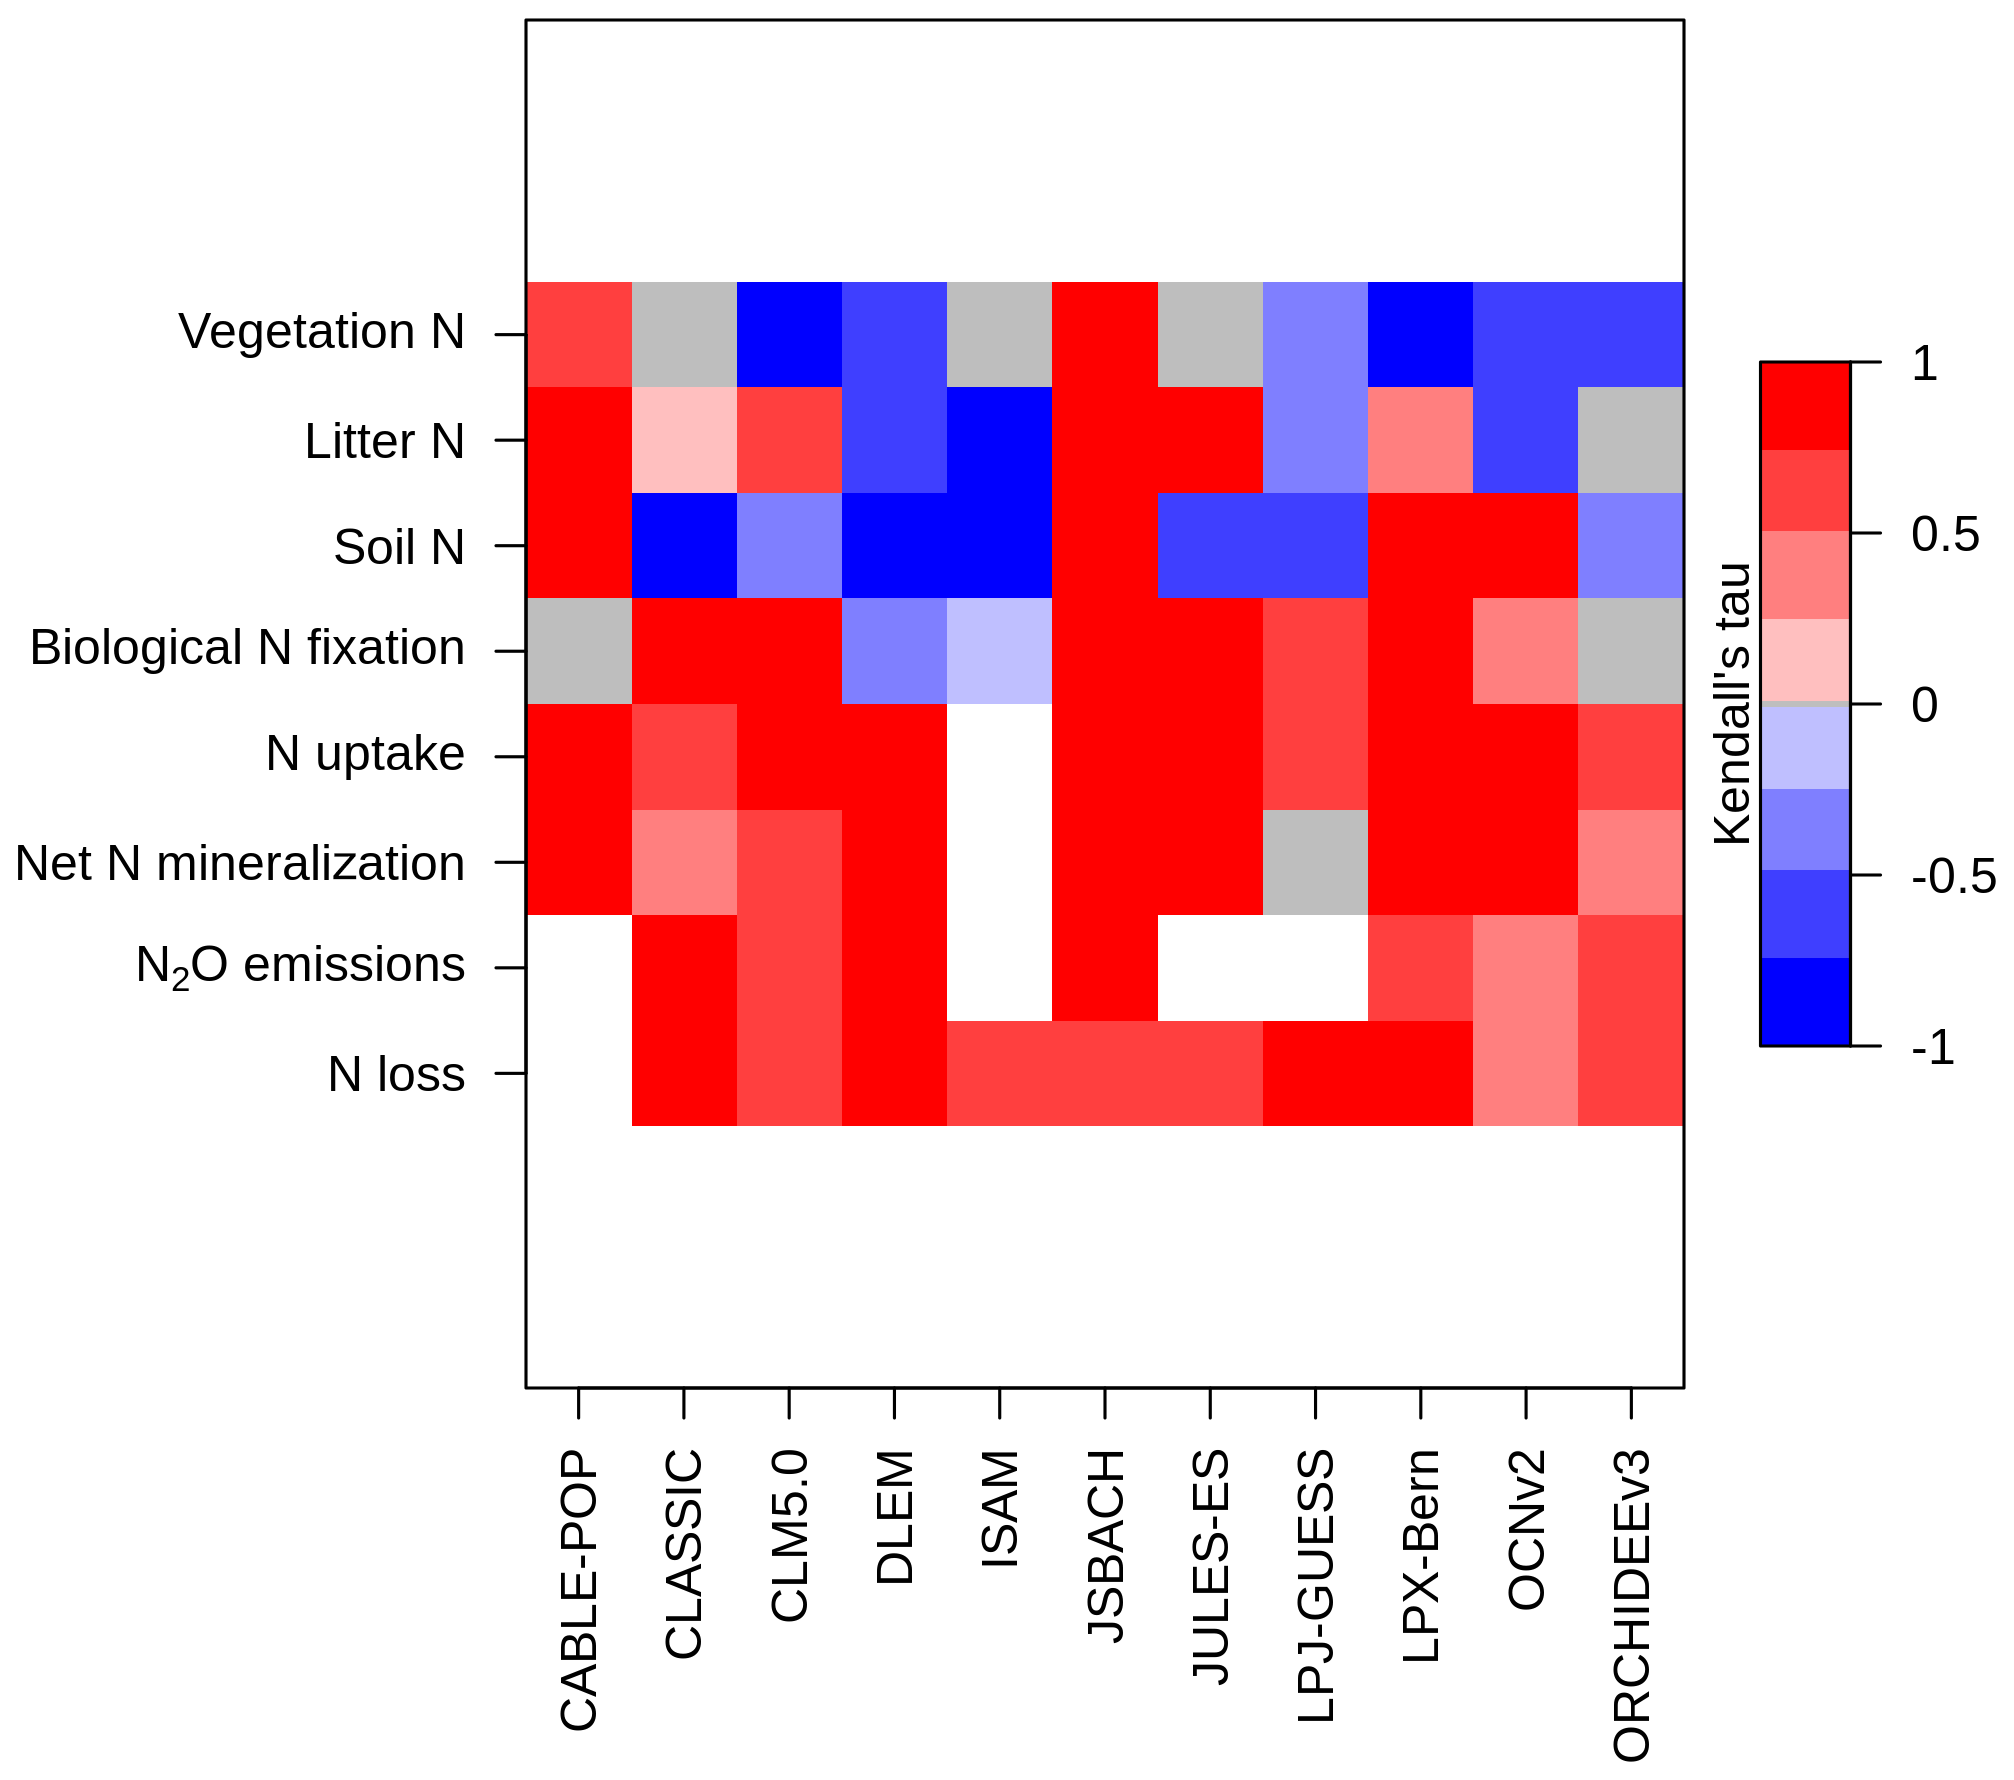
Figure 6Kendall's tau from the Mann–Kendall test (p value < 0.05) for each N pool and N flux time series simulated by the TRENDY-N ensemble from 1850 to 2021 (Table A2). A positive value (red) indicates an increasing trend and a negative value (blue) indicates a decreasing trend. Gray indicates a statistically insignificant value, and white indicates a missing value.
3.3 Evaluation of biological N fixation, vegetation C : N ratio, and soil C : N ratio
In comparison to the observation-based dataset from Davies-Barnard and Friedlingstein (2020), the TRENDY-N ensemble reproduced global biological N fixation (101.8 Tg N yr−1 vs. 88 Tg N yr−1; Fig. 7a and Table 2) but overestimated low-latitude biological N fixation and underestimated high-latitude biological N fixation in the Northern Hemisphere (Fig. 7b). In comparison to the observation-based dataset from the TRY plant trait database, the TRENDY-N ensemble overestimated the global vegetation C : N ratio (154.5 vs. 102.8; Fig. 7c and Table 2) and overestimated the vegetation C : N ratio across latitudes while capturing its latitudinal pattern (Fig. 7d). In comparison to the observation-based dataset from SoilGrids, the TRENDY-N ensemble overestimated the global soil C : N ratio, simulating a relatively constant soil C : N ratio across latitudes (11.1 vs. 8.8; Fig. 7e and Table 2). The TRENDY-N ensemble was thus unable to capture the latitudinal pattern of the soil C : N ratio (Fig. 7f).
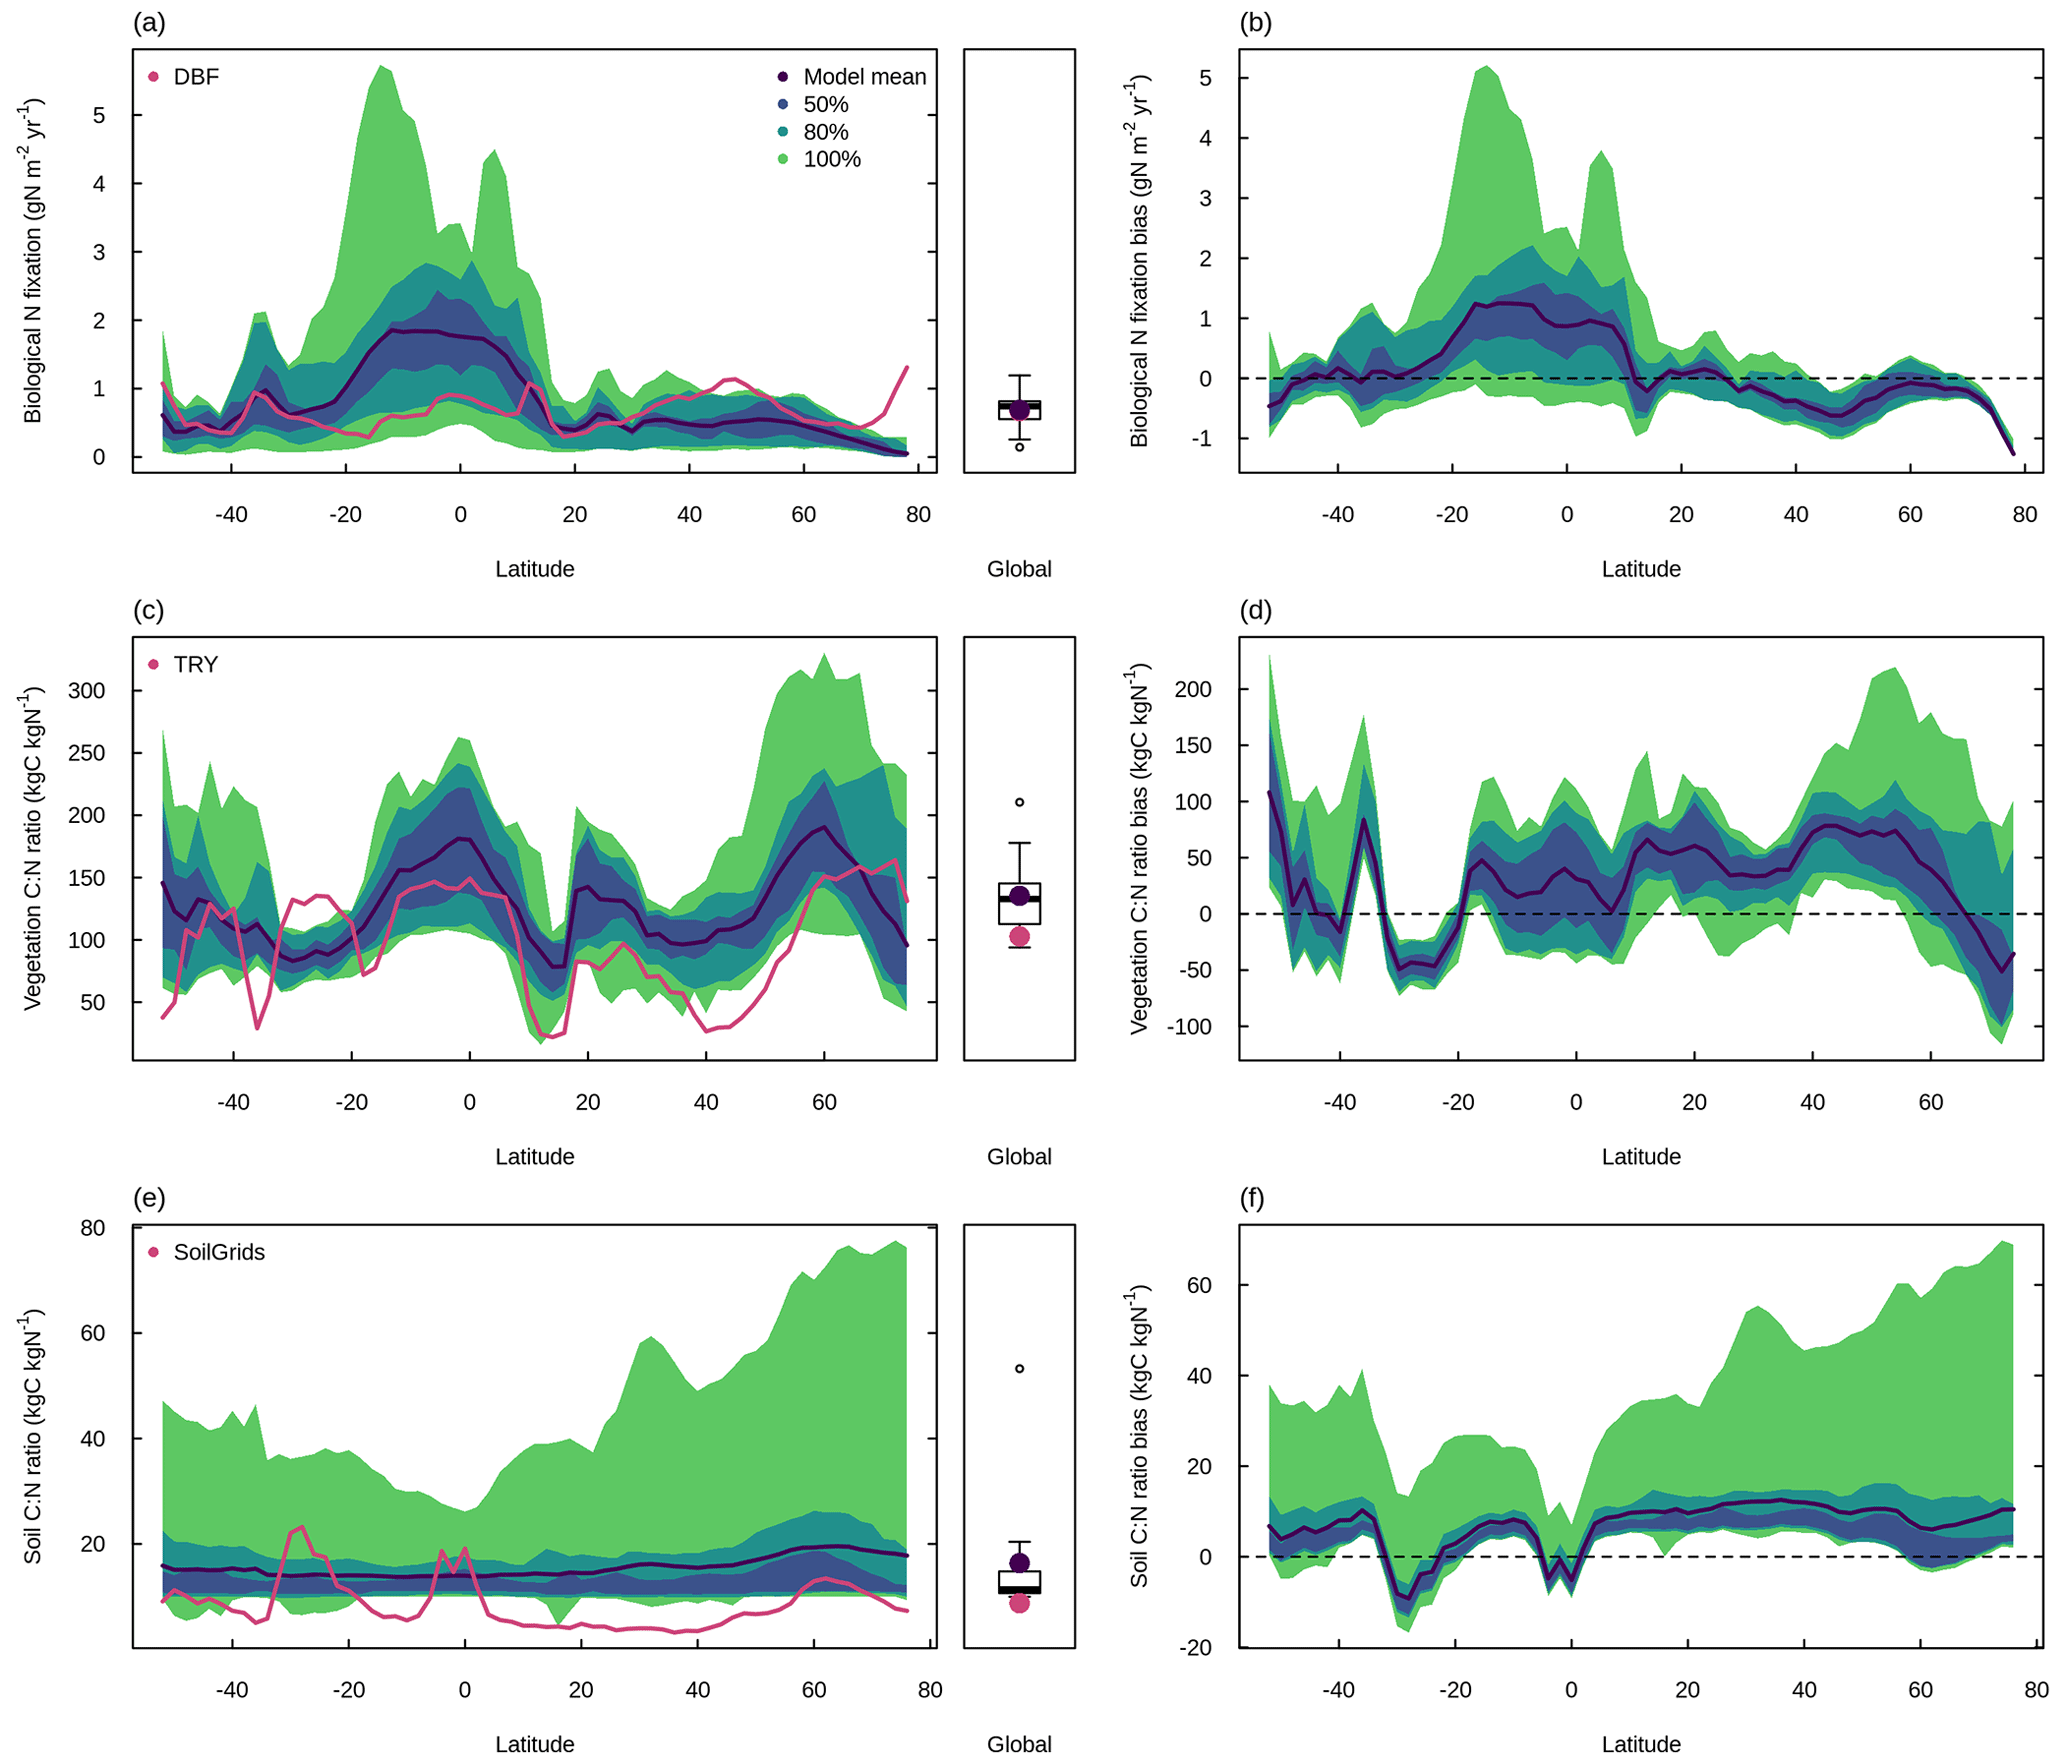
Figure 7Latitudinal distributions and global means of biological N fixation, vegetation C : N ratio, and soil C : N ratio simulated by the TRENDY-N ensemble (averaged across models over 1980–2021) in comparison to observations. Panels (a, c, e) show the latitudinal distribution of the mean and boxplots show the global mean. Panels (b, d, f) show the latitudinal distribution of the bias. Latitudinal distributions show the mean (black line) and the 50 %, 80 %, and 100 % percentiles across models. Boxplots show the median, interquartile range (box), and 80 % percentiles (whiskers) across models. Observation-based datasets are from Davies-Barnard and Friedlingstein (2020) for biological N fixation, the TRY plant trait database for vegetation C : N ratio, and SoilGrids for soil C : N ratio. LPX-Bern simulations are not shown in (a) or (b). Latitudinal distributions and global means of individual models in the TRENDY-N ensemble are shown in Fig. A6.
The overall score is a metric of model performance in reproducing an observation-based dataset. Overall scores for biological N fixation, vegetation C : N ratio, and soil C : N ratio (0.46, 0.53, and 0.29 averaged across models, respectively) were lower than those for C cycling variables (0.58 averaged across all C cycling variables and across models) (Fig. 8). The mean overall score for vegetation C : N ratio across models (0.53) was lower than the mean overall scores for vegetation C across models (which ranged from 0.61 to 0.69 depending on the observation-based dataset used to derive the score). Similarly, the mean overall score for soil C : N ratio across models (0.29) was lower than the mean overall scores for soil C across models (which ranged from 0.39 to 0.53 depending on the observation-based dataset used to derive the score).
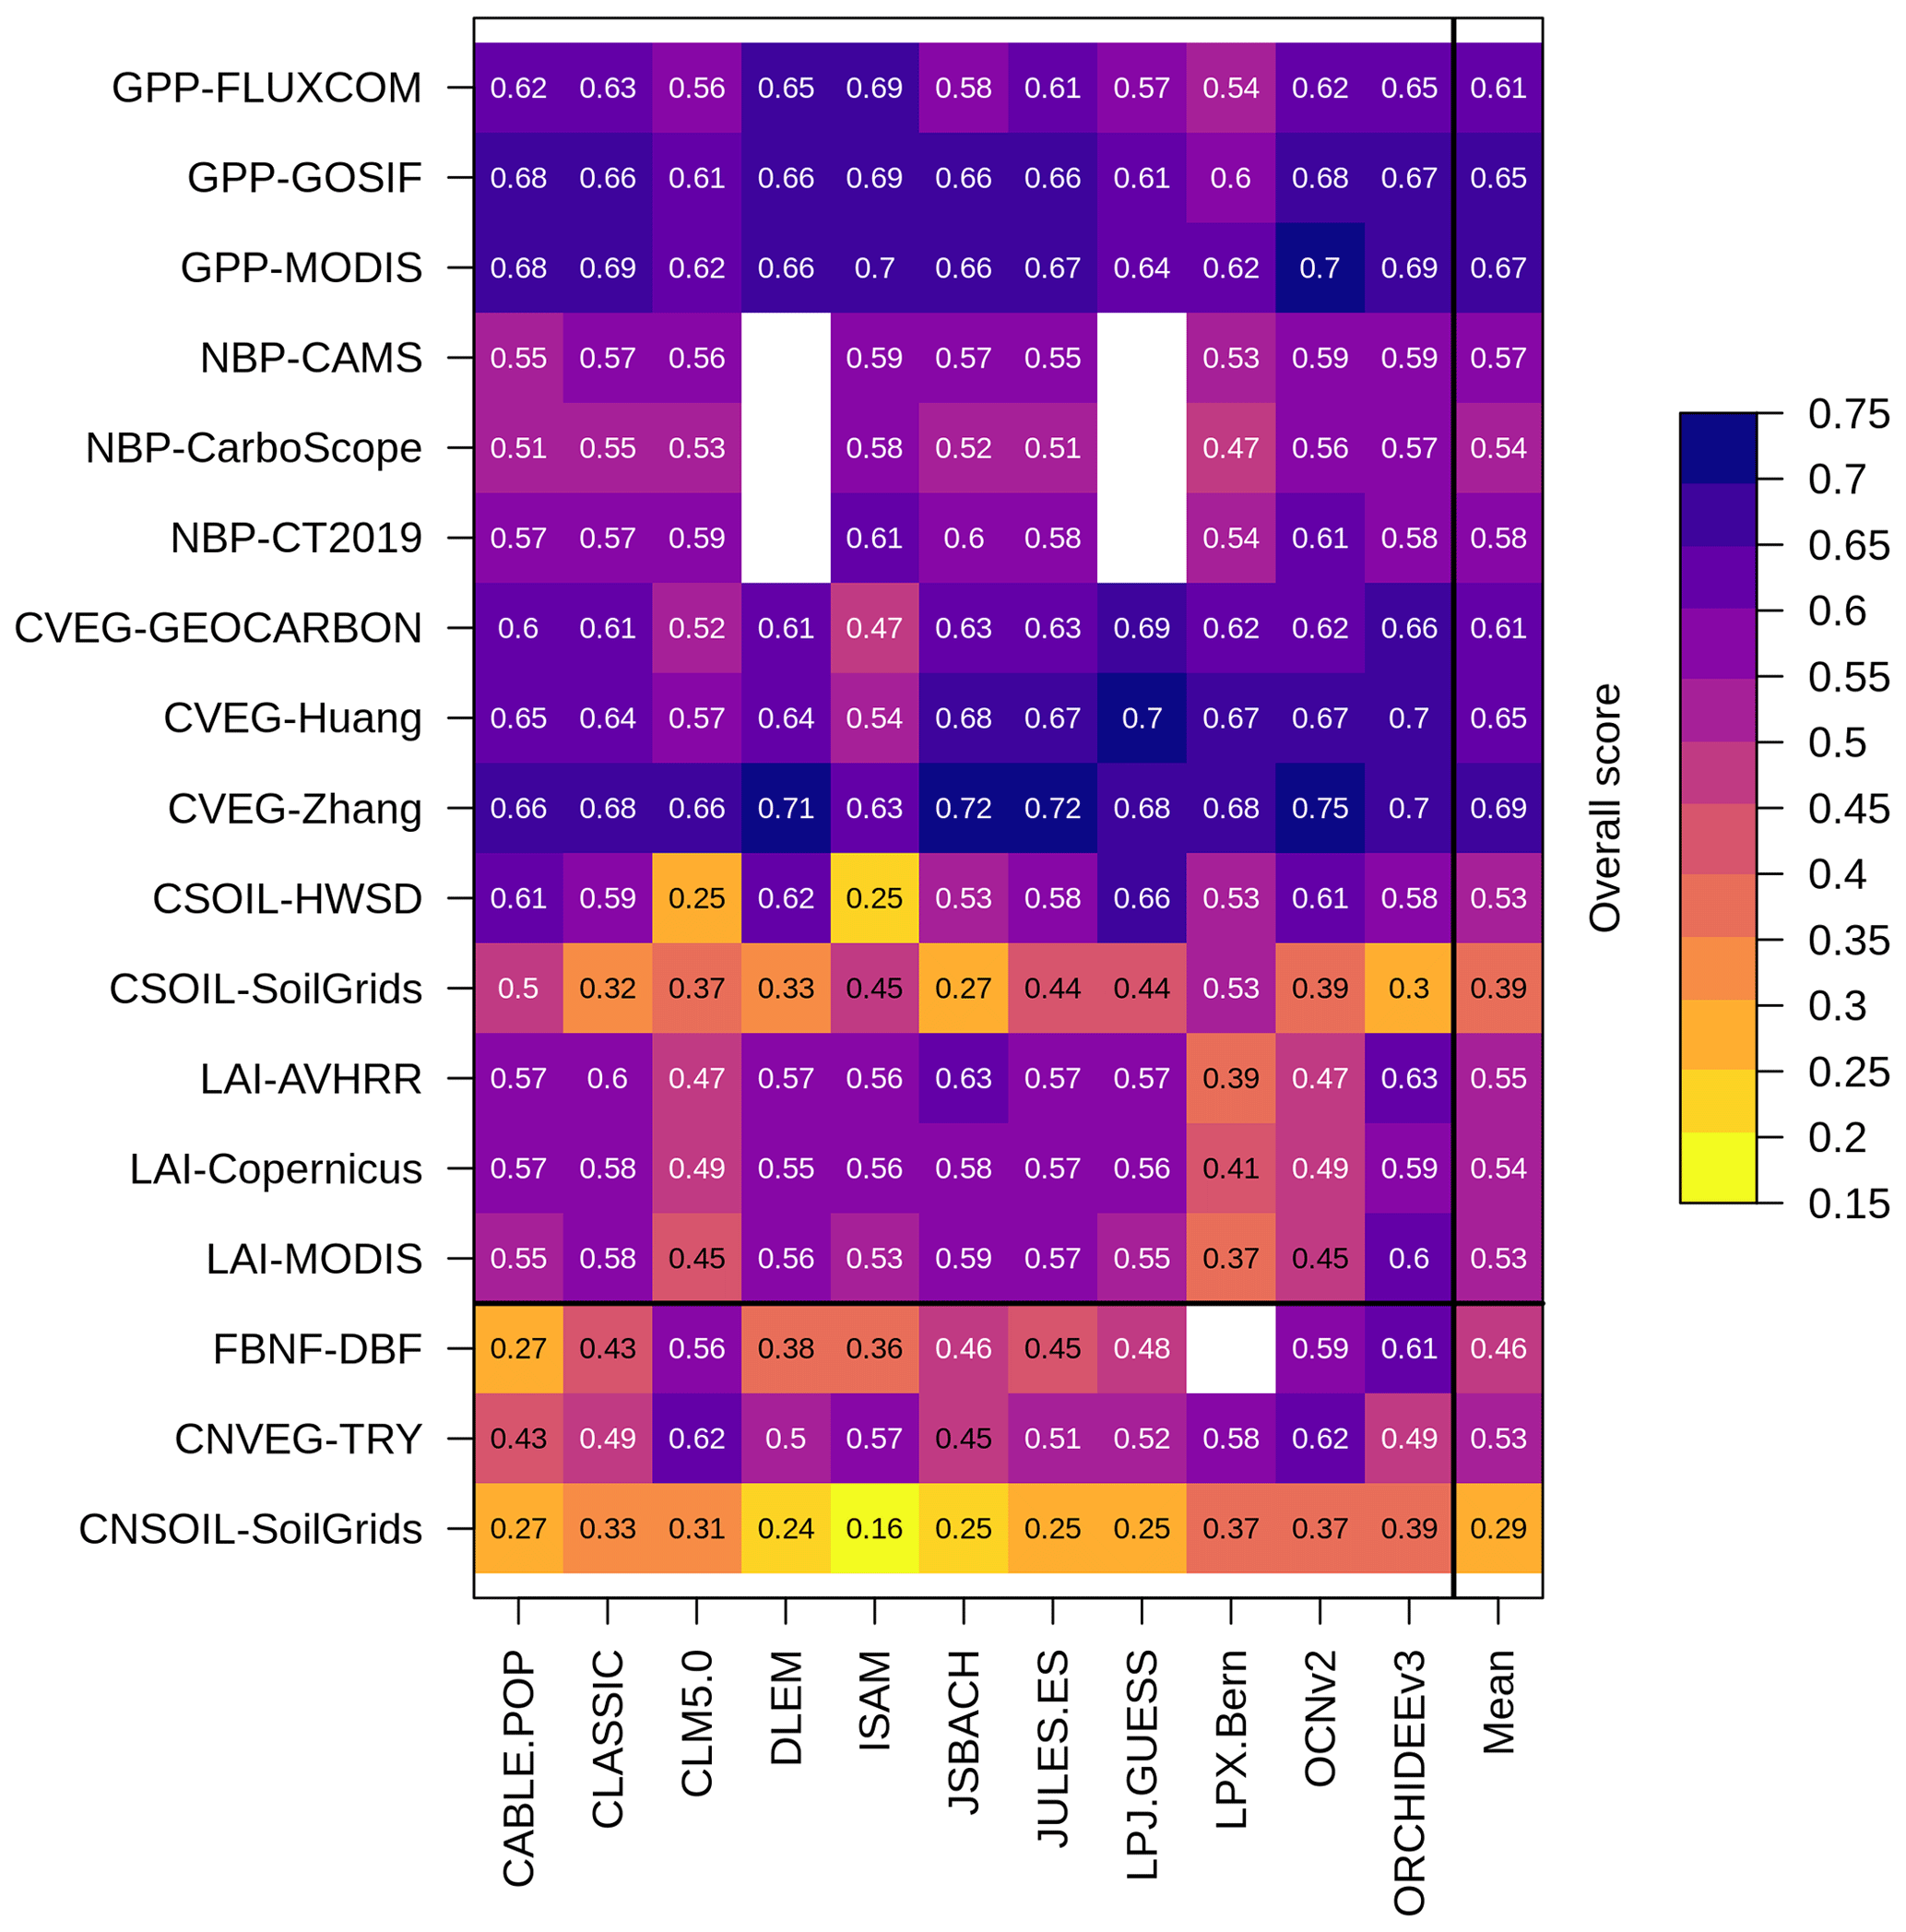
Figure 8Overall scores of the TRENDY-N ensemble in simulating C and N cycling variables: gross primary productivity (GPP), net biome productivity (NBP), vegetation C (CVEG), soil C (CSOIL), leaf area index (LAI), biological N fixation (FBNF), vegetation C : N ratio (CNVEG), and soil C : N ratio (CNSOIL). Abbreviations of the observation-based datasets are described in Sect. 2 and in Seiler et al. (2022).
For N cycling variables, the overall score is composed of the time mean bias score (which assesses the difference between the time mean of model simulations and the time mean of the observation-based dataset) and the spatial distribution score (which assesses the ability of the model to reproduce the spatial pattern of the observation-based dataset) (Collier et al., 2018; Seiler et al., 2022). For biological N fixation, the time mean bias score averaged across models was 0.50 and the mean spatial distribution score across models was 0.41 (Table A3). For the vegetation C : N ratio, the time mean bias averaged score across models was 0.46 and the mean spatial distribution score across models was 0.59 (Table A3). For the soil C : N ratio, the time mean bias score averaged across models was 0.39 and the mean spatial distribution score across models was 0.19 (Table A3).
Note that for C fluxes the overall score is composed of not only the time mean bias score and the spatial distribution score but also the monthly centralized root-mean-square-error score (which assesses the ability of the model to reproduce the time series of the observation-based dataset), the seasonality score (which assesses the ability of the model to reproduce the seasonality of the observation-based dataset), and the inter-annual variability score (which assesses the ability of the model to reproduce the inter-annual variability of the observation-based dataset) because observation-based datasets of C fluxes are available over time, whereas observation-based datasets of C pools and all N cycling variables are representative of the present day (as a single time point).
3.4 Model performance for C cycling vs. N cycling
There were no statistically significant correlations between the overall score of NBP (as well as other primary C variables) and the overall scores of the primary N variables across the TRENDY-N ensemble (Fig. A2). Furthermore, there were no statistically significant correlations between the present-day global value of NBP and the present-day global values of the primary N variables across the TRENDY-N ensemble (Fig. A3). Finally, there were no statistically significant correlations between Kendall's tau of NBP and Kendall's tau of the primary N variables across the TRENDY-N ensemble (Fig. A4).
3.5 Model performance for different representations of N cycling processes
There were no statistically significant differences in overall scores between models with different representations of N limitation of vegetation growth (decreasing Vcmax and flexible C : N stoichiometry vs. decreasing NPP), different representations of biological N fixation (function of N limitation of vegetation growth vs. function of NPP or ET vs. time invariant), different representations of the response of vegetation to N limitation (dynamic vs. static), or different representations of N limitation of decomposition (function of soil N vs. N invariant) (Table A4). However, models that represented decomposition as a function of soil N had a significantly higher NBP score (for CT2019) than models that represented decomposition as N invariant. Similarly, there were no statistically significant differences between present-day global values or Kendall's tau of primary C and N pools and fluxes between models with different representations of N limitation of vegetation growth, biological N fixation, vegetation response to N limitation, and N limitation of decomposition (Tables A5 and A6). This is likely in part due to the low number of models and the confounding influence of other process representations.
4.1 Evaluation of N cycling in terrestrial biosphere models
Despite the ability of all TRENDY-N models to simulate the historical terrestrial C sink in line with observations (Fig. 2), there is substantial variation in simulated N cycling processes by the models. The magnitudes of N pools and fluxes differ considerably between models (Figs. 3 and A1). Additionally, the historical trajectories of these N pools and fluxes differ between models: some models simulate increasing vegetation N and soil N, whereas others simulate decreasing vegetation N and soil N between 1850 and 2021 (Figs. 5 and 6). These trajectories are the result of a host of interacting global change drivers (CO2 fertilization, intensifying N deposition, rising temperature and varying precipitation, and land use change and associated N fertilization regimes) whose effects are challenging to disentangle without additional simulations. For example, while intensifying N deposition and N fertilizer use could drive increasing soil N and N uptake, land use change could increase N losses from both vegetation N and soil N. Most models suggest increasing biological N fixation between 1850 and 2021. This occurs as a result of either increasing vegetation biomass or the up-regulation of biological N fixation due to N limitation imposed by CO2 fertilization or a combination thereof, depending on the representation of biological N fixation in a given model (Table 1). This follows observations that suggest that biological N fixation is stimulated by CO2 fertilization (Zheng et al., 2020; Liang et al., 2016), although its mechanism (i.e., up-regulated biological N fixation in N-limited conditions) may not be captured. Similarly, most models also suggest increasing N uptake between 1850 and 2021. This also occurs as a result of increasing vegetation biomass; increasing soil N from intensifying N deposition and N fertilizer use; or increasing biological N fixation, mycorrhizae, and root allocation due to N limitation imposed by CO2 fertilization, which is again dependent on the representation of the vegetation response to N limitation in a given model (Table 1). Most models suggest increasing net N mineralization rate between 1850 and 2021, likely due to rising temperature following observations (Liu et al., 2017). Most models suggest increasing N2O emissions (and N losses) between 1850 and 2021, likely due to rising temperatures and intensifying N deposition and N fertilizer use following observations (Tian et al., 2020).
We focused on three key N cycling processes for evaluation: biological N fixation, vegetation C : N ratio, and soil C : N ratio. These three key N cycling processes have important implications for projecting the future terrestrial C sink. Biological N fixation is the dominant natural N supply to terrestrial ecosystems and allows vegetation to increase N uptake in N-limited conditions, reduce N limitation, and thus sustain terrestrial C sequestration, such as in response to N limitation imposed by CO2 fertilization (Zheng et al., 2020; Liang et al., 2016). Vegetation and soil C : N ratios reflect assimilated C per unit N and thus terrestrial C sequestration. They can potentially vary, such as in response to high photosynthesis rates relative to N uptake rates driven by CO2 fertilization (Elser et al., 2010). Overall scores of N cycling variables, which quantify model performance in reproducing an observation-based dataset, are lower than overall scores of corresponding C cycling variables, suggesting that models could be less capable of capturing N cycling processes than C cycling processes (Fig. 8). However, this could also be due to the significant uncertainty associated with measurements of N cycling processes as discussed below.
The TRENDY-N ensemble reproduced global observation-based biological N fixation but tended to overestimate low-latitude biological N fixation and underestimate high-latitude biological N fixation (Fig. 7a, b). This is likely because most models represented biological N fixation phenomenologically as a function of a measure of vegetation activity (either NPP or ET). Since there is higher vegetation activity at low latitudes than at high latitudes, these models thus represent higher biological N fixation at low latitudes than at high latitudes. However, because biological N fixation is down-regulated in non-N-limited conditions, it is often down-regulated at low latitudes, which are generally not (or at least less) N-limited in nature (Barron et al., 2011; Batterman et al., 2013; Sullivan et al., 2014). While CLASSIC, CLM5.0, and OCNv2 can represent the down-regulation of biological N fixation in non-N-limited conditions, they still simulate high low-latitude biological N fixation. This suggests that the strength of regulation of biological N fixation could be insufficient and/or that there could be unaccounted N sources at low latitudes. For example, rock N weathering could be a significant N source to terrestrial ecosystems. Some estimates have suggested that rock N weathering could be as high as 11–18 Tg N yr−1 globally (Houlton et al., 2018) but is not explicitly represented in the TRENDY-N ensemble (with the exception of LPX-Bern, which calculates all external N sources post hoc to simulate a closed N cycle, thereby implicitly including rock N sources). The discrepancy between modelled and observed biological N fixation could also be due to uncertainty in the observation-based dataset given the difficulties associated with measuring biological N fixation (Soper et al., 2021). Ecological theory (Hedin et al., 2009) has suggested that natural biological N fixation should be higher at low latitudes given large N losses, in contrast to the observation-based dataset from Davies-Barnard and Friedlingstein (2020). Furthermore, the observation-based dataset from Davies-Barnard and Friedlingstein (2020) did not explicitly account for agricultural biological N fixation but rather assumed that crop biological N fixation rates are equivalent to those of grasses, although they are likely to be much greater (Peoples et al., 2021; Herridge et al., 2022).
The TRENDY-N ensemble overestimated the global observation-based vegetation C : N ratio but reproduced its latitudinal pattern (as also indicated by its higher spatial distribution score) (Fig. 7c, d). This is because most models represent different plant functional types (e.g., evergreen needleleaf trees, deciduous broadleaf trees, evergreen broadleaf trees) with different tissue C : N ratios (which can be either flexible within a constrained range or time invariant). These plant functional types are geographically distributed according to similar land cover products. The TRENDY-N ensemble overestimated global observation-based soil C : N ratio and failed to reproduce its latitudinal pattern (as also indicated by its lower spatial distribution score) (Fig. 7e, f). In particular, models failed to reproduce the peak at the Equator and the peak at approximately −30∘ S, corresponding to tropical forests and deserts, respectively. This is because most models represent a constant soil C : N ratio (both temporally and spatially) and are thus unable to capture the spatial variability in the soil C : N ratio. Improving the representation of soil N is an important future direction for terrestrial biosphere model development given the essential feedbacks between soil N and soil C.
4.2 Disconnect between C and N cycling in terrestrial biosphere models
The importance of N limitation of terrestrial C sequestration is empirically established (Elser et al., 2007; LeBauer and Treseder, 2008; Wright et al., 2018). It has already influenced the historical terrestrial C sink (S. Wang et al., 2020), and it is expected to be especially important under future CO2 fertilization and global change (Terrer et al., 2019). While all TRENDY-N models simulate the historical terrestrial C sink in line with observations (and are no different from TRENDY models without a representation N cycling; Seiler et al., 2022), our results suggest a disconnect between C and N cycling in these models. First, the models exhibit a wide spread across simulated N pools and fluxes. Second, there are no significant correlations between model performance in simulating N cycling and model performance in simulating C cycling. Third, there are no statistically significant differences between models with different representations of fundamental N cycling processes (N limitation of vegetation growth, biological N fixation, the response of vegetation to N limitation, and N limitation of decomposition).
Overall, our results suggest that the underlying N cycling processes that regulate terrestrial C sequestration operate differently across models and may not be fully captured given that models are calibrated to C cycling. The spread across models suggests that approaches to represent N cycling processes vary among models and that there is no clear consensus yet on what the best approaches are. Studies have explored the validity of different representations of N cycling processes within a single model, suggesting that alternative representations of a biological N fixation, ecosystem C : N stoichiometry, and ecosystem N losses lead to substantial differences in simulated C cycling (Kou-Giesbrecht and Arora, 2022; Meyerholt et al., 2020; Peng et al., 2020; Wieder et al., 2015a). This disconnect between C and N cycling will become particularly consequential for projecting the terrestrial C sink under future global change, which is likely to modify the C–N balance through N limitation of CO2 fertilization and intensifying N deposition (among other effects of global change).
4.3 Future directions
Evaluating N cycling in terrestrial biosphere models is severely restricted by the lack of available observations of N cycling. N cycling processes are notoriously difficult to measure, such as biological N fixation (Soper et al., 2021) and gaseous N losses (Barton et al., 2015). In the past, N cycling has commonly been evaluated by comparison to estimates of global N pools and fluxes derived from a small number of observations that have been scaled up or averaged to yield a value with wide confidence intervals (Davies-Barnard et al., 2020). Not only are these global totals highly uncertain, but they also do not allow for the analysis of spatial patterns. Here, we present an improved framework to evaluate three key N cycling processes – biological N fixation, vegetation C : N ratio, and soil C : N ratio – in terrestrial biosphere models. However, these globally gridded observation-based datasets are also uncertain, given uncertainty in the estimates of tissue C : N ratios for different plant functional types, tissue fraction of total biomass (especially those of roots and wood, which had a lower number of measurements in comparison to that of leaves), and the measurements and models used to derive soil N (Batjes et al., 2020). More observations of these N cycling processes are necessary to reduce uncertainty. Temporally explicit measurements are important for assessing intra-annual and inter-annual variability. Leveraging advances in remote sensing (Knyazikhin et al., 2013; Townsend et al., 2013; Cawse-Nicholson et al., 2021) and incorporating N cycling process measurements into research networks such as FLUXNET (Vicca et al., 2018) are essential. Multiple observation-based datasets taken from different sources and derived via different methodologies of a given N cycling process are necessary to evaluate observational uncertainty (Seiler et al., 2021). Global observations of other important N cycling processes (such as N mineralization and N losses) are necessary to fully evaluate N cycling in terrestrial biosphere models. Additionally, hindcast simulations of the transition from the Last Glacial Maximum to the pre-industrial period can be used in combination with proxy-based reconstructions of past N2O emissions (Fischer et al., 2019) and C stocks (Jeltsch-Thömmes et al., 2019) for model evaluation and can serve as a constraint for terrestrial biosphere models (Joos et al., 2020).
Modelled experimental manipulations (such as CO2 fertilization or N fertilization experiments) are imperative to evaluate model formulations of the underlying mechanisms of C–N cycling interactions (Medlyn et al., 2015; Wieder et al., 2019; Zaehle et al., 2014). Derived nutrient limitation products (Fisher et al., 2012) can also be applied to evaluate present-day nutrient cycling when phosphorus (P) is accounted for (Braghiere et al., 2022). Evaluating the ability of models to simulate present-day N cycling processes, as we did here, is only one method of assessing their ability to simulate N limitation of terrestrial C sequestration. A robust test of the simulated response to CO2 fertilization and N fertilization across models would be ideal for evaluating the ability of models to represent the regulation of C cycling by N cycling under global change and thus their ability to realistically simulate the future terrestrial C sink.
While some of the models in the TRENDY-N ensemble have the capability of representing coupled C, N, and P cycling (Goll et al., 2012; Nakhavali et al., 2022; Sun et al., 2021; Wang et al., 2010; Z. Wang et al., 2020; Yang et al., 2014), P cycling was not active in the model simulations in the GCP 2022. P limitation could be important for limiting terrestrial C sequestration, especially in low-latitude forests (Elser et al., 2007; Terrer et al., 2019; Wieder et al., 2015b). As more models incorporate coupled C–N–P cycling (Reed et al., 2015; Braghiere et al., 2022), observation-based datasets of P will also be necessary for model evaluation.
Because the TRENDY-N ensemble overestimated both vegetation and soil C : N ratios, it is possible that models could overestimate assimilated C per unit N and thus future terrestrial C sequestration under CO2 fertilization. Alongside discrepancies in biological N fixation, this could lead to biases in projections of the future terrestrial C sink by the TRENDY-N ensemble. Not to mention there are several other terrestrial biosphere models in the TRENDY ensemble that do not represent coupled C–N cycling. While the models are capable of reproducing the current terrestrial C sink, the spread across the models in simulating N cycling suggests that C–N interactions operate differently across models and may not be fully captured given that models are calibrated to C cycling. However, these C–N interactions are critical for projecting the terrestrial C sink under global change in the future.
Table A1IGBP land cover type, corresponding TRY plant trait database PFT, tissue C : N ratios from the TRY plant trait database (Kattge et al., 2020), tissue fractions (Poorter et al., 2012), and calculated total C : N ratio.
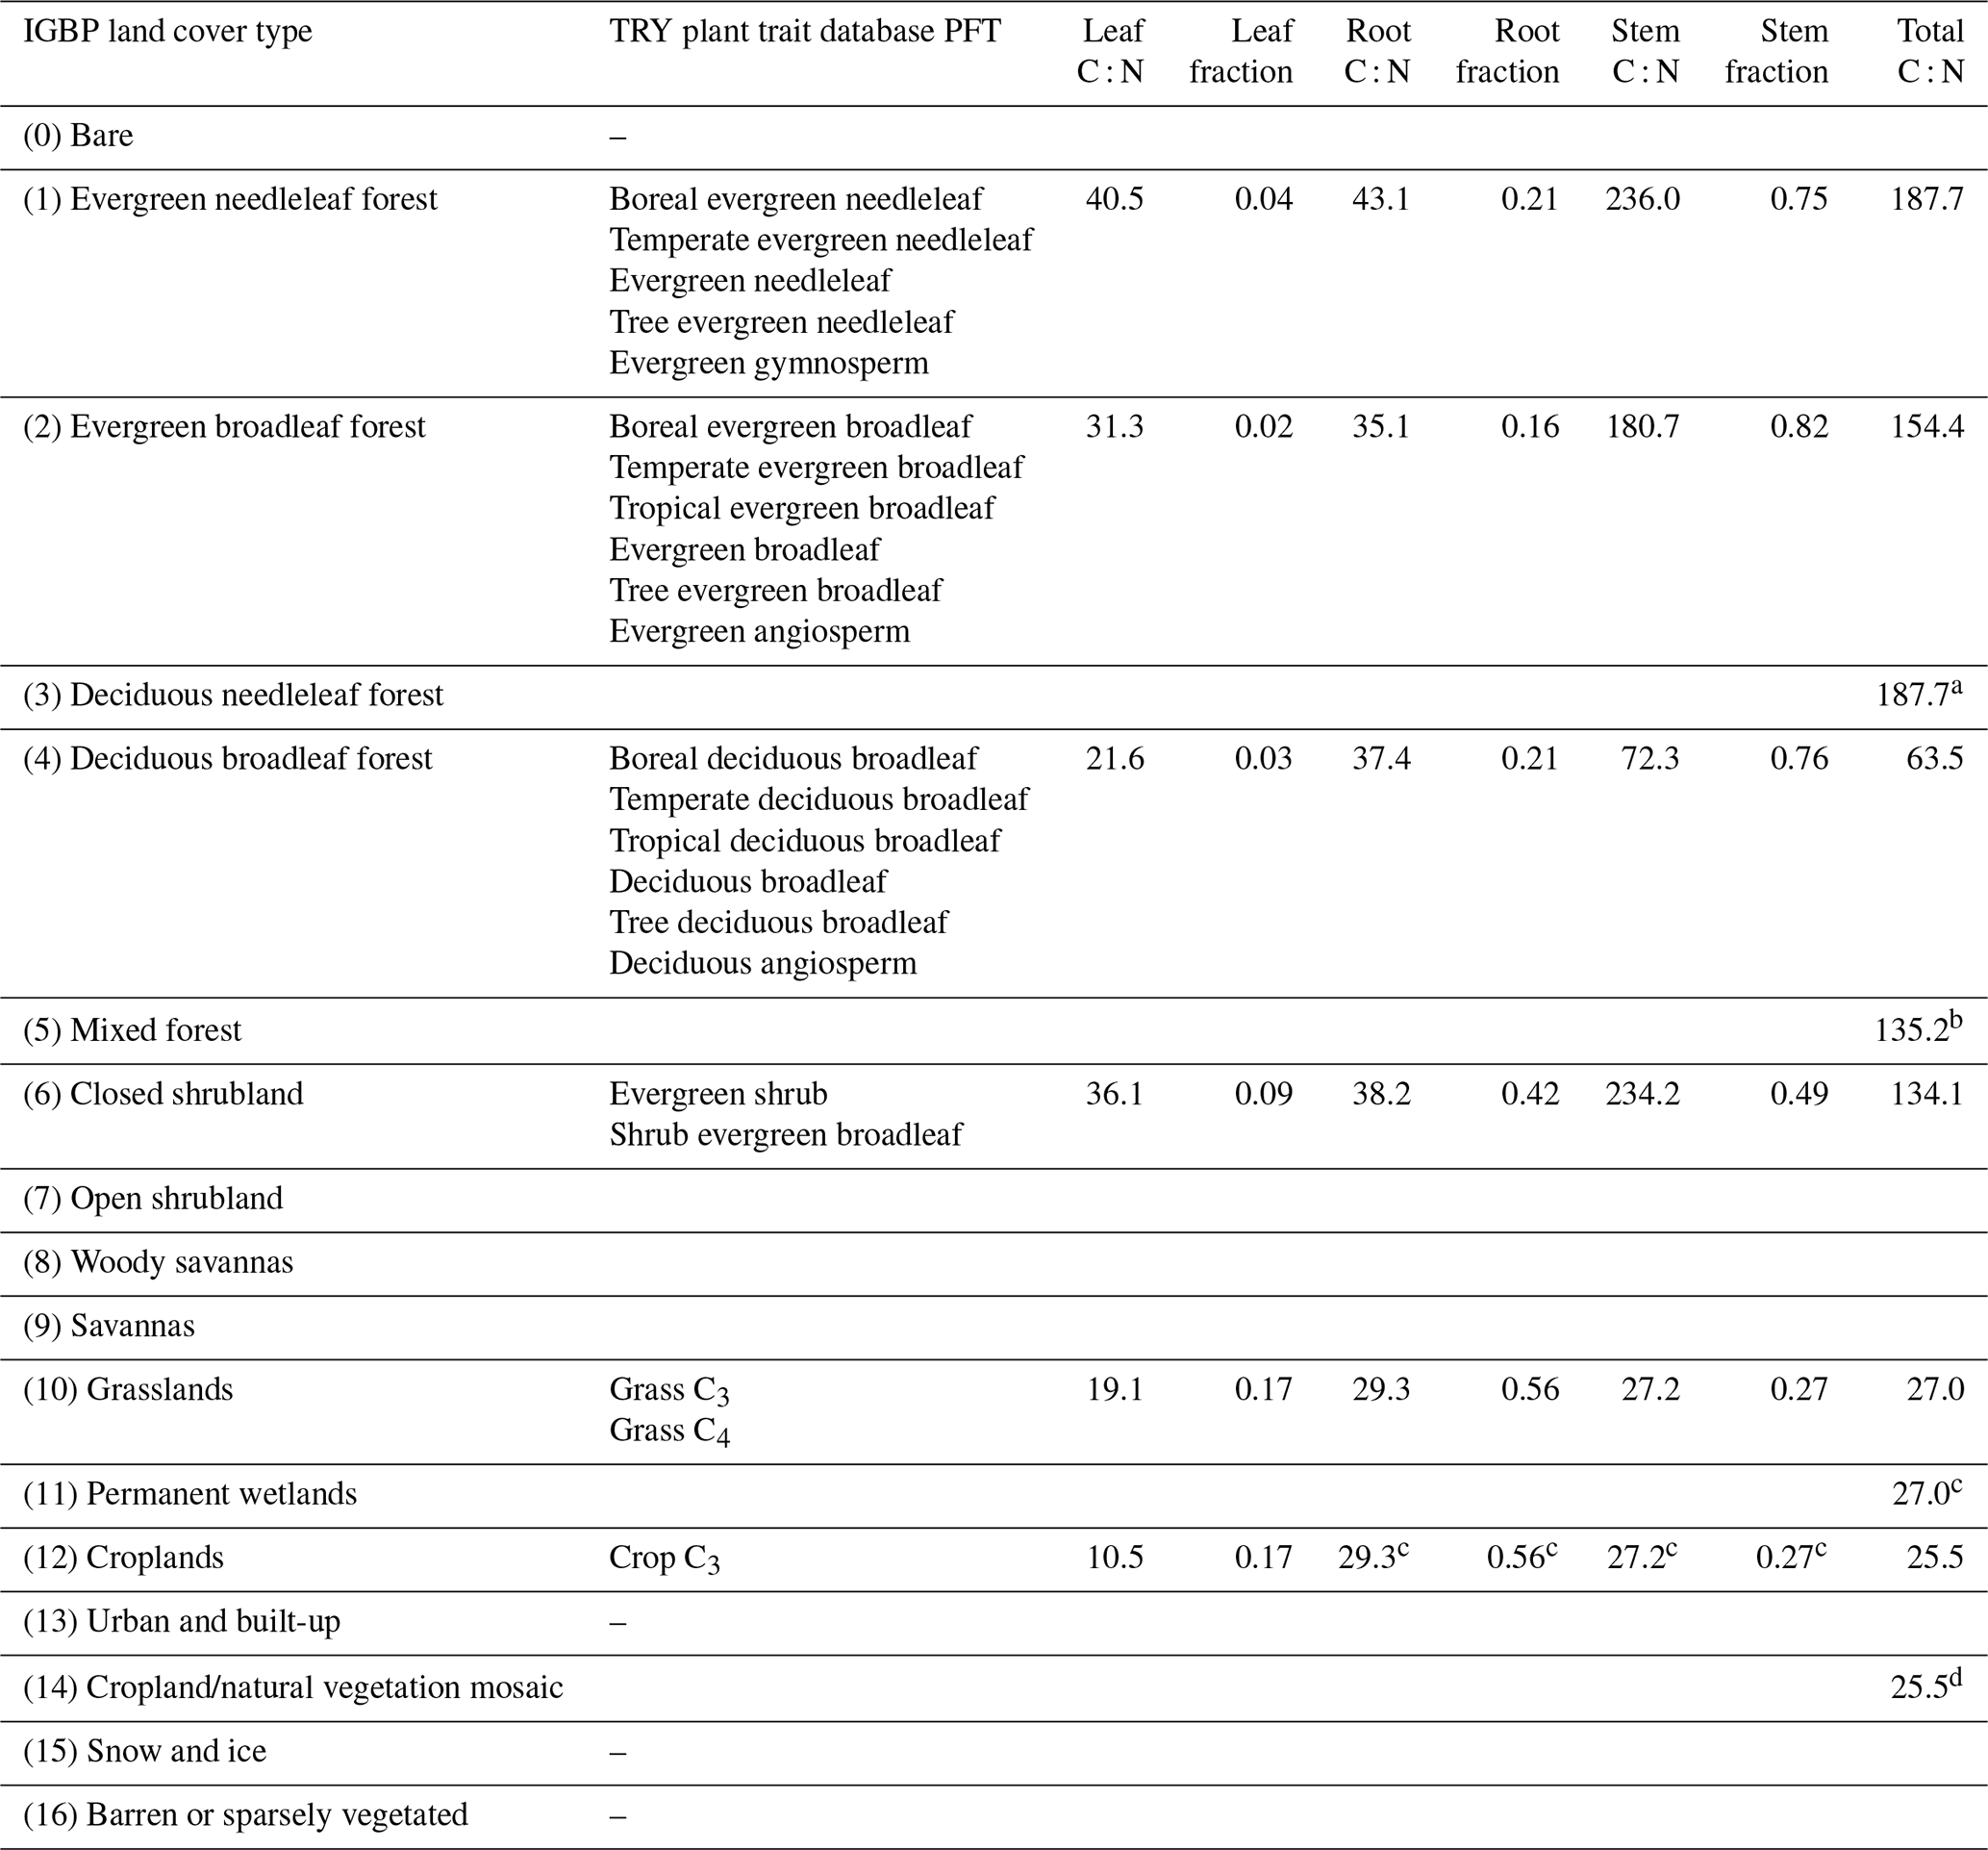
a Value from evergreen needleleaf forest. b Average of evergreen needleleaf forest, evergreen broadleaf forest, and deciduous broadleaf forest. c Value from grasslands. d Value from croplands.
Table A2Kendall's tau from the Mann–Kendall test (p value < 0.05) for each N pool and N flux time series simulated by the TRENDY-N ensemble from 1850 to 2021. NS indicates that Kendall's tau is not significant. NA indicates that the variable was not reported by the model.
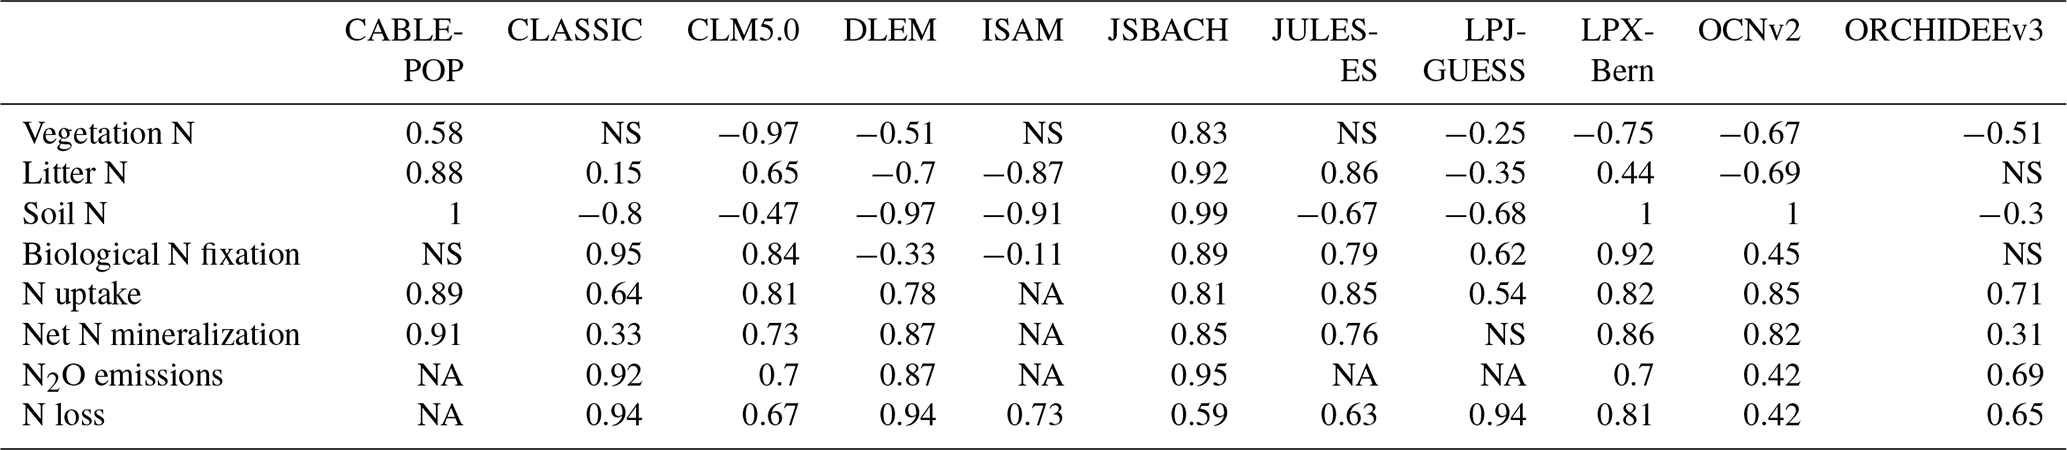
Table A3Time mean bias score (Sbias), spatial distribution score (Sdist), and overall score (Soverall) of the TRENDY-N ensemble in simulating biological N fixation, vegetation C : N ratio, and soil C : N ratio. NA indicates that this variable was not evaluated.
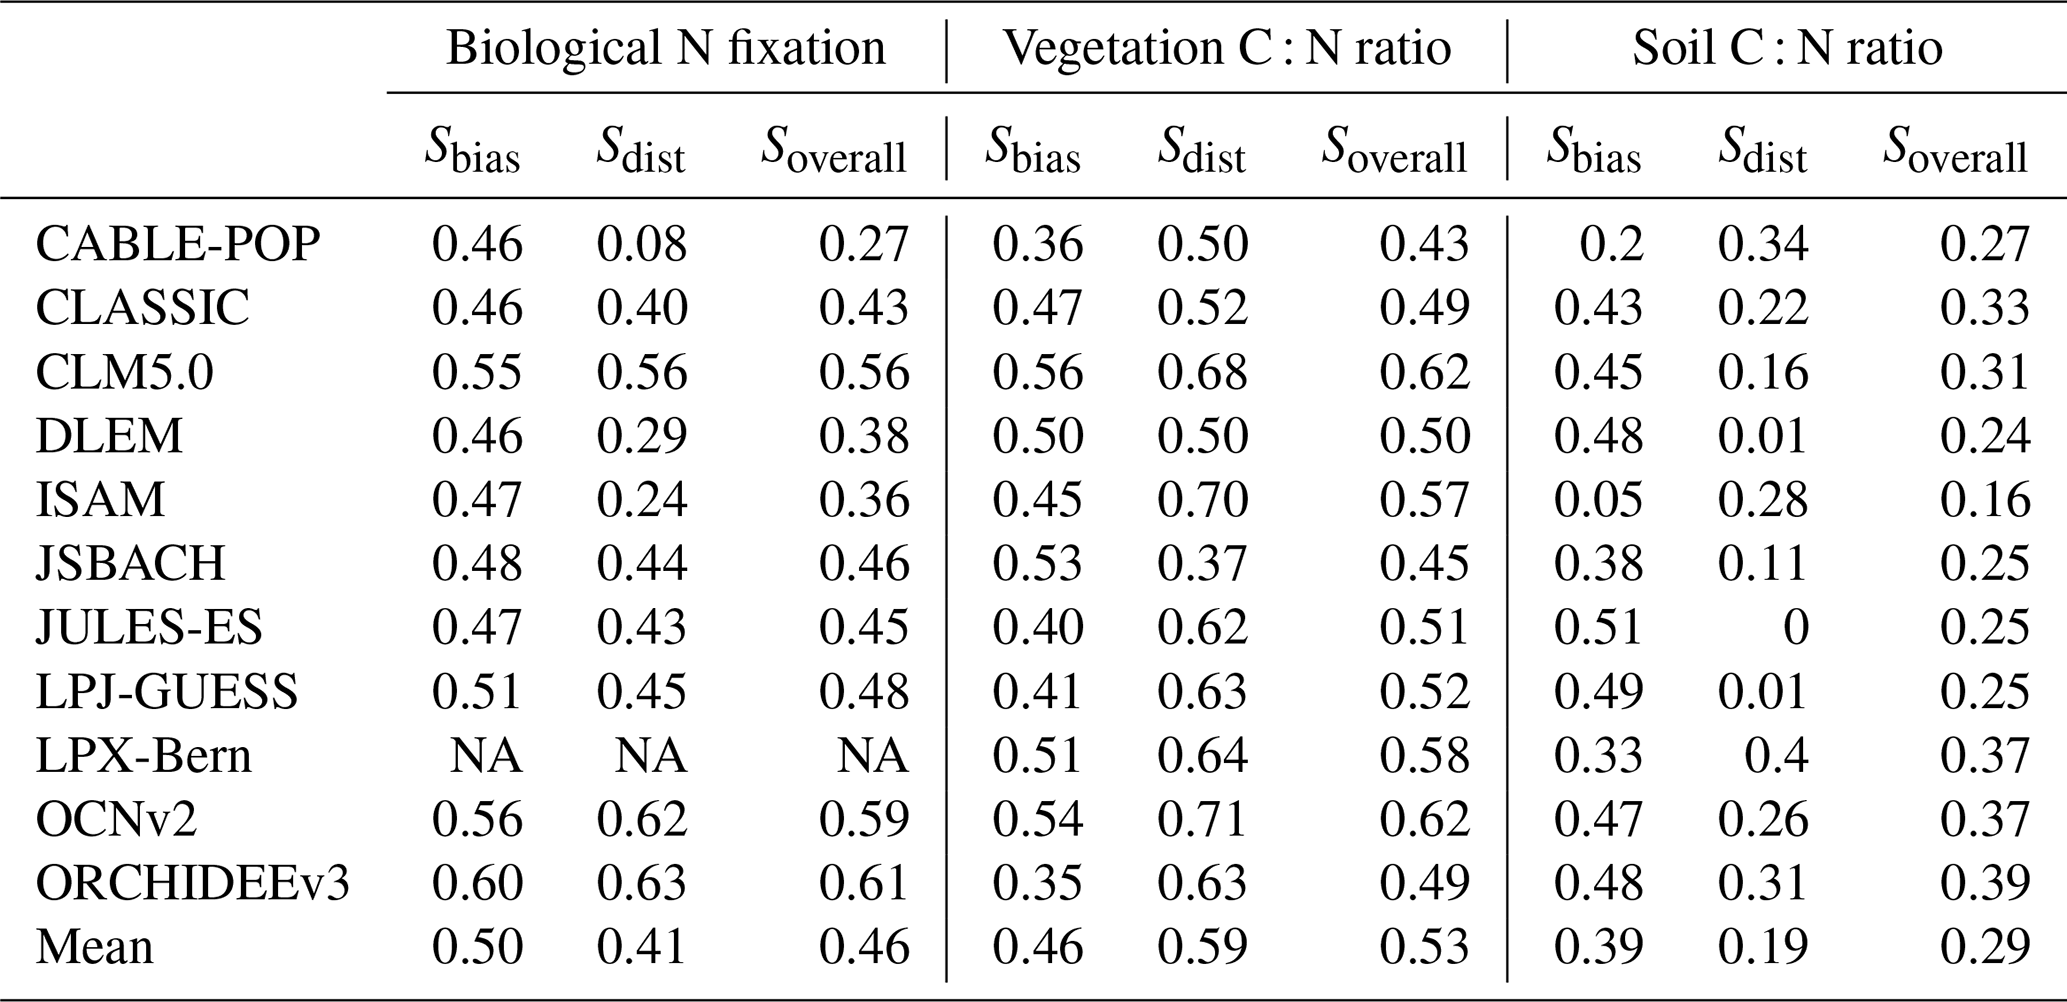
Table A4Overall scores of biological N fixation, vegetation C : N ratio, soil C : N ratio, and NBP averaged across TRENDY-N ensemble models with different representations of key N cycling processes (N limitation of vegetation growth, biological N fixation, vegetation response to N limitation, and N limitation of decomposition; see Table 1). The p values are from t tests and ANOVAs assessing differences between these representations of key N cycling processes.
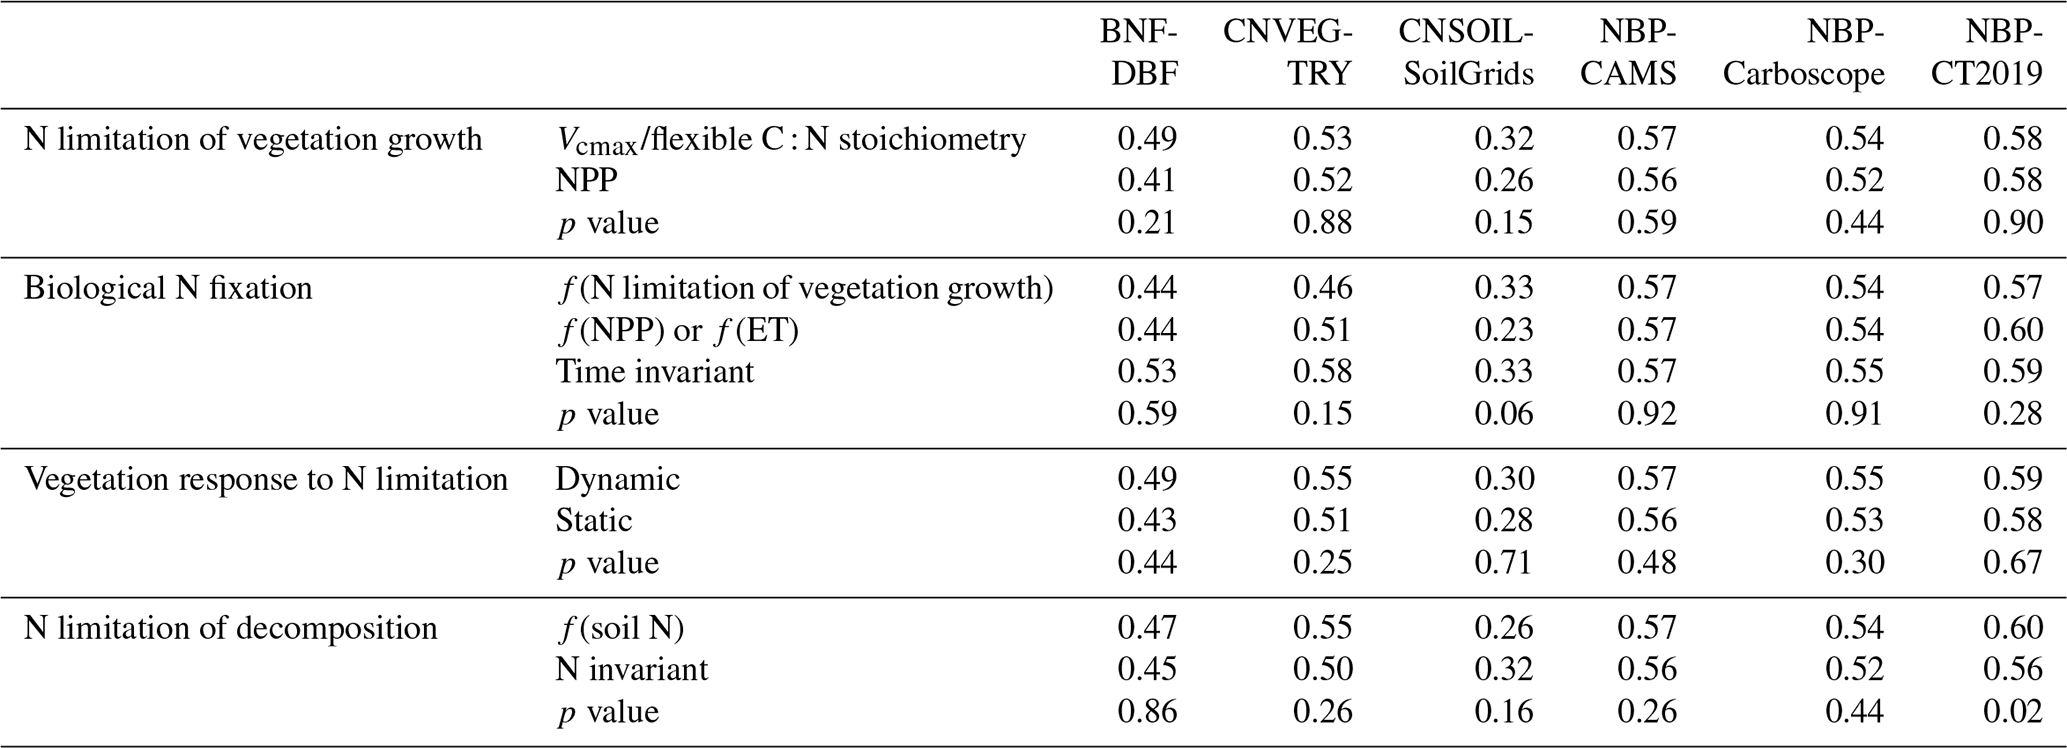
Table A5Present-day global values of biological N fixation, vegetation C : N ratio, and soil C : N ratio averaged across TRENDY-N ensemble models with different representations of key N cycling processes (N limitation of vegetation growth, biological N fixation, vegetation response to N limitation, and N limitation of decomposition; see Table 1). The p values are from t tests and ANOVAs assessing differences between these representations of key N cycling processes.
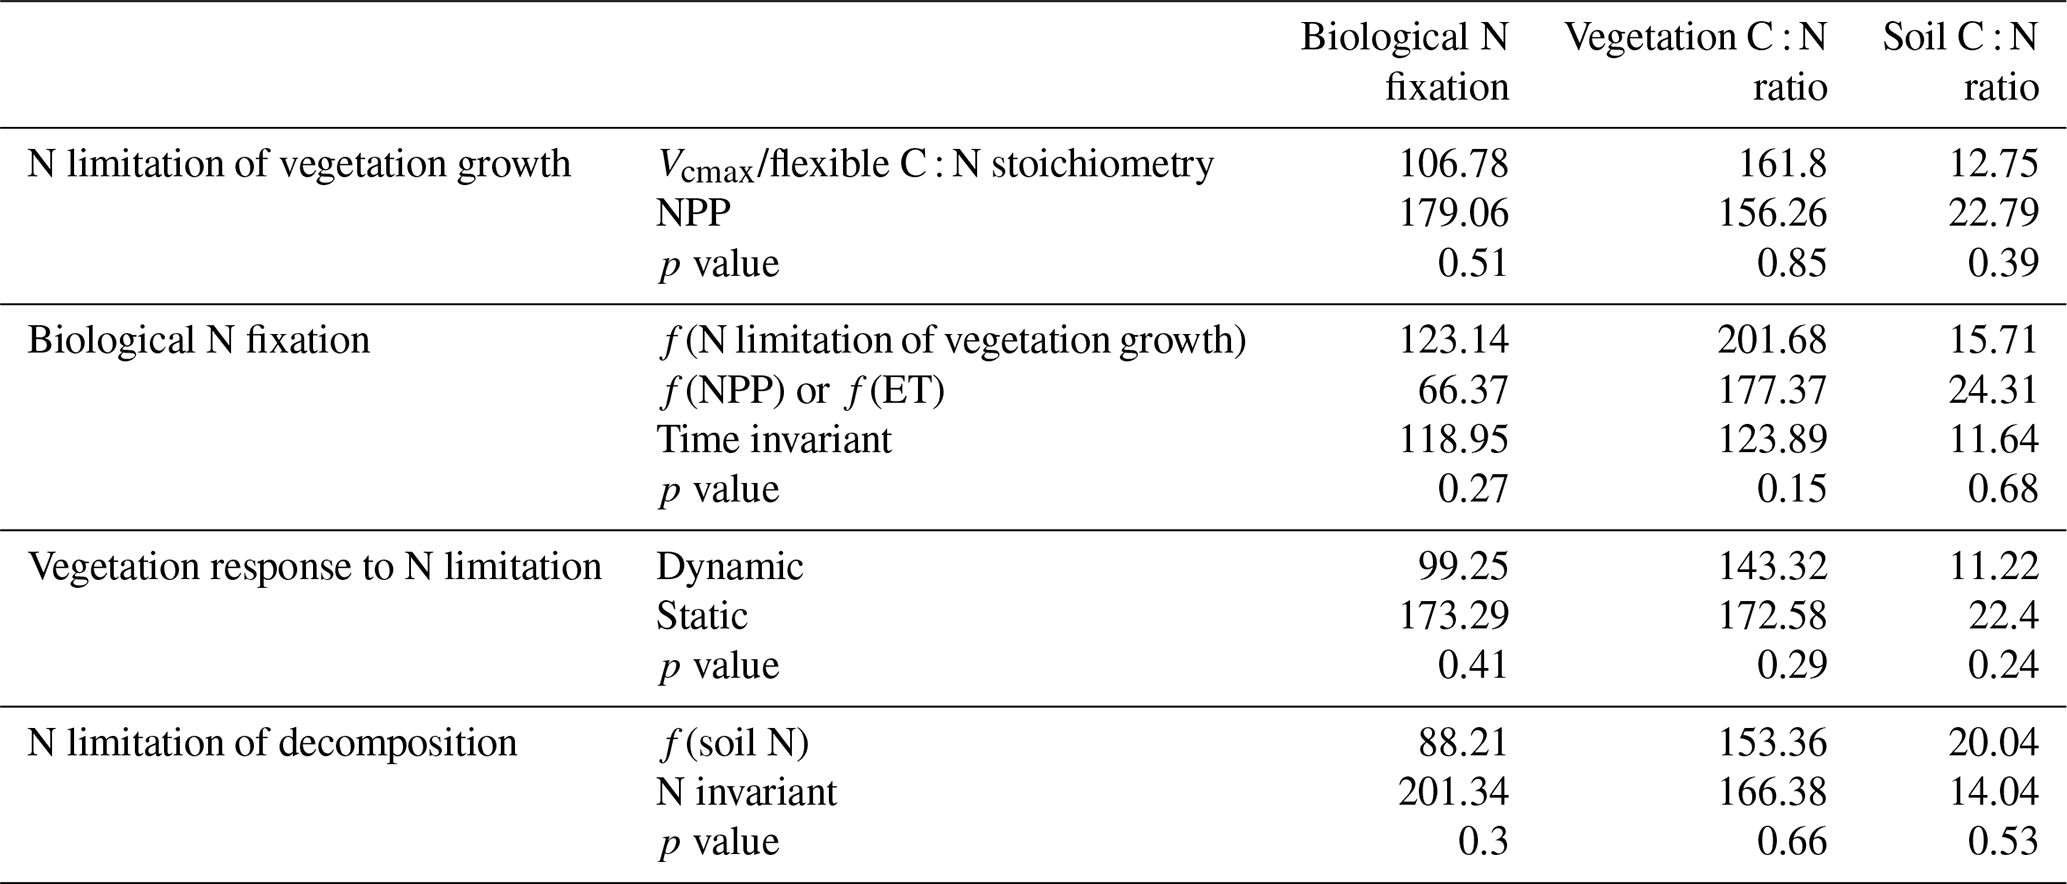
Table A6Kendall's tau from the Mann–Kendall test (p value < 0.05) for biological N fixation, vegetation C : N ratio, and soil C : N ratio averaged across TRENDY-N ensemble models with different representations of key N cycling processes (N limitation of vegetation growth, biological N fixation, vegetation response to N limitation, and N limitation of decomposition; see Table 1). The p values are from t tests and ANOVAs assessing differences between these representations of key N cycling processes.
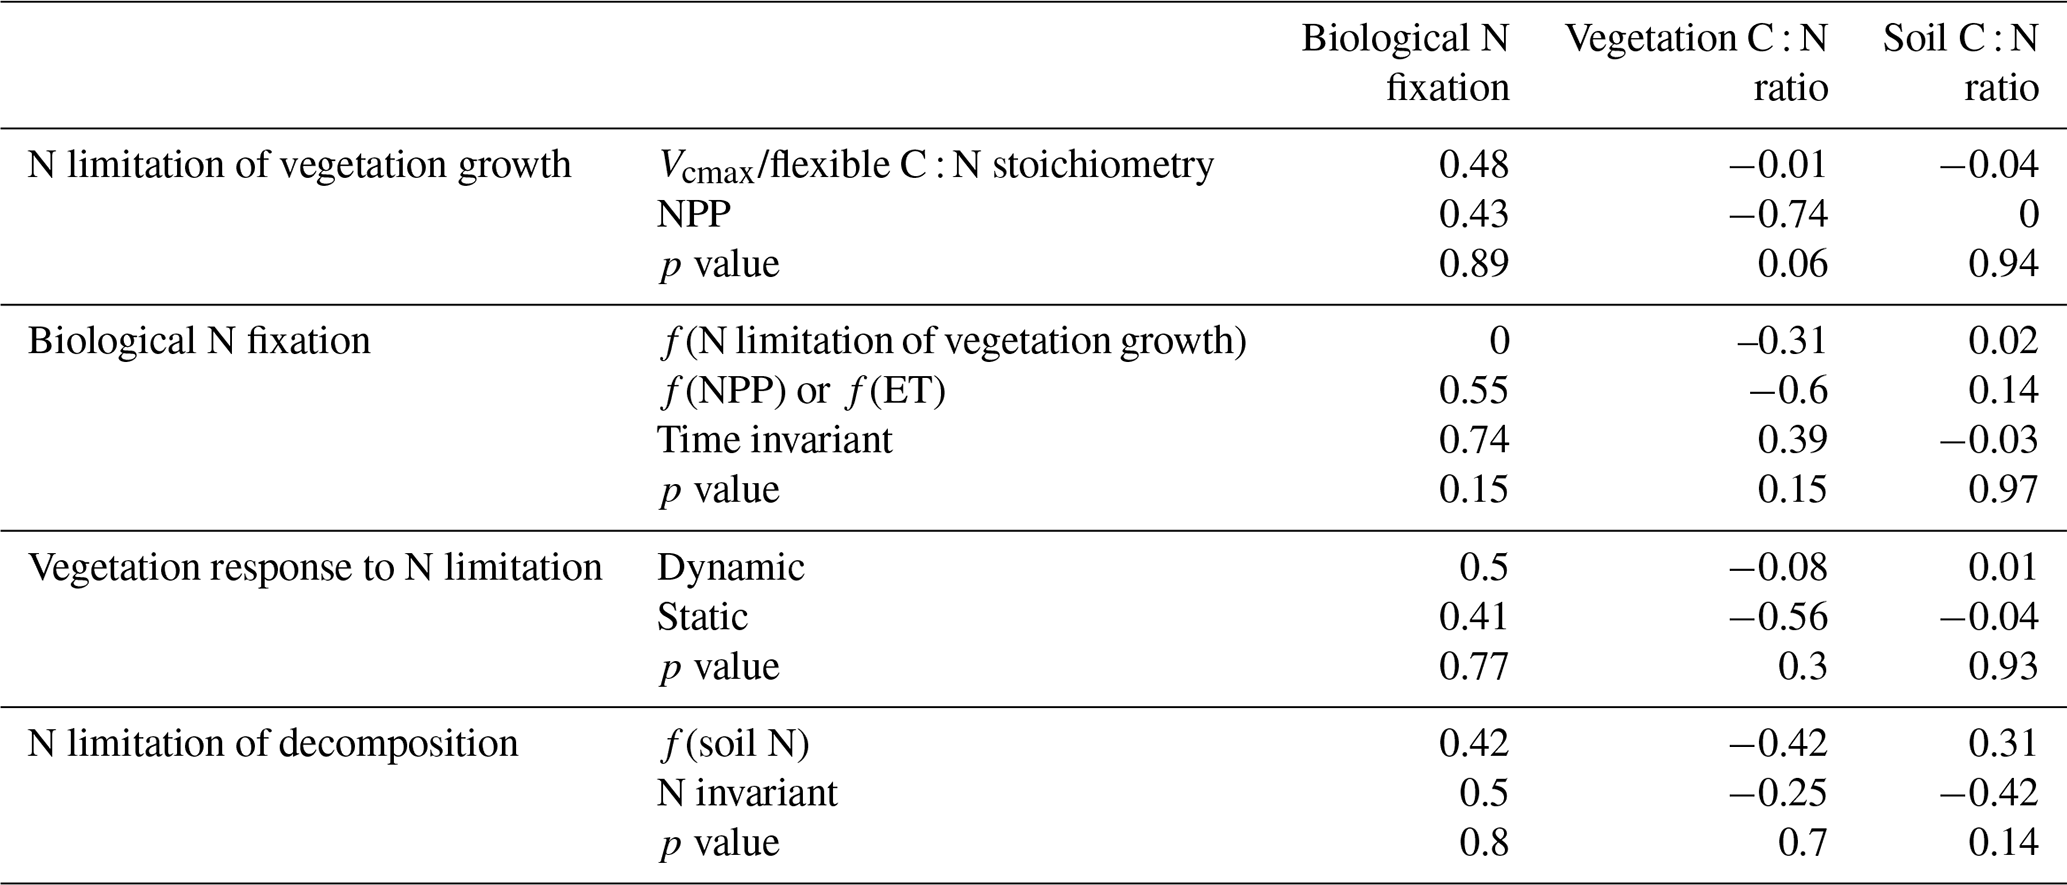
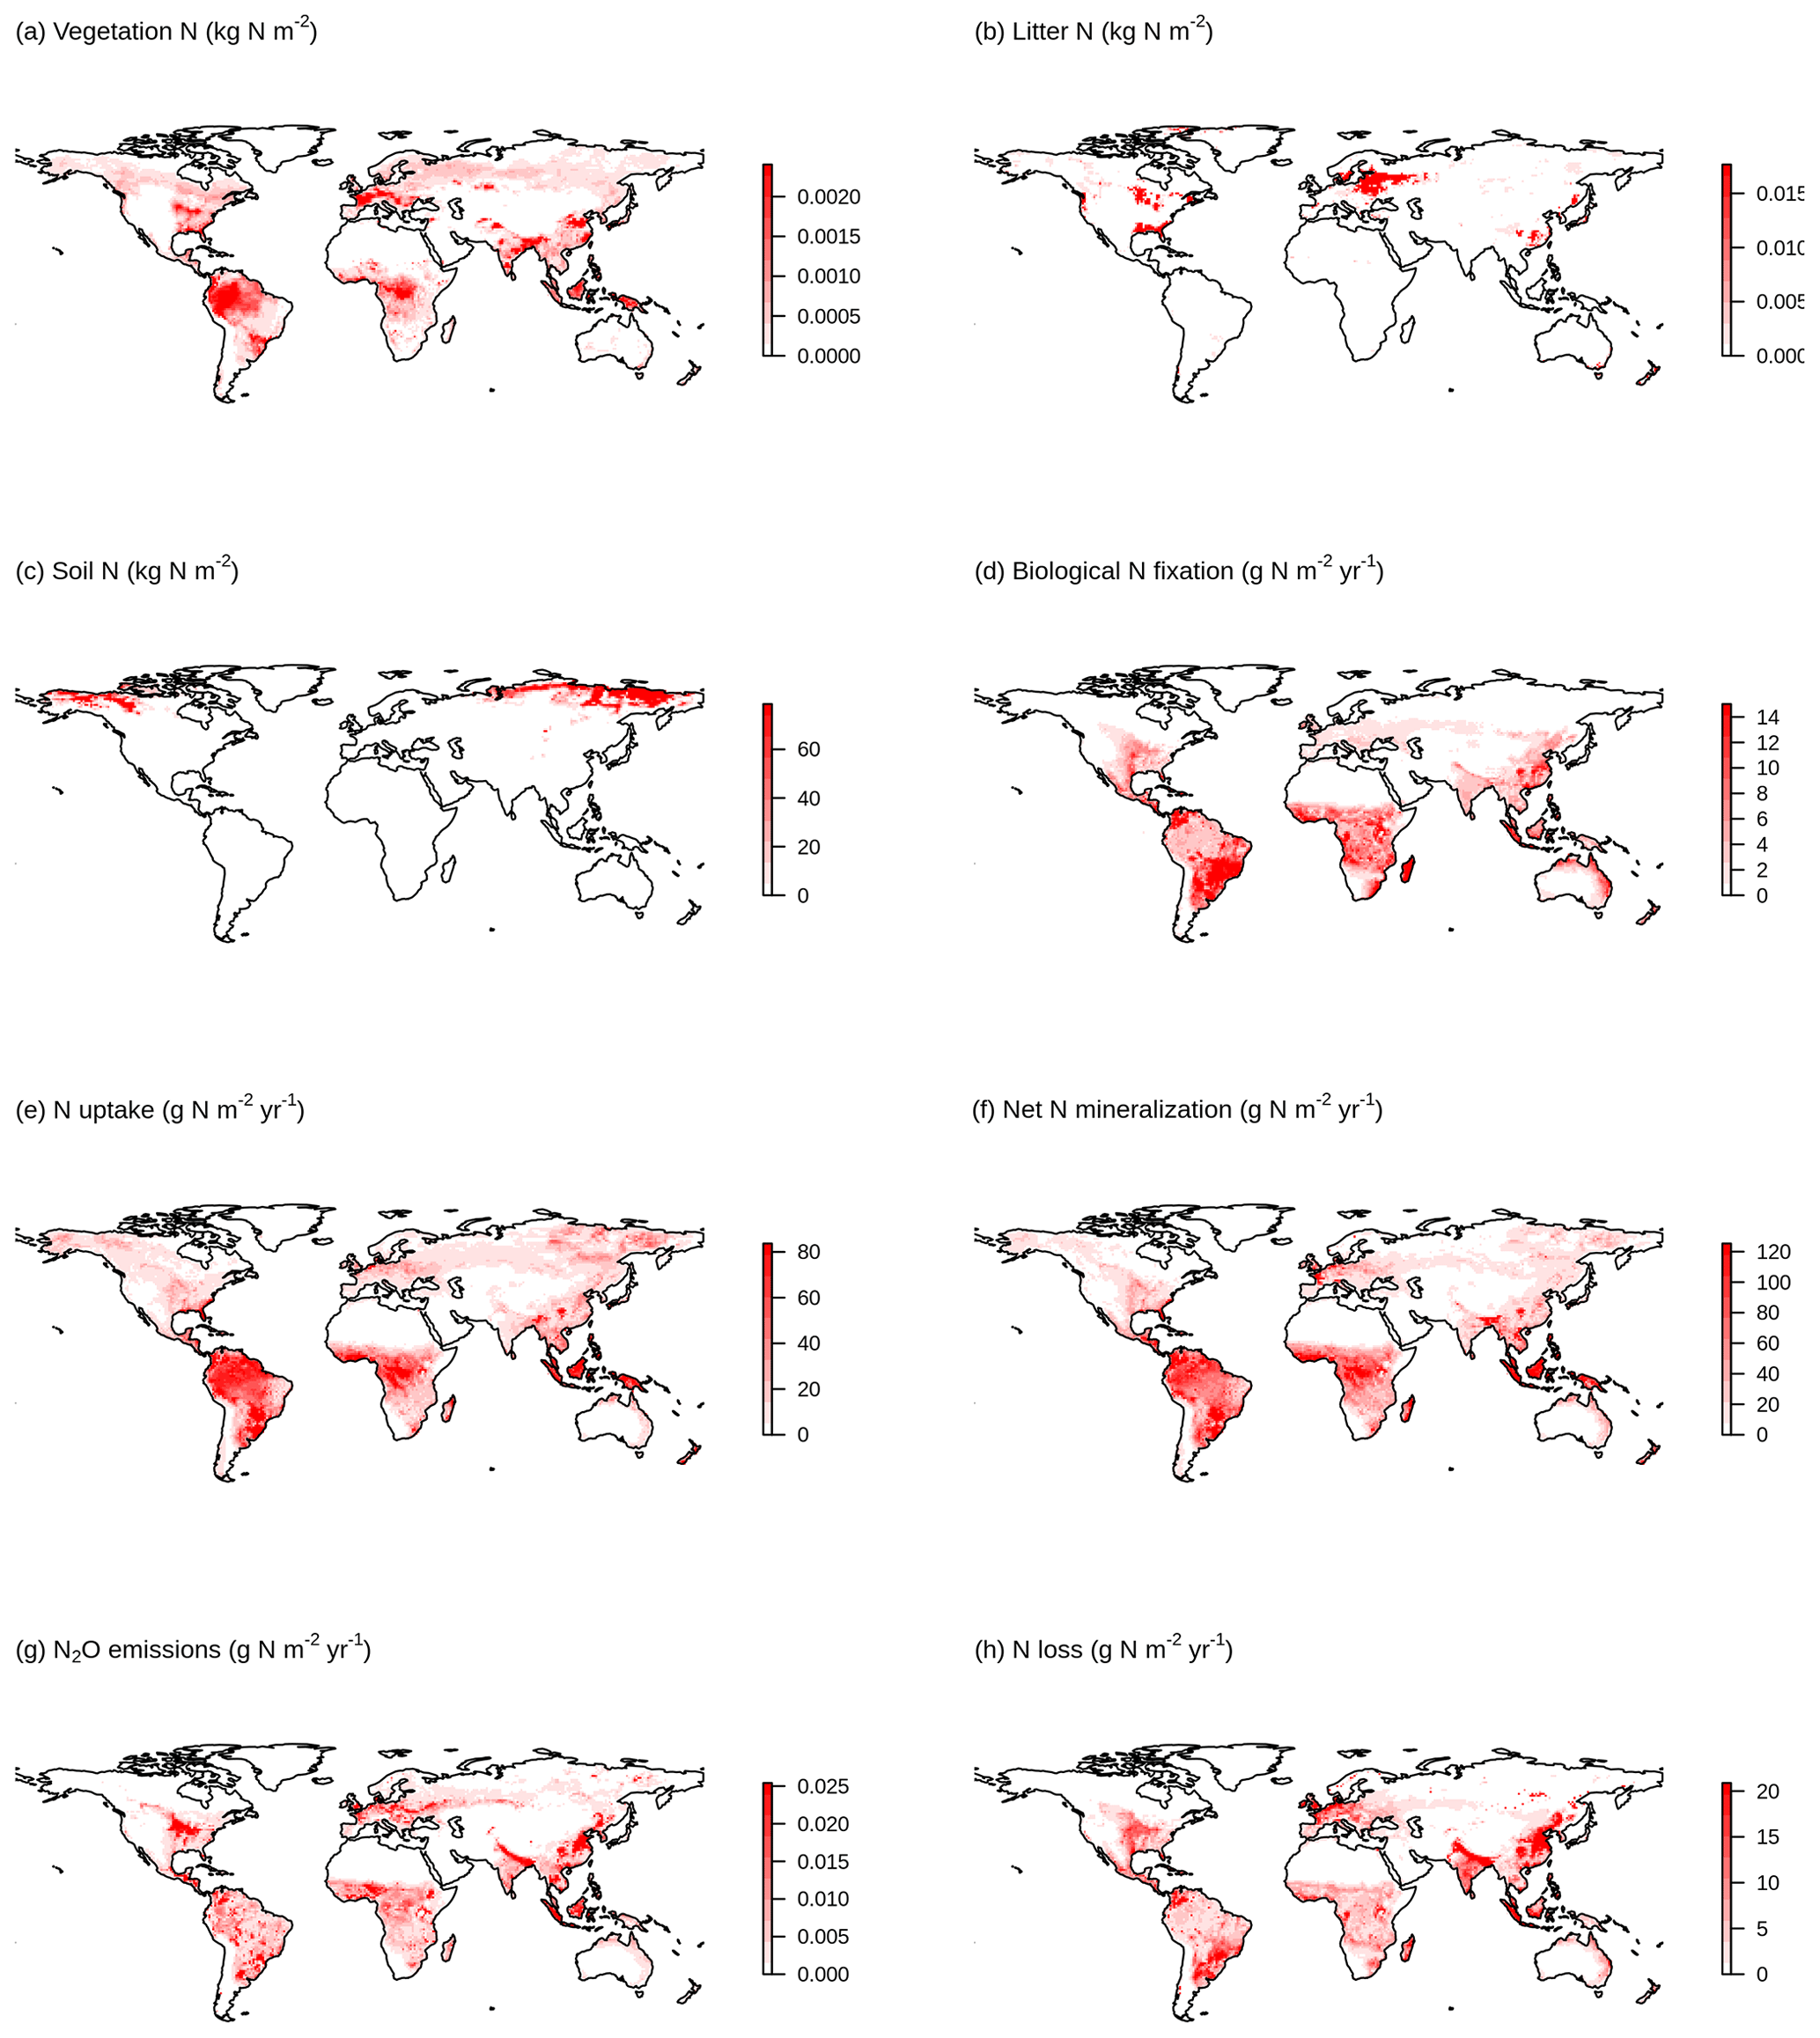
Figure A1Geographical distributions of variation in (a) vegetation N, (b) litter N, (c) soil N, (d) biological N fixation, (e) N uptake, (f) net N mineralization, (g) N2O emissions, and (h) N loss simulated by the TRENDY-N ensemble (across models over 1980–2021).
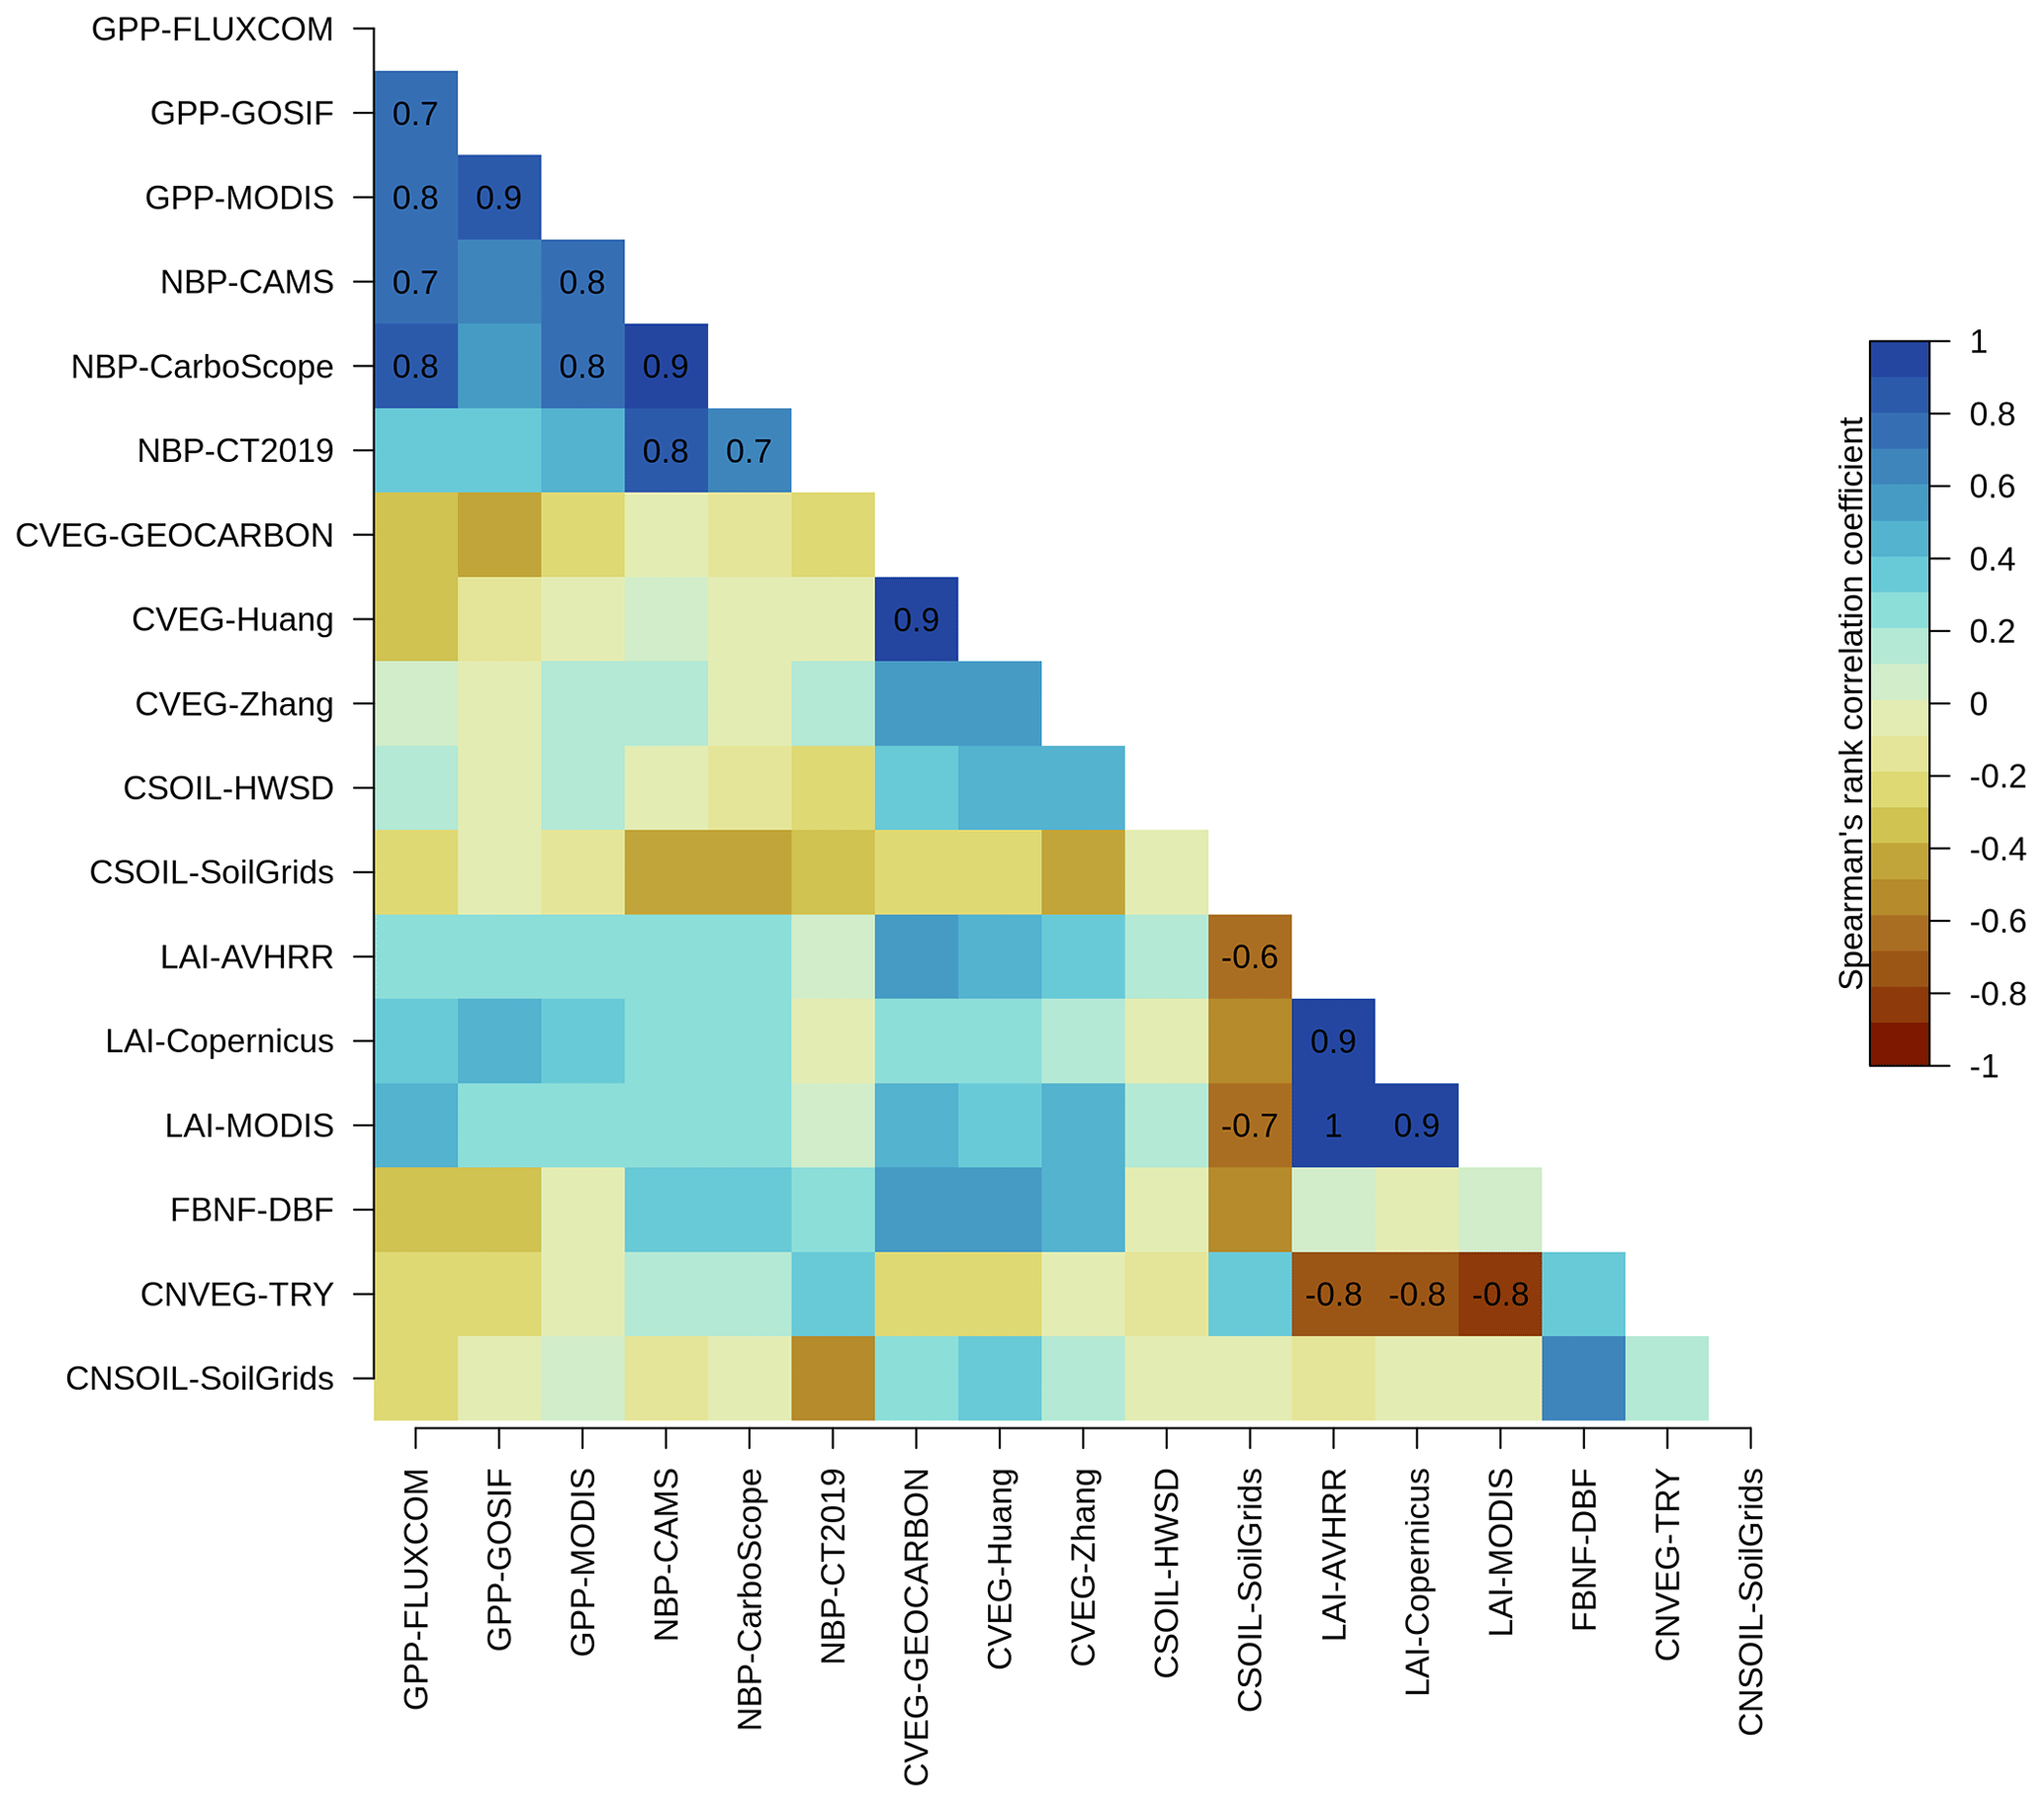
Figure A2Correlations between overall scores of primary C and N pools and fluxes across TRENDY-N ensemble models: gross primary productivity (GPP), net biome productivity (NBP), vegetation C (CVEG), soil C (CSOIL), leaf area index (LAI), biological N fixation (FBNF), vegetation C : N ratio (CNVEG), and soil C : N ratio (CNSOIL). Abbreviations of the observation-based datasets are described in Sect. 2 and in Seiler et al. (2022). Spearman's rank correlation coefficient is shown for statistically significant correlations (p value < 0.05).
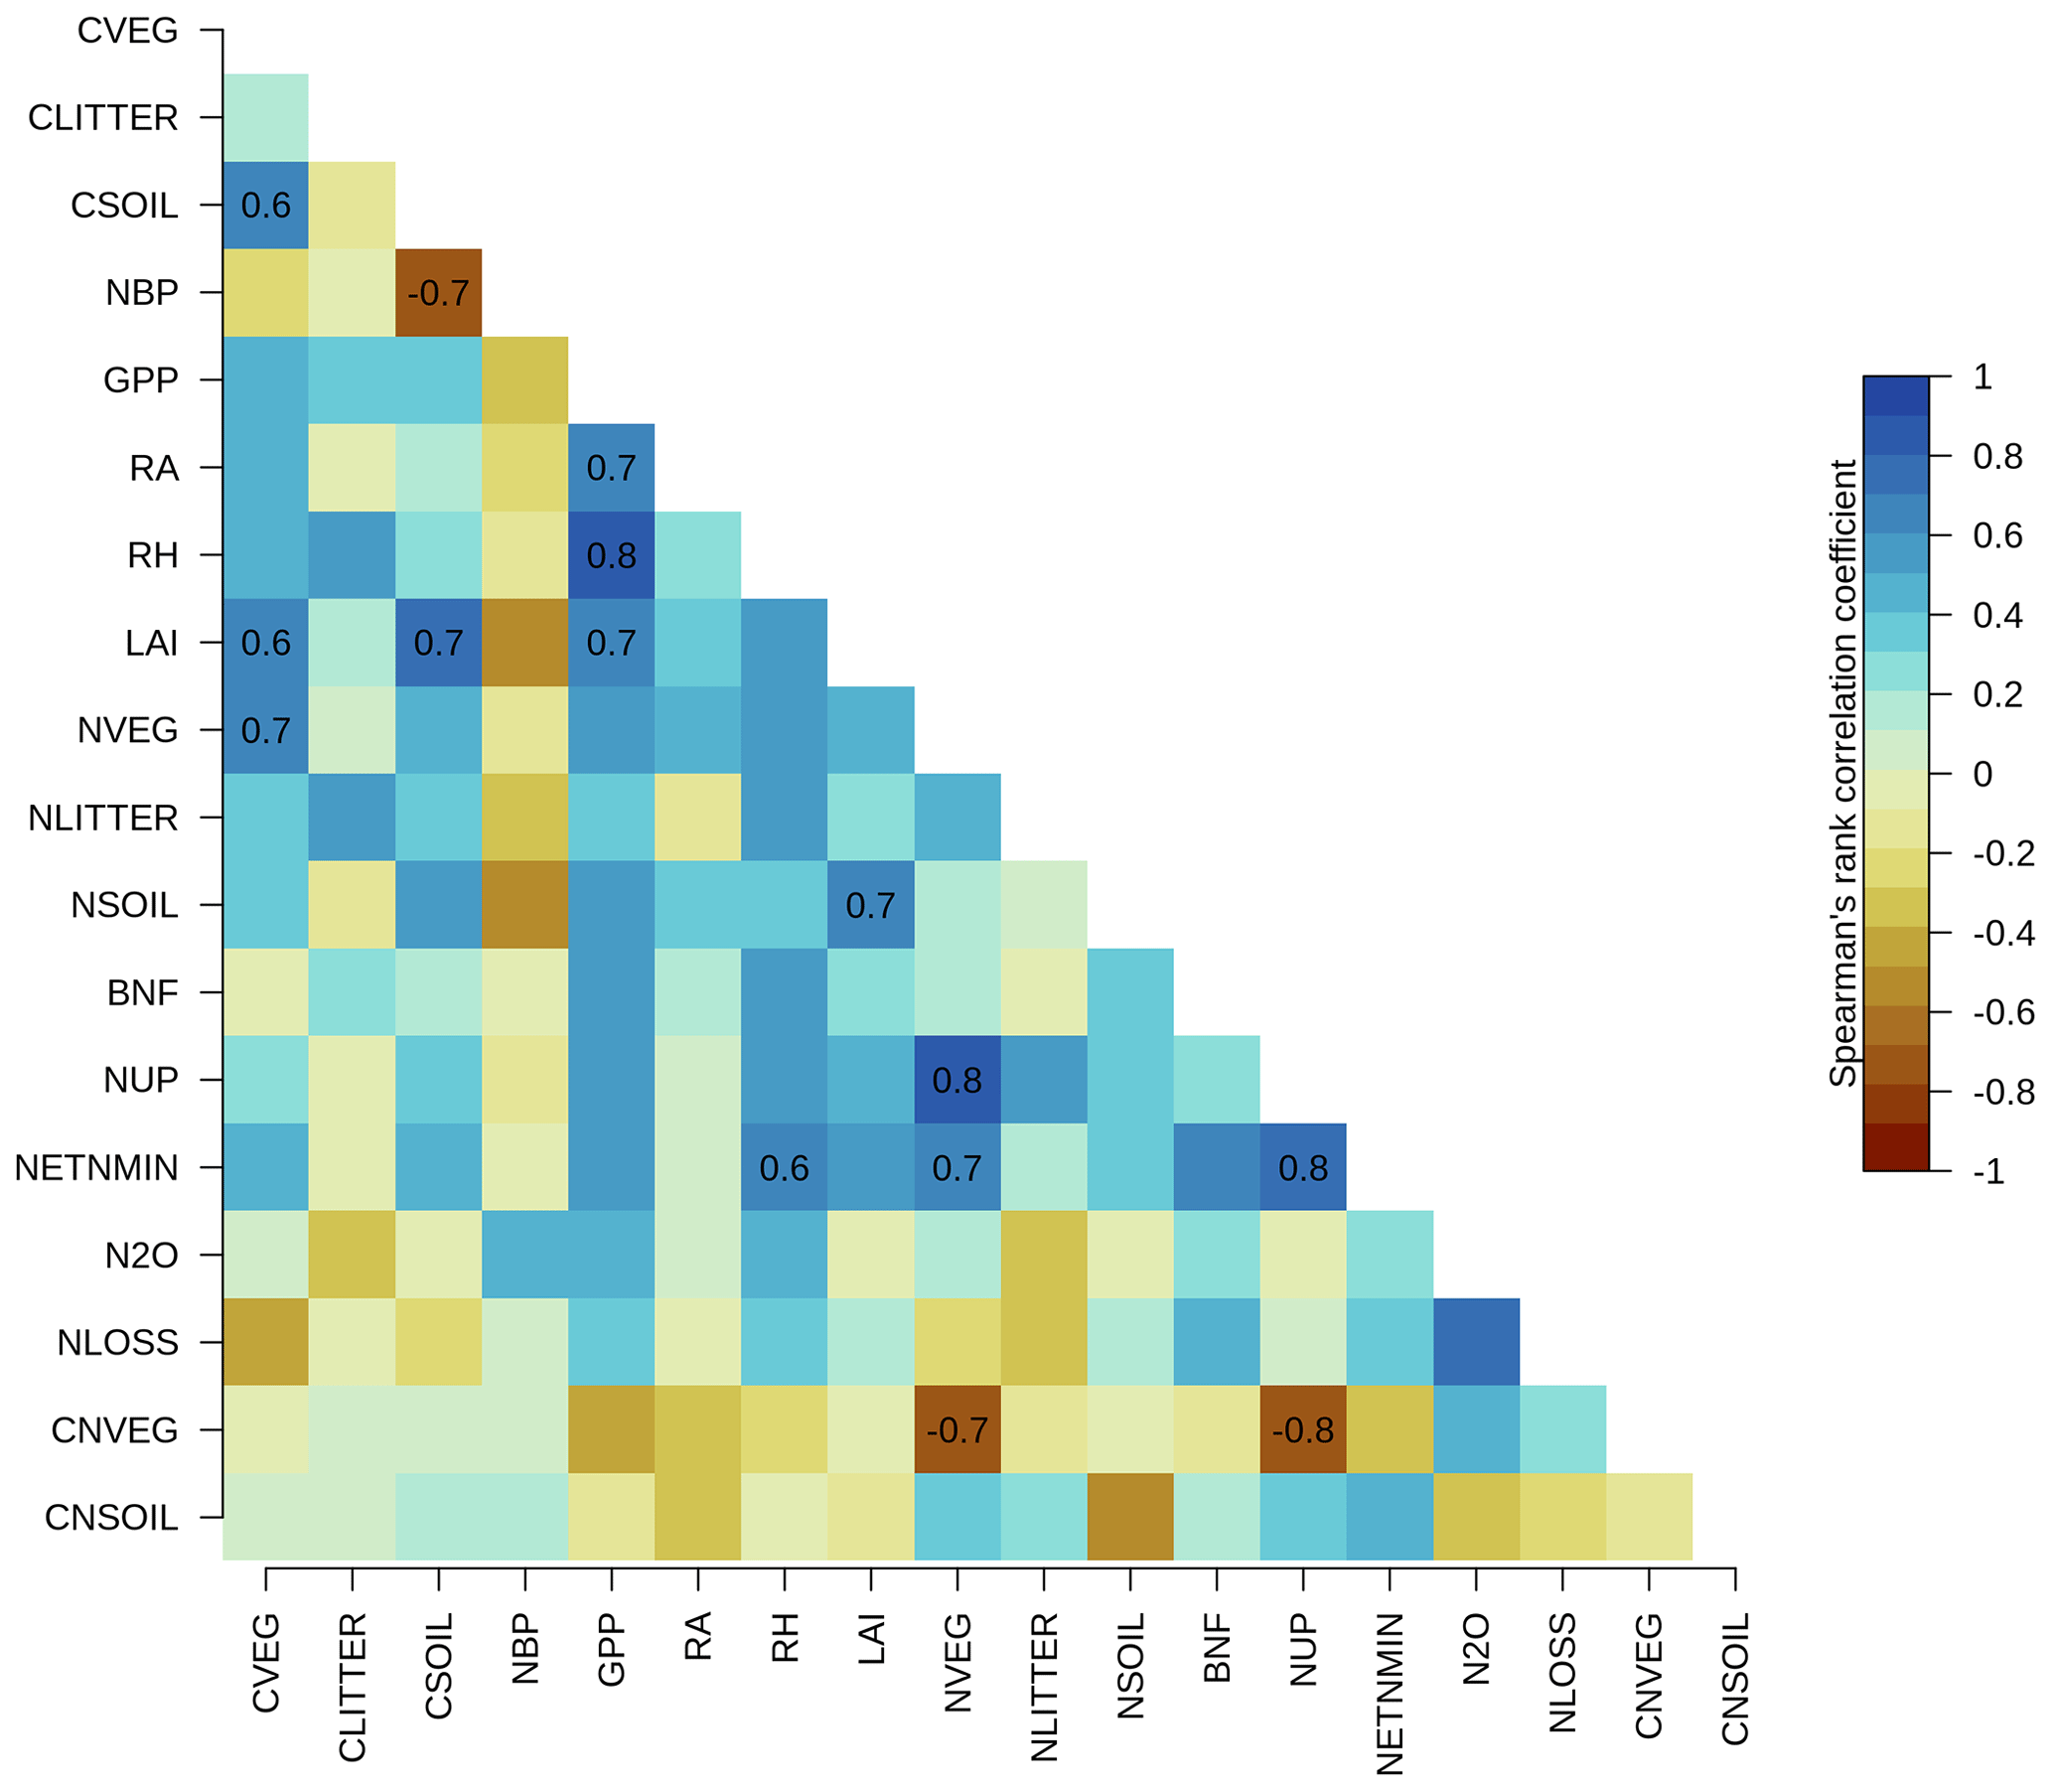
Figure A3Correlations between present-day global values (averaged over 1980–2021) of primary C and N pools and fluxes across TRENDY-N ensemble models: vegetation C (CVEG), litter C (CLITTER), soil C (CSOIL), net biome productivity (NBP), gross primary productivity (GPP), autotrophic respiration (RA), heterotrophic respiration (RH), leaf area index (LAI), vegetation N (NVEG), litter N (NLITTER), soil N (NSOIL), biological N fixation (FBNF), N uptake (NUP), net N mineralization (NETNMIN), N2O emissions (N2O), N loss (NLOSS), vegetation C : N ratio (CNVEG), and soil C : N ratio (CNSOIL). Spearman's rank correlation coefficient is shown for statistically significant correlations (p value < 0.05).
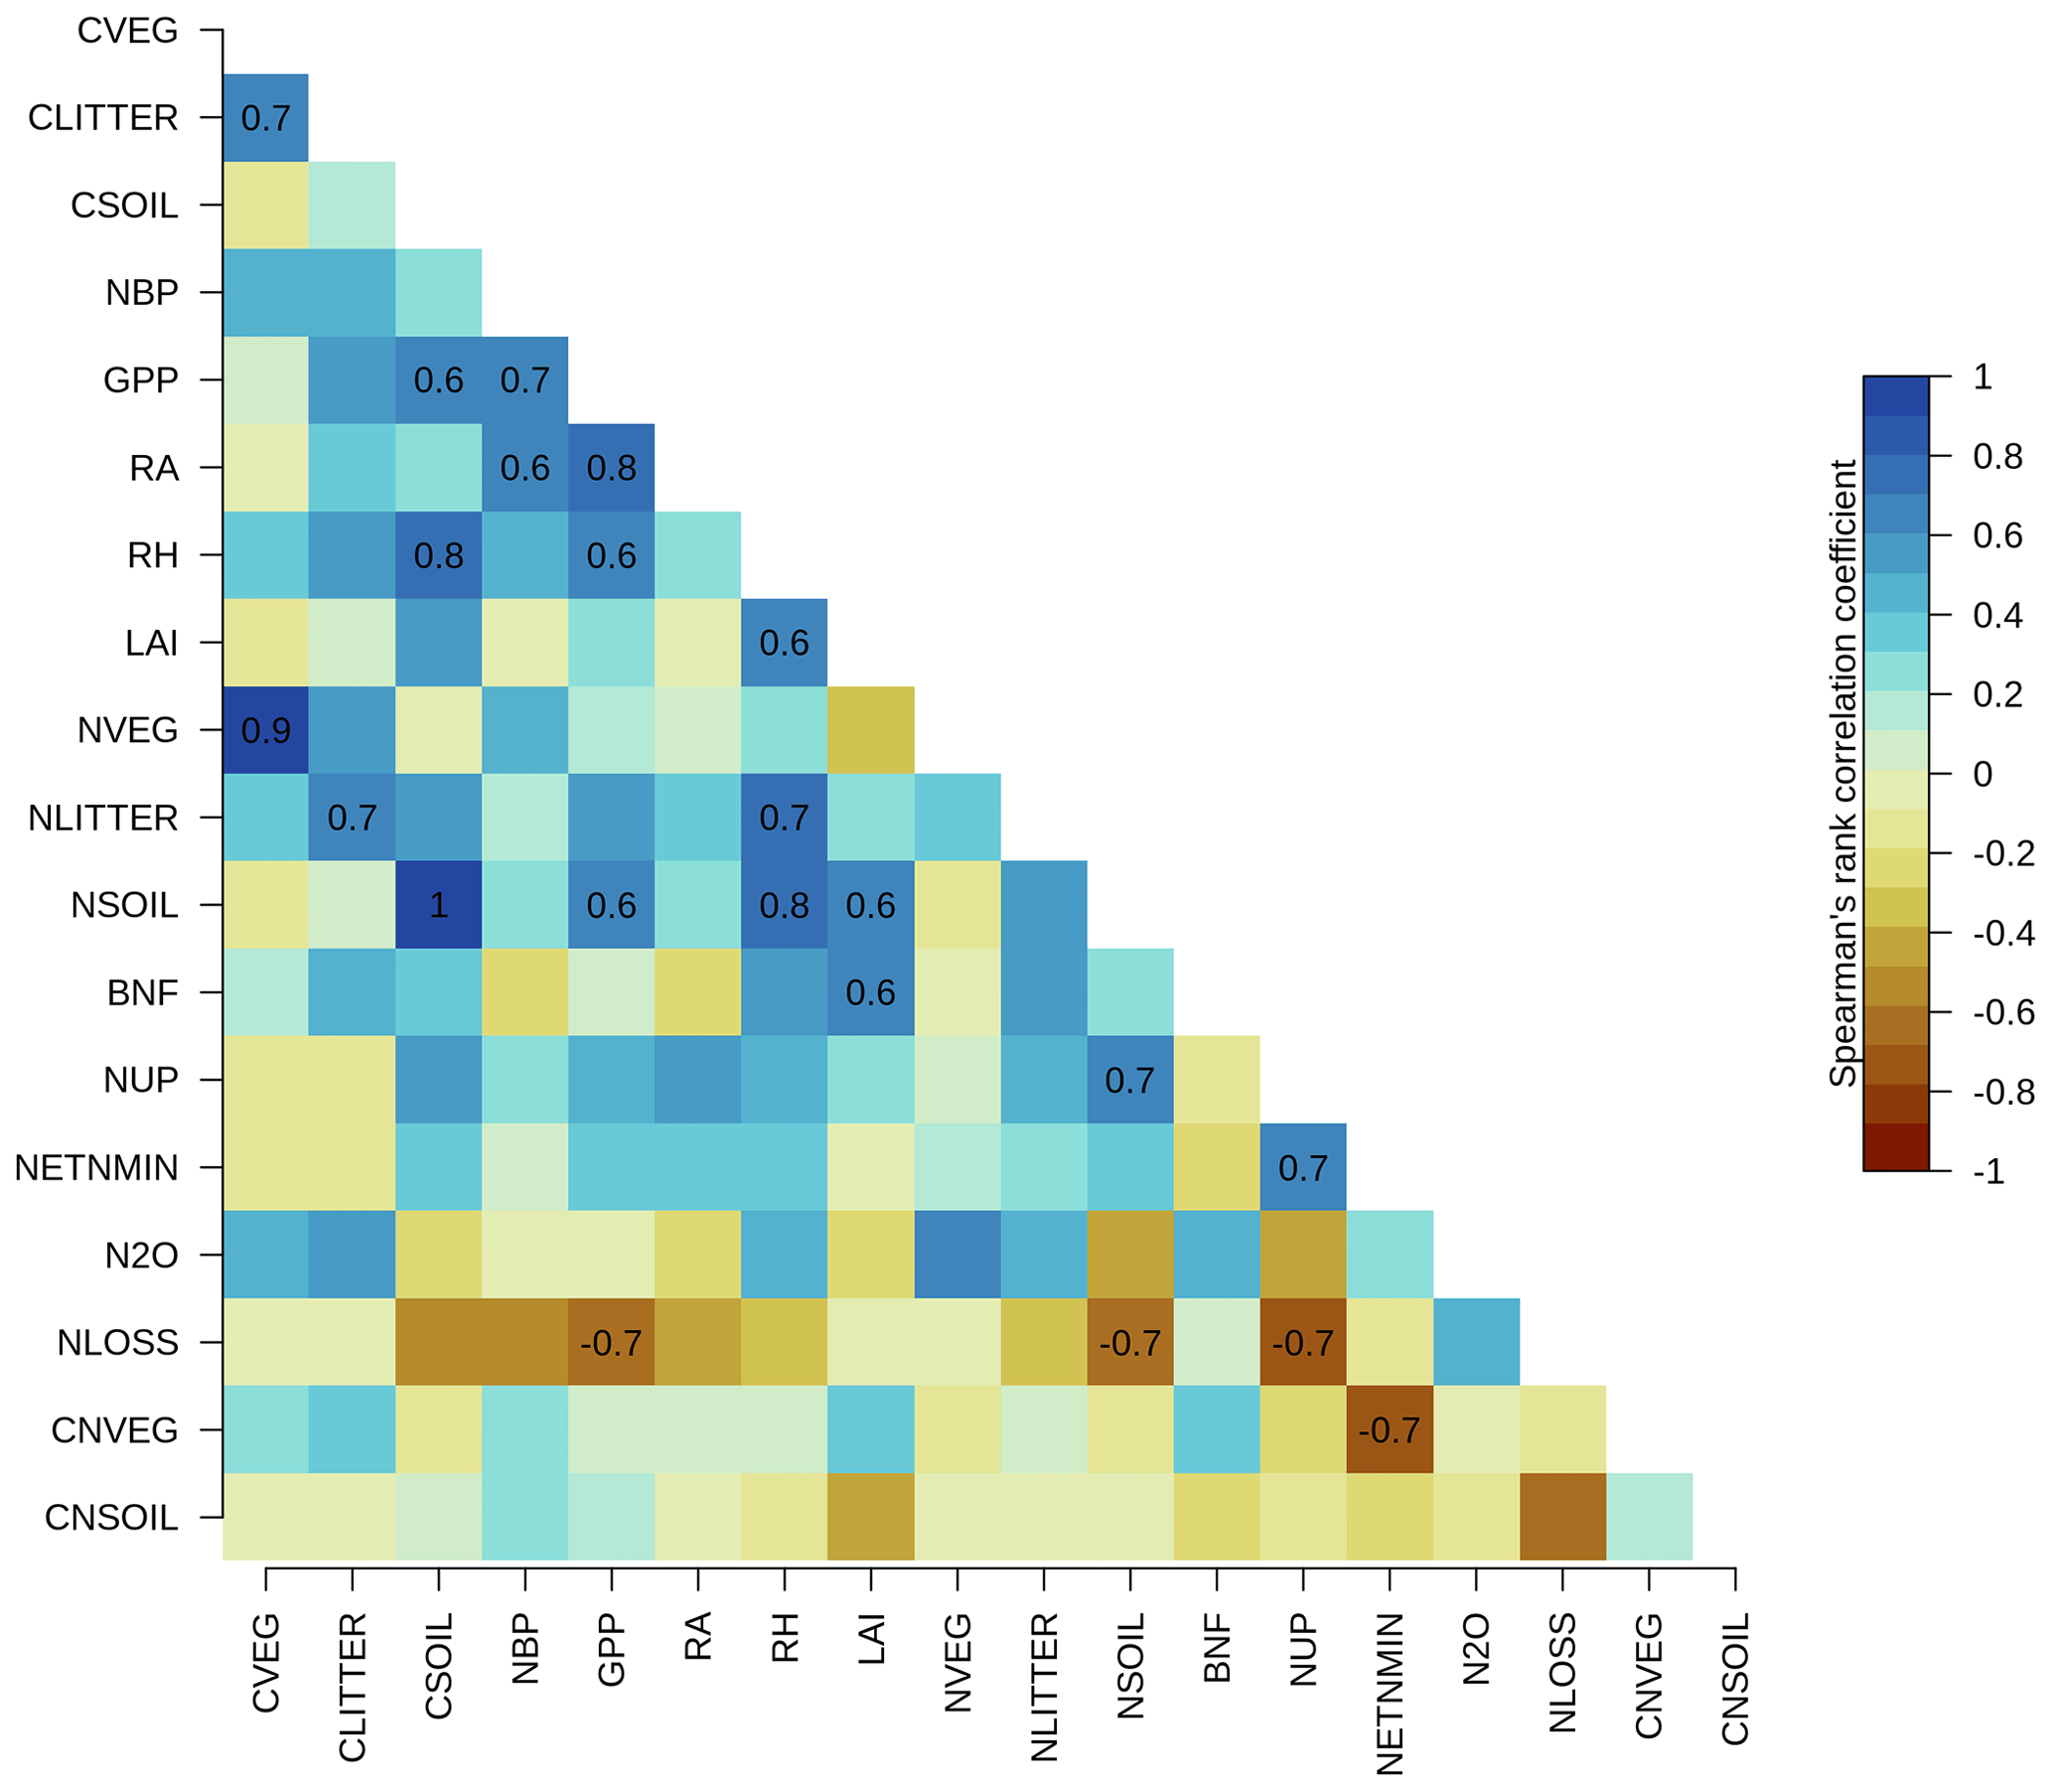
Figure A4Correlations between Kendall's tau of primary C and N pools and fluxes across TRENDY-N ensemble models: vegetation C (CVEG), litter C (CLITTER), soil C (CSOIL), net biome productivity (NBP), gross primary productivity (GPP), autotrophic respiration (RA), heterotrophic respiration (RH), leaf area index (LAI), vegetation N (NVEG), litter N (NLITTER), soil N (NSOIL), biological N fixation (FBNF), N uptake (NUP), net N mineralization (NETNMIN), N2O emissions (N2O), N loss (NLOSS), vegetation C : N ratio (CNVEG), and soil C : N ratio (CNSOIL). Spearman's rank correlation coefficient is shown for statistically significant correlations (p value < 0.05).
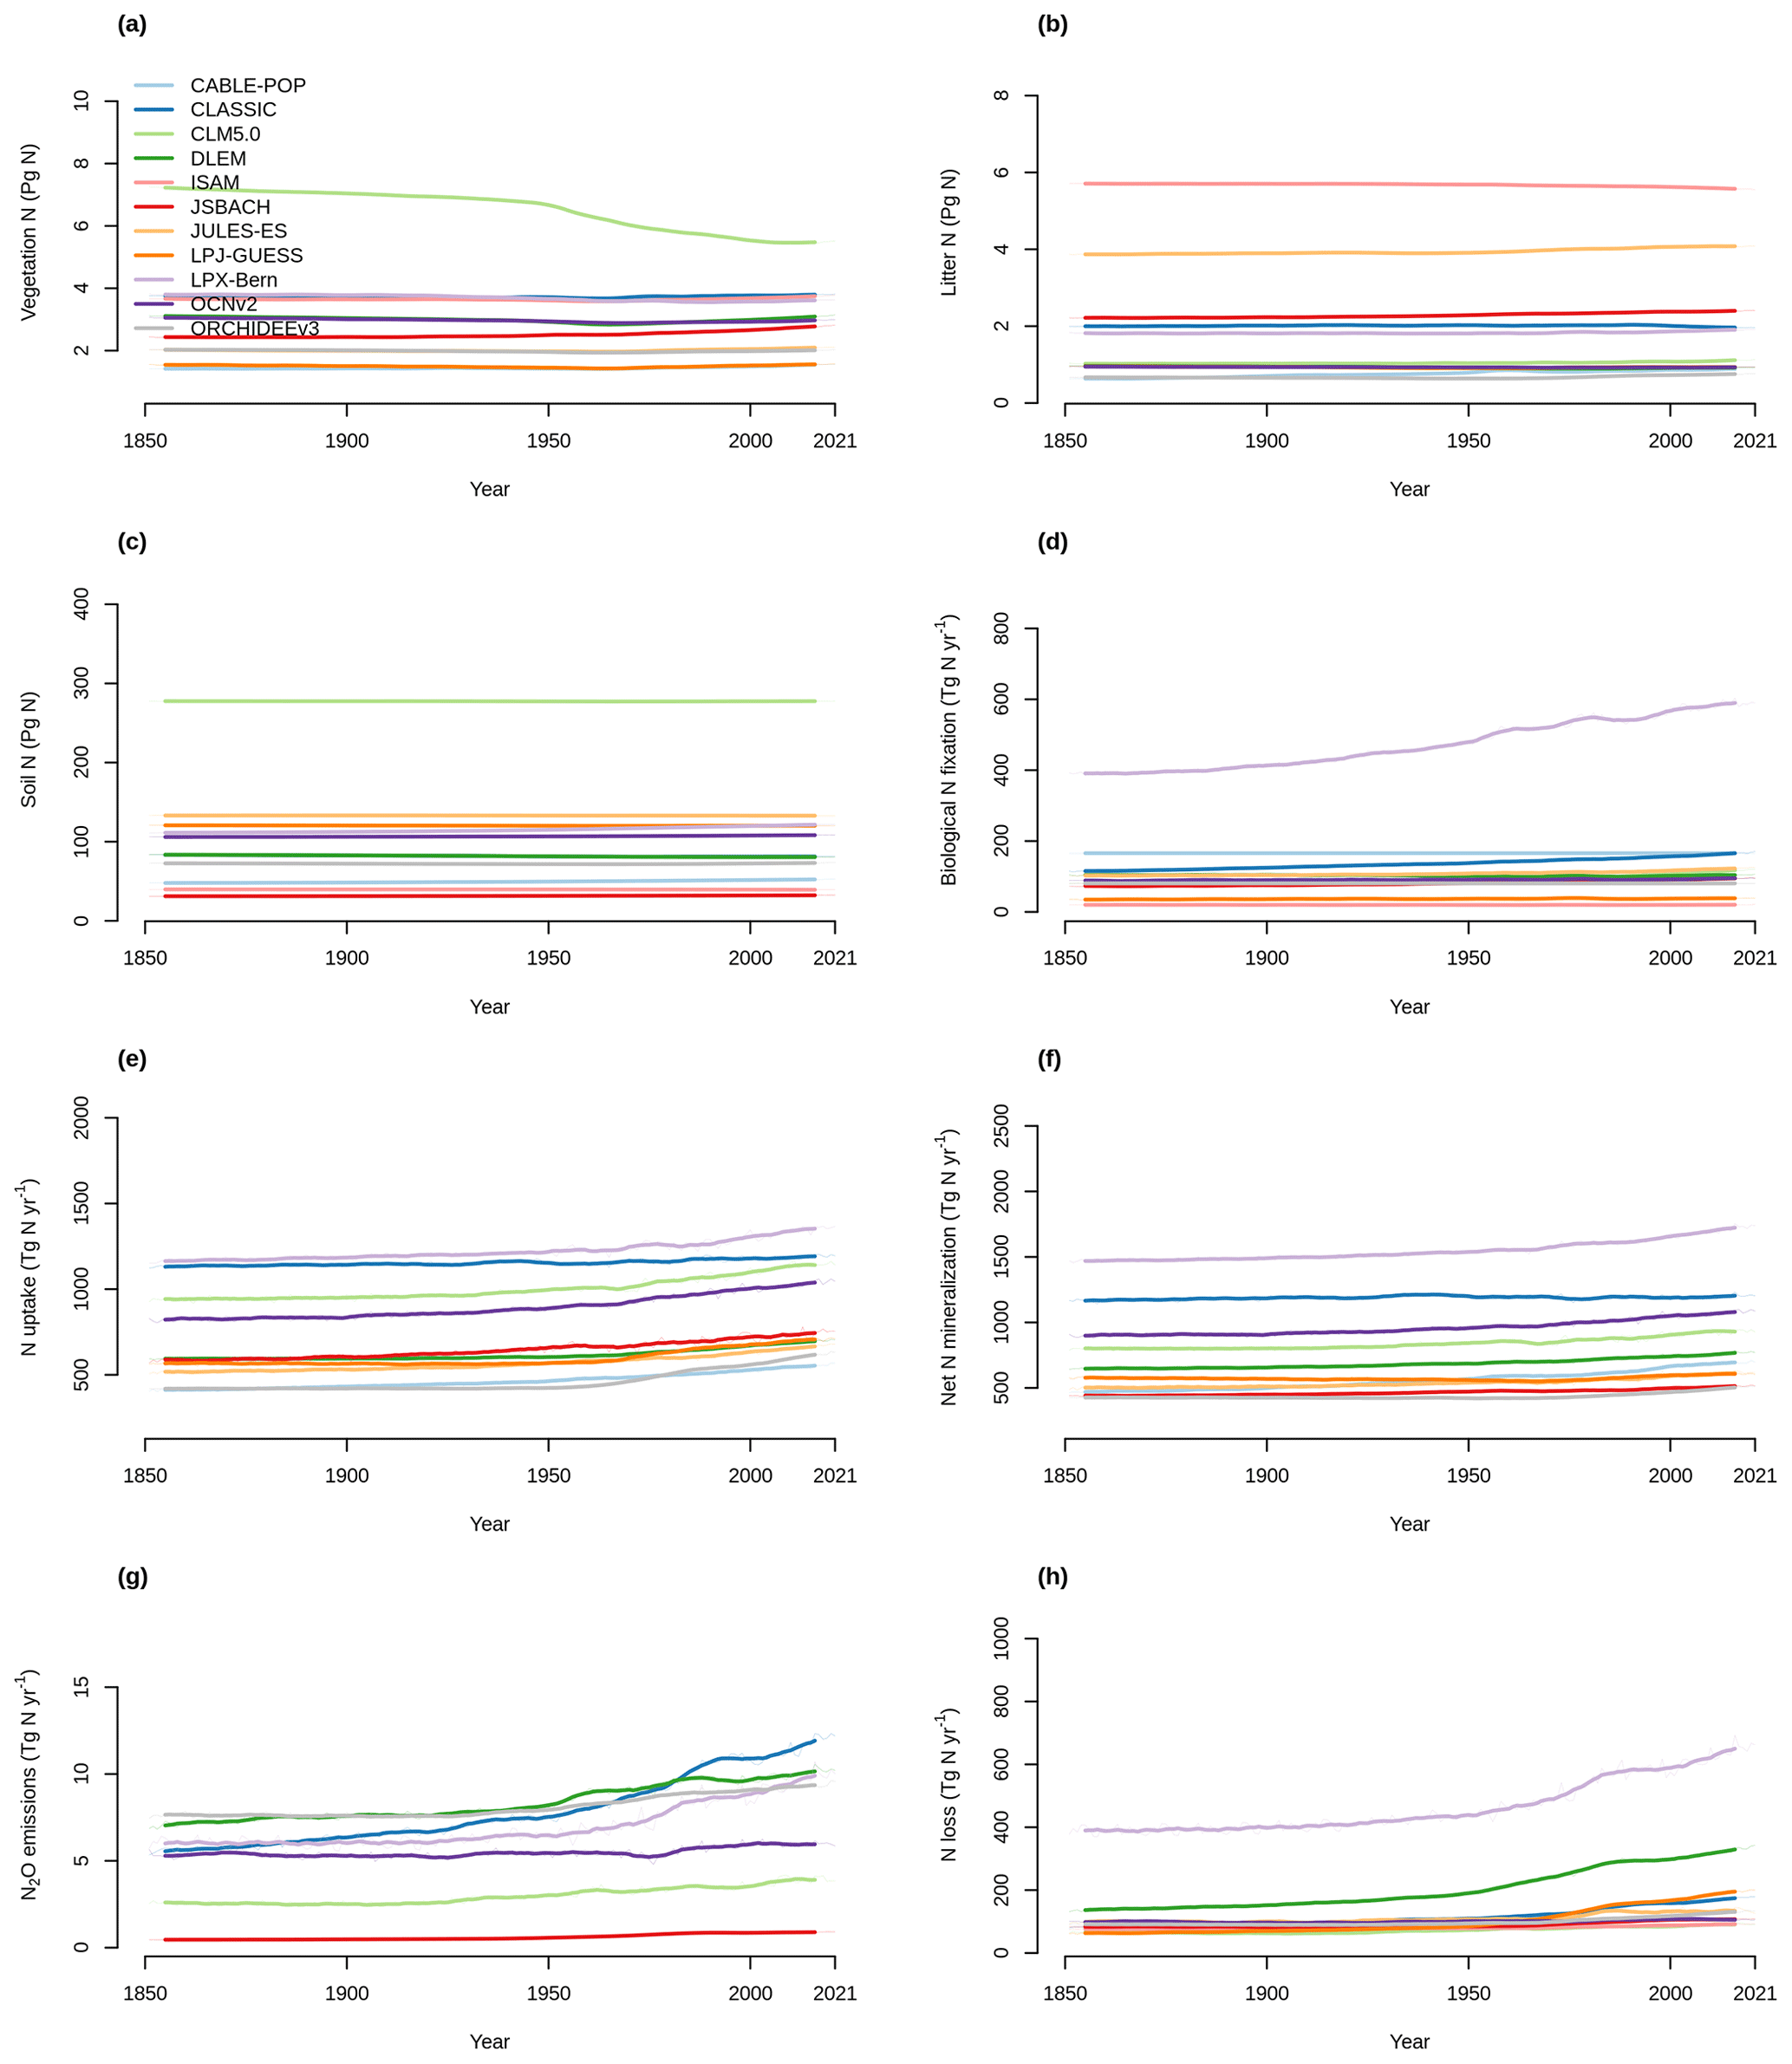
Figure A5Time series of (a) vegetation N, (b) litter N, (c) soil N, (d) biological N fixation, (e) N uptake, (f) net N mineralization, (g) N2O emissions, and (h) N loss simulated by the TRENDY-N ensemble from 1850 to 2021.
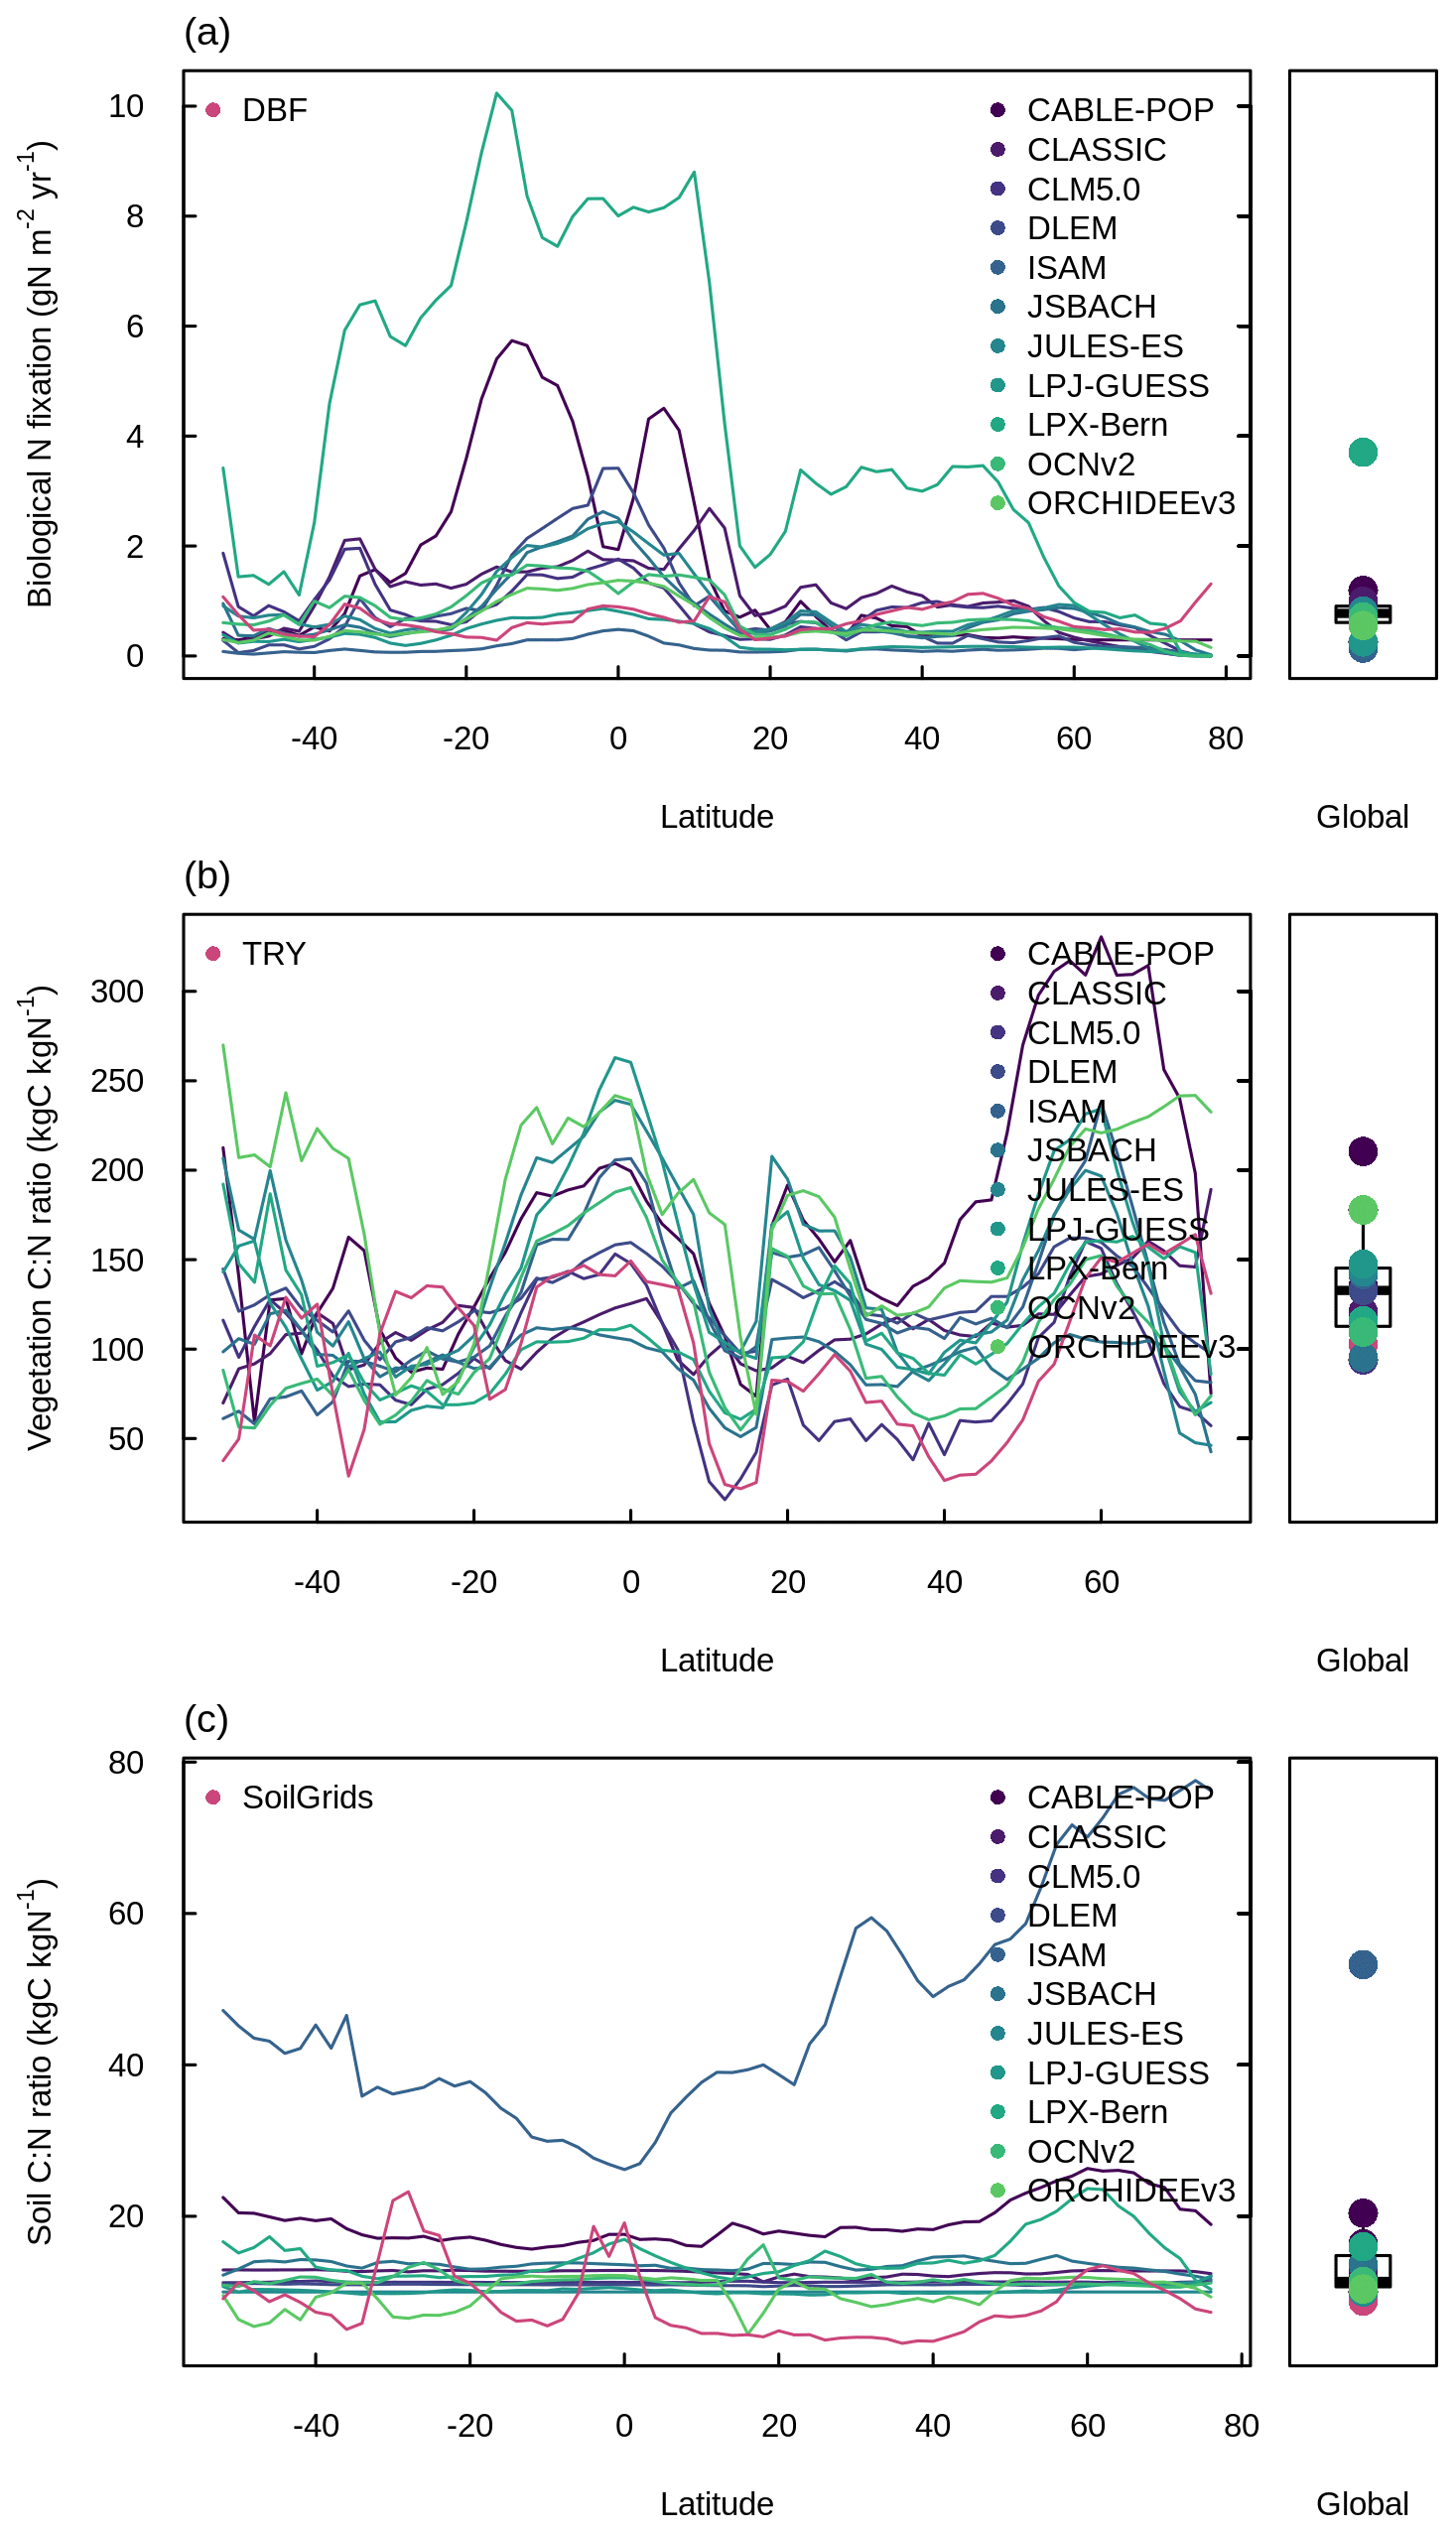
Figure A6Latitudinal distributions and global means of (a) biological N fixation, (b) vegetation C : N ratio, and (c) soil C : N ratio simulated by the TRENDY-N ensemble (averaged across models over 1980–2021) in comparison to observation-based datasets from Davies-Barnard and Friedlingstein (2020) for biological N fixation, the TRY plant trait database for vegetation C : N ratio, and SoilGrids for soil C : N ratio. Boxplots show the median, interquartile range (box), and 80 % percentiles (whiskers) of the global mean.
AMBER is available at https://gitlab.com/cseiler/AMBER (Seiler, 2021).
Biological N fixation, vegetation C : N ratio, and soil C : N ratio data are available at https://gitlab.com/sian.kougiesbrecht/trendy-nitrogen (Kou-Giesbrecht, 2023).
SKG designed and conducted the study and prepared the initial manuscript. VKA and CS provided feedback on the initial manuscript and its subsequent revisions. AA, SF, AKJ, FJ, DK, JK, SS, MO, NP, QS, HT, NV, and SZ conducted TRENDY simulations and provided feedback on the manuscript.
At least one of the (co-)authors is a member of the editorial board of Earth System Dynamics. The peer-review process was guided by an independent editor, and the authors also have no other competing interests to declare.
Publisher's note: Copernicus Publications remains neutral with regard to jurisdictional claims in published maps and institutional affiliations.
The authors would like to thank Taraka Davies-Barnard for compiling the observations used to evaluate biological N fixation. ORCHIDEEv3 simulations were granted access to the HPC resources of GENCI-TGCC under the allocation A0130106328.
This paper was edited by Somnath Baidya Roy and reviewed by Joshua Fisher and one anonymous referee.
Agustí-Panareda, A., Diamantakis, M., Massart, S., Chevallier, F., Muñoz-Sabater, J., Barré, J., Curcoll, R., Engelen, R., Langerock, B., Law, R. M., Loh, Z., Morguí, J. A., Parrington, M., Peuch, V.-H., Ramonet, M., Roehl, C., Vermeulen, A. T., Warneke, T., and Wunch, D.: Modelling CO2 weather – why horizontal resolution matters, Atmos. Chem. Phys., 19, 7347–7376, https://doi.org/10.5194/acp-19-7347-2019, 2019.
Avitabile, V., Herold, M., Heuvelink, G. B. M., Lewis, S. L., Phillips, O. L., Asner, G. P., Armston, J., Ashton, P. S., Banin, L., Bayol, N., Berry, N. J., Boeckx, P., de Jong, B. H. J., DeVries, B., Girardin, C. A. J., Kearsley, E., Lindsell, J. A., Lopez-Gonzalez, G., Lucas, R., Malhi, Y., Morel, A., Mitchard, E. T. A., Nagy, L., Qie, L., Quinones, M. J., Ryan, C. M., Ferry, S. J. W., Sunderland, T., Laurin, G. V., Gatti, R. C., Valentini, R., Verbeeck, H., Wijaya, A., and Willcock, S.: An integrated pan-tropical biomass map using multiple reference datasets, Glob. Change Biol., 22, 1406–1420, https://doi.org/10.1111/gcb.13139, 2016.
Barron, A. R., Purves, D. W., and Hedin, L. O.: Facultative nitrogen fixation by canopy legumes in a lowland tropical forest, Oecologia, 165, 511–520, https://doi.org/10.1007/s00442-010-1838-3, 2011.
Barton, L., Wolf, B., Rowlings, D., Scheer, C., Kiese, R., Grace, P., Stefanova, K., and Butterbach-Bahl, K.: Sampling frequency affects estimates of annual nitrous oxide fluxes, Sci. Rep., 5, 1–9, https://doi.org/10.1038/srep15912, 2015.
Batjes, N. H., Ribeiro, E., and van Oostrum, A.: Standardised soil profile data to support global mapping and modelling (WoSIS snapshot 2019), Earth Syst. Sci. Data, 12, 299–320, https://doi.org/10.5194/essd-12-299-2020, 2020.
Batterman, S. A., Hedin, L. O., Breugel, M. van, Ransijn, J., Craven, D. J., and Hall, J. S.: Key role of symbiotic dinitrogen fixation in tropical forest secondary succession, Nature, 502, 224–227, https://doi.org/10.1038/nature12525, 2013.
Braghiere, R. K., Fisher, J. B., Allen, K., Brzostek, E., Shi, M., Yang, X., Ricciuto, D. M., Fisher, R. A., Zhu, Q., and Phillips, R. P.: Modeling Global Carbon Costs of Plant Nitrogen and Phosphorus Acquisition, J. Adv. Model. Earth Sy., 14, e2022MS003204, https://doi.org/10.1029/2022MS003204, 2022.
Cawse-Nicholson, K., Townsend, P. A., Schimel, D., Assiri, A. M., Blake, P. L., Buongiorno, M. F., Campbell, P., Carmon, N., Casey, K. A., Correa-Pabón, R. E., Dahlin, K. M., Dashti, H., Dennison, P. E., Dierssen, H., Erickson, A., Fisher, J. B., Frouin, R., Gatebe, C. K., Gholizadeh, H., Gierach, M., Glenn, N. F., Goodman, J. A., Griffith, D. M., Guild, L., Hakkenberg, C. R., Hochberg, E. J., Holmes, T. R. H., Hu, C., Hulley, G., Huemmrich, K. F., Kudela, R. M., Kokaly, R. F., Lee, C. M., Martin, R., Miller, C. E., Moses, W. J., Muller-Karger, F. E., Ortiz, J. D., Otis, D. B., Pahlevan, N., Painter, T. H., Pavlick, R., Poulter, B., Qi, Y., Realmuto, V. J., Roberts, D., Schaepman, M. E., Schneider, F. D., Schwandner, F. M., Serbin, S. P., Shiklomanov, A. N., Stavros, E. N., Thompson, D. R., Torres-Perez, J. L., Turpie, K. R., Tzortziou, M., Ustin, S., Yu, Q., Yusup, Y., and Zhang, Q.: NASA's surface biology and geology designated observable: A perspective on surface imaging algorithms, Remote Sens. Environ., 257, 112349, https://doi.org/10.1016/j.rse.2021.112349, 2021.
Chini, L., Hurtt, G., Sahajpal, R., Frolking, S., Klein Goldewijk, K., Sitch, S., Ganzenmüller, R., Ma, L., Ott, L., Pongratz, J., and Poulter, B.: Land-use harmonization datasets for annual global carbon budgets, Earth Syst. Sci. Data, 13, 4175–4189, https://doi.org/10.5194/essd-13-4175-2021, 2021.
Claverie, M., Matthews, J. L., Vermote, E. F., and Justice, C. O.: A 30+ Year AVHRR LAI and FAPAR Climate Data Record: Algorithm Description and Validation, Remote Sens., 8, 263, https://doi.org/10.3390/rs8030263, 2016.
Cleveland, C. C., Townsend, A. R., Schimel, D. S., Fisher, H., Hedin, L. O., Perakis, S., Latty, E. F., Fischer, C. V., Elseroad, A., and Wasson, M. F.: Global patterns of terrestrial biological nitrogen (N2) fixation in natural ecosystems, Global Biochem. Cy., 13, 623–645, https://doi.org/10.1029/1999GB900014, 1999.
Collier, N., Hoffman, F. M., Lawrence, D. M., Keppel-Aleks, G., Koven, C. D., Riley, W. J., Mu, M., and Randerson, J. T.: The International Land Model Benchmarking (ILAMB) System: Design, Theory, and Implementation, J. Adv. Model. Earth Sy., 10, 2731–2754, https://doi.org/10.1029/2018MS001354, 2018.
Cotrufo, M. F., Wallenstein, M. D., Boot, C. M., Denef, K., and Paul, E.: The Microbial Efficiency-Matrix Stabilization (MEMS) framework integrates plant litter decomposition with soil organic matter stabilization: Do labile plant inputs form stable soil organic matter?, Glob. Change Biol., 19, 988–995, https://doi.org/10.1111/gcb.12113, 2013.
Davies-Barnard, T. and Friedlingstein, P.: The Global Distribution of Biological Nitrogen Fixation in Terrestrial Natural Ecosystems, Global Biogeochem. Cy., 34, 1–17, https://doi.org/10.1029/2019GB006387, 2020.
Davies-Barnard, T., Meyerholt, J., Zaehle, S., Friedlingstein, P., Brovkin, V., Fan, Y., Fisher, R. A., Jones, C. D., Lee, H., Peano, D., Smith, B., Wårlind, D., and Wiltshire, A. J.: Nitrogen cycling in CMIP6 land surface models: progress and limitations, Biogeosciences, 17, 5129–5148, https://doi.org/10.5194/bg-17-5129-2020, 2020.
Dlugokencky, E. and Tans, P.: Trends in atmospheric carbon dioxide, National Oceanic and Atmospheric Administration, Global Monitoring Laboratory (NOAA/GML), https://gml.noaa.gov/ccgg/trends/gl_data.html, last access: 25 September 2022.
Du, E., Terrer, C., Pellegrini, A. F. A., Ahlstrom, A., Lissa, C. J. van, Zhao, X., Xia, N., Wu, X., and Jackson, R. B.: Global patterns of terrestrial nitrogen and phosphorus limitation, Nat. Geosci., 13, 221–226, https://doi.org/10.1038/s41561-019-0530-4, 2020.
Elser, J. J., Bracken, M. E. S., Cleland, E. E., Gruner, D. S., Harpole, W. S., Hillebrand, H., Ngai, J. T., Seabloom, E. W., Shurin, J. B., and Smith, J. E.: Global analysis of nitrogen and phosphorus limitation of primary producers in freshwater, marine and terrestrial ecosystems, Ecol. Lett., 10, 1135–1142, https://doi.org/10.1111/j.1461-0248.2007.01113.x, 2007.
Elser, J. J., Fagan, W. F., Kerkhoff, A. J., Swenson, N. G., and Enquist, B. J.: Biological stoichiometry of plant production: Metabolism, scaling and ecological response to global change, New Phytol., 186, 593–608, https://doi.org/10.1111/j.1469-8137.2010.03214.x, 2010.
Fischer, H., Schmitt, J., Bock, M., Seth, B., Joos, F., Spahni, R., Lienert, S., Battaglia, G., Stocker, B. D., Schilt, A., and Brook, E. J.: N2O changes from the Last Glacial Maximum to the preindustrial – Part 1: Quantitative reconstruction of terrestrial and marine emissions using N2O stable isotopes in ice cores, Biogeosciences, 16, 3997–4021, https://doi.org/10.5194/bg-16-3997-2019, 2019.
Fisher, J. B., Sitch, S., Malhi, Y., Fisher, R. A., Huntingford, C., and Tan, S.-Y.: Carbon cost of plant nitrogen acquisition: A mechanistic, globally applicable model of plant nitrogen uptake, retranslocation, and fixation, Global Biogeochem. Cy., 24, 1–17, https://doi.org/10.1029/2009gb003621, 2010.
Fisher, J. B., Badgley, G., and Blyth, E.: Global nutrient limitation in terrestrial vegetation, Global Biogeochem. Cy., 26, 1–9, https://doi.org/10.1029/2011GB004252, 2012.
Fisher, R. A. and Koven, C. D.: Perspectives on the Future of Land Surface Models and the Challenges of Representing Complex Terrestrial Systems, J. Adv. Model. Earth Sy., 12, e2018MS001453, https://doi.org/10.1029/2018MS001453, 2020.
Fowler, D., Coyle, M., Skiba, U., Sutton, M. A., Cape, J. N., Reis, S., Sheppard, L. J., Jenkins, A., Grizzetti, B., Galloway, J. N., Vitousek, P., Leach, A., Bouwman, A. F., Butterbach-Bahl, K., Dentener, F., Stevenson, D., Amann, M., and Voss, M.: The global nitrogen cycle in the twenty-first century, Philos. T. R. Soc. B, 368, 20130164, https://doi.org/10.1098/rstb.2013.0164, 2013.
Friedl, M. A., Sulla-Menashe, D., Tan, B., Schneider, A., Ramankutty, N., Sibley, A., and Huang, X.: MODIS Collection 5 global land cover: Algorithm refinements and characterization of new datasets, Remote Sens. Environ., 114, 168–182, https://doi.org/10.1016/j.rse.2009.08.016, 2010.
Friedlingstein, P., O'Sullivan, M., Jones, M. W., Andrew, R. M., Gregor, L., Hauck, J., Le Quéré, C., Luijkx, I. T., Olsen, A., Peters, G. P., Peters, W., Pongratz, J., Schwingshackl, C., Sitch, S., Canadell, J. G., Ciais, P., Jackson, R. B., Alin, S. R., Alkama, R., Arneth, A., Arora, V. K., Bates, N. R., Becker, M., Bellouin, N., Bittig, H. C., Bopp, L., Chevallier, F., Chini, L. P., Cronin, M., Evans, W., Falk, S., Feely, R. A., Gasser, T., Gehlen, M., Gkritzalis, T., Gloege, L., Grassi, G., Gruber, N., Gürses, Ö., Harris, I., Hefner, M., Houghton, R. A., Hurtt, G. C., Iida, Y., Ilyina, T., Jain, A. K., Jersild, A., Kadono, K., Kato, E., Kennedy, D., Klein Goldewijk, K., Knauer, J., Korsbakken, J. I., Landschützer, P., Lefèvre, N., Lindsay, K., Liu, J., Liu, Z., Marland, G., Mayot, N., McGrath, M. J., Metzl, N., Monacci, N. M., Munro, D. R., Nakaoka, S.-I., Niwa, Y., O'Brien, K., Ono, T., Palmer, P. I., Pan, N., Pierrot, D., Pocock, K., Poulter, B., Resplandy, L., Robertson, E., Rödenbeck, C., Rodriguez, C., Rosan, T. M., Schwinger, J., Séférian, R., Shutler, J. D., Skjelvan, I., Steinhoff, T., Sun, Q., Sutton, A. J., Sweeney, C., Takao, S., Tanhua, T., Tans, P. P., Tian, X., Tian, H., Tilbrook, B., Tsujino, H., Tubiello, F., van der Werf, G. R., Walker, A. P., Wanninkhof, R., Whitehead, C., Willstrand Wranne, A., Wright, R., Yuan, W., Yue, C., Yue, X., Zaehle, S., Zeng, J., and Zheng, B.: Global Carbon Budget 2022, Earth Syst. Sci. Data, 14, 4811–4900, https://doi.org/10.5194/essd-14-4811-2022, 2022.
Goll, D. S., Brovkin, V., Parida, B. R., Reick, C. H., Kattge, J., Reich, P. B., van Bodegom, P. M., and Niinemets, Ü.: Nutrient limitation reduces land carbon uptake in simulations with a model of combined carbon, nitrogen and phosphorus cycling, Biogeosciences, 9, 3547–3569, https://doi.org/10.5194/bg-9-3547-2012, 2012.
Han, W., Tang, L., Chen, Y., and Fang, J.: Relationship between the relative limitation and resorption efficiency of nitrogen vs phosphorus in woody plants, PLoS ONE, 8, e83366, https://doi.org/10.1371/journal.pone.0083366, 2013.
Harris, I., Osborn, T. J., Jones, P., and Lister, D.: Version 4 of the CRU TS monthly high-resolution gridded multivariate climate dataset, Sci. Data, 7, 1–18, https://doi.org/10.1038/s41597-020-0453-3, 2020.
Haverd, V., Smith, B., Nieradzik, L., Briggs, P. R., Woodgate, W., Trudinger, C. M., Canadell, J. G., and Cuntz, M.: A new version of the CABLE land surface model (Subversion revision r4601) incorporating land use and land cover change, woody vegetation demography, and a novel optimisation-based approach to plant coordination of photosynthesis, Geosci. Model Dev., 11, 2995–3026, https://doi.org/10.5194/gmd-11-2995-2018, 2018.
Hedin, L. O., Brookshire, E. N. J., Menge, D. N. L., and Barron, A. R.: The Nitrogen Paradox in Tropical Forest Ecosystems, Annu. Rev. Ecol. Evol. S., 40, 613–635, https://doi.org/10.1146/annurev.ecolsys.37.091305.110246, 2009.
Hegglin, M., Kinnison, D., and Lamarque, J.-F.: CCMI nitrogen surface fluxes in support of CMIP6 – version 2.0, Earth System Grid Federation [data set], https://doi.org/10.22033/ESGF/input4MIPs.1125, 2016.
Hengl, T., Jesus, J. M. D., Heuvelink, G. B. M., Gonzalez, M. R., Kilibarda, M., Blagotić, A., Shangguan, W., Wright, M. N., Geng, X., Bauer-Marschallinger, B., Guevara, M. A., Vargas, R., MacMillan, R. A., Batjes, N. H., Leenaars, J. G. B., Ribeiro, E., Wheeler, I., Mantel, S., and Kempen, B.: SoilGrids250m: Global gridded soil information based on machine learning, PLoS ONE, 12, e0169748, https://doi.org/10.1371/journal.pone.0169748, 2017.
Herridge, D. F., Giller, K. E., Jensen, E. S., and Peoples, M. B.: Quantifying country-to-global scale nitrogen fixation for grain legumes II. Coefficients, templates and estimates for soybean, groundnut and pulses, Plant Soil, 474, 1–15, https://doi.org/10.1007/s11104-021-05166-7, 2022.
Hipel, K. W. and McLeod, A. I.: Time series modelling of water resources and environmental systems, Elsevier, ISBN 9780080870366, 1994.
Houlton, B. Z., Morford, S. L., and Dahlgren, R. A.: Convergent evidence for widespread rock nitrogen sources in Earth's surface environment, Science, 360, 58–62, https://doi.org/10.1126/science.aan4399, 2018.
Huang, Y., Ciais, P., Santoro, M., Makowski, D., Chave, J., Schepaschenko, D., Abramoff, R. Z., Goll, D. S., Yang, H., Chen, Y., Wei, W., and Piao, S.: A global map of root biomass across the world's forests, Earth Syst. Sci. Data, 13, 4263–4274, https://doi.org/10.5194/essd-13-4263-2021, 2021.
Hungate, B. A., Dukes, J. S., Shaw, M. R., Luo, Y., and Field, C. B.: Nitrogen and Climate Change, Science, 302, 1512–1513, 2003.
Huntzinger, D. N., Michalak, A. M., Schwalm, C., Ciais, P., King, A. W., Fang, Y., Schaefer, K., Wei, Y., Cook, R. B., Fisher, J. B., Hayes, D., Huang, M., Ito, A., Jain, A. K., Lei, H., Lu, C., Maignan, F., Mao, J., Parazoo, N., Peng, S., Poulter, B., Ricciuto, D., Shi, X., Tian, H., Wang, W., Zeng, N., and Zhao, F.: Uncertainty in the response of terrestrial carbon sink to environmental drivers undermines carbon-climate feedback predictions, Sci. Rep., 7, 1–8, https://doi.org/10.1038/s41598-017-03818-2, 2017.
Hurtt, G. C., Chini, L., Sahajpal, R., Frolking, S., Bodirsky, B. L., Calvin, K., Doelman, J. C., Fisk, J., Fujimori, S., Klein Goldewijk, K., Hasegawa, T., Havlik, P., Heinimann, A., Humpenöder, F., Jungclaus, J., Kaplan, J. O., Kennedy, J., Krisztin, T., Lawrence, D., Lawrence, P., Ma, L., Mertz, O., Pongratz, J., Popp, A., Poulter, B., Riahi, K., Shevliakova, E., Stehfest, E., Thornton, P., Tubiello, F. N., van Vuuren, D. P., and Zhang, X.: Harmonization of global land use change and management for the period 850–2100 (LUH2) for CMIP6, Geosci. Model Dev., 13, 5425–5464, https://doi.org/10.5194/gmd-13-5425-2020, 2020.
Jacobson, A. R., Schuldt, K. N., Miller, J. B., Oda, T., Tans, P., Andrews, A., Mund, J., Ott, L., Collatz, G. J., and Aalto, T.: CarbonTracker CT2019, NOAA Earth Syst. Res. Lab. Glob. Monit. Div. [data set], 10, https://doi.org/10.25925/20201008, 2020.
Jeltsch-Thömmes, A., Battaglia, G., Cartapanis, O., Jaccard, S. L., and Joos, F.: Low terrestrial carbon storage at the Last Glacial Maximum: constraints from multi-proxy data, Clim. Past, 15, 849–879, https://doi.org/10.5194/cp-15-849-2019, 2019.
Joos, F., Spahni, R., Stocker, B. D., Lienert, S., Müller, J., Fischer, H., Schmitt, J., Prentice, I. C., Otto-Bliesner, B., and Liu, Z.: N2O changes from the Last Glacial Maximum to the preindustrial – Part 2: terrestrial N2O emissions and carbon–nitrogen cycle interactions, Biogeosciences, 17, 3511–3543, https://doi.org/10.5194/bg-17-3511-2020, 2020.
Jung, M., Schwalm, C., Migliavacca, M., Walther, S., Camps-Valls, G., Koirala, S., Anthoni, P., Besnard, S., Bodesheim, P., Carvalhais, N., Chevallier, F., Gans, F., Goll, D. S., Haverd, V., Köhler, P., Ichii, K., Jain, A. K., Liu, J., Lombardozzi, D., Nabel, J. E. M. S., Nelson, J. A., O'Sullivan, M., Pallandt, M., Papale, D., Peters, W., Pongratz, J., Rödenbeck, C., Sitch, S., Tramontana, G., Walker, A., Weber, U., and Reichstein, M.: Scaling carbon fluxes from eddy covariance sites to globe: synthesis and evaluation of the FLUXCOM approach, Biogeosciences, 17, 1343–1365, https://doi.org/10.5194/bg-17-1343-2020, 2020.
Kattge, J., Bönisch, G., Díaz, S., Lavorel, S., Prentice, I. C., Leadley, P., Tautenhahn, S., Werner, G. D. A., Aakala, T., Abedi, M., Acosta, A. T. R., Adamidis, G. C., Adamson, K., Aiba, M., Albert, C. H., Alcántara, J. M., C, C. A., Aleixo, I., Ali, H., Amiaud, B., Ammer, C., Amoroso, M. M., Anand, M., Anderson, C., Anten, N., Antos, J., Apgaua, D. M. G., Ashman, T. L., Asmara, D. H., Asner, G. P., Aspinwall, M., Atkin, O., Aubin, I., Baastrup-Spohr, L., Bahalkeh, K., Bahn, M., Baker, T., Baker, W. J., Bakker, J. P., Baldocchi, D., Baltzer, J., Banerjee, A., Baranger, A., Barlow, J., Barneche, D. R., Baruch, Z., Bastianelli, D., Battles, J., Bauerle, W., Bauters, M., Bazzato, E., Beckmann, M., Beeckman, H., Beierkuhnlein, C., Bekker, R., Belfry, G., Belluau, M., Beloiu, M., Benavides, R., Benomar, L., Berdugo-Lattke, M. L., Berenguer, E., Bergamin, R., Bergmann, J., Carlucci, M. B., Berner, L., Bernhardt-Römermann, M., Bigler, C., Bjorkman, A. D., Blackman, C., Blanco, C., Blonder, B., Blumenthal, D., Bocanegra-González, K. T., Boeckx, P., Bohlman, S., Böhning-Gaese, K., Boisvert-Marsh, L., Bond, W., Bond-Lamberty, B., Boom, A., Boonman, C. C. F., Bordin, K., Boughton, E. H., Boukili, V., Bowman, D. M. J. S., Bravo, S., Brendel, M. R., Broadley, M. R., Brown, K. A., Bruelheide, H., Brumnich, F., Bruun, H. H., Bruy, D., Buchanan, S. W., Bucher, S. F., Buchmann, N., Buitenwerf, R., Bunker, D. E., et al.: TRY plant trait database – enhanced coverage and open access, Glob. Change Biol., 26, 119–188, https://doi.org/10.1111/gcb.14904, 2020.
Klein Goldewijk, K., Beusen, A., Doelman, J., and Stehfest, E.: Anthropogenic land use estimates for the Holocene – HYDE 3.2, Earth Syst. Sci. Data, 9, 927–953, https://doi.org/10.5194/essd-9-927-2017, 2017a.
Klein Goldewijk, K., Dekker, S. C., and Zanden, J. L. van: Per-capita estimations of long-term historical land use and the consequences for global change research, J. Land Use Sci., 12, 313–337, https://doi.org/10.1080/1747423X.2017.1354938, 2017b.
Knyazikhin, Y., Schull, M. A., Stenberg, P., Mõttus, M., Rautiainen, M., Yang, Y., Marshak, A., Latorre Carmona, P., Kaufmann, R. K., Lewis, P., Disney, M. I., Vanderbilt, V., Davis, A. B., Baret, F., Jacquemoud, S., Lyapustin, A., and Myneni, R. B.: Hyperspectral remote sensing of foliar nitrogen content, P. Natl. Acad. Sci. USA, 110, E185–E192, https://doi.org/10.1073/pnas.1210196109, 2013.
Kobe, R. K., Lepczyk, C. A., and Iyer, M.: Resorption efficiency decreases with increasing green leaf nutrients in a global data set, Ecology, 86, 2780–2792, 2005.
Kou-Giesbrecht, S.: TRENDY nitrogen, GitLab [data set], https://gitlab.com/sian.kougiesbrecht/trendy-nitrogen (last access: 11 August 2023), 2023.
Kou-Giesbrecht, S. and Arora, V. K.: Representing the Dynamic Response of Vegetation to Nitrogen Limitation via Biological Nitrogen Fixation in the CLASSIC Land Model, Globa Biogeochem. Cy., 36, e2022GB007341, https://doi.org/10.1029/2022GB007341, 2022.
Lawrence, D. M., Fisher, R. A., Koven, C. D., Oleson, K. W., Swenson, S. C., Bonan, G., Collier, N., Ghimire, B., Kampenhout, L. van, Kennedy, D., Kluzek, E., Lawrence, P. J., Li, F., Li, H., Lombardozzi, D., Riley, W. J., Sacks, W. J., Shi, M., Vertenstein, M., Wieder, W. R., Xu, C., Ali, A. A., Badger, A. M., Bisht, G., Broeke, M. van den, Brunke, M. A., Burns, S. P., Buzan, J., Clark, M., Craig, A., Dahlin, K., Drewniak, B., Fisher, J. B., Flanner, M., Fox, A. M., Gentine, P., Hoffman, F., Keppel-Aleks, G., Knox, R., Kumar, S., Lenaerts, J., Leung, L. R., Lipscomb, W. H., Lu, Y., Pandey, A., Pelletier, J. D., Perket, J., Randerson, J. T., Ricciuto, D. M., Sanderson, B. M., Slater, A., Subin, Z. M., Tang, J., Thomas, R. Q., Martin, M. V., and Zeng, X.: The Community Land Model Version 5: Description of New Features, Benchmarking, and Impact of Forcing Uncertainty, J. Adv. Model. Earth Sy., 11, 4245–4287, https://doi.org/10.1029/2018MS001583, 2019.
LeBauer, D. S. and Treseder, K. K.: Nitrogen Limitation of Net Primary Productivity in Terrestrial Ecosystems is Globally Distributed, Ecology, 89, 371–379, https://doi.org/10.1016/j.agee.2013.04.020, 2008.
Li, X. and Xiao, J.: Mapping Photosynthesis Solely from Solar-Induced Chlorophyll Fluorescence: A Global, Fine-Resolution Dataset of Gross Primary Production Derived from OCO-2, Remote Sens., 11, 2563, https://doi.org/10.3390/rs11212563, 2019.
Liang, J., Qi, X., Souza, L., and Luo, Y.: Processes regulating progressive nitrogen limitation under elevated carbon dioxide: a meta-analysis, Biogeosciences, 13, 2689–2699, https://doi.org/10.5194/bg-13-2689-2016, 2016.
Lienert, S. and Joos, F.: A Bayesian ensemble data assimilation to constrain model parameters and land-use carbon emissions, Biogeosciences, 15, 2909–2930, https://doi.org/10.5194/bg-15-2909-2018, 2018.
Liu, Y., Wang, C., He, N., Wen, X., Gao, Y., Li, S., Niu, S., Butterbach-Bahl, K., Luo, Y., and Yu, G.: A global synthesis of the rate and temperature sensitivity of soil nitrogen mineralization: latitudinal patterns and mechanisms, Glob. Change Biol., 23, 455–464, https://doi.org/10.1111/gcb.13372, 2017.
Medlyn, B. E., Zaehle, S., Kauwe, M. G. D., Walker, A. P., Dietze, M. C., Hanson, P. J., Hickler, T., Jain, A. K., Luo, Y., Parton, W., Prentice, I. C., Thornton, P. E., Wang, S., Wang, Y. P., Weng, E., Iversen, C. M., Mccarthy, H. R., Warren, J. M., Oren, R., and Norby, R. J.: Using ecosystem experiments to improve vegetation models, Nat. Clim. Change, 5, 528–534, https://doi.org/10.1038/nclimate2621, 2015.
Melton, J. R., Arora, V. K., Wisernig-Cojoc, E., Seiler, C., Fortier, M., Chan, E., and Teckentrup, L.: CLASSIC v1.0: the open-source community successor to the Canadian Land Surface Scheme (CLASS) and the Canadian Terrestrial Ecosystem Model (CTEM) – Part 1: Model framework and site-level performance, Geosci. Model Dev., 13, 2825–2850, https://doi.org/10.5194/gmd-13-2825-2020, 2020.
Menge, D. N. L., Wolf, A. A., and Funk, J. L.: Diversity of nitrogen fixation strategies in Mediterranean legumes, Nat. Plants, 1, 1–5, https://doi.org/10.1038/nplants.2015.64, 2015.
Meyerholt, J., Zaehle, S., and Smith, M. J.: Variability of projected terrestrial biosphere responses to elevated levels of atmospheric CO2 due to uncertainty in biological nitrogen fixation, Biogeosciences, 13, 1491–1518, https://doi.org/10.5194/bg-13-1491-2016, 2016.
Meyerholt, J., Sickel, K., and Zaehle, S.: Ensemble projections elucidate effects of uncertainty in terrestrial nitrogen limitation on future carbon uptake, Glob. Change Biol., 26, 3978–3996, https://doi.org/10.1111/gcb.15114, 2020.
Moreno-Martínez, Á., Camps-Valls, G., Kattge, J., Robinson, N., Reichstein, M., van Bodegom, P., Kramer, K., Cornelissen, J. H. C., Reich, P., Bahn, M., Niinemets, Ü., Peñuelas, J., Craine, J. M., Cerabolini, B. E. L., Minden, V., Laughlin, D. C., Sack, L., Allred, B., Baraloto, C., Byun, C., Soudzilovskaia, N. A., and Running, S. W.: A methodology to derive global maps of leaf traits using remote sensing and climate data, Remote Sens. Environ., 218, 69–88, https://doi.org/10.1016/j.rse.2018.09.006, 2018.
Myneni, R. B., Hoffman, S., Knyazikhin, Y., Privette, J. L., Glassy, J., Tian, Y., Wang, Y., Song, X., Zhang, Y., Smith, G. R., Lotsch, A., Friedl, M., Morisette, J. T., Votava, P., Nemani, R. R., and Running, S. W.: Global products of vegetation leaf area and fraction absorbed PAR from year one of MODIS data, Remote Sens. Environ., 83, 214–231, https://doi.org/10.1016/S0034-4257(02)00074-3, 2002.
Nakhavali, M. A., Mercado, L. M., Hartley, I. P., Sitch, S., Cunha, F. V., di Ponzio, R., Lugli, L. F., Quesada, C. A., Andersen, K. M., Chadburn, S. E., Wiltshire, A. J., Clark, D. B., Ribeiro, G., Siebert, L., Moraes, A. C. M., Schmeisk Rosa, J., Assis, R., and Camargo, J. L.: Representation of the phosphorus cycle in the Joint UK Land Environment Simulator (vn5.5_JULES-CNP), Geosci. Model Dev., 15, 5241–5269, https://doi.org/10.5194/gmd-15-5241-2022, 2022.
O'Sullivan, M., Spracklen, D. V., Batterman, S. A., Arnold, S. R., Gloor, M., and Buermann, W.: Have Synergies Between Nitrogen Deposition and Atmospheric CO2 Driven the Recent Enhancement of the Terrestrial Carbon Sink?, Global Biogeochem. Cy., 33, 163–180, https://doi.org/10.1029/2018GB005922, 2019.
Peng, J., Wang, Y. P., Houlton, B. Z., Dan, L., Pak, B., and Tang, X.: Global Carbon Sequestration Is Highly Sensitive to Model-Based Formulations of Nitrogen Fixation, Global Biogeochem. Cy., 34, e2019GB006296, https://doi.org/10.1029/2019GB006296, 2020.
Peoples, M. B., Giller, K. E., Jensen, E. S., and Herridge, D. F.: Quantifying country-to-global scale nitrogen fixation for grain legumes: I. Reliance on nitrogen fixation of soybean, groundnut and pulses, Plant Soil, 469, 1–14, https://doi.org/10.1007/s11104-021-05167-6, 2021.
Phillips, R. P., Brzostek, E., and Midgley, M. G.: The mycorrhizal-associated nutrient economy: A new framework for predicting carbon-nutrient couplings in temperate forests, New Phytol., 199, 41–51, https://doi.org/10.1111/nph.12221, 2013.
Poggio, L., de Sousa, L. M., Batjes, N. H., Heuvelink, G. B. M., Kempen, B., Ribeiro, E., and Rossiter, D.: SoilGrids 2.0: producing soil information for the globe with quantified spatial uncertainty, SOIL, 7, 217–240, https://doi.org/10.5194/soil-7-217-2021, 2021.
Poorter, H., Niklas, K. J., Reich, P. B., Oleksyn, J., Poot, P., and Mommer, L.: Biomass allocation to leaves, stems and roots: Meta-analyses of interspecific variation and environmental control, New Phytol., 193, 30–50, https://doi.org/10.1111/j.1469-8137.2011.03952.x, 2012.
Reed, S. C., Cleveland, C. C., and Townsend, A. R.: Functional Ecology of Free-Living Nitrogen Fixation: A Contemporary Perspective, Annu. Rev. Ecol. Evol. S., 42, 489–512, https://doi.org/10.1146/annurev-ecolsys-102710-145034, 2011.
Reed, S. C., Yang, X., and Thornton, P. E.: Incorporating phosphorus cycling into global modeling efforts: A worthwhile, tractable endeavor, New Phytol., 208, 324–329, https://doi.org/10.1111/nph.13521, 2015.
Reick, C. H., Gayler, V., Goll, D., Hagemann, S., Heidkamp, M., Nabel, J. E., Raddatz, T., Roeckner, E., Schnur, R., and Wilkenskjeld, S.: JSBACH 3 – The land component of the MPI Earth System Model: documentation of version 3.2, Berichte zur Erdsystemforschung, 240, https://doi.org/10.17617/2.3279802, 2021.
Rödenbeck, C., Zaehle, S., Keeling, R., and Heimann, M.: How does the terrestrial carbon exchange respond to inter-annual climatic variations? A quantification based on atmospheric CO2 data, Biogeosciences, 15, 2481–2498, https://doi.org/10.5194/bg-15-2481-2018, 2018.
Santoro, M., Beaudoin, A., Beer, C., Cartus, O., Fransson, J. E. S., Hall, R. J., Pathe, C., Schmullius, C., Schepaschenko, D., Shvidenko, A., Thurner, M., and Wegmüller, U.: Forest growing stock volume of the northern hemisphere: Spatially explicit estimates for 2010 derived from Envisat ASAR, Remote Sens. Environ., 168, 316–334, https://doi.org/10.1016/j.rse.2015.07.005, 2015.
Seiler, C.: AMBER, GitLab [code], https://gitlab.com/cseiler/AMBER (last access: 13 November 2022), 2021.
Seiler, C., Melton, J. R., Arora, V. K., and Wang, L.: CLASSIC v1.0: the open-source community successor to the Canadian Land Surface Scheme (CLASS) and the Canadian Terrestrial Ecosystem Model (CTEM) – Part 2: Global benchmarking, Geosci. Model Dev., 14, 2371–2417, https://doi.org/10.5194/gmd-14-2371-2021, 2021.
Seiler, C., Melton, J. R., Arora, V. K., Sitch, S., Friedlingstein, P., Anthoni, P., Goll, D., Jain, A. K., Joetzjer, E., Lienert, S., Lombardozzi, D., Luyssaert, S., Nabel, J. E. M. S., Tian, H., Vuichard, N., Walker, A. P., Yuan, W., and Zaehle, S.: Are Terrestrial Biosphere Models Fit for Simulating the Global Land Carbon Sink?, J. Adv. Model. Earth Syst., 14, e2021MS002946, https://doi.org/10.1029/2021MS002946, 2022.
Shi, M., Fisher, J. B., Brzostek, E. R., and Phillips, R. P.: Carbon cost of plant nitrogen acquisition: Global carbon cycle impact from an improved plant nitrogen cycle in the Community Land Model, Glob. Change Biol., 22, 1299–1314, https://doi.org/10.1111/gcb.13131, 2016.
Shu, S., Jain, A. K., Koven, C. D., and Mishra, U.: Estimation of Permafrost SOC Stock and Turnover Time Using a Land Surface Model With Vertical Heterogeneity of Permafrost Soils, Global Biogeochem. Cy., 34, e2020GB006585, https://doi.org/10.1029/2020GB006585, 2020.
Smith, B., Wårlind, D., Arneth, A., Hickler, T., Leadley, P., Siltberg, J., and Zaehle, S.: Implications of incorporating N cycling and N limitations on primary production in an individual-based dynamic vegetation model, Biogeosciences, 11, 2027–2054, https://doi.org/10.5194/bg-11-2027-2014, 2014.
Soper, F. M., Taylor, B. N., Winbourne, J. B., Wong, M. Y., Dynarski, K. A., Reis, C. R. G., Peoples, M. B., Cleveland, C. C., Reed, S. C., Menge, D. N. L., and Perakis, S. S.: A roadmap for sampling and scaling biological nitrogen fixation in terrestrial ecosystems, Methods Ecol. Evol., 2021, 1–16, https://doi.org/10.1111/2041-210X.13586, 2021.
Stocker, B. D., Prentice, I. C., Cornell, S. E., Davies-Barnard, T., Finzi, A. C., Franklin, O., Janssens, I., Larmola, T., Manzoni, S., Näsholm, T., Raven, J. A., Rebel, K. T., Reed, S., Vicca, S., Wiltshire, A., and Zaehle, S.: Terrestrial nitrogen cycling in Earth system models revisited, New Phytol., 210, 1165–1168, https://doi.org/10.1111/nph.13997, 2016.
Sullivan, B. W., Smith, W. K., Alan, R., Nasto, M. K., Reed, S. C., and Chazdon, R. L.: Spatially robust estimates of biological nitrogen (N) fixation imply substantial human alteration of the tropical N cycle, P. Natl. Acad. Sci. USA, 111, 8101–8106, https://doi.org/10.1073/pnas.1511978112, 2014.
Sun, Y., Goll, D. S., Chang, J., Ciais, P., Guenet, B., Helfenstein, J., Huang, Y., Lauerwald, R., Maignan, F., Naipal, V., Wang, Y., Yang, H., and Zhang, H.: Global evaluation of the nutrient-enabled version of the land surface model ORCHIDEE-CNP v1.2 (r5986), Geosci. Model Dev., 14, 1987–2010, https://doi.org/10.5194/gmd-14-1987-2021, 2021.
Terrer, C., Prentice, I., Jackson, R., Keenan, T., Kaiser, C., Vicca, S., Fisher, J., Reich, P., Stocker, B., Hungate, B., Penuelos, J., McCallum, I., Soudzilovskala, N., Cernusak, L., Talhelm, A., Van, S. K., Piao, S., Newton, P., Hovenden, M., Blumenthal, D., Liu, Y., Muller, C., Winter, K., Field, C., Viechtbauer, W., Van, L. C., Hoosbeek, M., Watanabe, M., Koike, T., Leshyk, V., Polley, W., and Franklin, O.: Nitrogen and phosphorus constrain the CO2 fertilization of global plant biomass, Nat. Clim. Change, 9, 684–689, https://doi.org/10.1038/s41558-019-0545-2, 2019.
Thomas, R. Q., Brookshire, E. N. J., and Gerber, S.: Nitrogen limitation on land: How can it occur in Earth system models?, Glob. Change Biol., 21, 1777–1793, https://doi.org/10.1111/gcb.12813, 2015.
Tian, H., Chen, G., Lu, C., Xu, X., Hayes, D. J., Ren, W., Pan, S., Huntzinger, D. N., and Wofsy, S. C.: North American terrestrial CO2 uptake largely offset by CH4 and N2O emissions: toward a full accounting of the greenhouse gas budget, Clim. Change, 129, 413–426, https://doi.org/10.1007/s10584-014-1072-9, 2015.
Tian, H., Yang, J., Lu, C., Xu, R., Canadell, J. G., Jackson, R., Arneth, A., Chang, J., Chen, G., Ciais, P., Gerber, S., Ito, A., Huang, Y., Joos, F., Lienert, S., Messina, P., Olin, S., Pan, S., Peng, C., Saikawa, E., Thompson, R. L., Vuichard, N., Winiwarter, W., Zaehle, S., Zhang, B., Zhang, K., and Zhu, Q.: The Global N2O Model Intercomparison Project (NMIP), B. Am. Meteorol. Soc., 99, 1231–1251, https://doi.org/10.1175/BAMS-D-17-0212.1, 2018.
Tian, H., Xu, R., Canadell, J. G., Thompson, R. L., Winiwarter, W., Suntharalingam, P., Davidson, E. A., Ciais, P., Jackson, R. B., Janssens-Maenhout, G., Prather, M. J., Regnier, P., Pan, N., Pan, S., Peters, G. P., Shi, H., Tubiello, F. N., Zaehle, S., Zhou, F., Arneth, A., Battaglia, G., Berthet, S., Bopp, L., Bouwman, A. F., Buitenhuis, E. T., Chang, J., Chipperfield, M. P., Dangal, S. R. S., Dlugokencky, E., Elkins, J. W., Eyre, B. D., Fu, B., Hall, B., Ito, A., Joos, F., Krummel, P. B., Landolfi, A., Laruelle, G. G., Lauerwald, R., Li, W., Lienert, S., Maavara, T., MacLeod, M., Millet, D. B., Olin, S., Patra, P. K., Prinn, R. G., Raymond, P. A., Ruiz, D. J., Werf, G. R. van der, Vuichard, N., Wang, J., Weiss, R. F., Wells, K. C., Wilson, C., Yang, J., and Yao, Y.: A comprehensive quantification of global nitrous oxide sources and sinks, Nature, 586, 248–256, https://doi.org/10.1038/s41586-020-2780-0, 2020.
Tian, H., Bian, Z., Shi, H., Qin, X., Pan, N., Lu, C., Pan, S., Tubiello, F. N., Chang, J., Conchedda, G., Liu, J., Mueller, N., Nishina, K., Xu, R., Yang, J., You, L., and Zhang, B.: History of anthropogenic Nitrogen inputs (HaNi) to the terrestrial biosphere: a 5 arcmin resolution annual dataset from 1860 to 2019, Earth Syst. Sci. Data, 14, 4551–4568, https://doi.org/10.5194/essd-14-4551-2022, 2022.
Todd-Brown, K. E. O., Randerson, J. T., Post, W. M., Hoffman, F. M., Tarnocai, C., Schuur, E. A. G., and Allison, S. D.: Causes of variation in soil carbon simulations from CMIP5 Earth system models and comparison with observations, Biogeosciences, 10, 1717–1736, https://doi.org/10.5194/bg-10-1717-2013, 2013.
Townsend, P. A., Serbin, S. P., Kruger, E. L., and Gamon, J. A.: Disentangling the contribution of biological and physical properties of leaves and canopies in imaging spectroscopy data, P. Natl. Acad. Sci. USA, 110, E1074–E1074, https://doi.org/10.1073/pnas.1300952110, 2013.
Verger, A., Baret, F., and Weiss, M.: Near Real-Time Vegetation Monitoring at Global Scale, IEEE J. Sel. Top. Appl., 7, 3473–3481, https://doi.org/10.1109/JSTARS.2014.2328632, 2014.
Vicca, S., Stocker, B. D., Reed, S., Wieder, W. R., Bahn, M., Fay, P. A., Janssens, I. A., Lambers, H., Peñuelas, J., Piao, S., Rebel, K. T., Sardans, J., Sigurdsson, B. D., Sundert, K. V., Wang, Y. P., Zaehle, S., and Ciais, P.: Using research networks to create the comprehensive datasets needed to assess nutrient availability as a key determinant of terrestrial carbon cycling, Environ. Res. Lett., 13, 125006, https://doi.org/10.1088/1748-9326/aaeae7, 2018.
Vitousek, P. M., Menge, D. N., Reed, S. C., and Cleveland, C. C.: Biological nitrogen fixation: rates, patterns and ecological controls in terrestrial ecosystems, Philos. T. R. Soc. B, 368, 20130119, https://doi.org/10.1098/rstb.2013.0119, 2013.
Vuichard, N., Messina, P., Luyssaert, S., Guenet, B., Zaehle, S., Ghattas, J., Bastrikov, V., and Peylin, P.: Accounting for carbon and nitrogen interactions in the global terrestrial ecosystem model ORCHIDEE (trunk version, rev 4999): multi-scale evaluation of gross primary production, Geosci. Model Dev., 12, 4751–4779, https://doi.org/10.5194/gmd-12-4751-2019, 2019.
Walker, A. P., Beckerman, A. P., Gu, L., Kattge, J., Cernusak, L. A., Domingues, T. F., Scales, J. C., Wohlfahrt, G., Wullschleger, S. D., and Woodward, F. I.: The relationship of leaf photosynthetic traits – Vcmax and Jmax – to leaf nitrogen, leaf phosphorus, and specific leaf area: A meta-analysis and modeling study, Ecol. Evol., 4, 3218–3235, https://doi.org/10.1002/ece3.1173, 2014.
Wang, R., Goll, D., Balkanski, Y., Hauglustaine, D., Boucher, O., Ciais, P., Janssens, I., Penuelas, J., Guenet, B., Sardans, J., Bopp, L., Vuichard, N., Zhou, F., Li, B., Piao, S., Peng, S., Huang, Y., and Tao, S.: Global forest carbon uptake due to nitrogen and phosphorus deposition from 1850 to 2100, Glob. Change Biol., 23, 4854–4872, https://doi.org/10.1111/gcb.13766, 2017.
Wang, S., Zhang, Y., Ju, W., Chen, J. M., Ciais, P., Cescatti, A., Sardans, J., Janssens, I. A., Wu, M., Berry, J. A., Campbell, E., and Penuelas, J.: Recent global decline of CO2 fertilization effects on vegetation photosynthesis, Science, 370, 1295–1300, https://doi.org/10.1126/science.abb7772, 2020.
Wang, Y. P., Law, R. M., and Pak, B.: A global model of carbon, nitrogen and phosphorus cycles for the terrestrial biosphere, Biogeosciences, 7, 2261–2282, https://doi.org/10.5194/bg-7-2261-2010, 2010.
Wang, Z., Tian, H., Yang, J., Shi, H., Pan, S., Yao, Y., Banger, K., and Yang, Q.: Coupling of Phosphorus Processes With Carbon and Nitrogen Cycles in the Dynamic Land Ecosystem Model: Model Structure, Parameterization, and Evaluation in Tropical Forests, J. Adv. Model. Earth Sy., 12, e2020MS002123, https://doi.org/10.1029/2020MS002123, 2020.
Wieder, W.: Regridded Harmonized World Soil Database v1.2, Oak Ridge National Laboratory Distributed Active Archive Center (ORNL DAAC) [data set], https://doi.org/10.3334/ORNLDAAC/1247, 2014.
Wieder, W., Cleveland, C., Lawrence, D., and Bonan, G.: Effects of model structural uncertainty on carbon cycle projections: Biological nitrogen fixation as a case study, Environ. Res. Lett., 10, 044016, https://doi.org/10.1088/1748-9326/10/4/044016, 2015a.
Wieder, W., Cleveland, C. C., Smith, W. K., and Todd-Brown, K.: Future productivity and carbon storage limited by terrestrial nutrient availability, Nat. Geosci., 8, 441–444, https://doi.org/10.1038/ngeo2413, 2015b.
Wieder, W., Lawrence, D. M., Fisher, R. A., Bonan, G. B., Cheng, S. J., Goodale, C. L., Grandy, A. S., Koven, C. D., Lombardozzi, D. L., Oleson, K. W., and Thomas, R. Q.: Beyond Static Benchmarking: Using Experimental Manipulations to Evaluate Land Model Assumptions, Global Biogeochem. Cy., 33, 1289–1309, https://doi.org/10.1029/2018GB006141, 2019.
Wiltshire, A. J., Burke, E. J., Chadburn, S. E., Jones, C. D., Cox, P. M., Davies-Barnard, T., Friedlingstein, P., Harper, A. B., Liddicoat, S., Sitch, S., and Zaehle, S.: JULES-CN: a coupled terrestrial carbon–nitrogen scheme (JULES vn5.1), Geosci. Model Dev., 14, 2161–2186, https://doi.org/10.5194/gmd-14-2161-2021, 2021.
Wright, S. J., Turner, B. L., Yavitt, J. B., Harms, K. E., Kaspari, M., Tanner, E. V. J., Bujan, J., Griffin, E. A., Mayor, J. R., Pasquini, S. C., Sheldrake, M., and Garcia, M. N.: Plant responses to fertilization experiments in lowland, species-rich, tropical forests, Ecology, 99, 1129–1138, https://doi.org/10.1002/ecy.2193, 2018.
Yang, X., Thornton, P. E., Ricciuto, D. M., and Post, W. M.: The role of phosphorus dynamics in tropical forests – a modeling study using CLM-CNP, Biogeosciences, 11, 1667–1681, https://doi.org/10.5194/bg-11-1667-2014, 2014.
Zaehle, S. and Dalmonech, D.: Carbon-nitrogen interactions on land at global scales: Current understanding in modelling climate biosphere feedbacks, Curr. Opin. Env. Sust., 3, 311–320, https://doi.org/10.1016/j.cosust.2011.08.008, 2011.
Zaehle, S. and Friend, A. D.: Carbon and nitrogen cycle dynamics in the O-CN land surface model: 1. Model description, site-scale evaluation, and sensitivity to parameter estimates, Global Biogeochem. Cy., 24, GB1005, https://doi.org/10.1029/2009GB003521, 2010.
Zaehle, S., Medlyn, B. E., Kauwe, M. G. D., Walker, A. P., Dietze, M. C., Hickler, T., Luo, Y., Wang, Y. P., El-Masri, B., Thornton, P., Jain, A., Wang, S., Warlind, D., Weng, E., Parton, W., Iversen, C. M., Gallet-Budynek, A., Mccarthy, H., Finzi, A., Hanson, P. J., Prentice, I. C., Oren, R., and Norby, R. J.: Evaluation of 11 terrestrial carbon-nitrogen cycle models against observations from two temperate Free-Air CO2 Enrichment studies, New Phytol., 202, 803–822, https://doi.org/10.1111/nph.12697, 2014.
Zaehle, S., Jones, C. D., Houlton, B., Lamarque, J. F., and Robertson, E.: Nitrogen availability reduces CMIP5 projections of twenty-first-century land carbon uptake, J. Climate, 28, 2494–2511, https://doi.org/10.1175/JCLI-D-13-00776.1, 2015.
Zechmeister-Boltenstern, S., Keiblinger, K. M., Mooshammer, M., Peñuelas, J., Richter, A., Sardans, J., and Wanek, W.: The application of ecological stoichiometry to plant-microbial-soil organic matter transformations, Ecol. Monogr., 85, 133–155, https://doi.org/10.1890/14-0777.1, 2015.
Zhang, Y. and Liang, S.: Fusion of Multiple Gridded Biomass Datasets for Generating a Global Forest Aboveground Biomass Map, Remote Sens., 12, 2559, https://doi.org/10.3390/rs12162559, 2020.
Zhang, Y., Xiao, X., Wu, X., Zhou, S., Zhang, G., Qin, Y., and Dong, J.: A global moderate resolution dataset of gross primary production of vegetation for 2000–2016, Sci. Data, 4, 1–13, https://doi.org/10.1038/sdata.2017.165, 2017.
Zheng, M., Zhou, Z., Luo, Y., Zhao, P., and Mo, J.: Global pattern and controls of biological nitrogen fixation under nutrient enrichment: A meta-analysis, Glob. Change Biol., 25, 3018–3030, https://doi.org/10.1111/gcb.14705, 2019.
Zheng, M., Zhou, Z., Zhao, P., Luo, Y., Ye, Q., Zhang, K., Song, L., and Mo, J.: Effects of human disturbance activities and environmental change factors on terrestrial nitrogen fixation, Glob. Change Biol., 26, 6203–6217, https://doi.org/10.1111/gcb.15328, 2020.