the Creative Commons Attribution 4.0 License.
the Creative Commons Attribution 4.0 License.
 | 19 Apr 2022
Divergent historical GPP trends among state-of-the-art multi-model simulations and satellite-based products
Ruqi Yang
Ning Zeng
Stephen Sitch
Wenhan Tang
Matthew Joseph McGrath
Qixiang Cai
Di Liu
Danica Lombardozzi
Hanqin Tian
Atul K. Jain
Pengfei Han
Understanding historical changes in gross primary productivity (GPP) is essential for better predicting the future global carbon cycle. However, the historical trends of terrestrial GPP, due to the CO2 fertilization effect, climate, and land-use change, remain largely uncertain. Using long-term satellite-based near-infrared radiance of vegetation (NIRv), a proxy for GPP, and multiple GPP datasets derived from satellite-based products, dynamic global vegetation model (DGVM) simulations, and an upscaled product from eddy covariance (EC) measurements, here we comprehensively investigated their trends and analyzed the causes for any discrepancies during 1982–2015. Although spatial patterns of climatological annual GPP from all products and NIRv are highly correlated (r>0.84), the spatial correlation coefficients of trends between DGVM GPP and NIRv significantly decreased (with the ensemble mean of r=0.49) and even the spatial correlation coefficients of trends between other GPP products and NIRv became negative. By separating the global land into the tropics plus extratropical Southern Hemisphere (Trop+SH) and extratropical Northern Hemisphere (NH), we found that, during 1982–2015, simulated GPP from most of the models showed a stronger increasing trend over Trop+SH than NH. In contrast, the satellite-based GPP products indicated a substantial increase over NH. Mechanistically, model sensitivity experiments indicated that the increase of annual global total GPP was dominated by the CO2 fertilization effect (83.9 % contribution), however, with the largest uncertainty in magnitude in individual simulations among the three drivers of CO2 fertilization, climate, and land-use change. Interestingly, the spatial distribution of inter-model spreads of GPP trends resulted mainly from climate and land-use change rather than CO2 fertilization effect. After 2000, trends from satellite-based GPP products were different from the full time series, suggesting weakened rising trends over NH and even significantly decreasing trends over Trop+SH, while the trends from DGVMs and NIRv kept increasing. The inconsistencies of GPP trends are very likely caused by the contrasting performance between satellite-derived and DGVM simulated vegetation structure parameter (leaf area index, LAI). Therefore, the uncertainty in satellite-based GPP products induced by highly uncertain LAI data in the tropics undermines their roles in assessing the performance of DGVM simulations and understanding the changes of global carbon sinks. The higher consistency between DGVM GPP and NIRv suggests that the trends from a DGVM ensemble might even have better performance than satellite-based GPP products.
- Article
(8726 KB) - Full-text XML
-
Supplement
(6425 KB) - BibTeX
- EndNote


The gross primary productivity (GPP) is the largest carbon flux in the terrestrial carbon cycle. Quantifying terrestrial GPP and understanding its variations are vital in the global and regional carbon cycle (Ryu et al., 2019). To date, there are multiple global GPP products, mainly including the upscaled products from the eddy covariance (EC) flux data by machine learning techniques (Beer et al., 2010; Jung et al., 2020), satellite-based estimates by light-use efficiency (LUE) model (Running et al., 2004; Yuan et al., 2010; Joiner et al., 2018; Zheng et al., 2020), and simulations by the state-of-the-art dynamic global vegetation models (DGVMs) (Huntzinger et al., 2013; Sitch et al., 2015).
The machine learning FLUXCOM GPP products based on the global FLUXNET network, remote sensing, and meteorological input (Jung et al., 2020; Pastorello et al., 2020) are widely used in terrestrial carbon cycle studies. Taking FLUXCOM GPP as a benchmark, researchers have explored the interannual variation, seasonal cycle, and climatology pattern of global and regional GPP (Chen et al., 2017; Jia et al., 2020; Zhang and Ye, 2021). However, due to the lack of the CO2 fertilization effect, the performance of this product on the long-term GPP trend is not realistic (Jung et al., 2020). Based on the LUE principle and derived from the Advanced Very High-Resolution Radiometer (AVHRR) and the Moderate Resolution Imaging Spectroradiometer (MODIS) datasets, the satellite-based GPP estimates include MOD17, GLASS, GIMMS, FluxSat, WECANN, and the revised EC_LUE GPP product (Running et al., 2004; Yuan et al., 2007; Smith et al., 2016; Alemohammad et al., 2017; Joiner et al., 2018; Zheng et al., 2020). These GPP products capture the seasonal variation, spatial distribution, and interannual variation to a large extent (Wang et al., 2014) but do not always account for the CO2 fertilization effect (O'Sullivan et al., 2020). For DGVM simulations, different forcing datasets, parameterizations, and processes considered can make the surprising differences in model representation of responses of photosynthesis to CO2 concentration, soil moisture, temperature, and water vapor deficit (Rogers, 2014; Rogers et al., 2017; Ito et al., 2017; M. Wang et al., 2021). These differences caused large inter-model spreads in GPP simulations (Ito et al., 2017). Hence, many efforts have been made to constrain the global GPP magnitude based on the satellite observations like solar-induced chlorophyll fluorescence (SIF) (Macbean et al., 2018; Bacour et al., 2019; Norton et al., 2019; J. Wang et al., 2021a).
The application of satellite-derived GPP proxy datasets provides a breakthrough for estimating global GPP (Running et al., 2004; Badgley et al., 2019; Piao et al., 2020). Many GPP proxy indices, such as normalized difference vegetation index (NDVI), enhanced vegetation index (EVI), and SIF, have been widely used to estimate the global GPP (Frankenberg et al., 2011; Guanter et al., 2014). However, each of them has its shortcomings. For example, NDVI can be saturated in tropical regions, demonstrating its nonlinear relationship with GPP (Badgley et al., 2017, 2019; Camps-Valls et al., 2021). The EVI index improves the NDVI algorithm, but this index has not entirely solved the saturation problem (Huete et al., 2002). Without dealing with the problem of distinguishing whether the signal comes from the plant or other interference factors, satellite retrieval of SIF measures the light emitted by chlorophyll in leaves and can be used as a robust proxy of GPP (Frankenberg et al., 2011; Mohammed et al., 2019). However, the time range of global SIF products is short, with direct observations only available from 2007. Representing the proportion of reflected near-infrared radiation attributable to vegetation, long-term satellite-derived near-infrared radiance of vegetation (NIRv) is a relatively recent GPP proxy (Badgley et al., 2017). Compared to NDVI and EVI, the saturation problem of NIRv and GPP in the tropical region is weakened because the mixed effects of background brightness, leaf area, and the distribution of canopy photosynthetic capacity with depth are largely eliminated. Since NIRv can be directly obtained from observational datasets of the AVHRR sensors, it can be derived from 1982 to the present. Moreover, previous studies have shown that NIRv and SIF are closely related and indicated that NIRv could well represent changes in GPP (Badgley et al., 2017, 2019; Camps-Valls et al., 2021; Wang et al., 2020).
Although there have been a lot of studies focusing on extreme anomalies, the seasonal cycle, interannual variation, and the climatological pattern of global and regional GPP based on the multiple GPP products and proxy indices (Chen et al., 2017; Madani et al., 2020; J. Wang et al., 2021b), few efforts have been devoted to evaluate the long-term GPP trends across different GPP sources and to analyze the causes of uncertainties. This study will comprehensively investigate historical GPP trends during 1982–2015, based on the satellite-derived GPP proxy (NIRv), simulations from process-based models, machine-learning products, satellite-based estimates, and site-level observations. Hereinafter, Sect. 2 describes the datasets and statistical methods used. The comparison of GPP trends among GPP proxy, DGVM simulations, and satellite-based GPP products is in Sect. 3.1. The mechanisms of the trend attributions are explored in Sect. 3.2. The uncertainties in GPP trends are discussed in Sect. 3.3. At last, the main conclusions of the results are summarized in Sect. 4.
2.1 TRENDYv6 multi-model-simulated GPP
We used the model simulation results conducted under the auspices of the “Trends and drivers of the regional scale sources and sinks of carbon dioxide” (TRENDY) Project (Sitch et al., 2015). We used 10 DGVMs in the TRENDYv6 project for the period of 1982–2015, including CABLE (Haverd et al., 2018), CLASS-CTEM (Melton and Arora, 2016), CLM4.5 (Oleson et al., 2013), DLEM (Tian et al., 2015), ISAM (Jain et al., 2013), OCN (Zaehle et al., 2010), ORCHIDEE-MICT (Guimberteau et al., 2018), ORCHIDEE (Krinner et al., 2005), VEGAS (Zeng et al., 2005), and VISIT (Kato et al., 2013). There is a suite of experimental protocols in the TRENDY project, and we here explored GPP trends and their mechanisms using the GPP outputs from three simulations. In detail, DGVMs were run under the varying CO2 concentration, and constant climate conditions and land-use change in experiment S1 in the Supplement; the varying CO2 concentration and climate conditions, with constant land-use change in experiment S2; the varying CO2 concentration, climate conditions, and land-use change in experiment S3. Hence, experiment S1 represents the impact of the CO2 fertilization effect. The contributions of climate change and land-use change (hereafter “LUC”) are calculated through the differences between experiments S2 and S1 and experiments S3 and S2, respectively. These modeling details are listed in Table 1.
In Sect. 3.2 and 3.3.1, we calculated the ensemble mean of the seven model simulations, which included all scenarios as the DGVM ensemble GPP and calculated their standard deviation to represent inter-model spread across these models. In other sections which only need results from experiment S3, we used the ensemble mean simulations from 10 models.
Table 1Information of TRENDYv6 models used in this study. S1 represents the impact of the CO2 fertilization effect, S2 represents the impact of the CO2 fertilization effect and climate change, and S3 represents the impact of the CO2 fertilization effect, climate change, and LUC.
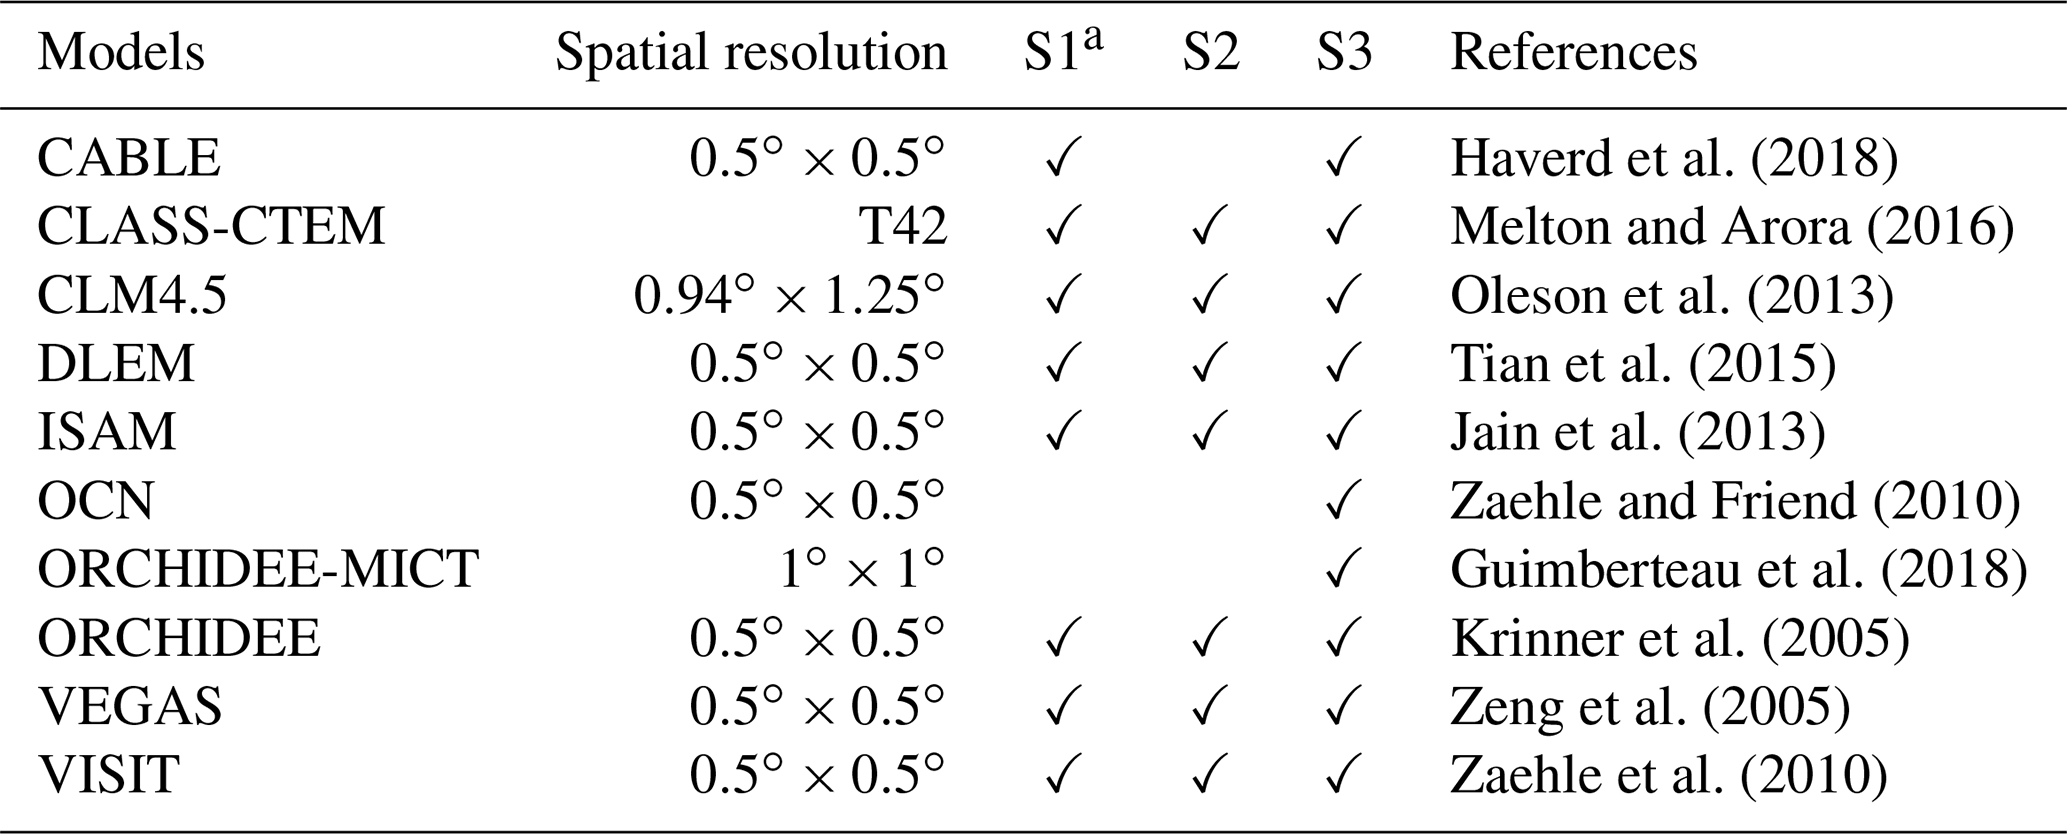
a Simulation datasets in the corresponding experiments (S1, S2, and S3) as available for models indicated with the notation of “✓”.
2.2 FLUXCOM GPP
The FLUXCOM datasets comprised of 120 global carbon flux products generated by nine machine learning algorithms based on site-level observed GPP measured by EC associated with remote sensing information and meteorology data but did not take the CO2 fertilization effect into account (Jung et al., 2020). This research used the ensemble mean of GPP datasets forced by the Climatic Research Unit – Japanese Reanalysis (CRU JRA) climate data and generated from three machine learning techniques (random forest, artificial neural network, and multivariate adaptive regression splines) from 1982 to 2015. The original spatial resolution of this dataset is .
2.3 Satellite-based GPP products
In this study, the GLASS GPP and revised EC-LUE GPP estimates were used as representatives of long-term satellite-based GPP products from 1982 to 2015. GLASS GPP originated from the eddy covariance–light-use efficiency (EC-LUE) model (Yuan et al., 2007), which considered various impact factors (NDVI, photosynthetically active radiation, temperature, CO2 concentrations, the Bowen ratio of sensible to latent heat flux, water vapor pressure deficit (VPD), direct radiation fluxes, and diffuse radiation fluxes) and nine ecosystem types to accurately estimate the long-term change of GPP (Yuan et al., 2019). The original spatial resolution of this dataset is .
The revised EC-LUE GPP is a long-term GPP dataset based on the LUE equation. Zheng et al. (2020) generated the revised EC-LUE GPP using the following formula:
where εmsu is the maximum LUE of sunlit leaves and εmsh is the maximum LUE of shaded leaves; APARsu is the PAR absorbed by sunlit leaves, and APARsh is the PAR absorbed by shaded leaves. Cs, Ts, and Ws represent the downward regulation scalars of atmospheric CO2 concentration, temperature, and VPD on LUE with the range from 0 to 1. Specifically, the direct effect of CO2 fertilization on GPP is determined by the following equations:
where Ci represents the CO2 concentration inside the leaf, Ca is the atmospheric CO2 concentration, φ means the CO2 compensation point in the absence of dark respiration (ppm), and χ means the ratio of CO2 concentration inside the leaf to that in the atmosphere (Farquhar et al., 1980). After adding the effect of CO2 fertilization, Zheng et al. (2020) suggested that the generated GPP was closer to the site observation data of more than 5 years (R2=0.44) than that of other LUE models (R2 ranged from 0.06 to 0.30). The original spatial resolution of this dataset is .
The spatial pattern and temporal changes of the GLASS GPP and revised EC-LUE GPP are highly consistent (Figs. S1, S2, and S3). Therefore, for simplicity, we averaged them to represent satellite-based GPP products.
2.4 NIRv dataset
The long-term (1982–2015) satellite growing season NIRv dataset used in this study as the GPP proxy (Badgley et al., 2019) originates from the AVHRR sensors. Following the previous study, the NIRv was first calculated as a function of monthly NDVI and near-infrared reflection of the total pixel (NIRT) via the equation of (Badgley et al., 2017). By defining the growing season as monthly average temperature higher than 0 ∘C, the NIRv for each grid cell during the growing season was then aggregated into annual value. Wang et al. (2020) have shown that AVHRR NIRv could explain about 60 % of the monthly variances in ground observational GPP from the FLUXNET2015 dataset, and NIRv trends could be used as the proxy of GPP trends under the different definitions of the growing season.
2.5 Site-level GPP observations
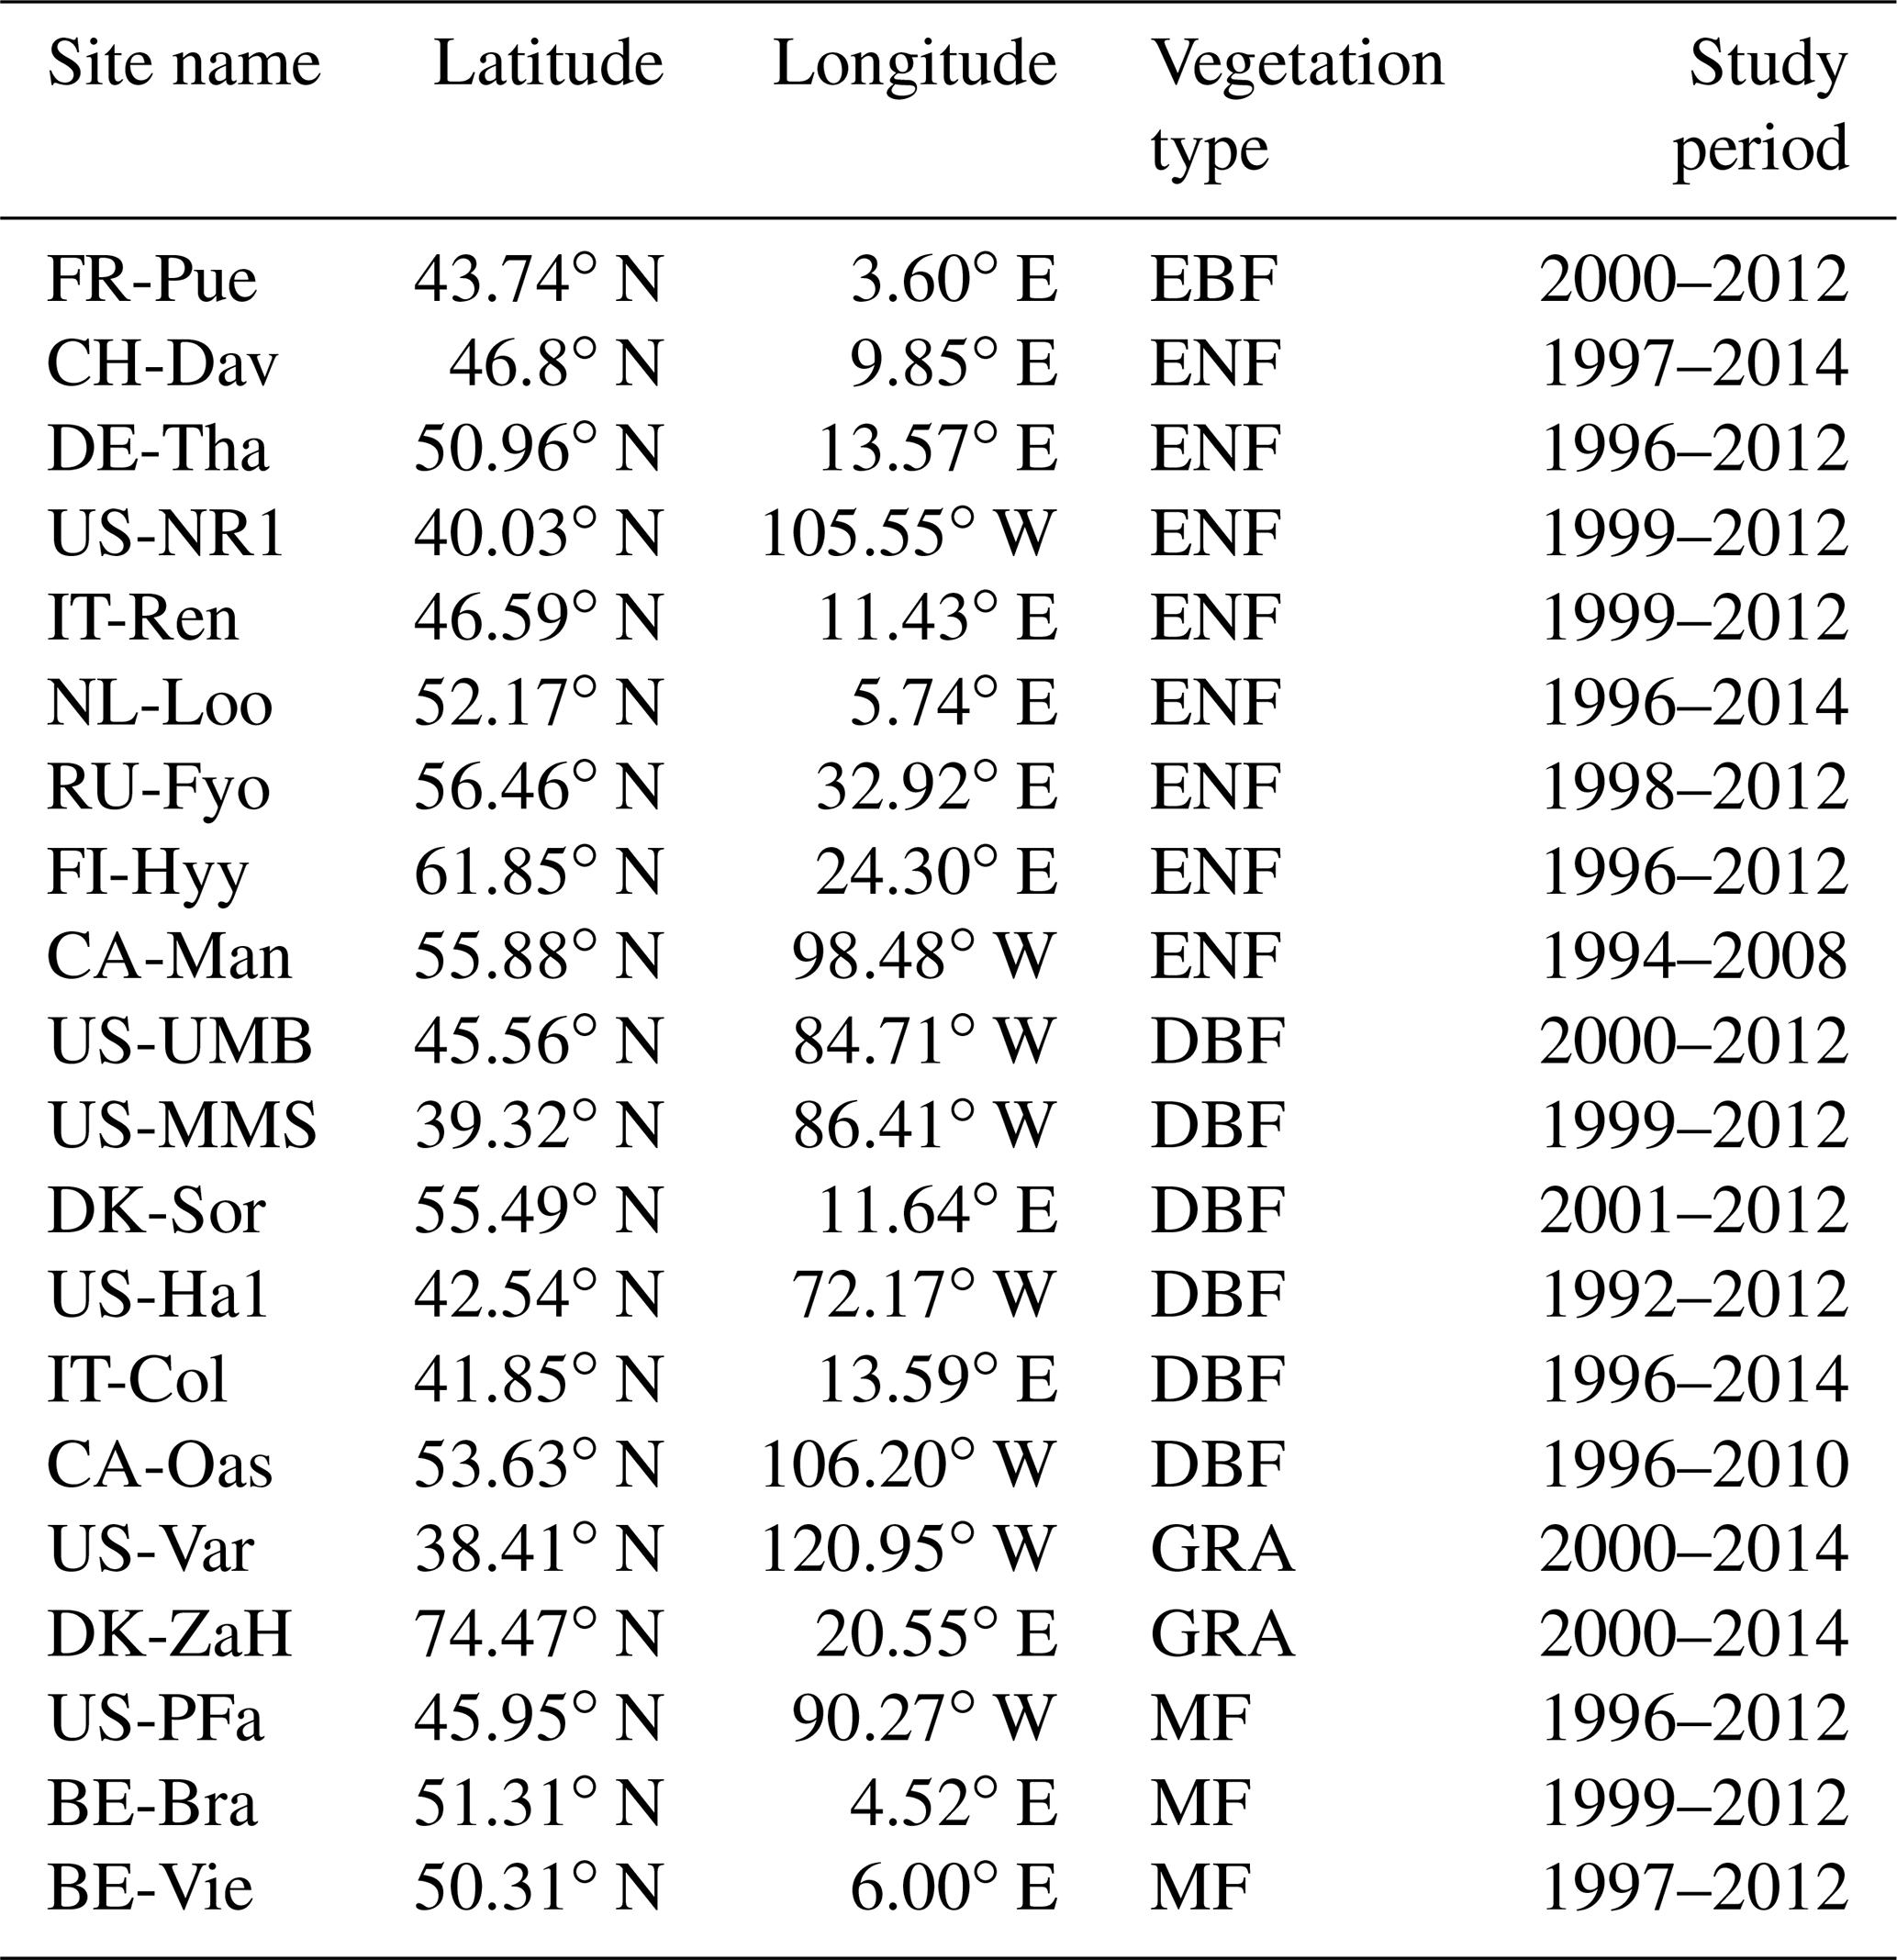
We also adopted 20 EC sites from the FLUXNET2015 dataset (Pastorello et al., 2020) with an observation period longer than 15 years to evaluate the performance of different global GPP products. These sites, all located over Northern Hemisphere, included five vegetation types: evergreen broadleaf forest (EBF), evergreen needleleaf forest (ENF), deciduous broadleaf forest (DBF), grassland (GRA), and mixed forest (MF) (Table 2). The GPP variable used in this study is GPP_NT_VUT_REF. When evaluating the global gridded GPP datasets with the site observations, the bilinear interpolation method was used to interpolate the gridded data to the specific site locations.
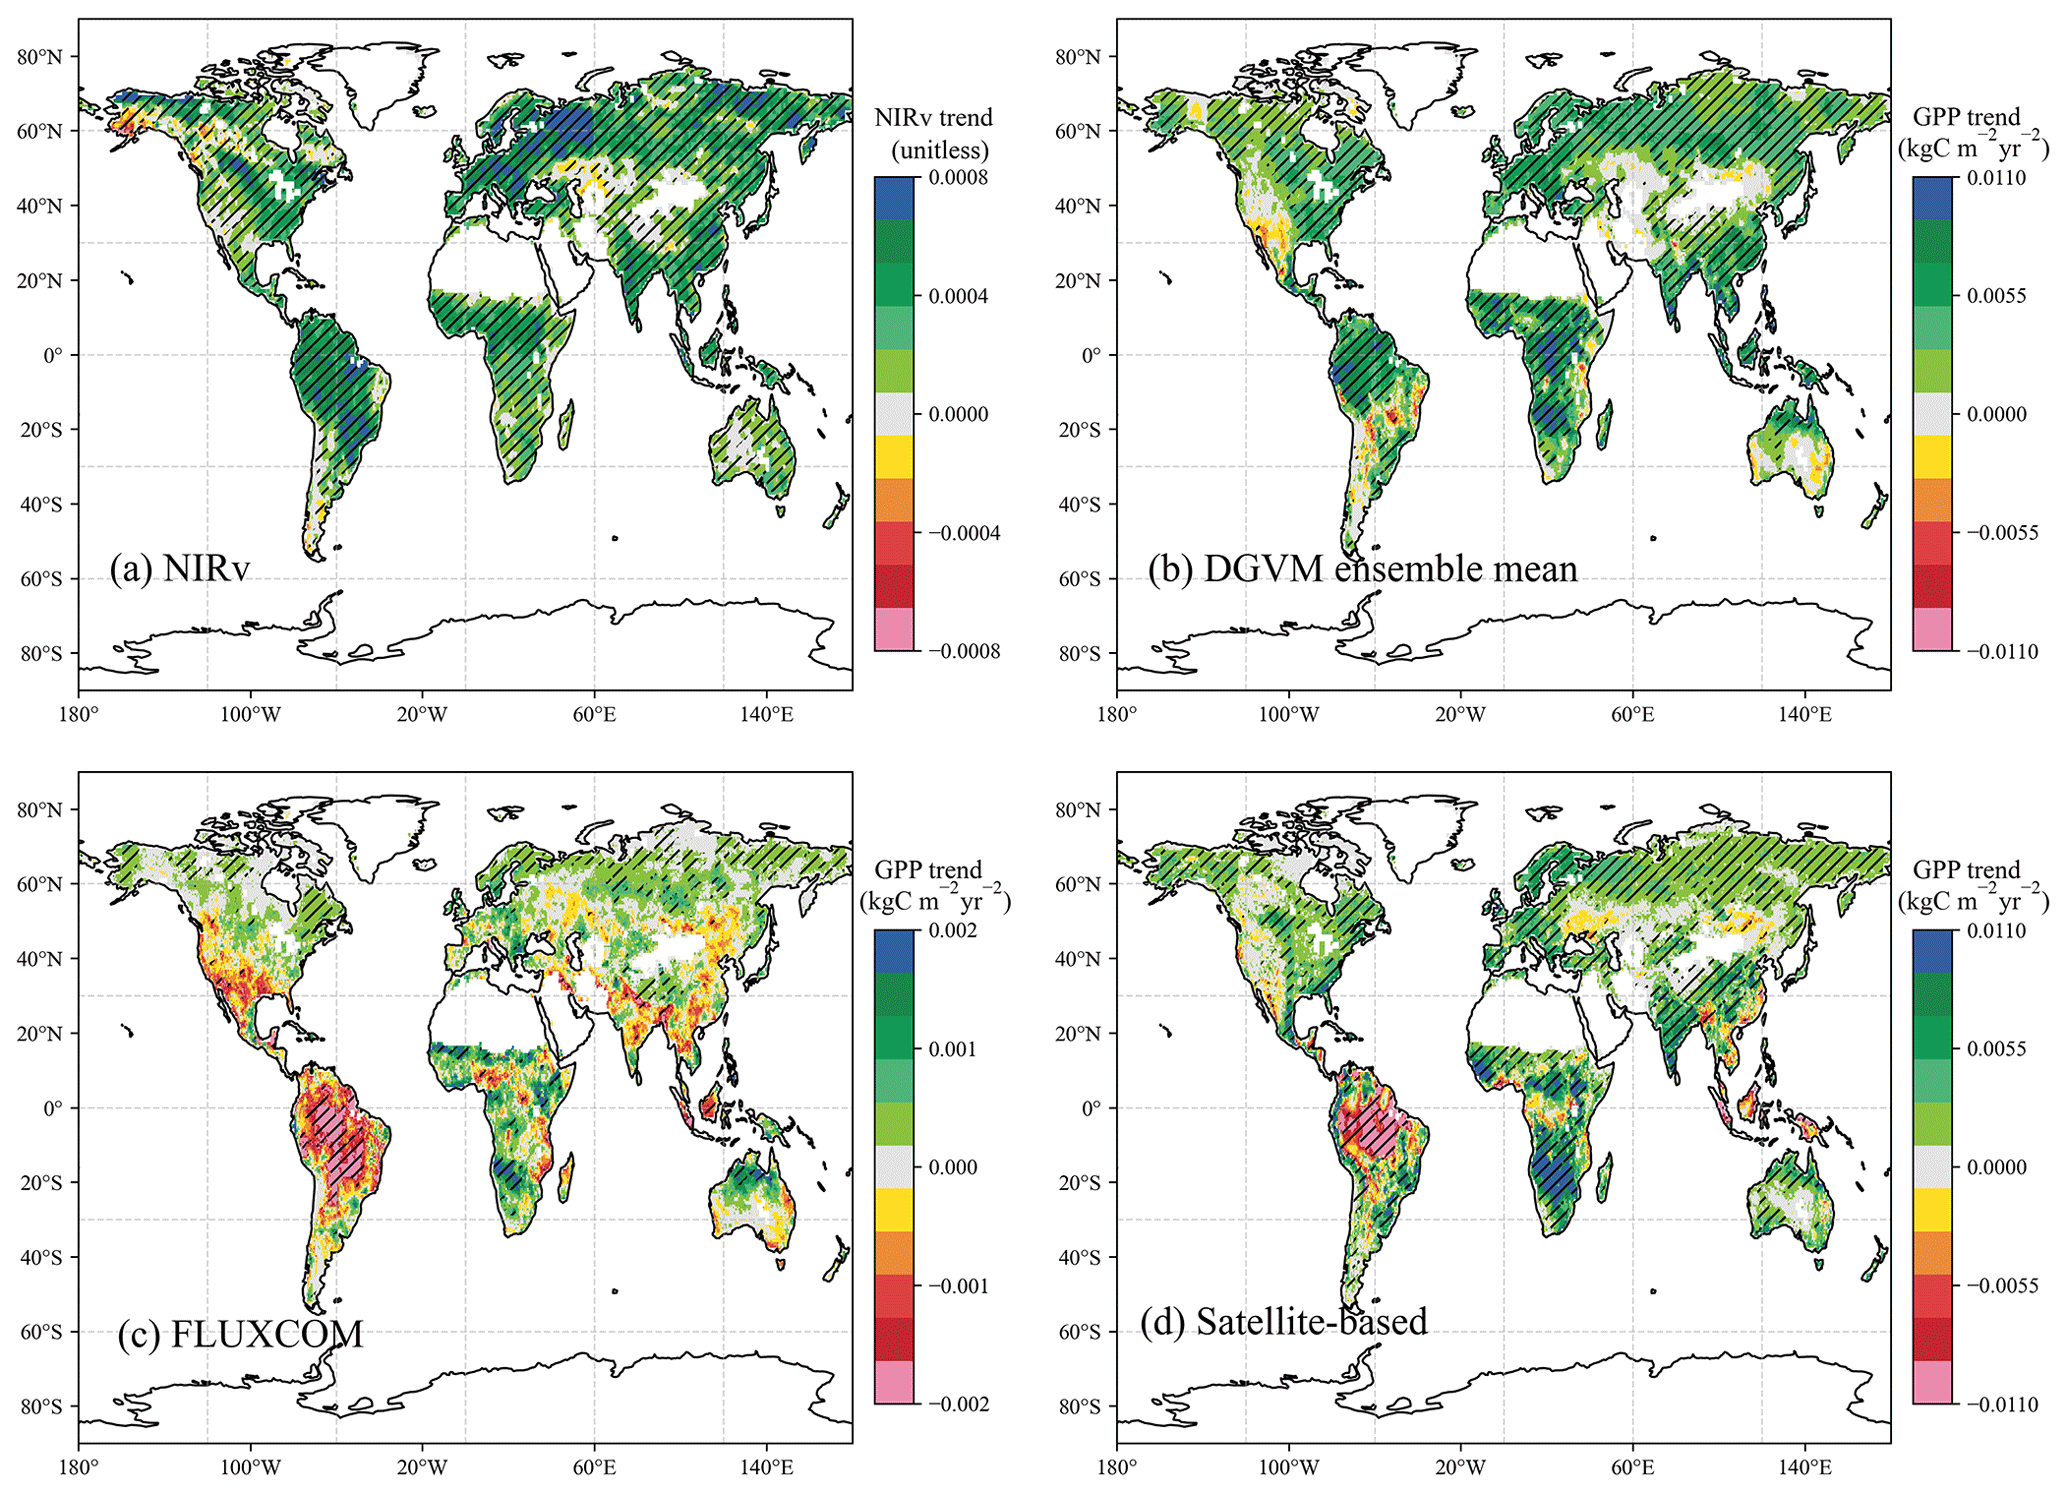
Figure 1Geographical distributions of linear trends of NIRv and GPP during 1982–2015. (a) AVHRR NIRv, (b) ensemble mean of TRENDY multi-model-simulated GPP, (c) FLUXCOM GPP, (d) mean of satellite-based products from revised EC-LUE and GLASS GPP. Striped areas indicate that the trends are significant with p<0.05 following the non-parametric Mann–Kendall trend test. The trends of NIRv and GPP are unitless and in kgC m−2 yr−2, respectively. Additionally, due to a lack of the CO2 fertilization effect in FLUXCOM GPP (c), we used a smaller scale than in panels (b) and (d).
Table 2FLUXNET sites used in this study. The vegetation types include evergreen broadleaf forest (EBF), evergreen needleleaf forest (ENF), deciduous broadleaf forest (DBF), grassland (GRA), and mixed forest (MF).
2.6 Leaf area index
GLASS LAI version 05 was used to compare the TRENDY model ensemble LAI (S3) because it is an input parameter for GLASS GPP and revised EC-LUE GPP. This dataset originated from version 4 of the Long-Term Data Record (LTDR) AVHRR surface reflectance product before 2001 with a spatial resolution of and MODIS surface reflectance product (MOD09) after 2001 with a spatial resolution of 1 km × 1 km. The spatial-average method was used to aggregate the dataset to . Biome-specific general regression neural networks were used to fuse these two datasets to generate a long-term LAI product (1982–2018), which improved performance than the original datasets. Its spatial and temporal resolutions are and 8 d, respectively (Xiao et al., 2016). The previous study has shown that this product performed well than other long-time LAI estimations based on the evaluation of high-resolution reference maps at VAlidation of Land European Remote sensing Instruments (VALERI) sites (Xiao et al., 2017).
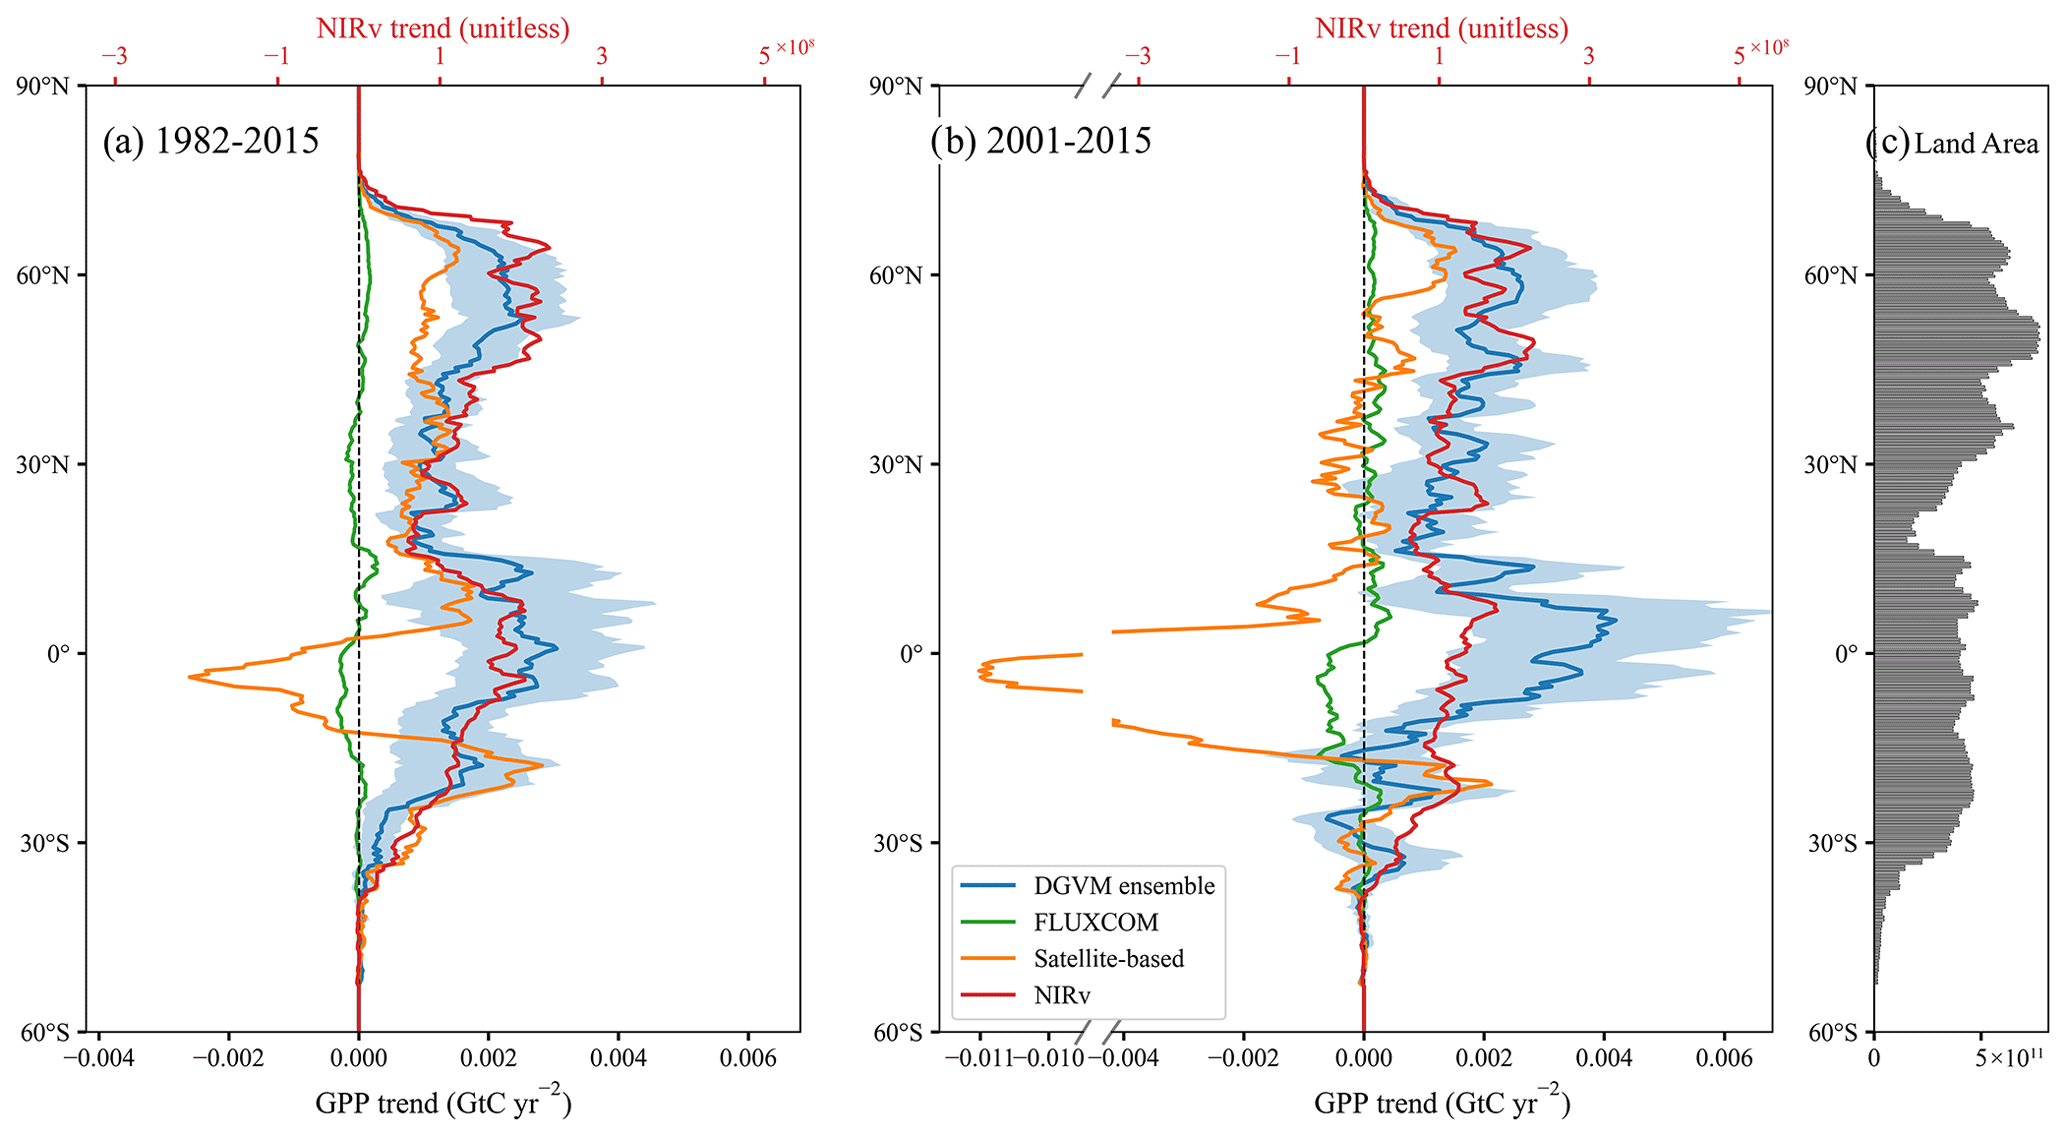
Figure 2Latitudinal profiles of trends of annual zonal total NIRv and GPP (0.5∘ latitudinal bins). Results for the DGVM ensemble mean (blue), FLUXCOM GPP (green), satellite-based products (orange), and NIRv (red) during 1982–2015 (a) and 2001–2015 (b), respectively. The GPP values are given on the bottom axis and the NIRv values on the top axis. The shaded areas represent the standard deviation of the individual TRENDY model-simulated GPP trend. The units of the NIRv and GPP trends are unitless and GtC yr−2, respectively. Panel (c) represents the latitudinal total vegetated land areas (m2).
2.7 Statistical methods used
Due to the difference among spatial resolution of each product, we resampled all GPP datasets into through the first-order conservative remapping method:
where is the area-averaged destination quantity, Ak indicates the area of grid k, and f is the quantity in an old grid with an overlapping area with the destination grid. We resampled NIRv and LAI into using bilinear interpolation and generated the annual datasets according to the weights of days. To detect the historical changes in GPP in each dataset, we calculated the global and regional total GPP and their linear trends. We also calculated the linear trends of each dataset at the pixel level to generate the spatial patterns of GPP trends. The linear trend was calculated as
where k represents the linear trend of the time series, b is the intercept, and ε is the error term.
Finally, non-parametric Mann–Kendall trend tests were used to evaluate the level of significance for each GPP time series because it does not require the data to follow the normal distribution (Hamed, 1998).
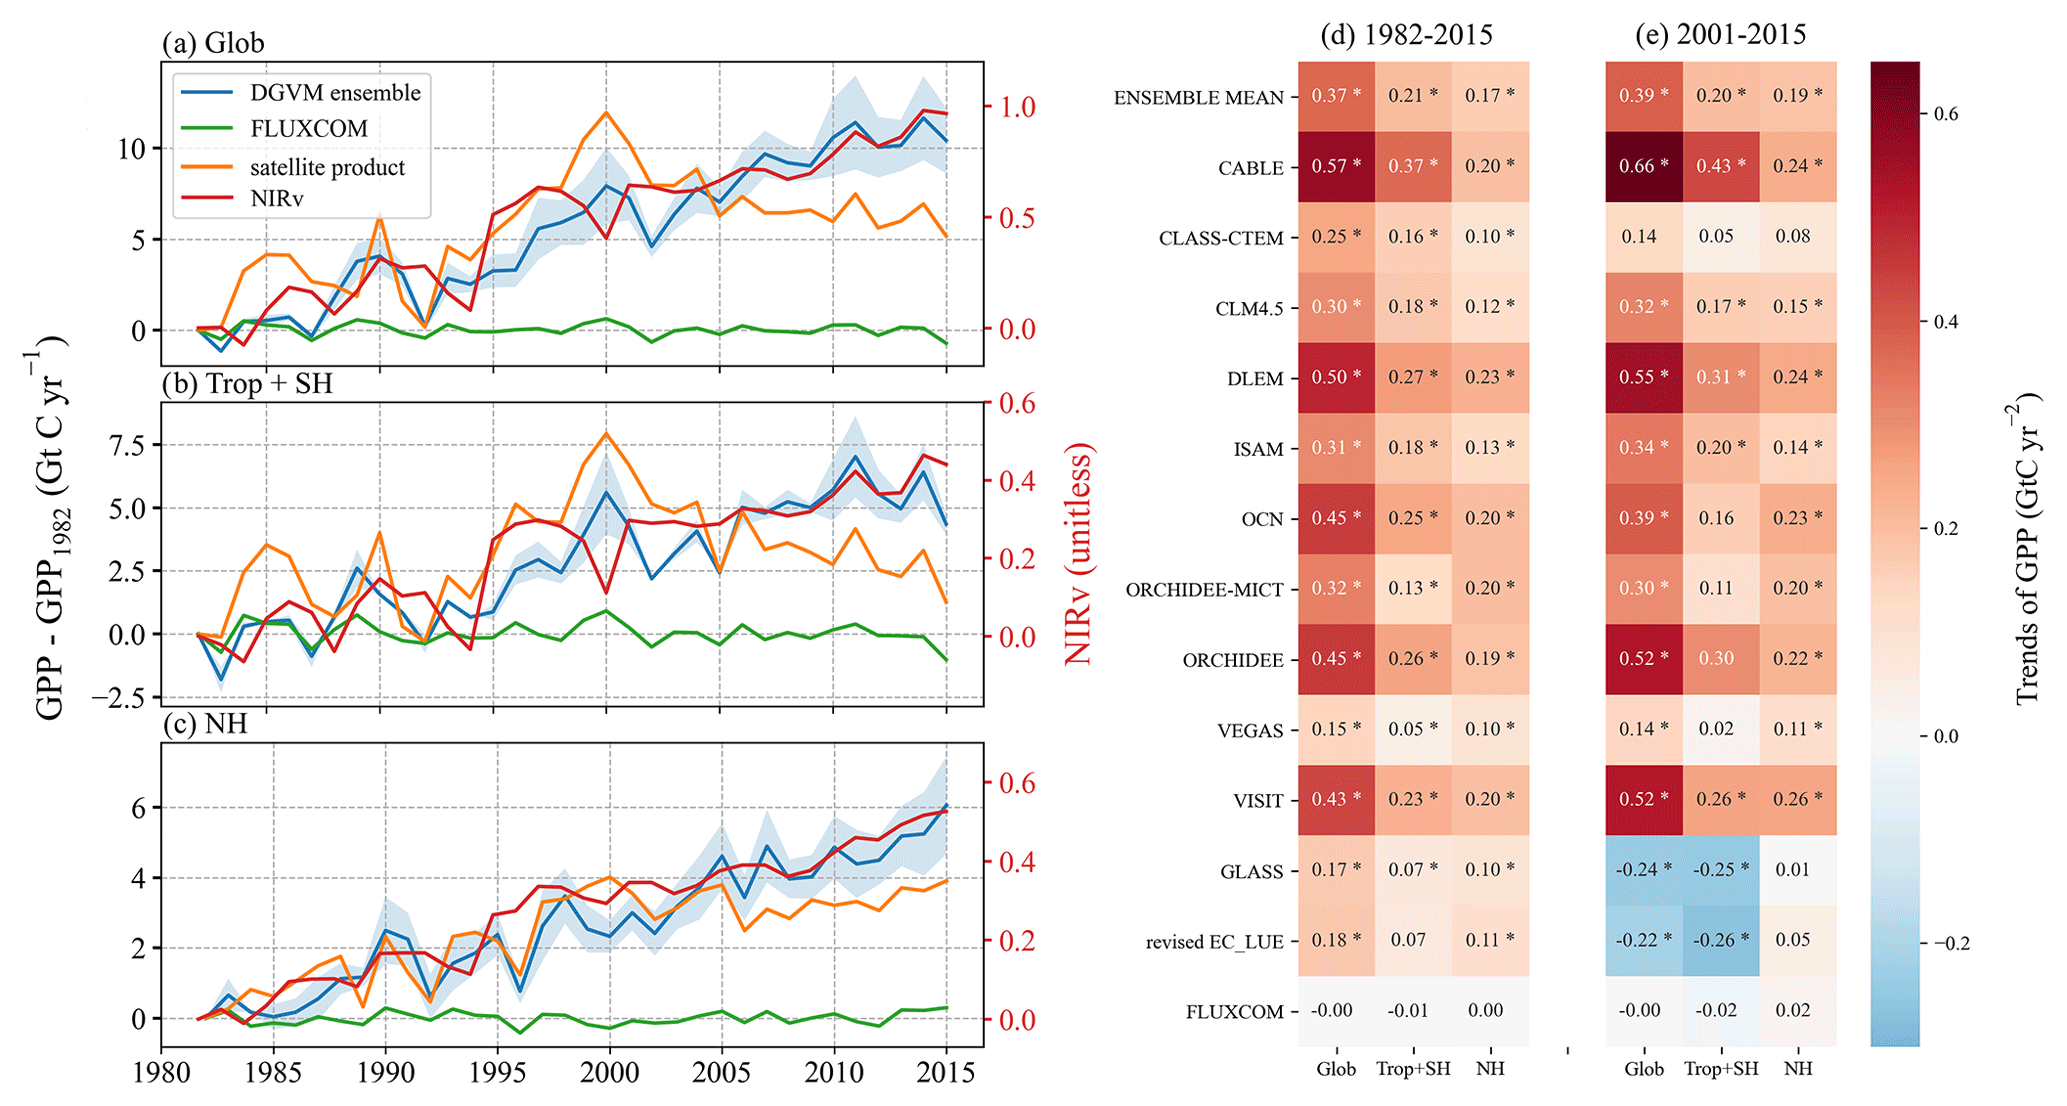
Figure 3Linear trends of global and regional total GPP. Changes of annual total GPP relative to 1982, based on DGVM ensemble mean (blue), FLUXCOM (green), and satellite-based products (orange), compared to AVHRR-NIRv (red), for global (a), Trop+SH (b), and NH (c) measurements. The shaded areas denote the TRENDY inter-model 1σ spread. (d–e) Global and regional GPP trends in individual models and products for the period of 1982–2015 and 2001–2015, respectively. Asterisks indicate that the trend is significant with p<0.05 following the non-parametric Mann–Kendall trend test.
3.1 Different GPP trends in DGVMs and satellite-based products
During 1982–2015, the spatial patterns of climatological annual GPP from different products are highly correlated with satellite-derived NIRv with their spatial correlation coefficients ranging from 0.84 to 0.95 (Table 3). However, the spatial distributions of the various GPP and NIRv trends are quite different. The spatial patterns of trends of NIRv, the DGVM ensemble, FLUXCOM, and satellite-based GPP during 1982–2015 are presented in Fig. 1. NIRv clearly shows increasing trends in most land regions, especially in the northwest parts of Eurasia, and shows decreasing trends over Alaska and Kazakhstan (Fig. 1a). The global distribution of the DGVM ensemble GPP trends is generally consistent with satellite-derived NIRv with their spatial correlation coefficient (r) of 0.49. However, the increasing trends of the DGVM ensemble GPP in the tropical regions (Amazon and equatorial Africa) are higher than those in the boreal zone. Further, for DGVM ensemble GPP, there are about 59.8 % of the global land regions showing significant positive GPP trends and 3.8 % showing significant negative GPP trends. For NIRv, 88.2 % of the global land had positive GPP trends (Table 3).
Although the DGVM ensemble GPP trends are close to those of NIRv, inconsistencies exist in spatial distribution and magnitude of GPP trends among individual model simulations. Firstly, the spatial correlations among individual models and NIRv range from 0.15 to 0.48. Secondly, the GPP simulated by the DLEM shows increasing trends in about three-fourths (77.3 %) of the global land areas, while the GPP simulated by the CLASS-CTEM has increasing trends in only about one-third (33.9 %) of the land area (Table 3). Finally, in magnitude, the trends of VEGAS GPP appear generally weaker than those of other models (Figs. S2, S4a).
The spatial distributions of the trends between NIRv and the remaining non-DGVM products are quite different, ranging from uncorrelated to negatively correlated (Table 3). For FLUXCOM, due to the lack of CO2 fertilization effect, the GPP trend pattern generally shows no significant trends over 74.1 % of the land areas. And the most striking differences between NIRv and satellite-based GPP products are located in the low latitudes, especially over the Amazon and Indonesia, with the latter indicating significant decreasing trends over these regions (Fig. 1d).
Table 3Spatial information for NIRv and different GPP products.
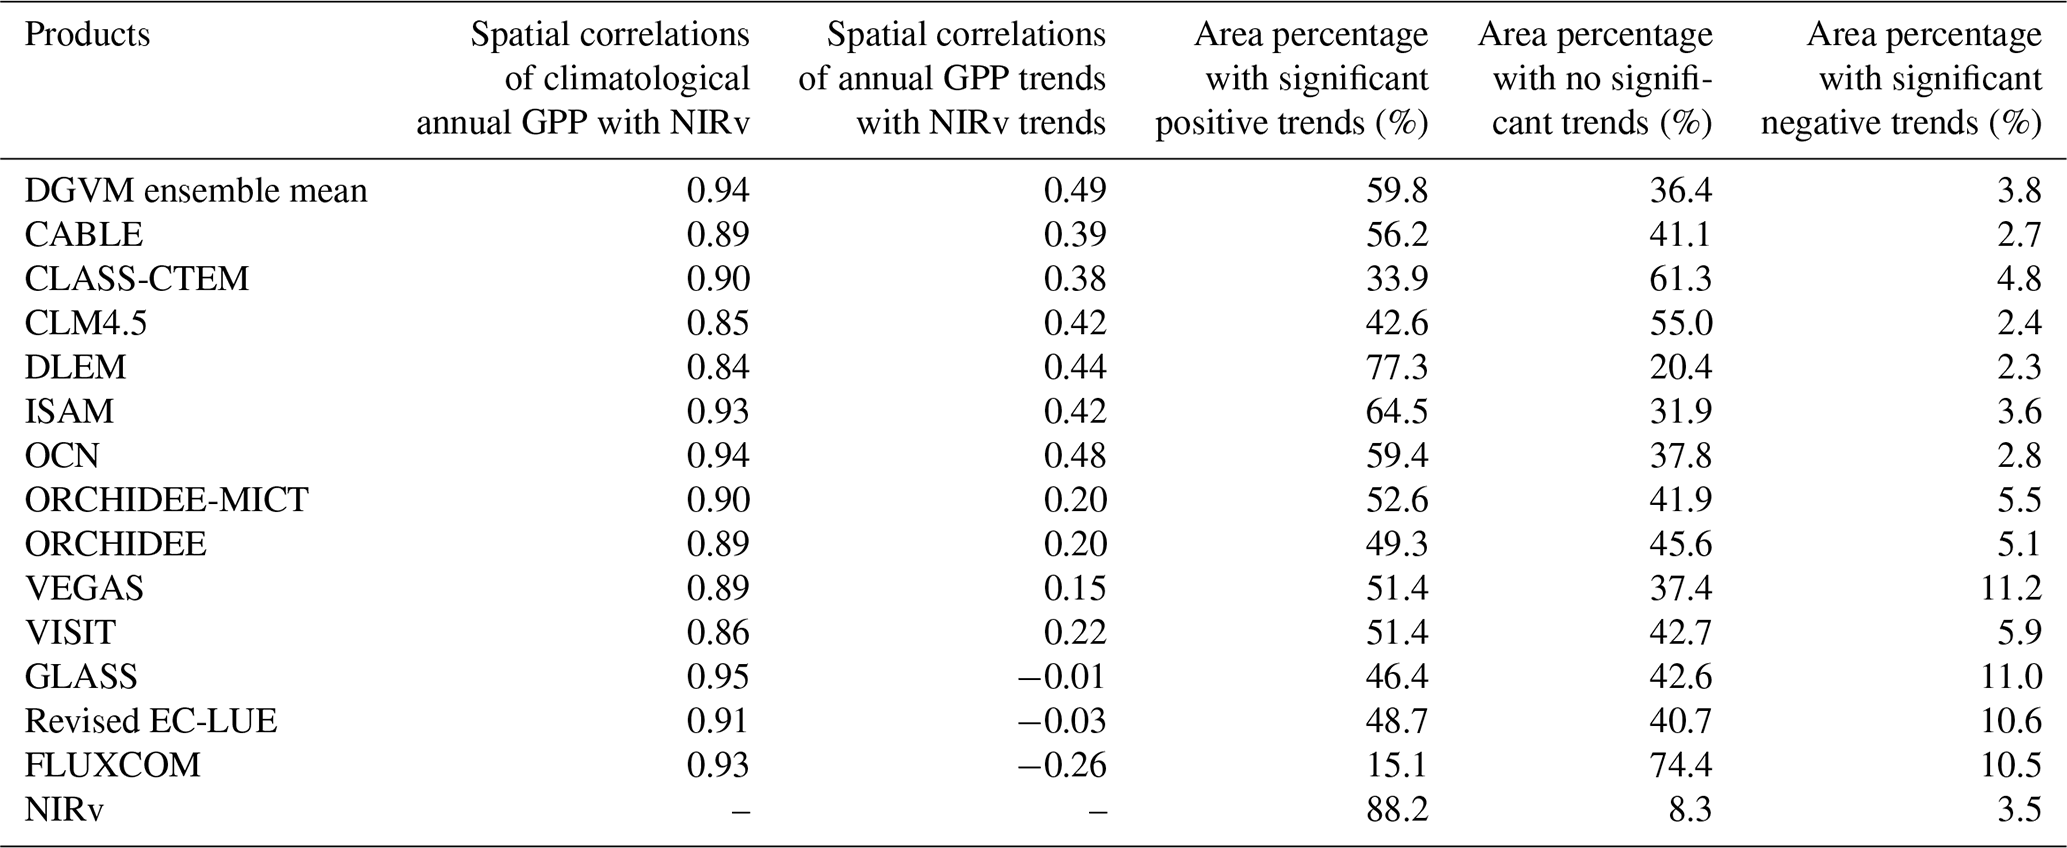
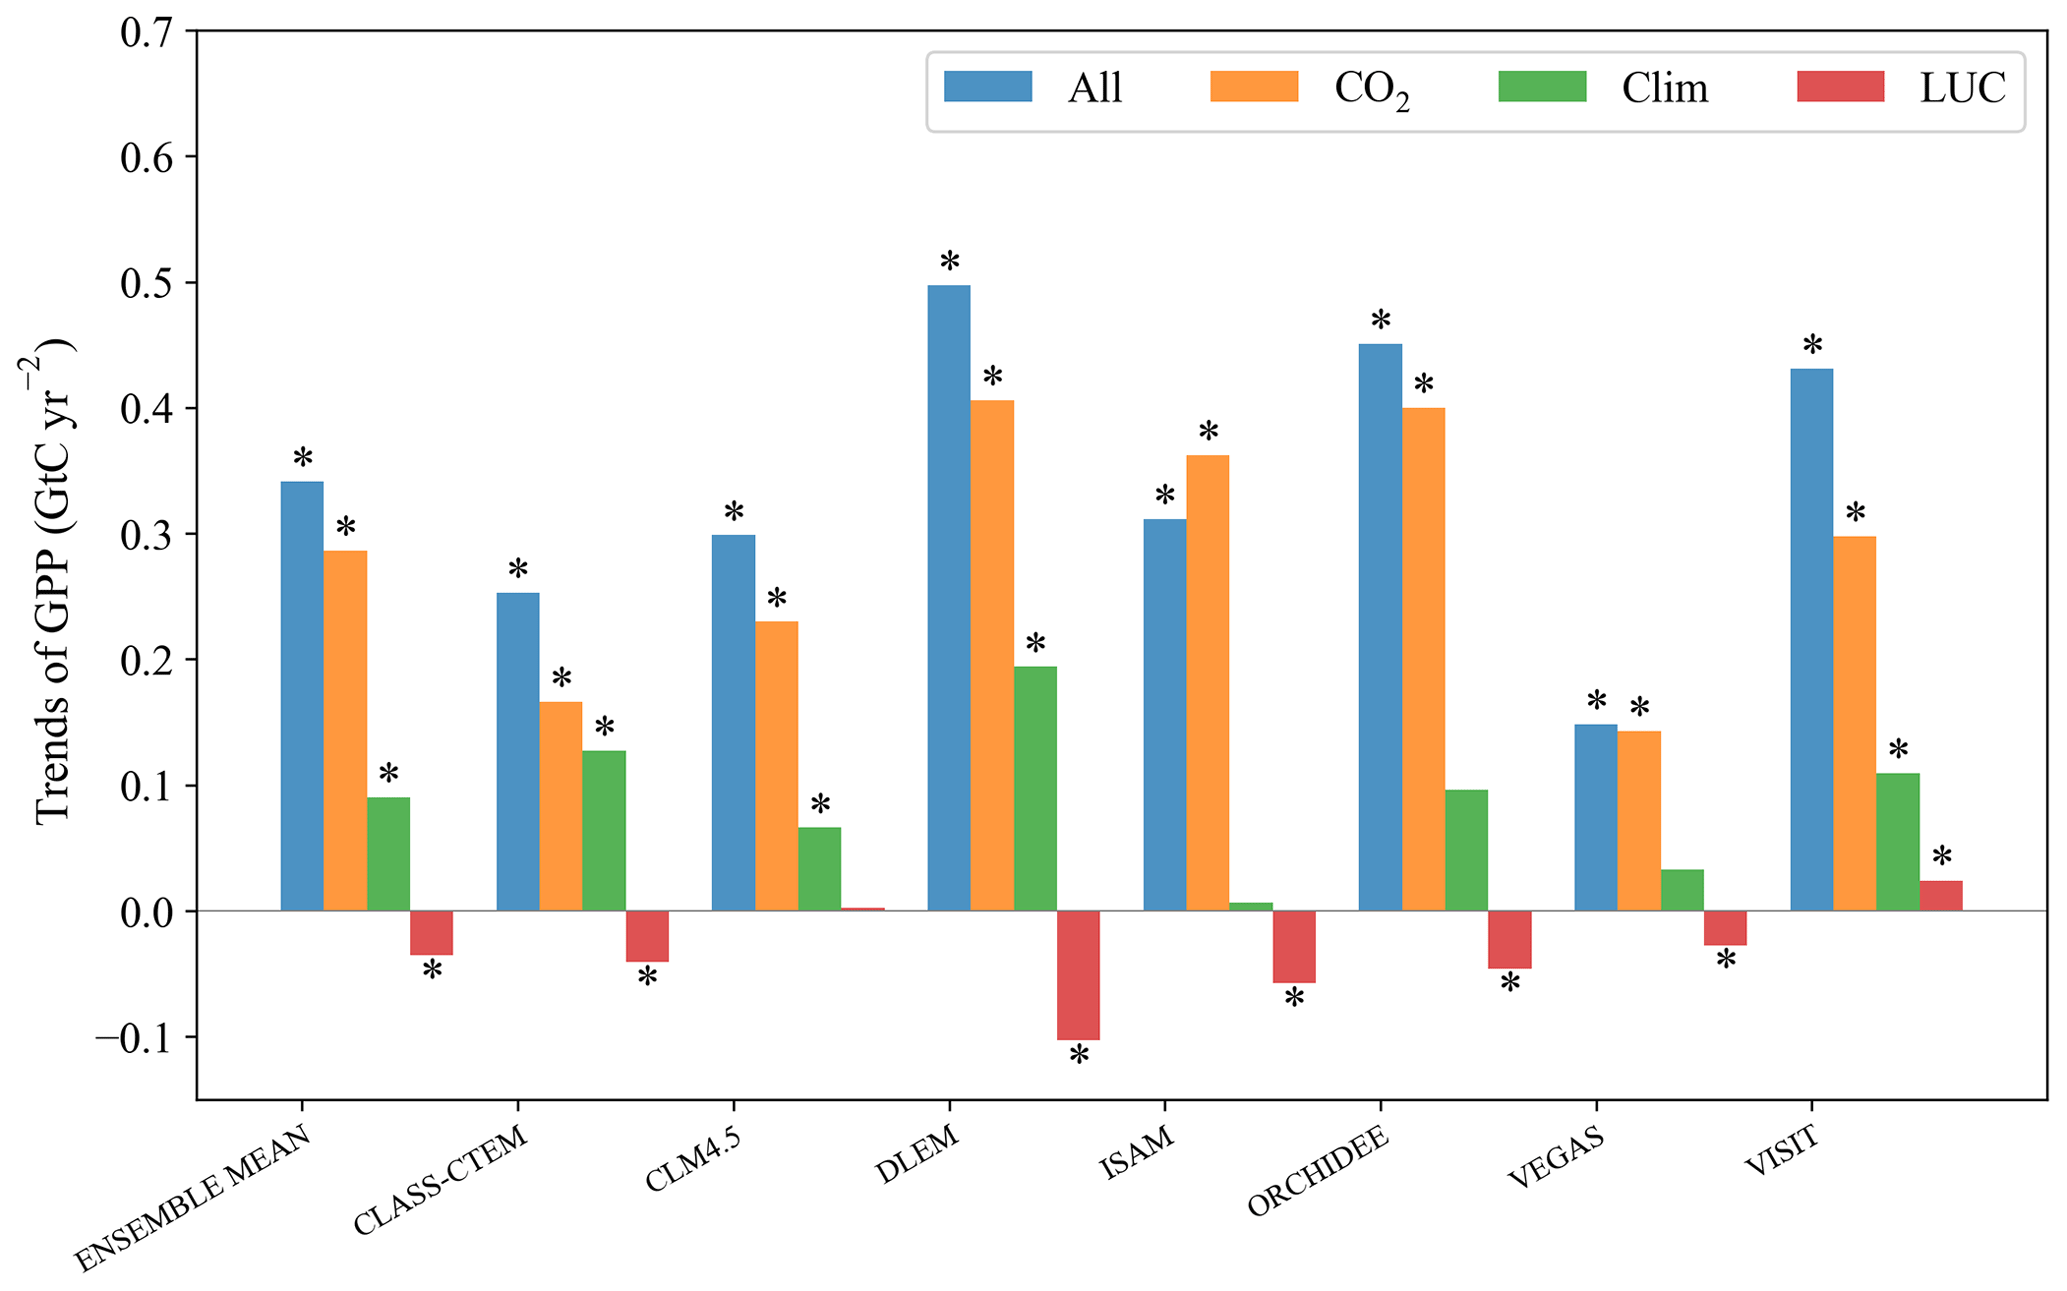
Figure 4Attributions of global total GPP trends for TRENDYv6 simulations from 1982 to 2015: CO2 fertilization effect (S1), climate (S2 – S1), and land-use change (S3 – S2). “All” gives the values of the reference simulation that includes the effect of all three drivers (S3). Asterisks indicate that the trend is significant with p<0.05 following the non-parametric Mann–Kendall trend test.
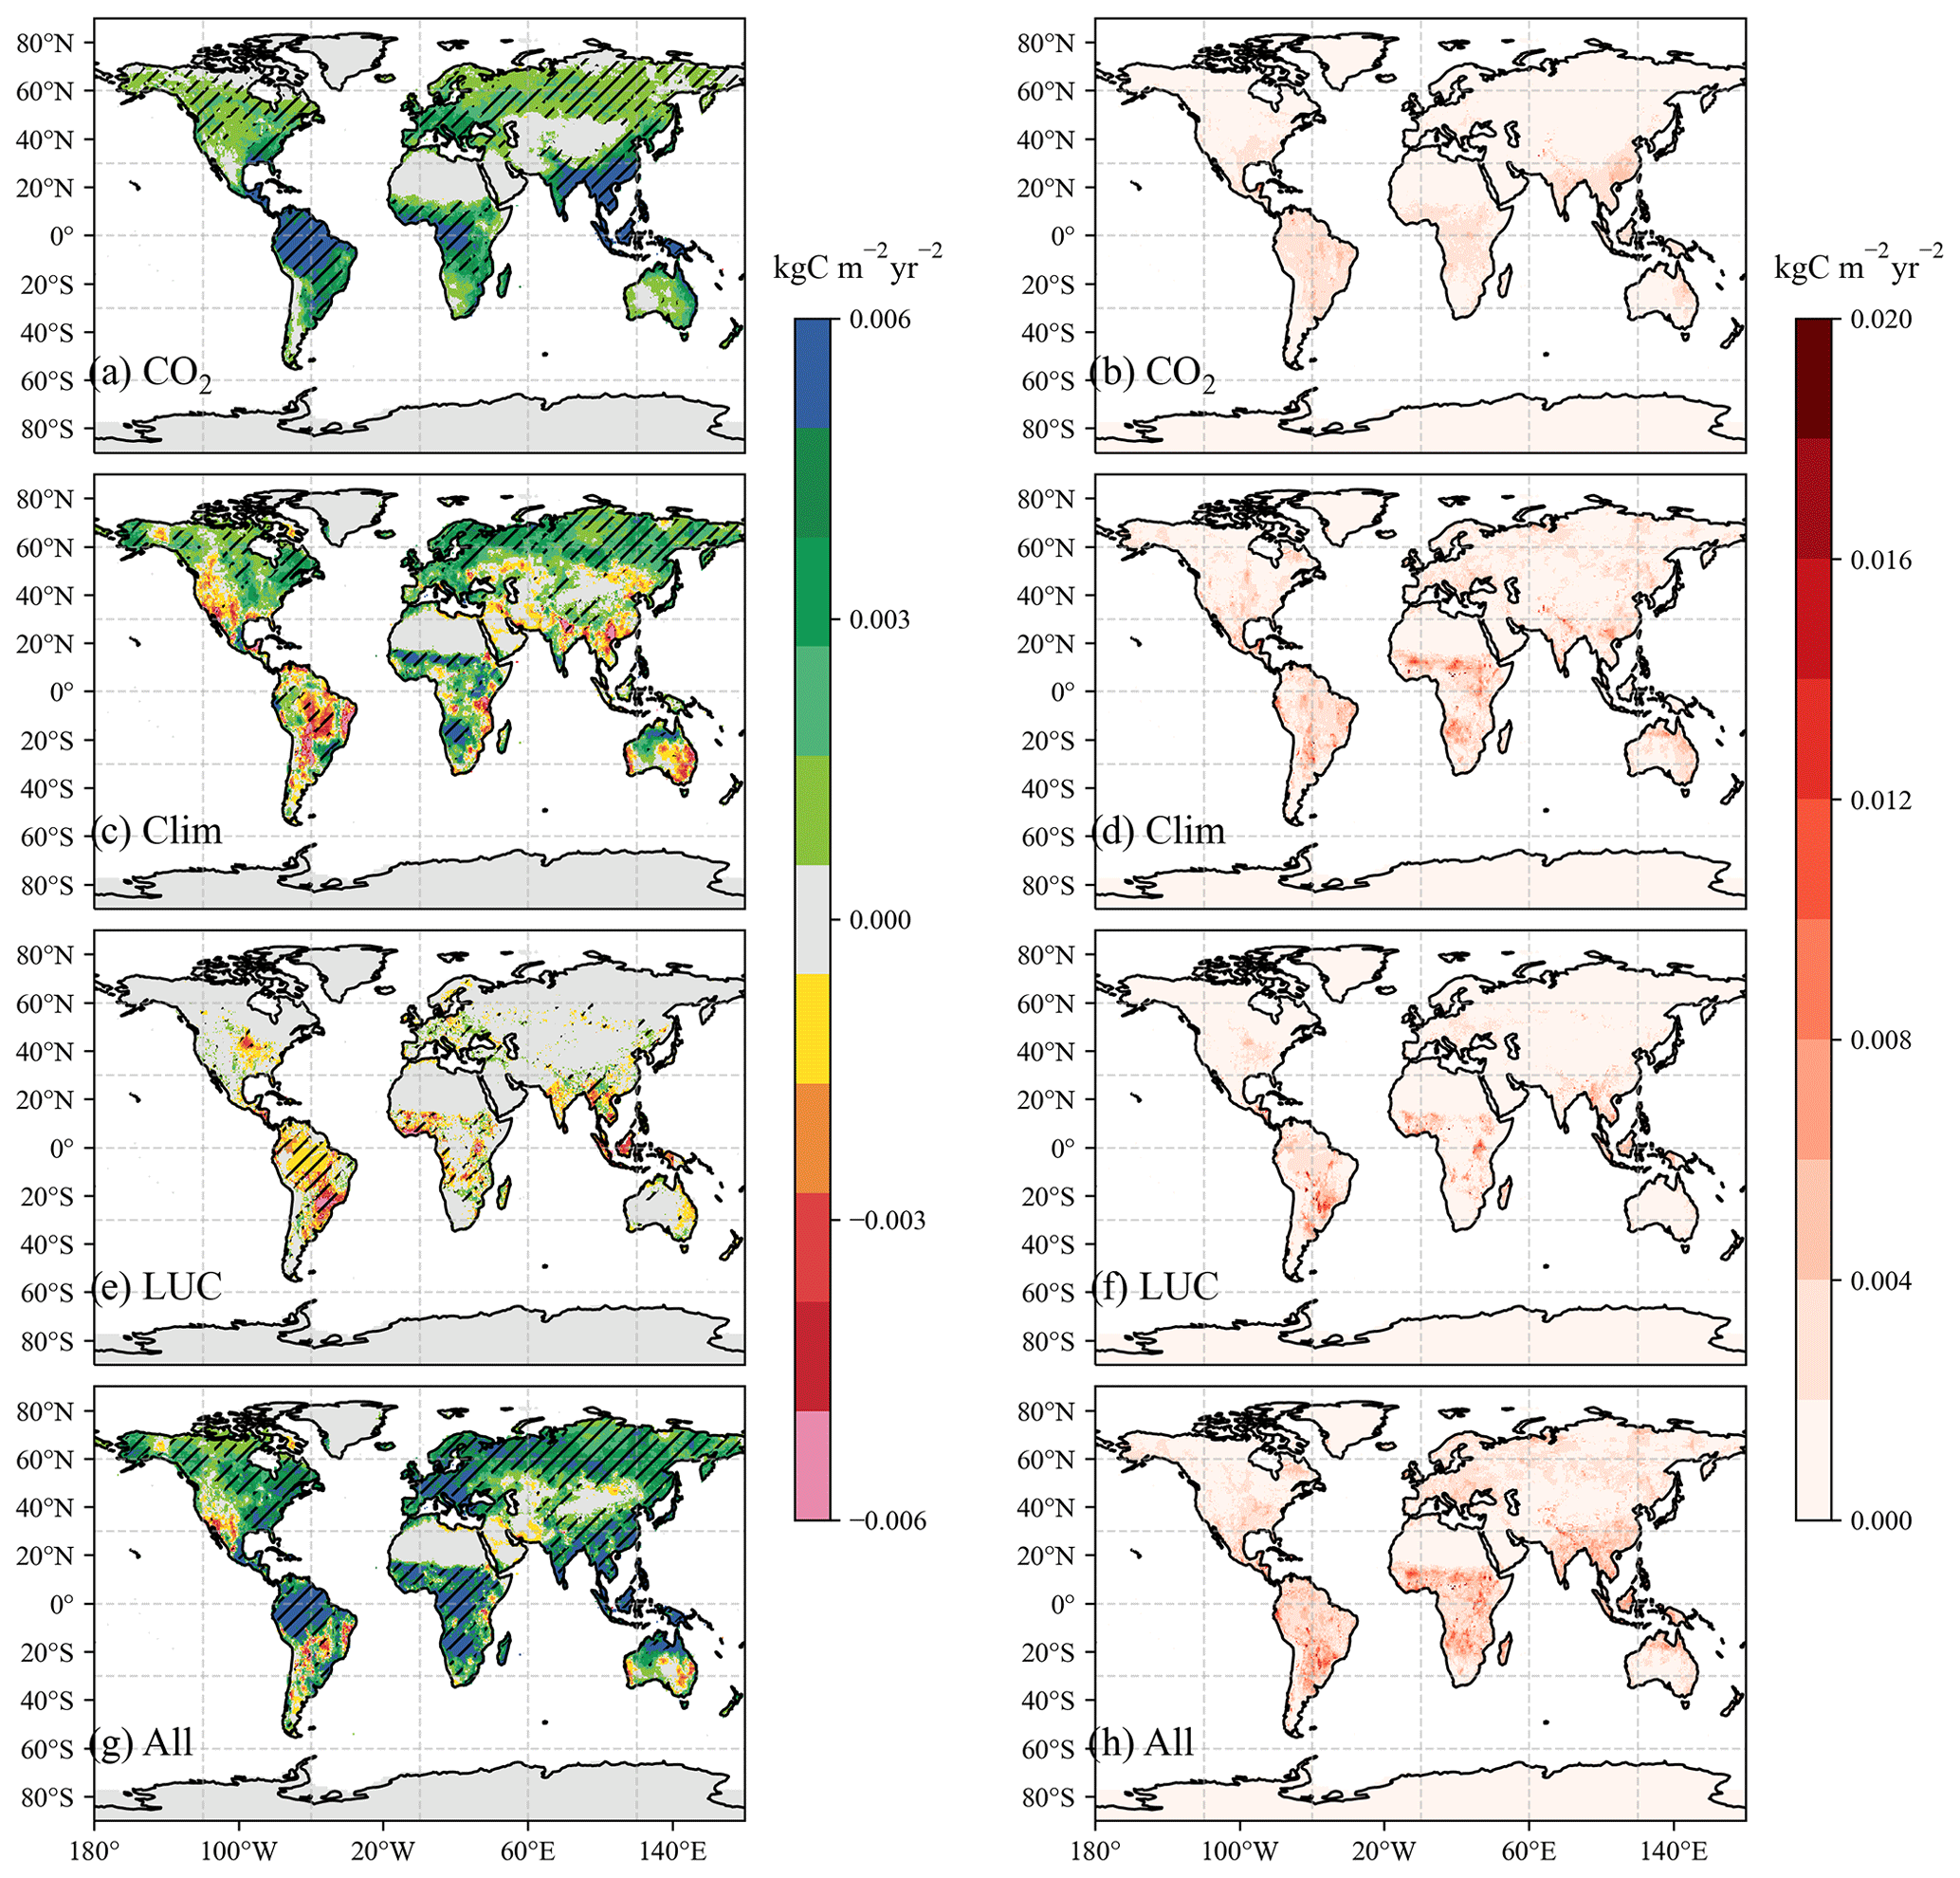
Figure 5The spatial distribution patterns and the inter-model spreads of GPP trends from the DGVM ensemble. (a–b) GPP trends and spreads due to the CO2 fertilization effect; (c–d) GPP trends and spreads due to climate change; (e–f) GPP trends and spreads owing to LUC; (g–h) GPP trends and spreads from the combined effects of all drivers (S3). Striped areas indicate that the trend is significant with p<0.05 following the non-parametric Mann–Kendall trend test.
As mentioned above, the trends of DGVM ensemble GPP and NIRv show relatively consistent patterns for 1982–2015. However, the DGVM ensemble mean GPP shows slightly stronger trends over the tropics than over the Northern Hemisphere, whereas NIRv has relatively stronger increasing trends over the Northern Hemisphere (Fig. 2a). The tropical region shows the most extensive inter-model spread for the DGVM ensemble, with the strongest trends in CABLE and the weakest trends in VEGAS (Figs. S4a, S5b). The latitudinal distribution of satellite GPP products is quite different from DGVM ensemble and NIRv. Satellite-based GPP shows a significant decrease over the tropical region, rebounding to the most substantial increase located between 15 and 25∘ S. The GPP increases in the middle and high latitudes of the Northern Hemisphere, but its magnitude is weaker than that of the DGVM ensemble in the most northern regions.
The GPP trends are quite different for the long-term (1982–2015) and recent short-term (2001–2015) periods (Figs. 2b, S4, S6). Compared to the comparable trend magnitudes of DGVM ensemble mean GPP and NIRv over NH during these two periods, the DGVM ensemble mean GPP trends show much stronger increase but NIRv appears a little weakened increase over tropical regions during 2001–2015 (Fig. 2a and b). Additionally, satellite-based GPP products indicate a much stronger GPP decrease over the tropical regions and no noticeable trends in midlatitudes of the Northern Hemisphere after 2000 (Fig. 2b). Also, FLUXCOM GPP trends are near zero in most latitudinal bands during these two periods (Fig. 2a and b) due to the lack of CO2 fertilization effect (Jung et al., 2020).
The relative changes and linear trends of annual total GPP among the DGVM simulations, FLUXCOM, and satellite-based GPP products vary substantially both globally and regionally (Figs. 3, S3). Based on the analysis over the 34 years, the trend of global GPP was about 0.37±0.08 (DGVM ensemble mean ± 95 % confidence intervals), 0.0 (FLUXCOM), and 0.18 GtC yr−2 (satellite-based GPP products), respectively (Fig. 3d). Before 2001, the GPP trend of satellite-based products was generally stronger than that of DGVMs (Fig. 3a). Separating the global land into the tropics plus extratropical Southern Hemisphere (Trop+SH: 90∘ S–23∘ N) and extratropical Northern Hemisphere (NH: 23–90∘ N), results show that more than half of the increase of GPP in the DGVM ensemble is from the Trop+SH (57 %). In comparison, the increase of GPP in satellite-based GPP products is mainly attributed to the NH (60 %) rather than Trop+SH (40 %) (Fig. 3d). In individual models, with the exception of ORCHIDEE-MICT and VEGAS, the others indicate that Trop+SH largely contributes to the global GPP trend (ranging from 54.3 % to 65.3 %) (Fig. 3d).
After 2000, there were obvious differences in the trend between DGVM ensemble and satellite-based GPP products, with the satellite-based GPP products showing an obvious turning point at the year of 2000 (Fig. 3a–c), confirming the previous studies (Yuan et al., 2019; Madani et al., 2020). Both GLASS and revised EC-LUE GPP changed from significant increasing trends to significant decreasing trends, resulting mainly from Trop+SH (Fig. 3a–c). Studies based on satellite-based GPP products suggested that this transition was mainly due to the increased atmospheric vapor pressure deficit in the tropical zones (Yuan et al., 2019; Madani et al., 2020). Meanwhile, the increasing GPP trend in the NH was greatly weakened (from 0.10 to 0.01 GtC yr−2 for GLASS and from 0.11 to 0.05 GtC yr−2 for revised EC-LUE). In contrast, DGVM ensemble mean GPP and NIRv kept increasing. However, in detail, 4 out of 10 DGVM models (CLASS-CTEM, OCN, ORCHIDEE-MICT, and VEGAS) simulated weakened GPP increasing signals primarily from the Trop+SH (Fig. 3d and e).
In general, we found that, for the two study periods, the trends from DGVM GPP have higher consistencies with the trends of NIRv at the global and regional scales compared with satellite-based GPP. It may suggest that long-term trends of GPP from DGVM ensemble results have better performance than satellite-derived GPP products.
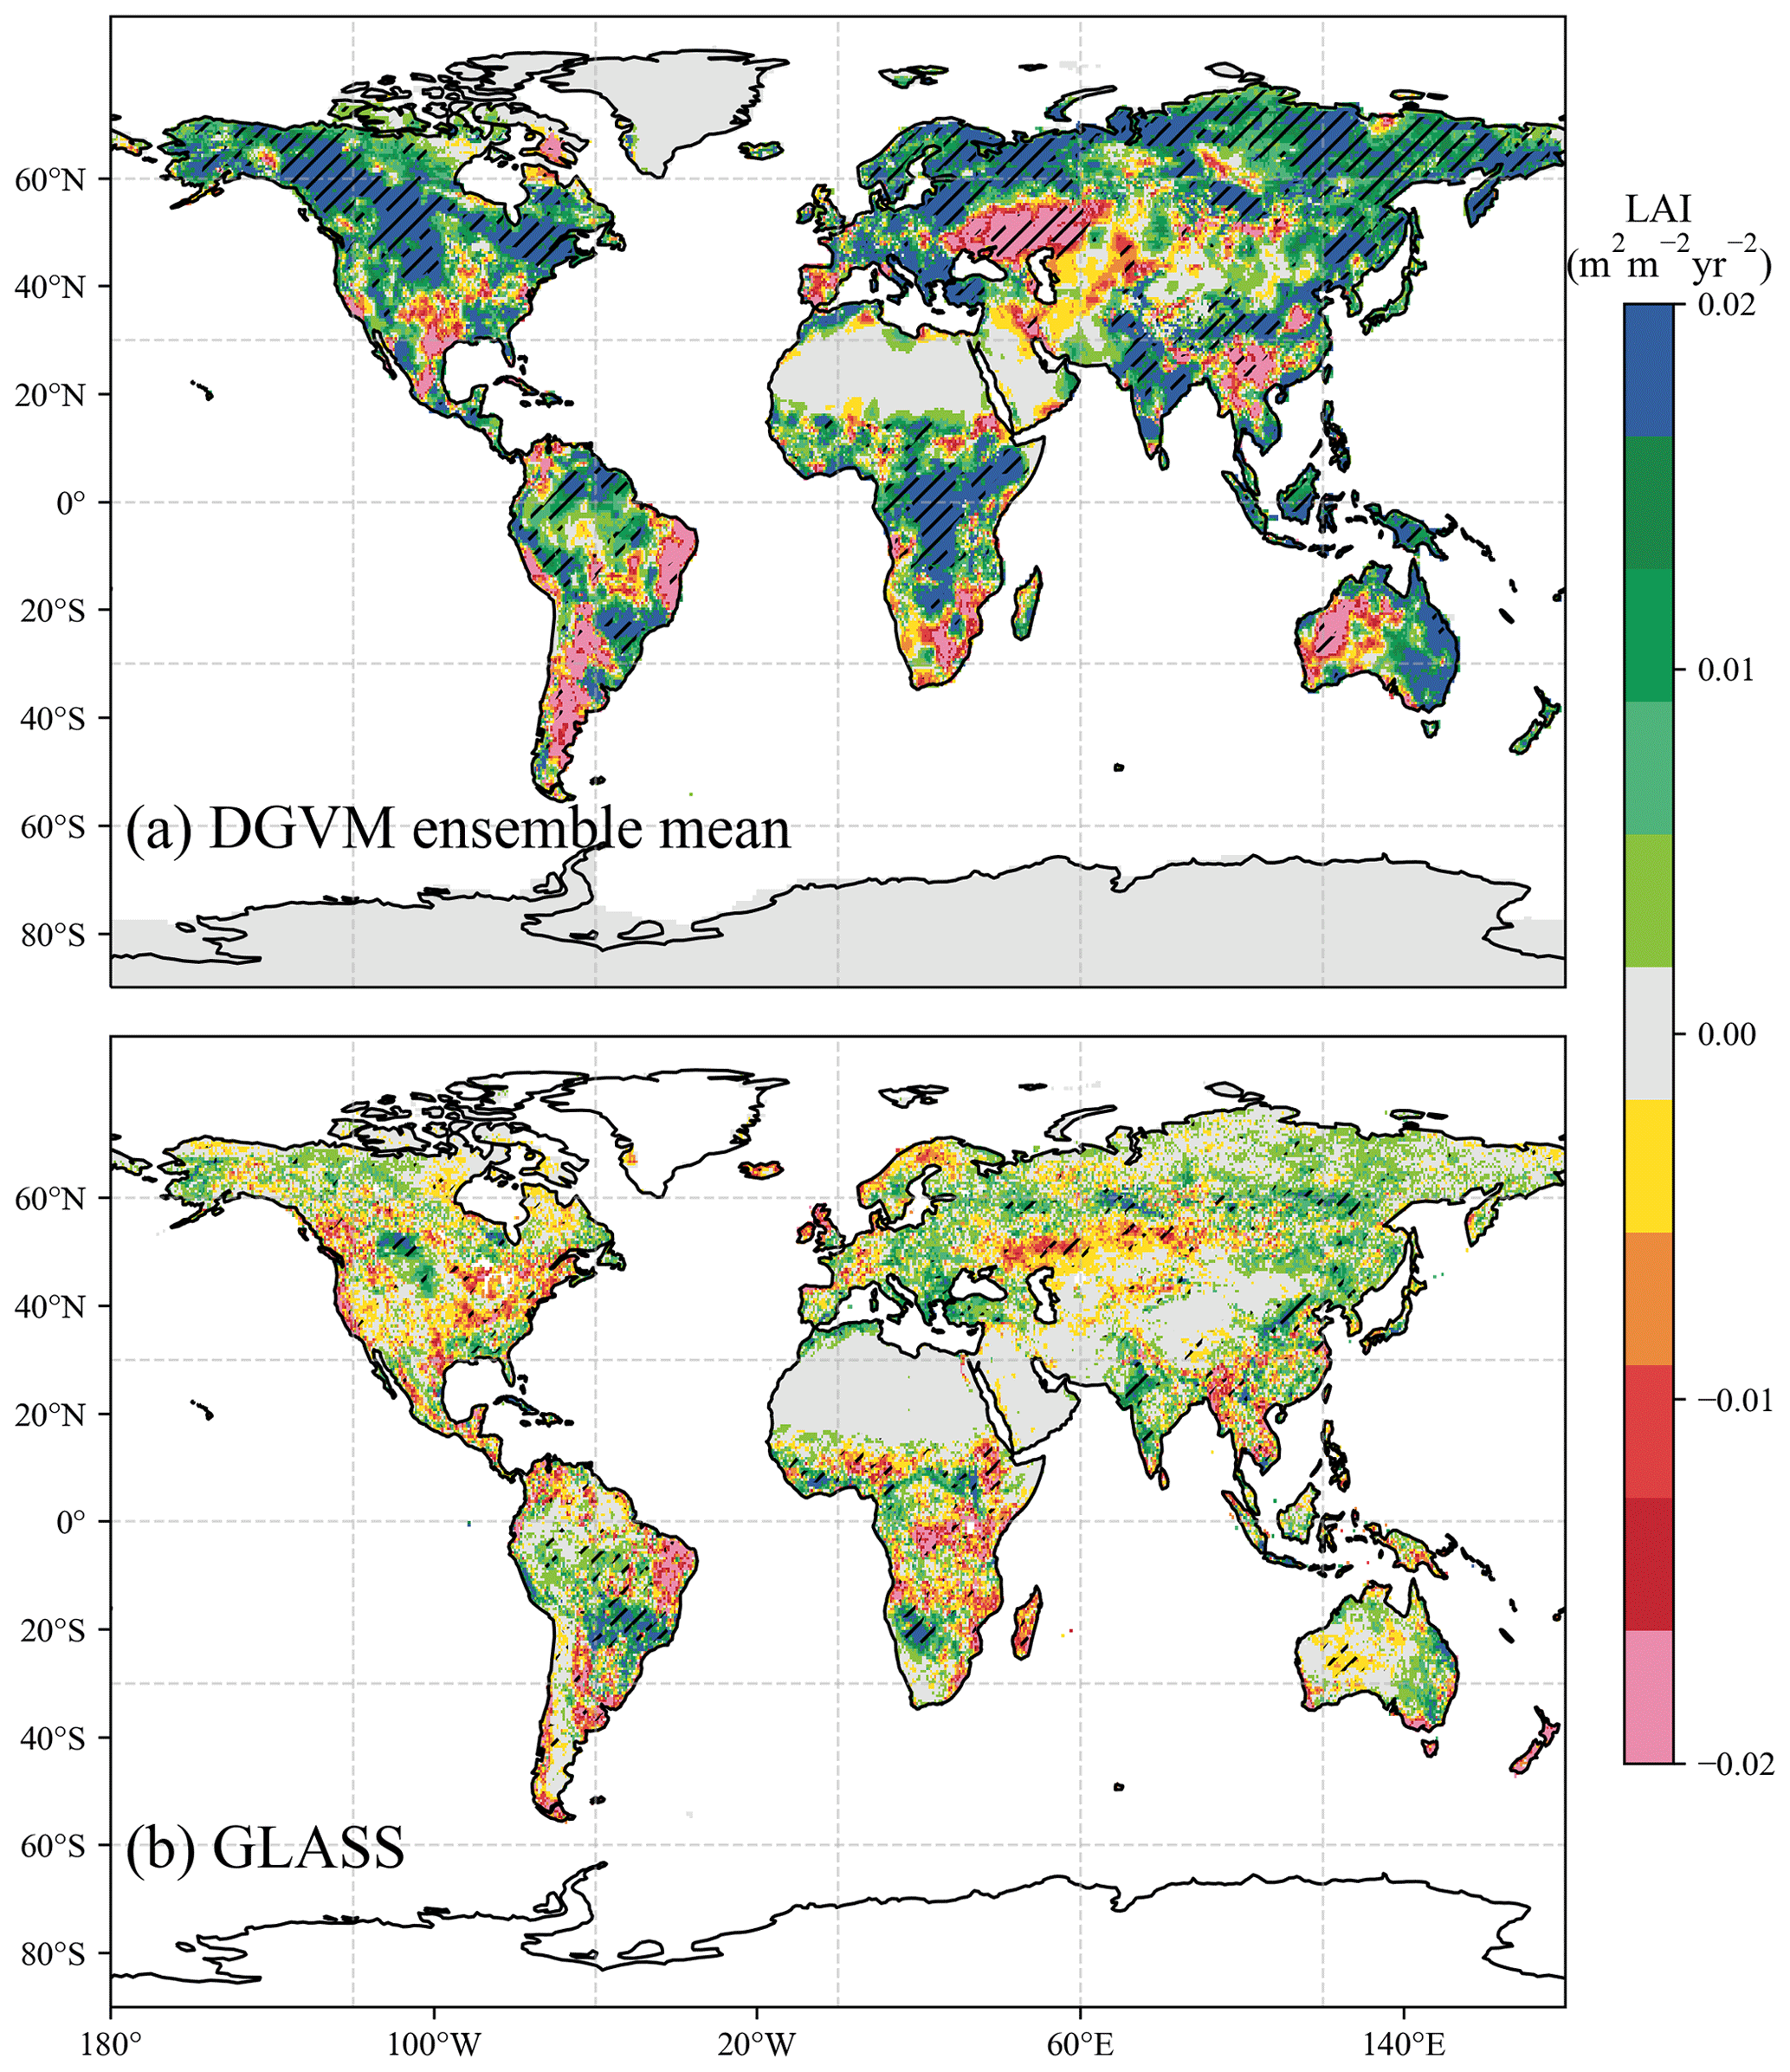
Figure 6The spatial distributions of LAI trends (m2 m−2 yr−2) from the (a) DGVM ensemble mean and (b) GLASS from 2001 to 2015. Striped areas indicate that the trend is significant with p<0.05 following the non-parametric Mann–Kendall trend test.
3.2 Trend attributions in DGVMs
We analyzed the contributions of three drivers (CO2 fertilization effect, climate change, and LUC) to the GPP trends during 1982–2015 by using the results of the TRENDY sensitivity experiments (Fig. 4). Globally, DGVM ensemble results suggest that the CO2 fertilization effect is the dominant driver to the increasing GPP (0.29 GtC yr−2 accounting for 83.9 %), followed by climate change (0.09 GtC yr−2 accounting for 26.5 %). Additionally, LUC has little effect on the trend of GPP (−0.04 GtC yr−2 accounting for −10.4 %). For individual model simulations, the contributions from CO2 fertilization effect, climate change, and LUC range from 65.7 % to 116.3 %, 2 % to 50.4 %, and −18.4 % to 5.5 %, respectively. The model simulations for the period of 2001–2015 show similar results (Fig. S7).
The spatial distributions of GPP trends indicate that the CO2 fertilization effect consistently increases global GPP, especially in tropical rainforest areas (Fig. 5a). Climate change has inhomogeneous effects on GPP due to different regional changes of climate elements (Figs. 5c, S8a and b) associated with different vegetation sensitivities to each climate element (Wang et al., 2016; Jung et al., 2017). For instance, in the high northern latitudes, global warming dominates the increase of GPP (Figs. 5c, S8a, and S9c); the increase in temperature and decrease in precipitation over the Amazon lead to the GPP decrease; the increase of GPP over equatorial Africa appears to be consistent with the increase of the precipitation based on visual comparison against the trends for the CRU observational dataset (Figs. 5c and S8b). Concentrated in the Trop+SH, LUC basically weakens GPP (Figs. 5e and S9a), mainly due to deforestation (Friedlingstein et al., 2019).
3.3 Uncertainties in GPP trends
3.3.1 DGVM simulations
By analyzing the simulation results driven by each factor, it can be found that though the CO2 fertilization effect has the most considerable contribution to the global GPP trend, it has the largest inter-model uncertainty (σ=0.11 GtC yr−2) among three drivers (Fig. 4). A previous study showed that some models might overestimate the CO2 fertilization effect on stomatal closure (Anav et al., 2015). The spatial pattern of the standard deviation among each model indicates that the inter-model spreads are mainly located in the Trop+SH (Fig. 5h). The inter-model spread attributed to the CO2 fertilization effect shows a consistently positive effect on GPP at the global scale (Fig. 5a and b). By contrast, the inter-model spreads driven by climate change and LUC over Trop+SH outweigh the CO2 fertilization effect (Fig. 5b, d, and f). However, because the inhomogeneous impacts on GPP from climatic elements can offset each other to a large extent (Fig. 5c), it makes the largest inter-model uncertainty of CO2 fertilization to the global GPP increase rather than the climate effect. Meanwhile, the largest uncertainties in the impact of LUC on GPP trends concentrate over 20∘–40∘ S in South America.
We further calculated the spatial correlation coefficients among the GPP trends of each model experiment S3 simulation to quantify their spatial consistencies. The correlation coefficients in pairs among individual models varied from 0.16 to 0.61 (Fig. S10), implying that large uncertainties existed in the distribution of GPP trends among models, which were caused by differences in model structures and parameterizations (Rogers, 2014; Rogers et al., 2017). Furthermore, studies have shown that the global GPP increase can be largely overestimated without nitrogen (N) constraints, especially in the tropical region, where the nitrogen limitation will reduce the photosynthetic capacity of vegetation and weaken its response to the increasing atmospheric CO2 concentration (He et al., 2017; Terrer et al., 2019). Phosphorus (P) availability also limits the extent to which plants respond to the CO2 fertilization effect, which is especially relevant in the Amazon rain forest (Fleischer et al., 2019). Therefore, DGVM ensemble GPP may overestimate the increasing GPP trend in the tropical regions since not all of the models used in this study take the effect of N limitation into consideration, and no model includes P limitation in the CO2 fertilization effect.
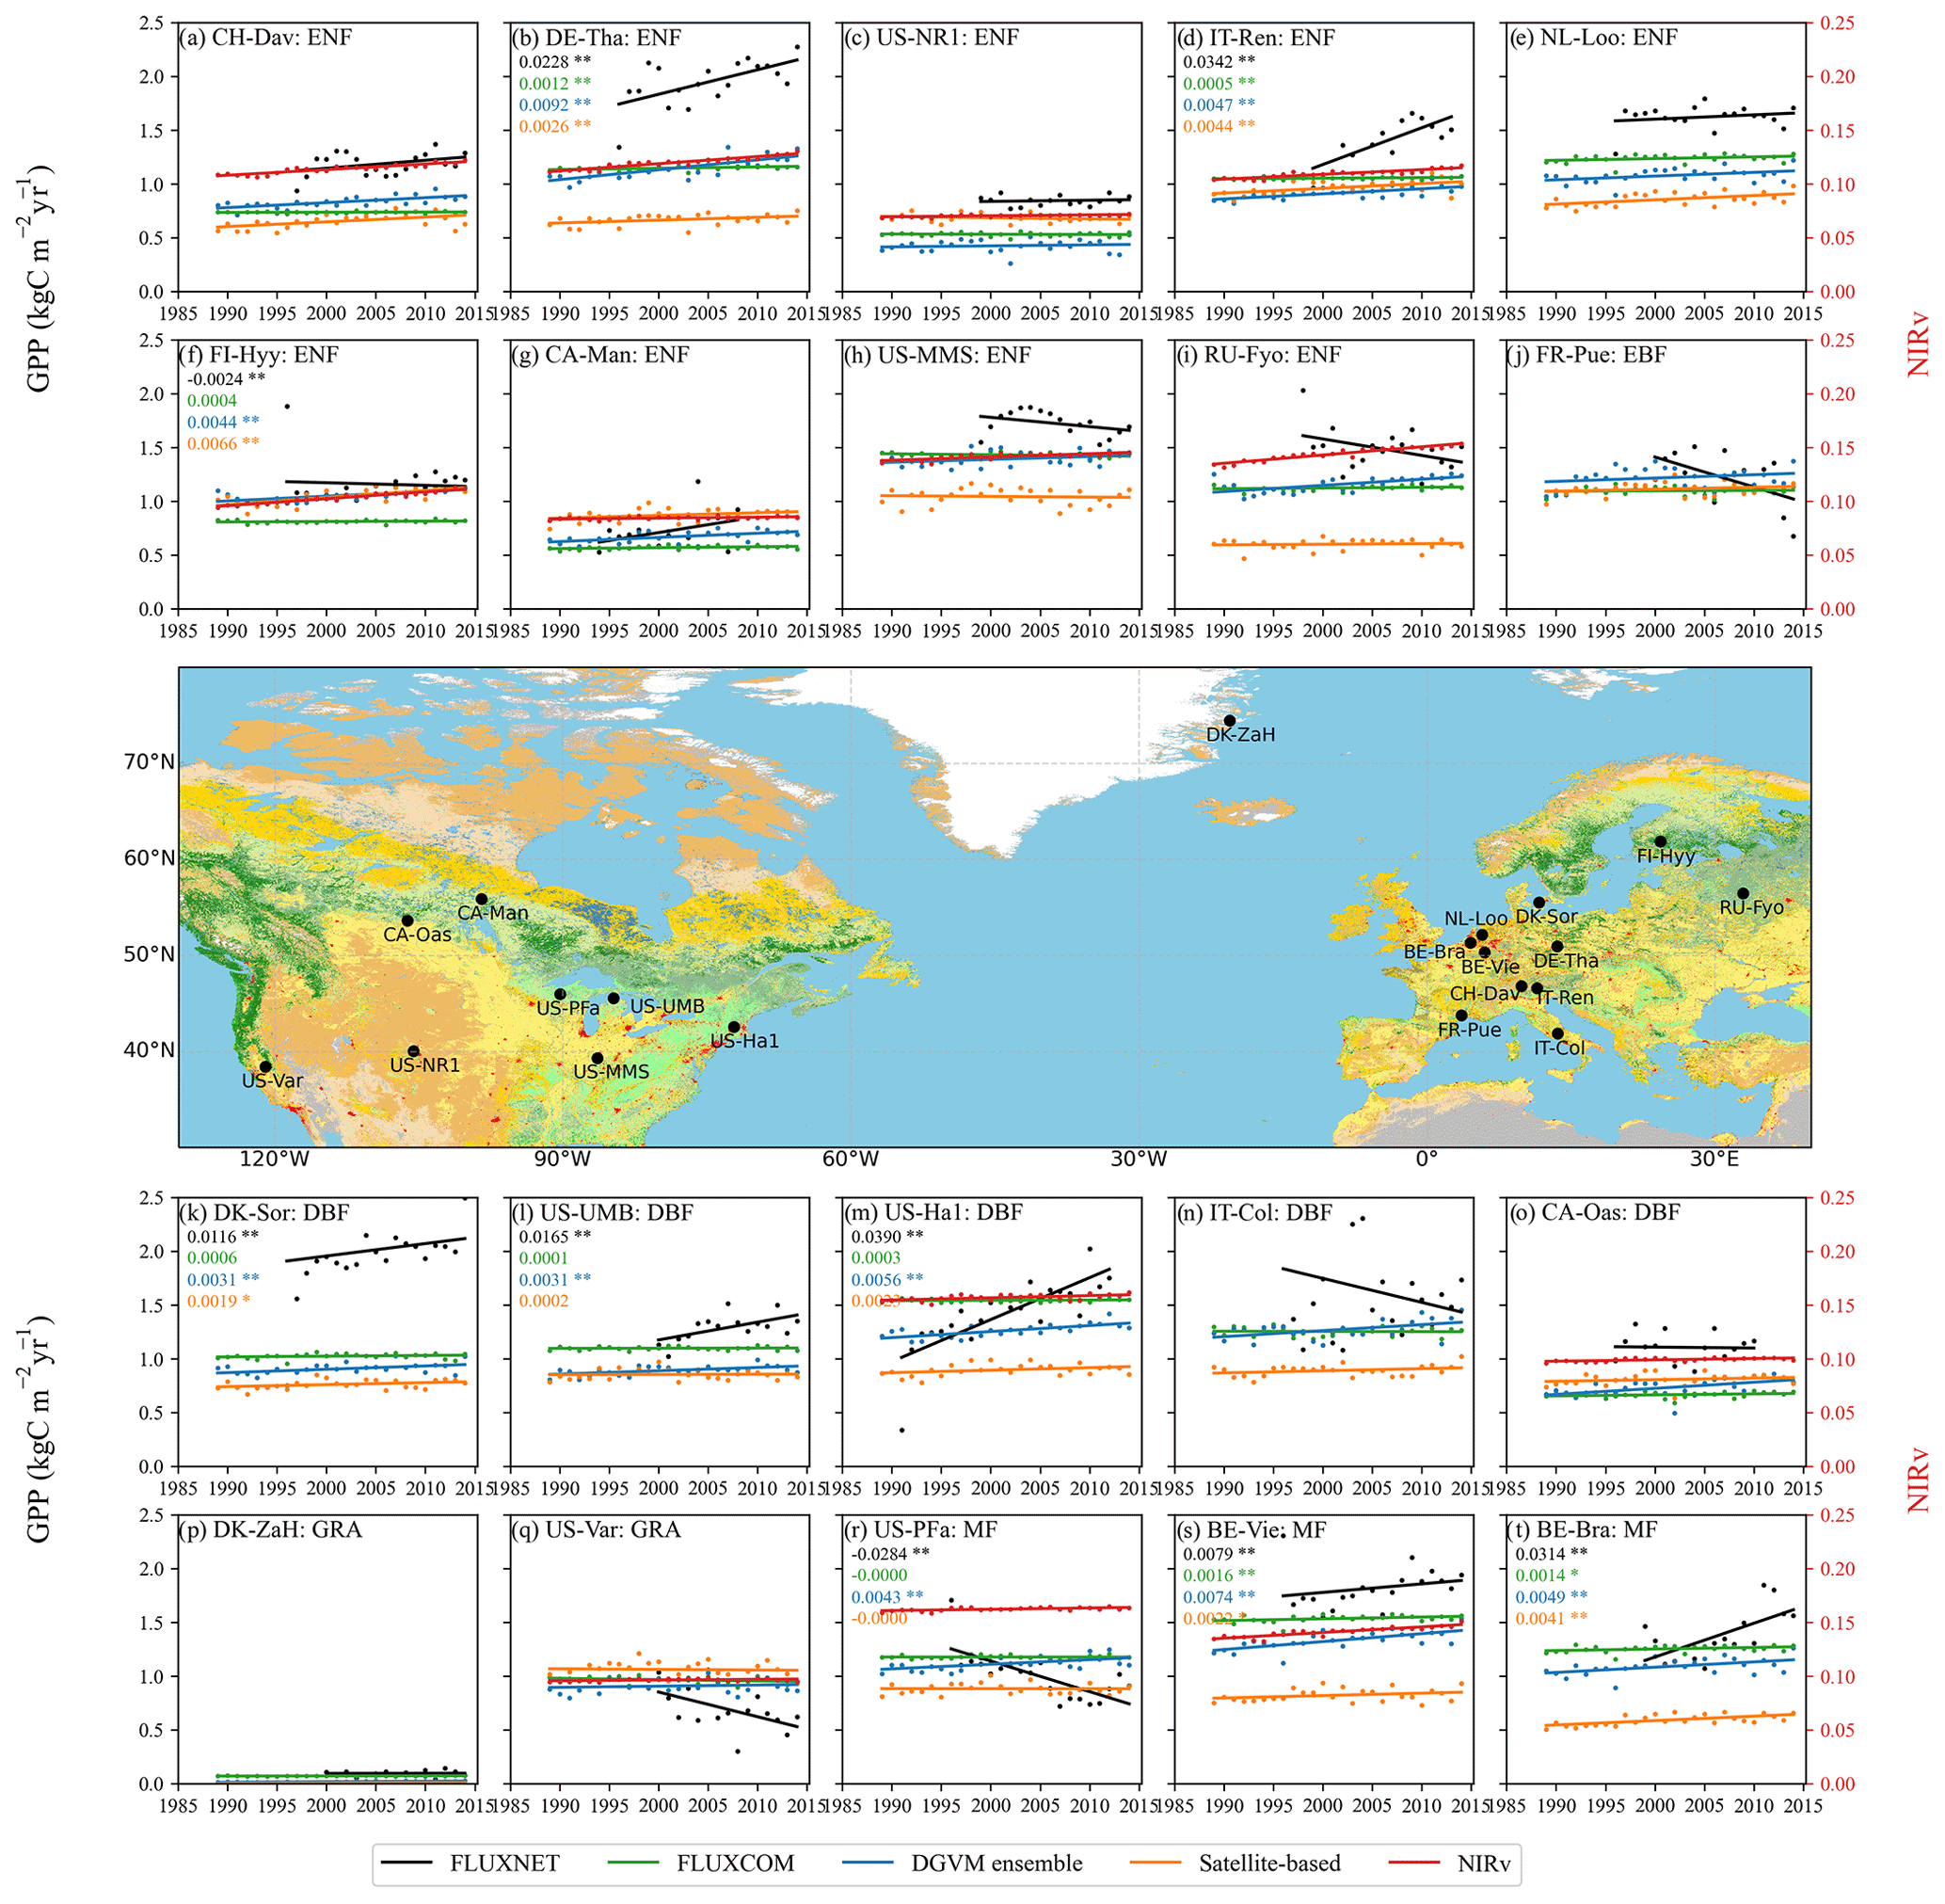
Figure 7Comparisons of annual GPP over different FLUXNET2015 sites (black), FLUXCOM (green), satellite-based product (orange), DGVM ensemble (blue), and NIRv (red). The global GPP datasets were interpolated into the locations of these 20 sites according to the bilinear interpolation method. Observation sites with significant trends are marked with values. Single (∗) and double () asterisks indicate that the trend is significant with p<0.1 and p<0.05 following the non-parametric Mann–Kendall trend test. The units of GPP and GPP trend are kgC m−2 yr−1 and kgC m−2 yr−2, respectively.
3.3.2 Satellite-based GPP products
In this study, GLASS GPP and revised EC-LUE GPP were used as a representative of long-term satellite-based GPP products. As an essential input in the LUE model (Eq. 1), absorbed photosynthetically active radiation (APAR) is a function of LAI, suggesting that LAI is a key parameter in satellite-derived GPP. The GLASS LAI product was used in calculating both the GLASS GPP and the revised EC-LUE GPP products. The spatial correlation coefficient of trends between GLASS LAI and satellite-based GPP (i.e., the mean of GLASS GPP and revised EC-LUE GPP) is 0.42. A previous study over China has shown that satellite-based LAI datasets play a more important role in GPP estimation than meteorological data for all land cover types (Liu et al., 2014). Also, the spatial distribution of trends between LAI and GPP simulated from the DGVM ensemble is even more consistent (r=0.77), confirming the previous studies showing that the trends of GPP and LAI are highly correlated in biome models (Ito et al., 2017; Liu et al., 2019), and the changes of GPP and LAI are consistent in Earth system models from CMIP5 (Hashimoto et al., 2019).
Figure 6 compares the LAI trends of GLASS and the DGVM ensemble during 2001–2015. The spatial distribution of DGVM LAI indicates significant increasing trends over the boreal forest regions, Indonesia, equatorial Africa, and India, and significant decreasing trends over Kazakhstan, Southeast Asia, and western Australia. The trends of GLASS LAI were obviously weaker than those of the DGVM ensemble, especially in the equatorial African region, northern Amazon region, Indonesia, and northern high latitudes. The large inconsistencies between the LAI from the DGVMs and those observed in the satellite products could lead to substantial uncertainties in generating/simulating the global GPP (Figs. 1 and 6). Xiao et al. (2017) suggested that the trends of four satellite-derived LAI products showed large discrepancies in equatorial Africa from 1982 to 2011 and differed across each vegetation type. Jiang et al. (2017) revealed that NOAA satellite orbit changes and MODIS sensor degradation might cause long-term satellite-derived LAI products inconsistent with each other. Xie et al. (2019) also suggested that satellite-derived LAI datasets can cause uncertainties in GPP estimations through model structure and the complexity of the terrain. Hence, the long-term trends of satellite GPP products based on satellite-derived LAI remain highly uncertain (Smith et al., 2016; Jiang et al., 2017; Liu et al., 2018).
3.4 Evaluations at site level
We further adopted 20 sites with observations longer than 15 years from FLUXNET2015 datasets to evaluate long-term GPP trends from global products and simulations. Compared to the site observations, the magnitudes of GPP at most of site locations were underestimated by satellite-based GPP products, FLUXCOM, and the DGVM ensemble mean. Also, the interannual variation of GPP at sites are more obvious than those of global GPP products and NIRv (Fig. 7). This is possibly due to the fact that climate variables at 0.5∘ grid cells are smoothed out compared to those recorded at individual sites, which leads to a moderate GPP variation.
More than half of the sites indicate that FLUXNET GPP has increased on a long-time scale (Figs. 7, S11), which was mainly caused by rising LUE due to the CO2 fertilization effect and increased green vegetation cover (Cai and Prentice, 2020). Although FLUXCOM was upscaled from FLUXNET datasets, it did not capture the trends of GPP observed at sites, which was also mentioned by Anav et al. (2015). Sites with significant increasing GPP trends were all captured by DGVM ensemble mean but some were missed by satellite-based GPP (Fig. 7b, d, k, l, m, s, and t). Furthermore, none of sites with decreasing GPP trends were reflected in the global GPP products and NIRv (Fig. 7f, h, i, j, n, q, r), which may be in part due to the different spatial representativeness between a tower fetch and a model or satellite grid point. Therefore, the uncertainty remained when using the site-level observed GPP to evaluate the GPP trends of the DGVM simulations and satellite-based GPP products. We also selected sites with observation longer than 12 years and found similar results (Fig. S12). It is worth mentioning that sites with more than 15 years of observations were all located at NH (from 39.32 to 50.96∘ N) (Table 2), and only three sites with more than 12 years of observations were located at Trop+SH (Table S2). Therefore, it is hardly possible for us to evaluate the GPP trends of global products over the Trop+SH by using the GPP observations from sites.
Based on five kinds of GPP or GPP-related datasets, including satellite-based products, the upscaled product from EC measurements, DGVM simulations, satellite-observed proxy (NIRv), and site-level observations, we comprehensively assessed the global and regional GPP trends during 1982–2015. The simulated spatial pattern of GPP trends from the DGVM ensemble is highly consistent with NIRv but shows considerable inconsistency with satellite-based GPP products, especially in the tropical regions. After 2000, the GPP generated by the satellite-based GPP products decreased significantly in Trop+SH, and the increasing trend in NH also weakened. However, the results of DGVMs showed that global GPP kept increasing after 2000, even in the tropical regions, which was closer to the performance of NIRv. By analyzing the impacts of different drivers in DGVM simulations, the results indicate that the CO2 fertilization effect has the dominant contribution to the global GPP. Spatially, the CO2 fertilization effect makes the global GPP increase consistently, while climate has an inhomogeneous impact on GPP trends over different regions.
We further explored the uncertainties in GPP trends among these different datasets. For the DGVM ensemble, globally, the CO2 fertilization effect causes the largest inter-model spread. At the grid cell level, the uncertainties in simulated GPP trends concentrate over the Trop+SH, which results mainly from climate and LUC. Furthermore, the large discrepancy in the GPP trends between DGVM ensemble and satellite-based GPP products is, to a large extent, induced by the difference of vegetation canopy structure parameter (LAI). Therefore, the highly uncertain satellite-derived LAI data in the tropical regions increase the uncertainty of satellite GPP products and weaken their reliability in explaining changes in the global GPP.
Finally, GPP trends from satellite-based products and DGVM simulations were evaluated by using the FLUXNET2015 dataset. Results show that all of sites with significant increasing GPP trends can be captured by DGVM ensemble mean, but some of them were missed by satellite-based GPP. Also none of sites with decreasing GPP trends were reflected in the global GPP products. Therefore, uncertainty remained when using the FLUXNET observed GPP to evaluate the GPP trends of the global GPP products.
Generally, the differences among models, observations, and products suggest the importance of the research on the GPP trend and make us cautious to interpret the mechanisms of the global carbon cycle by using the long-term GPP products.
All data acquired or used in this analysis are available from the links in Table S1.
The supplement related to this article is available online at: https://doi.org/10.5194/esd-13-833-2022-supplement.
NZ, JW, and RY conceived and designed this study. RY and WT processed the datasets, completed the statistical analysis, and prepared the figures. RY and JW drafted the manuscript with contributions from all authors.
At least one of the (co-)authors is a member of the editorial board of Earth System Dynamics. The peer-review process was guided by an independent editor, and the authors also have no other competing interests to declare.
Publisher's note: Copernicus Publications remains neutral with regard to jurisdictional claims in published maps and institutional affiliations.
We gratefully acknowledge the TRENDY DGVM community and all people and institutions who provided datasets used in this study. We thank Shengjie Zhou, Huihang Sun, Xiaohui Lin, Xing Yan, Han Mei, and Zhiqiang Liu for the helpful discussions that they provided.
This research was supported by the National Key R & D Program of China (grant nos. 2017YFB0504000, 2020YFA0607504, and 2021YFB3901001), and the National Natural Science Foundation of China (grant no. 41807434). Matthew Joseph McGrath has been supported by the H2020 European Research Council (grant no. 776810).
This paper was edited by Somnath Baidya Roy and reviewed by two anonymous referees.
Alemohammad, S. H., Fang, B., Konings, A. G., Aires, F., Green, J. K., Kolassa, J., Miralles, D., Prigent, C., and Gentine, P.: Water, Energy, and Carbon with Artificial Neural Networks (WECANN): a statistically based estimate of global surface turbulent fluxes and gross primary productivity using solar-induced fluorescence, Biogeosciences, 14, 4101–4124, https://doi.org/10.5194/bg-14-4101-2017, 2017.
Anav, A., Friedlingstein, P., Beer, C., Ciais, P., Harper, A., Jones, C., Murray-Tortarolo, G., Papale, D., Parazoo, N. C., Peylin, P., Piao, S., Sitch, S., Viovy, N., Wiltshire, A., and Zhao, M.: Spatiotemporal patterns of terrestrial gross primary production: A review, Rev. Geophys., 53, 785–818, https://doi.org/10.1002/2015rg000483, 2015.
Bacour, C., Maignan, F., MacBean, N., Porcar-Castell, A., Flexas, J., Frankenberg, C., Peylin, P., Chevallier, F., Vuichard, N., and Bastrikov, V.: Improving Estimates of Gross Primary Productivity by Assimilating Solar-Induced Fluorescence Satellite Retrievals in a Terrestrial Biosphere Model Using a Process-Based SIF Model, J. Geophys. Res.-Biogeo., 124, 3281–3306, https://doi.org/10.1029/2019jg005040, 2019.
Badgley, G., Field, C. B., and Berry, J. A.: Canopy near-infrared reflectance and terrestrial photosynthesis, Science Advances, 3, e1602244, https://doi.org/10.1126/sciadv.1602244, 2017.
Badgley, G., Anderegg, L. D. L., Berry, J. A., and Field, C. B.: Terrestrial gross primary production: Using NIRV to scale from site to globe, Glob. Change Biol., 25, 3731–3740, https://doi.org/10.1111/gcb.14729, 2019.
Beer, C., Reichstein, M., Tomelleri, E., Ciais, P., Jung, M., Carvalhais, N., Rodenbeck, C., Arain, M. A., Baldocchi, D., Bonan, G. B., Bondeau, A., Cescatti, A., Lasslop, G., Lindroth, A., Lomas, M., Luyssaert, S., Margolis, H., Oleson, K. W., Roupsard, O., Veenendaal, E., Viovy, N., Williams, C., Woodward, F. I., and Papale, D.: Terrestrial gross carbon dioxide uptake: global distribution and covariation with climate, Science, 329, 834–838, https://doi.org/10.1126/science.1184984, 2010.
Cai, W. and Prentice, I. C.: Recent trends in gross primary production and their drivers: analysis and modelling at flux-site and global scales, Environ. Res. Lett., 15, 124050, https://doi.org/10.1088/1748-9326/abc64e, 2020.
Camps-Valls, G., Campos-Taberner, M., Moreno-Martinez, A., Walther, S., Duveiller, G., Cescatti, A., Mahecha, M. D., Munoz-Mari, J., Garcia-Haro, F. J., Guanter, L., Jung, M., Gamon, J. A., Reichstein, M., and Running, S. W.: A unified vegetation index for quantifying the terrestrial biosphere, Science Advances, 7, eabc7447, https://doi.org/10.1126/sciadv.abc7447, 2021.
Chen, M., Rafique, R., Asrar, G. R., Bond-Lamberty, B., Ciais, P., Zhao, F., Reyer, C. P. O., Ostberg, S., Chang, J., Ito, A., Yang, J., Zeng, N., Kalnay, E., West, T., Leng, G., Francois, L., Munhoven, G., Henrot, A., Tian, H., Pan, S., Nishina, K., Viovy, N., Morfopoulos, C., Betts, R., Schaphoff, S., Steinkamp, J., and Hickler, T.: Regional contribution to variability and trends of global gross primary productivity, Environ. Res. Lett., 12, 105005, https://doi.org/10.1088/1748-9326/aa8978, 2017.
Farquhar, G. D., von Caemmerer, S., and Berry, J. A.: A biochemical model of photosynthetic CO2 assimilation in leaves of C 3 species, Planta, 149, 78–90, https://doi.org/10.1007/BF00386231, 1980.
Fleischer, K., Rammig, A., De Kauwe, M. G., Walker, A. P., Domingues, T. F., Fuchslueger, L., Garcia, S., Goll, D. S., Grandis, A., Jiang, M., Haverd, V., Hofhansl, F., Holm, J. A., Kruijt, B., Leung, F., Medlyn, B. E., Mercado, L. M., Norby, R. J., Pak, B., von Randow, C., Quesada, C. A., Schaap, K. J., Valverde-Barrantes, O. J., Wang, Y.-P., Yang, X., Zaehle, S., Zhu, Q., and Lapola, D. M.: Amazon forest response to CO2 fertilization dependent on plant phosphorus acquisition, Nat. Geosci., 12, 736–741, https://doi.org/10.1038/s41561-019-0404-9, 2019.
Frankenberg, C., Fisher, J. B., Worden, J., Badgley, G., Saatchi, S. S., Lee, J.-E., Toon, G. C., Butz, A., Jung, M., Kuze, A., and Yokota, T.: New global observations of the terrestrial carbon cycle from GOSAT: Patterns of plant fluorescence with gross primary productivity, Geophys. Res. Lett., 38, L17706, https://doi.org/10.1029/2011gl048738, 2011.
Friedlingstein, P., Jones, M. W., O'Sullivan, M., Andrew, R. M., Hauck, J., Peters, G. P., Peters, W., Pongratz, J., Sitch, S., Le Quéré, C., Bakker, D. C. E., Canadell, J. G., Ciais, P., Jackson, R. B., Anthoni, P., Barbero, L., Bastos, A., Bastrikov, V., Becker, M., Bopp, L., Buitenhuis, E., Chandra, N., Chevallier, F., Chini, L. P., Currie, K. I., Feely, R. A., Gehlen, M., Gilfillan, D., Gkritzalis, T., Goll, D. S., Gruber, N., Gutekunst, S., Harris, I., Haverd, V., Houghton, R. A., Hurtt, G., Ilyina, T., Jain, A. K., Joetzjer, E., Kaplan, J. O., Kato, E., Klein Goldewijk, K., Korsbakken, J. I., Landschützer, P., Lauvset, S. K., Lefèvre, N., Lenton, A., Lienert, S., Lombardozzi, D., Marland, G., McGuire, P. C., Melton, J. R., Metzl, N., Munro, D. R., Nabel, J. E. M. S., Nakaoka, S.-I., Neill, C., Omar, A. M., Ono, T., Peregon, A., Pierrot, D., Poulter, B., Rehder, G., Resplandy, L., Robertson, E., Rödenbeck, C., Séférian, R., Schwinger, J., Smith, N., Tans, P. P., Tian, H., Tilbrook, B., Tubiello, F. N., van der Werf, G. R., Wiltshire, A. J., and Zaehle, S.: Global Carbon Budget 2019, Earth Syst. Sci. Data, 11, 1783–1838, https://doi.org/10.5194/essd-11-1783-2019, 2019.
Guanter, L., Zhang, Y., Jung, M., Joiner, J., Voigt, M., Berry, J. A., Frankenberg, C., Huete, A. R., Zarco-Tejada, P., Lee, J.-E., Moran, M. S., Ponce-Campos, G., Beer, C., Camps-Valls, G., Buchmann, N., Gianelle, D., Klumpp, K., Cescatti, A., Baker, J. M., and Griffis, T. J.: Global and time-resolved monitoring of crop photosynthesis with chlorophyll fluorescence, P. Ntl. Acad. Sci. USA, 111, E1327–E1333, https://doi.org/10.1073/pnas.1320008111, 2014.
Guimberteau, M., Zhu, D., Maignan, F., Huang, Y., Yue, C., Dantec-Nédélec, S., Ottlé, C., Jornet-Puig, A., Bastos, A., Laurent, P., Goll, D., Bowring, S., Chang, J., Guenet, B., Tifafi, M., Peng, S., Krinner, G., Ducharne, A., Wang, F., Wang, T., Wang, X., Wang, Y., Yin, Z., Lauerwald, R., Joetzjer, E., Qiu, C., Kim, H., and Ciais, P.: ORCHIDEE-MICT (v8.4.1), a land surface model for the high latitudes: model description and validation, Geosci. Model Dev., 11, 121–163, https://doi.org/10.5194/gmd-11-121-2018, 2018.
Hamed, K. H. and Ramachandra Rao, A.: A modified MannKendall trend test for autocorrelated data, J. Hydrol., 204, 182–196, https://doi.org/10.1016/S0022-1694(97)00125-X, 1998.
Hashimoto, H., Nemani, R., Bala, G., Cao, L., Michaelis, A., Ganguly, S., Wang, W., Milesi, C., Eastman, R., Lee, T., and Myneni, R.: Constraints to Vegetation Growth Reduced by Region-Specific Changes in Seasonal Climate, Climate, 7, 27, https://doi.org/10.3390/cli7020027, 2019.
Haverd, V., Smith, B., Nieradzik, L., Briggs, P. R., Woodgate, W., Trudinger, C. M., Canadell, J. G., and Cuntz, M.: A new version of the CABLE land surface model (Subversion revision r4601) incorporating land use and land cover change, woody vegetation demography, and a novel optimisation-based approach to plant coordination of photosynthesis, Geosci. Model Dev., 11, 2995–3026, https://doi.org/10.5194/gmd-11-2995-2018, 2018.
He, L., Chen, J. M., Croft, H., Gonsamo, A., Luo, X., Liu, J., Zheng, T., Liu, R., and Liu, Y.: Nitrogen availability dampens the positive impacts of CO2 fertilization on terrestrial ecosystem carbon and water cycles, Geophys. Res. Lett., 44, 590–611, https://doi.org/10.1002/2017GL075981, 2017.
Huete, A., Didan, K., Miura, T., Rodriguez, E. P., Gao, X., and Ferreira, L. G.: Overview of the radiometric and biophysical performance of the MODIS vegetation indices, Remote Sens. Environ., 83, 195–213, https://doi.org/10.1016/s0034-4257(02)00096-2, 2002.
Huntzinger, D. N., Schwalm, C., Michalak, A. M., Schaefer, K., King, A. W., Wei, Y., Jacobson, A., Liu, S., Cook, R. B., Post, W. M., Berthier, G., Hayes, D., Huang, M., Ito, A., Lei, H., Lu, C., Mao, J., Peng, C. H., Peng, S., Poulter, B., Riccuito, D., Shi, X., Tian, H., Wang, W., Zeng, N., Zhao, F., and Zhu, Q.: The North American Carbon Program Multi-Scale Synthesis and Terrestrial Model Intercomparison Project – Part 1: Overview and experimental design, Geosci. Model Dev., 6, 2121–2133, https://doi.org/10.5194/gmd-6-2121-2013, 2013.
Ito, A., Nishina, K., Reyer, C. P. O., François, L., Henrot, A.-J., Munhoven, G., Jacquemin, I., Tian, H., Yang, J., Pan, S., Morfopoulos, C., Betts, R., Hickler, T., Steinkamp, J., Ostberg, S., Schaphoff, S., Ciais, P., Chang, J., Rafique, R., Zeng, N., and Zhao, F.: Photosynthetic productivity and its efficiencies in ISIMIP2a biome models: benchmarking for impact assessment studies, Environ. Res. Lett., 12, 85001, https://doi.org/10.1088/1748-9326/aa7a19, 2017.
Jain, A. K., Meiyappan, P., Song, Y., and House, J. I.: CO2 emissions from land-use change affected more by nitrogen cycle, than by the choice of land-cover data, Glob. Change Biol., 19, 2893–2906, https://doi.org/10.1111/gcb.12207, 2013.
Jia, B., Luo, X., Cai, X., Jain, A., Huntzinger, D. N., Xie, Z., Zeng, N., Mao, J., Shi, X., Ito, A., Wei, Y., Tian, H., Poulter, B., Hayes, D., and Schaefer, K.: Impacts of land use change and elevated CO2 on the interannual variations and seasonal cycles of gross primary productivity in China, Earth Syst. Dynam., 11, 235–249, https://doi.org/10.5194/esd-11-235-2020, 2020.
Jiang, C., Ryu, Y., Fang, H., Myneni, R., Claverie, M., and Zhu, Z.: Inconsistencies of interannual variability and trends in long-term satellite leaf area index products, Glob. Change Biol., 23, 4133–4146, https://doi.org/10.1111/gcb.13787, 2017.
Joiner, J., Yoshida, Y., Zhang, Y., Duveiller, G., Jung, M., Lyapustin, A., Wang, Y., and Tucker, C.: Estimation of Terrestrial Global Gross Primary Production (GPP) with Satellite Data-Driven Models and Eddy Covariance Flux Data, Remote Sensing, 10, 1346, https://doi.org/10.3390/rs10091346, 2018.
Jung, M., Reichstein, M., Schwalm, C. R., Huntingford, C., Sitch, S., Ahlstrom, A., Arneth, A., Camps-Valls, G., Ciais, P., Friedlingstein, P., Gans, F., Ichii, K., Ain, A. K. J., Kato, E., Papale, D., Poulter, B., Raduly, B., Rodenbeck, C., Tramontana, G., Viovy, N., Wang, Y.-P., Weber, U., Zaehle, S., and Zeng, N.: Compensatory water effects link yearly global land CO2 sink changes to temperature, Nature, 541, 516–520, https://doi.org/10.1038/nature20780, 2017.
Jung, M., Schwalm, C., Migliavacca, M., Walther, S., Camps-Valls, G., Koirala, S., Anthoni, P., Besnard, S., Bodesheim, P., Carvalhais, N., Chevallier, F., Gans, F., Goll, D. S., Haverd, V., Köhler, P., Ichii, K., Jain, A. K., Liu, J., Lombardozzi, D., Nabel, J. E. M. S., Nelson, J. A., O'Sullivan, M., Pallandt, M., Papale, D., Peters, W., Pongratz, J., Rödenbeck, C., Sitch, S., Tramontana, G., Walker, A., Weber, U., and Reichstein, M.: Scaling carbon fluxes from eddy covariance sites to globe: synthesis and evaluation of the FLUXCOM approach, Biogeosciences, 17, 1343–1365, https://doi.org/10.5194/bg-17-1343-2020, 2020.
Kato, E., Kinoshita, T., Ito, A., Kawamiya, M., and Yamagata, Y.: Evaluation of spatially explicit emission scenario of land-use change and biomass burning using a process-based biogeochemical model, Journal of Land Use Science, 8, 104–122, https://doi.org/10.1080/1747423x.2011.628705, 2013.
Krinner, G., Viovy, N., de Noblet-Ducoudre, N., Ogee, J., Polcher, J., Friedlingstein, P., Ciais, P., Sitch, S., and Prentice, I. C.: A dynamic global vegetation model for studies of the coupled atmosphere-biosphere system, Global Biogeochem. Cy., 19, 133, https://doi.org/10.1029/2003gb002199, 2005.
Liu, Y., Xiao, J., Ju, W., Zhu, G., Wu, X., Fan, W., Li, D., and Zhou, Y.: Satellite-derived LAI products exhibit large discrepancies and can lead to substantial uncertainty in simulated carbon and water fluxes, Remote Sens. Environ., 206, 174–188, https://doi.org/10.1016/j.rse.2017.12.024, 2018.
Liu, Y., Xue, Y., MacDonald, G., Cox, P., and Zhang, Z.: Global vegetation variability and its response to elevated CO2, global warming, and climate variability – a study using the offline SSiB4/TRIFFID model and satellite data, Earth Syst. Dynam., 10, 9–29, https://doi.org/10.5194/esd-10-9-2019, 2019.
Liu, Z., Shao, Q., and Liu, J.: The Performances of MODIS-GPP and -ET Products in China and Their Sensitivity to Input Data (FPAR/LAI), Remote Sensing, 7, 135–152, https://doi.org/10.3390/rs70100135, 2014.
MacBean, N., Maignan, F., Bacour, C., Lewis, P., Peylin, P., Guanter, L., Kohler, P., Gomez-Dans, J., and Disney, M.: Strong constraint on modelled global carbon uptake using solar-induced chlorophyll fluorescence data, Sci. Rep.-UK, 8, 10420, https://doi.org/10.1038/s41598-018-28697-z, 2018.
Madani, N., Parazoo, N. C., Kimball, J. S., Ballantyne, A. P., Reichle, R. H., Maneta, M., Saatchi, S., Palmer, P. I., Liu, Z., and Tagesson, T.: Recent Amplified Global Gross Primary Productivity Due to Temperature Increase Is Offset by Reduced Productivity Due to Water Constraints, AGU Advances, 1, e2020AV000180, https://doi.org/10.1029/2020av000180, 2020.
Melton, J. R. and Arora, V. K.: Competition between plant functional types in the Canadian Terrestrial Ecosystem Model (CTEM) v. 2.0, Geosci. Model Dev., 9, 323–361, https://doi.org/10.5194/gmd-9-323-2016, 2016.
Mohammed, G. H., Colombo, R., Middleton, E. M., Rascher, U., van der Tol, C., Nedbal, L., Goulas, Y., Perez-Priego, O., Damm, A., Meroni, M., Joiner, J., Cogliati, S., Verhoef, W., Malenovsky, Z., Gastellu-Etchegorry, J.-P., Miller, J. R., Guanter, L., Moreno, J., Moya, I., Berry, J. A., Frankenberg, C., and Zarco-Tejada, P. J.: Remote sensing of solar-induced chlorophyll fluorescence (SIF) in vegetation: 50 years of progress, Remote Sens. Environ., 231, 111177, https://doi.org/10.1016/j.rse.2019.04.030, 2019.
Norton, A. J., Rayner, P. J., Koffi, E. N., Scholze, M., Silver, J. D., and Wang, Y.-P.: Estimating global gross primary productivity using chlorophyll fluorescence and a data assimilation system with the BETHY-SCOPE model, Biogeosciences, 16, 3069–3093, https://doi.org/10.5194/bg-16-3069-2019, 2019.
O'Sullivan, M., Smith, W. K., Sitch, S., Friedlingstein, P., Arora, V. K., Haverd, V., Jain, A. K., Kato, E., Kautz, M., Lombardozzi, D., Nabel, J., Tian, H., Vuichard, N., Wiltshire, A., Zhu, D., and Buermann, W.: Climate-Driven Variability and Trends in Plant Productivity Over Recent Decades Based on Three Global Products, Global Biogeochem. Cy., 34, e2020GB006613, https://doi.org/10.1029/2020GB006613, 2020.
Oleson, K., Lawrence, D., Bonan, G., Drewniak, B., Huang, M., Koven, C., Levis, S., Li, F., Riley, W., Subin, Z., Swenson, S., Thornton, P., Bozbiyik, A., Fisher, R., Heald, C., Kluzek, E., Lamarque, J., Lawrence, P., Leung, L., Lipscomb, W., Muszala, S., Ricciuto, D., Sacks, W., Tang, J., and Yang, Z.: Technical Description of version 4.5 of the Community Land Model (CLM), NCAR – National Center for Atmospheric Research, Boulder, Colorado, https://doi.org/10.5065/D6RR1W7M, 2013.
Pastorello, G., Trotta, C., Canfora, E., Chu, H., Christianson, D., Cheah, Y.-W., Poindexter, C., Chen, J., Elbashandy, A., Humphrey, M., Isaac, P., Polidori, D., Ribeca, A., van Ingen, C., Zhang, L., Amiro, B., Ammann, C., Arain, M. A., Ardo, J., Arkebauer, T., Arndt, S. K., Arriga, N., Aubinet, M., Aurela, M., Baldocchi, D., Barr, A., Beamesderfer, E., Marchesini, L. B., Bergeron, O., Beringer, J., Bernhofer, C., Berveiller, D., Billesbach, D., Black, T. A., Blanken, P. D., Bohrer, G., Boike, J., Bolstad, P. V., Bonal, D., Bonnefond, J.-M., Bowling, D. R., Bracho, R., Brodeur, J., Bruemmer, C., Buchmann, N., Burban, B., Burns, S. P., Buysse, P., Cale, P., Cavagna, M., Cellier, P., Chen, S., Chini, I., Christensen, T. R., Cleverly, J., Collalti, A., Consalvo, C., Cook, B. D., Cook, D., Coursolle, C., Cremonese, E., Curtis, P. S., D'Andrea, E., da Rocha, H., Dai, X., Davis, K. J., De Cinti, B., de Grandcourt, A., De Ligne, A., De Oliveira, R. C., Delpierre, N., Desai, A. R., Di Bella, C. M., di Tommasi, P., Dolman, H., Domingo, F., Dong, G., Dore, S., Duce, P., Dufrene, E., Dunn, A., Dusek, J., Eamus, D., Eichelmann, U., ElKhidir, H. A. M., Eugster, W., Ewenz, C. M., Ewers, B., Famulari, D., Fares, S., Feigenwinter, I., Feitz, A., Fensholt, R., Filippa, G., Fischer, M., Frank, J., Galvagno, M., Gharun, M., Gianelle, D., Gielen, B., Gioli, B., Gitelson, A., Goded, I., Goeckede, M., Goldstein, A. H., Gough, C. M., Goulden, M. L., Graf, A., Griebel, A., Gruening, C., Gruenwald, T., Hammerle, A., Han, S., Han, X., Hansen, B. U., Hanson, C., Hatakka, J., He, Y., Hehn, M., Heinesch, B., Hinko-Najera, N., Hoertnagl, L., Hutley, L., Ibrom, A., Ikawa, H., Jackowicz-Korczynski, M., Janous, D., Jans, W., Jassal, R., Jiang, S., Kato, T., Khomik, M., Klatt, J., Knohl, A., Knox, S., Kobayashi, H., Koerber, G., Kolle, O., Kosugi, Y., Kotani, A., Kowalski, A., Kruijt, B., Kurbatova, J., Kutsch, W. L., Kwon, H., Launiainen, S., Laurila, T., Law, B., Leuning, R., Li, Y., Liddell, M., Limousin, J.-M., Lion, M., Liska, A. J., Lohila, A., Lopez-Ballesteros, A., Lopez-Blanco, E., Loubet, B., Loustau, D., Lucas-Moffat, A., Lueers, J., Ma, S., Macfarlane, C., Magliulo, V., Maier, R., Mammarella, I., Manca, G., Marcolla, B., Margolis, H. A., Marras, S., Massman, W., Mastepanov, M., Matamala, R., Matthes, J. H., Mazzenga, F., McCaughey, H., McHugh, I., McMillan, A. M. S., Merbold, L., Meyer, W., Meyers, T., Miller, S. D., Minerbi, S., Moderow, U., Monson, R. K., Montagnani, L., Moore, C. E., Moors, E., Moreaux, V., Moureaux, C., Munger, J. W., Nakai, T., Neirynck, J., Nesic, Z., Nicolini, G., Noormets, A., Northwood, M., Nosetto, M., Nouvellon, Y., Novick, K., Oechel, W., Olesen, J. E., Ourcival, J.-M., Papuga, S. A., Parmentier, F.-J., Paul-Limoges, E., Pavelka, M., Peichl, M., Pendall, E., Phillips, R. P., Pilegaard, K., Pirk, N., Posse, G., Powell, T., Prasse, H., Prober, S. M., Rambal, S., Rannik, U., Raz-Yaseef, N., Reed, D., de Dios, V. R., Restrepo-Coupe, N., Reverter, B. R., Roland, M., Sabbatini, S., Sachs, T., Saleska, S. R., Sanchez-Canete, E. P., Sanchez-Mejia, Z. M., Schmid, H. P., Schmidt, M., Schneider, K., Schrader, F., Schroder, I., Scott, R. L., Sedlak, P., Serrano-Ortiz, P., Shao, C., Shi, P., Shironya, I., Siebicke, L., Sigut, L., Silberstein, R., Sirca, C., Spano, D., Steinbrecher, R., Stevens, R. M., Sturtevant, C., Suyker, A., Tagesson, T., Takanashi, S., Tang, Y., Tapper, N., Thom, J., Tiedemann, F., Tomassucci, M., Tuovinen, J.-P., Urbanski, S., Valentini, R., van der Molen, M., van Gorsel, E., van Huissteden, K., Varlagin, A., Verfaillie, J., Vesala, T., Vincke, C., Vitale, D., Vygodskaya, N., Walker, J. P., Walter-Shea, E., Wang, H., Weber, R., Westermann, S., Wille, C., Wofsy, S., Wohlfahrt, G., Wolf, S., Woodgate, W., Li, Y., Zampedri, R., Zhang, J., Zhou, G., Zona, D., Agarwal, D., Biraud, S., Torn, M., and Papale, D.: The FLUXNET2015 dataset and the ONEFlux processing pipeline for eddy covariance data, Scientific Data, 7, 225, https://doi.org/10.1038/s41597-020-0534-3, 2020.
Piao, S., Wang, X., Park, T., Chen, C., Lian, X., He, Y., Bjerke, J. W., Chen, A., Ciais, P., Tommervik, H., Nemani, R. R., and Myneni, R. B.: Characteristics, drivers and feedbacks of global greening, Nat. Rev. Earth Environ., 1, 14–27, https://doi.org/10.1038/s43017-019-0001-x, 2020.
Rogers, A.: The use and misuse of Vc,max in Earth System Models, Photosynth. Res., 119, 15–29, https://doi.org/10.1007/s11120-013-9818-1, 2014.
Rogers, A., Medlyn, B. E., Dukes, J. S., Bonan, G., von Caemmerer, S., Dietze, M. C., Kattge, J., Leakey, A. D. B., Mercado, L. M., Niinemets, U., Prentice, I. C., Serbin, S. P., Sitch, S., Way, D. A., and Zaehle, S.: A roadmap for improving the representation of photosynthesis in Earth system models, New Phytol., 213, 22–42, https://doi.org/10.1111/nph.14283, 2017.
Running, S. W., Nemani, R. R., Heinsch, F. A., Zhao, M. S., Reeves, M., and Hashimoto, H.: A continuous satellite-derived measure of global terrestrial primary production, Bioscience, 54, 547–560, https://doi.org/10.1641/0006-3568(2004)054[0547:Acsmog]2.0.Co;2, 2004.
Ryu, Y., Berry, J. A., and Baldocchi, D. D.: What is global photosynthesis? History, uncertainties and opportunities, Remote Sens. Environ., 223, 95–114, https://doi.org/10.1016/j.rse.2019.01.016, 2019.
Sitch, S., Friedlingstein, P., Gruber, N., Jones, S. D., Murray-Tortarolo, G., Ahlström, A., Doney, S. C., Graven, H., Heinze, C., Huntingford, C., Levis, S., Levy, P. E., Lomas, M., Poulter, B., Viovy, N., Zaehle, S., Zeng, N., Arneth, A., Bonan, G., Bopp, L., Canadell, J. G., Chevallier, F., Ciais, P., Ellis, R., Gloor, M., Peylin, P., Piao, S. L., Le Quéré, C., Smith, B., Zhu, Z., and Myneni, R.: Recent trends and drivers of regional sources and sinks of carbon dioxide, Biogeosciences, 12, 653–679, https://doi.org/10.5194/bg-12-653-2015, 2015.
Smith, W. K., Reed, S. C., Cleveland, C. C., Ballantyne, A. P., Anderegg, W. R. L., Wieder, W. R., Liu, Y. Y., and Running, S. W.: Large divergence of satellite and Earth system model estimates of global terrestrial CO2 fertilization, Nat. Clim. Change, 6, 306–310, https://doi.org/10.1038/nclimate2879, 2016.
Terrer, C., Jackson, R. B., Prentice, I. C., Keenan, T. F., Kaiser, C., Vicca, S., Fisher, J. B., Reich, P. B., Stocker, B. D., Hungate, B. A., Peñuelas, J., McCallum, I., Soudzilovskaia, N. A., Cernusak, L. A., Talhelm, A. F., Van Sundert, K., Piao, S., Newton, P. C. D., Hovenden, M. J., Blumenthal, D. M., Liu, Y. Y., Müller, C., Winter, K., Field, C. B., Viechtbauer, W., Van Lissa, C. J., Hoosbeek, M. R., Watanabe, M., Koike, T., Leshyk, V. O., Polley, H. W., and Franklin, O.: Nitrogen and phosphorus constrain the CO2 fertilization of global plant biomass, Nat. Clim. Change, 9, 684–689, https://doi.org/10.1038/s41558-019-0545-2, 2019.
Tian, H., Chen, G., Lu, C., Xu, X., Hayes, D. J., Ren, W., Pan, S., Huntzinger, D. N., and Wofsy, S. C.: North American terrestrial CO2 uptake largely offset by CH4 and N2O emissions: toward a full accounting of the greenhouse gas budget, Climatic Change, 129, 413–426, https://doi.org/10.1007/s10584-014-1072-9, 2015.
Wang, J., Dong, J., Liu, J., Huang, M., Li, G., Running, S. W., Smith, W. K., Harris, W., Saigusa, N., Kondo, H., Liu, Y., Hirano, T., and Xiao, X.: Comparison of Gross Primary Productivity Derived from GIMMS NDVI3g, GIMMS, and MODIS in Southeast Asia, Remote Sensing, 6, 2108–2133, https://doi.org/10.3390/rs6032108, 2014.
Wang, J., Zeng, N., and Wang, M.: Interannual variability of the atmospheric CO2 growth rate: roles of precipitation and temperature, Biogeosciences, 13, 2339–2352, https://doi.org/10.5194/bg-13-2339-2016, 2016.
Wang, J., Jiang, F., Wang, H., Qiu, B., Wu, M., He, W., Ju, W., Zhang, Y., Chen, J. M., and Zhou, Y.: Constraining global terrestrial gross primary productivity in a global carbon assimilation system with OCO-2 chlorophyll fluorescence data, Agr. Forest Meteorol., 304, https://doi.org/10.1016/j.agrformet.2021.108424, 2021a.
Wang, J., Wang, M., Kim, J.-S., Joiner, J., Zeng, N., Jiang, F., Wang, H., He, W., Wu, M., Chen, T., Ju, W., and Chen, J. M.: Modulation of Land Photosynthesis by the Indian Ocean Dipole: Satellite-Based Observations and CMIP6 Future Projections, Earths Future, 9, 4, https://doi.org/10.1029/2020ef001942, 2021b.
Wang, M., Wang, J., Cai, Q., Zeng, N., Lu, X., Yang, R., Jiang, F., Wang, H., and Ju, W.: Considerable uncertainties in simulating land carbon sinks induced by different precipitation products, J. Geophys. Res.-Biogeo., 126, e2021JG006524, https://doi.org/10.1029/2021JG006524, 2021.
Wang, S., Zhang, Y., Ju, W., Chen, J. M., Ciais, P., Cescatti, A., Sardans, J., Janssens, I. A., Wu, M., Berry, J. A., Campbell, E., Fernandez-Martinez, M., Alkama, R., Sitch, S., Friedlingstein, P., Smith, W. K., Yuan, W., He, W., Lombardozzi, D., Kautz, M., Zhu, D., Lienert, S., Kato, E., Poulter, B., Sanders, T. G. M., Kruger, I., Wang, R., Zeng, N., Tian, H., Vuichard, N., Jain, A. K., Wiltshire, A., Haverd, V., Goll, D. S., and Penuelas, J.: Recent global decline of CO2 fertilization effects on vegetation photosynthesis, Science, 370, 1295–1300, https://doi.org/10.1126/science.abb7772, 2020.
Xiao, Z., Liang, S., Wang, J., Xiang, Y., Zhao, X., and Song, J.: Long-Time-Series Global Land Surface Satellite Leaf Area Index Product Derived From MODIS and AVHRR Surface Reflectance, IEEE T. Geosci. Remote, 54, 5301–5318, https://doi.org/10.1109/TGRS.2016.2560522, 2016.
Xiao, Z., Liang, S., and Jiang, B.: Evaluation of four long time-series global leaf area index products, Agr. Forest Meteorol., 246, 218–230, https://doi.org/10.1016/j.agrformet.2017.06.016, 2017.
Xie, X., Li, A., Jin, H., Tan, J., Wang, C., Lei, G., Zhang, Z., Bian, J., and Nan, X.: Assessment of five satellite-derived LAI datasets for GPP estimations through ecosystem models, Sci. Total Environ., 690, 1120–1130, https://doi.org/10.1016/j.scitotenv.2019.06.516, 2019.
Yuan, W., Liu, S., Zhou, G., Zhou, G., Tieszen, L. L., Baldocchi, D., Bernhofer, C., Gholz, H., Goldstein, A. H., Goulden, M. L., Hollinger, D. Y., Hu, Y., Law, B. E., Stoy, P. C., Vesala, T., Wofsy, S. C., and AmeriFlux, C.: Deriving a light use efficiency model from eddy covariance flux data for predicting daily gross primary production across biomes, Agr. Forest Meteorol., 143, 189–207, https://doi.org/10.1016/j.agrformet.2006.12.001, 2007.
Yuan, W., Liu, S., Yu, G., Bonnefond, J.-M., Chen, J., Davis, K., Desai, A. R., Goldstein, A. H., Gianelle, D., Rossi, F., Suyker, A. E., and Verma, S. B.: Global estimates of evapotranspiration and gross primary production based on MODIS and global meteorology data, Remote Sens. Environ., 114, 1416–1431, https://doi.org/10.1016/j.rse.2010.01.022, 2010.
Yuan, W., Zheng, Y., Piao, S., Ciais, P., Lombardozzi, D., Wang, Y., Ryu, Y., Chen, G., Dong, W., Hu, Z., Jain, A. K., Jiang, C., Kato, E., Li, S., Lienert, S., Liu, S., Nabel, J. E. M. S., Qin, Z., Quine, T., Sitch, S., Smith, W. K., Wang, F., Wu, C., Xiao, Z., and Yang, S.: Increased atmospheric vapor pressure deficit reduces global vegetation growth, Science Advances, 5, eaax1396, https://doi.org/10.1126/sciadv.aax1396, 2019.
Zaehle, S., Friend, A. D., Friedlingstein, P., Dentener, F., Peylin, P., and Schulz, M.: Carbon and nitrogen cycle dynamics in the OCN land surface model: 2. Role of the nitrogen cycle in the historical terrestrial carbon balance, Global Biogeochem. Cy., 24, GB1006, https://doi.org/10.1029/2009GB003522, 2010.
Zeng, N., Mariotti, A., and Wetzel, P.: Terrestrial mechanisms of interannual CO2 variability, Global Biogeochem. Cy., 19, GB1016, https://doi.org/10.1029/2004gb002273, 2005.
Zhang, Y. and Ye, A.: Would the obtainable gross primary productivity (GPP) products stand up? A critical assessment of 45 global GPP products, Sci. Total Environ., 783, 146965, https://doi.org/10.1016/j.scitotenv.2021.146965, 2021.
Zheng, Y., Shen, R., Wang, Y., Li, X., Liu, S., Liang, S., Chen, J. M., Ju, W., Zhang, L., and Yuan, W.: Improved estimate of global gross primary production for reproducing its long-term variation, 1982–2017, Earth Syst. Sci. Data, 12, 2725–2746, https://doi.org/10.5194/essd-12-2725-2020, 2020.