the Creative Commons Attribution 4.0 License.
the Creative Commons Attribution 4.0 License.
 | 21 Jun 2022
Complex network analysis of fine particulate matter (PM2.5): transport and clustering
Wansuo Duan
Zhidan Zhao
Jingfang Fan
In this paper, complex network theory has been applied to reveal the transport patterns and cooperative regions of fine particulate matter (PM2.5) over China from 2015 to 2019. The results show that the degrees, weighted degrees, and edge lengths of PM2.5 cities follow power law distributions. We find that the cities in the Beijing–Tianjin–Hebei–Henan–Shandong (BTHHS) region have a strong ability to export PM2.5 pollution to other cities. By analyzing the transport routes, we show that a mass of links extends southward from the BTHHS to the Yangtze River Delta (YRD) regions with 1 or 2 d time lags. Hence, we conclude that earlier emission reduction in the BTHHS region and early warning measures in the YRD region will provide better air pollution mitigation in both regions. Moreover, significant links are concentrated in wintertime, suggesting the impact of the winter monsoon. In addition, all cities have been divided into nine clusters according to their spatial correlations. We suggest that the cities in the same clusters should be regarded as a whole to control the level of air pollution. This approach is able to characterize the transport and cluster for other air pollutants, such as ozone and NOx.
- Article
(4758 KB) - Full-text XML
- BibTeX
- EndNote


The Earth system behaves as a complex self-regulating system comprised of atmosphere, hydrosphere, cryosphere, lithosphere, and biosphere, with highly nonlinear interactions and feedbacks between the component parts (Steffen et al., 2015). With the increasing understanding of interactions between physical, chemical, biological, and human processes, a new “science of the Earth”, known as Earth system science (ESS), has been initiated (Steffen et al., 2020). Facilitated by its various tools and approaches, ESS has introduced some new concepts and theories, the most important of which is the concept of the Anthropocene (Malm and Hornborg, 2014). In the Anthropocene era, haze events have occurred frequently in China, and the problem of air pollution has received wide attention from the government, scholars, and the public in China (Huang et al., 2014; Sheehan et al., 2014).
Fine particulate matter (PM2.5) is the primary cause of haze pollution (Ding et al., 2016; Cai et al., 2017). It has adverse influences on human health, atmospheric visibility, and global climate change (Liang et al., 2016; Liaoet al., 2017). PM2.5 pollution is generated from both anthropogenic and natural sources, including primary aerosols and secondary aerosols that are produced in the atmosphere through the chemistry of precursor gases (Squizzato et al., 2012). In recent years, it has also been recognized that air pollution in a given area is influenced not only by the air pollutant emissions within the same region but also by the transport of air pollutants from other regions. Based on trajectory clustering methods, Li et al. (2019) concluded that regional PM2.5 transmission has become the key factor driving severe haze in Beijing. By using the positive matrix factorization approach, Khuzestani et al. (2017) revealed that remote transmission accounted for approximately 77 % of the PM2.5 concentration in the Ordos region. Furthermore, PM2.5 transmissions are also examined using model simulations. For example, Wang et al. (2014) quantified the regional contribution of PM2.5 in southern Hebei by using Mesoscale Modeling System Generation 5(MM5) and the Models-3 Community Multiscale Air Quality (CMAQ) modeling system. Zhang et al. (2017) investigated the effect of regional pollution transport based on the GEOS-Chem chemical transport model and its adjoint. These studies suggest that curbing air pollution has not been a local issue, and the regional coordination could be an effective approach to improve the air quality of the regional atmospheric environment. In 2012, The 12th Five-Year Plan on Air Pollution Prevention and Control in Key Regions approved proposed dividing China into three key regions to jointly prevent air pollution, i.e., the Beijing–Tianjin–Hebei (BTH) region, Yangtze River Delta (YRD), and the Pearl River Delta (PRD), and major urban agglomerations such as Lanzhou–Xining, Wuhan and surrounding areas, and Shaanxi and Guanzhong city (MEP, 2012). However, this kind of region division ignores the nonlinear transport characteristics of PM2.5 concentrations; furthermore, considerable discrepancies exist in the above studies of PM2.5 transmission in different cities and regions during different air pollution periods. For example, the transport from the BTH region to the YRD is significant during the hazing periods (Huang et al., 2020). High PM2.5 to the southwest and south of Beijing is related to the PM2.5 transmission in Baoding and Hengshui in Hebei Province and Dezhou, Liaocheng, Heze, Jining, and Zaozhuang in Shandong Province, respectively (Li et al., 2015). Hence, PM2.5 transport for the whole of China over a long-time period is not been fully understood; furthermore, the traditional approaches adopted in the above studies did not fully consider the nonlinear transport processes between cities.
Methods are required that help to unveil the transport processes at the national scale. In addition, it is important to quantify their spatial and temporary interactions between cities. During the last 2 decades, complex network theory has been applied to reveal the statistical and dynamic topological features in complex systems (Fountalis et al., 2014; Feldhoff et al., 2015). In complex networks, geographical locations are considered to be nodes. Links represent communications between time series of nodes, and their strength is measured by the cross-correlation between records (Castrejon-Pita and Read, 2010). The network-theory-based approach has been used to study teleconnection patterns (Zhou et al., 2015; Boers et al., 2019; Ying et al., 2019), El Niño events (Yamasaki et al., 2008; Ludescher et al., 2013, 2014), the North Atlantic Oscillation (Guez et al., 2012), Atlantic Multidecadal Oscillation (Wyatt et al., 2012), and Rossby waves (Wang et al., 2013; Ying et al., 2020). This approach is also useful in the studies of atmosphere environment systems, especially enabling us to investigate the nonlinear spatiotemporal dynamics between air pollution agents. Such nonlinear relationships are critical for assessing the intrinsic dynamics of atmospheric pollution systems, but traditional statistical or model simulation methods are difficult to reveal. The network-theory-based approach has been used to uncover the correlation pattern of PM2.5 concentrations (Zhang et al., 2018), analyze the PM2.5 spillover routes in BTH region cities (Li et al., 2019), discriminate between urban and rural tropospheric ozone (Rafael et al., 2019), and quantify the interaction between upper-air conditions and surface PM2.5 concentrations (Zhang et al., 2019). It is obvious that complex network methods are valuable tools for depicting and quantifying air pollution transmission and cluster among cities. In addition, for traditional model simulation, numerous parameters are needed in the simulation process. In contrast, complex network theory is performed based on time series of field observations, so the estimation process is faster and more economic.
In the present study, we attempt to explore the transport and cluster of PM2.5 based on complex networks, and in the next section we introduce the data and methods. The patterns of PM2.5 concentrations and their transport features and demarcation regions are presented in Sect. 3. Finally, the summary and discussion are detailed in Sect. 4.
2.1 Data
The daily PM2.5 concentration data for 336 cities over China from 1 January 2015 to 31 December 2019 are used in this study. These raw data were acquired from the China National Environmental Monitoring Centre (CNEMC). We then pre-processed these data according to the needs of the ambient air quality standard for the validity of air pollutant concentration data. Specifically, the missing values in the PM2.5 data are excluded. Following this, the error values, e.g., negative values and those larger than 900 mg m−3 on a given day for a given year, are removed, and for these years we deleted the data corresponding to those days. As a result, we obtained data for 360 valid days per year (data on 9 January, 1 April, 6 July, 5 September, and 29 November are removed), and thus the total length is 5×360 (1800 d).
The anomaly records of PM2.5 are adopted, where the anomalies are obtained by subtracting the daily averages and dividing them by the corresponding standard deviations to remove the seasonal cycle.
2.2 Methods
The network construction includes three steps. First, we calculate the weight of the edges between nodes. Second, we apply a shuffled procedure to identify a certain threshold. Third, we calculate network typological metrics to determine the interaction strength between two nodes. Below, we detail each step.
2.2.1 Step 1: the calculation of the weight links between nodes
The anomalous PM2.5 time series of each node i is represented as δSi(t), where i is the node index. Similar to earlier studies (Gozolchiani et al., 2011; Ying et al., 2020), we define Xi,j(τ) as the time-delayed cross-correlation function for PM2.5 nodes (i and j), i.e., δSi(t) and δSj(t). For τ>0,
where τ denotes the time lag, which is in a range between 0 and +30 d, and . The bracket is the average over the time period of our study. We quantify the strength of the correlations as follows (Gozolchiani et al., 2011; Guez et al., 2014):
In this approach, max( ), mean( ), min( ), and SD( ) denote the maximum, minimum, mean, and standard deviation of the cross-correlation function Xi,j(τ), respectively. The deviations in the link identification caused by persistence or autocorrelation in the records are reduced through dividing the SD(Xi,j). We defined the maximum and minimum of Xi,j as and , respectively; and represent the maximum and minimum values of Xi,j(τ), respectively; and the sign of (or ) represents the direction of each positive (or negative) link. When , the link is regarded as coming from node i and pointing to node j. When , the link is regarded as pointing away from node j toward node i. The direction is undefined when . The definitions are similar for the negatively weighted links.
The adjacency matrix is defined as follows:
where δi,j is the Kronecker delta introduced to avoid self-loops in the network and H(x) is the Heaviside step function ( and ). Q denotes a certain threshold value. The definitions are similar for the negatively weighted links. We constructed networks by pruning the links for which the statistical significance was below a certain threshold (Guez et al., 2014). The threshold is determined according to the shuffle method, which is explained in detail in the next section.
2.2.2 Step 2: the identification of the critical threshold
In the shuffled case, the order of years is permutated and the order of days within each year is maintained for each pair of nodes (Ying et al., 2020). For each link, we selected one of two nodes randomly and then shuffled this time series by persisting the order of days in each year and changing the permutation of years several times. We then calculated the cross-correlation function and weight links for the shuffled datasets. The shuffling procedure represents the properties of statistical quantities and the autocorrelations of the original records, which may introduce unrealistic links. We only considered the link weights in the original network that are significantly higher than values in the shuffled case as a real link; otherwise, they are classed as spurious links. According to the principles mentioned above, Fig. 1 depicts the research process and integration of analytical tools.
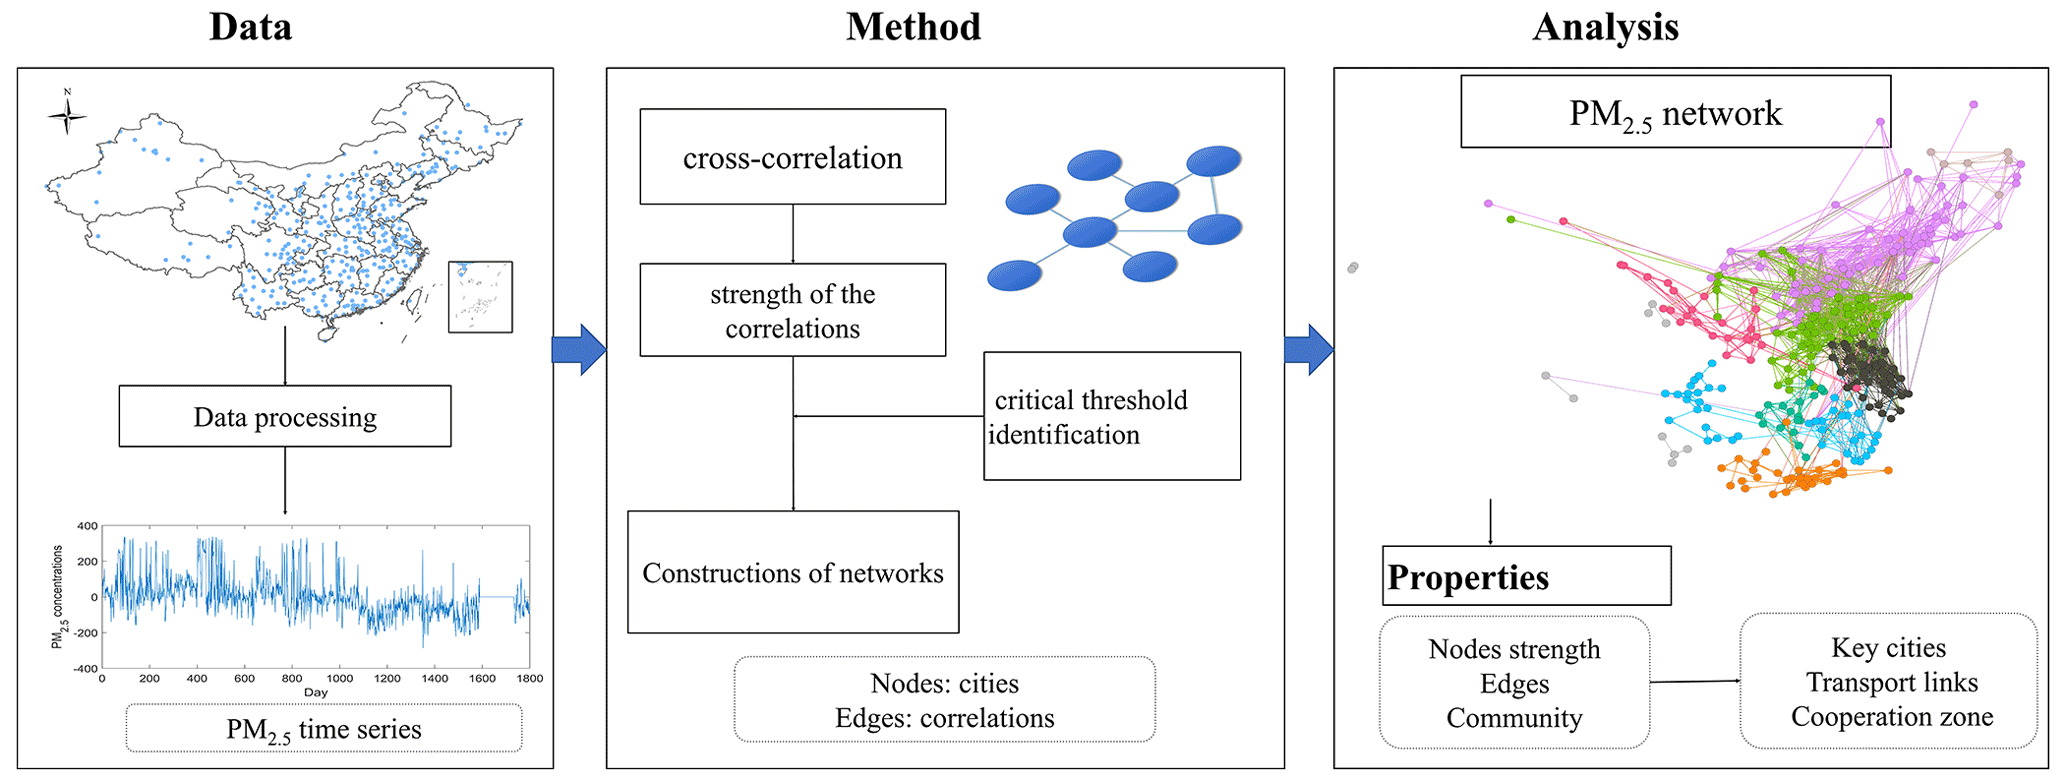
Figure 1The flow chart of the method with complex network analysis. Please note that the above figure contains disputed territories.
2.2.3 Step 3: the determination of network typological metrics
The degree is the most common application for measuring complex networks. A link that points toward a node is referred to as an “in-degree” link, and a link that points away from a node is considered as an “out-degree” link. The “in-weights” and “out-weights” for degrees of node i are denoted as In(w)i and Out(w)i, representing the total incoming (or outgoing) weighted links, respectively, as follows:
The in- and out-weighted degrees represent a node's dependence on its surrounding nodes and the influence of the node on the surroundings nodes, respectively. Nodes with higher values in the network indicate a larger amount of connection with other nodes, whereas zero values indicate that the node is isolated.
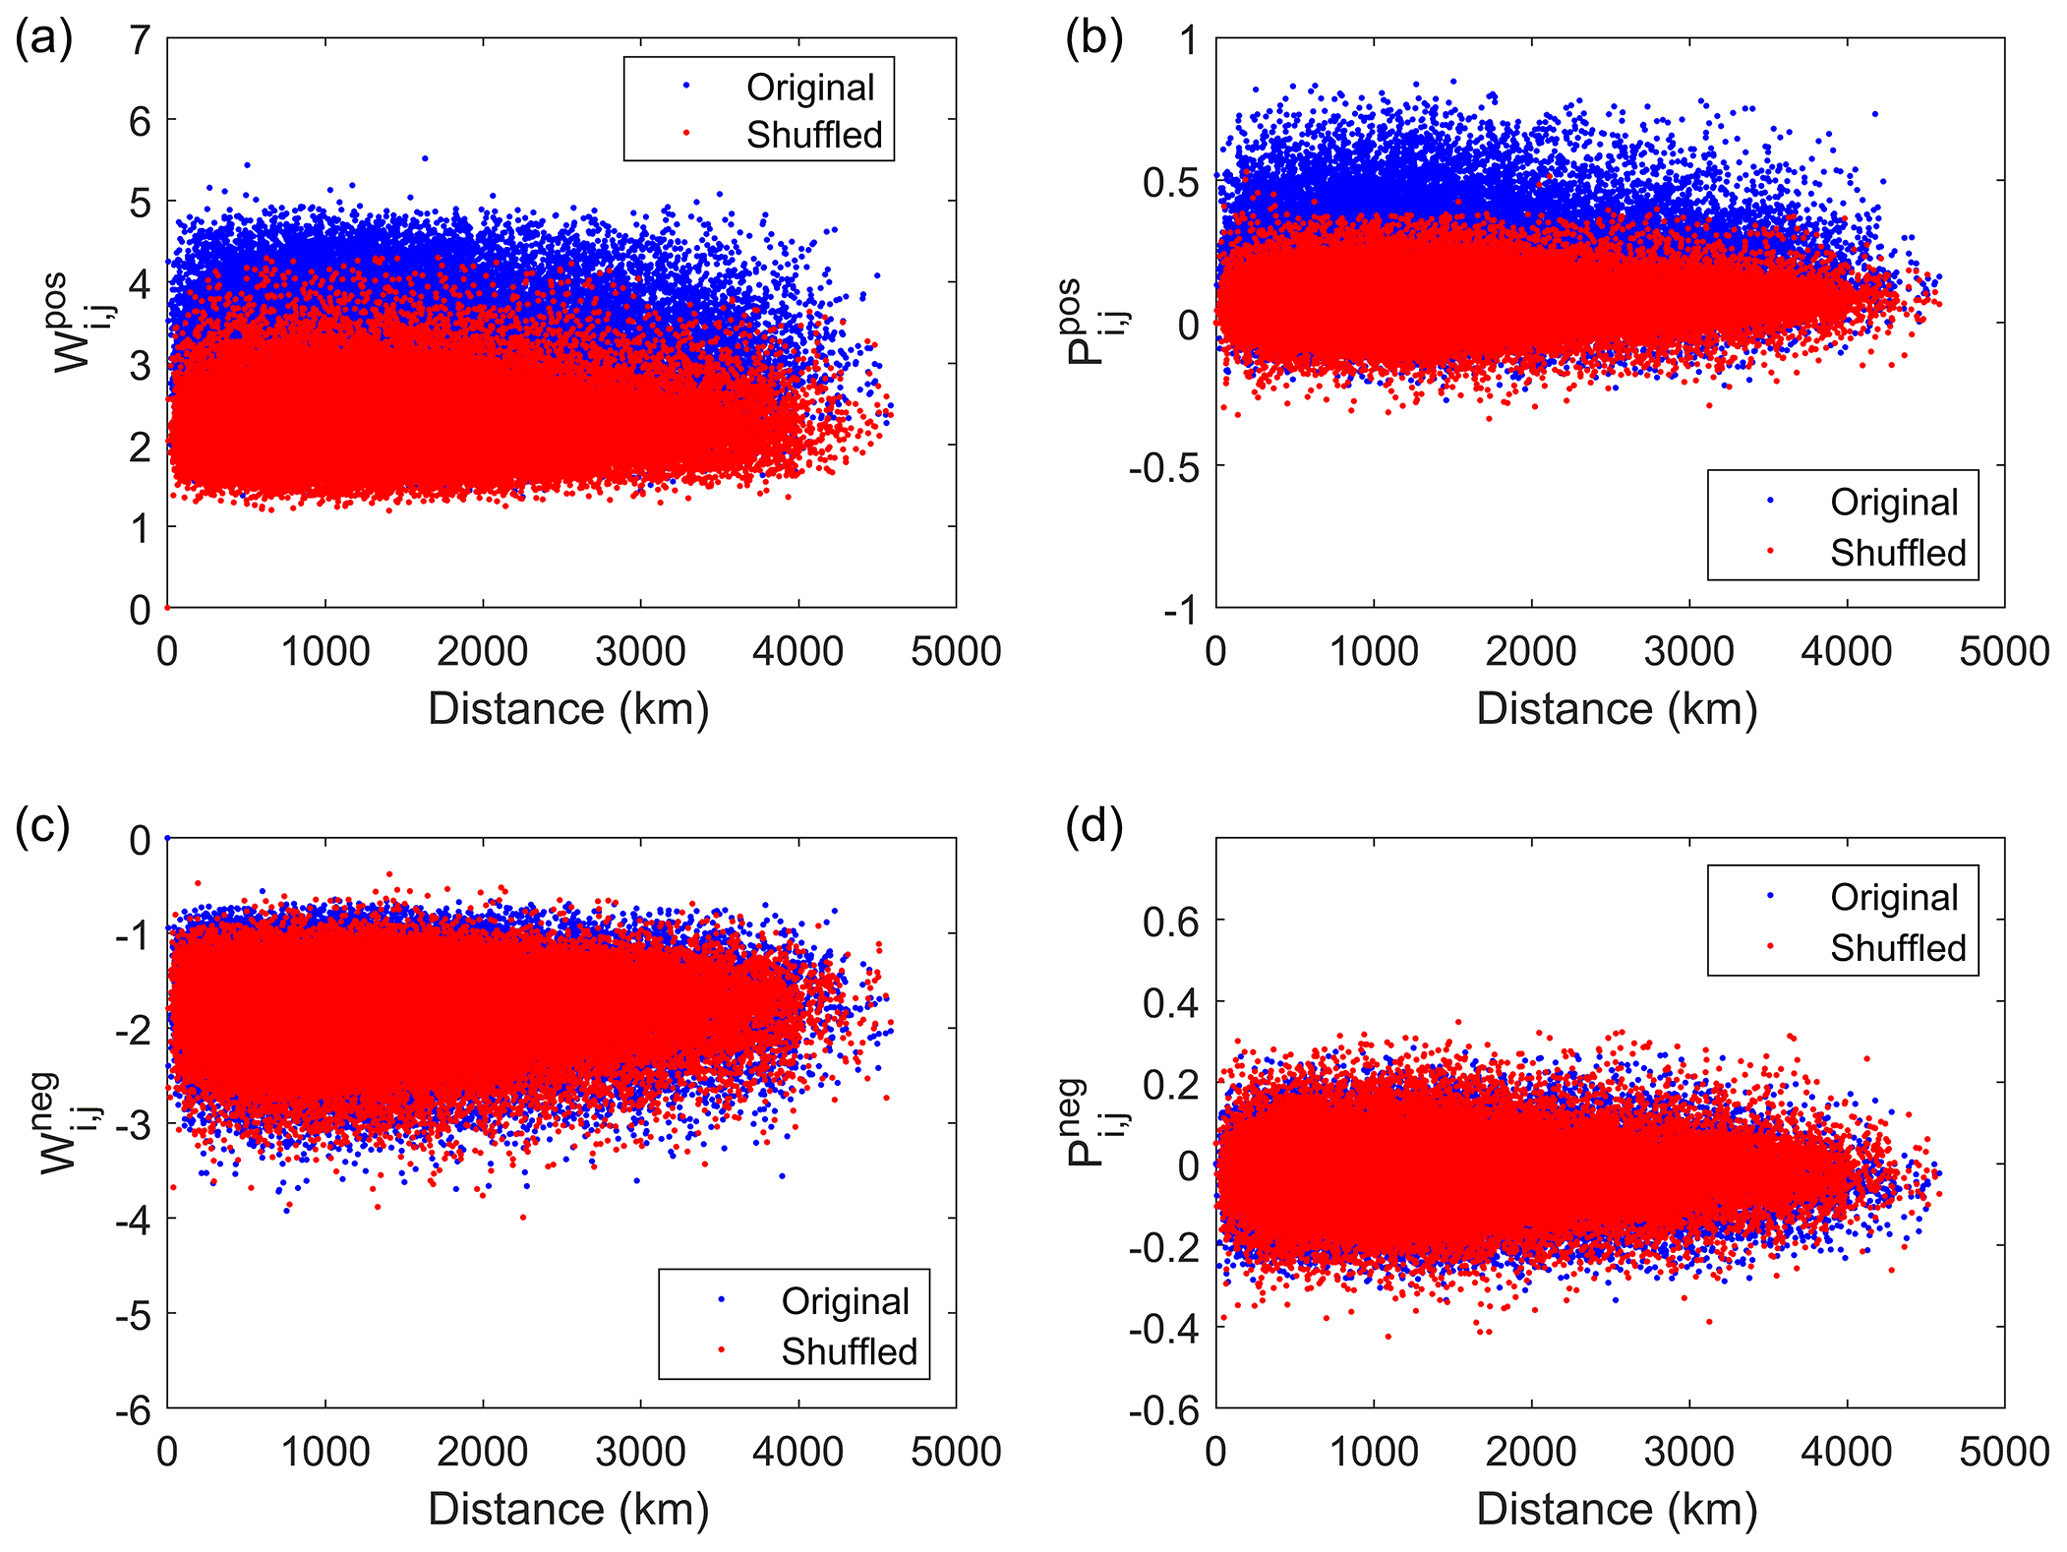
Figure 2Positive link weights as a function of geographical distances Di,j for (a) and (b) for real (blue) and shuffled (red) data. Panels (c, d) are the same as panels (a, b) but for negative links.
The Girvan–Newman algorithm is used to explore regional division in the networks. In binary networks, the quality of community structure is typically measured by the modularity (Q) function (Newman, 2006). A high value of Q suggests a strong division of a network into clusters. Nodes in the same community may have the same properties. The Q in networks is defined as follows:
where ki and kj are the weight of node i and j, respectively, Ai,j is the adjacency matrix, δ is the membership function, and M is the number of edges.
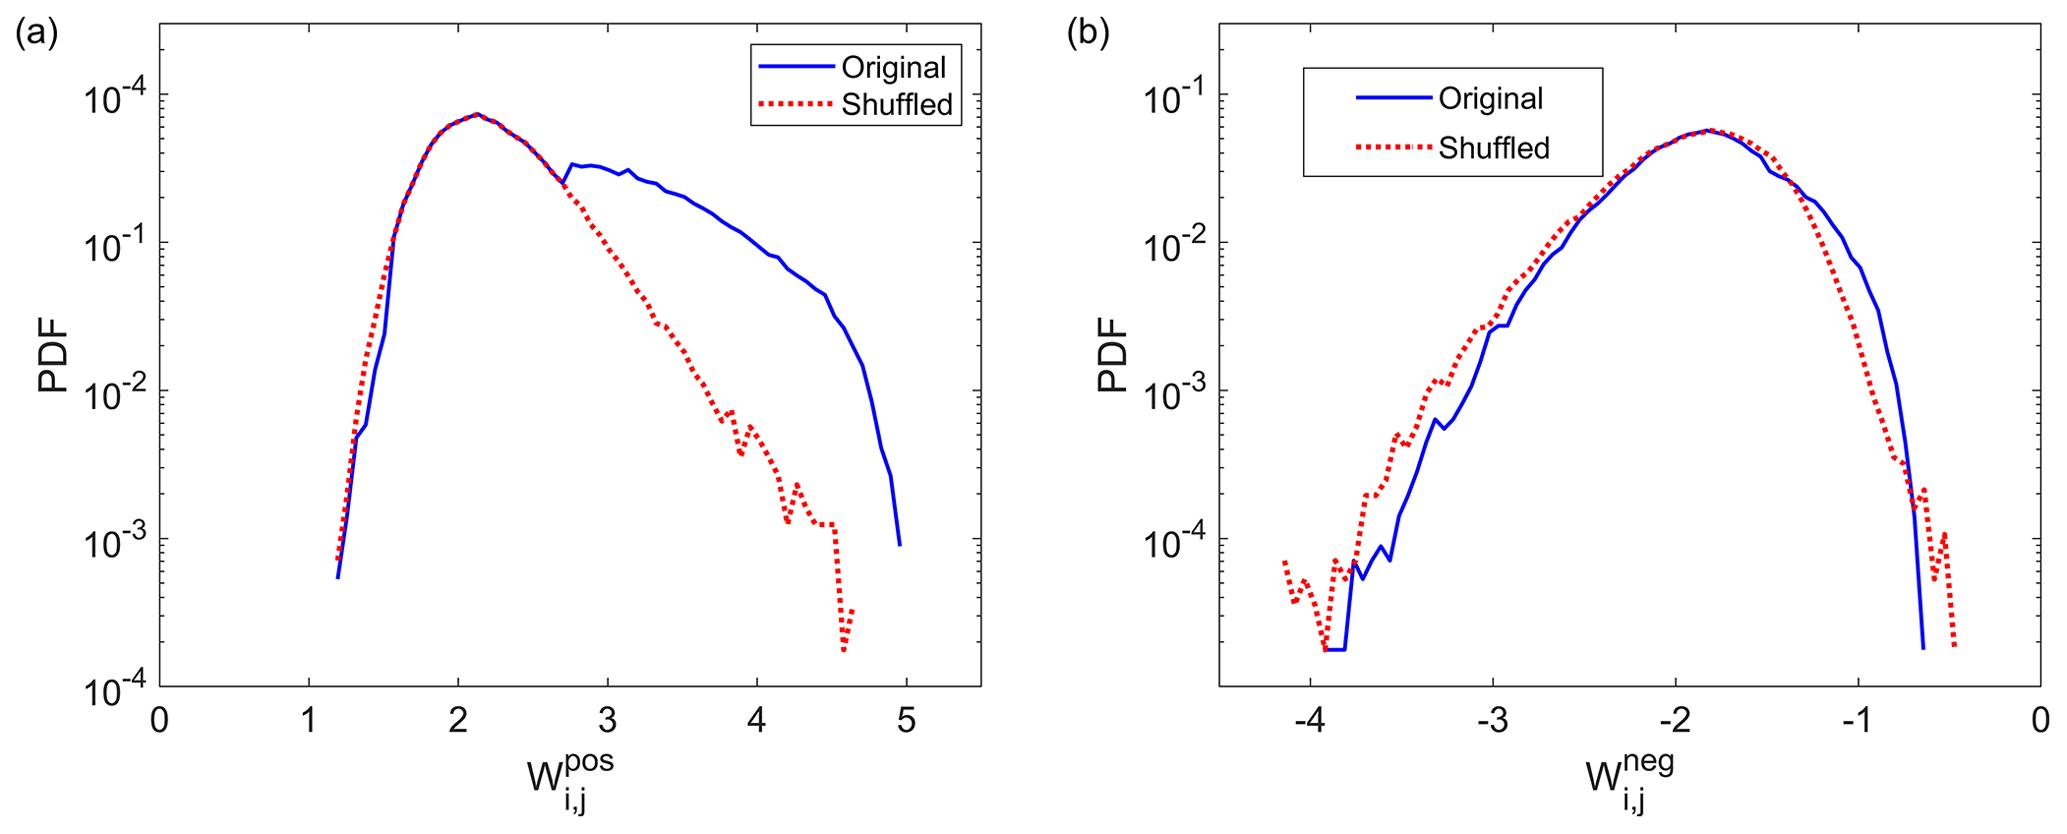
Figure 3PDF of positive (a) and negative (b) link weights for the original data and shuffled data. The blue lines represent the original data, and the dashed red lines denote the shuffled cases.

Figure 4(a) PDF for degree values (red dots) and the power law fit curve (black line). (b) PDF for weighted degrees (red dots) and the power law fit curve (black line). (c) PDF for edge lengths (km) (red dots) and the power law fit curve (black line).
3.1 Characteristics of the PM2.5 network
The function of positive link weights and geographical distances Di,j for the original and the shuffled networks are shown in Fig. 2a. values in the original network are greater than those in the shuffled network, indicating that the stronger positive links are the result of information transport of PM2.5 concentrations and the similarity of weather patterns (Liu et al., 2022). For the relation between the largest cross-correlation versus Di,j, we observe that the values in the shuffled case are smaller than those in the original case (Fig. 2b), which is in agreement with the pattern of . In the negative case (Fig. 2c and d), there is no distinct difference between the original network and the shuffled network.
Figure 3 shows the probability density function (PDF) of links in the original network and the shuffled network. The PDF of positive link weights has a long tail in the original data, which is not presented in the link weights of the shuffled networks. The PDF of negative link weights is a signature of random behavior, which further indicates that the many significant positive links are not likely to occur by chance. As a result, we consider links that are separated from the shuffled links. Both and can be used as a measure of the strength of links. In our analysis, positive link weights of 4.2 are the threshold and accordingly gain the adjacency matrix of the network.
In the network, 284 cities are connected by PM2.5 concentrations with 3930 links among cities. The clustering coefficient measures the probability that the adjacent nodes of a node are connected. If one city has a high clustering coefficient, there are close connections between its neighbors. In this paper, the clustering coefficient is 0.46. We also analyze the shuffled network with the same number of edges. A total of 337 cities are connected, and the value in the shuffled network is 0.07, suggesting that PM2.5 cities are more connected to each other. The density of networks is 0.05 in the original network, while the value is 0.03 in the shuffled network. It reflects the degree of completeness of the network, and high values mean strong connections between cities. The average path length is 3.15 and 4.61 for the original and shuffled network, indicating that cities transport the PM2.5 concentrations to other cities crossed almost three other cities. PM2.5 cities have a higher clustering coefficient and lower average path length compared with the shuffled network, demonstrating that cities with higher PM2.5 concentrations can quickly affect their surrounding cities.

Figure 5Distribution of in-weighted degree (a) and out-weighted degree (b) in the network of each node for positive cases.
The degree of a node is one of the most important statistical properties in networks. The weighted degree characterizes the total strength of correlation of the node with surrounding cities. The PDF of degrees, weighted degrees, and edge lengths of the nodes are shown in Fig. 4. It is found that the degrees, weighted degrees, and edge lengths conform to power law distributions that are associated with some climate and weather phenomena such as the tropical circulations and cyclones (Pierrehumbert, 1986). The power law exponents are 1.3, 1.2, and 1.5, with R2 values 0.71, 0.70, and 0.63, respectively. These links are heterogeneous, with few nodes possessing the majority of links in the network. Most of the PM2.5 concentration links remain confined to a handful of cities.

Figure 6Distribution of in-weighted degree (a) and out-weighted degree (b) in the network of each node for seasonal data.
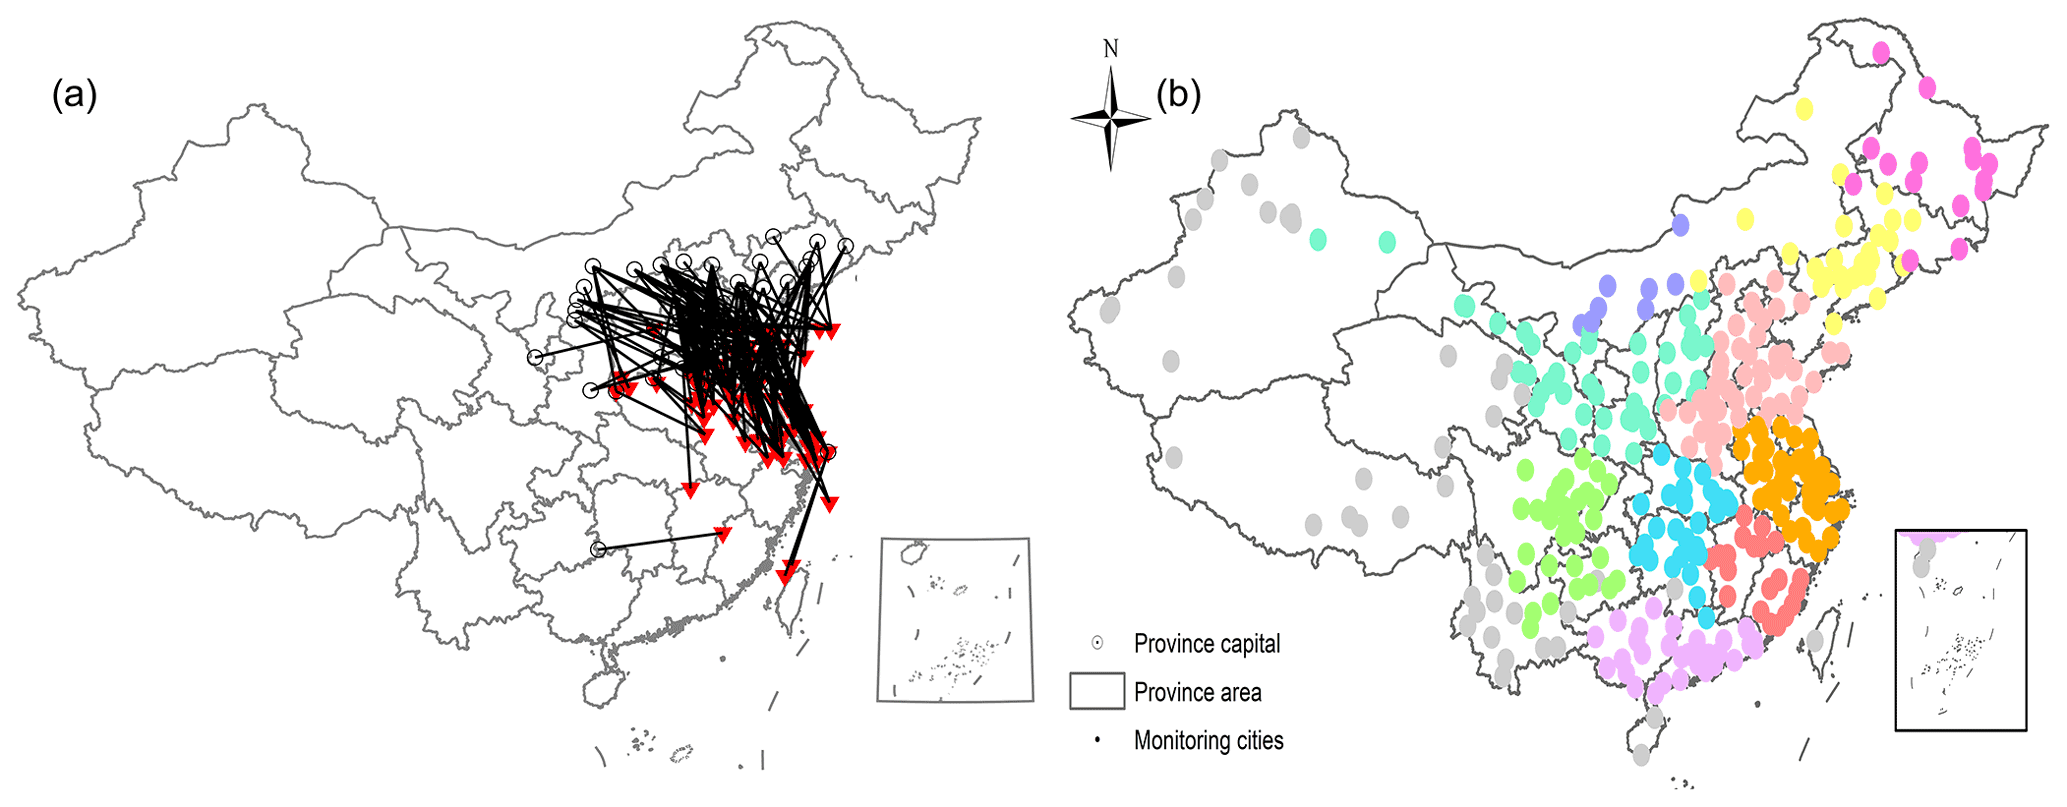
Figure 7(a) Map of PM2.5 transport links among the monitoring cities in China. (b) The cluster regions of PM2.5 concentrations. Different colors represent different communities.
To examine a node's dependence or influencing role on the other nodes, we analyze the patterns of in- and out-weighted degrees. The direction of links is determined by the sign of the time delay, which quantifies the incoming or outgoing nodes. Links with zero time delay represent bidirectional links. The in-weighted degree of each node measures incoming links towards the target city, and high values indicate a stronger export effect from source cities to the target city. Out-weighted degrees denote the strength of outgoing links to other cities, and higher values suggest that more cities transfer their PM2.5 concentrations to the target city. Figure 5 presents the spatial distribution of in- and out-weighted degrees for the whole-year datasets. Different colors represent the ability to transmit. The dark red indicates strong transmission capacity, while white indicates weak transmission capacity. Regions in the Beijing–Tianjin–Hebei–Henan–Shandong (BTHHS) region, YRD, and northwestern China show significant synchronicity with the rest of the provinces in terms of PM2.5 mass concentrations. These regions correspond to regions with high mean PM2.5 concentrations. Furthermore, we observe that the distribution of the in-weighted degree is similar to that of the out-weighted degree, which indicates that these cities are both recipients and senders in the networks. This suggests that their pollution is not only due to the local emissions but also imported from other cities. Therefore, solving air pollution should not only rely on reducing emissions in a single city but also on developing inter-city cooperation. Compared with the out-weighted degrees, in-weighted degrees are stronger over the BTHHS region. These cities (sending cities) can also export PM2.5 concentrations to other cities (recipient cities). In addition, the values of in- and out-weighted degrees display remarkable differences in different seasons, as shown in Fig. 6. The weighted degrees in summer and autumn are small (Fig. 7b and c). In winter and spring, the values of in- and out-weighted degrees are significant (especially in wintertime), and their patterns are similar to that of the whole year.
3.2 Routes and clustering of the PM2.5
Both in- and out-weighted degrees offer information in terms of nodes (cities). It is reported that urban air quality can be substantially influenced by atmospheric transport of PM2.5 pollution from distant cities. An analysis of the edges can contribute to revealing the transport routes of PM2.5 among cities. A recent study found that PM2.5 concentrations over a distance of 1000 km were related to a typical cyclonic scale within the Rossby waves (Zhang et al., 2019). Here we discuss the transport path within 1000 km and only focus on positive time lags. This is since they are typical links that are related to different climate processes, and they thus enable detailed comparisons with the previous literature. The transport routes show that southward propagation is predominant in the sub-network (Fig. 7a; Zhang and Cao, 2015). We focus on two groups of connections that belong to different regions. The first group is made up of links that traveled from the Gobi Desert over southwestern parts of Mongolia and the Badain Jaran Desert to the BTH region. The second group is made up of links transported from the BTHHS region to the YRD region, and these links show a 1 or 2 d time lag. This is consistent with previous studies obtained from the WRF-Chem model (Huang et al., 2020). The outbreak of YRD pollution usually peaks with a time lag of 1–2 d after that in the BTHHS region.
In addition, we also analyzed the transport routes in different seasons (Fig. 8). The transport routes are significant in autumn and winter, especially in wintertime. It means the route features in winter are dominant over the whole year. Here the southwestern links may be related to the East Asian winter monsoon.
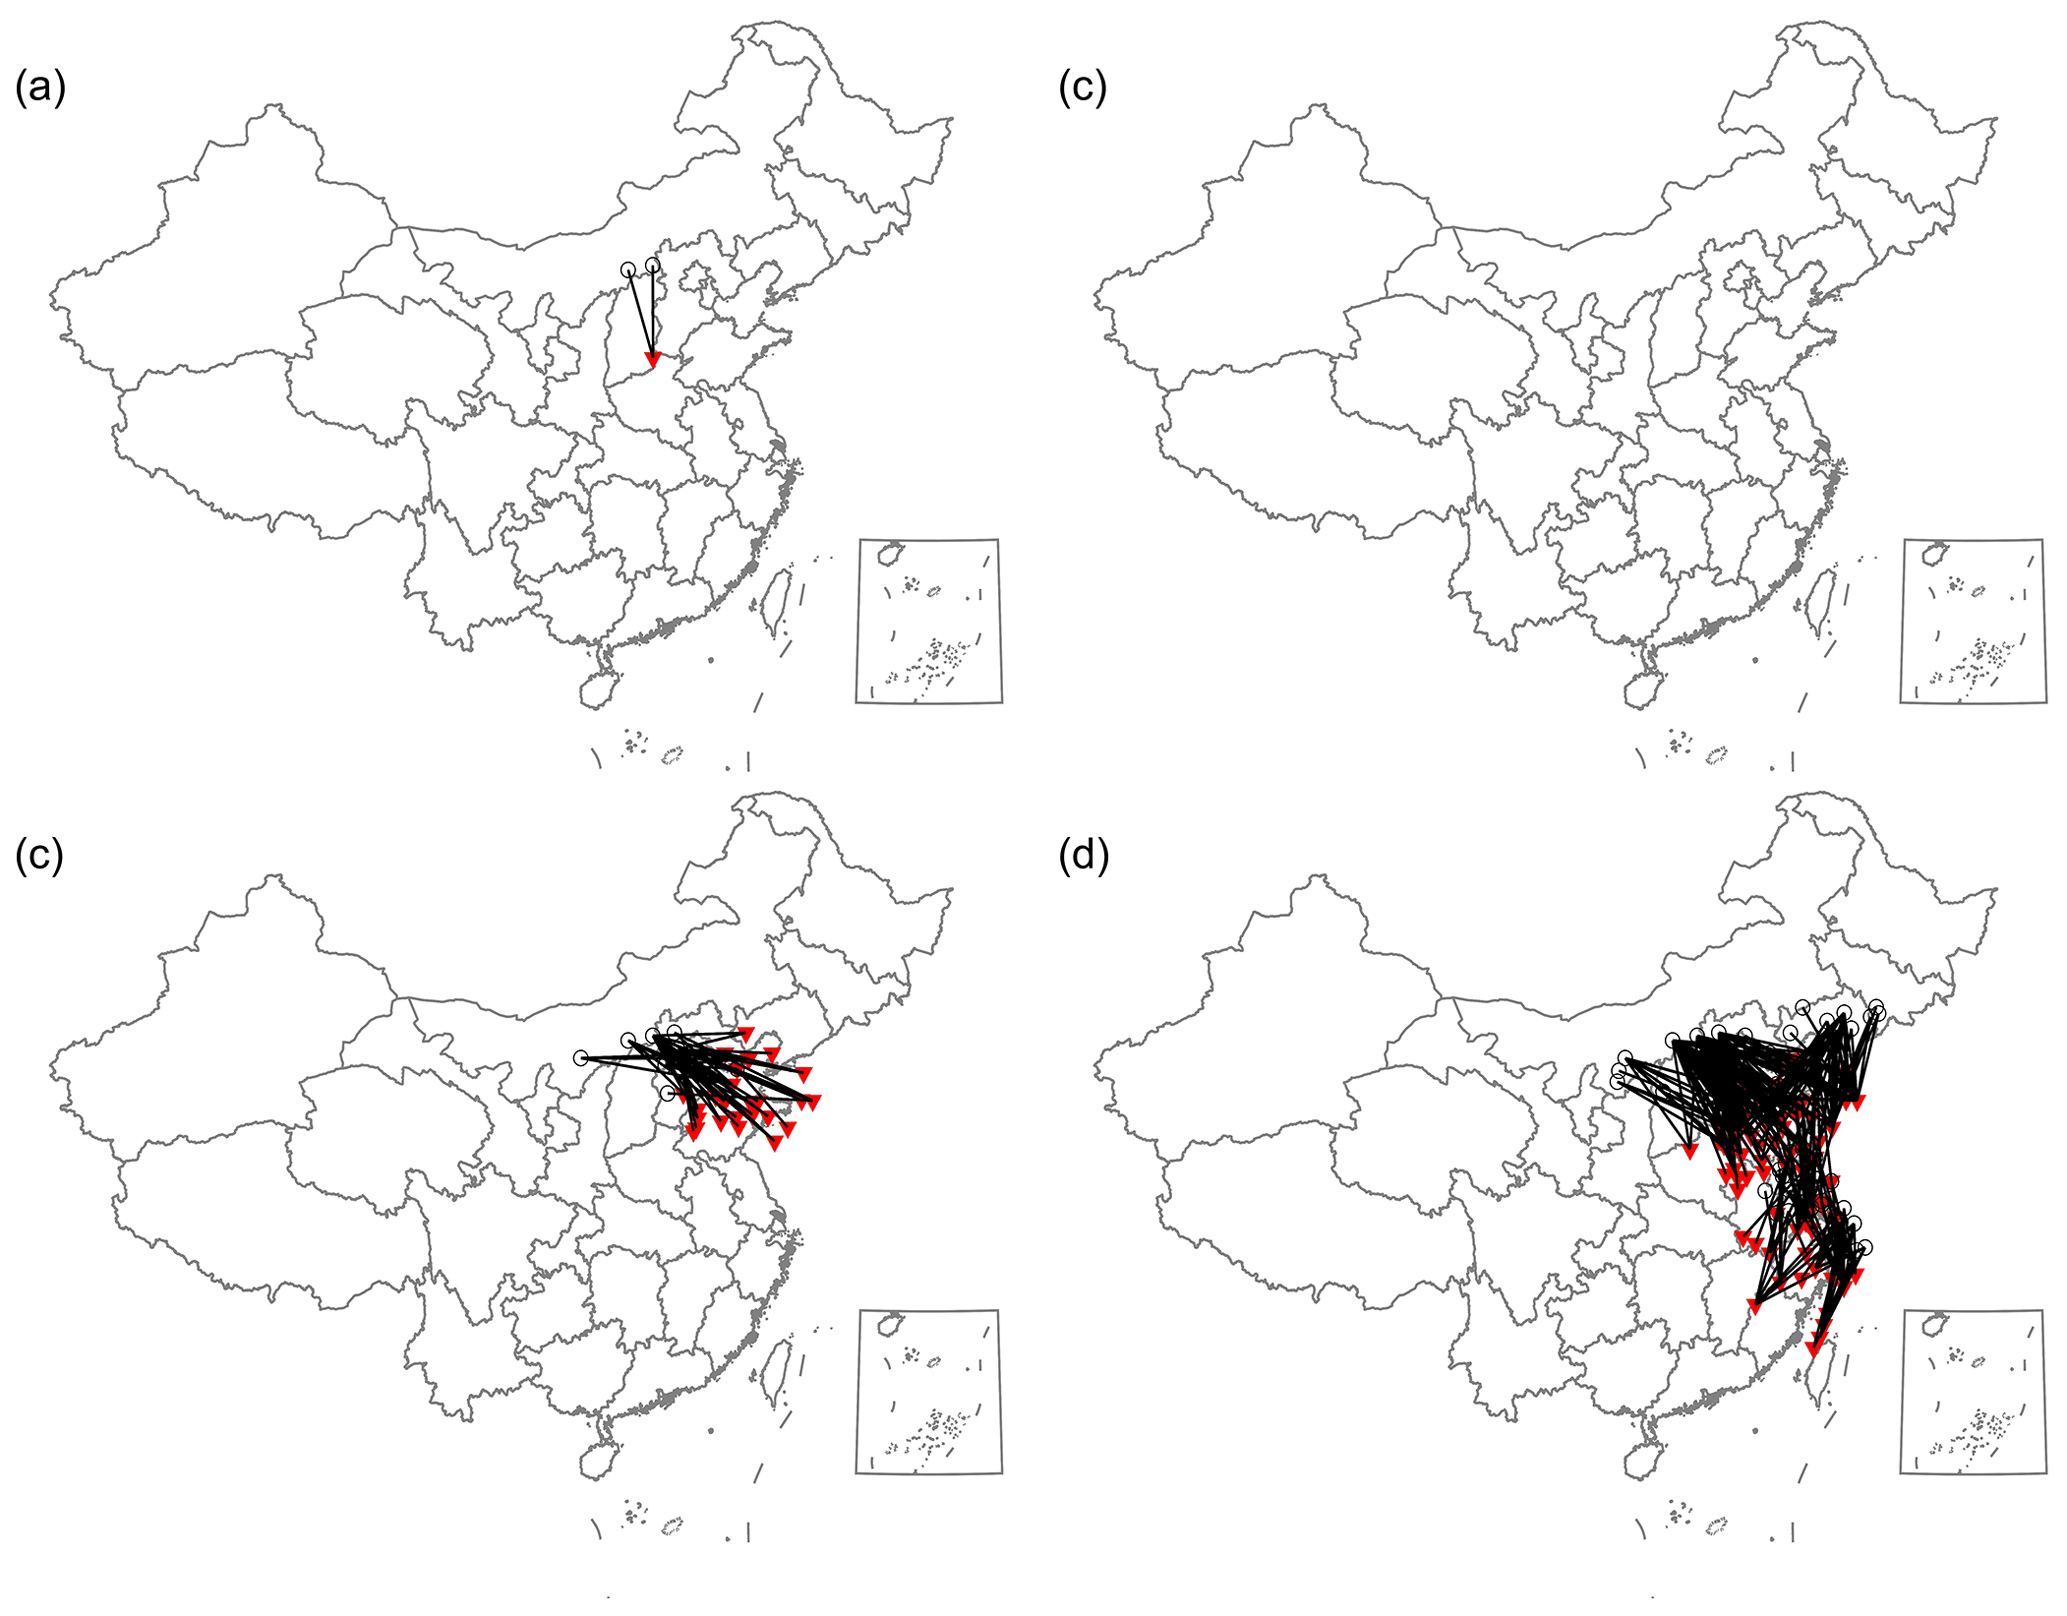
Figure 8Distribution of transport paths in the network for spring (a), summer (b), autumn (c), and winter (d).
In complex networks, nodes that are closely related to each other are more likely to be grouped in the same cluster. Hence, cities are tightly bound to cities in the same cluster and uncorrelated to cities in other clusters. The pollution transport routes presented above indicate that curbing air pollution is more than just a local issue. In the following, we investigate the cluster features of our networks by utilizing the modularity algorithm described above. Considering a larger Q value means a more accurate community structure for network segmentation, we calculate the Q value at each division to obtain a better result. Here, 284 cities are divided into 9 clusters, where the Q value obtains the maximum value (0.56). The results present a strong regional character, as shown in Fig. 7b. Cities that have the same color represent the same cluster, which could be considered for collaborative governance. These nine regions include the above-mentioned three key regions: the BTH region, YRD region (containing Shanghai, Jiangsu, Anhui, and Zhejiang province), and PRD region (including Guangdong and Guangxi). The other interconnected areas are Heilongjiang and Jilin provinces; Jilin and Liaoning provinces (northeastern China); Hunan and Hubei provinces (central China); Jiangxi and Fujian provinces; Guizhou, Chongqing, and Sichuan provinces; and Shanxi, Shaanxi, Ningxia, and Gansu provinces.
By constructing PM2.5 networks based on complex network approaches, it is found that the PDF of the degrees, weighted degrees, and edge lengths of PM2.5 cities follow a power law distribution, which indicates that the variability of PM2.5 concentrations in China is not random. Hence, it is reasonable to analyze the transmission and cooperation regions of PM2.5 from the perspective of the whole national evolution over a long period of time. To quantify the relations of PM2.5 among cities, the patterns of weighted degrees are investigated. Higher weighted degrees are observed in the BTH region, which is consistent with the patterns of high levels of PM2.5 concentrations. Cites in the BTH region have stronger strength to export their PM2.5 pollution to other cities. The distributions of weighted degrees exhibit significant differences in seasons, with the largest being in winter and the smallest being in summer.
Based on the PM2.5 networks, the transport links and collaborative regions are analyzed. This showed that many links traveled from the Gobi Desert over southwestern parts of Mongolia and the Badain Jaran Desert to the BTH region. The other group extends southward from the BTH region to the YRD region and then further south to Fujian province with a 1 or 2 d time lag. This is consistent with previous studies obtained from the WRF-Chem model (Huang et al., 2014). Although we get a similar transmission pattern in winter, it possesses a stronger intensity. We demonstrate that this is possibly due to the influence of cold fronts, which exactly disperse the PM2.5 accumulated in the North China Plain to the YRD region, which leads to the propagation of PM2.5 from the BTH region to the YRD region. Hence, links between the BTH region and the YRD region obtained over the whole year are related to the cold front occurring in wintertime.
In addition, we created a community detection dataset based on the synchronicity of PM2.5 concentrations and obtained nine clusters. Cities in the same regions should join together to control air pollution. This result provides theoretical support for the Joint Prevention and Control of Air Pollution (JPCAP) proposed by the national government. Regional cooperation should be promoted in these regions to implement regional policies to improve air quality.
A central implication of this study is that the transmission and collaborative regions can be explored via the complex network approach. For traditional model simulation, numerous parameters are needed in the simulation process. In contrast, complex network theory is performed based on time series of field observations, so the estimation process is faster and more economical. As our analysis is based on long-time PM2.5 records in China rather than a particular region or period of air pollution, it may provide a reference and basis for the development of effective regulatory policies produced by the government to improve air quality. Previous researchers have demonstrated that the accumulated pollutants in the North China Plain can transport the pollution via strong winds to the YRD region based on traditional model simulation, which is similar to our study. We also observed that links that were transported from the BTHHS region to the YRD region show a 1 or 2 d time lag. The result is consistent with previous studies obtained from the WRF-Chem model. Hence, complex network methodologies are useful for the studies of the transport and clustering of air pollutants in faster and more economical ways. Furthermore, there is also potential for the study of other air pollutants, such as ozone and NOx.
In addition, the study has some limitations. The relationships between PM2.5 cities have been measured based on the lagged correlations, which have yielded useful results. However, the peak of cross-correlation in a correlogram may be spurious due to serial autocorrelation within each time series, which is another common feature in geophysical time series. Furthermore, the results cannot reveal causal relationships, which may suffer from problems related to interpretability.
The codes in this study were produced with MATLAB (https://ww2.mathworks.cn/; The Mathworks, 2022) and are publicly available on Figshare (https://doi.org/10.6084/m9.figshare.15141528; Ying, 2021).
The study is based on publicly available datasets, as described in Sect. 2. Model and analysis scripts and outputs are available upon request from the corresponding author. The daily PM2.5 concentration data were downloaded from the China National Environmental Monitoring Centre (CNEMC) at https://air.cnemc.cn:18007 (CNEMC, 2022).
NY developed the research idea, developed the model, and performed the analysis. All authors discussed the results and contributed to the writing of the paper.
The contact author has declared that neither they nor their co-authors have any competing interests.
Publisher's note: Copernicus Publications remains neutral with regard to jurisdictional claims in published maps and institutional affiliations.
This study is supported by Budget Surplus of Central Financial Science and Technology Plan (grant no. 2021-JY-15) and National Key Research and Development Program of China (grant no. 2019YFC0214201).
This paper was edited by Ben Kravitz and reviewed by two anonymous referees.
Boers, N., Goswami, B., Rheinwalt, A., Bookhagen, B., Hoskins, B., and Kurths, J.: Complex networks reveal global pattern of extreme-rainfall teleconnections, Nature, 566, 373–377, https://doi.org/10.1038/s41586-018-0872-x, 2019.
Cai, S., Wang, Y., Zhao, B., Wang, S., Chang, X., and Hao, J.: The impact of the “Air Pollution Prevention and Control Action Plan” on PM2.5 concentrations in Jing-Jin-Ji region during 2012–2020, Sci. Total. Environ., 580, 197–209, https://doi.org/10.1016/j.scitotenv.2016.11.188, 2017.
Castrejon-Pita, A. A. and Read, P. L.: Synchronization in a Pair of Thermally Coupled Rotating Baroclinic Annuli: Understanding Atmospheric Teleconnections in the Laboratory, Phys. Rev. Lett., 104, 204501, https://doi.org/10.1103/PhysRevLett.104.204501, 2010.
CNEMC – China National Environmental Monitoring Centre: Real-time National Air Quality, https://air.cnemc.cn:18007, last access: 19 June 2022.
Ding, A. J., Huang, X., Nie, W., Sun, J. N., Kerminen, V. -M., Petaja, T., Su, H., Cheng, Y. F., Yang, X.-Q., Wang, M. H., Chi, X. G., Wang, J. P., Virkkula, A., Guo, W. D., Yuan, J. Wang, S. Y., Zhang, R. J., Wu, Y. F., Song, Y. Zhu, T., Zilitinkevich, S. Kulmala, M., and Fu, C. B.: Enhanced haze pollution by black carbon in megacities in China, Geophys. Res. Lett., 43, 2873–2879, https://doi.org/10.1002/2016GL067745, 2016.
Feldhoff, J. H., Lange, S., Volkholz, J., Donges, J. F., Kurths, J., and Gerstengarbe, F.-W.: Complex networks for climate model evaluation with application to statistical versus dynamical modeling of South American climate, Clim. Dynam., 44, 1567–1581, https://doi.org/10.1007/s00382-014-2182-9, 2015.
Fountalis, I., Bracco, A., and Dovrolis, C.: Spatio-temporal network analysis for studying climate patterns, Clim. Dynam., 42, 879–899, https://doi.org/10.1007/s00382-013-1729-5, 2014.
Gozolchiani, A., Havlin, S., and Yamasaki, K.: Emergence of El Nino as an autonomous component in the climate network, Phys. Rev. Lett., 107, 148501, https://doi.org/10.1103/PhysRevLett.107.148501, 2011.
Guez, O., Gozolchiani, A., Berezin, Y., Brenner, S., and Havlin, S.: Climate network structure evolves with North Atlantic Oscillation phases, Europhys. Lett., 98, 38006, https://doi.org/10.1209/0295-5075/98/38006, 2012.
Guez, O. C., Gozolchiani, A., and Havlin, S.: Influence of autocorrelation on the topology of the climate network, Phys. Rev. E, 90, 29–38, https://doi.org/10.1103/PhysRevE.90.062814, 2014.
Huang, R.-J., Zhang, Y., Bozzetti, C., Ho, K.-F., Cao, J.-J., Han, Y., Daellenbach, K. R., Slowik, J. G., Platt, S. M., Canonaco, F., Zotter, P., Wolf, R., Pieber, S. M., Bruns, E. A., Crippa, M., Ciarelli, G., Piazzalunga, A., Schwikowski, M., Abbaszade, G., Schnelle-Kreis, J., Zimmermann, R., An, Z., Szidat, S., Baltensperger, U., Haddad, I. E., and Prévôt, A. S. H.: High secondary aerosol contribution to particulate pollution during haze events in China, Nature, 514, 218–222, https://doi.org/10.1038/nature13774, 2014.
Huang, X., Ding, A., Wang, Z., Ding, K., Gao, J., Chai, F., and Fu, C.: Amplified transboundary transport of haze by aerosolboundary layer interaction in China, Nat. Geosci., 13, 428–434, https://doi.org/10.1038/s41561-020-0583-4, 2020.
Khuzestani, R. B., Schauer, J. J., Wei, Y., Zhang, L., Cai, T., Zhang, Y., and Zhang, Y.: Quantification of the sources of long-range transport of PM2.5 pollution in the Ordos region, Inner Mongolia, China, Environ. Pollut., 229, 1019–1031, https://doi.org/10.1016/j.envpol.2017.07.093, 2017.
Li, H., Qi, Y., Li, C., and Liu, X.: Routes and clustering features of PM2.5 spillover within the Jing-Jin-Ji region at multiple timescales identified using complex network-based methods, J. Clean. Prod., 209, 1195–1205, https://doi.org/10.1016/j.jclepro.2018.10.284, 2019.
Li, P., Yan, R., Yu, S., Wang, S., Liu, W., and Bao, H.: Reinstate regional transport of PM2.5 as a major cause of severe haze in Beijing, P. Natl. Acad. Sci. USA, 112, E2739–E2740, https://doi.org/10.1073/pnas.1502596112, 2015.
Liang, C. S., Duan, F. K., He, K. B., and Ma, Y. L.: Review on recent progress in observations, source identifications and countermeasures of PM2.5, Environ. Int., 86, 150–170, https://doi.org/10.1016/j.envint.2015.10.016, 2016.
Liao, T., Wang, S., Ai, J., Gui, K., Duan, B., Zhao, Q., Zhang, X., Jiang, W., and Sun, Y.: Heavy pollution episodes, transport pathways and potential sources of PM2.5 during the winter of 2013 in Chengdu (China), Sci. Total Environ., 584, 1056–1065, https://doi.org/10.1016/j.scitotenv.2017.01.160, 2017.
Liu, X., Zhu, B., Zhu, T., and Liao, H.: The seesaw pattern of PM2.5 interannual anomalies between Beijing-Tianjin-Hebei and Yangtze River Delta across eastern China in winter, Geophys. Res. Lett., 49, e2021GL095878, https://doi.org/10.1029/2021GL095878, 2022.
Ludescher, J., Gozolchiani, A., Bogachev, M. I., Bunde, A., Havlin, S., and Schellnhuber, H. J.: Improved El Nino forecasting by cooperativity detection, P. Natl Acad. Sci. USA, 110, 11742–11745, https://doi.org/10.1073/pnas.1309353110, 2013.
Ludescher, J., Gozolchiani, A., Bogachev, M. I., Bunde, A., Havlin, S., and Schellnhuber, H. J.: Very early warning of next El Nino, P. Natl Acad. Sci. USA, 111, 2064–2066, https://doi.org/10.1073/pnas.1323058111, 2014.
Malm, A. and Hornborg, A.: The Geology of Mankind? A Critique of the Anthropocene Narrative, Anthropocene Rev., 1, 62–69, https://doi.org/10.1177/2053019613516291, 2014.
MEP: The 12th Five-Year Plan on Air Pollution Prevention and Controlin Key Regions, https://www.mee.gov.cn/gkml/hbb/bwj/201212/t20121205_243271.htm, last access: 29 October 2012.
Newman, M. E. J.: Modularity and community structure in networks, P. Natl. Acad. Sci. USA, 103, 8577–8582, https://doi.org/10.1073/pnas.0601602103, 2006.
Pierrehumbert, R. T.: Spatially amplifying modes of the Charney baroclinic-instability problem, J. Fluid Mech., 170, 293–317, https://doi.org/10.1017/s0022112086000897, 1986.
Rafael, C. C., Javier, G. G., Ariza-Villaverde, A. B., de Gutierrez, R. E., and Jimenez-Hornero, F. J.: Can complex networks describe the urban and rural tropospheric O3 dynamics?, Chemosphere, 230, 59–66, https://doi.org/10.1016/j.chemosphere.2019.05.057, 2019.
Sheehan, P., Cheng, E., English, A., and Sun, F.: China's response to the air pollution shock, Nat. Clim. Change, 4, 306–309, https://doi.org/10.1038/nclimate2197, 2014.
Squizzato, S., Masiol, M., Innocente, E., Pecorari, E., Rampazzo, G., and Pavoni, B.: A procedure to assess local and long-range transport contributions to PM2.5 and secondary inorganic aerosol, J. Aerosol Sci., 46, 64–76, https://doi.org/10.1016/j.jaerosci.2011.12.001, 2012.
Steffen, W., Broadgate, W., Deutsch, L., Gaffney, O., and Ludwig, C.: The trajectory of the Anthropocene: The Great Acceleration, Anthropocene Rev., 2, 81–98, https://doi.org/10.1177/2053019614564785, 2015.
Steffen, W., Richardson, K., Rockström, J., Schellnhuber, H. J., Dube, O. P., Dutreuil, S., Lenton, T. M., and Lubchenco, J.: The emergence and evolution of Earth System Science, Nat. Rev. Earth Environ., 1, 54–63, https://doi.org/10.1038/s43017-019-0005-6, 2020.
The Mathworks: MATLAB, https://ww2.mathworks.cn, last access: 19 June 2022.
Wang, Y., Gozolchiani, A., Ashkenazy, Y., Berezin, Y., Guez, O., and Havlin, S.: Dominant Imprint of Rossby Waves in the Climate Network, Phys. Rev. Lett., 111, 138501, https://doi.org/10.1103/PhysRevLett.111.138501, 2013.
Wang, Y., Qi, Y., Hu, J., and Zhang, H.: Spatial and temporal variations of six criteria air pollutants in 31 provincial capital cities in China during 2013–2014, Environ. Int., 73, 413–422, https://doi.org/10.1016/j.envint.2014.08.016, 2014.
Wyatt, M. G., Kravtsov, S., and Tsonis, A. A.: Atlantic Multidecadal Oscillation and Northern Hemisphere's climate variability, Clim. Dynam., 38, 929–949, https://doi.org/10.1007/s00382-011-1071-8, 2012.
Yamasaki, K., Gozolchiani, A., and Havlin, S.: Climate networks around the globe are significantly affected by El Nino, Phys. Rev. Lett., 100, 228501, https://doi.org/10.1103/PhysRevLett.100.228501, 2008.
Ying, N.: Complex network methodology for analysis of the transport and clustering of PM2.5 concentrations, figshare [code], https://doi.org/10.6084/m9.figshare.15141528, 2021.
Ying, N., Zhou, D., Chen, Q., Ye, Q., and Han, Z.: Long-term link detection in the CO2 concentration climate network, J. Clean Prod., 208, 1403–1408, https://doi.org/10.1016/j.jclepro.2018.10.093, 2019.
Ying, N., Zhou, D., Han, Z. G., Chen, Q. H., Ye, Q., and Xue, Z. G.: Rossby Waves Detection in the CO2 and Temperature Multilayer Climate Network, Geophys. Res. Lett., 47, e2019GL086507, https://doi.org/10.1029/2019GL086507, 2020.
Zhang, Q., Jiang, X., Tong, D., Davis, S. J., Zhao, H., Geng, G., Feng, T., Zheng, B., Lu, Z., Streets, D. G., Ni, R., Brauer, M., van Donkelaar, A., Martin, R. V., Huo, H., Liu, Z., Pan, D., Kan, H., Yan, Y., Lin, J., He, K., and Guan, D.: Transboundary health impacts of transported global air pollution and international trade, Nature, 543, 705—709, https://doi.org/10.1038/nature21712, 2017.
Zhang, Y. L. and Cao, F.: Fine particulate matter (PM2.5) in China at a city level, Sci. Rep., 5, 14884, https://doi.org/10.1038/srep14884, 2015.
Zhang, Y., Chen, D., Fan, J., Havlin, S., and Chen, X.: Correlation and scaling behaviors of fine particulate matter (PM2.5) concentration in China, Europhys. Lett., 122, 58003, https://doi.org/10.1209/0295-5075/122/58003, 2018.
Zhang, Y., Fan, J., Chen, X., Ashkenazy, Y., and Havlin, S.: Significant Impact of Rossby Waves on Air Pollution Detected by Network Analysis, Geophys. Res. Lett., 46, 12476–12485, https://doi.org/10.1029/2019GL084649, 2019.
Zhou, D., Gozolchiani, A., Ashkenazy, Y., and Havlin, S.: Teleconnection Paths via Climate Network Direct Link Detection, Phys. Rev. Lett., 115, 268501, https://doi.org/10.1103/PhysRevLett.115.268501, 2015.