the Creative Commons Attribution 4.0 License.
the Creative Commons Attribution 4.0 License.
 | 01 Apr 2020
Intensification of the hydrological cycle expected in West Africa over the 21st century
Stella Todzo
Adeline Bichet
Arona Diedhiou
This study uses the high-resolution outputs of the recent CORDEX-Africa climate projections to investigate the future changes in different aspects of the hydrological cycle over West Africa. Over the twenty-first century, temperatures in West Africa are expected to increase at a faster rate (+0.5 ∘C per decade) than the global average (+0.3 ∘C per decade), and mean precipitation is expected to increase over the Guinea Coast (+0.03 mm d−1 per decade) but decrease over the Sahel (−0.005 mm d−1 per decade). In addition, precipitation is expected to become more intense (+0.2 mm d−1 per decade) and less frequent (−1.5 d per decade) over all of West Africa as a result of increasing regional temperature (precipitation intensity increases on average by +0.35 mm d−1 ∘C−1 and precipitation frequency decreases on average by −2.2 d ∘C−1). Over the Sahel, the average length of dry spells is also expected to increase with temperature (+4 % d ∘C−1), which increases the likelihood for droughts with warming in this subregion. Hence, the hydrological cycle is expected to increase throughout the twenty-first century over all of West Africa, on average by +11 % ∘C−1 over the Sahel as a result of increasing precipitation intensity and lengthening of dry spells, and on average by +3 % ∘C−1 over the Guinea Coast as a result of increasing precipitation intensity only.
- Article
(3127 KB) - Full-text XML
-
Supplement
(447 KB) - BibTeX
- EndNote


It is now established that global warming will result from enhanced anthropogenic greenhouse gases (e.g., Collins et al., 2013). Such a warming is expected to affect precipitation and its variability, especially drought and flood episodes, in both the tropics and the subtropics (Zwiers et al., 2013; Giorgi et al., 2014). Over West Africa, previous studies (Collins et al., 2013; Diedhiou et al., 2018; Bichet et al., 2019) have shown that the warming is expected to occur at a faster rate than the global average (+0.5 vs. +0.3 ∘C per decade). Future changes in precipitation however are still unclear (e.g., Collins et al., 2013; Sylla et al., 2016; Bichet et al., 2020). Nevertheless, future changes in precipitation extremes are expected in some subregions, such as an increase in the maximum length of dry spells over West Sahel (Sylla et al., 2016; Diedhiou et al., 2018) and an intensification of extreme rainfall over the Guinea Coast (Diedhiou et al., 2018). Particularly relevant for agriculture, changes in precipitation are also projected during the growing season, expected to become shorter, as torrid, arid, and semiarid climate conditions are expected to extend (Sylla et al., 2016). Such conditions can produce significant stresses on agricultural activities, water resources management, ecosystem services, and urban area planning over West Africa, a region that is already highly vulnerable to climate variability. However, whereas previous studies project important changes in the precipitation, very little is known about the role of future warming and the processes involved.
Global distribution of tropospheric moisture and precipitation is highly complex, but there is one clear and strong control: moisture condensates out of supersaturated air. Assuming that relative humidity would remain roughly constant under global warming, the Clausius–Clapeyron relationship implies that specific humidity would increase exponentially with temperature, at a rate of about 6.5 % ∘C−1 (e.g., Allen and Ingram, 2002). Assuming no change in the evapotranspiration, a warmer atmosphere is thus expected to be able to hold more moisture before reaching saturation, thereby taking more time to reach saturation (longer periods of dryness between two rainy episodes), and releasing more water when moisture does condensate (intensification of the precipitation). Within this integrated view, Giorgi et al. (2011) introduced a single index (HY-INT) that quantitatively combines measures of precipitation intensity and dry-spell length, thereby providing an overall metric of hydroclimatic intensity.
To better understand the future impact of the warming on the hydrological cycle in the different subregions of West Africa, this study uses the state-of-the-art, high-resolution projections of the recent CORDEX-Africa (Giorgi et al., 2009; Jones et al., 2011; Hewitson et al., 2012; Kim et al., 2014) experiments to investigate, over the twenty-first century, the future changes in different aspects of the hydrological cycle and their relationship with regional temperatures. After describing the methodology (Sect. 2), the expected changes in temperature, precipitation, precipitation intensity, dry spells, wet spells, and HY-INT are identified (Sect. 3.1), before their relationship with regional temperature is quantified (Sect. 3.2). Section 4 discusses and concludes the study.
2.1 Methodology
We consider the three following subregions: West Sahel (10–20∘ N 18–10∘ W), Central Sahel (10–20∘ N 10–10∘ E), and Guinea Coast (5–10∘ N 10–10∘ E), shown as black boxes in Fig. 1a. We focus on annual values over the period 2006–2099. Following previous studies (Froidurot and Diedhiou, 2017; Bichet and Diedhiou, 2018a, b), we define a wet (dry) day using the threshold of 1 mm d−1. We define a dry spell as a sequence of 2 or more consecutive dry days that are preceded and followed by a wet day. Hence, the duration of a dry spell, as defined in our study, spans from 2 to 365 d. We compute the annual precipitation intensity (INT), number of wet days (RR1), maximum length of consecutive dry days (CDDs), and maximum length of consecutive wet days (CWDs) following the definition of the Expert Team of Climate Change Detection and Indices (ETCCDI; Zhang et al., 2011). Note that because INT corresponds to the precipitation averaged over wet days, a change in the INT value directly translates into a change in the intensity of wet events, regardless the number of wet events. In addition, we compute the annual contribution of very heavy rain (C98) following Eq. (1):
where PRCPTOT98 is the sum of daily precipitation greater than or equal to the 98th percentile annual value on wet days (Pctl98), and PRCPTOT is the sum of daily precipitation on wet days during that year. Following previous studies (Giorgi et al., 2011; Bichet and Diedhiou, 2018a, b), we compute the annual average duration of dry spells (DSLs) following Eq. (2):
where NDD is the annual number of dry days excluding isolated dry days (single dry day preceded and followed by a wet day), and NDS is the total number of dry spells during that year. Note that the annual number of dry days is directly derived from the annual number of wet days (RR1). Based on previous studies (Giorgi et al., 2011; Mohan and Rajeevan, 2017), we compute the annual hydroclimatic intensity index (HY-INT) following Eq. (3):
where DSLn and INTn are the normalized DSL and INT, respectively. The normalization consists, for each grid point, in dividing the annual time series of INT(DSL) by its mean value over the period 2006–2099.
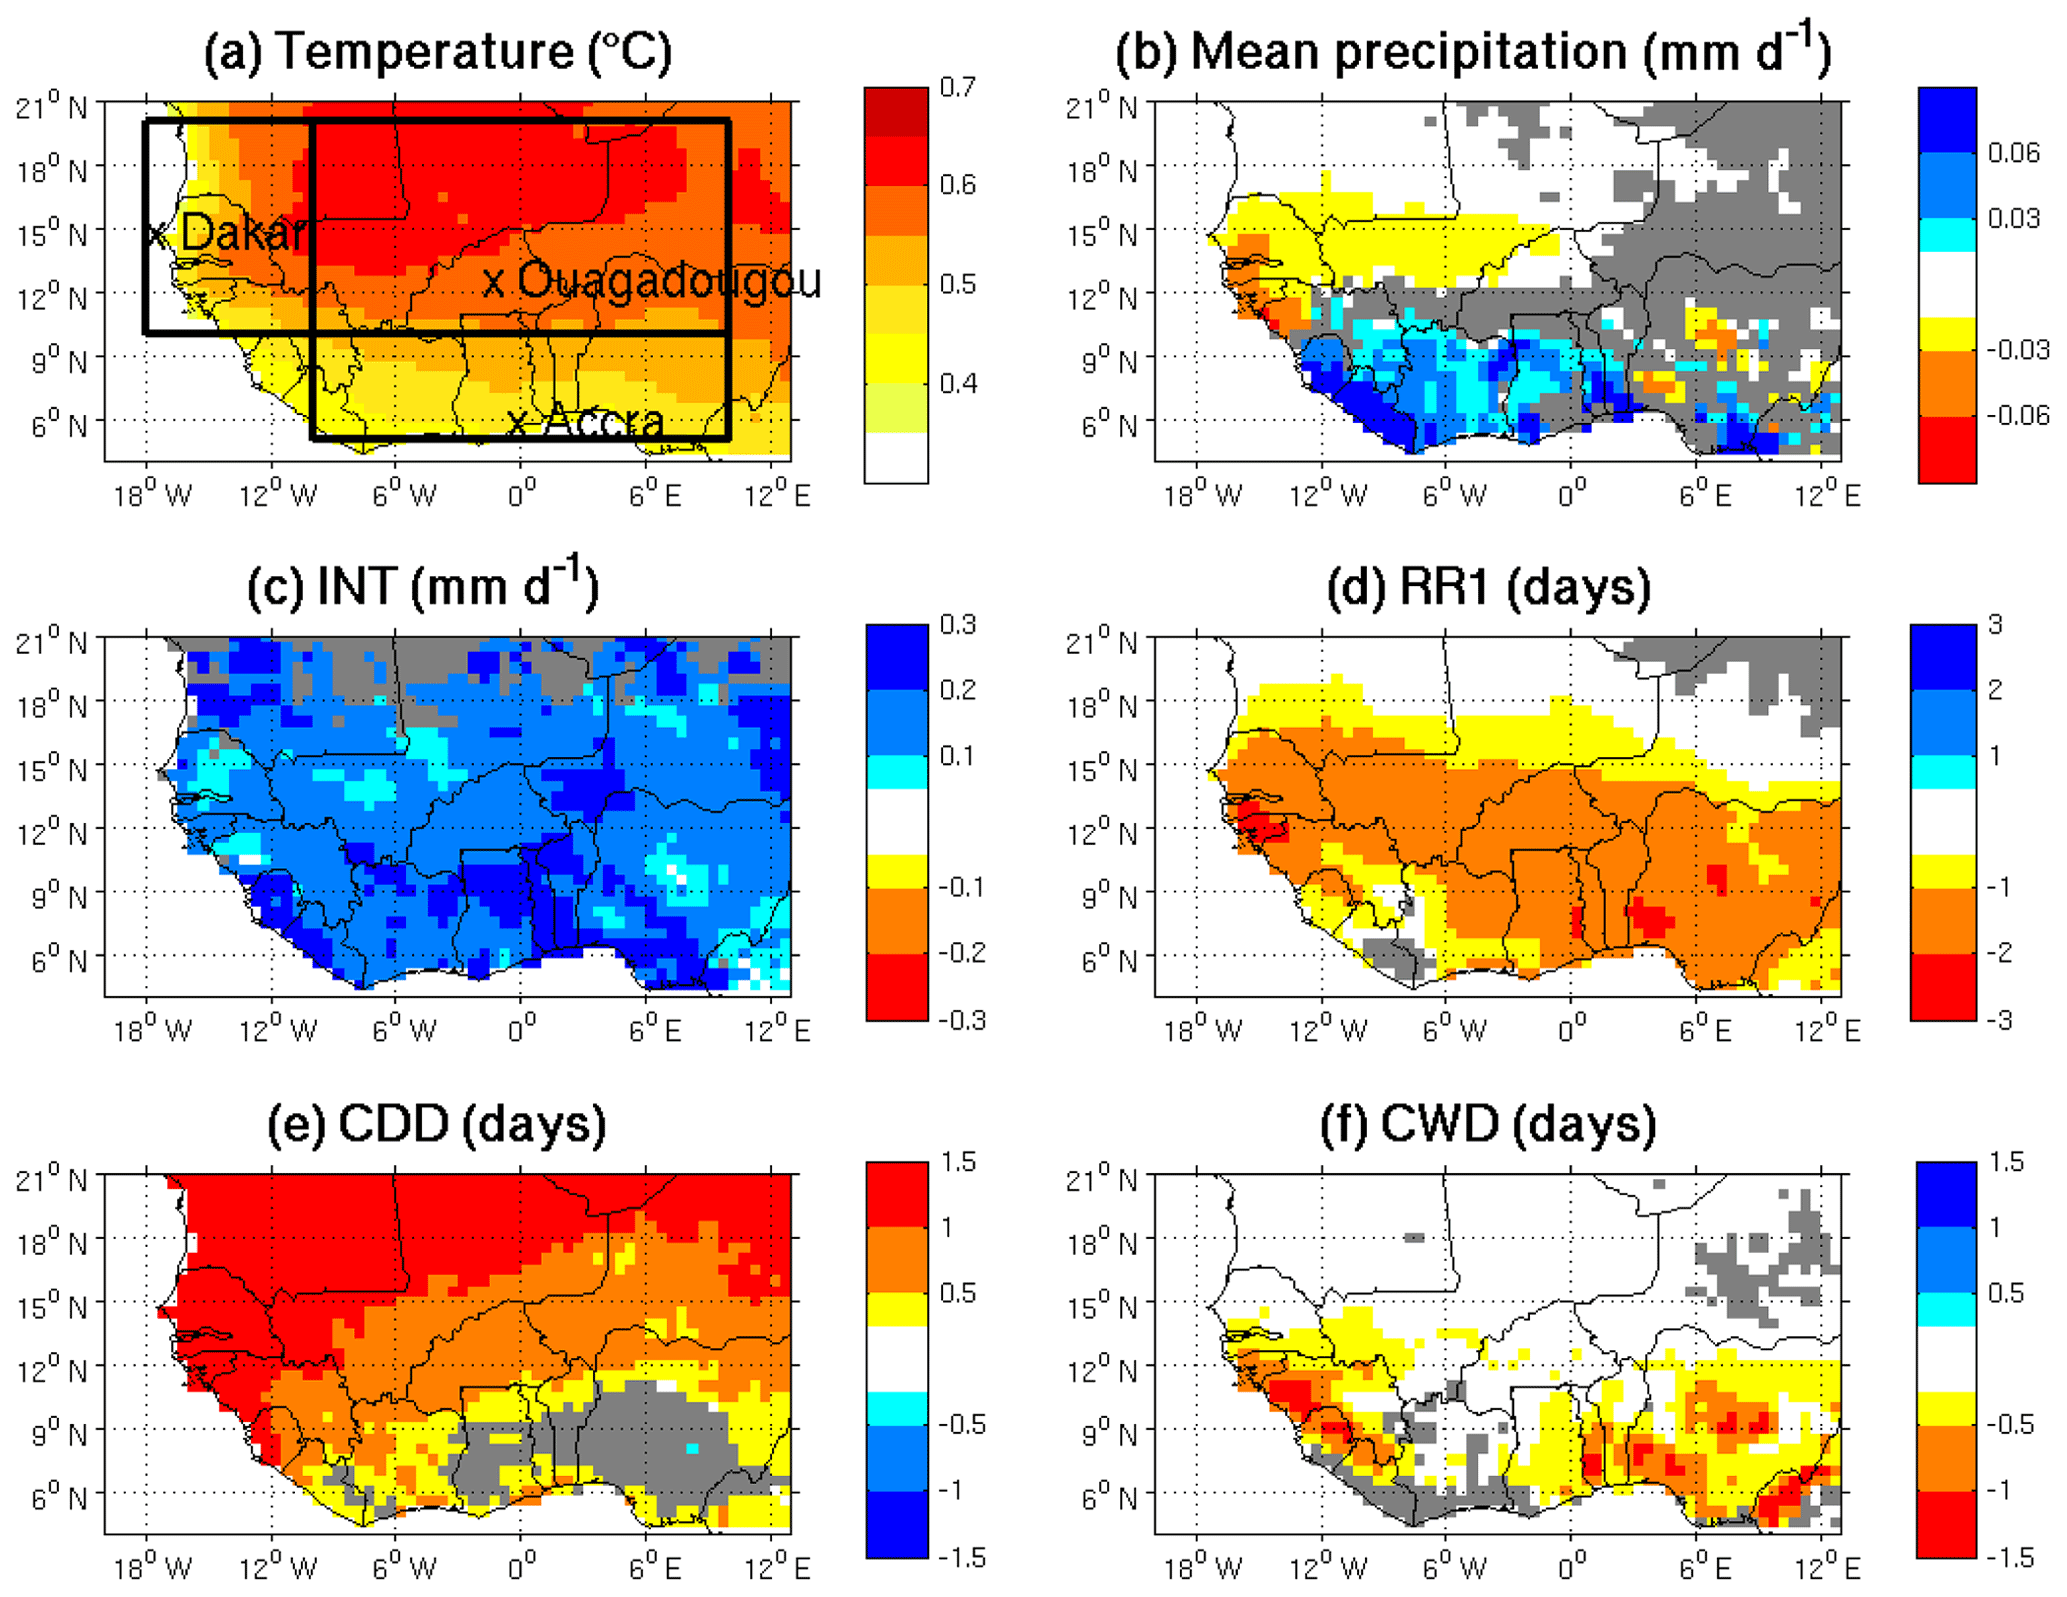
Figure 1Multimodel mean trend maps (2006–2100) for annual (a) mean temperature (∘C per decade), (b) mean precipitation (mm d−1 per decade), (c) INT (mm d−1 per decade), (d) RR1 (days per decade), (e) CDD (days per decade), and (f) CWD (days per decade). Trends that are not significant at 95 % according to the Student's t test are shaded in gray. The black boxes correspond to the three regions of interested: West Sahel, (10–20∘ N 18–10∘ W) Central Sahel (10–20∘ N 10∘ W–10∘ E), and the Guinea Coast (5–10∘ N 10∘ W–10∘ E), respectively.
2.2 Data
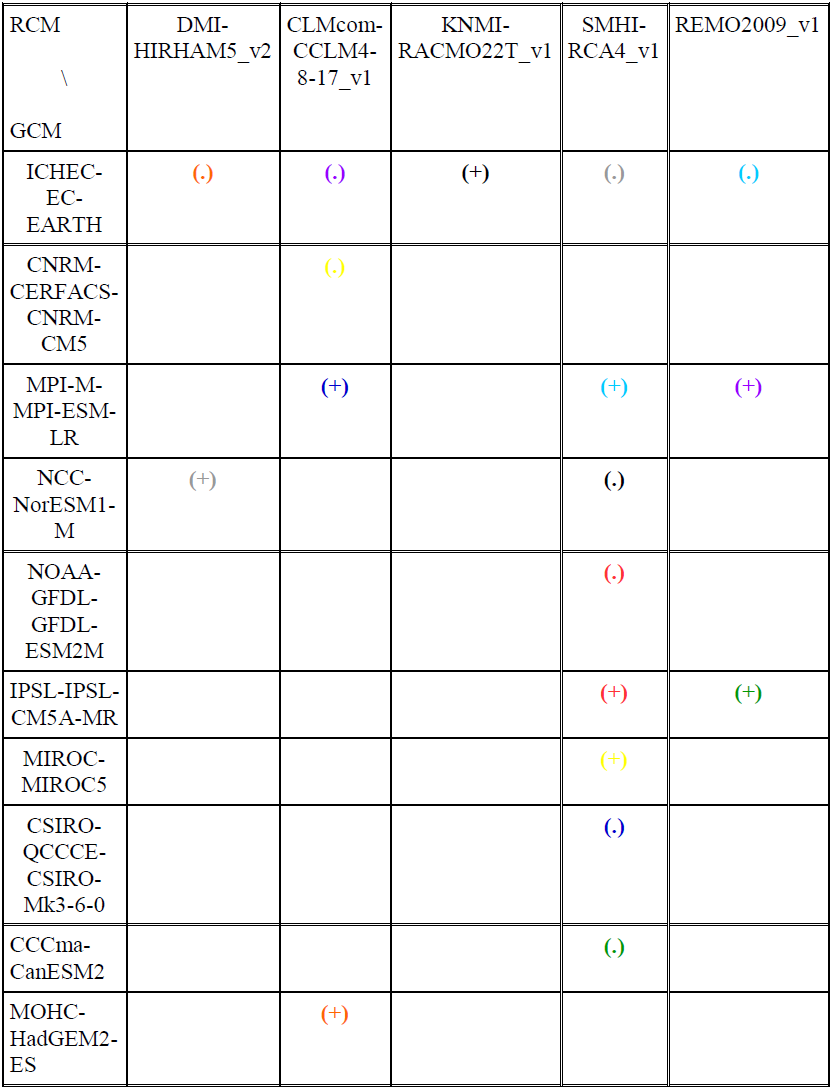
We use an ensemble of 18 high-resolution regional climate projections taken from the most up-to-date ensemble produced in the recent years for Africa: CORDEX-Africa (Giorgi et al., 2009; Jones et al., 2011; Hewitson et al., 2012; Kim et al., 2014). All simulations available online at the time of the analysis have been used. In this ensemble, 5 regional climate models (RCMs) are used to downscale 10 global climate models (GCMs) under the climate scenario RCP8.5 (Table 1). Out of the 50 combinations possible, only 18 were available, from which 8 use the same RCM. Whereas this imbalance presents the disadvantage to slightly bias the results towards this RCM, it also presents the advantage of representing a large number of GCMs, not accessible otherwise. Because the impact of the heterogeneity of the CORDEX-Africa GCM–RCM matrix on future precipitation changes is found mostly over central and West Africa (Dosio et al., 2019), we choose to represent a maximum diversity of RCMs and GCMs. Furthermore, although averaging model output may lead to a loss of signal (such that the true expected change is very likely to be larger than suggested by a model average), there is too little agreement on metrics to separate “good” and “bad” models to objectively weight the models (Knutti et al., 2010). In the following, we thus use the equal-weighted model average to illustrate the mean response of our ensemble (multimodel mean maps in Figs. 1–2) and show the individual responses of each simulation using scatterplots (Figs. 3–5). The simulations span the period 2006–2099 at a daily mean time step and cover Africa (24.64∘ W–60.28∘ E; 45.76∘ S–42.24∘ N) at about 50 km (∼0.5∘) spatial resolution in latitude and longitude. For each simulation and each grid cell, daily time series of surface air temperature and precipitation are retrieved.
Table 1Summary of 18 simulations (GCM/RCM chains) taken from the CORDEX-Africa data. In this ensemble, 5 RCMs are used to downscale 10 GCMs. Each experiment comprises one historical and one scenario (RCP8.5) run, spanning the periods 1981–2005 and 2006–2099 respectively. The horizontal resolution of all simulations is 0.5∘ in both latitude and longitude. The colors and symbols refer to Figs. 3, 4, and 5.
We evaluate the spatial distribution of daily mean rainfall simulated in the CORDEX models by comparing it to the satellite Climate Hazards Group Infrared Precipitation with Station data (CHIRPS) rainfall dataset (Fig. S1 in the Supplement). The CHIRPS dataset is explicitly designed for monitoring agricultural drought and global environmental change over land. It corresponds to a gridded, quasi-global (50∘ S–50∘ N), high-resolution (0.05∘), daily rainfall dataset that covers the time period 1981–2014 (Funk et al., 2015). In addition, we evaluate the statistical distribution of daily mean and yearly mean rainfall simulated in the CORDEX models from three cities (Ouagadougou Airport (12.35∘ N, 1.52∘ W), Dakar-Yoff (14.72∘ N, 17.51∘ W), and Accra Kotoka International Airport (5.6∘ N, 0.17∘ W), as seen in Fig. 1a), by comparing it to the CHIRPS dataset (grid point comparison) and to three near-surface daily rain gauge data extracted from the BADOPLUS dataset, as described in Panthou et al. (2012). Results are shown in Figs. S1 and S2 and summarized here. Each of the 18 CORDEX simulations satisfactorily reproduces the spatial distribution of the CHIRPS daily mean precipitation and to some extent RR1 (slightly overestimated in CORDEX, especially along the Guinea Coast; Fig. S1). More disagreements are found across models for INT, even though the multimodel mean is in good agreement with the CHIRPS dataset (Fig. S1). In Dakar, the CHIRPS and the BADOPLUS datasets show similar statistical distribution of daily mean and yearly mean precipitation, as well as RR1, and to some extent INT (Fig. S2). In Ouagadougou and Accra however, CHIRPS and the BADOPLUS datasets show similar statistical distributions for daily mean and yearly mean precipitation but strongly disagree for RR1 (overestimated in the CHIRPS dataset) and INT (underestimated in the CHIRPS dataset; Fig. S2). In other words, the CHIRPS dataset shows more frequent but less intense precipitation events than the BADOPLUS dataset in Ouagadougou and Accra. Each of the 18 CORDEX simulations generally shows a similar statistical distribution with the observations for daily mean and yearly mean precipitation, but they tend to overestimate (underestimate) the observed RR1 in Accra and Ouagadougou (Dakar) and underestimate the observed (particularly as compared to the BADOPLUS dataset) INT in all three locations (Fig. S2). In other words, the CORDEX simulations show less intense precipitation events compared to observations (especially the BADOPLUS dataset) in all three locations and less (more) frequent precipitation events in Dakar (Ouagadougou and Accra) than the observations. Nevertheless, we find that the observations are always included within the range of the 18 CORDEX simulations. Hence, we conclude that the CORDEX simulations compare satisfactorily well with the observations and can be used for the purpose of our study.
3.1 Time evolution
Trends (2006–2100) of air surface temperature (∘C per decade), mean precipitation (mm d−1 per decade), INT (mm d−1 per decade), RR1 (days per decade), CDD (days), and CWD (days) are shown in Fig. 1, as multimodel mean maps. From Fig. 1, temperature is expected to increase on average by +0.5 ∘C per decade over the entire region, with a northward increase that reaches +0.7 ∘C per decade over the northern Sahel. More specifically, temperature is expected to increase on average by +0.5, +0.6, and +0.45 ∘C per decade over West Sahel, Central Sahel, and the Guinea Coast, respectively (Fig. 1a). Mean precipitation is expected to increase on average by +0.03 mm d−1 per decade over the Guinea Coast and decrease on average by −0.015 and −0.001 mm d−1 per decade over West Sahel and Central Sahel, respectively (Fig. 1b). INT is expected to increase on average by +0.2 mm d−1 per decade over all of West Africa, reaching up to +0.3 mm d−1 over the Guinea Coast (Fig. 1c), and RR1 is expected to decrease on average by −1.5 d per decade over all of West Africa, reaching up to −3 d per decade over West Sahel (Fig. 1d). Furthermore, CDD is expected to increase on average by +1 d per decade over the entire region, with a northward increase that reaches +5 d per decade over the northern Sahel (Fig. 1e), and CWD is expected to decrease on average by −0.5 d per decade over the Guinea Coast, and more specifically over Guinea Bissau, Guinea, Sierra Leone, Liberia, Ghana, Benin, Togo, and Nigeria (Fig. 1f). Hence, our results show that by the end of the century, precipitation is expected to intensify but rarefy (including longer dry periods and shorter wet periods) over all of West Africa, with different impacts on mean precipitation depending on the subregion: decrease in mean precipitation over the Sahel (especially over West Sahel) and increase in mean precipitation over the Guinea Coast.
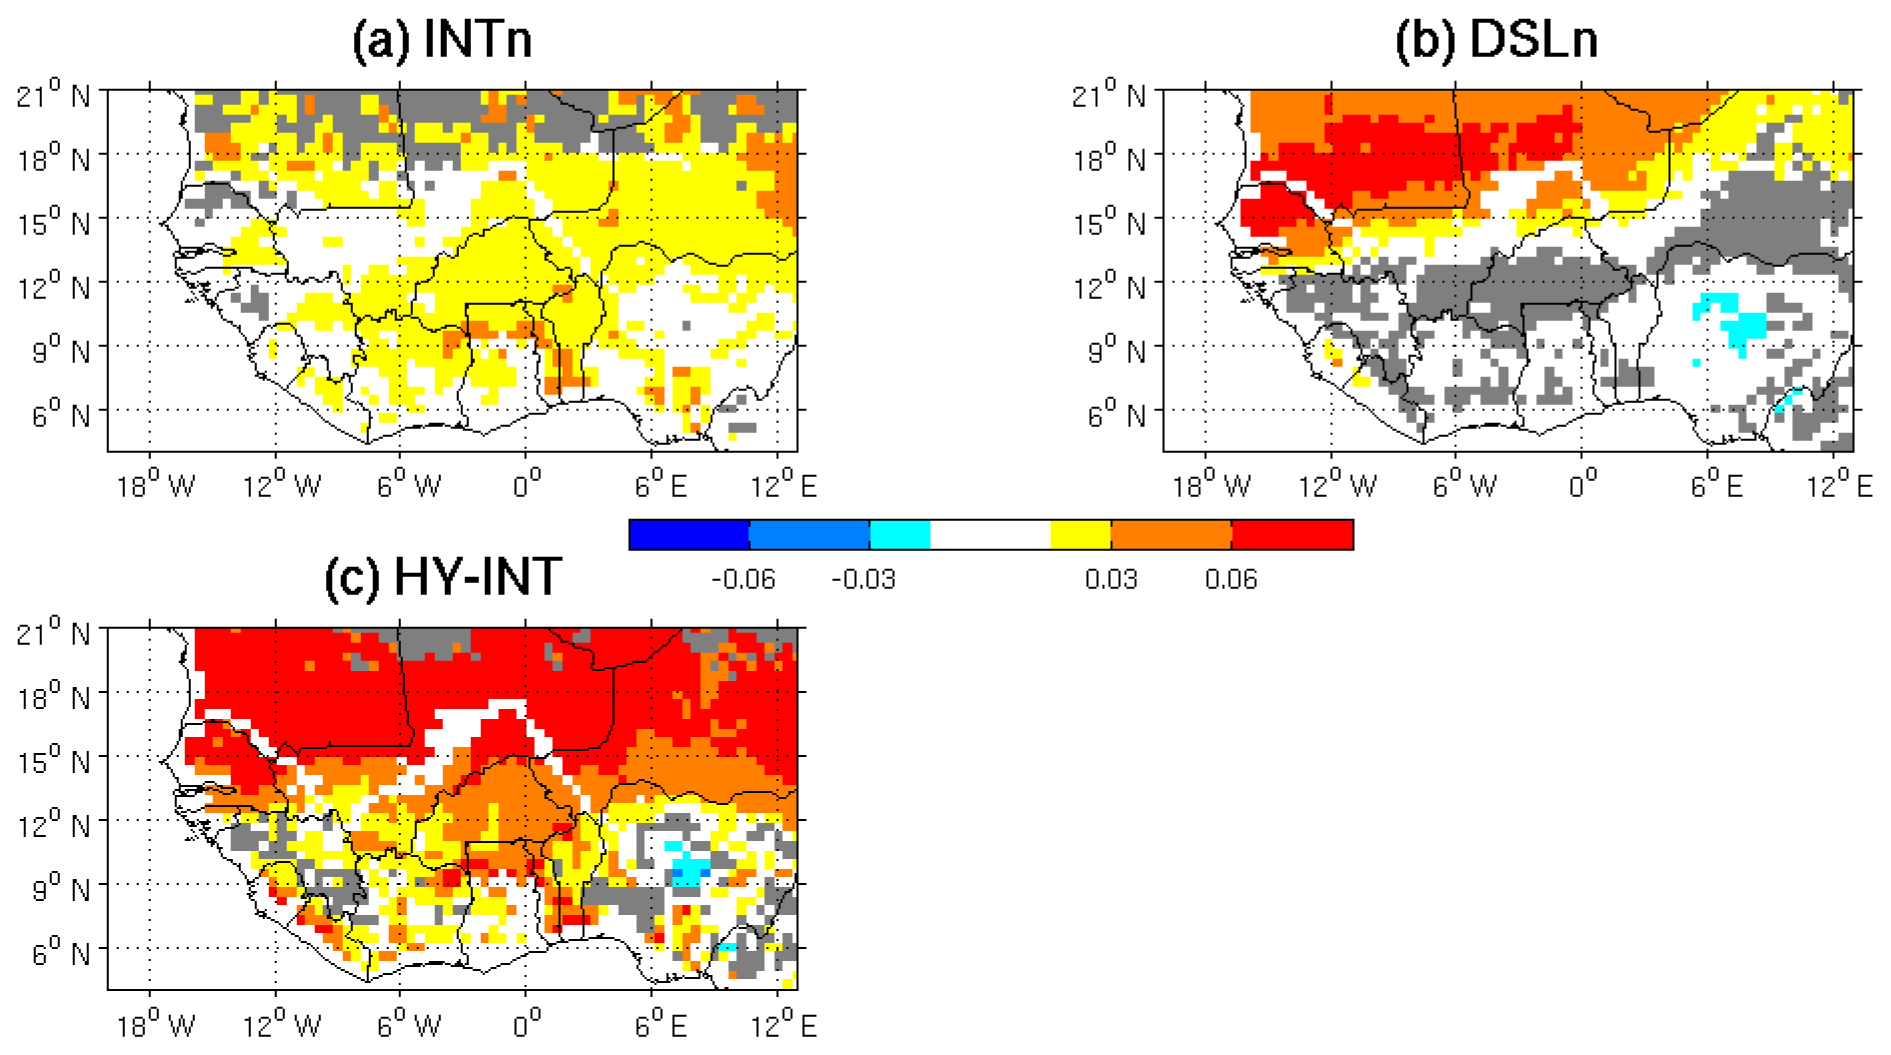
Figure 2Multimodel mean trend maps (2006–2100) for annual (a) INTn, (b) DSLn, and (c) HY-INT, in units per decade. Trends that are not significant at 95 % according to the Student's t test are shaded in gray.
Trends (2006–2100) of INTn, DSLn, and HY-INT are shown in Fig. 2, as multimodel mean maps. In agreement with Fig. 1c, Fig. 2 shows an intensification of precipitation over all of West Africa, on average by +0.02 (2 %) per decade (Fig. 2a). In addition, whereas DSL is expected to increase over the Sahel on average by +0.05 (5 %) per decade, with a latitudinal increase northward that reaches +0.1 (10 %) per decade over the western part of the Sahel, negligible changes are expected over the Guinea Coast (Fig. 2b). As a result, HY-INT is expected to increase on average by +0.05 (5 %) over West Africa, with a latitudinal increase northward that reaches +1.5 (15 %) per decade over the Sahel (Fig. 2c). Therefore, our results show that the hydrological cycle is expected to intensify by the end of the century over all of West Africa. Over the Guinea Coast, this intensification results exclusively from an increase in precipitation intensity (INT). Over the Sahel however, it results from both an increase in precipitation intensity (INT) and an increase in the average length of dry spells (DSL). Hence over the Sahel, rainfall events are expected to become more intense and separated by much longer periods of dryness.
3.2 Relationship with temperature
Annual values (2006–2009) of mean precipitation (mm d−1), RR1 (days), and INT (mm d−1) are shown in Fig. 3, plotted against the corresponding annual mean values of air surface temperature (∘C), as averaged over (a) West Sahel, (b) Central Sahel, and (c) Guinea Coast. Individual CORDEX simulations are represented by the thin colored dots (see Table 1 for color references), and the multimodel mean is represented by the thick black dots. According to Fig. 3, mean precipitation decreases with temperature over the Sahel (multimodel mean decreases by −0.032 and −0.012 mm d−1 ∘C−1 over West Sahel and Central Sahel, respectively) and increases with temperature over the Guinea Coast (multimodel mean increases by +0.062 mm d−1 ∘C−1). In all three subregions, RR1 decreases with temperature (multimodel mean decreases by −2.3, −1.7 and −2.6 d ∘C−1 over West Sahel, Central Sahel and Guinea Coast, respectively) while INT increases with temperature (multimodel mean increases by +0.33, +0.27 and +0.41 mm d−1 ∘C−1, respectively). Based on the multimodel mean values, we show that changes in temperature explain less than 24 % of the changes in mean precipitation in all three subregions but more than 67 % (51 %) of the changes in RR1 (INT). As seen in Fig. 3, even though the annual mean values vary greatly from a simulation to another (e.g., NCC-NorESM1-HIRHAM5 is particularly warm over Central Sahel, ICHEC-RACMO is particularly cold over the three subregions, NCC-NorESM1-HIRHAM5 is particularly wet over the Guinea Coast, and CSIRO-SMHI is particularly wet over the Sahel), the relation between each variable and the temperature is consistent across all models, albeit with a different strength.
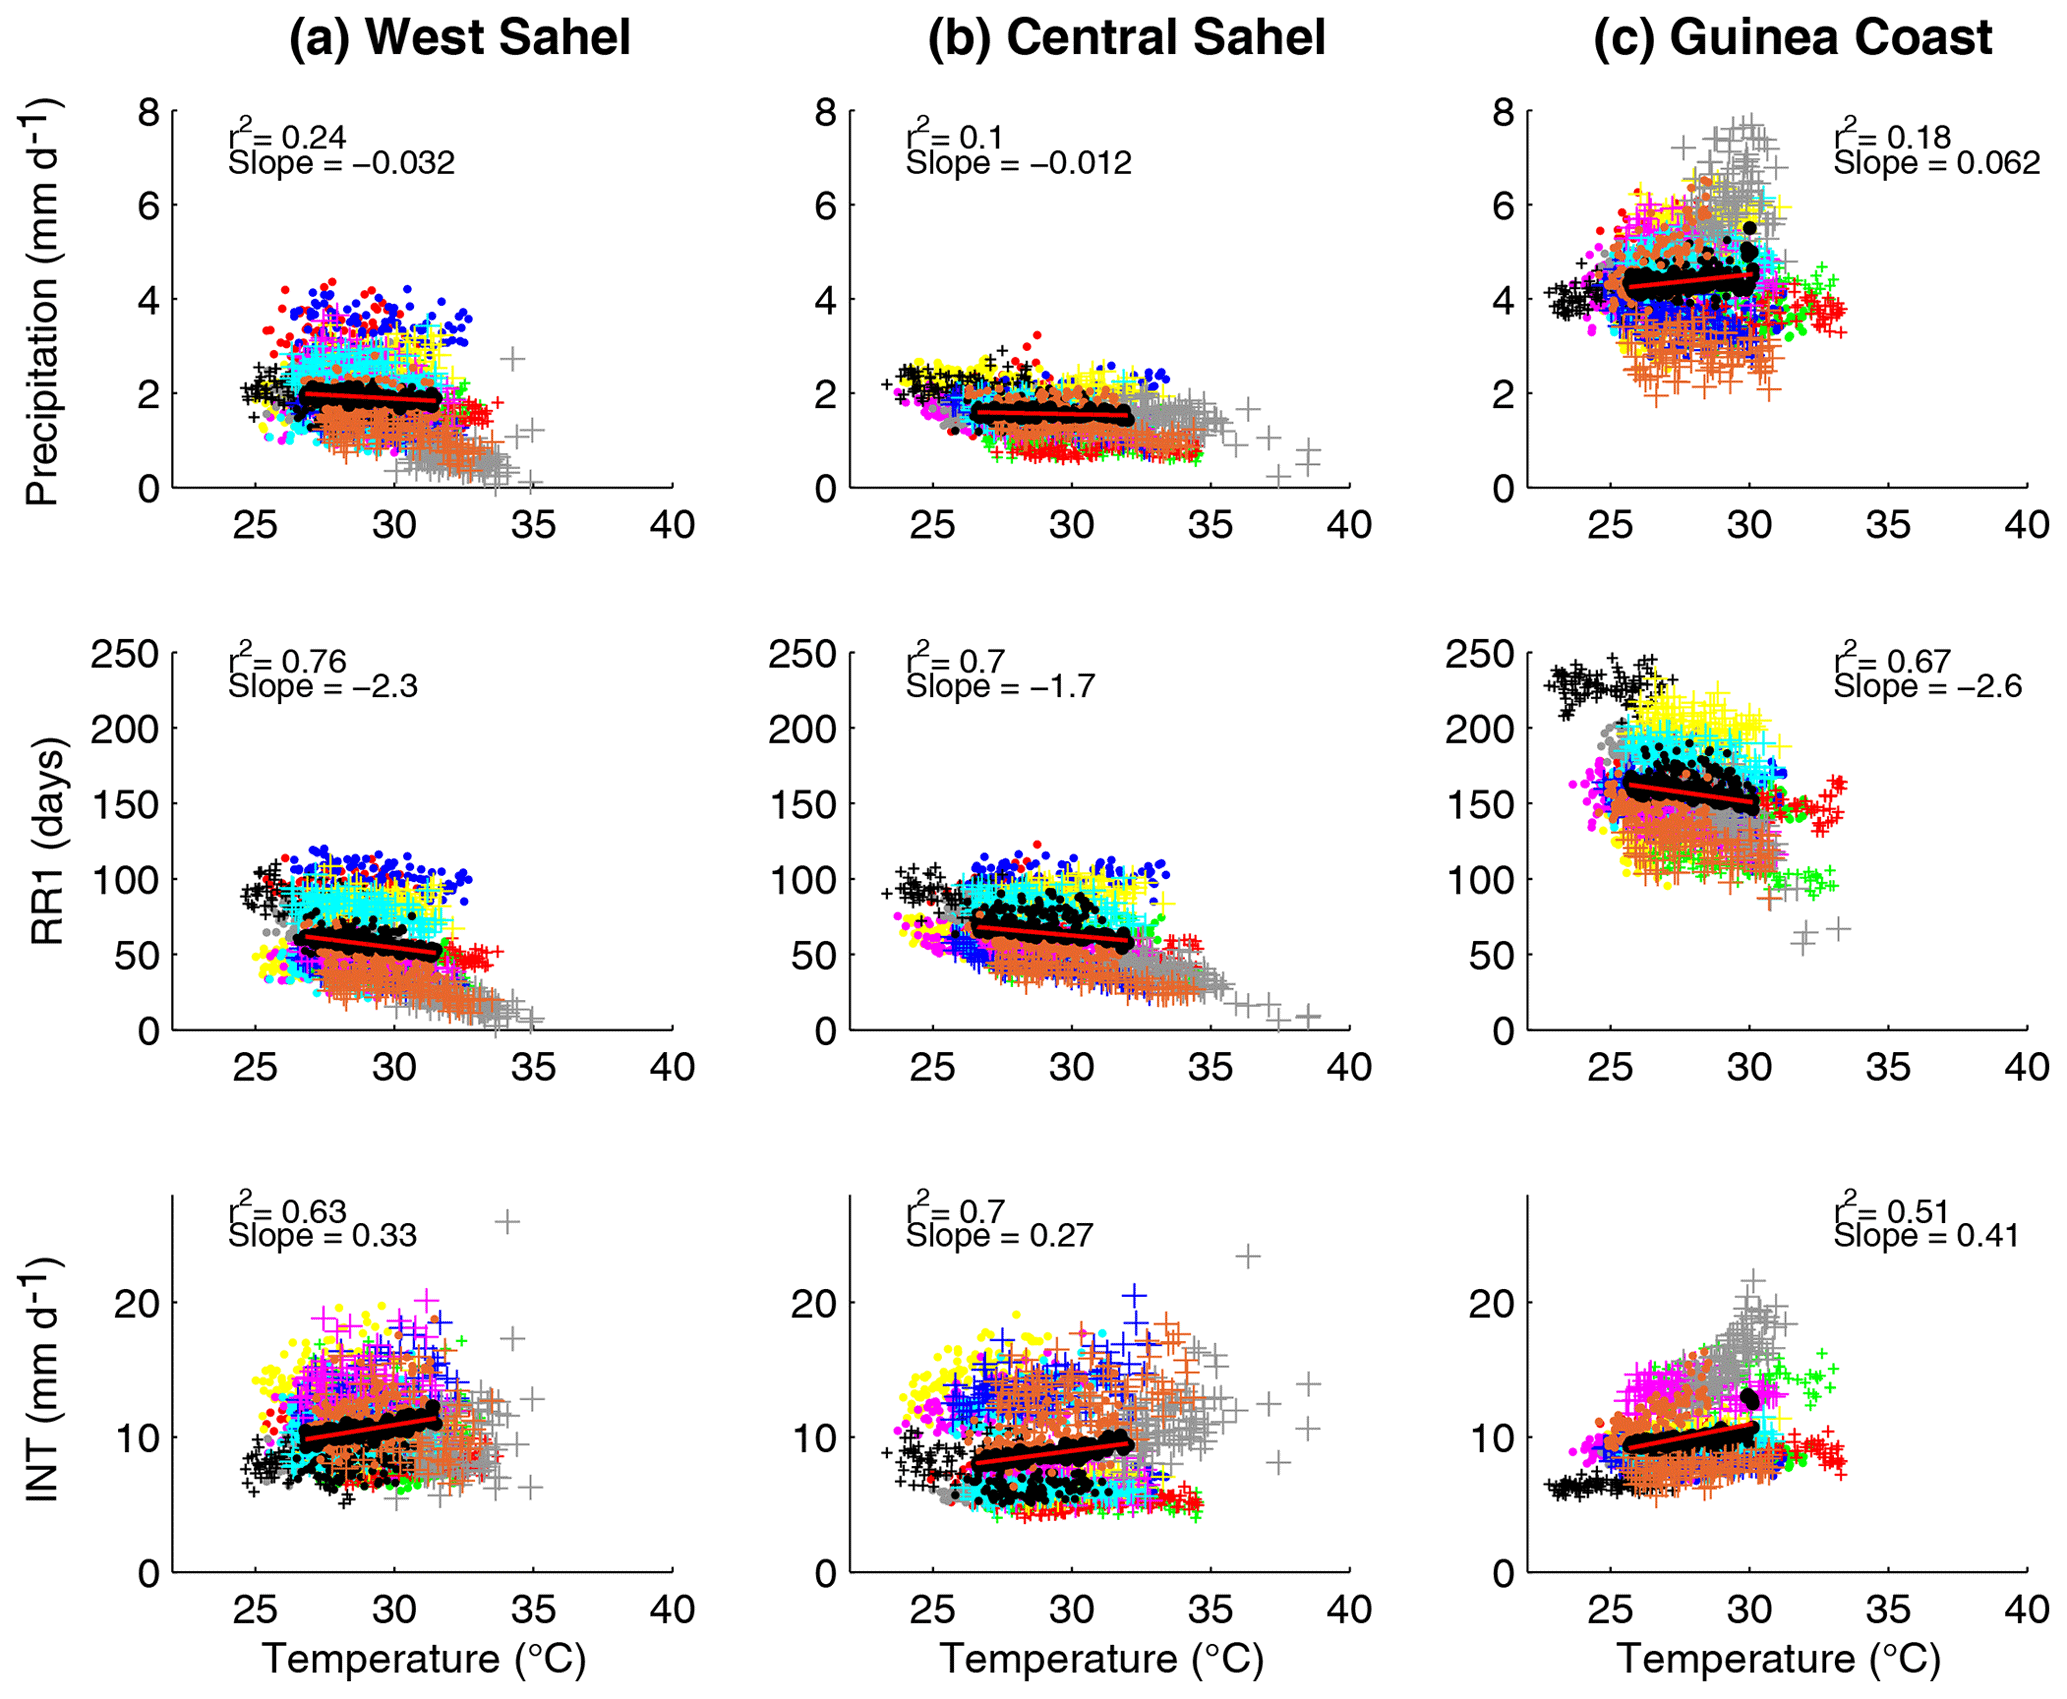
Figure 3Annual values of mean precipitation (mm d−1), RR1 (days), and INT (mm d−1) (y axis) shown against annual mean temperature (∘C) (x axis), and averaged over (a) West Sahel, (b) Central Sahel, and (c) Guinea Coast. Each color corresponds to a single simulation, as described in Table 1, and the thick black dots correspond to the multimodel mean. Also shown are the fitted regression line of the multimodel mean (red line) and the associated coefficient of determination (“r2”) and correlation (“slope”).
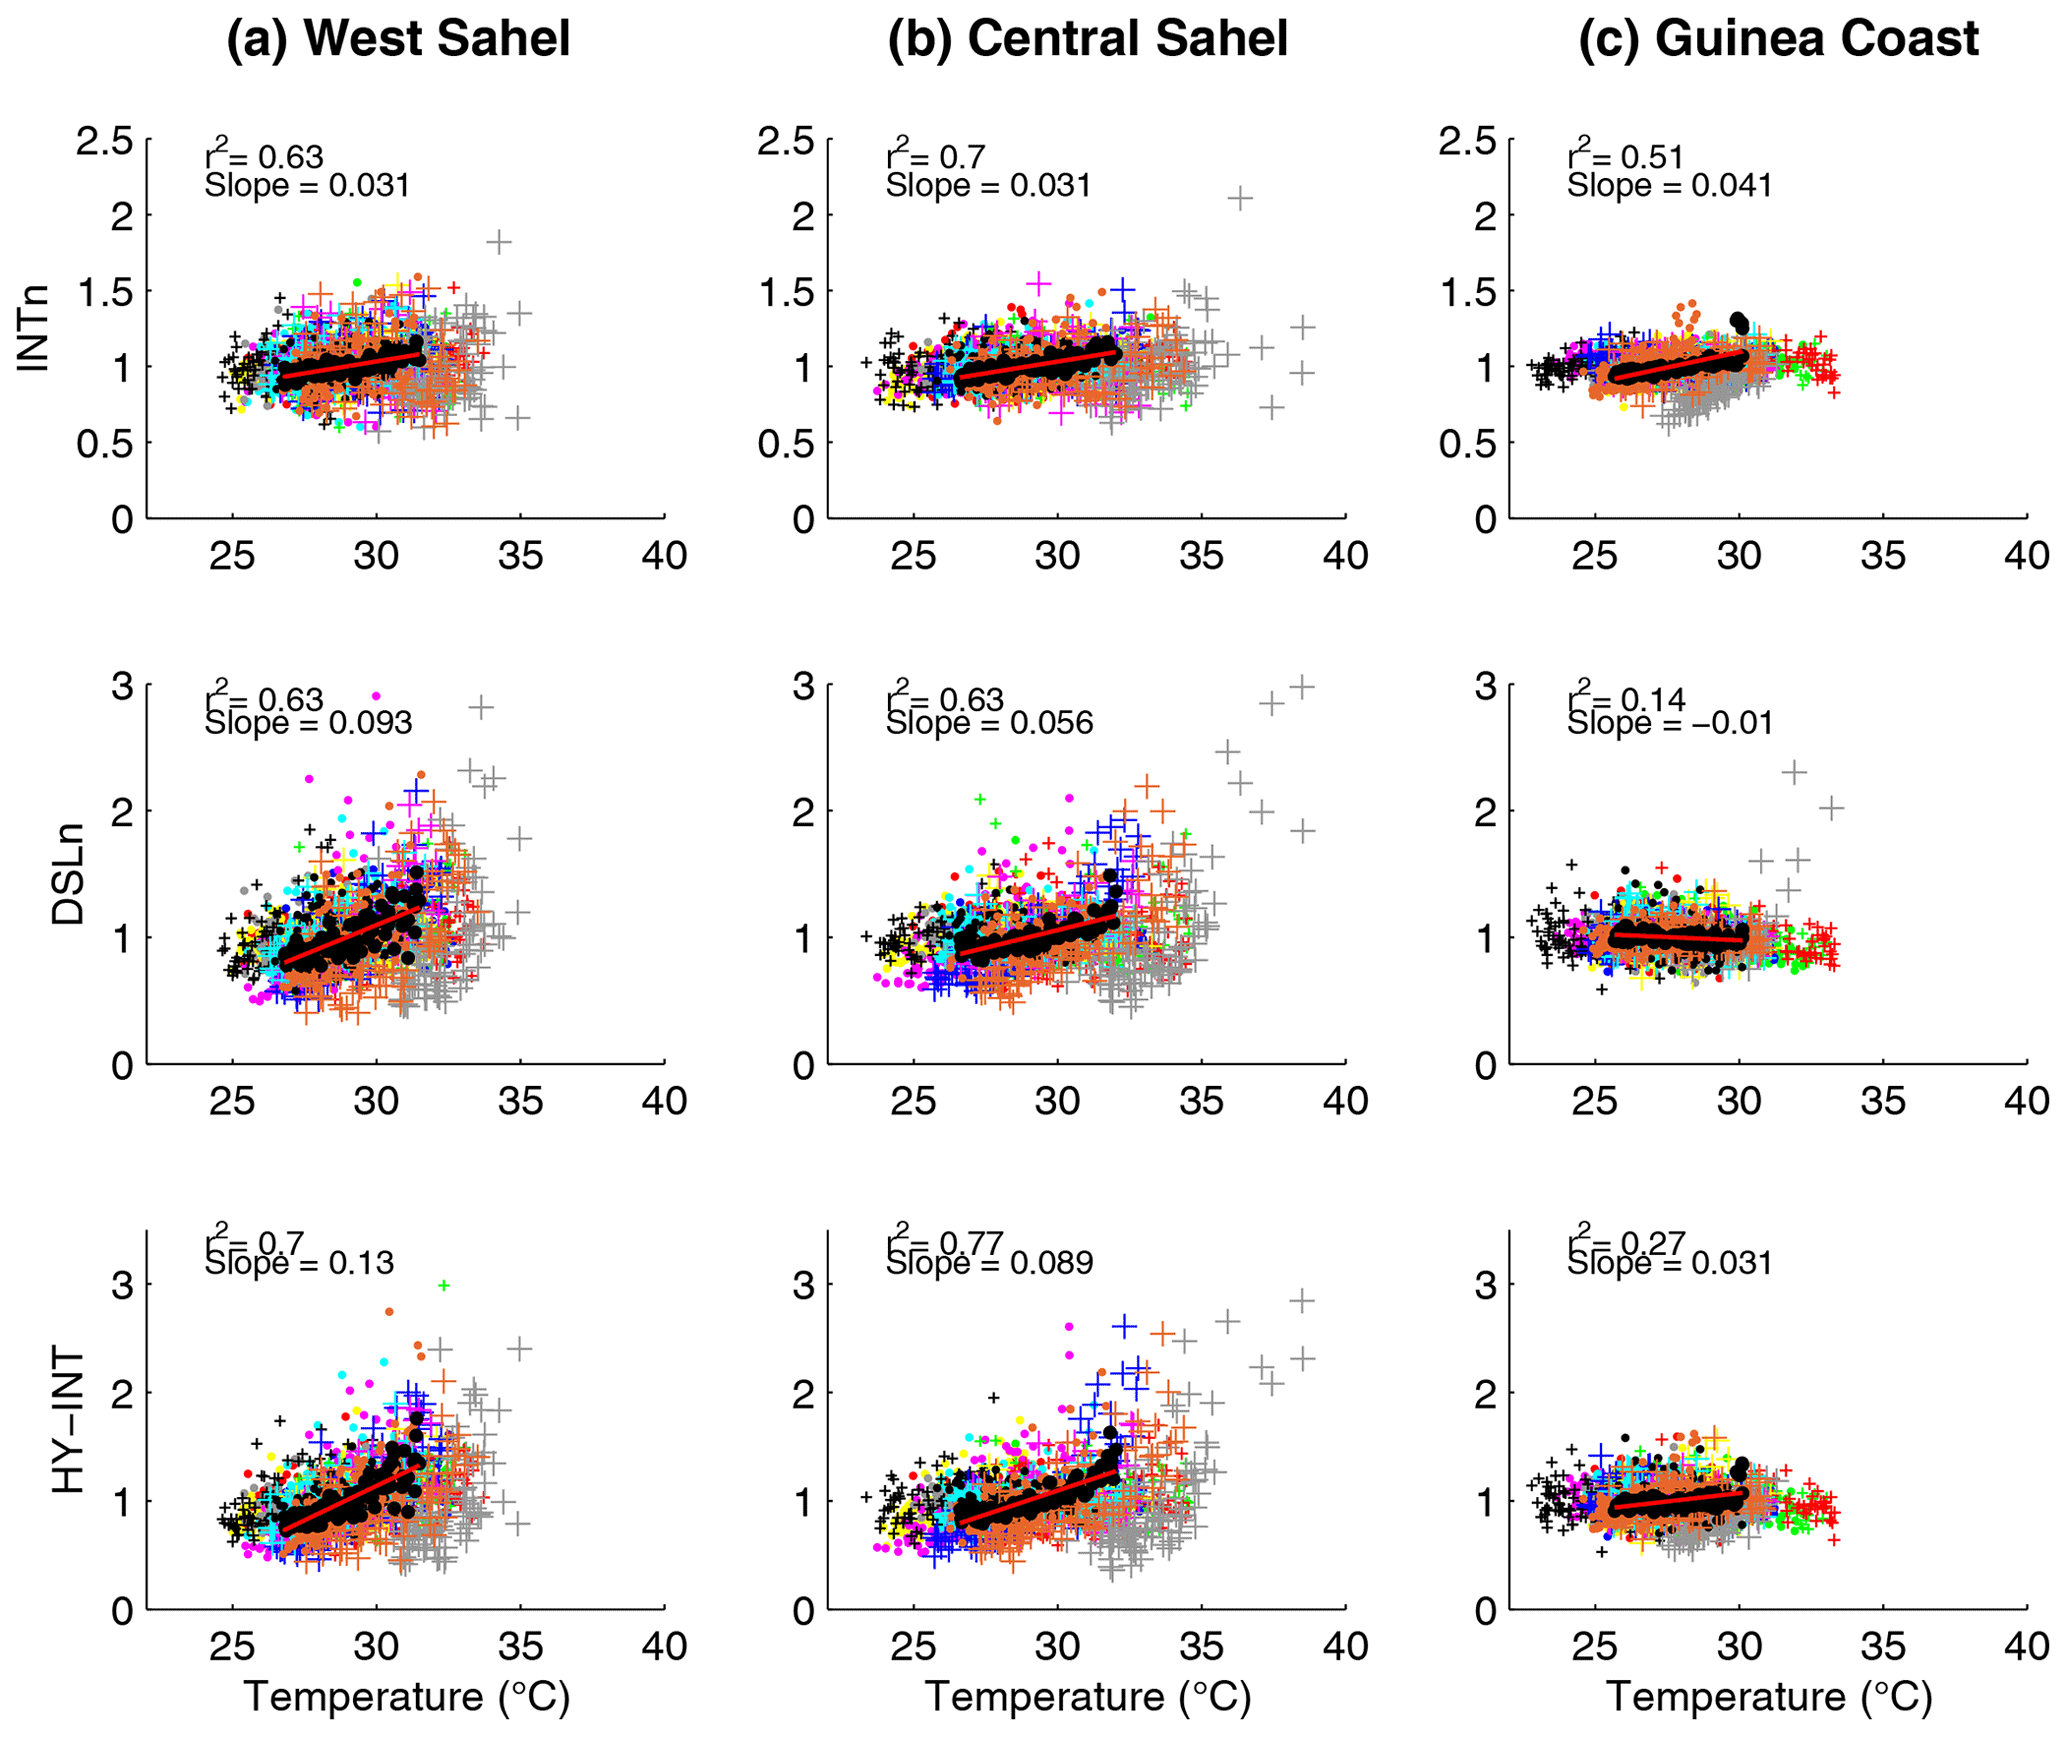
Figure 4Annual values of INTn, DSLn, and HY-INT (y axis) shown against annual mean temperature (∘C) (x axis), and averaged over (a) West Sahel, (b) Central Sahel, and (c) Guinea Coast. Each color corresponds to a single simulation, as described in Table 1, and the thick black dots correspond to the multimodel mean. Also shown are the fitted regression line of the multimodel mean (red line) and the associated coefficient of determination (“r2”) and correlation (“slope”).
Annual values (2006–2009) of INTn, DSLn, and HY-INT are shown in Fig. 4, plotted against the corresponding annual mean values of air surface temperature (∘C), as averaged over (a) West Sahel, (b) Central Sahel, and (c) Guinea Coast. As for Fig. 3, individual CORDEX simulations are represented by the thin colored dots and the multimodel mean by the thick black dots. From Fig. 4, INTn increases with temperature in all three regions (multimodel mean increases by +0.031 (3.1 %) ∘C−1 over the Sahel and +0.041 (4.1 %) ∘C−1 over the Guinea Coast), whereas DSLn increases with temperature over the Sahel (multimodel mean increases by +0.093 (9.3 %) and +0.056 (5.6 %) ∘C−1 over West Sahel, and Central Sahel, respectively; Fig. 4a and b), but it decreases with temperature over the Guinea Coast (multimodel mean decreases by −0.01 (1 %) ∘C−1; Fig. 4c). As a result, HY-INT increases with temperature in all three subregions (multimodel mean increases by +0.13 (13 %), +0.089 (8.9 %), and +0.031 (3.1 %) ∘C−1 over West Sahel, Central Sahel, and the Guinea Coast, respectively). Based on the multimodel mean values, we show that changes in temperature explain about 63 % (74 %) of the changes in DSLn (HY-INT) over the Sahel and 14 % (27 %) over the Guinea Coast. As shown in Fig. 4, the annual mean values of DSLn vary greatly from a simulation to another over the Sahel but are similar across simulations over the Guinea Coast. Similar to Fig. 3, we find that the relation between each variable and the temperature is consistent across all models, albeit with different strengths. We conclude that most of the trends observed in Figs. 1 and 2 show a positive relationship with regional warming.
This study uses an ensemble of high-resolution regional climate projections (CORDEX-Africa) to investigate, over the twenty-first century, the relationship between regional warming and different aspects of the hydrological cycle, as seen in three different subregions of West Africa. In agreement with previous studies (e.g., Vizy and Cook, 2012; Collins et al., 2013; Sylla et al., 2016; Diedhiou et al., 2018; Klutse et al., 2018), we find that (1) West African surface temperatures are expected to increase at a faster rate than the global averaged warming (+0.5 vs. +0.3 ∘C per decade), (2) precipitation is expected to intensify but rarefy over the entire region, (3) dry spells are expected to become longer (especially over the northern and the western part of the Sahel), and (4) wet spells are expected to become shorter over the Guinea Coast.
In addition, we show that (1) mean precipitation is expected to increase over the Guinea Coast and decrease over the Sahel, and (2) the hydrological cycle, as defined by Giorgi et al. (2011), is expected to intensify over all of West Africa (+5 % per decade on average). Whereas this intensification results solely from more intense precipitation over the Guinea Coast, we find it results from both more intense precipitation (+2 %) and longer periods of dryness (+5 %–10 %) over the Sahel.
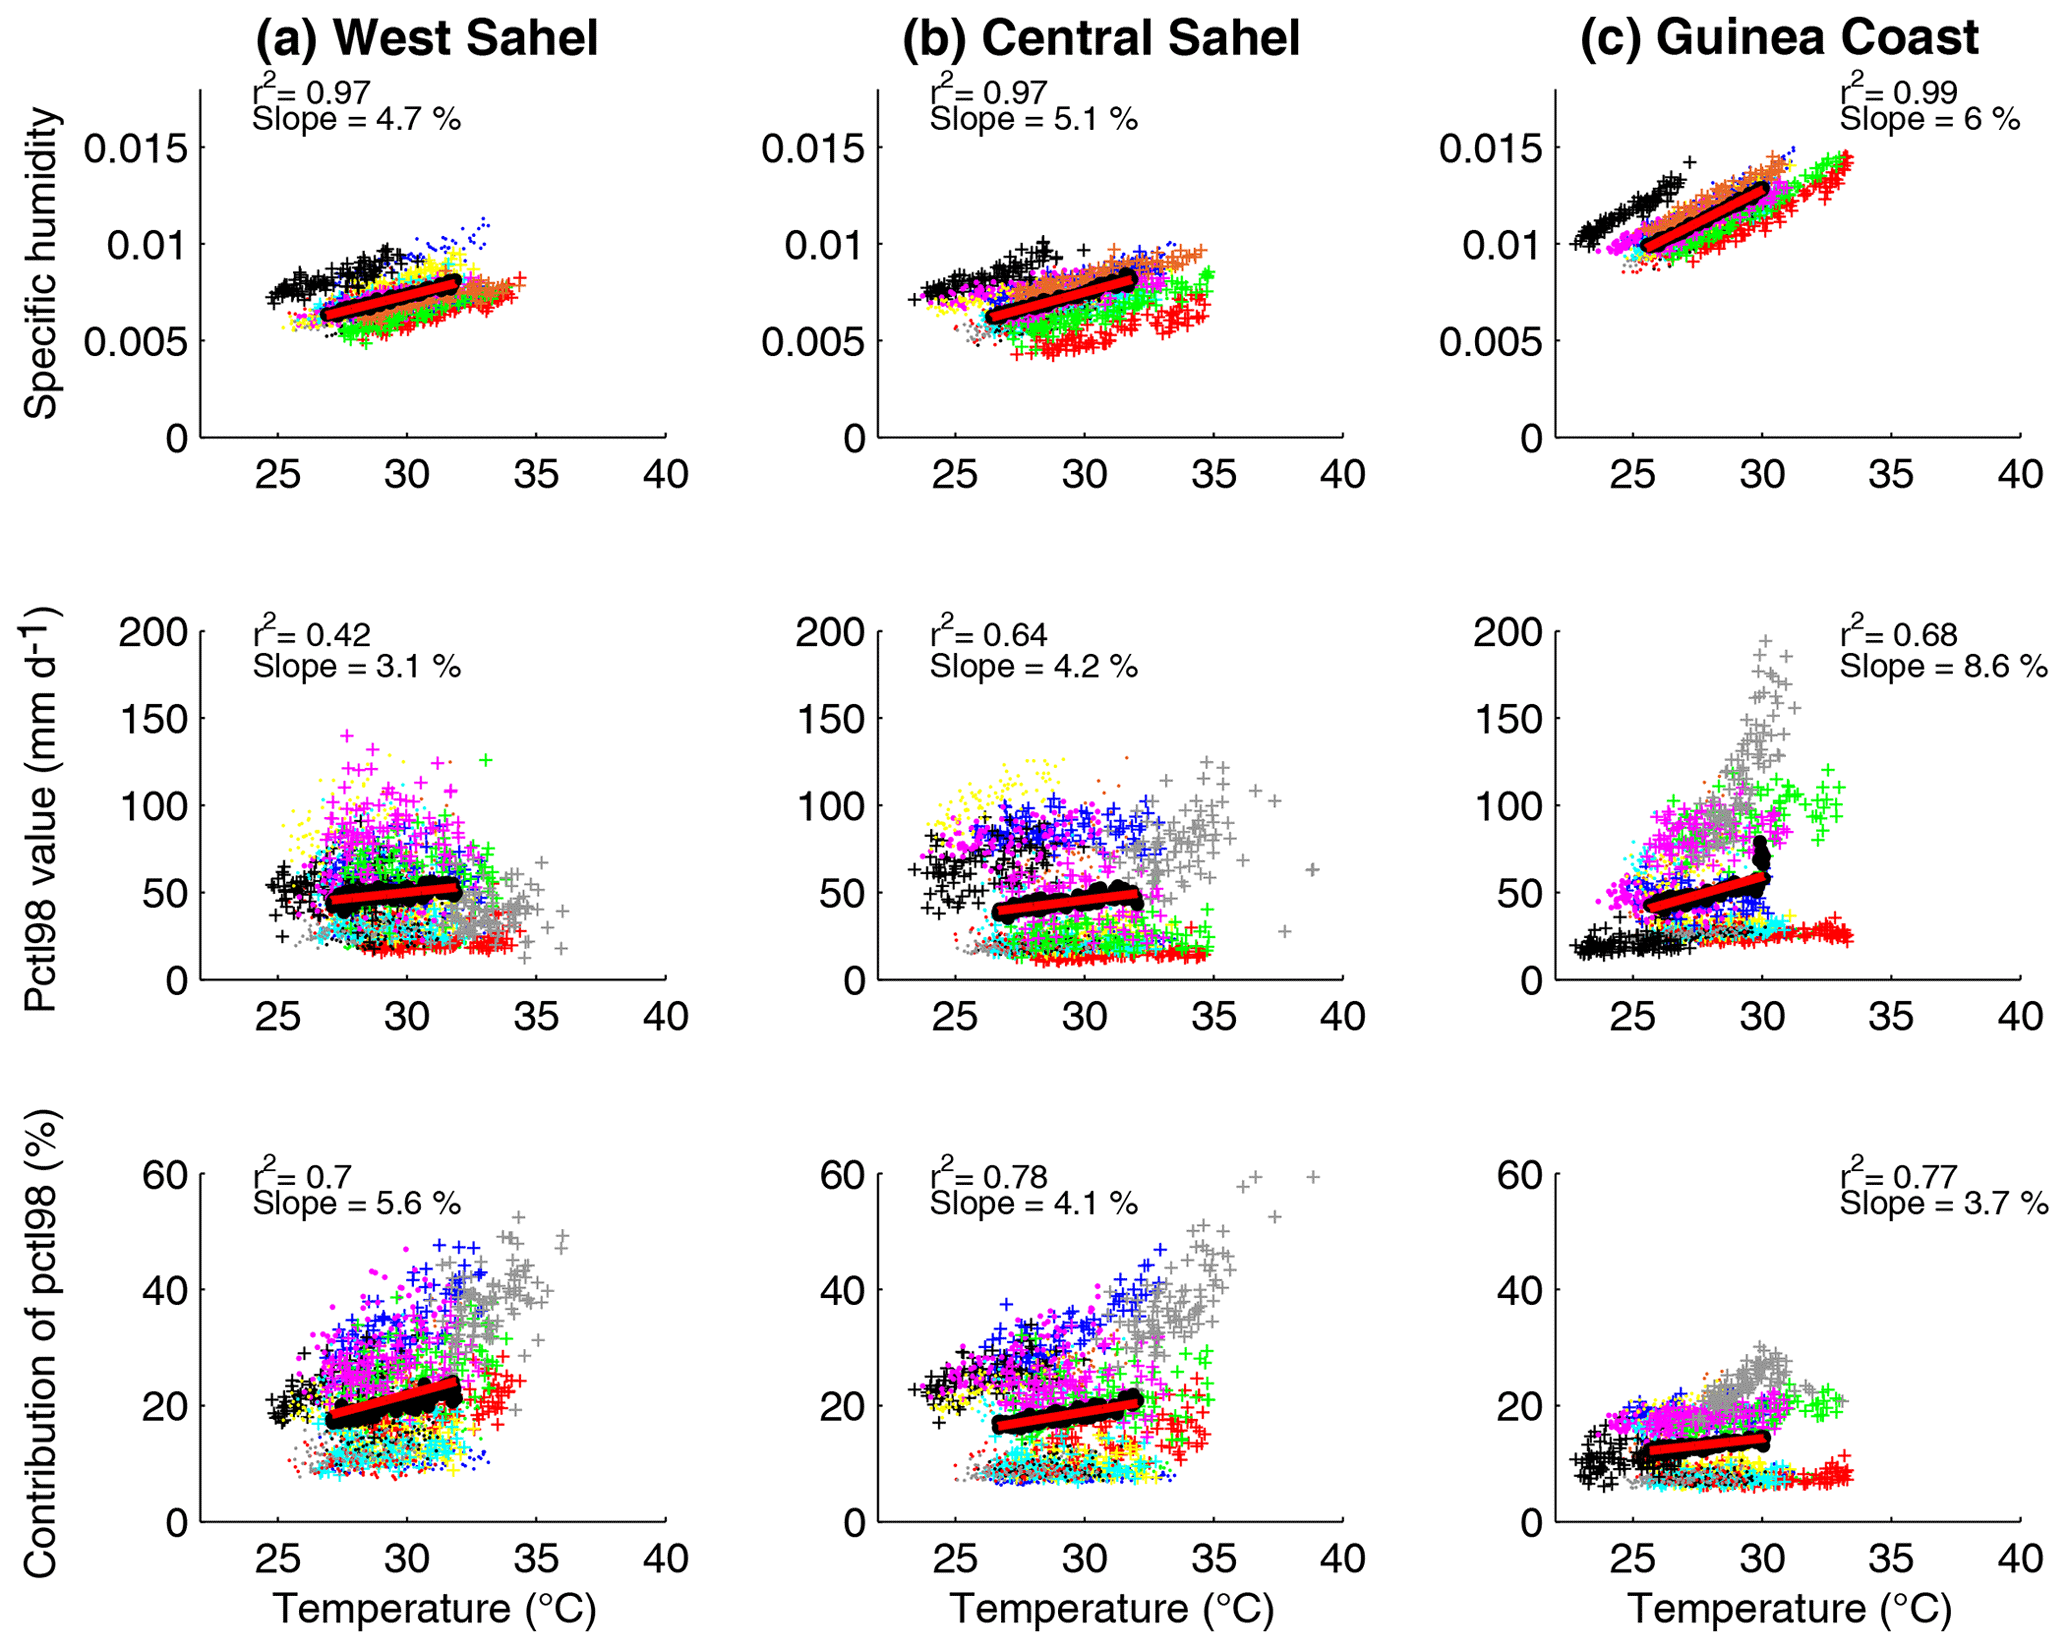
Figure 5Annual values of specific humidity, 98th percentile (mm d−1), and contribution of precipitation above the 98th percentile (%) (y axis) shown against annual mean temperature (∘C) (x axis), and averaged over (a) West Sahel, (b) Central Sahel, and (c) Guinea Coast. Each color corresponds to a single simulation, as described in Table 1, and the thick black dots correspond to the multimodel mean. Also shown are the fitted regression line of the multimodel mean (red line) and the associated coefficient of determination (“r2”) and correlation (“slope”, in % ∘C−1, as compared to the 2006–2100 mean value). Note that specific humidity for the model NCC-NorESM1-HIRHAM5 was not available to download at the time of the analysis.
According to our results, all aforementioned trends show a positive relationship with regional temperatures. In agreement with Collins et al. (2013), we find that mean precipitation is expected to decrease with temperature over the Sahel and increase with temperature over the Guinea Coast. In addition, we find that the hydrological cycle is expected to increase with temperature over all of West Africa, on average by +11 % ∘C−1 over the Sahel and +3 % ∘C−1 over the Guinea Coast. This increase is in qualitative agreement with the Clausius–Clapeyron relationship, which implies that specific humidity would increase exponentially with temperature (at a rate of about 6.5 % ∘C−1), meaning that a warmer atmosphere is expected to take longer to reach saturation and release more water when it condensates, thereby intensifying the hydrological cycle (e.g., Allen and Ingram, 2002). Over the Sahel, we find indeed that the warmer atmosphere takes longer to reach saturation (DSL increases on average by +7.5 % ∘C−1) and releases more water when it condensates (INT increases on average by +3.1 % ∘C−1). Over the Guinea Coast however, we find that the warmer atmosphere does not take longer to reach saturation (DSL decreases on average by −1 % ∘C−1) but does release more water when it condensates (INT increases by +4.1 % ∘C−1 but DSL decreases by −1 % ∘C−1). To understand the processes involved, Fig. 5 (top row) shows the evolution of annual mean specific humidity as a function of annual mean temperatures in all three subregions. It is shown that specific humidity increases with temperature on average by +5 % ∘C−1 in all three subregions (Fig. 5), which is close to the rate expected from the Clausius–Clapeyron relationship (+6.5 % ∘C−1). Thus, we conclude that in all three subregions, a warmer atmosphere does increase the amount of moisture in the atmosphere, which leads to more intense precipitation (INT increase in both subregions). However, whereas a warmer atmosphere also leads to longer periods of dryness over the Sahel (DSL increase over the Sahel), this is not the case over the Guinea Coast. We suggest that unlike the Sahel, the atmosphere over the Guinea Coast does not require more time to reach saturation because it is already very close to saturation. Thus, although the likelihood for droughts increases with temperature over the Sahel (and in particular over West Sahel), this is not the case over the Guinea Coast. To understand the impact on the very heavy rainfall and floods, Fig. 5 also shows the evolution of the 98th percentile annual value (Pctl98 in mm d−1, middle row) and the annual contribution of very heavy rain (C98 in %, bottom row) as a function of annual mean temperatures in all three subregions. It is shown that a warmer climate implies heavier rainfall (multimodel mean increases by +3.1 %, +4.2 %, and +8.6 % over West Sahel, Central Sahel, and Guinea Coast, respectively) and a larger contribution of very heavy rainfall (+5.6 %, +4.1 %, and +3.7 % in West Sahel, Central Sahel, and Guinea Coast, respectively) in all three subregions (Fig. 5), which indicates an increase in the likelihood for floods with temperature over all of West Africa.
Finally, it is worth noting that over the Sahel, precipitation intensity is also driven by the frequency of mesoscale convective systems (MCSs), which are driven by the meridional temperature gradient between the Sahel and the Sahara (Taylor et al., 2017). Whereas the meridional temperature gradient between the Sahel and the Sahara is projected to increase in CORDEX-Africa (on average by +2 ∘C by the end of the century, not shown), the impact of this increase on the frequency of the MCSs cannot be simulated by these models (50 km) because MCSs occur on scales that are not resolved by these models. Hence, we suggest that over the Sahel, precipitation intensity may increase more than projected in our study, as result of the increasing meridional temperature gradient between the Sahel and the Sahara. For instance, Berthou et al. (2019) have shown that over the West Sahel, future changes in extreme rainfall increase by a factor 5 to 10 at 4.5 km resolution (convection-permitting model allowing a good representation of MCSs), as compared to a factor 2 to 3 at 25 km resolution. Similarly, the impacts of atmospheric aerosols, particularly abundant over West Africa due to seasonal desert dusts (Konare et al., 2008; N'Datchoh Touré et al., 2018), are only partially accounted for in CORDEX-Africa due to the simplified parameterization schemes for aerosols in this dataset. However, because aerosols are expected to affect temperature and precipitation in this region (e.g., Konare et al., 2008; N'Datchoh Touré et al., 2018), we suggest that our results are also limited by this simplified representation of aerosols. Additional simulations at higher resolution and using a more complex parameterization scheme for aerosols would be required to identify the impact of MCSs and aerosols on our results, which is beyond the scope of our study.
The CORDEX-Africa dataset from the World Climate Research Program's (WCRP) Working Group on Regional Climate is freely available to download at http://www.cordex.org/data-access/esgf/ (WCRP CORDEX, 2019). The CHIRPS dataset from the Climate Hazards Group is freely available to download at http://chg.geog.ucsb.edu/data/chirps (CHIRPS, 2017). Parts of the BADOPLUS dataset are freely available to download at http://www.amma-catch.org/ (AMMA-CATCH, 2017), while the other part belongs to the national meteorological institutes of Senegal (Dakar), Burkina Faso (Ouagadougou), and Ghana (Accra).
The supplement related to this article is available online at: https://doi.org/10.5194/esd-11-319-2020-supplement.
AB and AD fixed the analysis framework. ST carried out all calculations and analyses and produced graphs. All authors contributed to the redaction.
The authors declare that they have no conflict of interest.
This work is a contribution to the CORDEX-Africa initiative. We acknowledge the use of the CORDEX-Africa dataset from the World Climate Research Program's Working Group on Regional Climate (http://www.cordex.org/data-access/esgf/) and the CHIRPS dataset from the Climate Hazards Group (http://chg.geog.ucsb.edu/data/chirps). Our work has benefited from access to rainfall datasets provided by the AMMA-CATCH observatory, the AMMA international program, DMN Burkina, ANACIM, and DMN Niger; we sincerely thank all of them, as well as the staff at the IGE computation center (Guillaume Quantin, Véronique Chaffard, Patrick Juen, and Wajdi Nechba) for their technical support, and Geremy Panthou for his role in accessing the data and insights into the dataset. We also thank the staff at the IGE computation center (Patrick Juen and Wajdi Nechba) for their technical support.
This research has been supported by the African Center of Excellence on Climate Change, Biodiversity and Sustainable Agriculture (ACE CCBAD), the NERC/DFID “Future Climate for Africa” program under the AMMA-2050 project (grant no. NE/M019969/1), and the French public research institution IRD (Institut de Recherche pour le Développement; France).
This paper was edited by Ben Kravitz and reviewed by two anonymous referees.
Allen, M. R. and Ingram, W. J.: Constraints on future changes in the hydrological cycle, Nature, 419, 224–228, 2002.
AMMA-CATCH: African Monsoon Multidisciplinary Analysis – Coupling the Tropical Atmosphere and the Hydrological Cycle, http://www.amma-catch.org/, last access: February 2017.
Berthou, S., Kendon, E., Rowell, D. P., Roberts, M. J., Tucker, S. O., and Stratton, R. A.: Larger future intensification of rainfall in the West African Sahel in a convection-permitting model, Geophys. Res. Lett., 46, 13299–13307, https://doi.org/10.1029/2019GL083544, 2019.
Bichet, A. and Diedhiou, A.: West African Sahel has become wetter during the last 30 years, but dry spells are shorter and more frequent, Clim. Res., 75, 155–162, 2018a.
Bichet, A. and Diedhiou, A.: Less frequent and more intense rainfall along the coast of the Gulf of Guinea in West and Central Africa (1981–2014), Clim. Res., 76, 191–201, 2018b.
Bichet, A., Hingray, B., Evin, G., Diedhiou, A., Kebe, C. M. F., and Anquetin, S.: Potential impact of climate change on solar resource in Africa for photovoltaic energy: analyses from CORDEX-AFRICA climate experiments, Environ. Res. Lett., 14, 12403, https://doi.org/10.1088/1748-9326/ab500a, 2019.
Bichet, A., Diedhiou, A., Hingray, B., Evin, G., N'Datchoh Touré, E., Klutse, N. A. B., and Kouadio, K.: Assessing uncertainties in the regional projections of precipitation in CORDEX-AFRICA, Climatic Change, in review, 2020.
Climate Hazards Center, CHIRPS: Rainfall Estimates from Rain Gauge and Satellite Observations, available at: http://chg.geog.ucsb.edu/data/chirps, last access: February 2017.
Collins, M., Knutti, R., Arblaster, J., Dufresne, J.-L., Fichefet, T., Friedlingstein, P., Gao, X., Gutowski, W. J., Johns, T., Krinner, G., Shongwe, M., Tebaldi, C., Weaver, A. J., and Wehner, M.: Long-term Climate Change: Projections, Commitments and Irreversibility, in: Climate Change 2013: The Physical Science Basis. Contribution of Working Group I to the Fifth Assessment Report of the Intergovernmental Panel on Climate Change, edited by: Stocker, T. F., Qin, D., Plattner, G.-K., Tignor, M., Allen, S. K., Boschung, J., Nauels, A., Xia, Y., Bex, V., and Midgley, P. M., Cambridge University Press, Cambridge, UK and New York, NY, USA, 2013.
Diedhiou, A., Bichet, A., Wartenburger, R., Seneviratne, S. I., Rowell, D. P., Sylla, M. B., Diallo, I., Todzo, S., N'datchoh Touré, E., Camara, M., Ngounou Ngatchah, B., Kane, N. A., Tall, L., and Affholder, F.: Changes in climate extremes over West and Central Africa at 1.5 ∘C and 2 ∘ C global warming, Environ. Res. Lett., 13, 065020, https://doi.org/10.1088/1748-9326/aac3e5, 2018.
Dosio, A., Jones, R. G., Jack, C., Lennard, C., Nikulins, G., and Hewitson, B.: What can we know about future precipitation in Africa? Robustness, significance and added value of projections from a large ensemble of regional climate models, Clim. Dynam., 53, 5833–5858, https://doi.org/10.1007/s00382-019-04900-3, 2019.
Froidurot, S. and Diedhiou, A.: Characteristics of wet and dry spells in the West African monsoon system, Atmos. Sci. Lett., 18, 125–131, 2017.
Funk, C., Peterson, P., Landsfeld, M., Pedreros, D., Verdin, J., Shukla, S., Husak, G., Rowland, J., Harrison, L., Hoell, A., and Michaelsen, J.: The climate hazards infrared precipitation with stations a new environmental record for monitoring extremes, Sci. Data, 2, 150066, https://doi.org/10.1038/sdata.2015.66, 2015.
Giorgi, F., Jones, C., and Asrar, G.: Addressing climate information needs at the regional level. The CORDEX framework, WMO Bulletin, 58, 175–183, 2009.
Giorgi, F., Im, E.-S., Coppola, E., Diffenbaugh, N. S., Gao, X. J., Mariotti, L., and Shi, Y.: Higher hydroclimatic intensity with global warming, J. Climate, 24, 5309–5324, https://doi.org/10.1175/2011JCLI3979.1, 2011.
Giorgi, F., Coppola, E., and Raffaele, F.: A consistent picture of the hydroclimatic response to global warming from multiple indices: Models and observations, J. Geophys. Res.-Atmos., 119, 11695–11708, https://doi.org/10.1002/2014JD022238, 2014.
Hewitson, B., Lennard, C., Nikulin, G., and Jones, C.: CORDEX-Africa: A unique opportunity for science and capacity building, CLIVAR Exchanges 60, International CLIVAR Project Office, Southampton, UK, 6–7, 2012.
Jones, C., Giorgi, F., and Asrar, G.: The coordinated regional downscaling experiment: CORDEX an international downscaling link to CMIP5, CLIVAR Exchanges, 56, 34–40, 2011.
Kim, J., Waliser, D. E, Mattmann, C. A., Gooodale, C. E.,Hart, A. F., Zimdars, P. A., Crichon, D. J., Jones, C., Nikulin, G., Hewitson, B., Jack, C., Lennard, C., and Favre, A.: Evaluation of the CORDEX-Africa multi-RCM hindcast: Systematic model errors, Clim. Dynam., 42, 1189–1202, https://doi.org/10.1007/s00382-013-1751-7, 2014.
Klutse, N. A. B., Ajayi, V. O., Gbobaniyi, E. O., Egbebiyi, T. S., Kouadio, K., Nkrumah, F., Quagraine, K. A., Olusegun, C., Diasso, U., Abiodun, B. J., Lawal, K., Nikulin, G., Lennard, C., and Dosio, A.: Potential impact of 1.5 ∘C and 2 ∘C global warming on consecutive dry and wet days over West Africa, Environ. Res. Lett., 13, 055013, https://doi.org/10.1088/1748-9326/aab37b, 2018.
Knutti, R., Furrer, R., Tebaldi, C., Cermak, J., and Meehl, G.A.: Challenges in Combining Projections from Multiple Climate Models, J. Climate, 23, 2739–2758, https://doi.org/10.1175/2009JCLI3361.1, 2010.
Konare, A., Zakey, A. S., Solmon, F., Giorgi, F., Rauscher, S., Ibrah, S., and Bi, X.: A regional climate modeling study of the effect of desert dust on the West African monsoon, J. Geophys. Res., 113, D12206, https://doi.org/10.1029/2007JD009322, 2008.
Mohan, T. and Rajeevan, M.: Past and future trends of hydroclimatic intensity over the Indian monsoon region, J. Geophys. Res.-Atmos., 122, 896–909, 2017.
N'Datchoh Touré, E., Diallo, I., Konaré, A., Silué, S., Ogunjobi, K. O., Diedhiou, A., and Doumbia, M.: Dust induced changes on the West African summer monsoon features, Int. J. Climatol., 38, 452–466, https://doi.org/10.1002/joc.5187, 2018.
Panthou, G., Vischel, T., Lebel, T., Blanchet, J., Quantin, G., and Ali, A.: Extreme rainfall in West Africa: a regional modeling, Water Resour. Res., 48, W08501, https://doi.org/10.1029/2012WR012052, 2012.
Sylla, M. B., Nikiema, P. M., Gibba, P., Kebe, I., and Klutse, N. A. B.: Climate change over West Africa: recent trends and future projections, in: Adaptation to climate change and variability in rural West Africa, edited by: Yaro, J. A. and Hesselberg, J., Springer International Publishing, Basel, Switzerland, 25–40, 2016.
Taylor, C. M., Belušić, D., Guichard, F., Parker, D. J., Vischel, T., Bock, O., Harris, P. P., Janicot, S., Klein, C., and Panthou, G.: Frequency of extreme Sahelian storms tripled since 1982 in satellite observations, Nature, 544, 475–488, https://doi.org/10.1038/nature22069, 2017.
Vizy, E. K. and Cook, K. H.: Mid-twenty-first-century changes in extreme events over northern and tropical Africa, J. Climate, 25, 5748–5767, https://doi.org/10.1175/JCLI-D-11-00693.1, 2012.
WCRP CORDEX: ESGF, available at: http://www.cordex.org/data-access/esgf/, last access: August 2019.
Zhang, X., Alexander, L., Hegerl, G. C., Jones, P., Klein Tank, A., Peterson, T. C., Trewin, B., and Zwiers, F. W.: Indices for monitoring changes in extremes based on daily temperature and precipitation data, WIRES Clim. Change, 2, 851–870, 2011.
Zwiers, F. W., Alexander, L. V., Hegerl, G. C., Knutson, T. R., Kossin, J., Naveau, P., Nicholls, N., Schär, C., Seneviratne, S. I., and Zhang, X.: Challenges in estimating and understanding recent changes in the frequency and intensity of extreme climate and weather events, in: Climate Science for Serving Society: Research, Modeling and Prediction Priorities, edited by: Asrar, G. R. and Hurrell, J. W., https://doi.org/10.1007/978-94-007-6692-1_13, 2013.