the Creative Commons Attribution 4.0 License.
the Creative Commons Attribution 4.0 License.
 | 29 Oct 2019
Organization of dust storms and synoptic-scale transport of dust by Kelvin waves
Ashok Kumar Pokharel
Michael L. Kaplan
Based on the large-scale transport of dust driven by the winds parallel to the mountains in the Harmattan, Saudi Arabian, and Bodélé Depression dust storm cases, a detailed study of the generation of Kelvin waves and its possible role in organizing these dust storms and large-scale dust transport was accomplished. For this study, observational and numerical model analyses were done in an in depth manner. For this, MERRA reanalysis data sets; WRF-simulated high-resolution variables; MODIS Aqua and Terra images; EUMETSAT images; NAAPS aerosol modeling plots; and MERRA-2 dust scattering aerosol optical depth (AOD) modeling plots, surface observations, and rawinsonde soundings were analyzed for each of these three case studies. We found that there were meso-β-scale (horizontal length scale of 20–200 km) adjustment processes resulting in Kelvin waves only in the Harmattan and the Bodélé Depression cases. The Kelvin wave preceded a cold pool accompanying the air behind the large-scale cold front instrumental in the major dust storm. We find that this Kelvin wave organized the major dust storm in a narrow zone parallel to the mountains before it expanded upscale (meso-α to synoptic).
- Article
(34186 KB) - Full-text XML
- BibTeX
- EndNote


The Sahara is dominated most of the year by the northeasterly wind-driven dry and hot air originating from the anticyclonic system centered over the North Atlantic Ocean (Shao, 2000). It has been shown that the transport of dust from the Sahara takes place in discrete outbreaks of several days and outbreak location and direction changes with the fluctuations of the Intertropical Convergence Zone (ITCZ) seasonally (Swap et al., 1996; Moulin et al., 1998). The annual maximum dust storm frequency and intensity period in the Sahara usually takes place in late winter and spring (Swap et al., 1996).
In Africa there are two preferred dust source regions: the first comprises Algeria, Mauritania, and Morocco, from which dust is transported over the Atlantic and as far west as the Barbados Islands, and the second is the Chad Basin, which exports dust to countries around the Gulf of Guinea (Balogun, 1974). The Bodélé Depression, which lies in the Chad Basin, is the most intense and perpetual dust source in the world followed by the western Sahara and has become the biggest and most persistent dust emission source on the global scale because of the availability of large amounts of deflatable material and strong wind systems to facilitate the long-range transport of material (Engelstaedter et al., 2006). The emission of dust from the Bodélé Depression takes place throughout the year though the peak emission occurs in winter and spring (Washington and Todd, 2005; Washington et al., 2006). These facts indicate the importance of the study of the Harmattan and Bodélé Depression dust storms. Studies of these phenomena have been increasing since these two systems deliver a significant amount of dust equatorward, causing severe negative impacts on visibility, agriculture, and human health (e.g., causes meningitis) (Burton et al., 2013; Kalu, 1979; Pérez García-Pando et al., 2014).
Alharbi et al. (2013) state that dust storms in Saudi Arabia are very frequent. Washington et al. (2003) indicate that eastern and central Saudi Arabia are also areas of dust storm activity. The primary local source of dust storm activity in Saudi Arabia is the Rub Al Khali. Additional remote sources are the Sahara for western Saudi Arabia and Iraqi deserts for the northern and eastern part of Saudi Arabia (Notaro et al., 2013). These frequent dust storms in Saudi Arabia and the arid and semiarid areas around the Arabian Sea are some of the most important global dust sources (Kutiel and Furman, 2003). Hamidi et al. (2013) mentioned that the Tigris–Euphrates alluvial plain was the major dust source in the Middle East. Alharbi et al. (2013) mentioned that the severe dust storm of 10 March 2009 was one of the most intense dust storms experienced in Saudi Arabia over the last 2 decades.
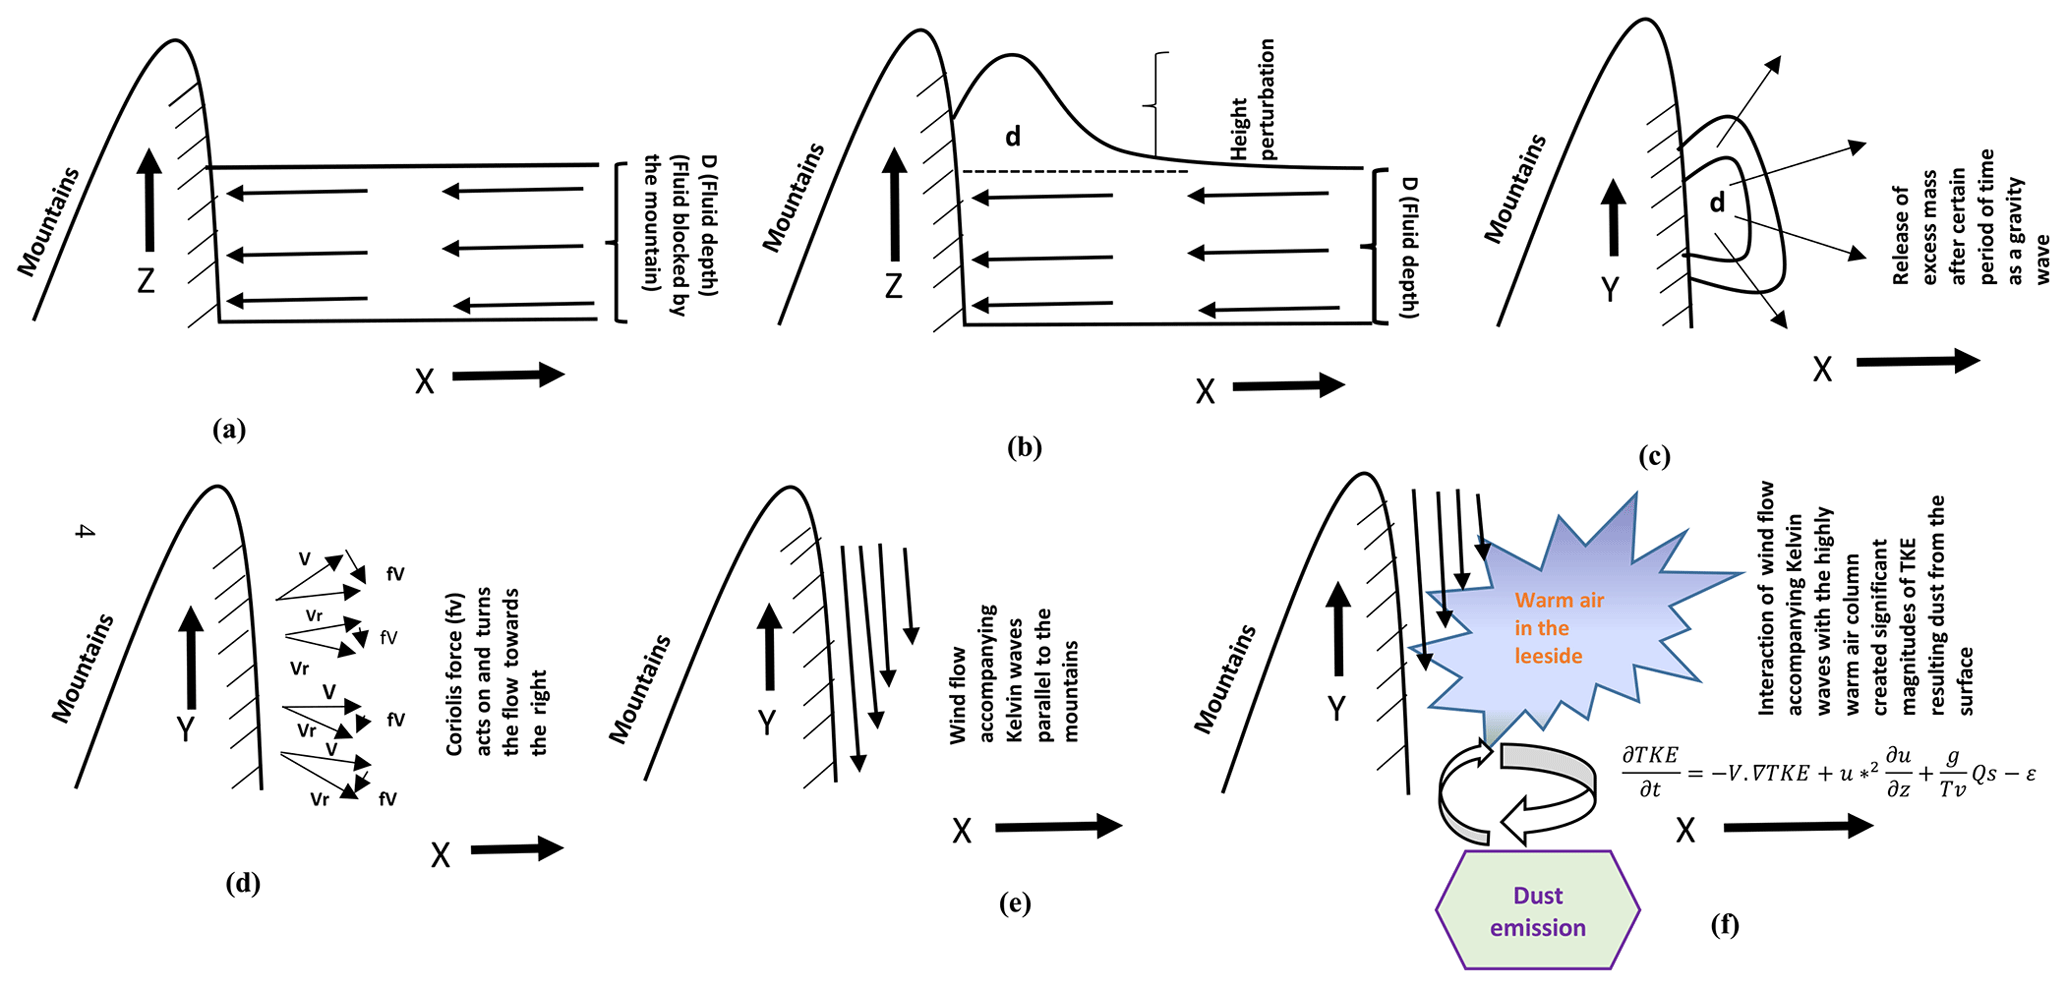
Figure 1Schematic diagram shows the blocking of the flow, height perturbation, excess mass release, acting of the Coriolis force and turning of the flow towards the right to achieve a balance, wind flow accompanying Kelvin waves propagating along the mountains, and interaction of this wind accompanying Kelvin waves with the warm air column, resulting in significant turbulence kinetic energy (TKE) leading to dust storm.
All three severe dust storms – (1) Harmattan dust storm of 2 March 2004 in northwest Africa, (2) Saudi dust storm of 9 March 2009, and (3) Bodélé Depression dust storm of 8 December 2011, that occurred in the lee of the mountains – were caused by downslope wind effects and jet adjustment processes (Pokharel et al., 2017a, b). During these events the winds were also parallel to the lee of the respective mountains (Atlas Mountains in the Harmattan case, Sarawat Mountains in the Saudi case, and Tibesti Mountains in the Bodélé Depression case). The locations of strong dynamics for these case studies is shown by the Modern-Era Retrospective analysis for Research and Applications (MERRA) data sets. Over time the wide distribution of dust ablated and transported away from the mountains in each of these cases indicated that a possible role of terrain-induced waves such as Kelvin waves may be important in transporting dust from these three severe dust storms events. For this study, it was hypothesized that the first organization of dust storms and spread of dust into the larger-scale circulations were facilitated by Kelvin waves (the generation of Kelvin waves is illustrated by a schematic diagram in Fig. 1). In this study, we have pursued an evaluation of the possible role of Kelvin waves in the organization of strong dust transport events. The next section includes a literature review of Kelvin waves followed by research methodology, results and discussion, and conclusion for our analyses of dust storm genesis and dust transport.
Relevant theories of Kelvin waves
Wang (2002) stated that a Kelvin wave is a relatively long-wavelength gravity wave affected by the earth's rotation that is trapped along a lateral boundary, e.g., mountain ranges or coastlines. The generation and type of Kelvin wave relies on the relative importance of the restoring force of gravity accompanying stable stratification, the significance of the Coriolis acceleration, and the nature of the physical boundary including the possible role of the proximity of the Equator. To create a Kelvin wave in this study's region of interest, e.g., the Atlas Mountains in northwest Africa, the following processes (schematic Fig. 1) must occur: (1) early on, the shallow cold pool of air is blocked by the Atlas Mountains due to a lack of sufficient kinetic energy to force air parcels over the mountain, causing a buildup of mass as a height perturbation in the area immediately adjacent to it; (2) after a certain period of time that is than an inertial period (, where f is the Coriolis parameter), this buildup of excess mass is released as a gravity wave or buoyancy wave signal or undulation in a free surface near the terrain (Thomson, 1879); (3) as time progresses towards 2π∕f, the Coriolis force acts on and turns the flow towards the right in a very slow effort to achieve balance; (4) as this process continues, wind flow becomes parallel to the mountains as a distinct wind perturbation in conjunction with the aforementioned free surface undulation; and (5) in time, the wind accompanying this Kelvin wave accelerates parallel to the mountain (Tilley, 1990).
To study these three dust events in detail, we have used Meteosat-8 dust images captured from the European Organization for the Exploitation of Meteorological Satellites (EUMETSAT) (http://www.eumetsat.int/website/home/Images/ImageLibrary/DAT_IL_04_03_06_F.html; last access: 4 December 2014); a composite of the Moderate Resolution Imaging Spectroradiometer (MODIS) Aqua and Terra (level 1b, collection 51, 1 km horizontal resolution, and RGB composite) (https://ladsweb.nascom.nasa.gov, last access: 10 February 2016) (Fig. 2a); and aerosol optical depth (AOD) derived from the MODIS Aqua instrument (level 3 daily (D3)). Rawinsonde soundings obtained from the University of Wyoming and observational surface data from Weather Underground were also analyzed. The low-resolution evolution of the dust storms are studied with an aerosol–weather model simulation of horizontal resolution from the Navy Aerosol Analysis and Prediction System (NAAPS) (https://www.nrlmry.navy.mil/aerosol_web/, last access: 5 May 2016). Besides this, the Modern-Era Retrospective analysis for Research and Applications-2 (MERRA-2) model (spatial resolution ∘) hourly data sets were used to analyze the dust scattering (AOD) 550 nm of 1 µm particulate matter (PM) over this region of interest (https://giovanni.gsfc.nasa.gov/giovanni/, last access: 4 September 2017).
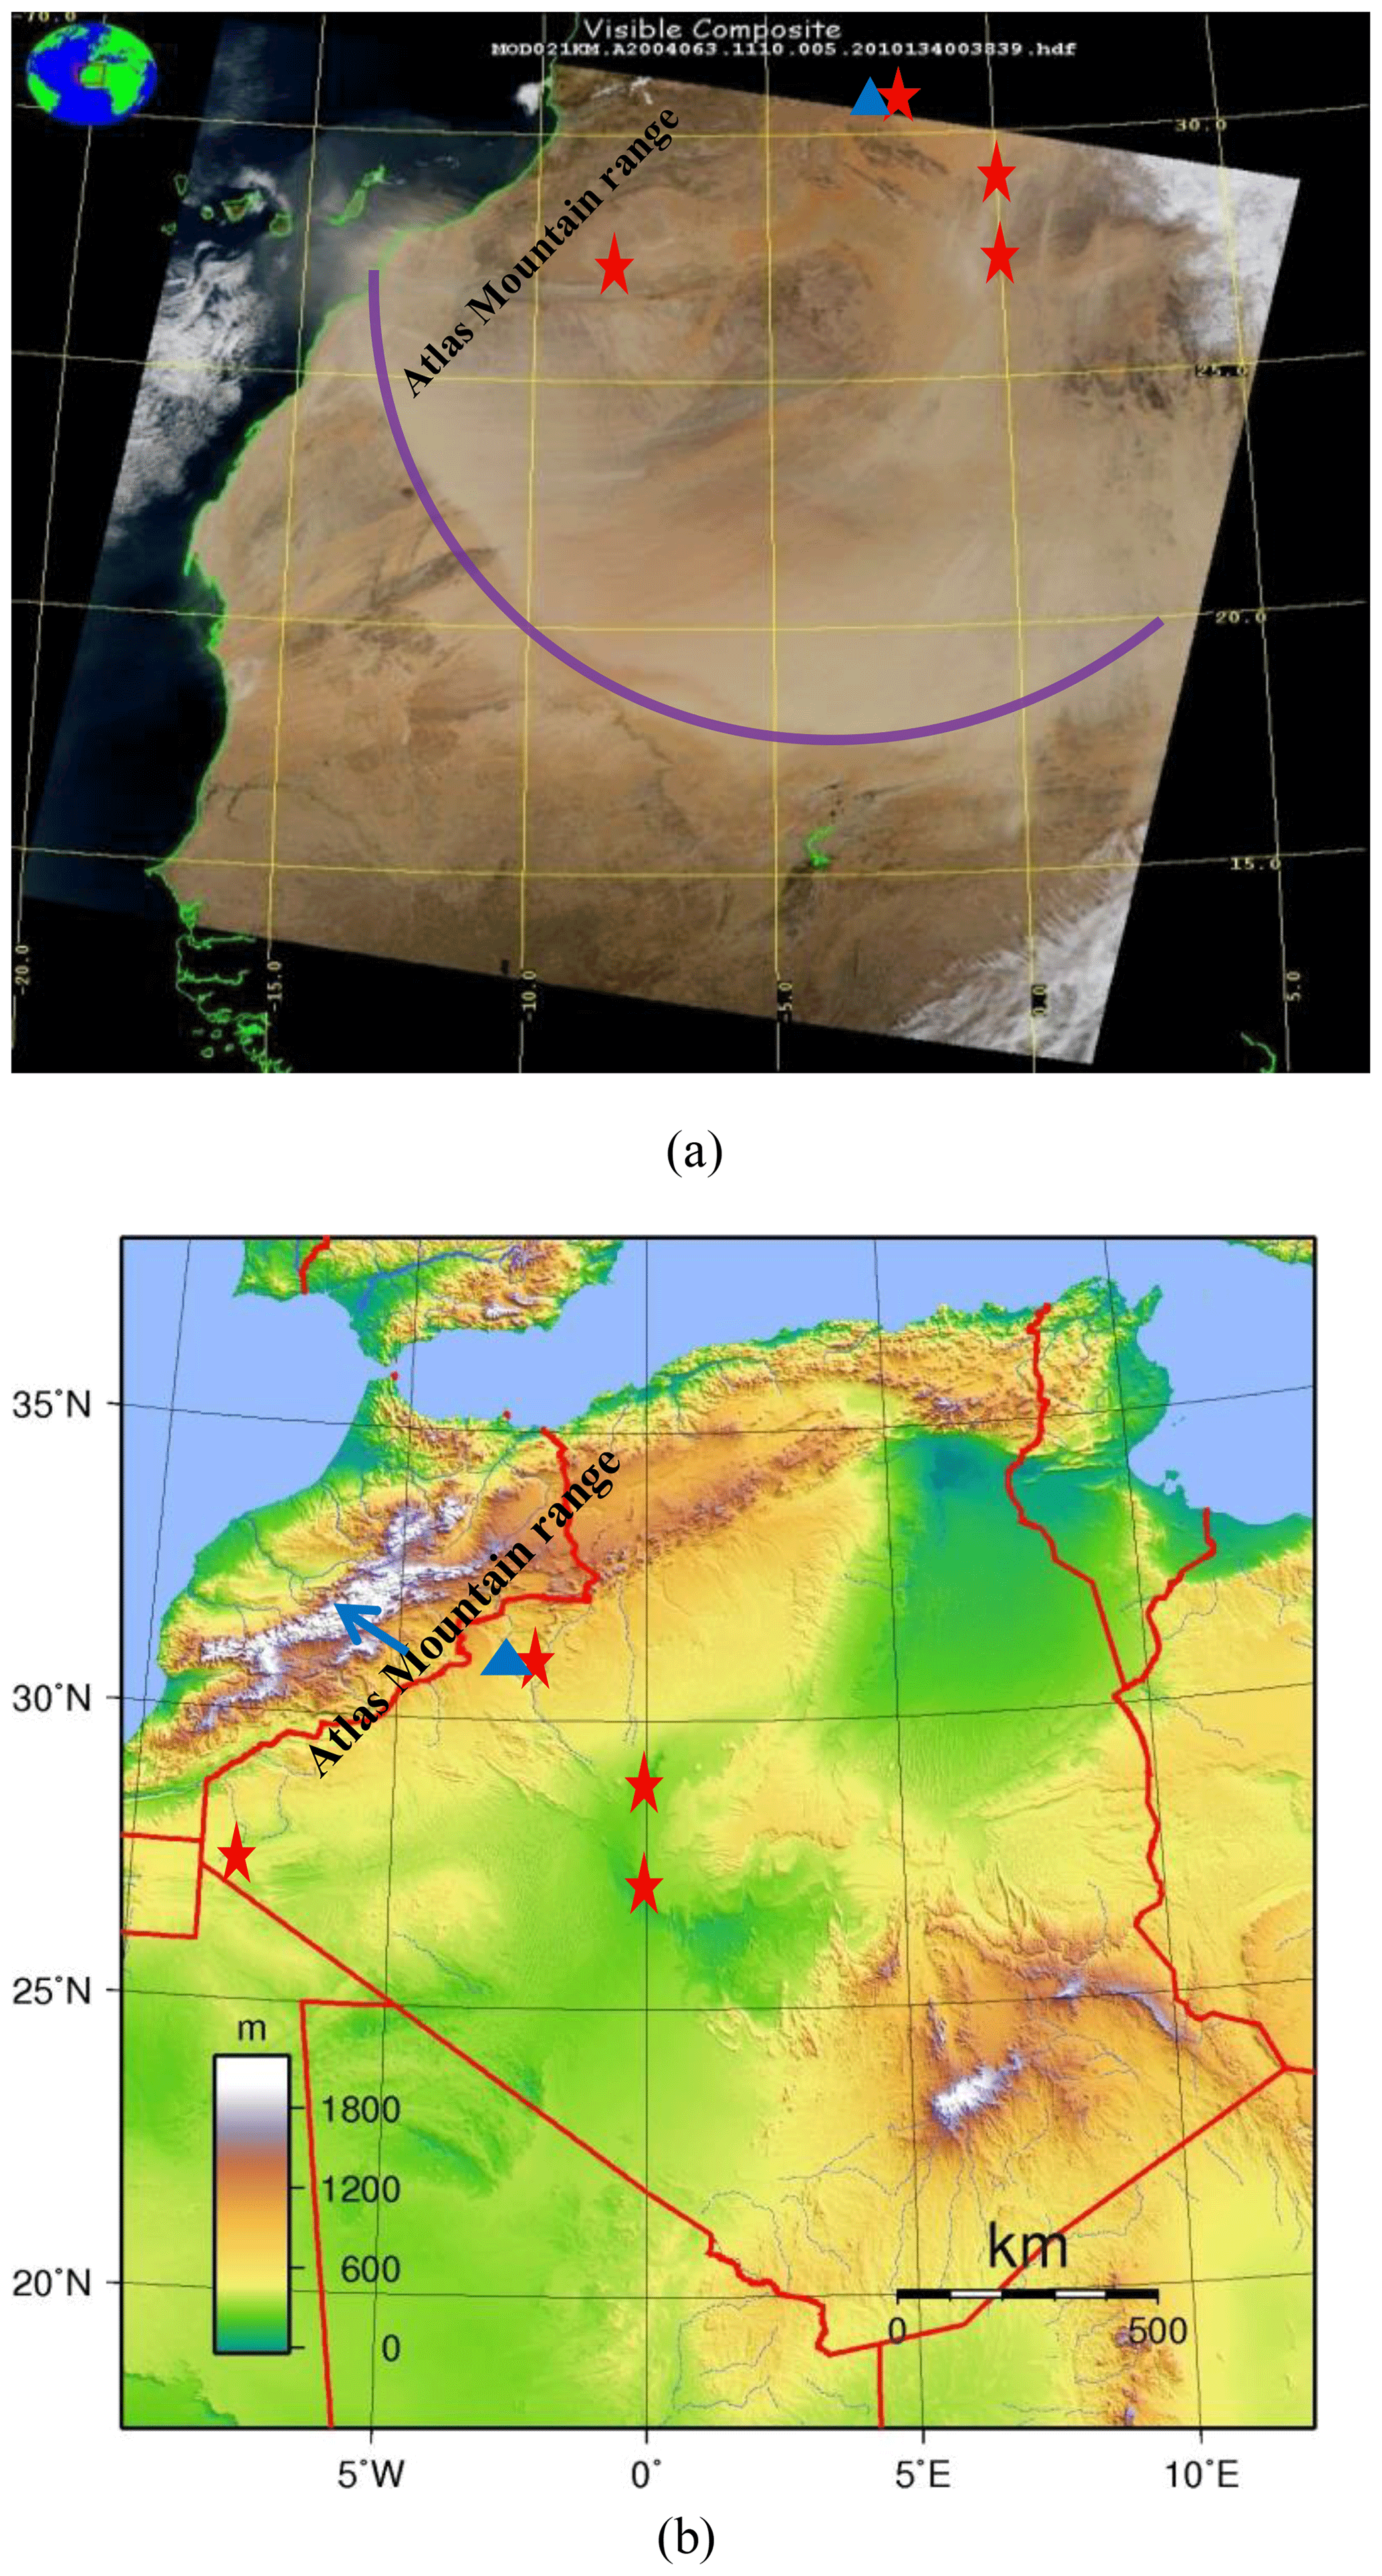
Figure 2(a) Dust storm image captured by MODIS AQUA at 11:10 UTC on 3 March 2004 (source: https://ladsweb.nascom.nasa.gov). The purple colored arc depicts the outline of the arc of dust plume. The red stars indicate surface stations (Bechar, Tindouf, Timimoun, and Adrar) in Algeria of which x and y coordinates are mentioned in Sect. 3.1.1 (Harmattan dust storm case study), which captured the dust storms on 2 March 2004 (source: https://www.wunderground.com/, last access: 26 May 2016; Pokharel et al., 2017b). The blue triangle indicates the soundings station at Bechar in Algeria. (b) Topographical map of Algeria (http://www.carte-algerie.com/carte-algerie/carte-topographique-algerie.jpg, last access: 12 October 2019) in which the red star indicates surface stations (Bechar, Tindouf, Timimoun, and Adrar), which experienced the dust storms on 2 March 2004 (source: https://www.wunderground.com/). The blue colored triangle indicates the soundings station at Bechar in Algeria.
For the study of synoptic to meso-scale observational atmospheric processes that organize conditions favorable for a Kelvin wave, surface pressure, geopotential height, air temperature, wind speed and direction, vertical motion, vertically integrated atmospheric mass tendency, and kinetic energy due to the pressure gradient force obtained from the Modern-Era Retrospective analysis for Research and Applications (MERRA) model (https://disc.sci.gsfc.nasa.gov/mdisc/data-holdings/merra/merra_products_nonjs.shtml, last access: 8 November 2014; Rinecker et al., 2011) were analyzed. These data were used to create horizontal cross sections at different pressure levels, as well as vertical cross sections of u and v wind speed, and isentropic surfaces at a resolution of .
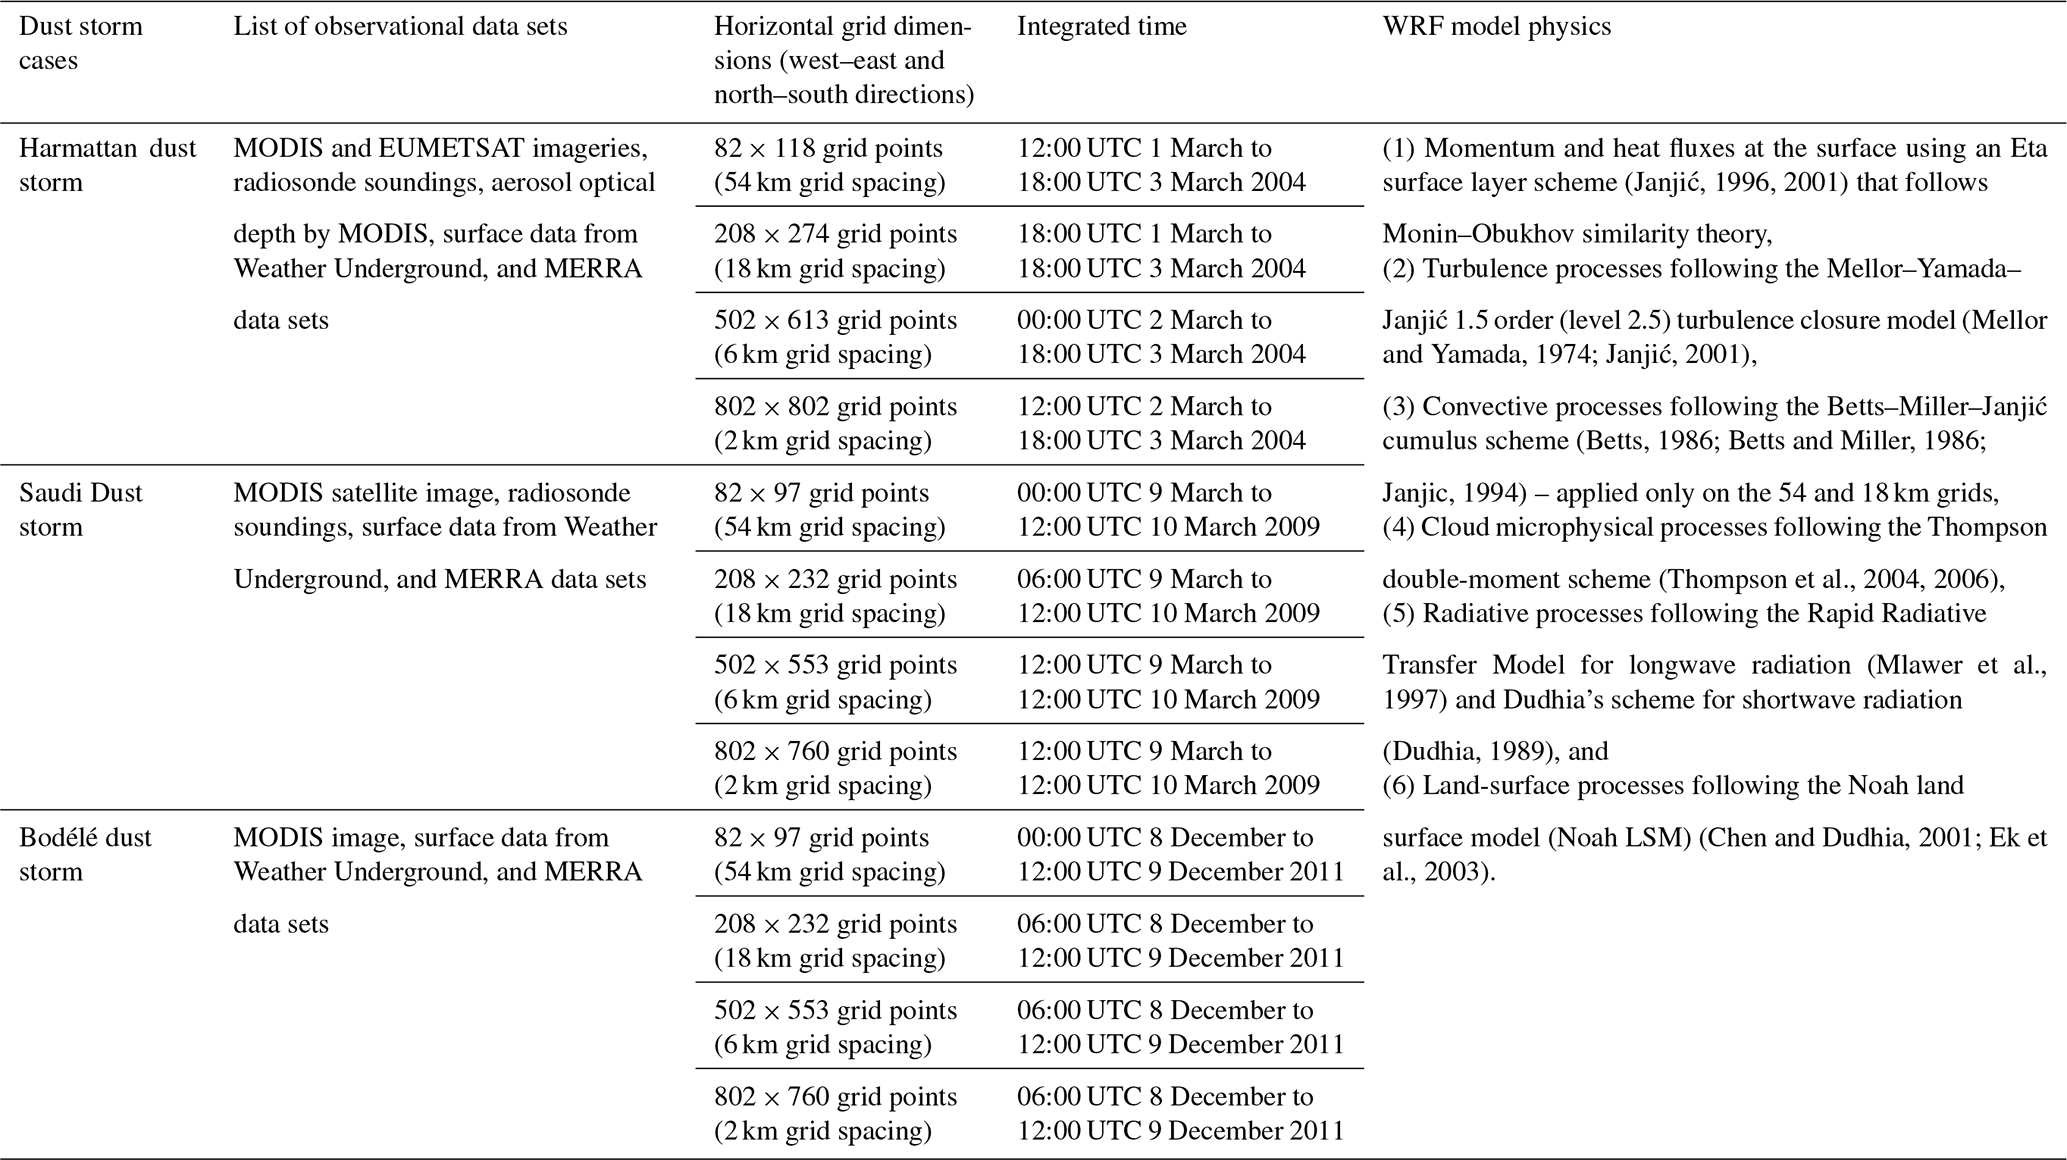
In order to get finer temporal and spatial resolutions of the atmospheric processes, which were involved in the dust storms, the non-hydrostatic Weather Research and Forecasting (WRF) model (Skamarock et al., 2008) was run for each dust storm, given in Table 1. Four nested domains with horizontal resolutions of 54, 18, 6, and 2 km were generated, of which resolutions higher than 18 km were run with moist convection turned off as a parameterization because convection was virtually nonexistent in these cases. The lateral boundary condition data of the parent domain with the lowest resolution were from the National Centers for Environmental Prediction (NCEP) Global Forecasting System (GFS) () products. Three domains were then nested into the parent domain having 18, 6, and 2 km. The WRF simulated domains for the three cases are presented in Figs. 3 and 9. The following six physical parameterizations were applied in WRF simulations in each of the three cases: (i) momentum and heat fluxes at the surface (Janjić, 1996, 2001) following Monin–Obukhov similarity theory, (ii) turbulent mixing following the Mellor–Yamada–Janjić 1.5 order (level 2.5) turbulence closure model (Mellor and Yamada, 1974; Janjić, 2001), (iii) moist convection following the Betts–Miller–Janjić cumulus scheme (Betts, 1986; Betts and Miller, 1986; Janjic, 1994) – only for the simulations with 54 and 18 km resolutions, (iv) cloud microphysical processes following the Thompson double-moment scheme (Thompson et al., 2004, 2006), (v) radiative processes following the Rapid Radiative Transfer Model for longwave radiation (Mlawer et al., 1997) and Dudhia's scheme for shortwave radiation (Dudhia, 1989), and (vi) land-surface processes from the Noah land surface model (Noah LSM) (Chen and Dudhia, 2001; Ek et al., 2003).
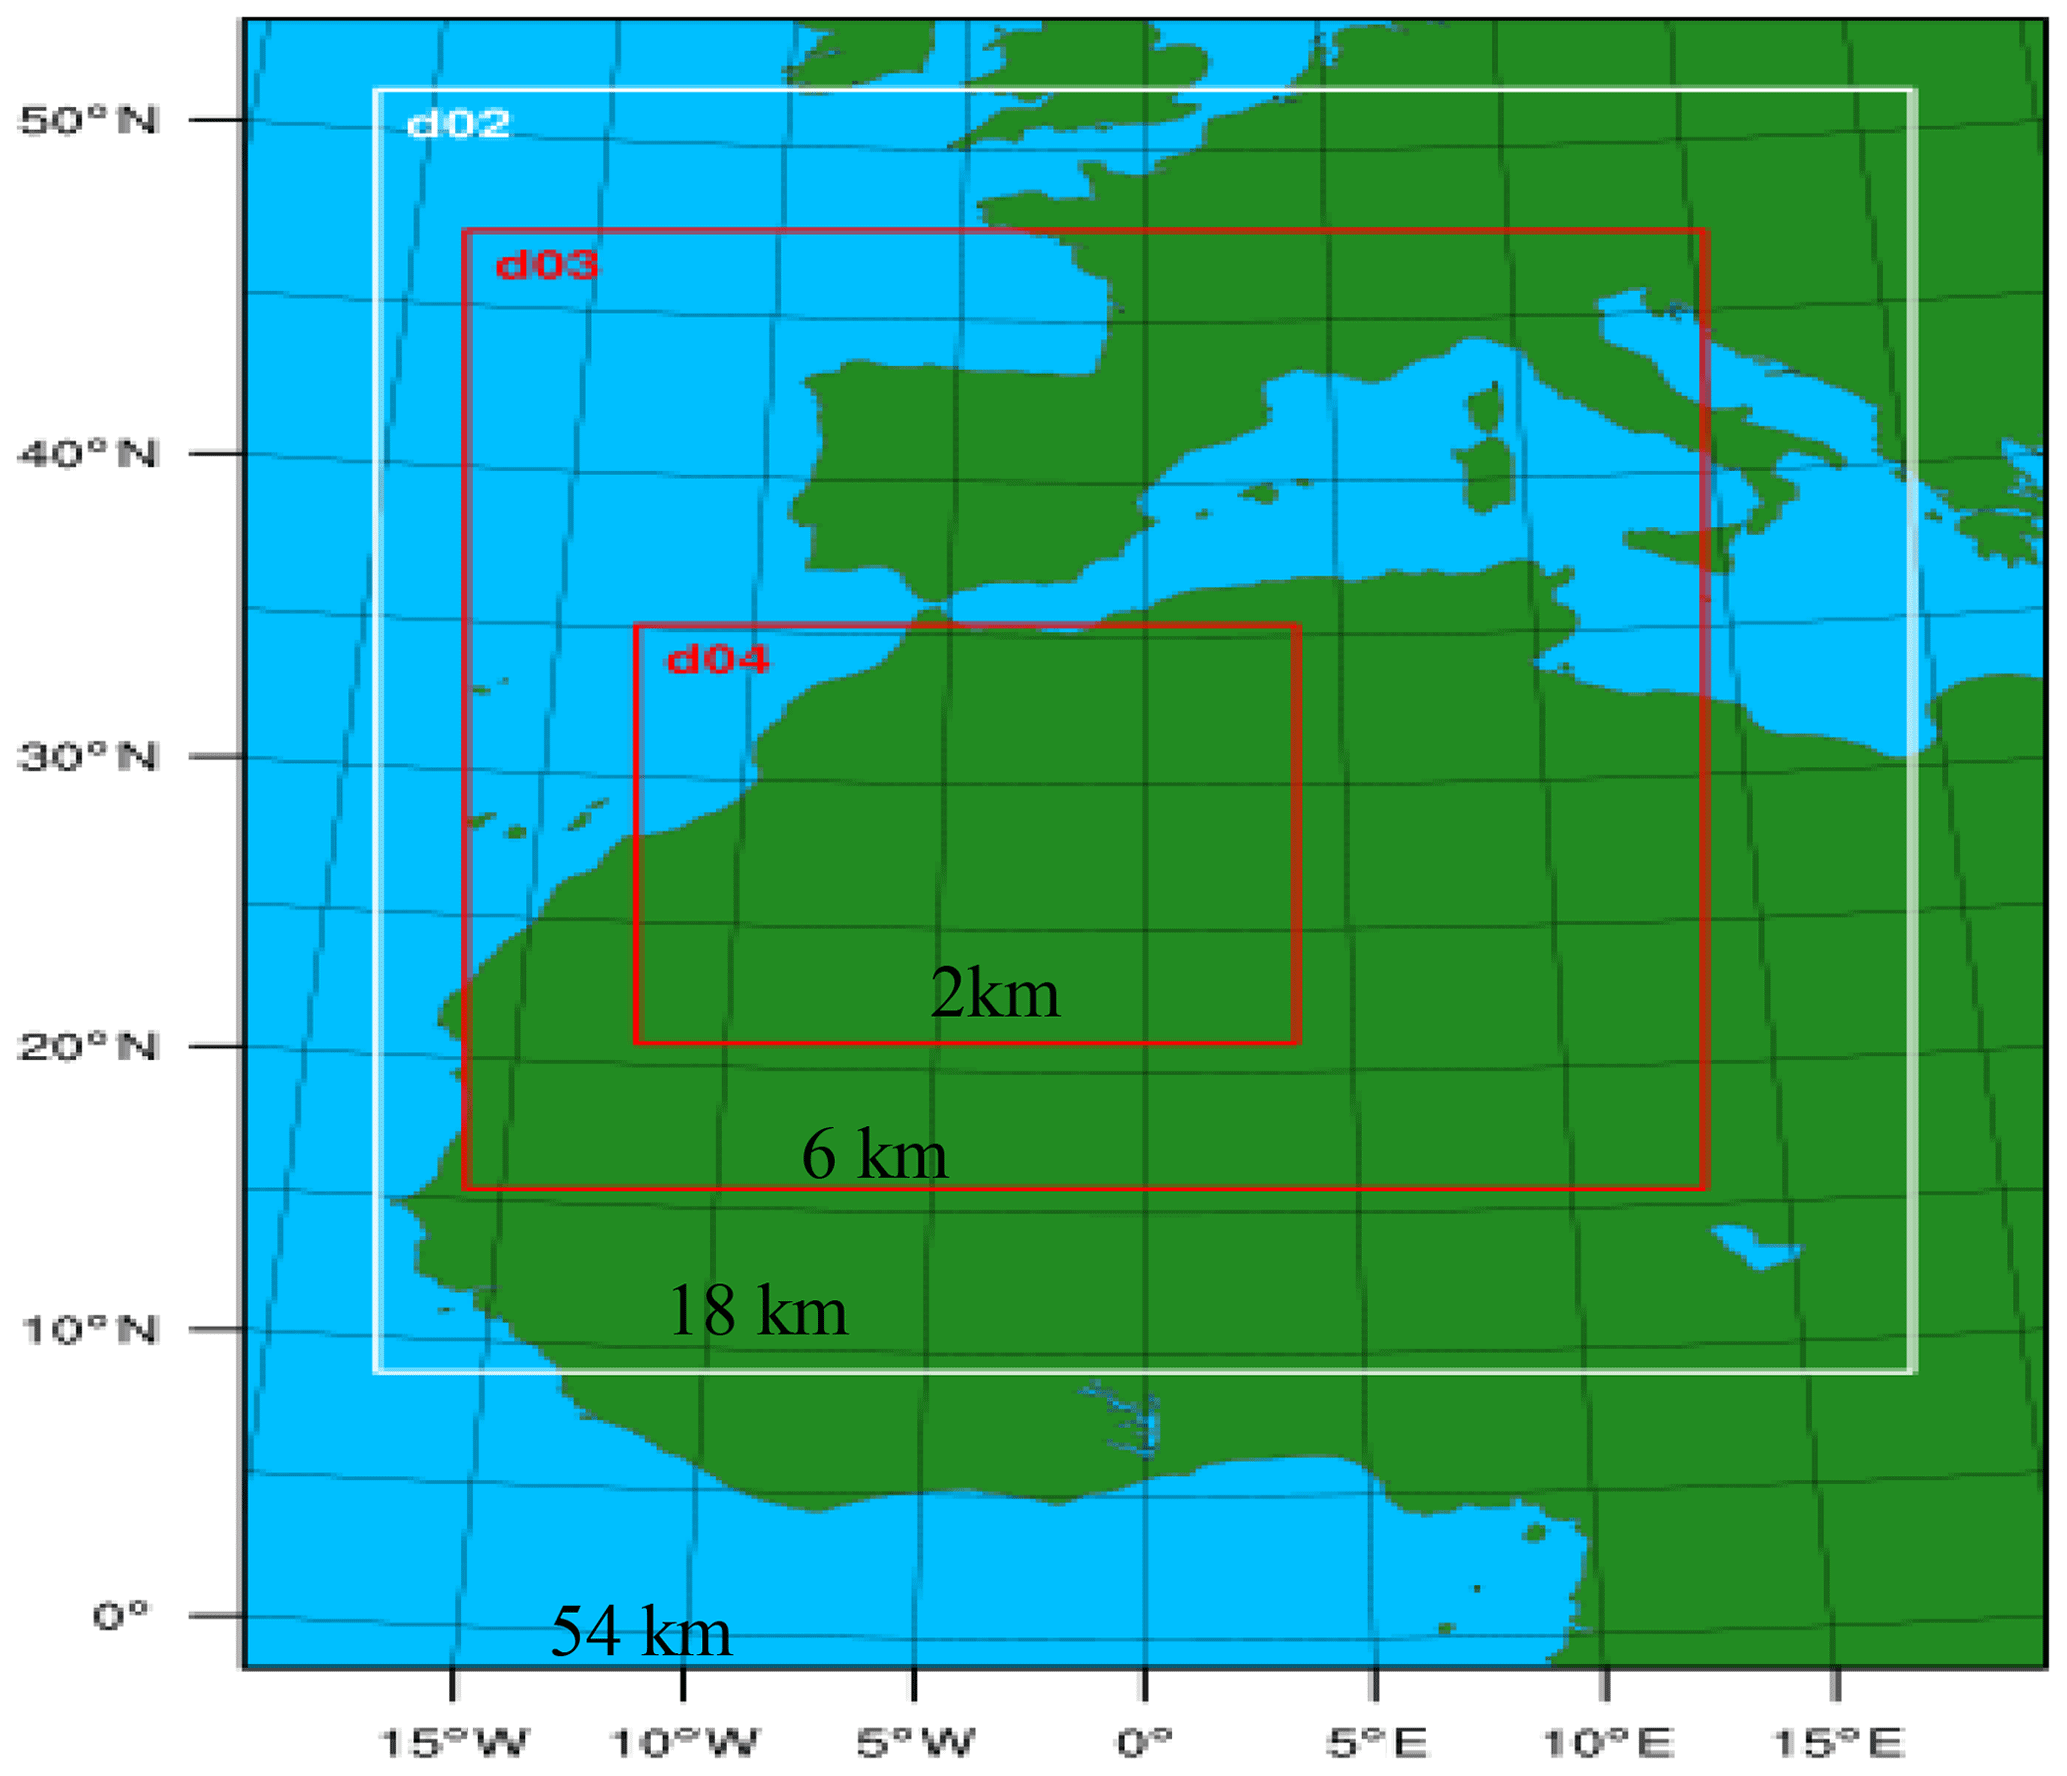
Figure 3WRF domain configuration for the Harmattan dust storm case in Fig. 2 (Pokharel, 2016). The do1, do2, do3, and do4 represent domains of 54, 18, 6, and 2 km resolutions, respectively.
Table 1List of observational data sets and horizontal grid dimensions, integration times, and WRF model physics applied in all three dust storm cases (Pokharel, 2016; Pokharel et al., 2017b).
3.1 Harmattan dust storm case study
3.1.1 Observational and model analyses
Since Bechar lies to the east of Atlas Mountains and is the nearest sounding station to the Atlas Mountains, it is logical to expect that the information regarding the vertical profiles of meteorological variables in the lee of the mountains could be well represented in the analysis of before and after the Kelvin wave formation. The sounding of 00:00 UTC 2 March shows that there was a thin inversion between 925 and 900 hPa (Fig. 4a). Above this, a dry adiabatic lapse rate between 900 and 585 hPa was present; again above this deep dry adiabatic layer, there was a presence of the shallow inversion layer, which was caused by a warm, stable thermal ridge. These different kinds of vertical temperature lapse rates indicate the presence of the discontinuous stratification of the atmosphere over this area at that time and also shows the necessity of higher resolution data sets to reveal the detailed processes involved.
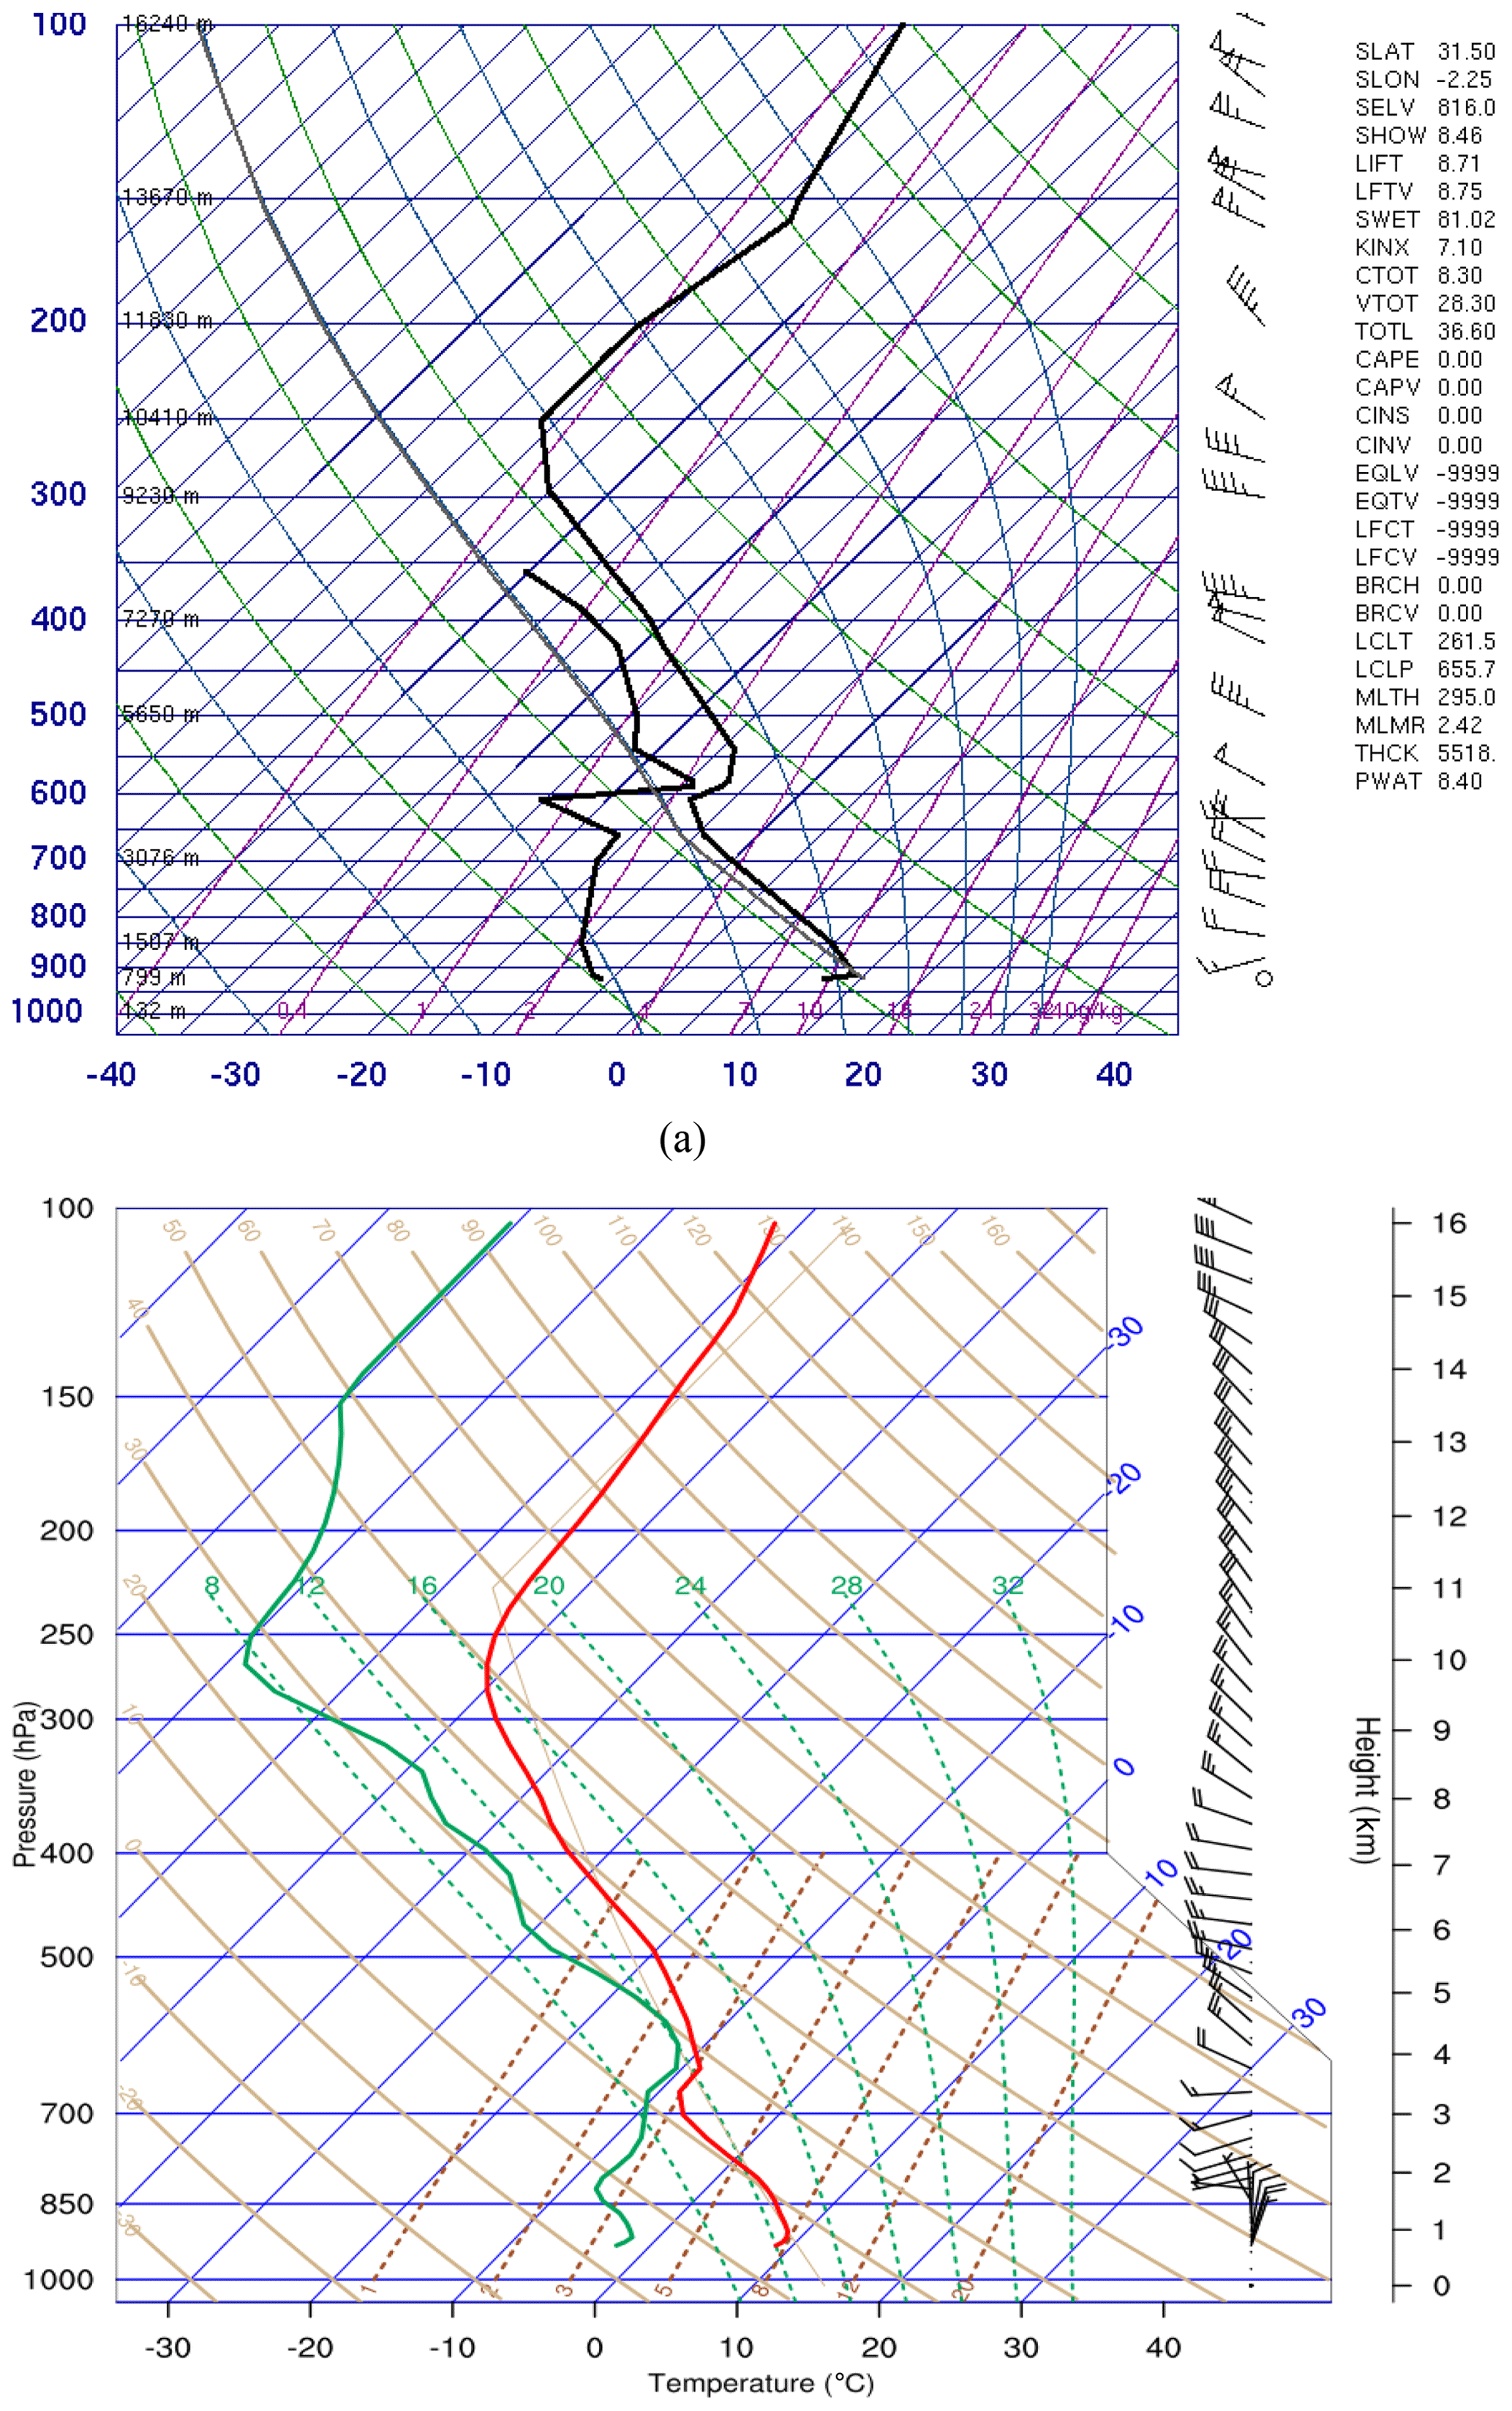
Figure 4(a) Atmospheric soundings at 00:00 UTC 2 March 2004 at Bechar in Algeria (source: University of Wyoming). (b) Atmospheric soundings at 00:00 UTC 2 March 2004 at Bechar in Algeria plotted from WRF simulation (6 km resolution).
Surface archived observational data sets by Weather Underground at Tindouf (27∘40′31′′ N, 8∘07′43′′ W) in Algeria showed that there was a major dust storm that occurred during the latter parts of 2 March 2004. This dust storm was associated with a surface north-northeasterly wind with a speed of 10 m s−1 after 22:00 UTC on 2 March. Besides this, Bechar (31∘37′ N, 2∘13′ W; northeast of Tindouf), Adrar (27∘52′ N, 0∘17′ W; east of Tindouf), and Timimoun (29∘15′46′′ N, 0∘14′20′′ W; east of Tindouf) experienced reduced visibility consistent with increased atmospheric optical depth and dust from 13:00 to 22:00, 14:00 to 23:00, and 13:00 to 16:00 UTC on 2 March, respectively (Pokharel et al., 2017b; Pokharel, 2016) (The locations of all these surface stations including a sounding station are shown in Fig. 2a and b.)
NAAPS shows that at 12:00 UTC of 2 March the evolution of the dust was over the northeast region of Algeria, including 20–28∘ N and 15–8∘ E and over time the dust expanded broadly and occupied the 18–35∘ N and 7∘ W–28∘ E region by 12:00 UTC on 3 March 2004. MERRA-2 also shows the dust scattering AOD reached 0.25 over this region. This event signal in NAAPS is consistent with the surface observations described above.
MERRA data sets show that there was a positively tilted trough (oriented northeast–southwest axis) in the southern part of Europe with an evolving ageostrophic wind indicative of the development of curved flow by the slight change of the wind direction (e.g., initiation of cyclonic curvature vorticity) near the trough axis at 28∘ N, 1∘ W to 32∘ N, 3∘ E at 00:00 UTC on 2 March 2004 (Fig. 5a and b). The geopotential height consistently showed a deep, cold positively tilted trough in time over the northwest part of Algeria. At 06:00 UTC 2 March–12:00 UTC 3 March, this deep trough cyclonically rotated to be oriented more northwest–southeast across Algeria (not shown) (Pokharel et al., 2017a, b). The jet at 500 hPa was propagating towards the Atlas Mountains from the north-northeast in Morocco and with further amplification over time; therefore, it was continuously advancing southeastward influencing the trough till the time of the dust storm. The baroclinic amplification of the jet streak was consistent with the deepening of the trough at the meso-α to synoptic scale (between 200 and 2000 km). Given the location of trough amplification of the exit region of the jet streak, which was becoming proximate to the stable layers in Fig. 4a and b, i.e., proximate to the mountain-induced thermal perturbation on the lee of the Atlas Mountains, it resulted in a mass perturbation (It is to be noted here that Fig. 4a is an observed sounding while the Fig. 4b sounding is the product of the WRF model; as both panels are consistent with each other in regards to vertical profiles of temperature and wind, the WRF model outputs can be said to be validated.) This interaction of the perturbed mass field ahead of the jet and the exit region of the jet leads to a breakdown of geostrophic balance. At 18:00 UTC and afterwards on 2 March, the temperature and wind speed pattern at 925 hPa show the possible evolution and propagation of the Kelvin wave as it was propagating parallel to the Atlas Mountains in the southwestward direction ahead of the cold pool accompanying the large-scale cold front (Fig. 6a). All these processes will be analyzed with high-resolution time-continuous WRF numerical simulations.
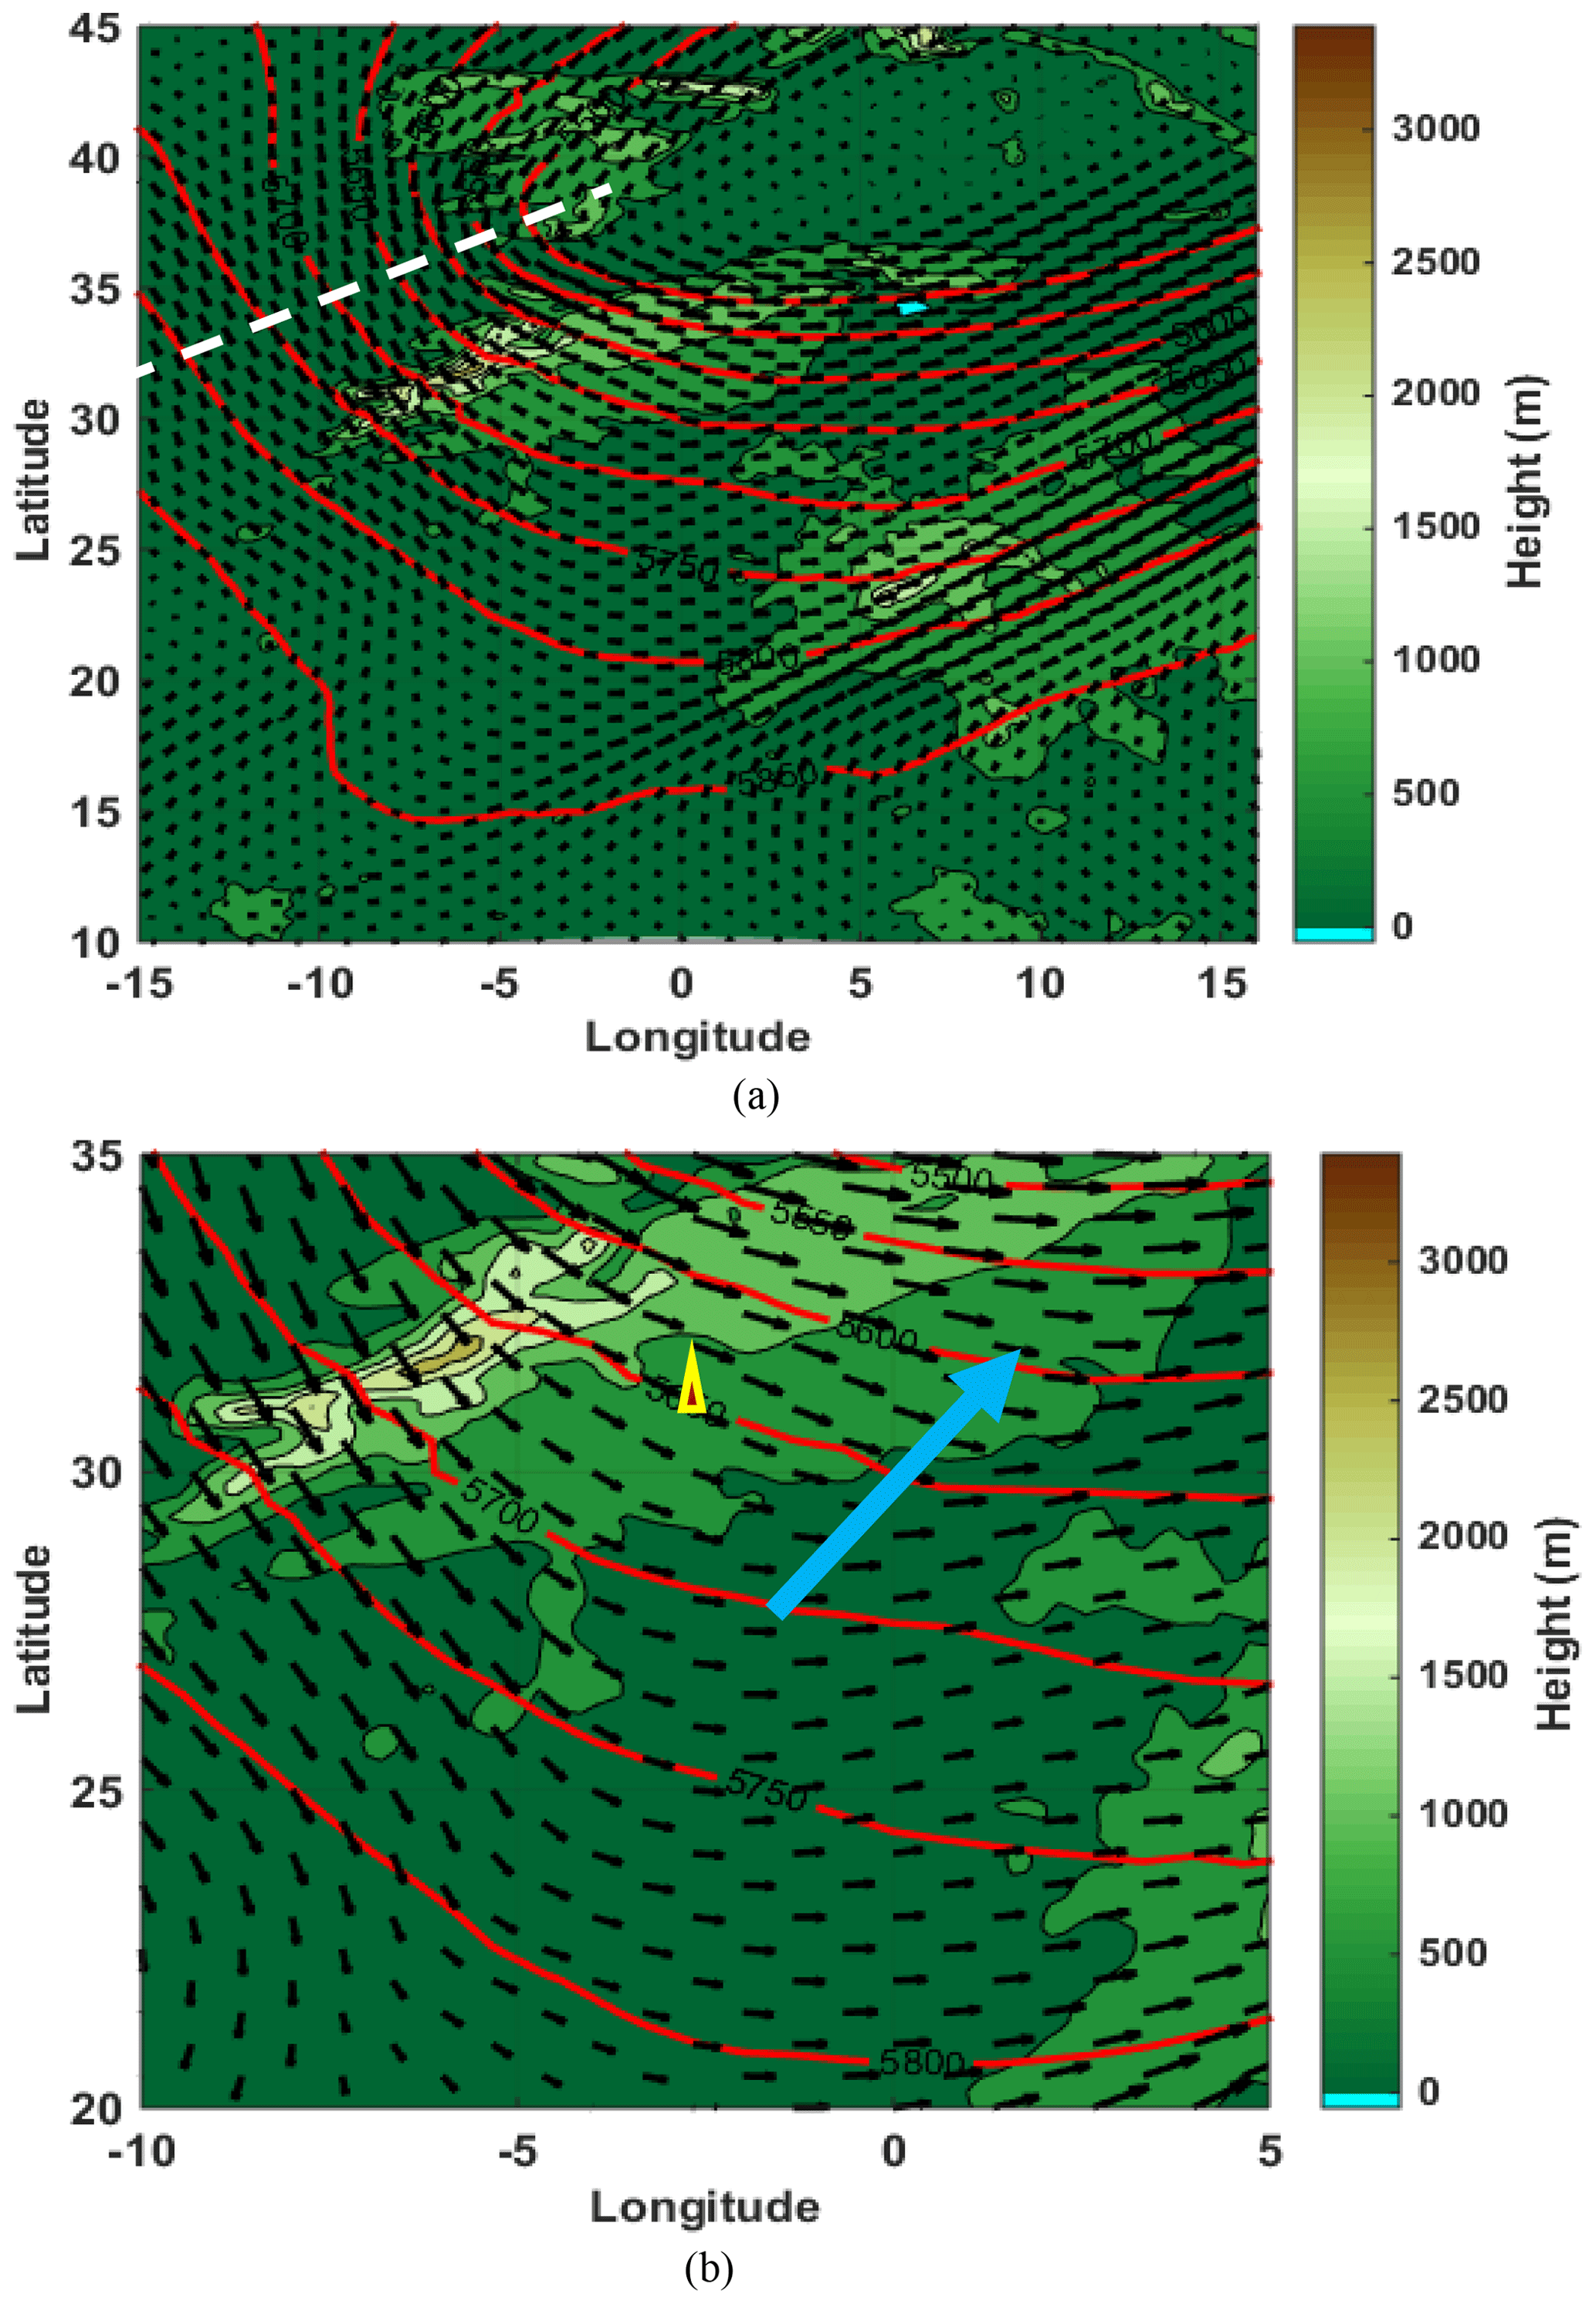
Figure 5(a) Geopotential height in steps of 50 m (red contours), wind speed and direction (small black colored vectors), and the orientation of the trough at 00:00 UTC on 2 March 2004 at the 500 hPa level from MERRA reanalysis with horizontal resolution of 54 km (Pokharel, 2016). The shading illustrates the orographic heights in meters. (b) Enlargement of geopotential height in steps of 50 m (red contours), wind speed and direction (vectors), and axis of evolving ageostrophic wind (big arrow) at the 500 hPa level at 00:00 UTC on 2 March 2004 from MERRA reanalysis with horizontal resolution of 54 km (Pokharel et al., 2017b). The shading illustrates the orographic heights in meters. A triangle of red (inside) and yellow (outside) shows the location of Bechar where the soundings were recorded.
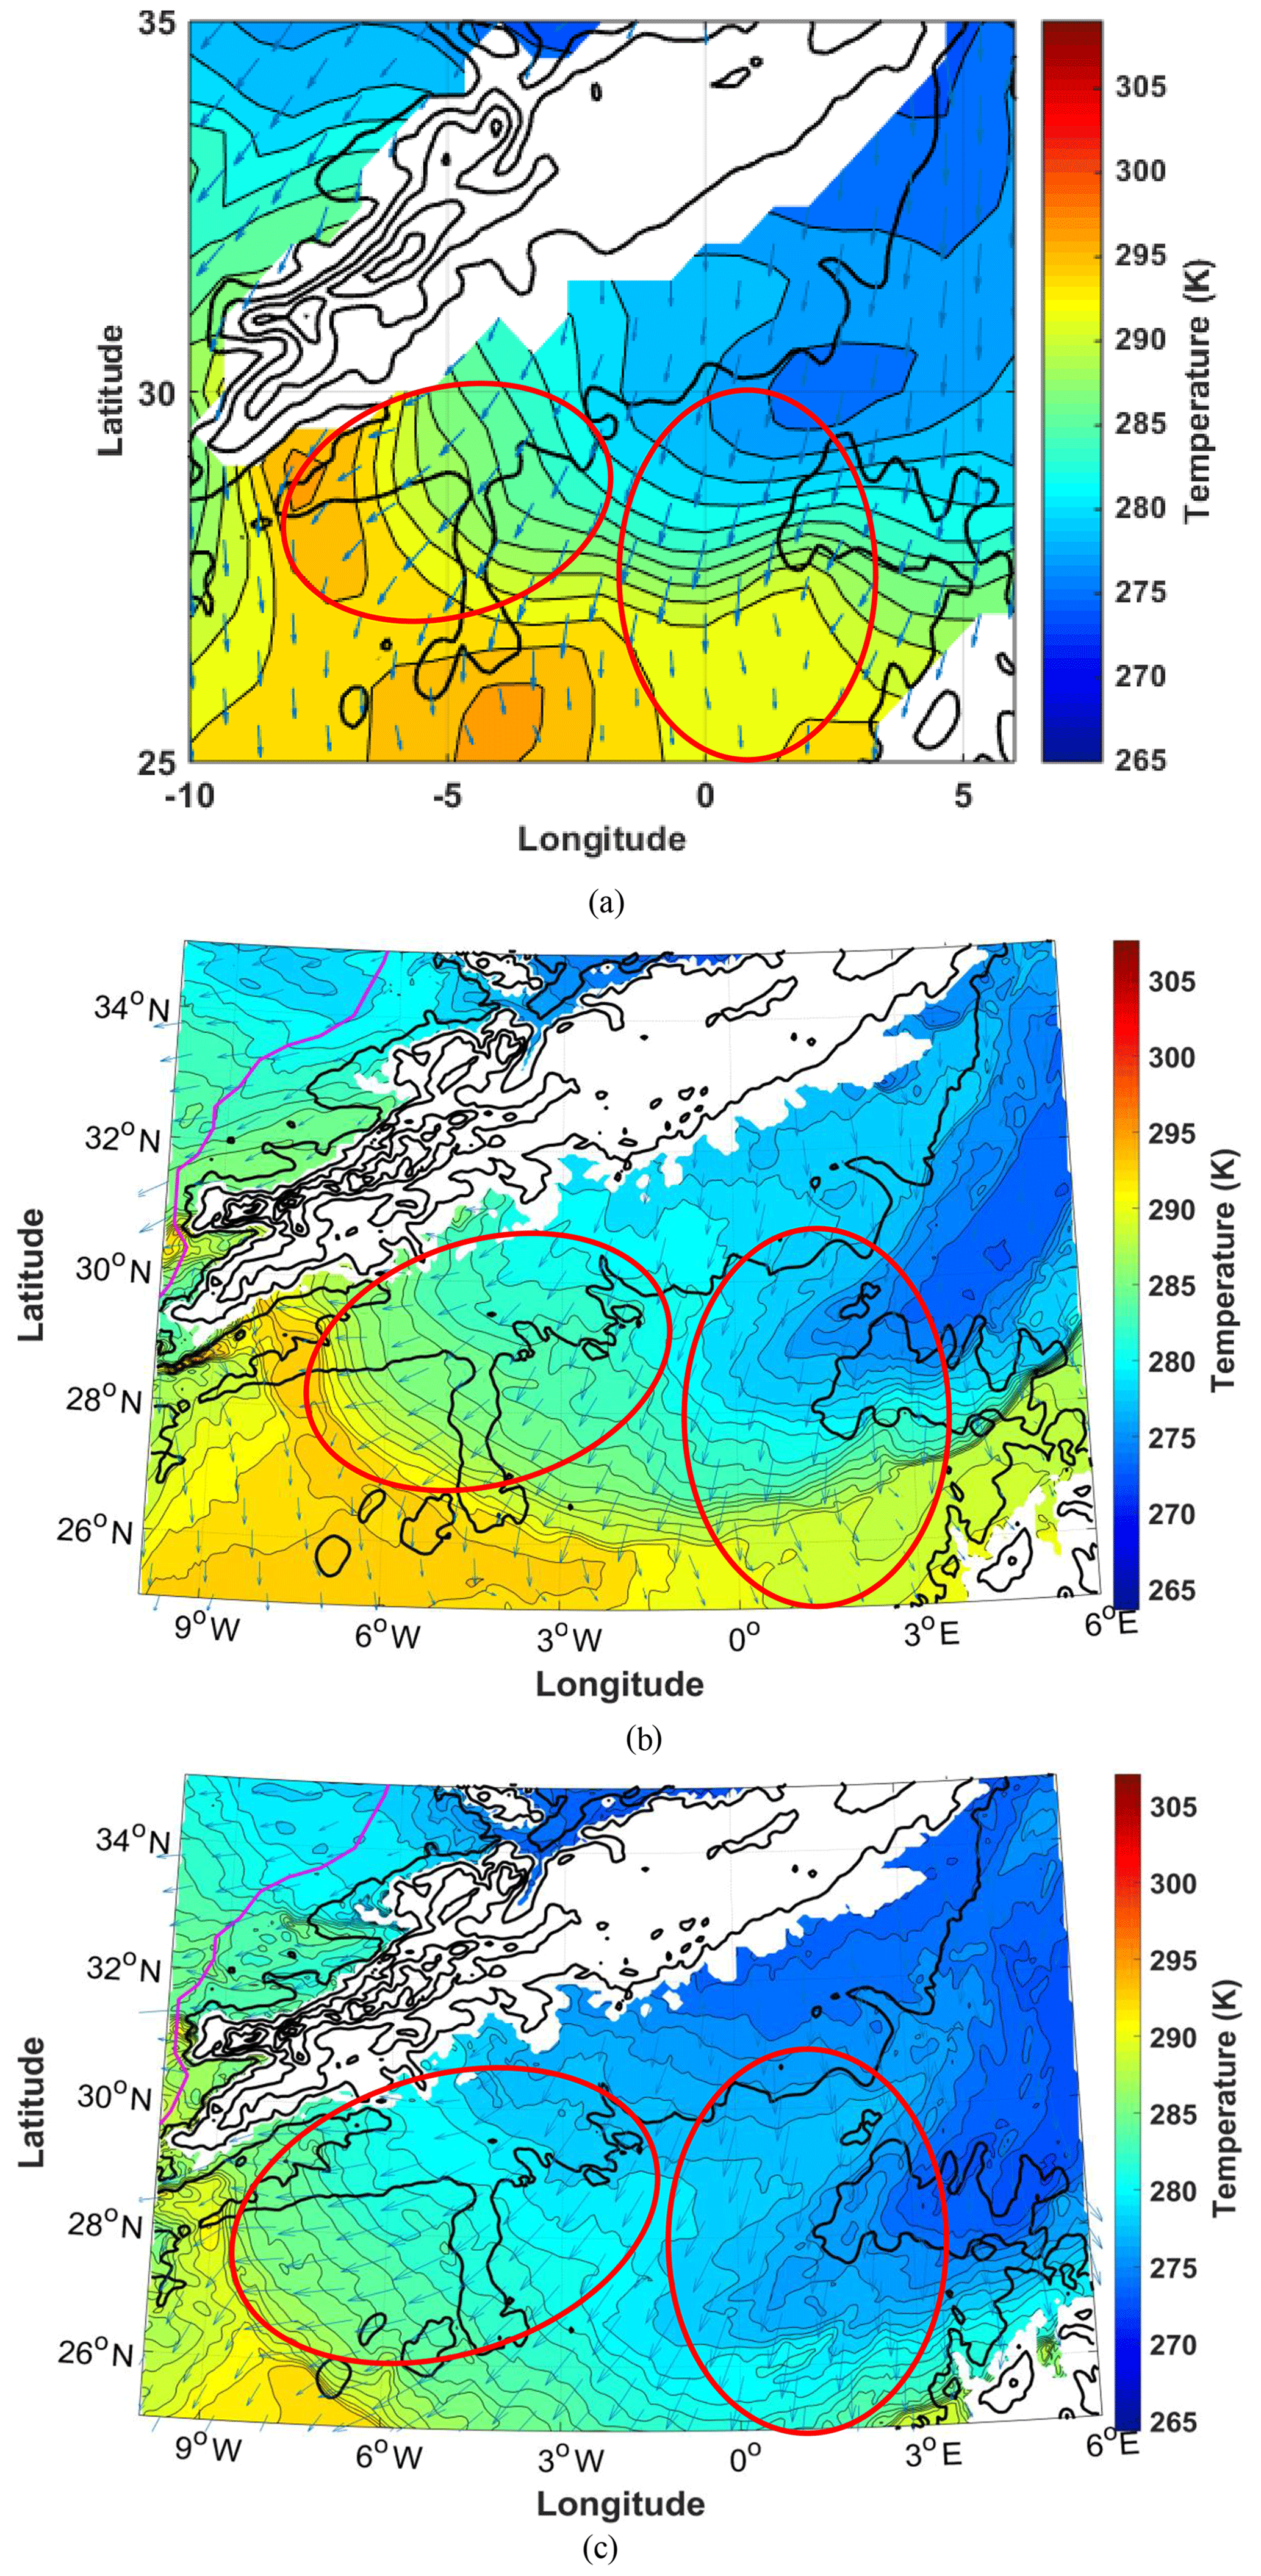
Figure 6(a) Temperature and wind speed and direction at 925 hPa on 18:00 UTC 2 March 2004 (54 km resolution MERRA product) (Pokharel, 2016). Blue arrow lines indicate the wind flow. The red circled areas represent the turning of one wind component to the right in response to the Coriolis force and another component turning to the left away from the mountains farther north and east as it goes south-southwestward. (b) Temperature and wind speed and direction at 925 hPa on 18:00 UTC 2 March 2004 (6 km resolution WRF product). Blue arrow lines indicate the wind flow. The red circled areas represent the turning of one wind component to the right in response to the Coriolis force and another component turning to the left away from the mountains farther north and east as it goes south-southwestward. (c) Temperature and wind speed and direction at 925 hPa on 22:00 UTC 2 March 2004 (6 km resolution WRF product). Blue arrow lines indicate the wind flow. The red circled areas represent the turning of one wind component to the right in response to the Coriolis force and another component turning to the left away from the mountains farther north and east as it goes south-southwestward.
3.1.2 WRF simulation analyses
Before discussing our specific analysis, we would like to introduce a study of the jet adjustment processes, which are precursors of this large-scale dust storm, discussed and recently published by Pokharel et al. (2017b). These jet adjustment processes were also one of the precursors for the generation of Kelvin waves. Pokharel et al. (2016, 2017b) and Pokharel (2016) clearly show that there was an interaction of the exit region of the polar jet streak with a local thermally perturbed air mass on the leeward side of the Atlas Mountains, and we summarize the processes after this interaction as follows: (1) the generation of a jetlet at 09:00 UTC on 2 March 2004 on the leeward side of the Atlas Mountains over the 30–32∘ N and 6–2∘ W region; (2) an occurrence of the mass field adjustment processes modifying the wind field until it reaches to a new geostrophic balance; (3) in this adjustment process, a thermally direct transverse ageostrophic circulation in the exit region of the jetlet developed downstream from the mountain leading to the upward motion and the formation of the cold pool under the right exit of the jetlet (where velocity divergence exists); and (4) this cold pool led to the rise of the low-level high-pressure perturbation creating an ageostrophic and isallobaric wind as a return branch of the direct circulation of the exit region of the jetlet at the lower levels, i.e., 925 hPa.
Following this finding, we analyzed our WRF-simulated data sets further to see if there was any additional signal generated prior to or during the adjustment processes as discussed by Pokharel et al. (2017b) for the generation of the strong winds at the lower levels. We see that there was an additional meso-β-scale mass field adjustment process shown by the geopotential height rise at 925 hPa at 11:00 UTC and afterwards (not shown). The temperature pattern at 07:00 UTC and afterwards shows the development of the cold region over 29–32∘ N and 5∘ W–2∘ E, reflecting the new mesoscale ascent zone. Within this cold pool, there was a comparatively colder region of air at lower levels than at upper levels in terms of the stretched vertical structure of the isentropic surfaces, indicative of the presence of the increased static stability of the atmosphere at this level (Fig. 7a) (consistent with schematic Fig. 1a).
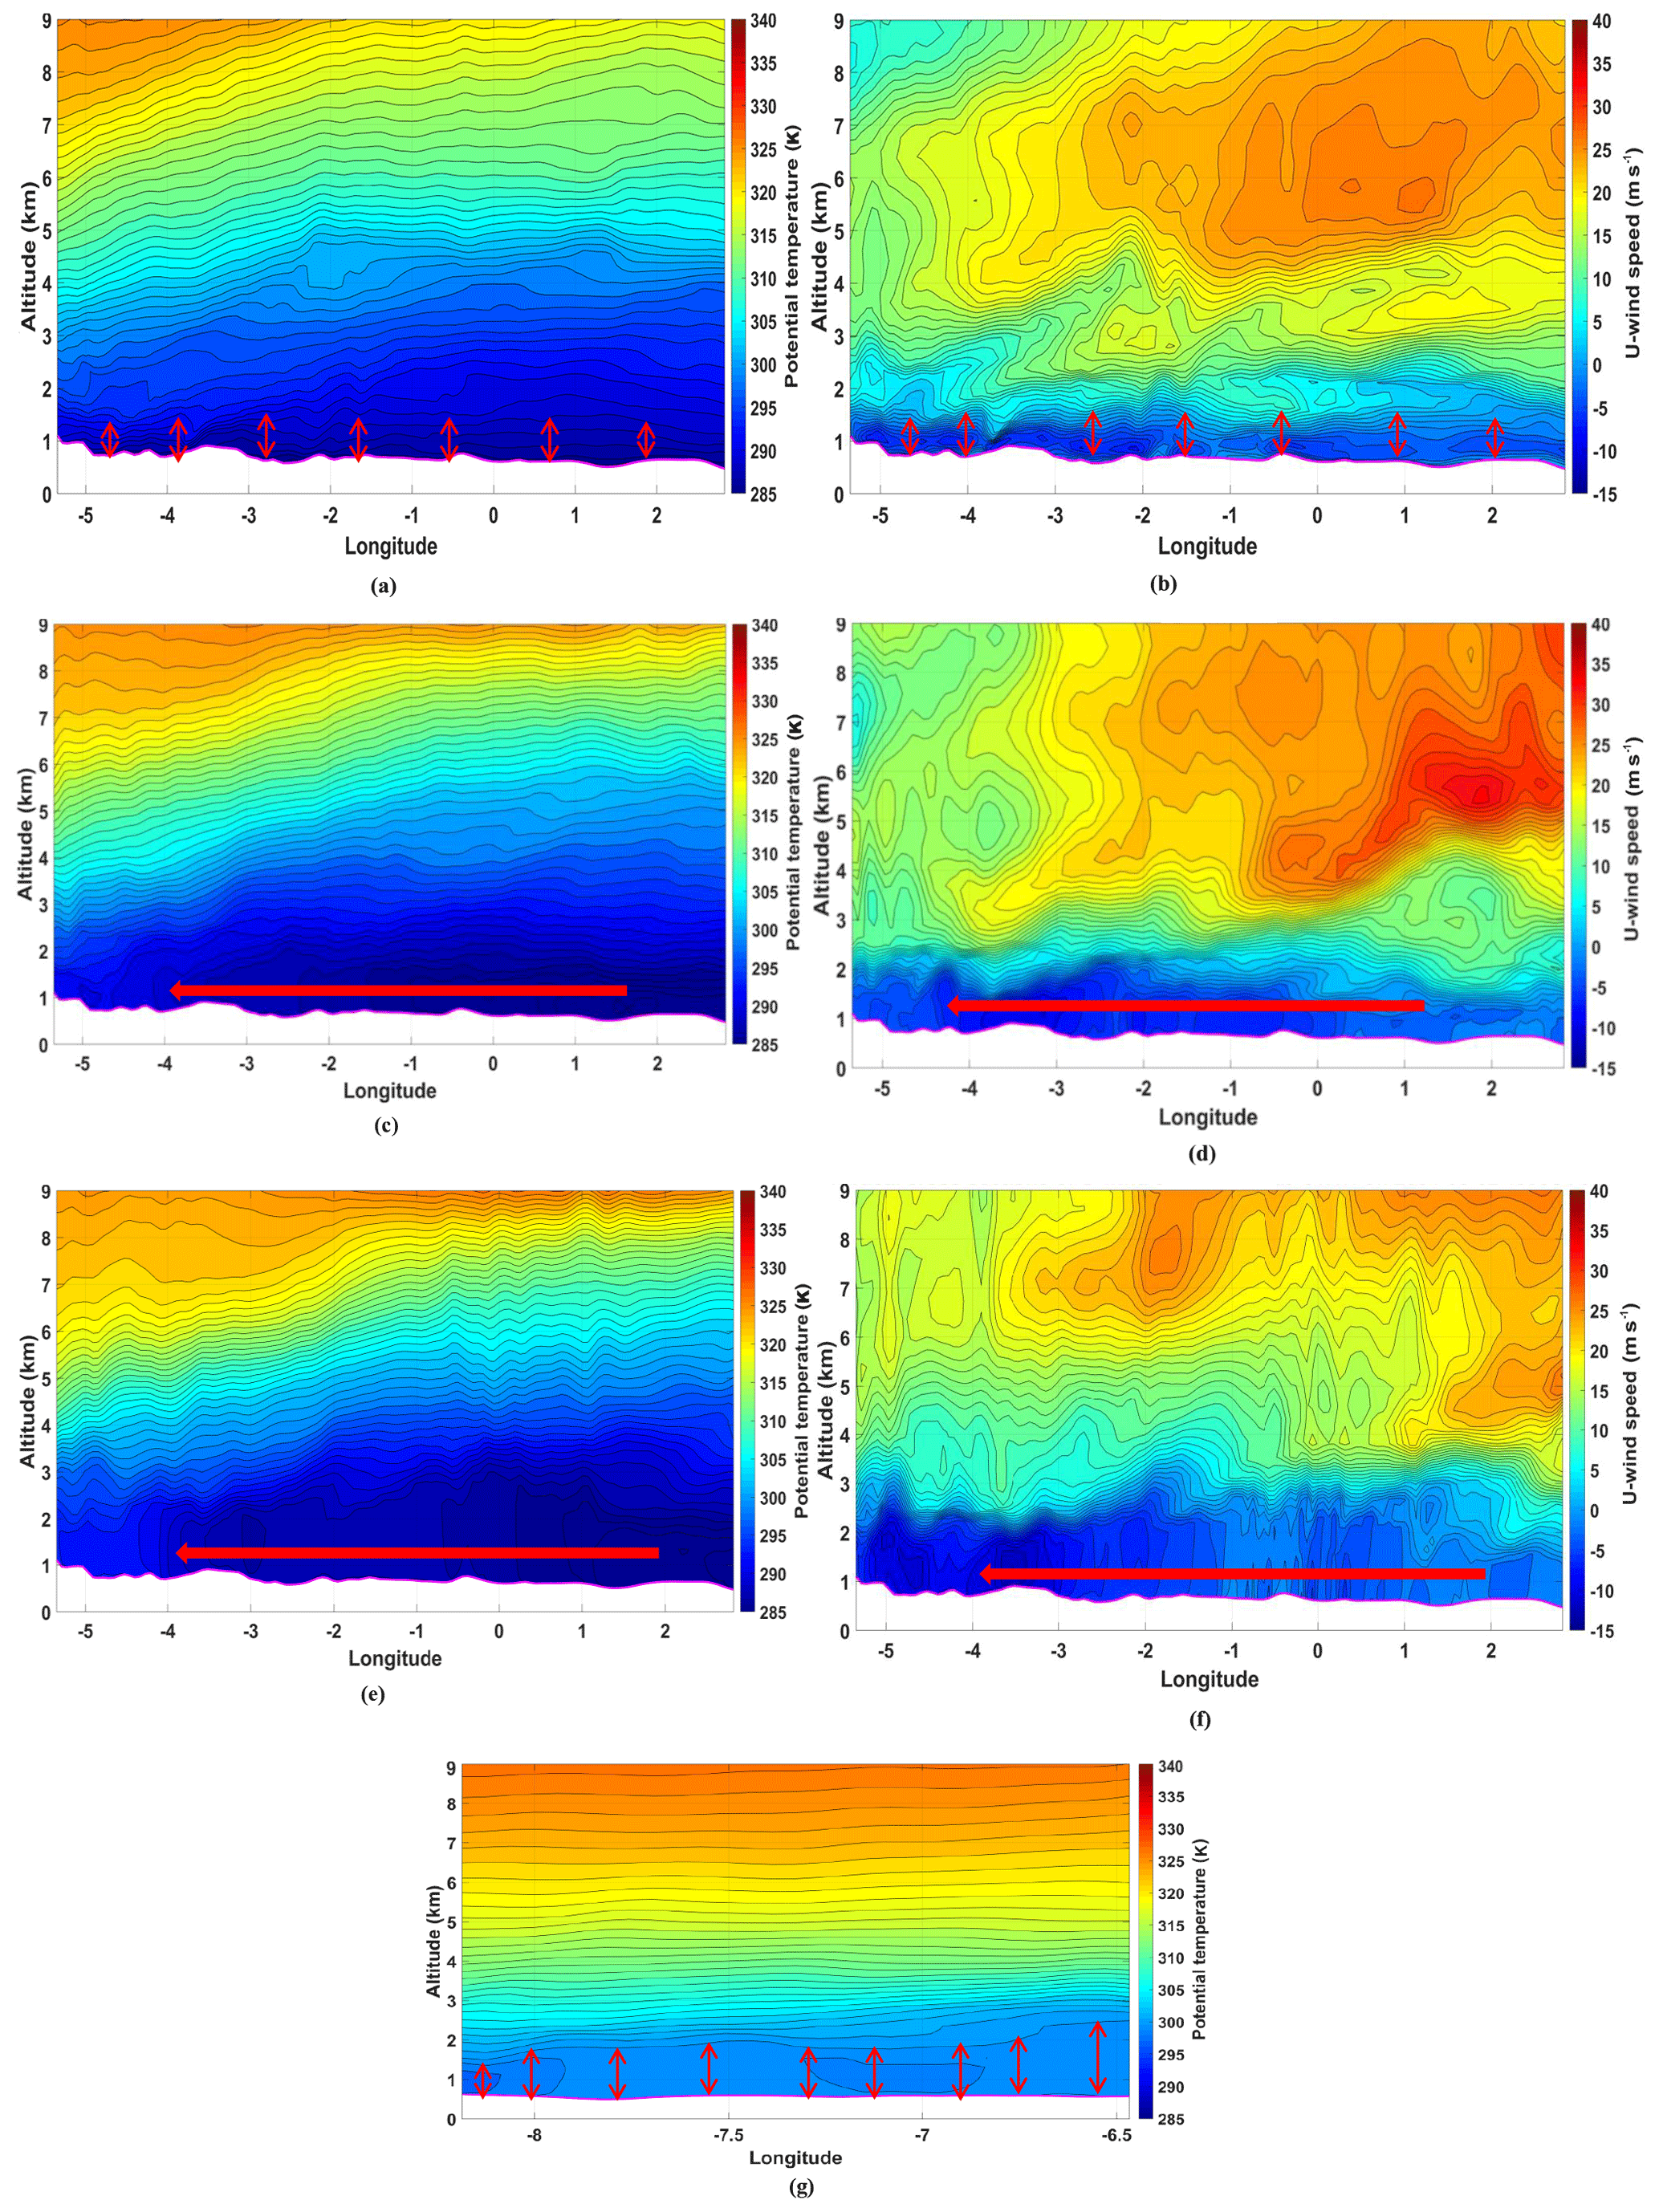
Figure 7(a) Vertical cross sections of potential temperature at 31.1∘ N on 07:00 UTC 2 March 2004 (6 km resolution WRF product). Red arrows (up and down) indicate region of sinking of air column (blocking of air). (b) Vertical cross sections of u-wind speed at 31.1∘ N on 07:00 UTC 2 March 2004 (6 km resolution WRF product). Red arrows (up and down) indicate region of blocking of air. (c) Vertical cross sections of potential temperature at 31.1∘ N on 11:00 UTC 2 March 2004 (6 km resolution WRF product). Red arrow indicates generation of Kelvin waves (cold air surge). (d) Vertical cross sections of u-wind speed component at 31.1∘ N on 11:00 UTC 2 March 2004 (6 km resolution WRF product). Red arrow indicates generation of Kelvin waves. (e) Vertical cross sections of potential temperature at 31.1∘ N on 15:00 UTC 2 March 2004 (6 km resolution WRF product). Red arrow indicates Kelvin wave (cold air surge) over time. (f) Vertical cross sections of u-wind speed at 31.1∘ N on 15:00 UTC 2 March 2004 (6 km resolution WRF product). Red arrow indicates Kelvin wave over time. (g) Vertical cross sections of potential temperature at 28.85∘ N on 15:00 UTC 2 March 2004 (6 km resolution WRF product). Red arrows (up and down) indicate warm air column of vertical stretch of isentropes.
This was the result of the presence of the blockage of the cold air column by the mountain range and generation of the initial mass impulse (Fig. 7a and b) (consistent with schematic Fig. 1a and b). This mass buildup by the jet adjustment process in the lower levels resulted in wind flow parallel to the mountains at 925 hPa by the ageostrophic isallobaric wind as discussed by Pokharel et al. (2017b). This indicated the possible evolution of the Kelvin wave (Thomson, 1879; Wang, 2002; Tilley, 1990) on the south to northeast edge of the lee of the Atlas Mountains (29–32∘ N and 5∘ W–2∘ E) at 11:00 UTC on 2 March (Fig. 7c and d) (consistent with schematic Fig. 1c, d, and e).
The generation of this Kelvin wave relies on stable stratification to sustain a gravitational or vertical restoring force in the form of a wave oscillation, followed by the Coriolis force acting to induce a horizontal oscillation or restoring force in time in the presence of the blocking mountain barrier. Over time the Kelvin wave, which had a wavelength extending more than 100 km orthogonal to the Atlas Mountains, propagated southwestward of the Atlas Mountains as a northeasterly wind (Fig. 7e and f) (consistent with schematic Fig. 1d and e). During the passage of time, this northeasterly wind further strengthened and increased the dust emission (consistent with schematic Fig. 1f). Afterwards, when this cold northeasterly wind, which already had significant momentum, interacted with the warm air column of stretched isentropes, which were present south to southwestward of the leeward side of the Atlas Mountains (Fig. 7g) as discussed above, there was a large production of dust over the region on the south to southwest side of the Atlas Mountains (Fig. 7g) (consistent with schematic Fig. 1f). This Kelvin wave started to organize the dust storms after the early, weak dust storm caused by the downslope wind events as discussed by Pokharel et al. (2017a). The Kelvin wave subsequently intensified the dust storm resulting in its growth by first concentrating its energy in a narrow zone adjacent to the lee of the mountains in the afternoon of 2 March before it expanded over time as a suspension of dust in the atmosphere by the growing wind perturbation orthogonal to the Kelvin wave. It is also seen that the northeasterly wind accompanying the Kelvin wave expanded further with the arrival of the quasi-geostrophic (Q-G) cold pool from the region north to northeast of the Atlas Mountains parallelly (Fig. 6b and c). Figure 6b is consistent with Fig. 6a, which is a product of an observational data set as mentioned in Sect. 3.1.1. In other words, Fig. 6a, b, and c indicate the wind was responding to the Kelvin wave mass field as one wind component was going west-southwest close to the mountains as it turns to the right in response to the Coriolis force and another component was turning to the left away from the mountains farther north and east as it goes south-southwestward (shown in two red circled areas).
The presence of the low static stability on the south and southwestward sections of the Atlas Mountains was shown by the stretching of the potential temperature in the vertical cross section in the WRF simulations during dust storm genesis.
These processes illustrated that the development of the northeasterly wind was associated with the huge cold surge and its interaction with the warm air column on the south and southwestern edge of the Atlas Mountains as the Kelvin wave and quasi-geostrophic cold air surge merged in time. These processes led to the generation of the large volume of dust from large areas on the leeward side (south and southwest of the Atlas Mountains, 25–30∘ N and 10∘ W–2∘ E) of the Atlas Mountains at around 21:00 UTC on 2 March and afterwards. This is consistent with the sequential dust storms at Tindouf, Bechar, and Adrar during this time period as discussed earlier in Sect. 3.1.1. Over time the WRF simulations and MERRA observations support the fact that the Kelvin wave propagated ahead of the cold pool accompanying the air behind the large-scale cold front (Fig. 6a, b, and c). This led the generation of the large volume of dust from the large areas on the leeward side (south and southwest of the Atlas Mountains, 25–31∘ N and 10∘ W–2∘ E) of the Atlas Mountains at around 18:00 UTC on 2 March and afterwards. This is also consistent with the dust storm at Tindouf at this time period. The presence of the area with a warm air column on the south and southwestern edge of the Atlas Mountains was also supported by the presence of the strong temperature gradient at the edge of this cold pool, consistent with the studies by Parmenter (1976), Garreaud and Wallace (1998), and Liebmann et al. (1999). Here, an evolution of the Kelvin wave process as discussed earlier is consistent with Tilley (1990), which states that the Kelvin wave is the propagation of parallel wind with the boundary on its right in the Northern Hemisphere. The generation of the Kelvin wave occurs when there is a shallow barotropic layer of air column (fluid) impinging on a physical barrier with a vertical height greater than fluid depth. In such a case, the flow of this air column is blocked by the barrier creating a buildup of mass in the area immediately adjacent to the barrier. After that, this excess mass is released as gravity waves and once the fluid has been set in motion, the Coriolis force begins to act upon it, turning the air flow towards its right. Over time this process continues and the air flow as a Kelvin wave becomes directed parallel to and is right-bounded by the barrier.
3.2 Bodélé Depression dust storm case study
3.2.1 Observational and model analyses
Though there were some observational stations in Chad, only one station (N'Djamena; 12.13∘ N, 15∘ E; southeast of the Bodélé Depression) recorded dust storms with a northeasterly wind of 3 m s−1 at 06:00 UTC on 8 December. At 06:00 UTC on 8 December 2011 (Fig. 8a and b), NAAPS shows the first evolution of the dust in the regions west to southwestward and equatorward of the Tibesti Mountains and after 6 h (12:00 UTC) the strength and the areal extension of the dust, including the sulfate mineral, increased and became concentrated mainly in the region southwest of the Tibesti Mountains as the dust-scattering AOD increased to 0.12 over this region as revealed by the MERRA-2 data.
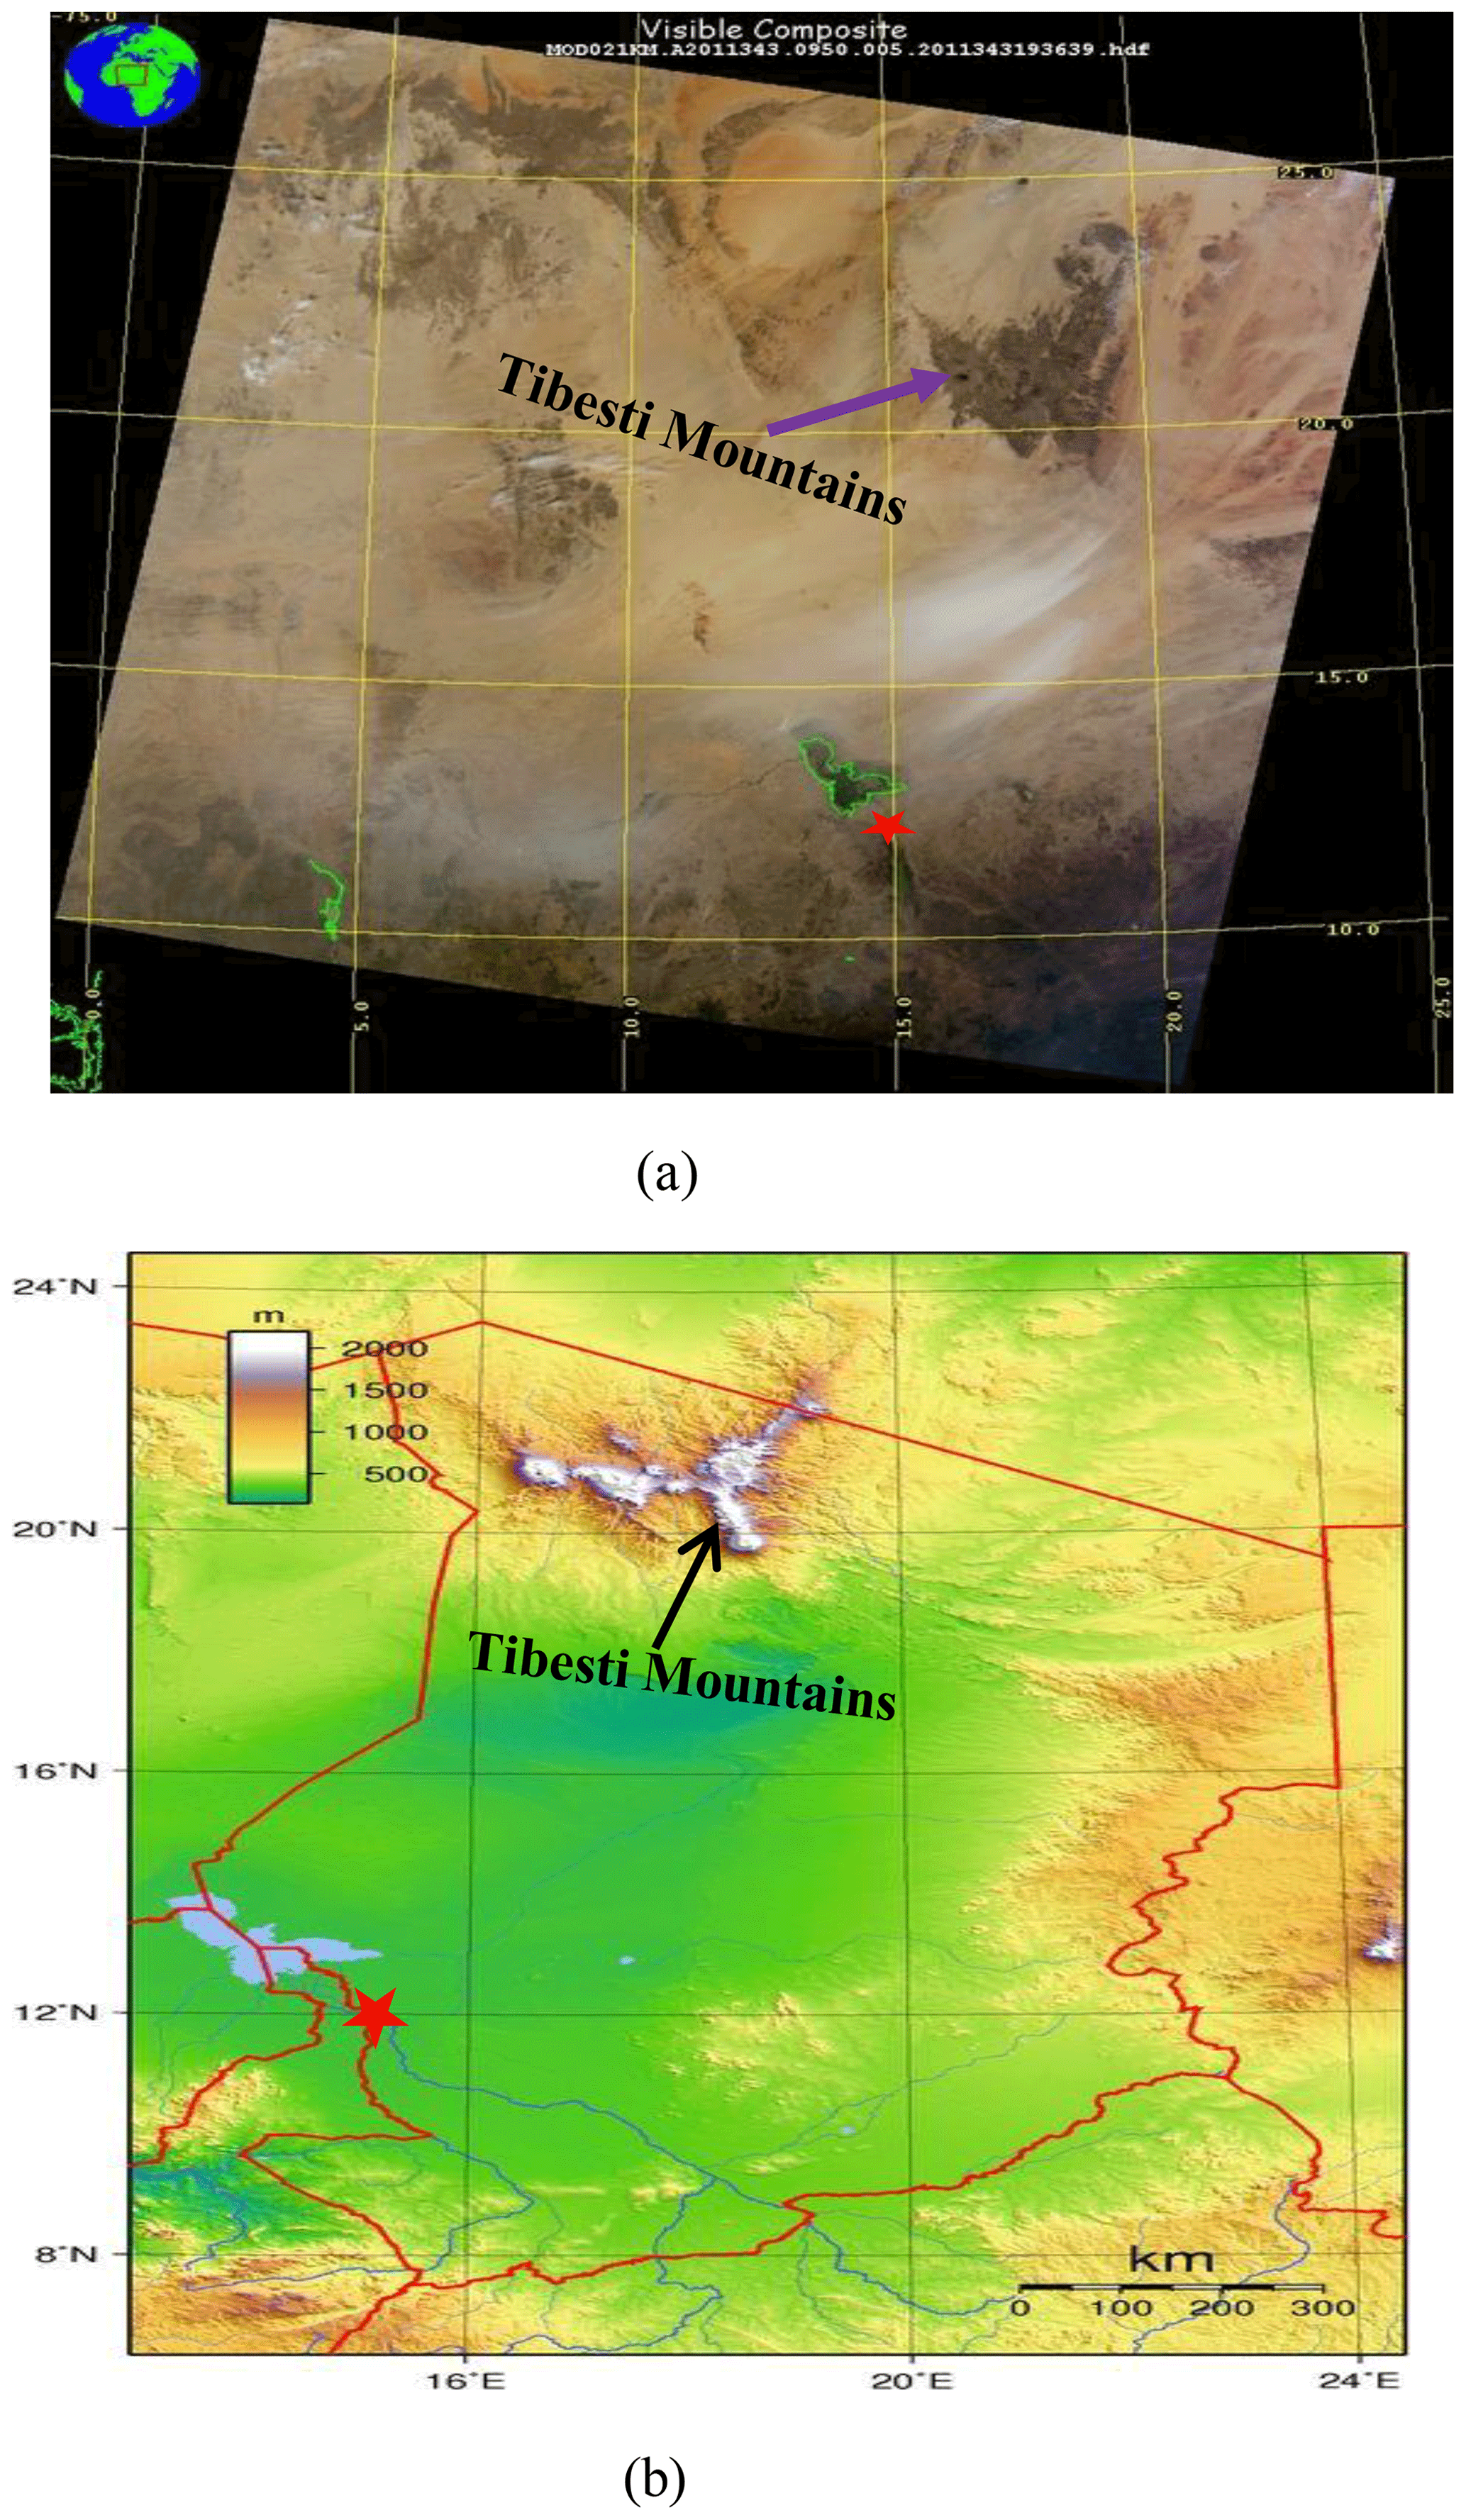
Figure 8(a) Bodélé Depression dust storm image captured by MODIS Terra at 09:50 UTC on 9 December 2011 (source: https://ladsweb.nascom.nasa.gov). The red star indicates the surface station at N'Djamena in Chad, which captured the dust storms from 06:00 UTC on 8 to 9 December 2011 (source: https://www.wunderground.com/) (Pokharel et al., 2017b). The x and y coordinates of this station are mentioned in Sect. 3.2.1 of the Bodélé Depression dust storm case study. (b) Topographical map of Chad (https://www.pinterest.com.au/pin/510877151474548010/, last access: 19 September 2019). The red star in this map shows surface station at N'Djamena in Chad, which captured the dust storms from 06:00 UTC on 8 to 9 December 2011 (source: https://www.wunderground.com/) (Pokharel et al., 2017b).
MERRA data sets show the development of a positively tilted trough and the development of the ageostrophic wind consistent with the initiation of the cyclonic vorticity near the trough axis at 19–20∘ N and 17–19∘ E at 06:00 UTC on 8 December (not shown). The positively tilted trough slightly deepened until the occurrence of the dust emission. Although the strength of the positively tilted trough was weak compared to the other cases, falling heights still revealed the upper-air disturbance over the northeast region of Niger, including north and northwestern regions of Chad which included Aozou, and southeast of Libya. From 09:00 UTC 8 December to 09:00 UTC 9 December this trough propagated southeastward and this propagation of the trough along with the jet stream were both associated with quasi-geostrophic lifting ahead of the trough and sinking behind it. A jet at 500 hPa was over the Tibesti Mountains and two additional jets were north of Chad from 00:00 UTC 8 December. The jet, which was over the Tibesti Mountains, was coupled to the trough until the occurrence of this dust storm. On the other hand, the Kelvin wave seemed to be evolving as it was flowing parallel to the Tibesti Mountains ahead of the large-scale cold pool accompanying the large-scale cold front at 08:00 UTC and afterwards shown by the temperature and wind speed pattern at the 850 hPa level at that time (not shown). So, to analyze all these aforementioned conditions, we again use high-resolution WRF simulations for the detailed dynamical development of a Kelvin wave in this severe dust storm.
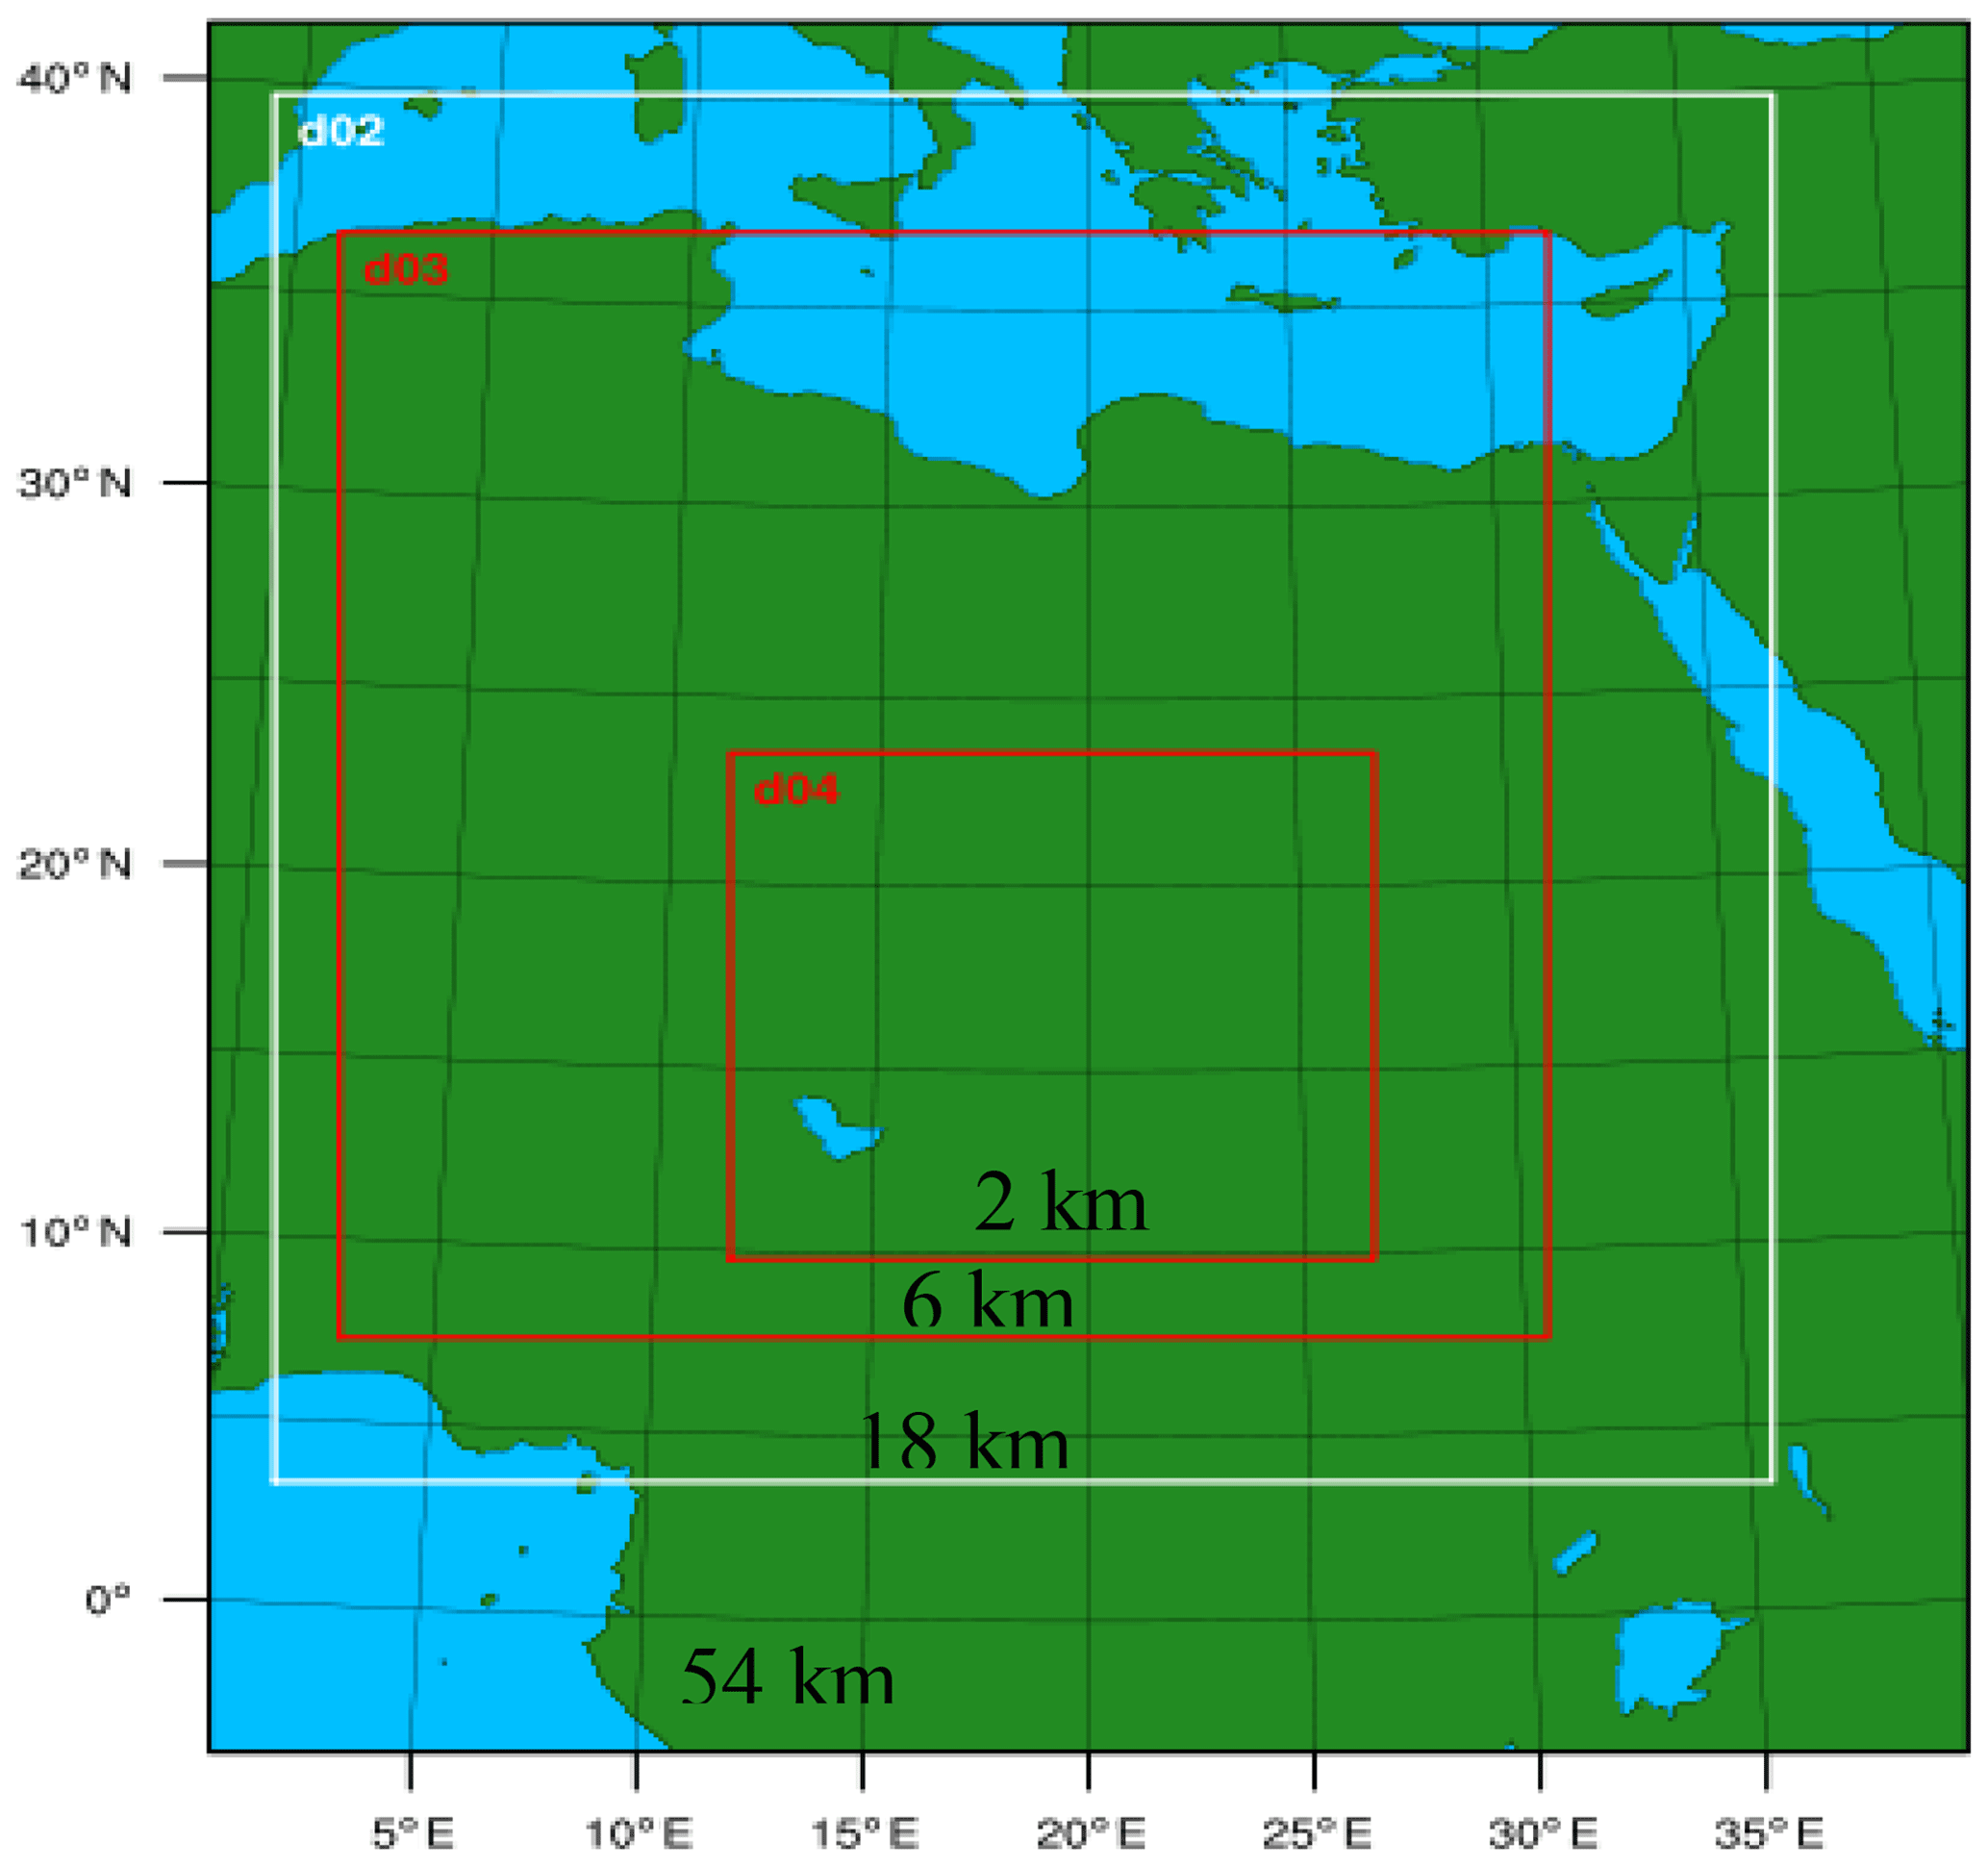
Figure 9WRF domain configuration for the Bodélé Depression dust storm case shown in Fig. 11 (Pokharel, 2016). The do1, do2, do3, and do4 represent domains of 54, 18, 6, and 2 km resolutions, respectively.
3.2.2 WRF simulation analyses
As mentioned above in the Harmattan case, Pokharel et al. (2017b) states in this case also that there was an interaction of the subtropical jet with the perturbed warm air mass on the leeward side (south, southwest, and southeast) of the Tibesti Mountains that led to the different processes (i.e., establishment of a meso-β-scale adjustment process) as mentioned in the above Harmattan case. In addition to this meso-β-scale adjustment process in the lower levels, there was an additional interesting meso-β-scale feature shown in the model output. At and after 07:00 UTC on 8 December 2011, as discussed earlier in the Harmattan case we also see that there was an additional meso-β-scale mass field adjustment process shown by the geopotential height rise at 925 hPa (not shown).
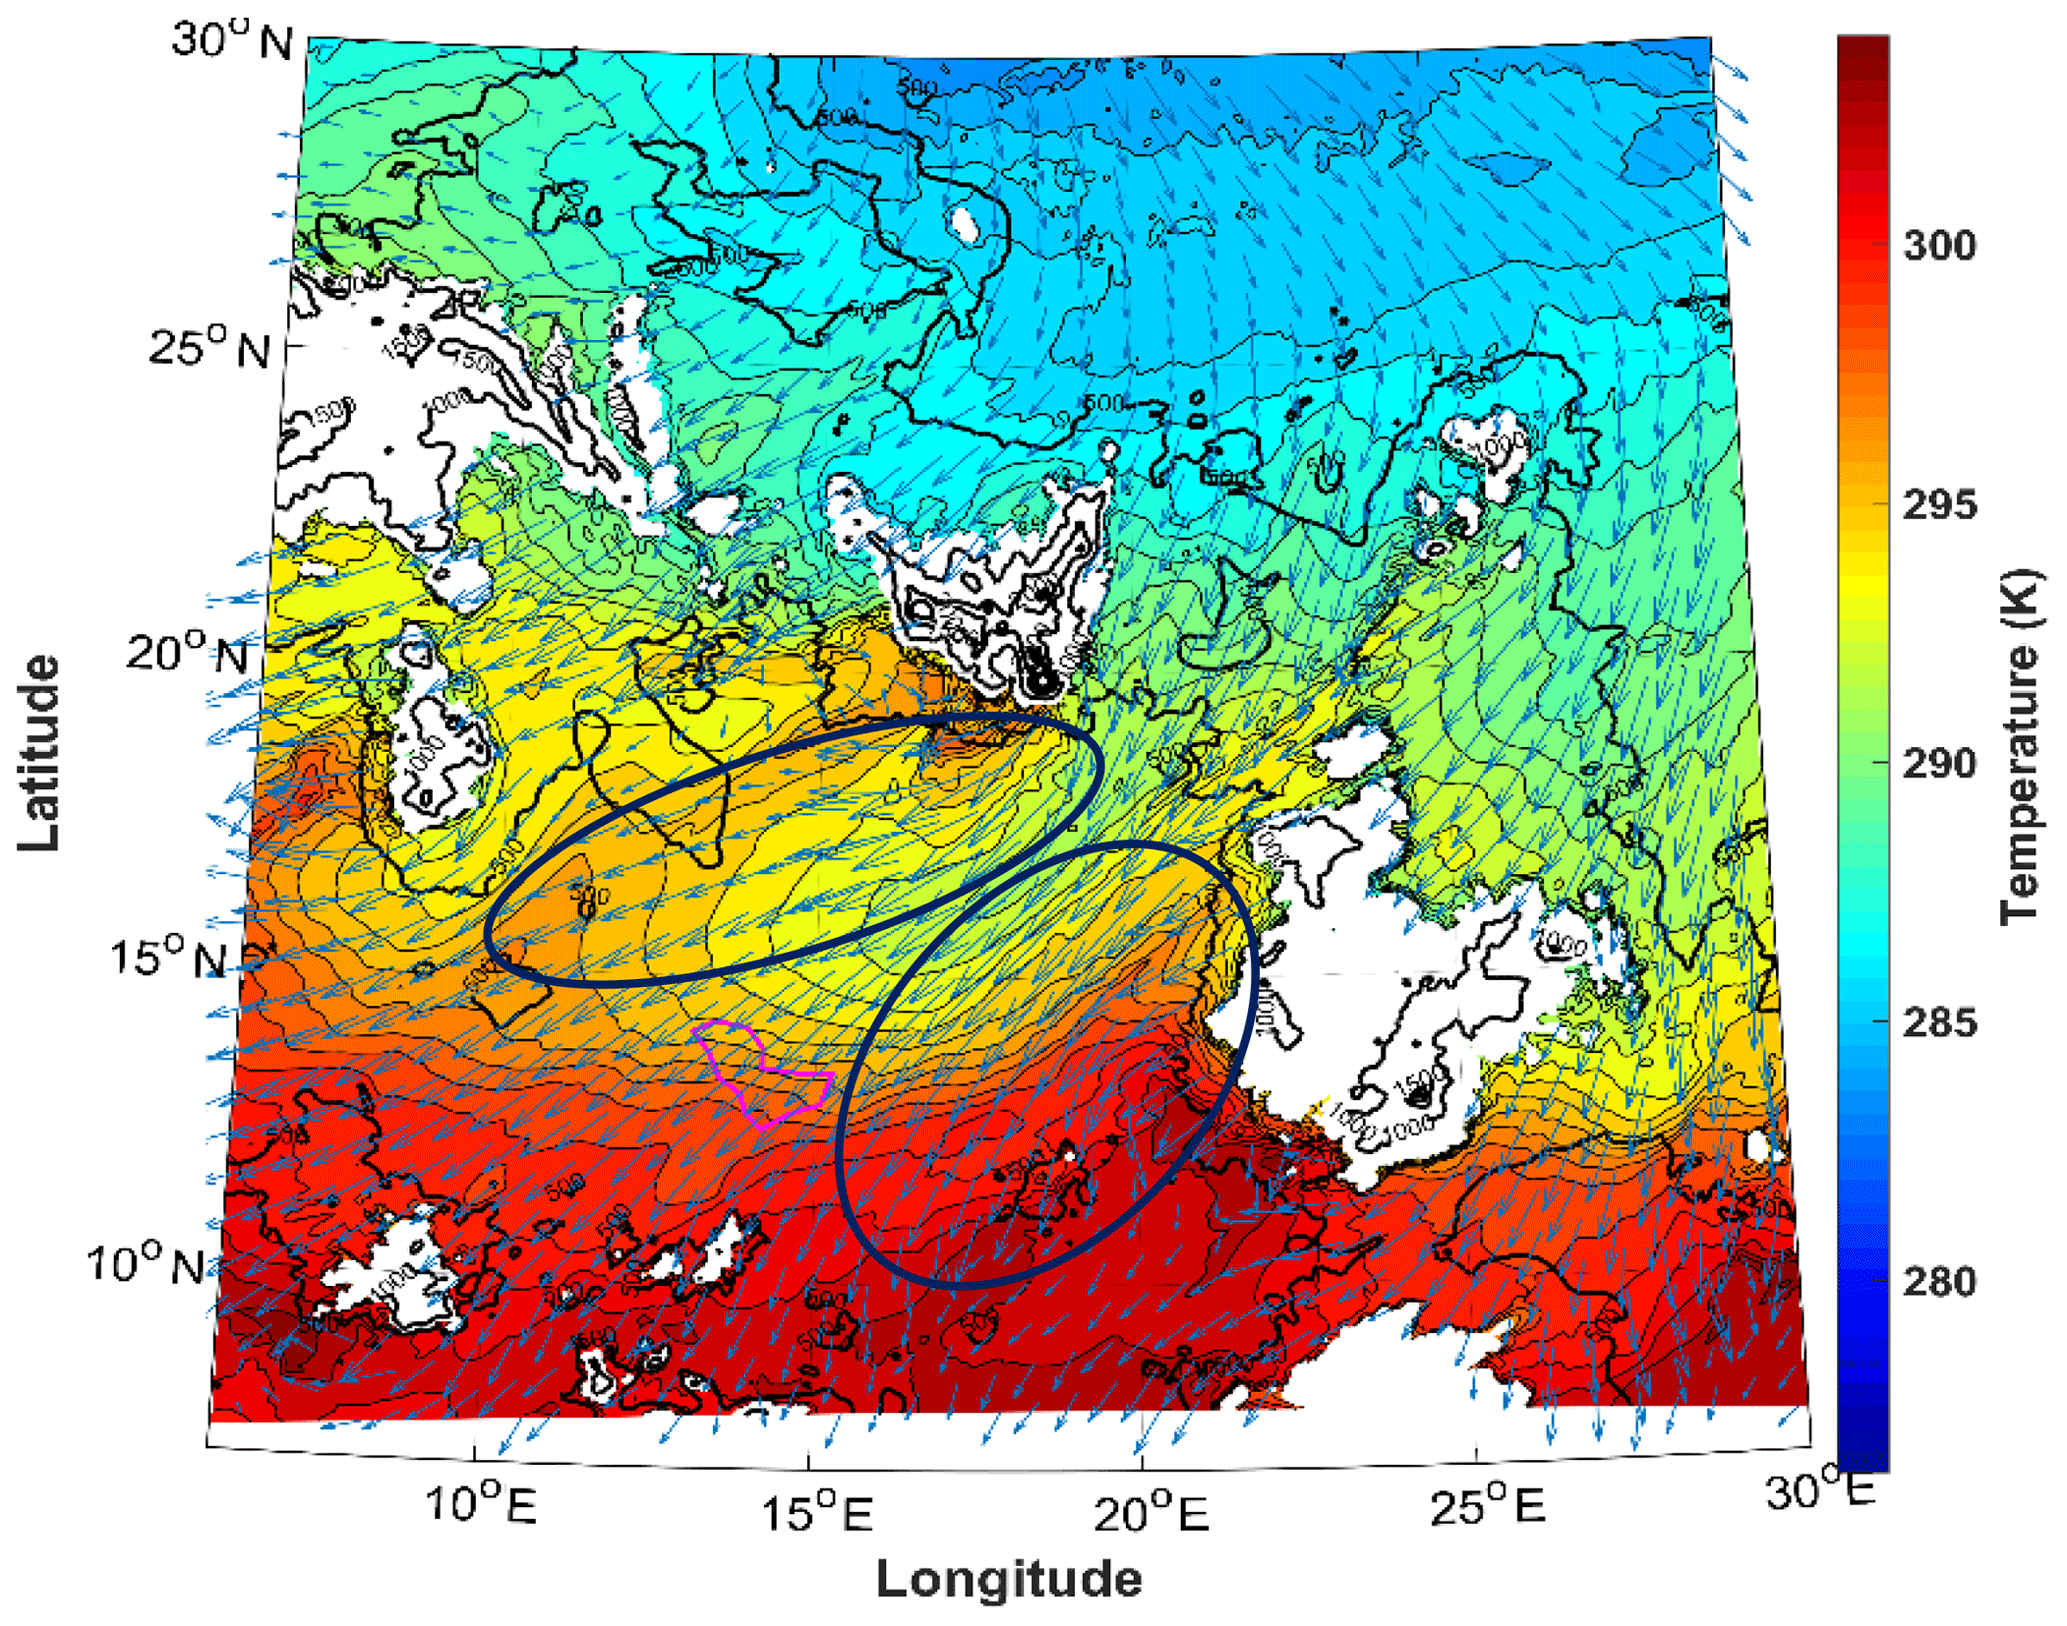
Figure 10Temperature and wind speed and direction at 925 hPa at 18:00 UTC on 8 December 2011 (6 km resolution WRF product). Blue arrow lines indicate the wind flow. Blue circled areas indicate one wind component was flowing west-southwest close to the mountains as it turns to the right and the other wind component was turning to the left away from the mountains farther north and east as it goes south-southwestward.
Similarly, the temperature pattern at 925 hPa shows that there was a cold pool over the 19–30∘ N and 10–30∘ E region. Within this wide, cold region, there was a comparatively colder region of air at the lower level than at upper levels in terms of the structure of the isentropic surfaces in the east and northeast side of the Tibesti Mountains (21–23∘ N and 19–21∘ E) (Fig. 11a) (consistent with schematic Fig. 1a). This cold column indicates the presence of the stability of the atmosphere at this level. This was the result of the presence of the blockage of the cold air column by the mountain range and generation of the initial mass impulse (Fig. 11b and c) (consistent with schematic Fig. 1a and b). From this buildup of mass by the jet adjustment process in the lower levels as discussed earlier, there was wind flow parallel to the Tibesti Mountains and equatorward at 925 hPa (Fig. 10). After flowing parallel to the Tibesti Mountains, this equatorward-directed wind rotated anticyclonically or southwestward along the east slope of the Tibesti Mountains as a northeasterly wind which strengthened in time. When the wind flow at this low-level stable region became parallel to these mountains, it can be inferred that there was a generation of the Kelvin wave (Thomson, 1879; Tilley, 1990) (Figs. 10, 11c, and d) (consistent with schematic Fig. 1c, d, and e). There was a close association between the subtropical jet streak imbalance (Pokharel et al., 2017b) and the Kelvin wave formation due to the presence of the inversion layer in the lee of the Tibesti Mountains. The presence of the cold pool at the bottom of the lee slope led to the pressure rise resulting in the wind flow parallel to the Tibesti Mountains during the Kelvin wave formation at 925 hPa. This process was also supported by the generation of a compensating jet generated by the low-level pressure rise and its ageostrophic and isallobaric wind flow as discussed in the earlier case study. This Kelvin wave, which was trapped along lateral vertical mountain boundaries, was the result of the mass perturbations propagating parallel to the mountain barrier as discussed by Tilley (1990) and was also representative of a higher-frequency form of adjustment process that might have played a vital role in generating this type of particular dust storm process. It is important to note that when this northeasterly wind became directed southwestward of the Tibesti Mountains, it accelerated. In time, this northeasterly momentum interacted with the warm air column resulting from the adiabatically compressed downslope wind. This warm pool can be inferred from the strong gradient of temperature at 850 and 925 hPa and the vertically expansive isentropic surfaces at lower levels. This region was favorable for the generation of significant magnitudes of turbulence kinetic energy (TKE) from the contribution of wind shear and the buoyancy terms as defined in the TKE tendency equation suggested by Stull (2000),
where is TKE advection by the mean wind, () is generated shear, g (Qs∕Tv) is buoyancy, and ε is the dissipation of TKE or eddy dissipation rate. This enhancement of the TKE developed a turbulent well-mixed circulation, which ablated the dust from the surface.
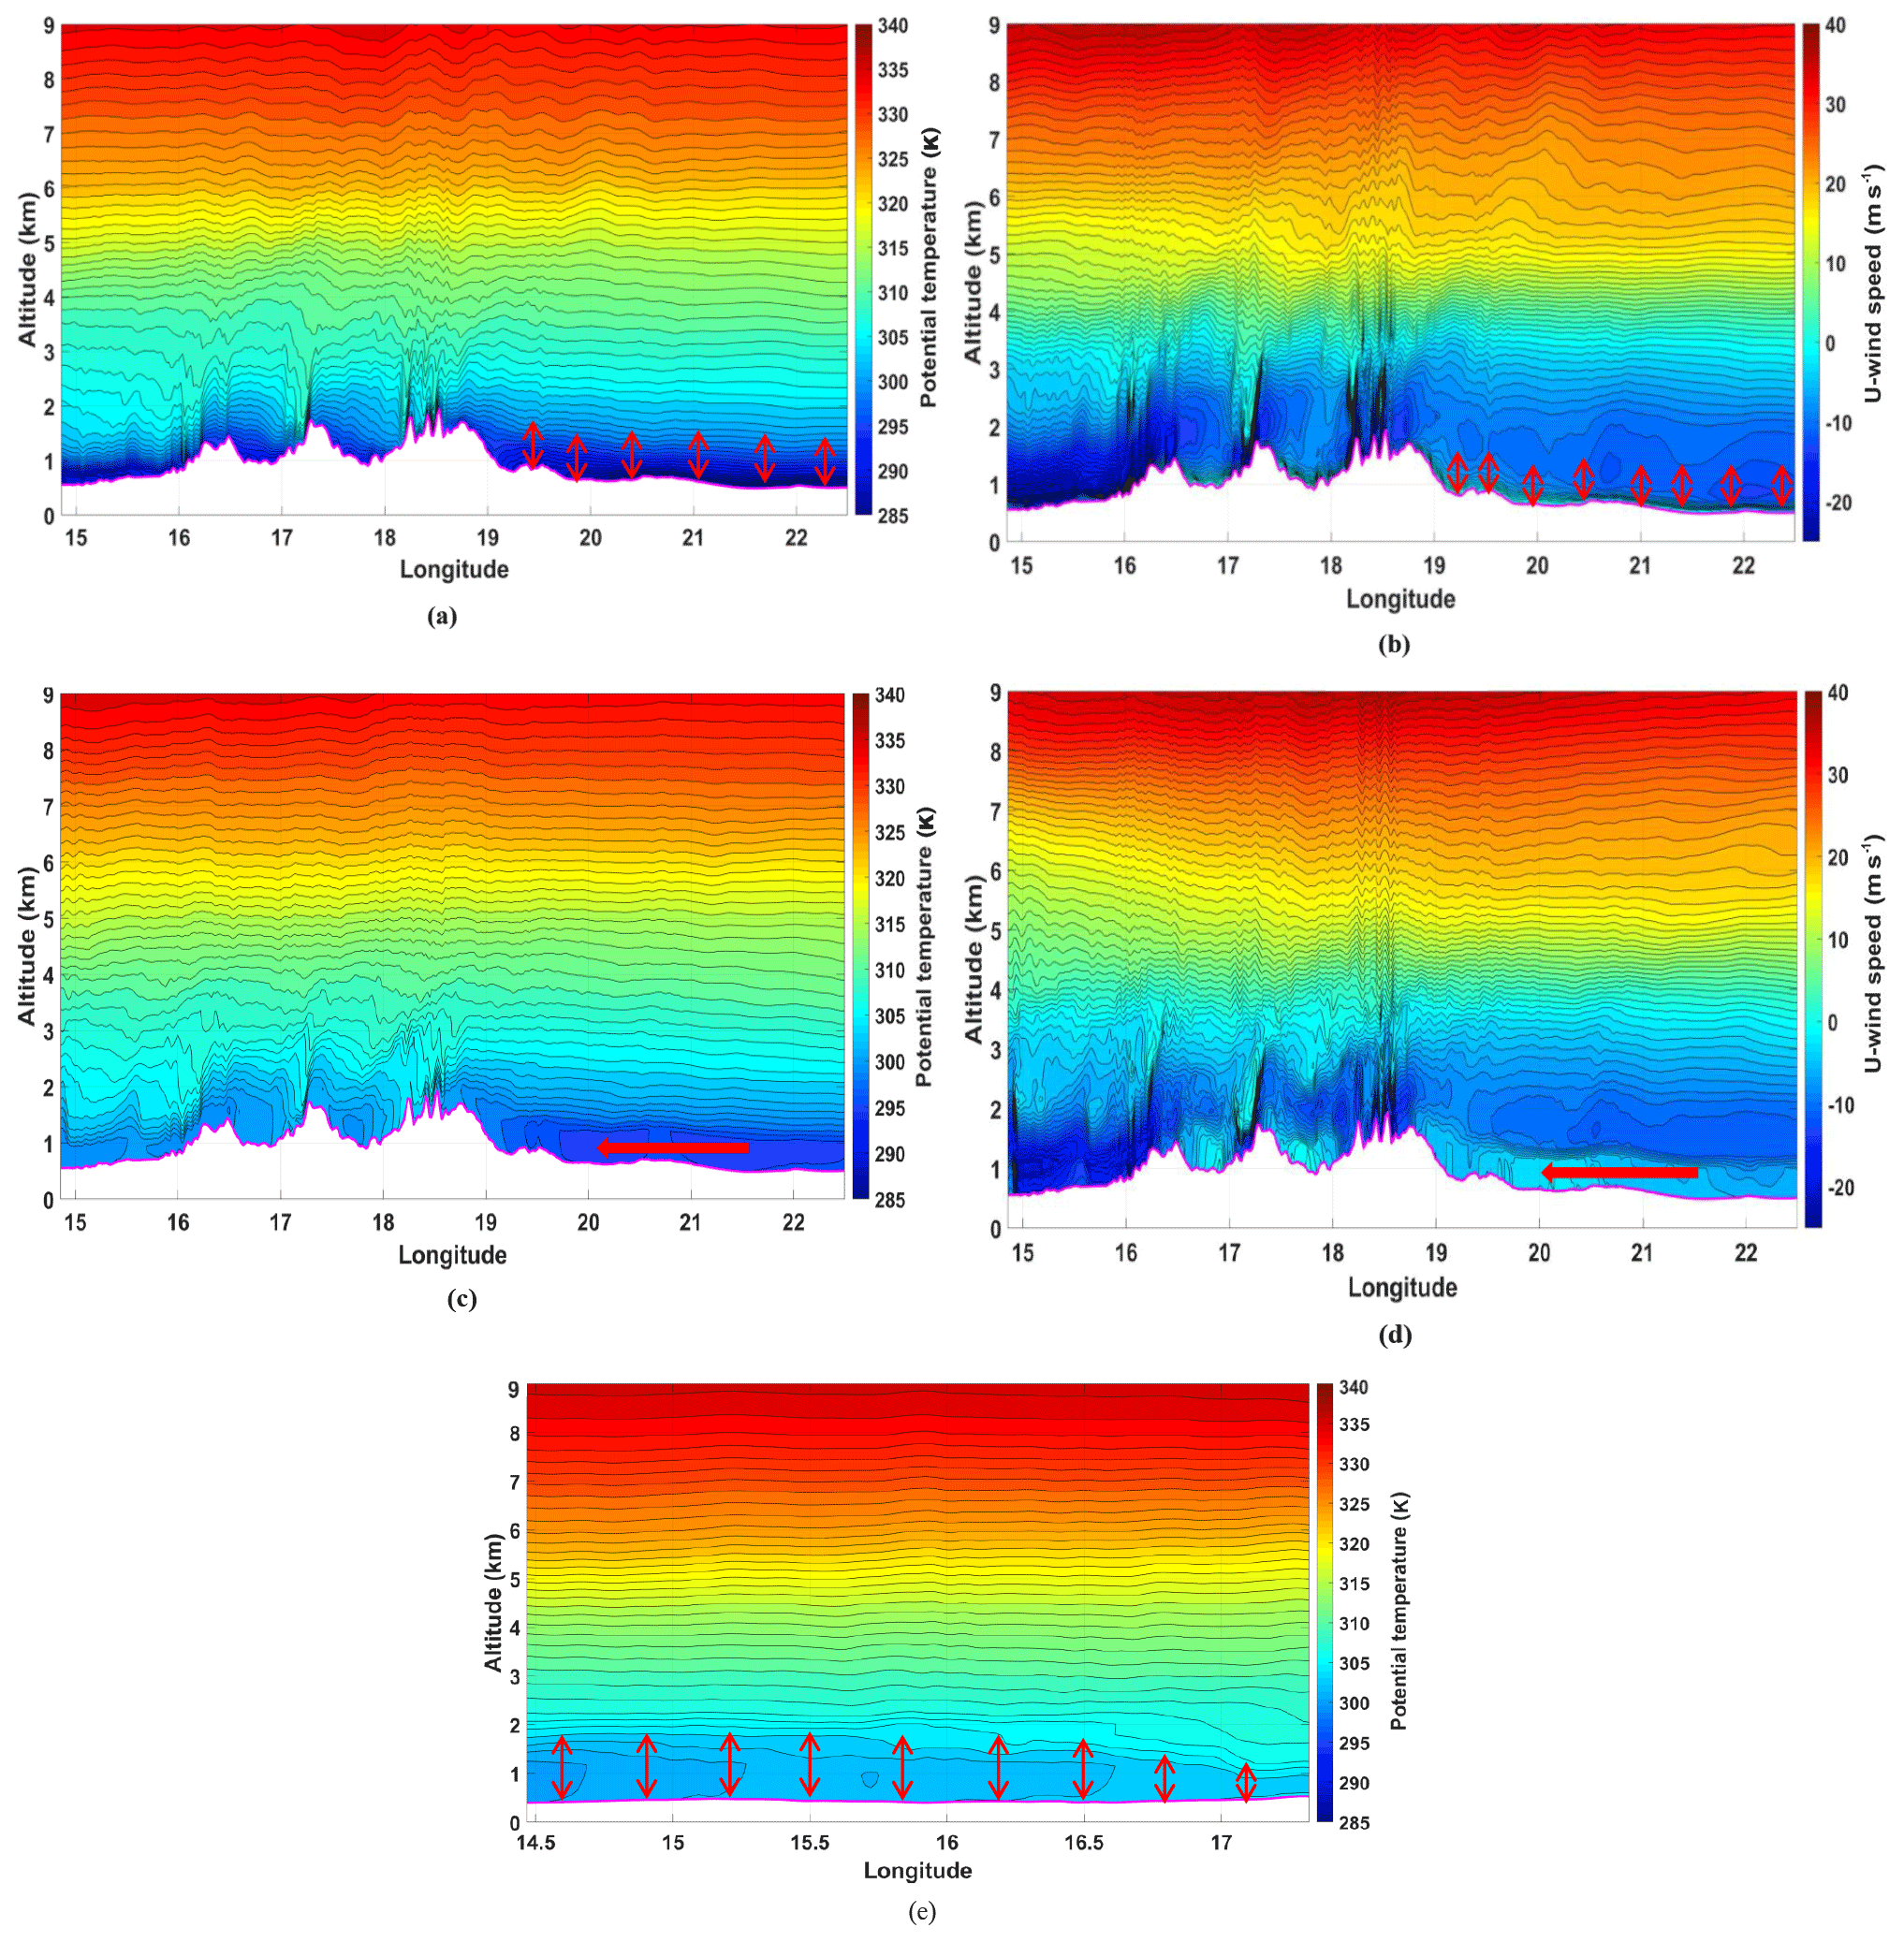
Figure 11(a) Vertical cross sections of potential temperature at 21.57∘ N on 07:00 UTC 8 December 2011 (2 km resolution WRF product). Red arrows (up and down) indicate the depth of region of possible stability of the atmosphere. (b) Vertical cross sections of u-wind speed at 21.57∘ N on 07:00 UTC 8 December 2011 (2 km resolution WRF product). Red arrows (up and down) indicate blocking of the air. (c) Vertical cross sections of potential temperature at 21.57∘ N on 11:00 UTC 8 December 2011 (2 km resolution WRF product). Red arrow indicates Kelvin wave (cold air surge). (d) Vertical cross sections of u-wind speed at 21.57∘ N on 11:00 UTC 8 December 2011 (2 km resolution WRF product). Red arrow indicates Kelvin wave. (e) Vertical cross sections of potential temperature at 18.89∘ N on 15:00 UTC 8 December 2011 (2 km resolution WRF product). Red arrows (up and down) indicate warm air column of vertical stretch of isentropes.
At 09:00 UTC and onwards, the Kelvin wave mentioned in the above paragraph propagated ahead of the cold pool accompanying the northeasterly wind behind the large-scale cold front from the north and northeast side of the Tibesti Mountains towards the south and southwest region of Chad, where the deep convective environment existed. The presence of the convective turbulent environment was consistent with the expansion of the isentropic surfaces (Fig. 11e) and the strong gradient of the temperature at the edge of the cold pool at 850 and 925 hPa as suggested by Parameter (1976), Garneau and Wallace (1998), and Liebmann et al. (1999). The interaction of this cold pool accompanying the northeasterly wind and the highly warm air column created significant magnitudes of TKE (Fig. 12) accompanying the generation of the turbulent eddies, which ablated the large volume of the diatomite dust from the surface, which is also consistent with Pokharel and Kaplan (2017). The surge of the cold pool over this region followed by the early enhancement of the warm air in the south to southwestward part of the Tibesti Mountains is consistent with the description in Vizy and Cook (2009).
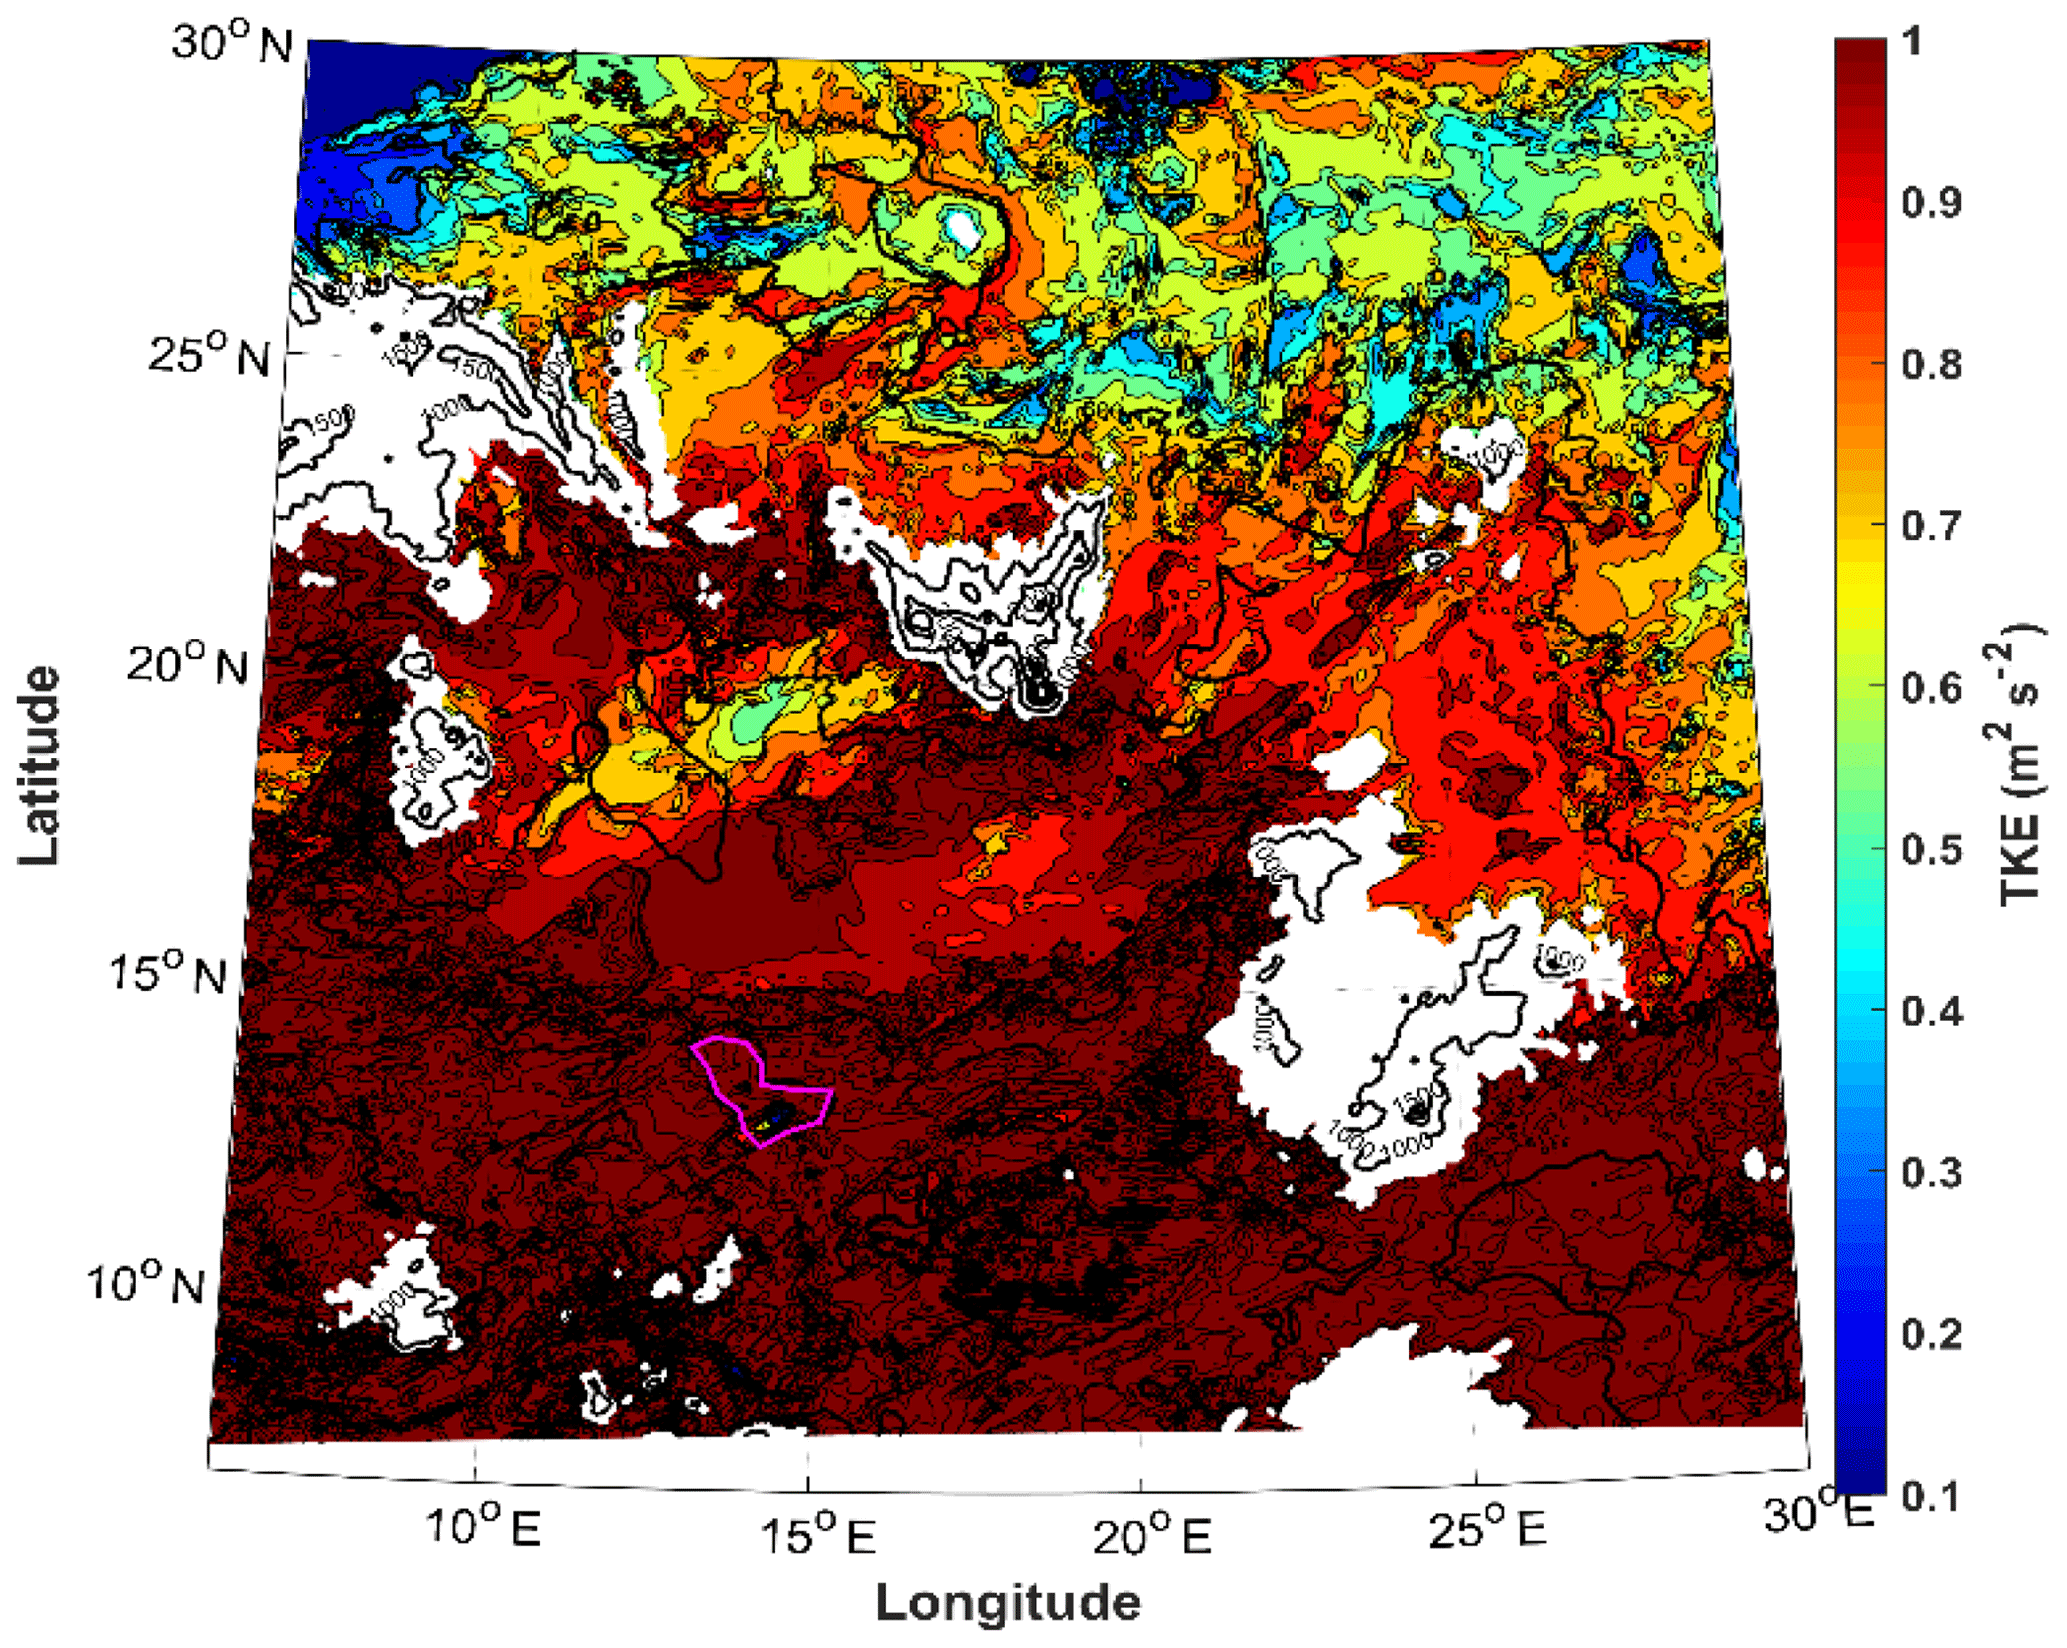
Figure 12Turbulent kinetic energy at 925 hPa on 12:00 UTC 8 December 2011 (6 km resolution WRF product).
Besides the downslope wind effects and the jet adjustment processes which were responsible for these three dust storms (Pokharel et al., 2017a, b, 2016; Pokharel, 2016), we found that the organization of the dust storms and the synoptic-scale transport of dust from the Harmattan and Bodélé Depression dust storms were also seen to be caused by the Kelvin waves. Though we also carried out detailed analyses of the Saudi dust storm case with the help of observational and WRF model data sets, as we did for the Harmattan and Bodélé Depression dust storm cases, for the convenience of readers we have not included the detailed analyses of the Saudi case in this article since we do not have unambiguous signals of Kelvin wave formation in this case. It is also to be understood that all validation of the Saudi case indicated that the simulation was accurate but the dynamics were not necessarily the same as the other two case studies.
The generation of Kelvin waves in Harmattan and Bodélé Depression dust storms were facilitated by the jet adjustment processes in the lee of the mountains and topographic blocking of the flow consistent with the lack of the sufficient kinetic energy of the air parcels to cross the mountains. This lack of kinetic energy to cross the mountains led to the following: (1) buildup of mass in the area immediately adjacent to respective mountains (consistent with schematic Fig. 1a and b), (2) release of excess mass from this buildup of mass after a certain period of time (consistent with schematic Fig. 1c), (3) effects of the Coriolis force on turning of the flow towards the right to achieve a balance (consistent with schematic Fig. 1d), (4) wind flow accompanying Kelvin waves parallel to the mountains (consistent with schematic Fig. 1e), and (5) interaction of this wind accompanying Kelvin waves with the highly warm air column created significant magnitudes of TKE resulting in dust from the surface (consistent with schematic Fig. 1f). This result is consistent with our generation of Kelvin wave hypotheses shown in Fig. 1 and also as discussed in the literature reviews of this article. This result contributes to a better understanding of how this type of large-scale dust transport can be organized from this region to the US, Amazon basin, and Europe (which are shown by numerous previous studies) and might be due in part to Kelvin waves. We also think there is still a need to study major historical dust events that occurred in this region to confirm that these locations are suitable and are responsible for the generation of the Kelvin waves and the transport of dust on a regular basis.
Data are available at http://www.eumetsat.int/website/home/Images/ImageLibrary/DAT_IL_04_03_06_F.html (source: European Organization for the Exploitation of Meteorological Satellites, EUMETASAT), https://ladsweb.nascom.nasa.gov (source: Moderate Resolution Imaging Spectroradiometer (MODIS) Aqua and Terra), https://www.nrlmry.navy.mil/aerosol_web/ (source: Navy Aerosol Analysis and Prediction System, NAAPS), https://giovanni.gsfc.nasa.gov/giovanni/ (source: NASA Giovanni), https://disc.sci.gsfc.nasa.gov/mdisc/data-holdings/merra/merra_products_nonjs.shtml (source: Modern-Era Retrospective analysis for Research and Applications, MERRA; last access: 8 November 2014), https://www.wunderground.com/, http://www.carte-algerie.com/carte-algerie/carte-topographique-algerie.jp (last access: 12 October 2019), and https://www.pinterest.com.au/pin/510877151474548010/.
AKP collected relevant data, performed the WRF model simulations and prepared this article. MLK edited and provided feedback on it.
The authors declare that they have no conflict of interest.
We would like to thank Kristein C. King, Robert David, Stephen Noble, Farnaz Hosseinpour, and Kacie Shourd for their help in collecting the observational data sets and running the WRF model. We would also like to thank to National Science Foundation (NSF) and National Center for Atmospheric Research (NCAR) for providing computational support.
This paper was edited by Raghavan Krishnan and reviewed by two anonymous referees.
Alharbi, B. H., Maghrabi, A., and Tapper, N.: The March 2009 dust event in Saudi Arabia-Precursor and Supportive Environment, B. Am. Meteorol. Soc., 94, 515–528, https://doi.org/10.1175/bams-d-11-00118.1,2013.
Balogun, E. E.: The phenomenology of the atmosphere over West Africa, Proceedings of Ghana Scope's Conference on Environment and Development in West Africa, 1–7 September 1974, Ghana, UNESCO/Ghana Environmental Protection Council, Ghana Acad. of Arts and Sciences, 19–31, 1974.
Betts, A. K.: A new convective adjustment scheme. 1. Observational and theoretical basis, Q. J. Roy. Meteor. Soc., 112, 677–691, https://doi.org/10.1256/smsqj.47306, 1986.
Betts, A. K. and Miller, M. J.: A new convective adjustment scheme. 2 single column tests using GATE Wave, Bomex, Atex, and Arctic airmass data sets, Q. J. Roy. Meteor. Soc., 112, 693–709, https://doi.org/10.1002/qj.49711247308, 1986.
Burton, R. R., Devine, G. M., Parker, D. J., Chazette, P., Dixon, N., Flamant, C., and Haywood, J. M.: The Harmattan over West Africa: Nocturnal structure and frontogenesis, Q. J. Roy. Meteor. Soc., 139, 1364–1373, https://doi.org/10.1002/qj.2036, 2013.
Chen, F. and Dudhia, J.: Coupling an advanced land surface-hydrology model with the Penn State-NCAR MM5 modeling system. Part I: Model implementation and sensitivity, Mon. Weather Rev., 129, 569–585, https://doi.org/10.1175/1520-0493(2001)129<0569:caalsh>2.0.co;2, 2001.
Dudhia, J.: Numerical study of convection observed during the winter monsoon experiment using a mesoscale two dimensional model, J. Atmos. Sci., 46, 3077–3107, https://doi.org/10.1175/1520-0469(1989)046<3077:nsocod>2.0.co;2, 1989.
Ek, M. B., Mitchell, K. E., Lin, Y., Rogers, E., Grunmann, P., Koren, V., Gayno, G., and Tarpley, J. D.: Implementation of Noah Land Surface Model advances in the National Centers for Environmental Prediction operational mesoscale Eta model, J. Geophys. Res., 108, 8851, https://doi.org/10.1029/2002JD003296, 2003.
Engelstaedter, S., Tegen, I., and Washington, R.: North African dust emissions and transport, Earth-Sci. Rev., 79, 73-100, https://doi.org/10.1016/j.earscirev.2006.06.004, 2006.
Garreaud, R. D. and Wallace, J. M.: Summertime incursions of midlatitude air into tropical and subtropical South America, Mon. Weather Rev., 126, 2713–2733, 1998.
Hamidi, M., Kavianpour, M. R., and Shao, Y. P.: Synoptic analysis of dust storms in the Middle East, Asia-Pac. J. Atmos. Sci., 49, 279–286, https://doi.org/10.1007/s13143-013-0027-9, 2013.
Janjic, Z. I.: The step-mountain Eta coordiante model-further developments of the convection, visocus sub-layer, and turbulence closure schemes, Mon. Weather Rev., 122, 927–945, https://doi.org/10.1175/1520-0493(1994)122<0927:tsmecm>2.0.co;2, 1994.
Janjić, Z. I.: The surface layer in the NCEP Eta model, Preprints, 11th Conference on Numerical Weather Prediction, 19–23 August 1996, Am. Norfolk, Va, USA, Amer. Meteor. Soc., 354–355, 1996.
Janjić, Z. I.: Nonsingular implementation of the Mellor-Yamada Level 2.5 Scheme in the NCEP Meso model, Off. Note 437, National Centers for Environmental Prediction, Camp Springs, MD, USA, 61 pp., 2001.
Kalu, A. E.: The African dust plume: Its characteristics and propagation across West Africa in winter, in: Saharan Dust: Mobilization, Transport and Deposition, edited by: Morales, C., 95–118, John Wiley and Sons, Chichester, UK, 1979.
Kutiel, H. and Furman, H.: Dust storms in the Middle East: Sources of origin and their temporal characteristics, Indoor Built Environ.t, 12, 419–426, https://doi.org/10.1177/1420326x03037110, 2003.
Liebmann, B., Kiladis, G., Marengo, J., Ambrizzi, T., and Glick, J. D.: Submonthly convective variability over South America and the South Atlantic convergence zone, J. Climate, 12, 1877–1891, 1999.
Mellor, G. L. and Yamada, T.: A hierarchy of turbulence closure models for planetary boundary layers, J. Atmos. Sci., 31, 1791–1806, https://doi.org/10.1175/1520-0469(1974)031<1791:AHOTCM>2.0.CO;2, 1974.
Mlawer, E. J., Taubman, S. J., Brown, P. D., Iacono, M. J., and Clough, S. A.: Radiative transfer for inhomogeneous atmospheres: RRTM, a validated correlated-k model for the longwave, J. Geophys. Res.-Atmos., 102, 16663–16682, https://doi.org/10.1029/97jd00237, 1997.
Moulin, C., Lambert, C. E., Dayan, U., Masson, V., Ramonet, M., Bousquet, P., Legrand, M., Balkanski, Y. J., Guelle, W., Matricoreana, B., Bergametti, G., and Dulac, F.: Satellite climatology of African dust transport in the Mediterranean atmosphere, J. Geophys. Res., 103, 13137–13144, https://doi.org/10.1029/98JD00171, 1998.
Notaro, M., Alkolibi, F., Fadda, E., and Bakhrjy F.: Trajectory analysis of Saudi Arabian dust storms, J. Geophys. Res.-Atmos., 118, 6028–6043, https://doi.org/10.1002/jgrd.50346, 2013.
Parmenter, F. C.: A Southern Hemisphere cold front passage at the equator, B. Am. Meteorol. Soc., 57, 1435–1440, 1976.
Pérez García-Pando, C., Stanton, M., Diggle, P., Trzaska, S., Miller, R. L., Perlwitz, J. P., Baldasano, J. M., Cuevas, E., Ceccato, P., Yaka, P., and Thomson, M. C.: Soil dust aerosols and wind as predictors of seasonal meningitis incidence in Niger, Environ. Health Persp., 122, 679–686, https://doi.org/10.1289/ehp.1306640, 2014.
Pokharel, A. K.: Atmospheric Dynamics of Sub-Tropical Dust Storms, University of Nevada, Reno, ProQuest Dissertations Publishing, 2016, 10161308, available at: https://search.proquest.com/openview/da62a119163cda173814073c75d3bc4e/1?pq-origsite=gscholar&cbl=18750&diss=y (last access: 2 April 2017), 2016.
Pokharel, A. K. and Kaplan, M. L.: Dust climatology of the NASA dryden flight research center (DFRC) in Lancaster, California, USA, Climate, 5, 15, https://doi.org/10.3390/cli5010015, 2017.
Pokharel, A. K., Kaplan, M. L., and Fiedler S.: Atmospheric Dynamics of the Harmattan Surge on 2 March 2004, ProScience, 3, 84–93, https://doi.org/10.14644/dust.2016.014, 2016.
Pokharel, A. K., Kaplan, M. L., and Fiedler, S.: Subtropical dust storms and downslope wind events, J. Geophys. Res.-Atmos., 122, 10191–10205, https://doi.org/10.1002/2017JD026942, 2017a.
Pokharel, A. K., Kaplan, M. L., and Fiedler, S.: The role of jet adjustment processes in subtropical dust storms, J. Geophys. Res.-Atmos., 122, 12122–12139, https://doi.org/10.1002/2017JD026672, 2017b.
Rinecker, M. M., Suarez, M. J., Gelaro, R., Todling, R., Bacmeister, J., Liu, E., Bosilovich, M. G., Schubert, S. D., Takacs, L., Kim, G.-K., Bloom, S., Chen, J., Collins, D., Conaty, A., Silva, A. D., Gu, W., Joiner, J., Koster, R. D., Lucchesi, R., Molod, A., Owens, T., Pawson, S., Pegion, P., Redder, C. R., Reichle, R., Robertson, F. R., Ruddick, A. G., Sienkiewicz, M., and Woollen, J.: MERRA: NASA's modern-era retrospective analysis for research and applications, J. Climate, 24, 3624–2648, https://doi.org/10.1175/JCLI-D-11-00015.1, 2011.
Shao, Y.: Physics and Modelling of Wind Erosion, Kluwer Acad., Norwell, Mass, USA, 393 pp., 2000.
Skamarock, W. C., Klemp, J. B., Dudhia, J., Gill, D. O., Barker, D. M., Duda, M. G., Huang, X.-Y., Wang, W., and Powers, J. G.: A Description of the Advanced Research WRF Version 3, NCAR/TN-475+STR, University Corporation for Atmospheric Research, Boulder, Colorado, USA, 113 pp., https://doi.org/10.5065/D68S4MVH, 2008.
Stull, R. B.: Meteorology for scientists and engineers, Pacific Grove/Brooks Cole, Pacific Grove, CA, USA, 2000.
Swap, R., Ulanski, S., Cobbett, M., and Garstang, M.: Temporal and spatial characteristics of Saharan dust outbreaks, J. Geophys. Res.-Atmos., 101, 4205–4220, https://doi.org/10.1029/95jd03236, 1996.
Thompson, G., Rasmussen, R. M., and Manning, K.: Explicit forecasts of winter precipitation using an improved bulk microphysics scheme. Part I: Description and sensitivity analysis, Mon. Weather Rev., 132, 519–542, https://doi.org/10.1175/1520-0493(2004)132<0519:efowpu>2.0.co;2, 2004.
Thompson, G., Field, P. R., Hall, W. D., and Rasmussen, R. M.: A new bulk microphysics parameterization for WRF and MM5, Seventh Weather and Research Forecasting Workshop, National Center for Atmospheric Research, NCAR, 19–22 June 2006, Boulder, Colorado, USA, 1–11, 2006.
Thomson, W.: On gravitational oscillations of rotating water, P. Roy. Soc. Edinb., 10, 92–100, 1879.
Tilley, J. S.: On the Application of Edge Wave Theory to Terrain Bounded Cold Surges: A Numerical Study, PhD Thesis, The Pennsylvania State University, University Park, USA, 1990.
Vizy, E. and Cook, K. H.,: A mechmaism for African monsoon breaks: Mediterranean cold air surges, J. Geosphys. Res., 114, D0114, https://doi.org/10.1029/2008JD010654, 2009.
Wang, B.: Kelvin Waves, University of Hawaii, Honolulu, HI, USA, Elsevier Science Ltd., https://doi.org/10.1006/rwas.2002.0191, 2002.
Washington, R. and Todd, M. C.: Atmospheric controls on mineral dust emission from the Bodélé Depression, Chad: The role of the low level jet, Geophys. Res. Lett., 32, L17701, https://doi.org/10.1029/2005gl023597, 2005.
Washington, R., Todd, M., Middleton, N. J., and Goudie, A. S.: Dust storm source areas determined by the Total Ozone Monitoring Spectrometer and surface observations, Ann. Assoc. Am. Geogr., 93, 297–313, https://doi.org/10.1111/1467-8306.9302003, 2003.
Washington, R., Todd, M. C., Lizcano, G., Tegen, I., Flamant, C., Koren, I., Ginoux, P., Engelstaedter, S., Bristow, C. S., Zender, C. S., Goudie, A. S., Warren, A., and Prospero, J. M.: Links between topography, wind, deflation, lakes and dust: The case of the Bodélé Depression, Chad, Geophys. Res. Lett., 33, L09401, https://doi.org/10.1029/2006GL025827, 2006.