the Creative Commons Attribution 4.0 License.
the Creative Commons Attribution 4.0 License.
 | 30 Sep 2019
Contributions of climate change and groundwater extraction to soil moisture trends
Longhuan Wang
Binghao Jia
Jinbo Xie
Bin Liu
Ruichao Li
Si Chen
Climate change affects water availability for soil, and groundwater extraction influences water redistribution by altering water demand, both of which significantly affect soil moisture. Quantifying their relative contribution to the changes in soil moisture will further our understanding of the mechanisms underlying the global water cycle. In this study, two groups of simulations were conducted with and without groundwater (GW) extraction (estimated based on local water supply and demand) from 1979 to 2010 using the Chinese Academy of Sciences land surface model, CAS-LSM, with four global meteorological forcing datasets (GSWP3, PRINCETON, CRU-NCEP, and WFDEI). To investigate the contribution of climate change and GW extraction, a trajectory-based method was used. Comparing the simulated results with the in situ dataset of the International Soil Moisture Network (ISMN) and the satellite-based soil moisture product of the European Space Agency's Climate Change Initiative (ESA-CCI) indicated that the CAS-LSM reasonably reproduced the distribution of soil moisture and matched the temporal changes well. Globally, our results suggested a significant decreasing trend in surface soil moisture (0–10 cm, mm3 mm−3 yr−1) over the 32-year period tested. The drying trends were mainly observed in arid regions such as the tropical desert regions in North Africa and the Arabian Peninsula, while the wetting trends were primarily in tropical forested areas in South America and northeastern Asia. Climate change contributed 101.2 % and 90.7 % to global drying and wetting trends of surface soil moisture, respectively, while GW extraction accounted for −1.2 % and 9.3 %, respectively. In deep soil, GW extraction contributed 1.37 % and −3.21 % to the drying and wetting trends, respectively. The weak influence of GW extraction may be because this activity occurs in limited areas. GW extraction contributed more than 35 % to the change in surface soil moisture in wetting areas where GW overexploitation occurs. GW is mainly extracted for irrigation to alleviate soil water stress in semiarid regions that receive limited precipitation, thereby slowing the drying trend and accelerating the wetting trend of surface soil. However, GW exploitation weakens the hydraulic connection between the soil and aquifer, leading to deeper soils drying up. Overall, climate change dominated the soil moisture trends, but the effect of GW extraction cannot be ignored.
- Article
(7136 KB) - Full-text XML
- BibTeX
- EndNote


Soil moisture plays a critical role in controlling the exchange of water, energy, and carbon in the land–vegetation–water–atmosphere system (Seneviratne et al., 2010; Van den Hurk et al., 2011). Soil drying could increase the possibility of agricultural drought and fire (Dai, 2011), and it affects plant transpiration, photosynthesis, microbial activity, and a number of biogeochemical processes. Significant decreasing trends in soil moisture can lead to water scarcity, threatening the water supply and associated food production (Döll et al., 2009; Wisser et al., 2010; Albergel et al., 2012; Wada et al., 2013; Dai, 2013; Zhan et al., 2016). Soil moisture trends are affected by both climate (e.g., precipitation and temperature) and human activities (e.g., groundwater (GW) extraction). Climate change can affect water availability for soil (Dai, 2013; Wentz et al., 2007; Feng, 2016), and human activities influence the soil water content by altering the surface water flux of soil (Min et al., 2011; Douville et al., 2013; Feng, 2016). GW extraction, such as for irrigation, has also been shown to affect local soil moisture. However, it remains unclear which of these factors exerts more influence owing to the complex interactions involved. Therefore, quantifying the contribution of climate change and GW extraction to soil moisture trends will improve our understanding of how human activities affect soil water content and will help to determine the mechanisms underlying the global water cycle.
Traditionally, trends in soil moisture have been studied using ground-based observations (Robock et al., 2005), which provide a direct record of soil moisture and are used as reference measurements for calibrating other methods for measuring soil moisture (Yin et al., 2018). Since they are limited in space, require significant manpower for sampling (Seneviratne et al., 2010), and cannot always represent larger scales, remote sensing methods (e.g., passive and active microwave remote sensing) that provide global coverage and excellent temporal sampling of soil moisture are widely used (Albergel et al., 2013). Nevertheless, the accuracy of these measurements strongly depends on the retrieval approach , and determining the contribution of climate and human activities is not easy. As a result, recent studies have mostly relied on model estimates (Wei et al., 2008; Zhan et al., 2016).
Land surface models (LSMs) can be used to calculate soil moisture trends at regional or global scales (Li et al., 2011; Jia et al., 2018). Different LSMs have been developed to simulate soil moisture as a function of meteorological input variables and soil and vegetation parameters over a few decades (e.g., Kowalczyk et al., 2006; Lawrence et al., 2011; Best et al., 2011). Much previous research has focused on the effect of climate change on soil moisture using comprehensive LSMs forced with realistic forcing data (Berg et al., 2003; Guo et al., 2006; Wei et al., 2008; Wang and Zeng, 2011). For global average, precipitation had a dominant effect on the variability of soil moisture at interannual to decadal timescales; however, temperature was the main cause of the long-term trend in soil moisture. Increased soil drying in the transitional regions was primarily caused by global warming, which is illustrated by regression analysis and LSMs (Cheng and Huang, 2016). Since 1950, rising temperatures have contributed 45 % of the total soil moisture reduction (Cai et al., 2009). In semiarid regions, precipitation and temperature are equally important to simulations of soil hydrological variables (Wang and Zeng, 2011). Jia et al. (2018) found that precipitation controlled the direction of soil moisture changes using remote sensing data from the ESA-CCI and modeling soil moisture by the Community Land Model 4.5 (CLM4.5) in China. Recently, researchers have focused on incorporating human activity into the hydrological processes of LSMs to assess the influence of anthropogenic activities on hydrological variable simulations. For example, irrigation has been shown to affect soil water content through increased local evapotranspiration and decreased temperatures near the surface (Yu et al., 2014; Zou et al., 2014). GW over-extraction lowers GW tables, reduces total terrestrial water storage, weakens hydraulic connections between aquifers and rivers, and may decrease lake area (Coe and Foley, 2001). Wada et al. (2013) reported that human water consumption is one of the more important mechanisms intensifying hydrological drought. GW exploitation caused drying in deep soil layers and wetting in upper layers, lowering the water table and rapidly reducing terrestrial water storage with severe levels of GW consumption (Zeng et al., 2016a, b, 2017; Xie et al., 2018).
Thus, to our knowledge, the influence of anthropogenic activities (GW extraction) on soil moisture has not been explicitly quantified. Therefore, the main purpose of our study was to assess the relative contribution of GW extraction and climate change to soil moisture trends. To address this issue, the historical land simulations of the Land Surface, Snow and Soil Moisture Model Intercomparison Project (LS3MIP) were employed (van den Hurk et al., 2016). Four global meteorological forcing datasets covering the 20th century were used with the land surface model for the Chinese Academy of Sciences (CAS-LSM), which considers human water regulation (HWR) and the movement of frost and thaw fronts (Xie et al., 2018). We compared the simulations with in situ observations and the ESA-CCI satellite-based product to validate the capacity of the CAS-LSM to simulate soil moisture trends. Furthermore, we investigated the interannual variation and trends in simulated soil moisture. Finally, the response of soil moisture temporal variability to climate change and GW extraction was investigated, which can further our understanding of the relationship between soil moisture and climate.
Section 2 describes the model used in this study and describes the experimental designs, in situ observations, and satellite-based data. Then Sect. 3 evaluates the soil moisture simulations in comparison with in situ observations and satellite-based data. Also, the contributions of climate and GW extraction to soil moisture are discussed, while Sect. 4 outlines our conclusions.
2.1 Description of CAS-LSM
Xie et al. (2018) incorporated GW lateral flow (GLF), human water regulation (HWR), and the changes in the depth of frost and thaw fronts into CLM4.5 (Oleson, 2013) to develop the high-resolution CAS-LSM. For a detailed description of the physical processes within the CAS-LSM, see Xie et al. (2018). In the present study, only the HWR module was activated. Owing to the coarse resolution (0.9∘ × 1.25∘) of the experiment, it is not possible to describe the water intake of the river, that is, the surface water. Therefore, only GW extraction was considered in our study. Here, only the processes associated with soil water are briefly described below.
The following equation represents the total water balance of the hydrological system:
where the left side denotes the change in canopy water, surface water, snow water, soil water, and ice and water in the unconfined aquifer in turn. qrain is rainfall, qsno is snow, and qs and qg represent the rate of surface and GW water use, respectively, some of which will return to the soil. qover is surface runoff, and qh2osfc is runoff from surface water storage. qrgwl and qice are liquid and solid runoff, respectively, from glaciers, wetlands, and lakes. qdrai is subsurface drainage and ET is evapotranspiration from vegetation, ground, and human water use. Δt is the time step(s).
2.2 Experimental setup
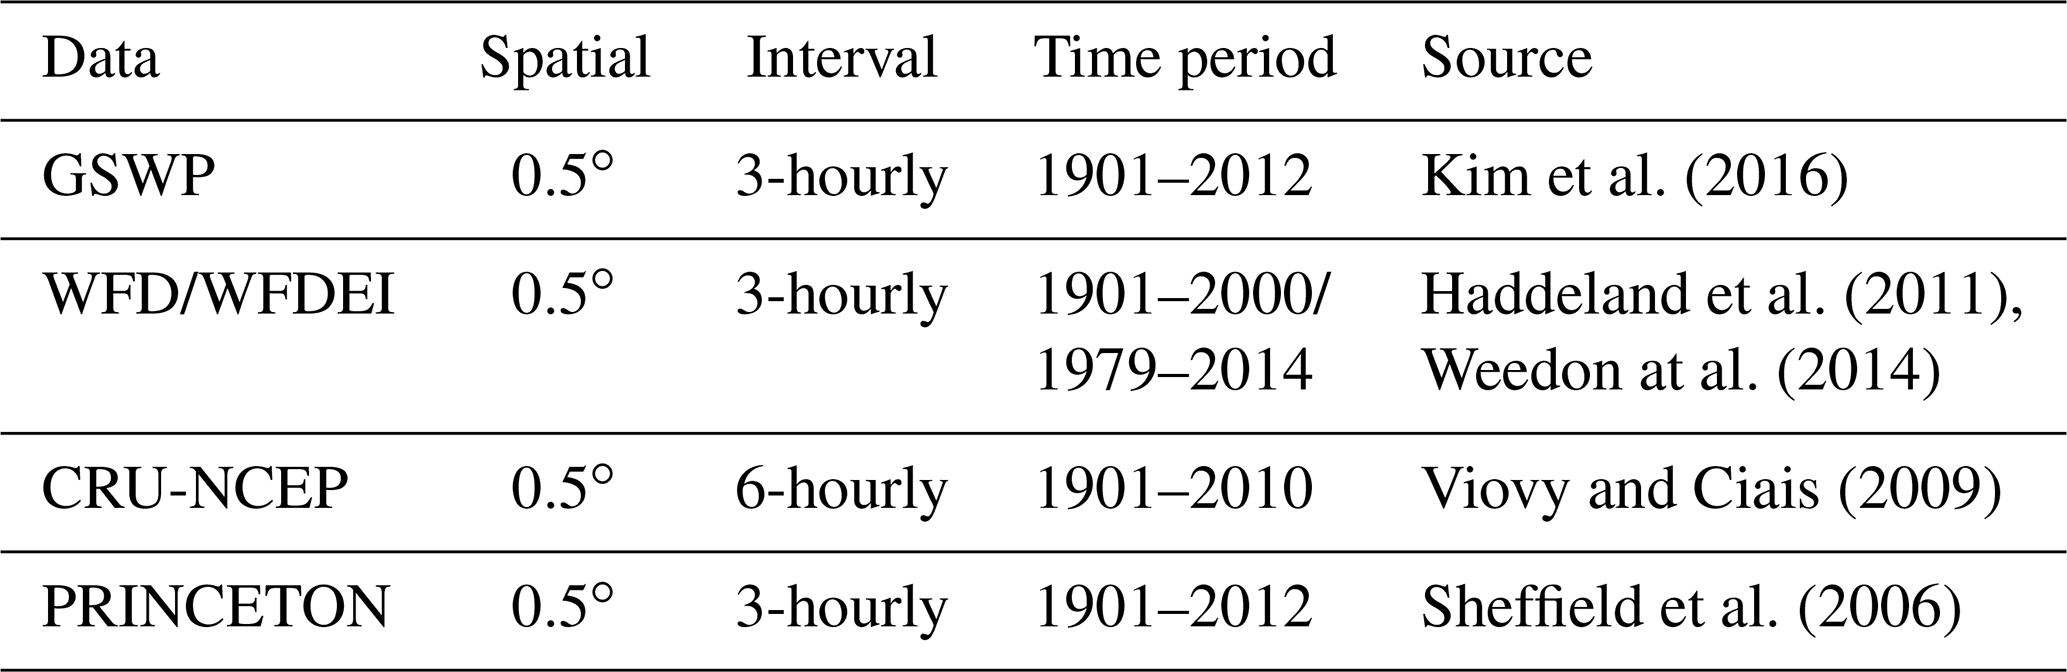
In this study, GSWP3 (Kim et al., 2016), WFDEI (Haddeland et al., 2011; Weedon at al., 2014), CRU-NCEP (Viovy and Ciais, 2009), and PRINCETON (Sheffield et al., 2006) were used to run the offline model. The fields included were air temperature, wind speed, specific humidity, solar radiation, and precipitation. The GSWP3 is based on a dynamical downscaling of the 20th century reanalysis project (Compo et al., 2011), covering the entire 20th century and some of the 21st century (1901–2012) at 0.5∘ spatial resolution and 3 h intervals. The WATCH forcing data (WFD) are based on the ECMWF ERA-40 reanalysis data and were also at 0.5∘ resolution and 3 h intervals, ceasing in 2001. A subsequent project, EMBARCE, provided the WFDEI, which consisted of 3 h interval ECMWF ERA-Interim reanalysis data interpolated to 0.5∘ spatial resolution (1979–2014). Thus, there are offsets for some variables in the overlap period with the WFD. The CRU-NCEP provided 6 h interval data at 0.5∘ horizontal spatial resolution (1901–2010). The PRINCETON is based on 6 h interval surface climate data from the NCEP-NCAR reanalysis. These data are available at 0.5∘ resolution and 3 h intervals. The version used in this study is from 1901 to 2012 with a real-time extension based on satellite precipitation and weather model analysis fields. General information about these datasets is summarized in Table 1. Four forcing datasets were bilinearly interpolated to construct a field to a uniform 0.9∘ × 1.25∘ to ensure that every simulation had the same soil and vegetation parameters.
Table 1General information on the meteorological forcing datasets.
We replaced the land cover data with the new generation of “land use harmonization” (LUH2), which builds on past work from CMIP5 (Hurtt et al., 2011). In addition, monthly irrigation datasets (Zeng et al., 2016b) were used for land model runs, which were developed based on the Food and Agriculture Organization of the United Nations (FAO) global water information system and the Global Map of Irrigation Areas version 5.0 (GMIA5; Siebert et al., 2005). Industrial and domestic water use were also included and were calculated by the fractions of total GW water consumption for agricultural, industrial, and domestic water use provided by the FAO. Changes in the annual GW pumping rate are assumed to vary linearly with population growth and socioeconomic development, as evidenced by previous work (Omole, 2013; Wu et al., 2014; Zou et al., 2015). The resulting global spatial patterns of GW extraction from 1979 to 2010 are shown in Fig. 2. Note that the GW exploitation hot spots like Europe, southern Iran, the North China Plain, the central United States, northern India, and Pakistan are consistent with previous studies (Rodell et al., 2009; Wada et al., 2010).
Two sets of numerical experiments were conducted using the default CLM4.5 (hereafter referred to as CTL) and using the CAS-LSM with the HWR module activated (hereafter referred to as NEW). Thus, CTL and NEW contained four simulations: CTL-GSWP3, CTL-CRUNCEP, CTL-PRINCETON, and CTL-WFDEI (prefixed with NEW- for the NEW model). The CTL runs did not include GW extraction, while the NEW runs did include it. Therefore, the difference between the NEW and CTL models provides a measure of the effect of GW extraction. Simulation spin-up followed the TRENDY protocol (http://dgvm.ceh.ac.uk/node/9, last access: August 2019) by recycling the climate mean and variability from 20 years (1901–1920) of the meteorological forcing. Land use and CO2 concentration were set to constant at the 1850 level during spin-up. All simulations were conducted with horizontal spacing of 0.9∘ × 1.25∘. However, there were differences among the four forcing datasets; therefore, the simulation period covers between 1901 and 2010 at a time step of 30 min. Considering that the ESA-CCI was available from 1979 to 2010, our evaluation focused on the same time interval.
2.3 In situ soil moisture and satellite-based data
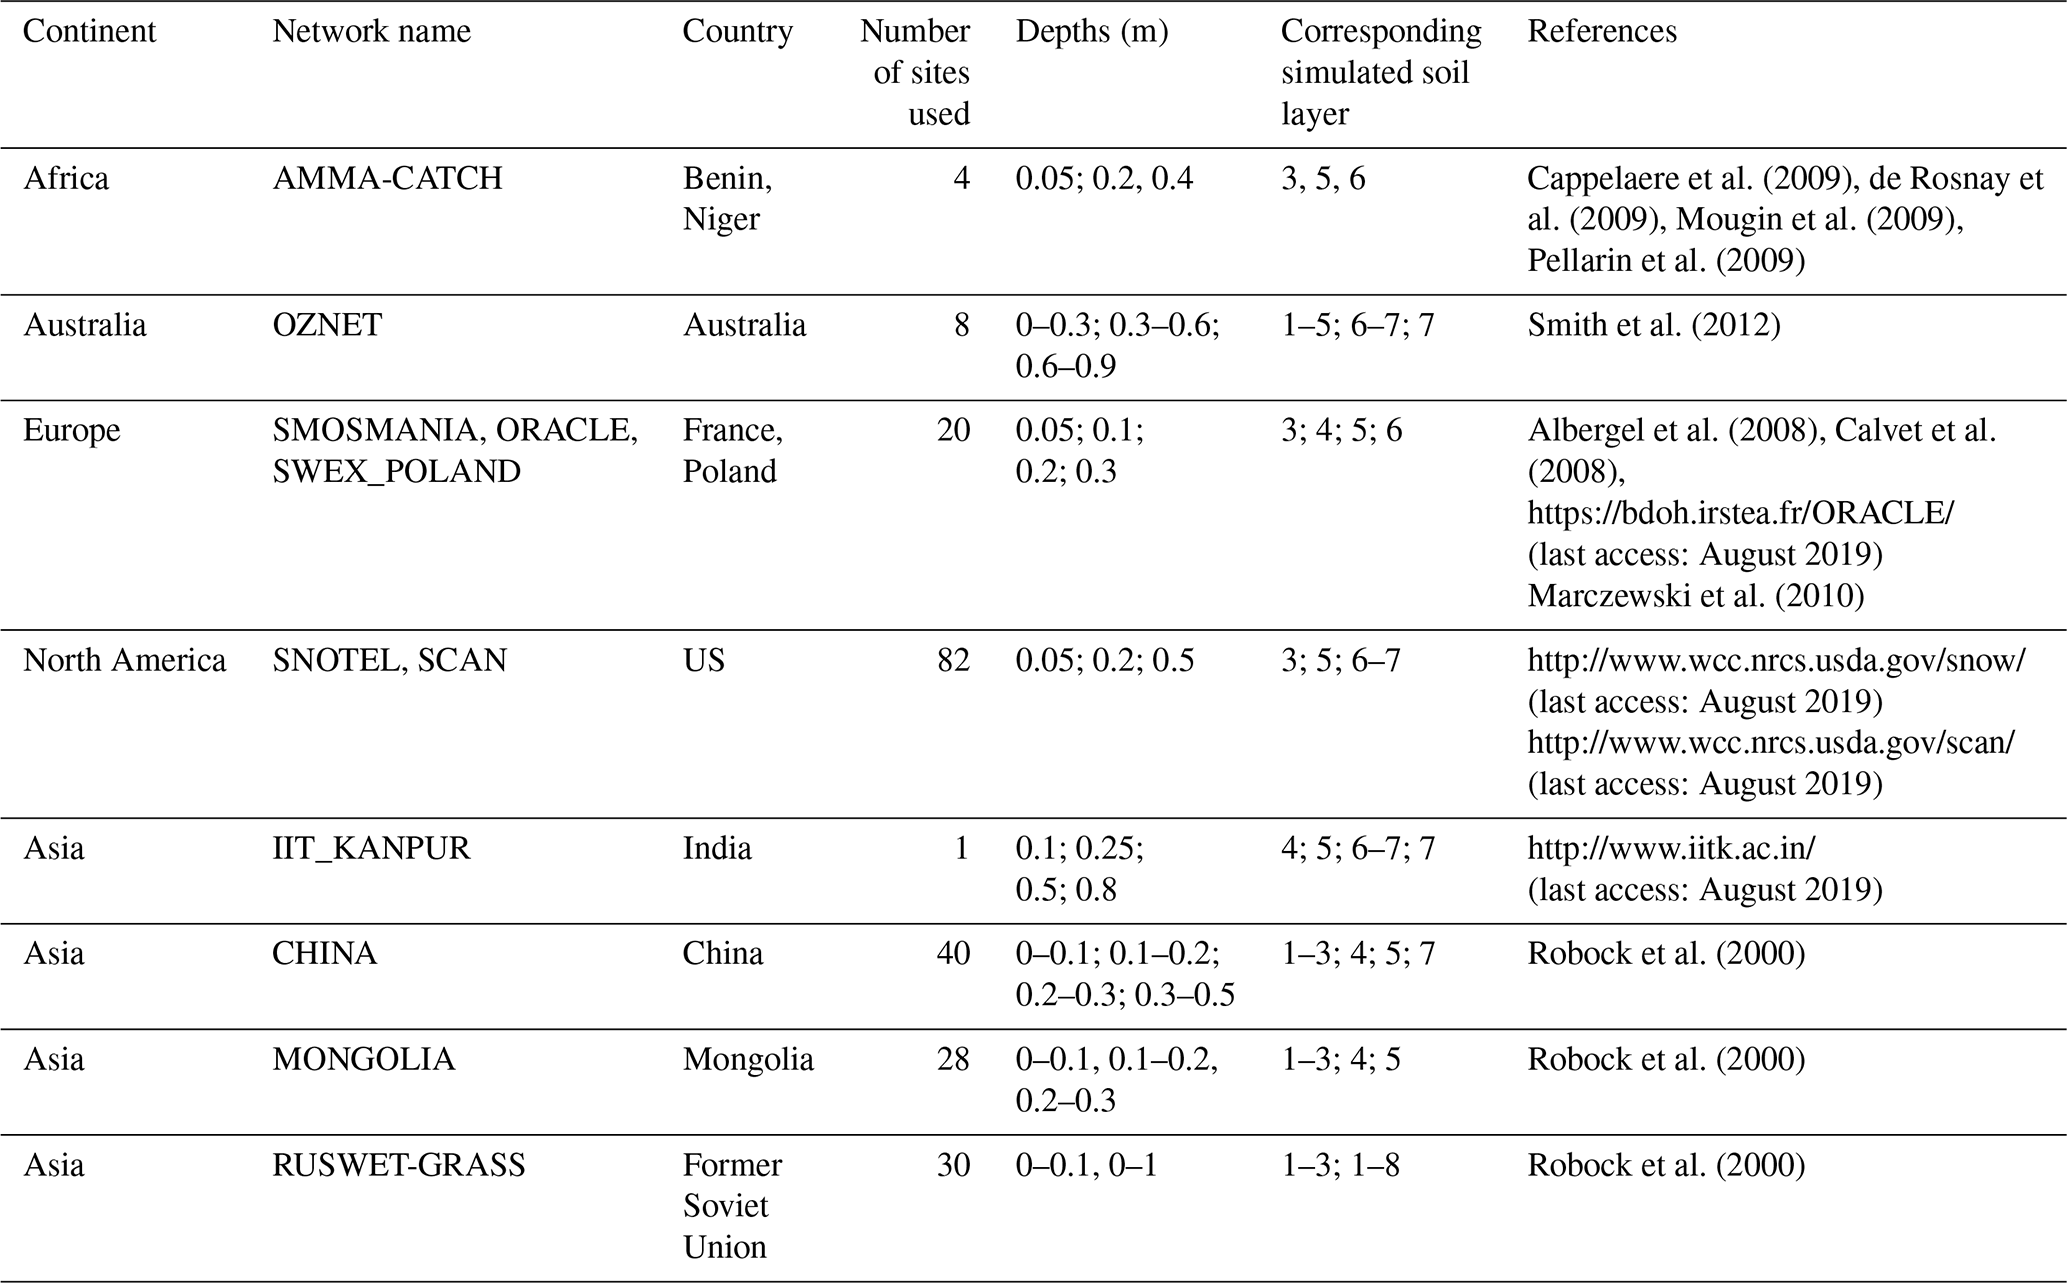
To evaluate the capability of the CAS-LSM to simulate soil moisture variation, we retrieved in situ soil moisture data from the International Soil Moisture Network (ISMN) (Robock et al., 2000; Dorigo et al., 2011, 2013). The ISMN is based on in situ measurements from different regional monitoring projects. For our study, we used data from African, Asian, European, Australian, and North American networks. Stations with >75 % of the observational data missing during the evaluation period were excluded, after which a subset of 225 stations remained (Fig. 2). There were only three dominant contiguous areas in the world (the central USA, the North China Plain, and northern India) with severe levels of GW extraction (Zeng et al., 2016b). Therefore, we focused on validating the ability of the model to accurately represent the soil moisture in these three areas. Further site information is presented in Table 2.
The European Space Agency's Climate Change Initiative (ESA-CCI) involves remote sensing projects to monitor global key climate variables with feedback effects on climate change. Soil moisture was then included in 2010. There are three ESA-CCI soil moisture products available based on the two types of sensors employed by the project: active microwave remote sensing, passive microwave remote sensing, and a combined product of both active and passive data. The active product was obtained using the SCAT scatterometer and the METOP-A satellite-equipped C-band scatterometer using the algorithm proposed by Wagner et al. (1999). The passive product includes observation data from four satellites, namely the Tropical Rainfall Measuring Mission microwave imager, the scanning multichannel microwave radiometer, the specific sensor microwave imager, and the Advanced Microwave Scanning Radiometer Earth Observing System. In the present study, we used the combined product (version 3.2), which covers 38 years from 1978 to 2016 at a daily temporal resolution.
2.4 Analysis method
Taylor's skill score (S) (Taylor, 2001) was used to quantitatively evaluate the spatial correlation of modeled soil moisture against the observations with standard deviations as follows:
where σf is the ratio of the standard deviation of the simulations to the observations, R is the spatial correlation coefficient between the simulation and observation, and R0 is the maximum possible spatial correlation coefficient. As the model variance approaches the observed variance (i.e., as σf→1) and as R→R0, the skill approaches 1. Thus, a higher value of S indicates a better model performance, and S=1 when the simulation and observation data are identical.
All simulated datasets were converted to annual means by averaging for the growing season (March–October) before the trend analysis. Precipitation and temperature were treated the same as soil moisture. Trends were calculated using the nonparametric Mann–Kendall test, and the Theil–Sen median slope (Sen, 1968) was used to delineate the trends.
To quantify the contribution of the climate and GW extraction to the trends in soil moisture, we used a trajectory method (Feng and Liu, 2014). The “trajectory” refers to studying the change in GW extraction that occurs within a certain period of time for a given grid or region. We can study the effect on soil moisture due to GW extraction in this way. Soil moisture in the CTL experiment represented the effect of climate on soil moisture trends and served as a reference for isolating the contribution of GW extraction. The contributions were calculated with area weight summarization as follows:
where Congw,global and Concm,global are the global contributions of GW extraction and climate, respectively; Rgw is the area ratio of GW extraction in the drying or wetting areas; Tgw and Tctl are the drying or wetting soil moisture trends in the GW and non-GW extraction regions, respectively; and T is the soil moisture trend in the global drying or wetting zones.
The contributions of climate and GW extraction to certain grids were calculated as follows:
where Congw,grid and Concm,grid are the contributions of GW extraction and climate to each grid, respectively; Tgw and Tctl are the soil moisture trends at each grid in the NEW and CTL experiments, respectively.
3.1 Validation
First, we compared the spatial distribution of simulated soil moisture with the ESA-CCI product. Figure 1a, c, e, and g show the linear correlation coefficients between the ESA-CCI and the simulated top 10 cm soil moisture from 1979 to 2010. The top 10 cm soil moisture is a weighted average of the first four soil layer thicknesses (1.75, 2.76, 4.55, and 7.5 cm; the weights are 0.175, 0.276, 0.455, and 0.094, respectively). The correlations between the simulated and ESA-CCI data were significantly positive in most areas (r>0.6). Modeled results were more accurate in humid and temperature zones, especially in India and Southeast Asia (r>0.9). Results revealed that the interannual variability of soil moisture cannot be well captured in northern high-latitude areas (no correlation or negative correlations). This is partly due to the limited ability of remote sensing techniques in detecting soil moisture in frozen soils or under snow cover.
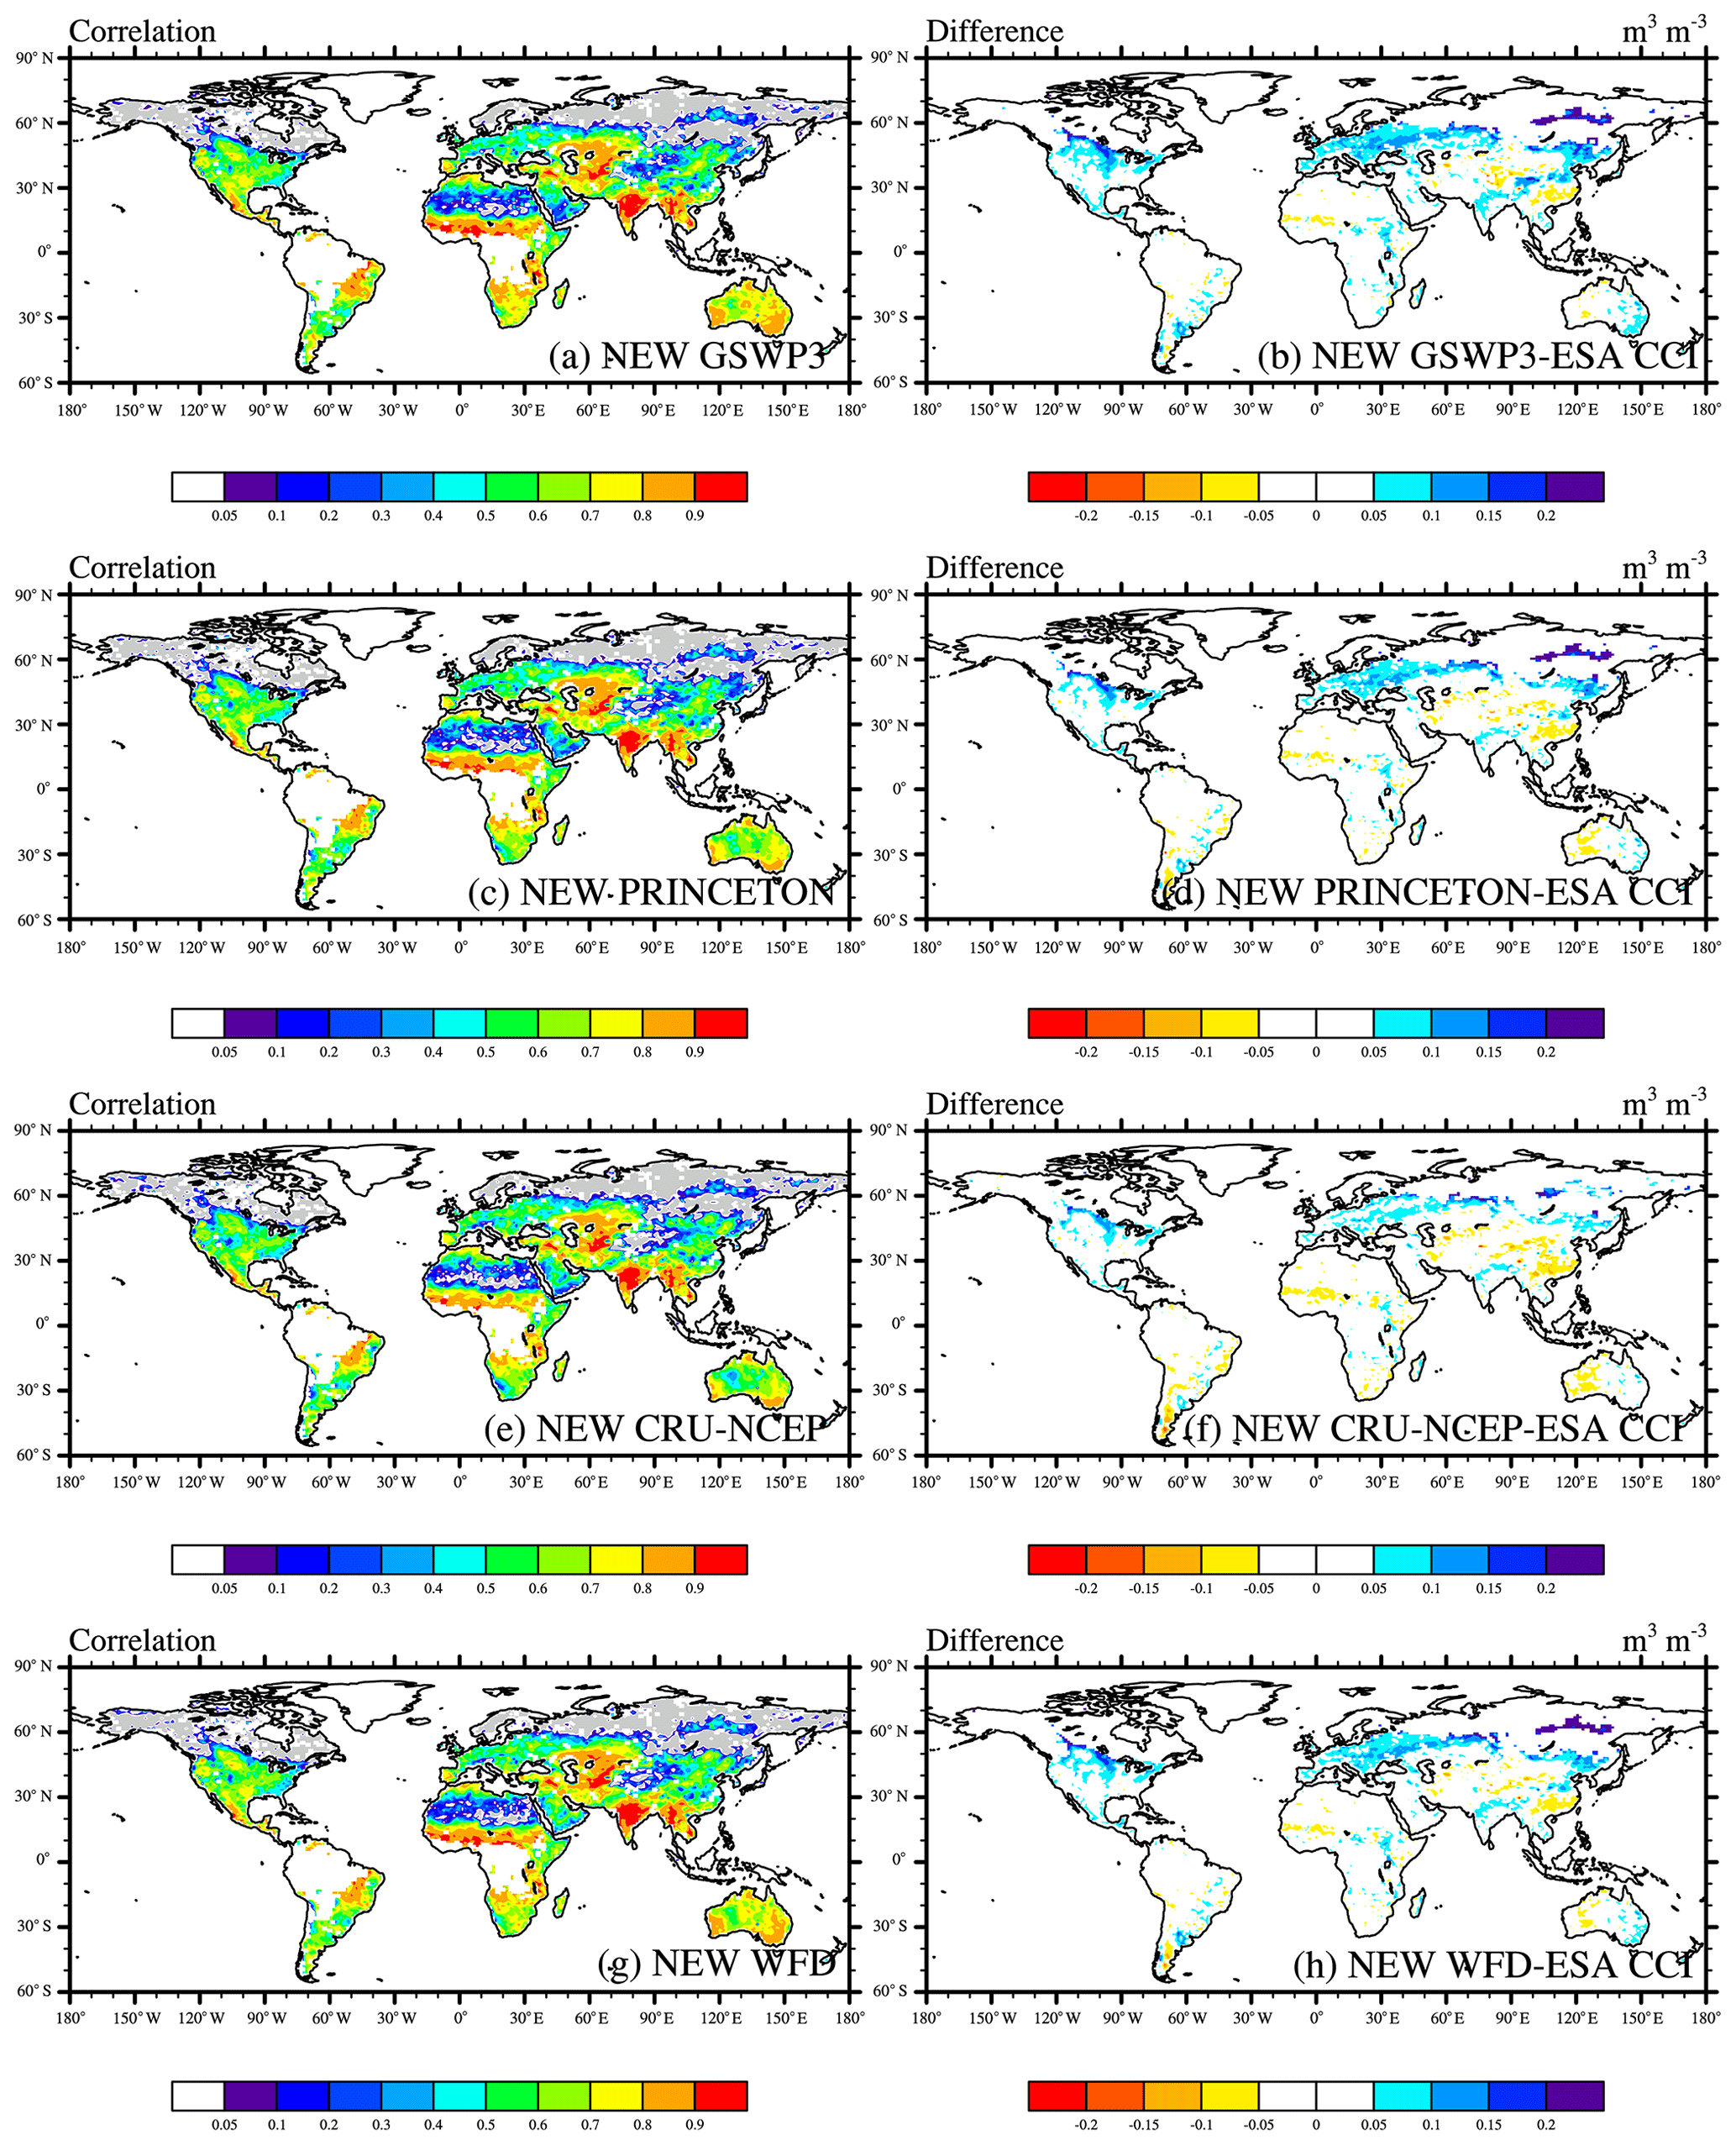
Figure 1Correlation coefficients (a, c, e, g) and differences in spatial patterns (b, d, f, h) of the ESA-CCI soil moisture and the corresponding simulated top 10 cm soil moisture from 1979 to 2010. Gray pixels indicate no correlation and negative correlation.
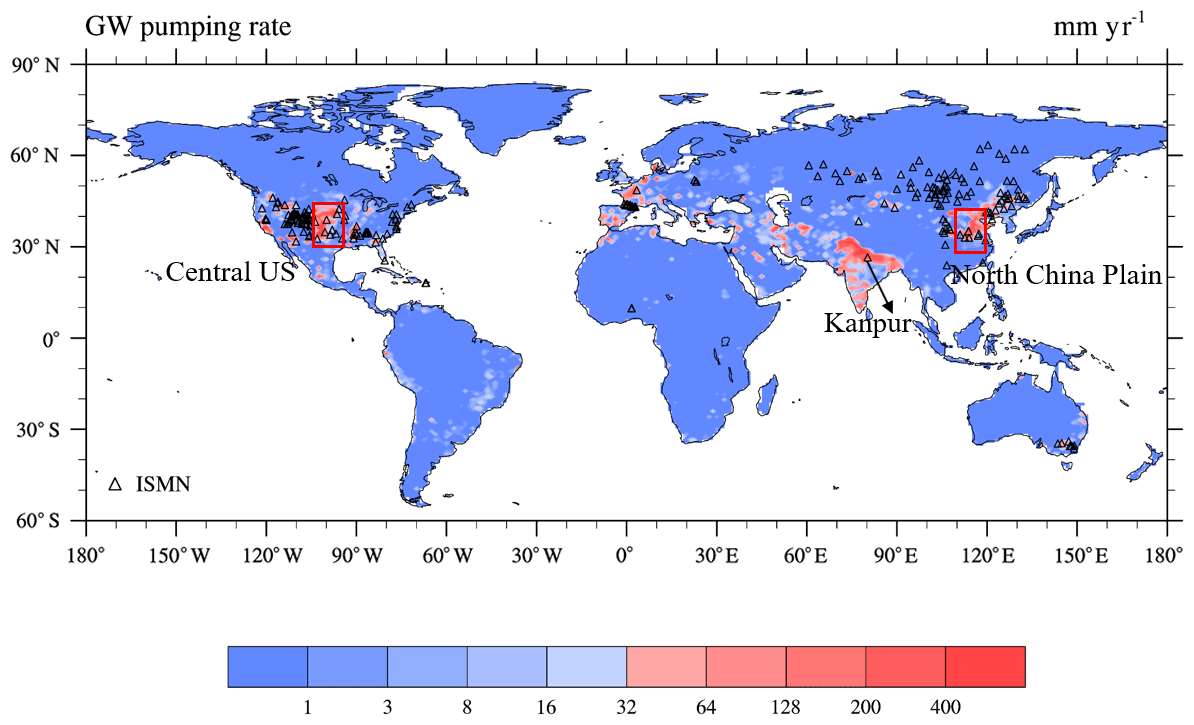
Figure 2Distribution of soil moisture stations and three subregions. The are 7 stations on the North China Plain, 15 in the central US, and 1 in Kanpur in northern India). The background is the groundwater (GW) extraction rate.
Figure 1b, d, f, and h show the differences between NEW simulations and ESA-CCI data. Soil moisture from all forcing datasets presented similar broad patterns. ESA-CCI had lower soil moisture compared with the simulated results from Europe and the eastern USA, while Fig. 1f shows that the results from CRU-NCEP are drier than those from the other three at high latitudes in the Northern Hemisphere. The simulation results in WFD were wetter overall, and the PRINCETON drier in South America and central Africa. However, overall, the results from the PRINCETON and GSWP3 simulation were closer. Soil moisture from NEW was 0.06 % to 0.09 % higher than that from CTL. The area represented by NEW is irrigated; thus, the top 10 cm of soil is wetter in NEW than in CTL. However, the increase in soil moisture was slight (about 0.001 to 0.2 mm3 mm−3). The differences between NEW and CTL indicate that GW extraction caused a significant increase in top 10 cm soil moisture in the central USA, the North China Plain, and northern India, which are the three areas with severe levels of GW extraction (Fig. 2).
Figure 3 presents Taylor diagrams comparing the four NEW experiments with the in situ ISMN observations over the eight subregions (see Table 2 for site details). Figure 3 clearly shows that the model can generally capture the changes in soil moisture in these regions (with high correlation close to 1). However, the performance of the model decreases as the soil depth increases. Results suggest that the standard deviation ratios at most stations in Africa, Australia, Europe, and North America were close to 1, while those for India, Mongolia, China, and former Soviet Union countries deviated from 1. Moreover, the different forcing datasets did not perform similarly. GSWP performed relatively poorly in deep soil in Europe, while PRINCETON provided a good estimation for Mongolia. CRUNCEP performed poorly in China and Mongolia. In general, GSWP and WFDEI performed well, except for Europe and Mongolia.
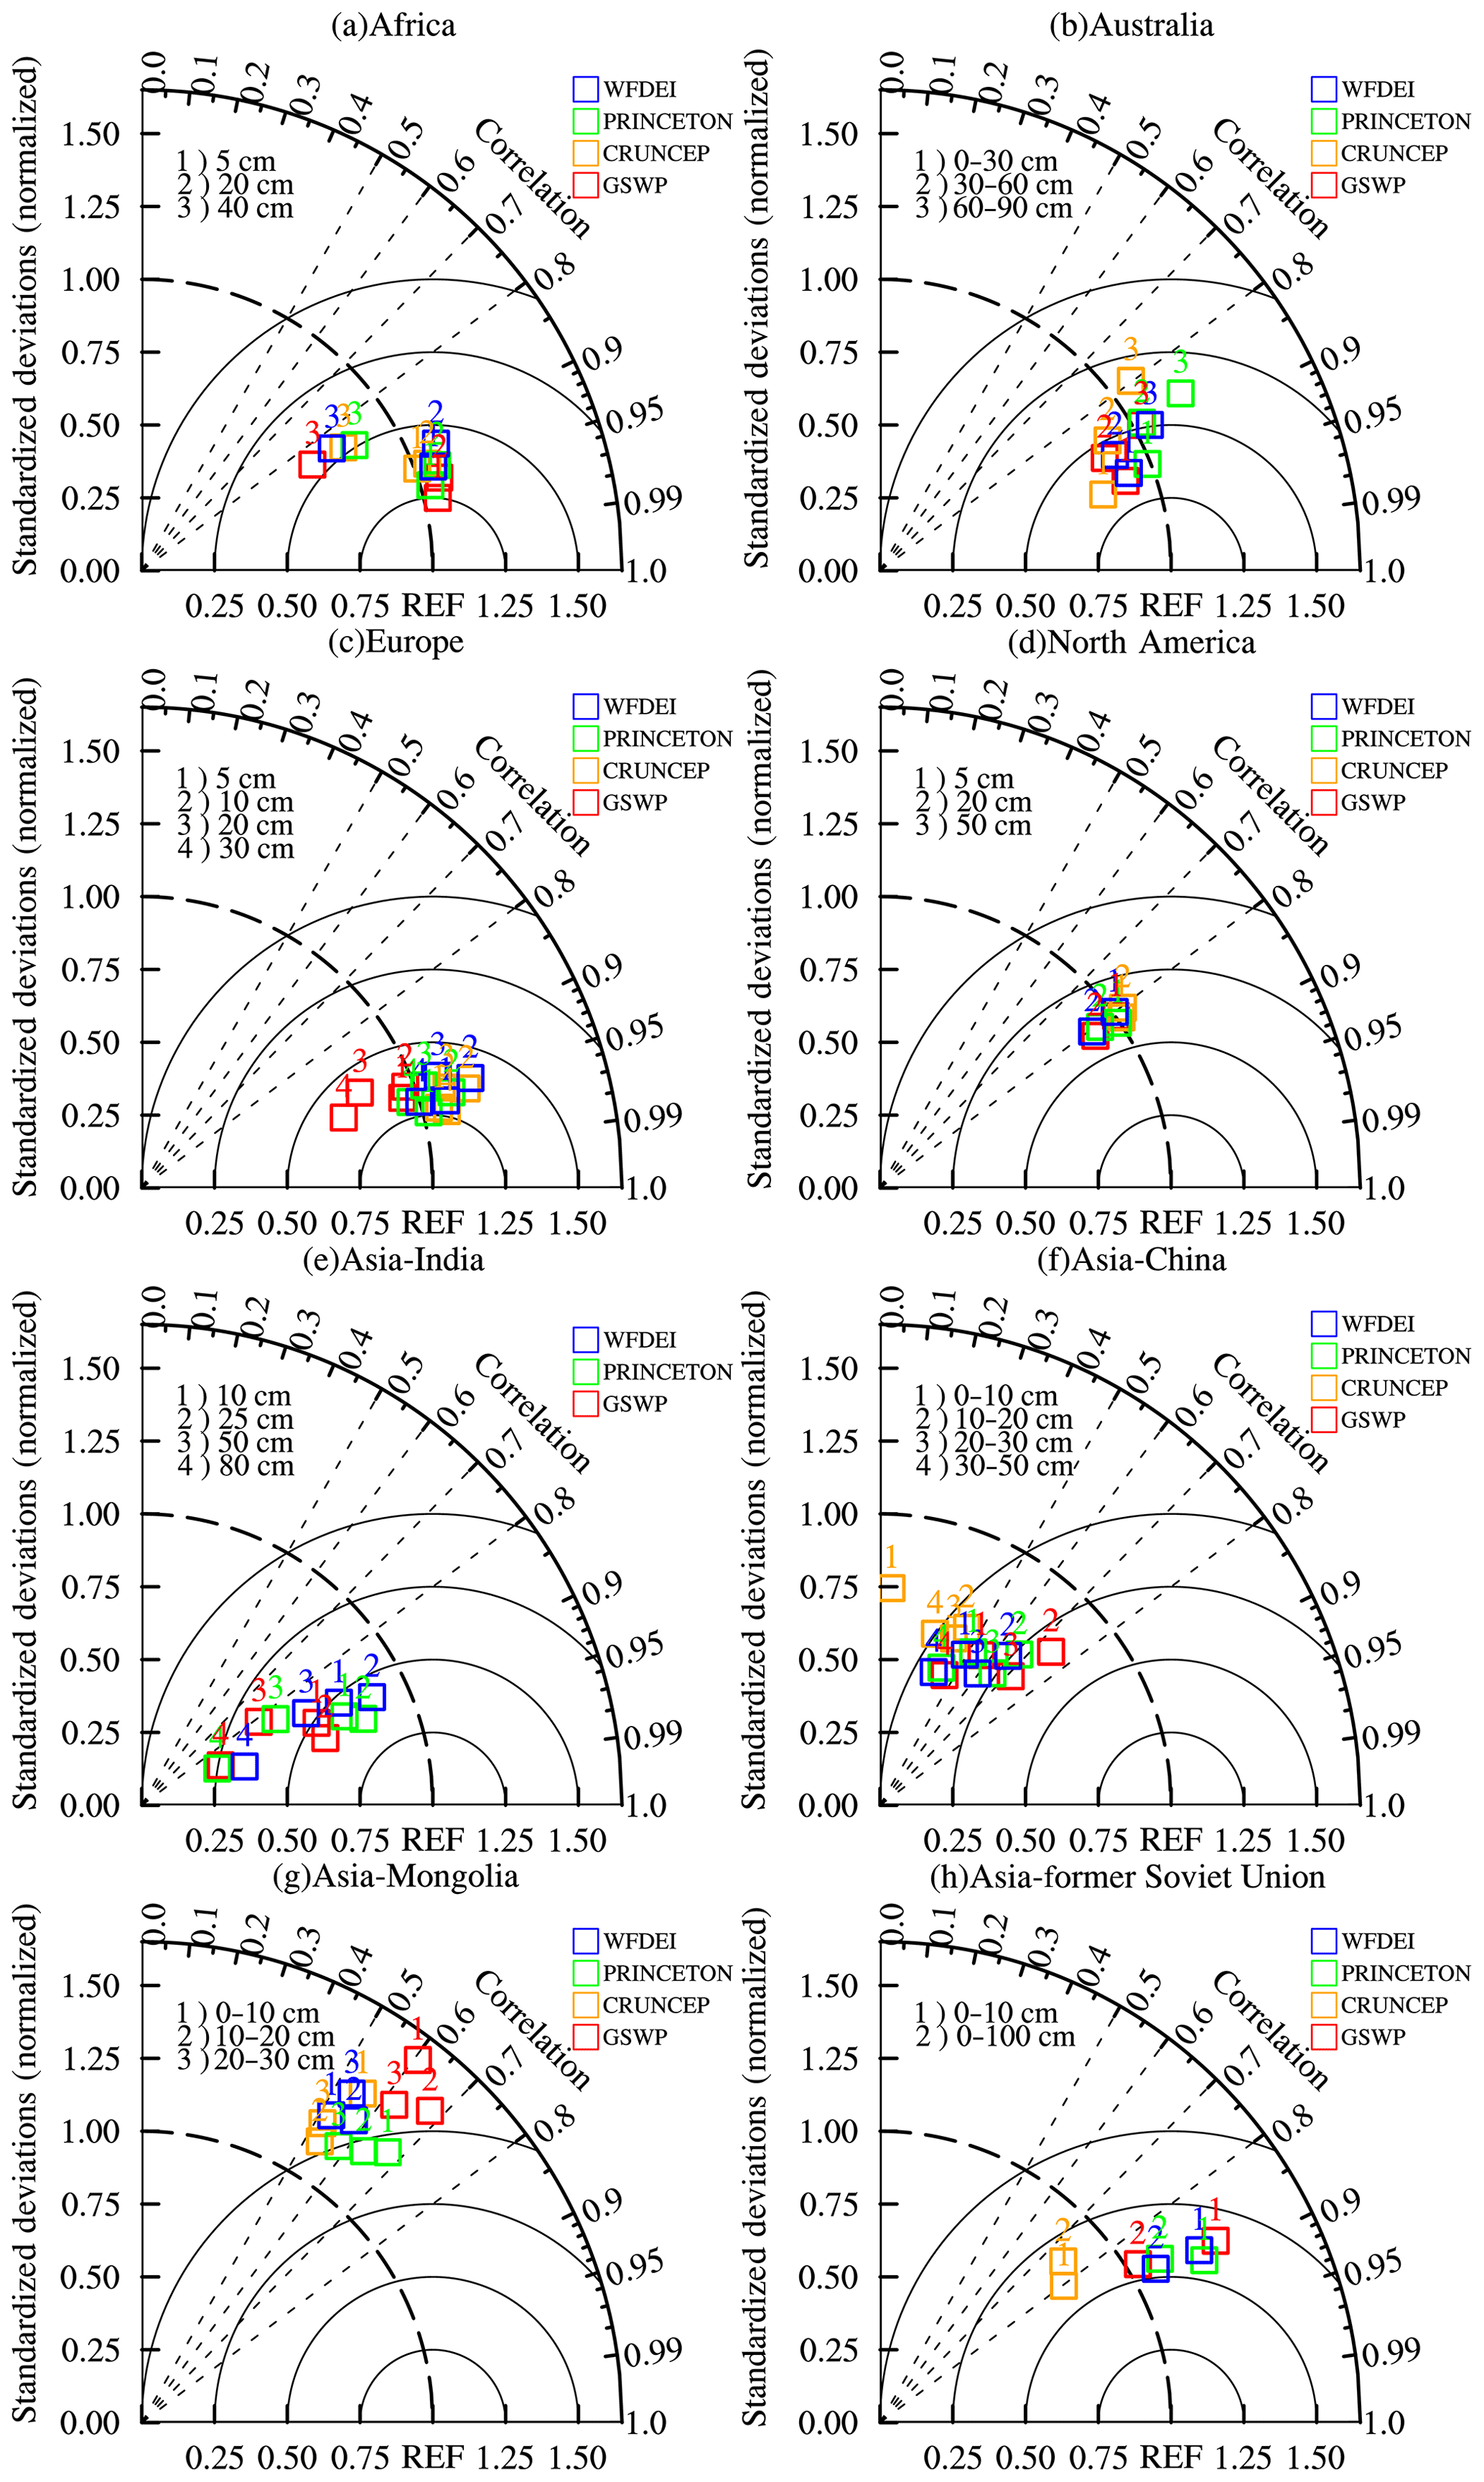
Figure 3Taylor diagrams illustrating the comparisons among GSWP, CRUNCEP, PRINCETON, WFDEI, and in situ observation data.
Three areas (the central USA, North China Plain, and northern India) with severe levels of GW exploitation were used as key areas for validation. Ground observations of soil moisture in the three regions were retrieved from the ISMN. The usable stations were as follows: 7 sites on the North China Plain from 1981 to 1999, 15 sites in Colorado in the central US from 2003 to 2010, and 1 site in Kanpur in northern India from 2011 to 2012. The regional soil moisture from observations and simulations was averaged from all stations and corresponding grid points. Before the comparison, hourly values from all stations were converted into a monthly time series. The soil layer depths in the CAS-LSM did not match those from the ground observations, and the depths of soil moisture observations varied among the three regions. Therefore, we used different methods to match the soil depth of observations to the corresponding soil layer of simulations for the different areas (Table 2).
We evaluated the performance of each forcing dataset over the three regions using Taylor's skill scores, as shown in Fig. 4a–c. As Fig. 4a shows, the individual forcing datasets show a varying ability to capture the soil moisture distribution. In the 0–10 cm soil layer, WFD performed well and had the highest skill scores (S=0.86). Generally, all meteorological forcing datasets performed consistently well for the North China Plain in both the near-surface and deeper soil layers. Performance was also evaluated using a Taylor diagram as shown in Fig. 4d–f. GSWP captured the temporal variability of observed soil moisture with higher correlations than the other datasets. Correlations tended to cluster around 0.7, with the exception of CRUNCEP. Then, the correlations between observations and simulations decreased with soil depth. The radial distance from the origin represents the standard deviation of simulations relative to the standard deviation of observations. CRU-NCEP exhibited much higher () variation than that of the in situ observations.

Figure 4Taylor's skill scores and Taylor diagrams illustrating the comparisons among GSWP, CRUNCEP, PRINCETON, WFDEI, and in situ observations. (a, d) North China Plain; (b, e) Colorado in the central US; (c, f) northern India. The azimuthal angle represents the correlation coefficient, and radial distance is the standard deviation normalized to observations.
In the central US, WFD performed better with a higher skill score, and CRU-NCEP had the lowest score. Correlations between the simulated 5 cm soil moisture and observations (Fig. 4e) were all lower than 0.5. This may be because the offline runs do not consider the strong interaction between the land and atmosphere. All simulations resulted in lower standard deviations than those for observations at 50 cm of soil depth. This indicates that the true variability in soil moisture cannot be well reconstructed in this layer using the four forcing datasets tested herein. Errors were also associated with the varying degrees of mismatch between the soil layers of the observations and the model.
Owing to the limitations of the observational data in Kanpur, only three sets of data were compared in that area. Based on the skill scores, WFD and PRINCETON performed well at both 10 and 25 cm soil depths, and WFD performed better in deeper soil. The results of a correlation analysis indicated that the simulations from three meteorological forcing datasets (GSWP3, PRINCETON, and WFD) were able to capture the variation in soil moisture (Fig. 4f). Notably, the correlation was higher (>0.9 in northern India) when considering the GW extraction, which was not obvious in the other two areas (Fig. 4f). This is because, according to FAO statistics, about 91 % of GW extraction was to supply irrigation in India, whereas 64 % and 38 % of GW extraction was used for agriculture in China and the USA, respectively (Zeng et al., 2016b). Figure 4f shows that the relative standard deviations decreased as soil depth increased, which indicates relatively large errors of fluctuation in the deeper soil layers. Overall, WFDEI provided a better simulation with a higher correlation and a relative standard deviation close to 1.
3.2 Trends in soil moisture
Owing to the uncertainty in meteorological forcing, especially regarding precipitation, which had large differences between different forcing datasets (Table 3), the ensemble average approach was used here. Figure 5 presents the trends in surface soil moisture (0–10 cm), deep soil moisture (200–300 cm), precipitation, temperature, and GW extraction from 1979 to 2010 from the NEW experiment. Globally, results suggested a significant decreasing trend in surface and deep soil moisture ( and mm3 mm−3 yr−1, respectively; p<0.05) over the 32-year period, but the soil moisture trend from PRINCETON was not significant (Table 3). There was a consistent significant warming trend (about 0.016 ∘C yr−1; p<0.05) and a nonsignificant decreasing precipitation trend (p>0.05). Furthermore, the drying of the surface soil moisture slowed when considering the HWR. The global surface soil moisture decreased at a rate of mm3 mm−3 yr−1 without GW extraction. Conversely, the deep soil dried ( mm3 mm−3 yr−1 in CTL) owing to the rapid lowering of the water table following GW extraction, and the hydraulic connection between the soil and aquifer weakened. More specifically, GW extraction slowed the drying of surface soils in drying areas and increased the wetting trend in wetting areas. The trend in 1.3 % of GW extraction areas changed from drying to wetting, with an average GW extraction rate of 171 mm yr−1. The opposite effect was observed in the deeper soil layers.
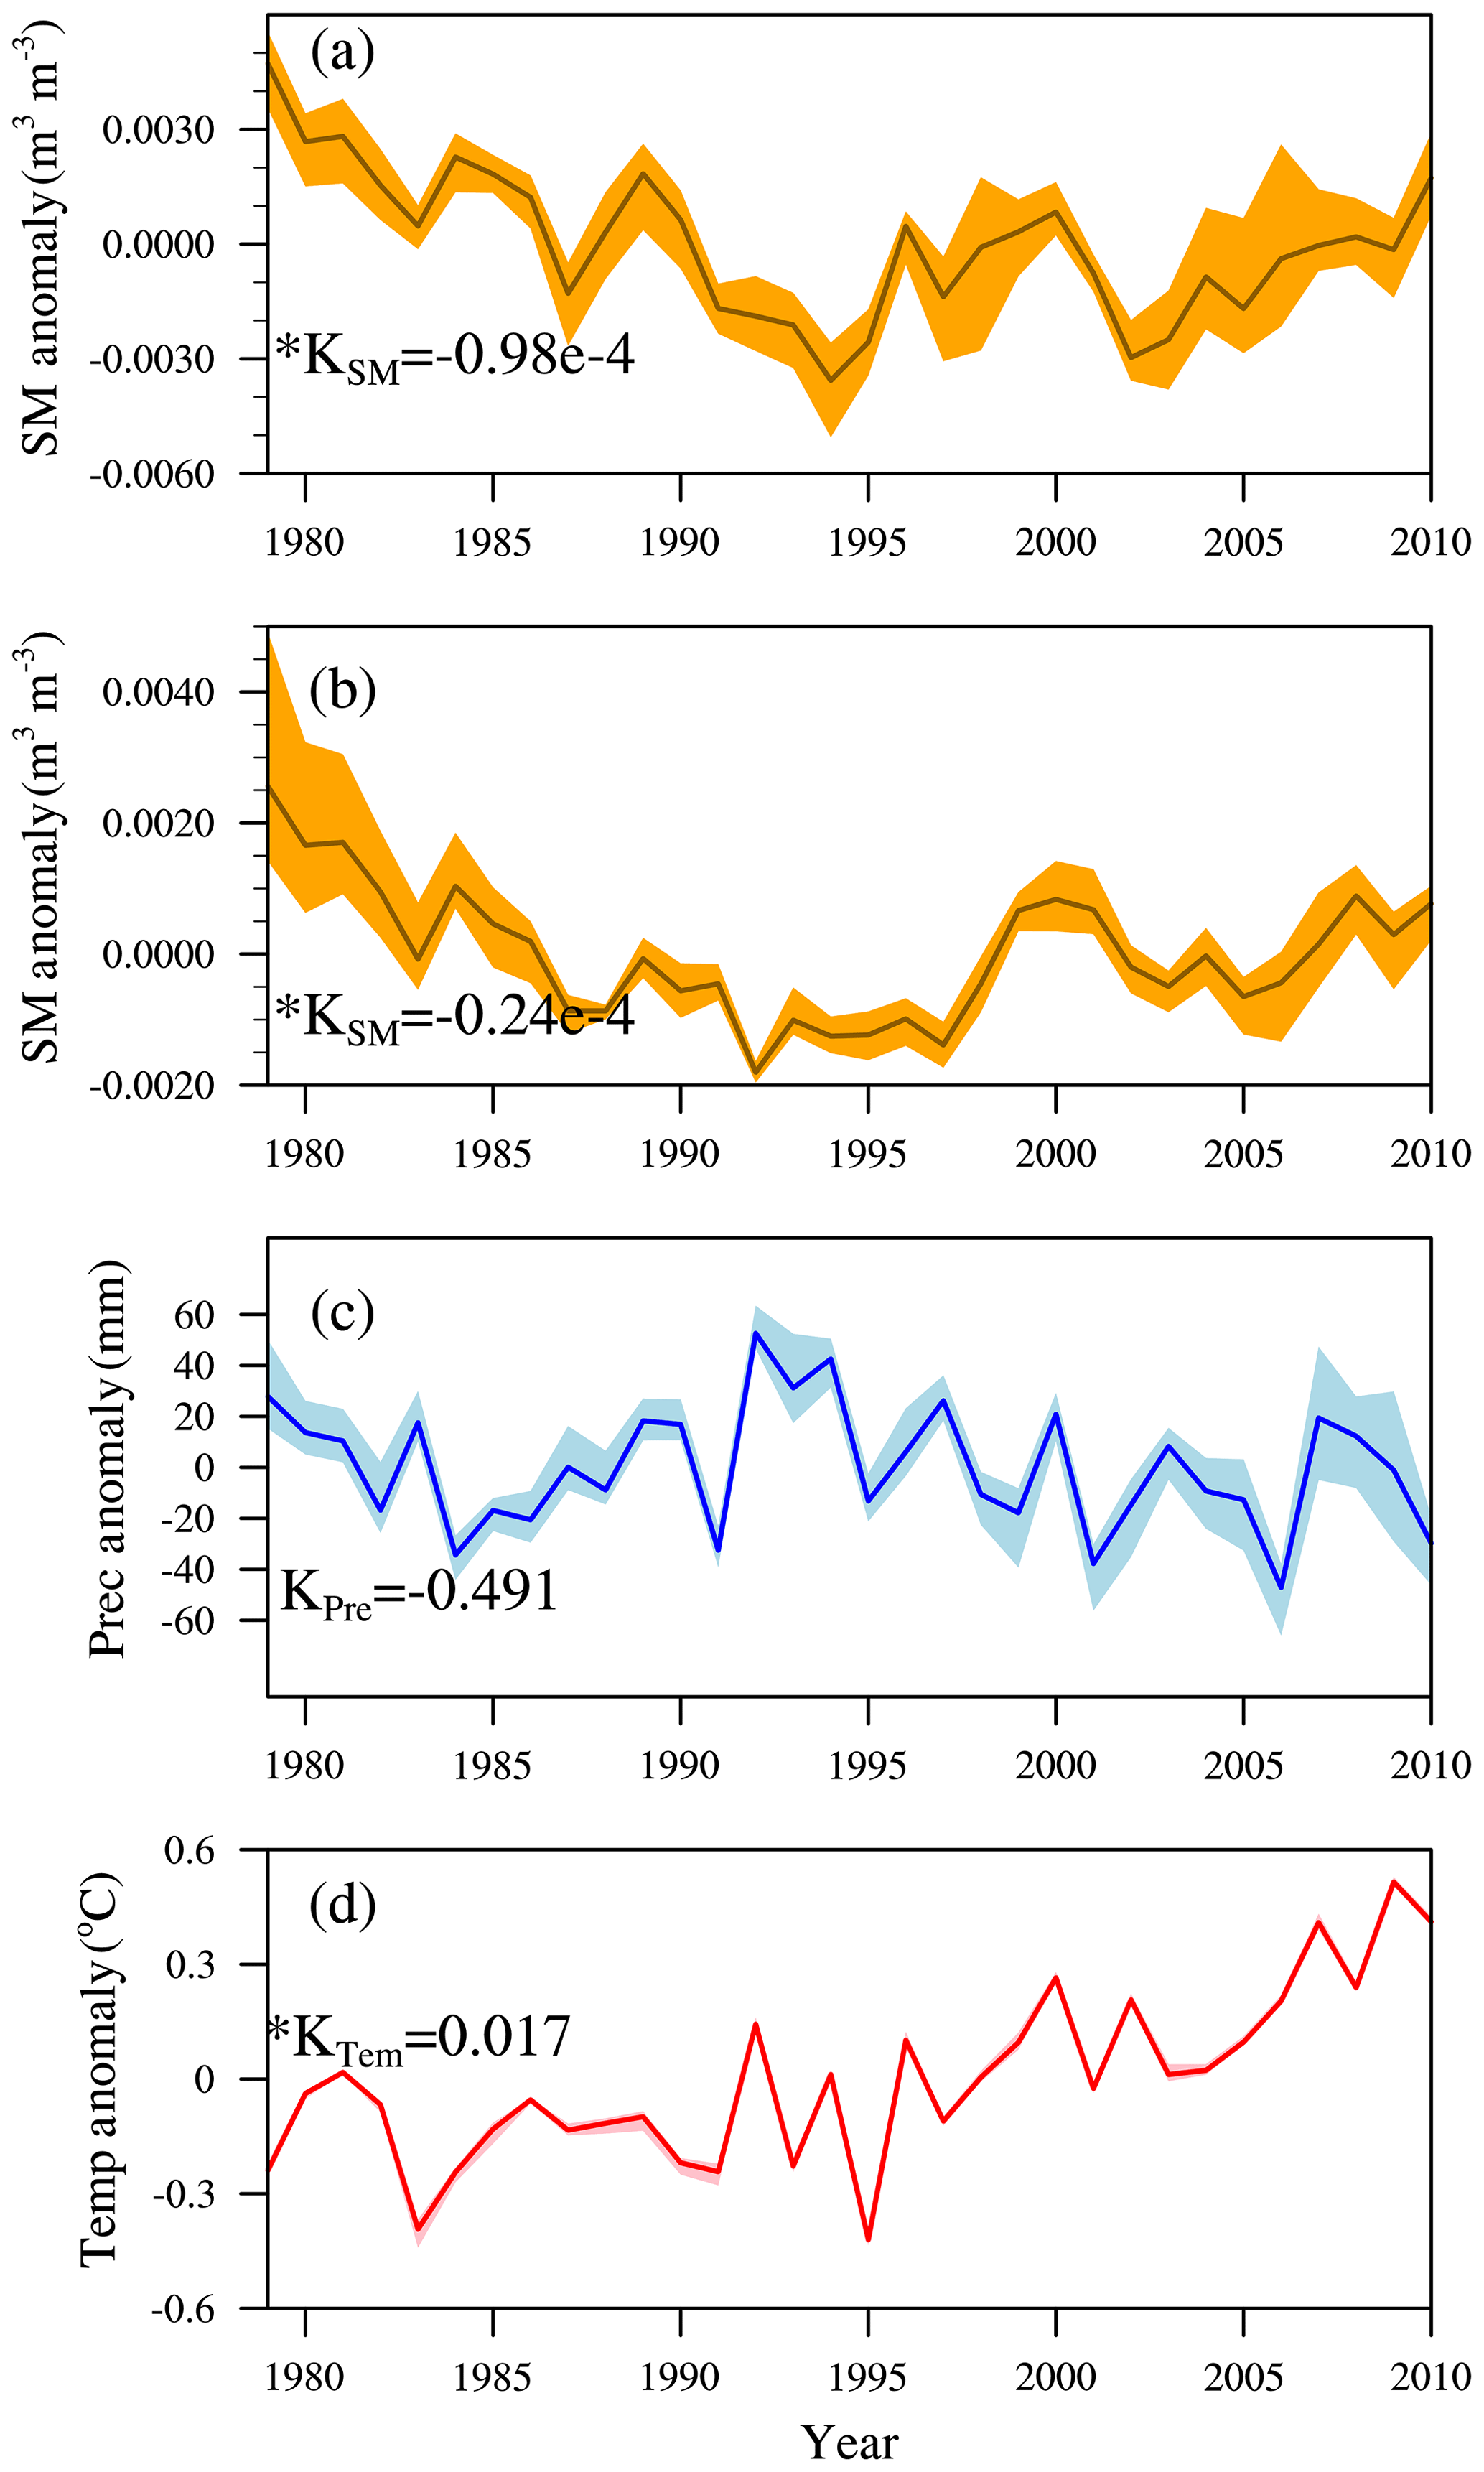
Figure 5Annual mean (a) surface soil moisture, (b) deep soil moisture, (c) precipitation, and (d) temperature averaged globally from 1979 to 2010. * .
Table 3Trends in NEW-simulated surface soil moisture, precipitation, and temperature forcing data. * .

Figure 6 shows the spatial distribution of soil moisture trends from 1979 to 2010 obtained from simulations of surface and deep soil moisture and ESA-CCI. As the depth of the soil increased, the proportion of apparent dryness increased. For the surface soil, the drying trends were mainly found in North Africa, central Asia, the southwestern USA, and southeastern Australia. The wetting trends were primarily in northern South America, northwest Africa, and northeast Asia. This result is consistent with those of previous studies on satellite-based data (Feng, 2015; Dorigo et al., 2012). The trend in the deep soil was consistent with that in the surface layer in most areas, except for central Asia. Regions with a drying trend always coincided with statistically significant increasing temperature. Many of the strong drying trends occurred over regions that already have relatively low soil moisture. Drying trends were the most prominent in the Sahel in northern Africa. This could be explained by deficits in precipitation during the 1970s and 1980s (Hulme, 1992; L'Hôte et al., 2002). The majority of northern Asia exhibited wetting trends with nonsignificant increasing temperature. Wetting trends were found in the central US, India, and the North China Plain, but there were no significant changes.
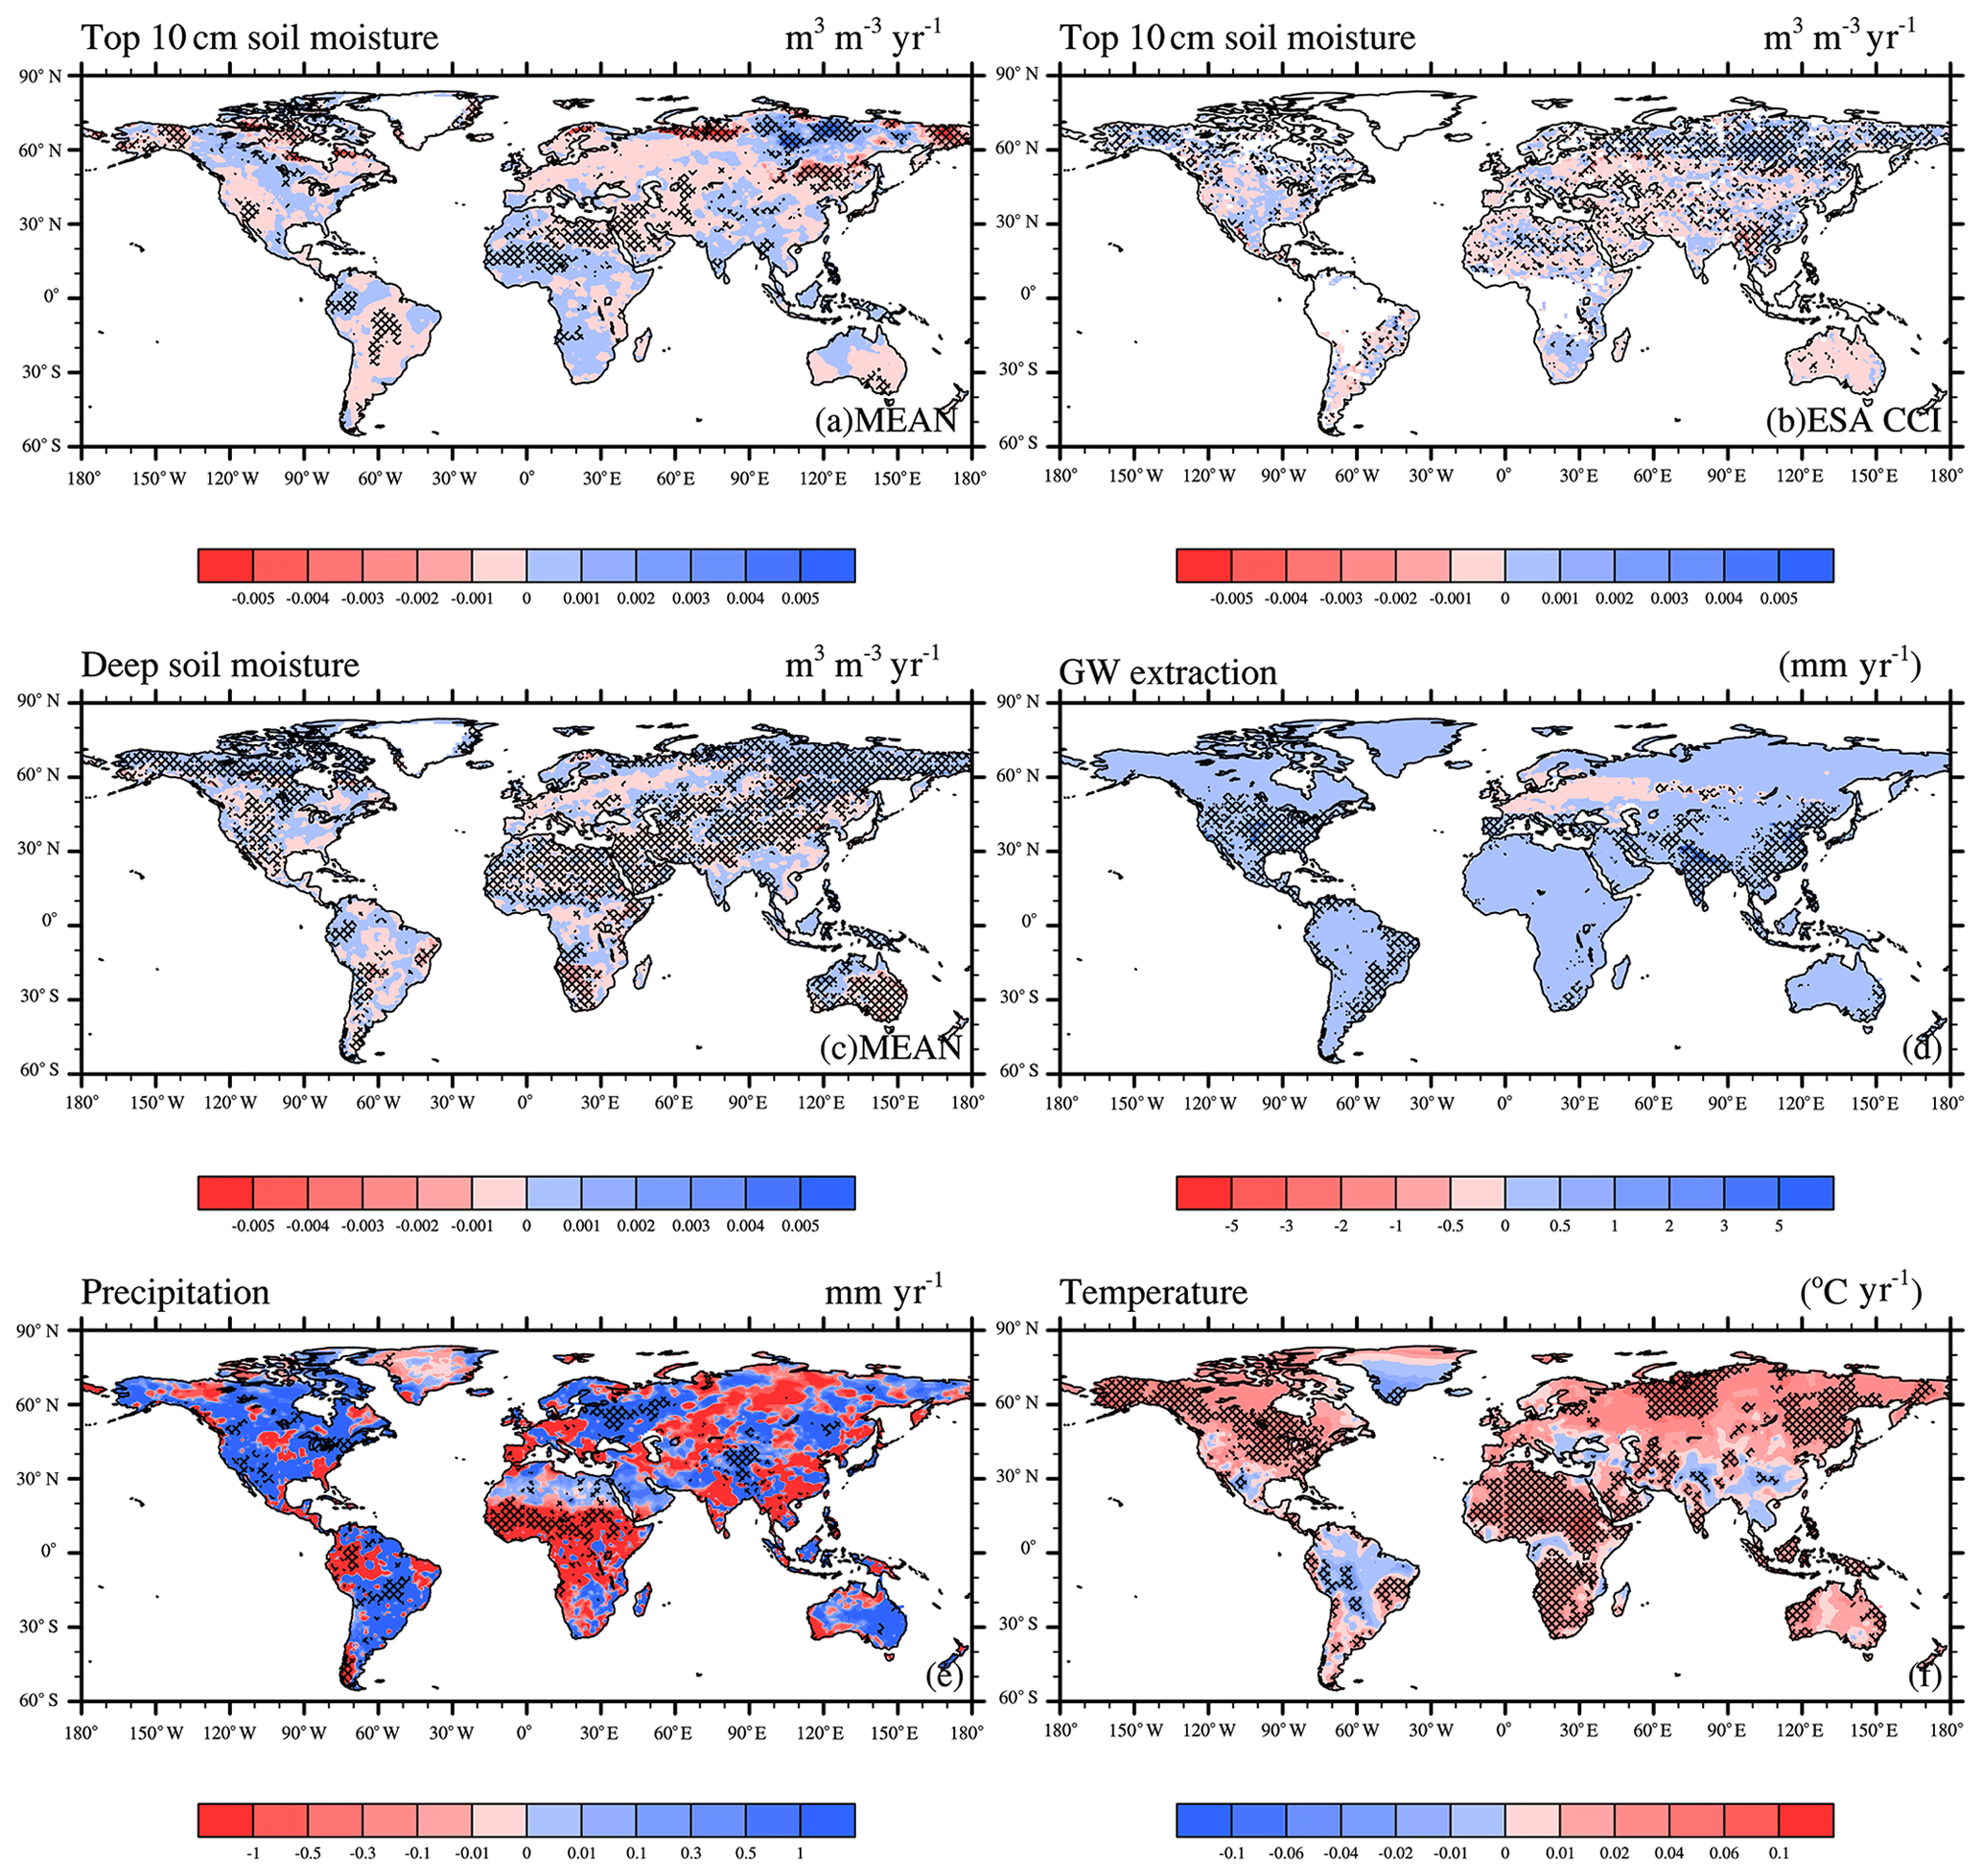
Figure 6The spatial distribution of linear trends for (a) simulated surface soil moisture (m3 m−3 yr−1) and (b) surface soil moisture from ESA-CCI (m3 m−3 yr−1), (c) simulated deep soil moisture (m3 m−3 yr−1), (d) groundwater extraction (mm yr−1), (e) precipitation (mm yr−1), and (f) temperature (∘C yr−1). The shaded areas represent grids with statistically significant trends (p<0.05).
We further evaluated the ratios of drying–wetting trends for surface and deep soil in different climate regions using the Köppen–Geiger climate classification (Kottek et al., 2006). A brief description of the climate classification is as follows. The first letter refers to the climate types: tropical (A), arid (B), temperate (C), and cold (D). The second letter indicates the precipitation conditions: rainforest (f), monsoon (m), and savannah (s) in tropical and desert (W) regions and steppe (S) in arid conditions, dry summers (s), dry winters (w), and without a dry season (f) in temperate and cold climates. The third letter refers to hot (h) and cold (k) in arid and hot summers (a), warm summers (b), cold summers (c), and very cold summers (d) in temperate and cold climates. At the same time, we used the climate regions defined by Feng and Zhang (2015); the first climate letter, labeled “arid”, represents the arid regions, the second letter “f” represents the humid regions, and other regions were classified as transitional regions. As Fig. 7a shows, some arid regions became significantly drier (16.9 %) or wetter (9.8 %), as did some humid regions (9.8 % drier, 9.5 % wetter) and transitional regions (12.8 % drier, 5.4 % wetter). The area of increasing wetness in the Af subregion, which is characterized by tropical rainforests, comprised 22 % of its total area. The Dfd subregion is characterized by areas without a dry season, and 42.6 % of this region rapidly became wetter (about mm3 mm−3 yr−1). Conversely, 21.5 % of the BWh subregion, which is characterized by hot deserts, was drying. In the Ds and Dw subregions, which have a hot summer or winter in a year, 30 %–40 % was drying out with a moisture decrease rate more than mm3 mm−3 yr−1. These results indicate that the drying trends were mainly in arid regions, while the wetting trends were primarily in humid regions. Figure 7b shows that there are proportionally more significant changes in the deeper soil layers. However, the changes are not as great as those in the surface soil. In arid regions (BW and BS subregions), the proportion of apparent drying exceeded 40 %. In humid regions (Cfc, Dfc, and Dfd subregions), 30 %–71 % of the area was significantly wetting. The climatic zone differences in deep soil changes were basically consistent with those in the topsoil, except in the Dwc and Dwd regions.
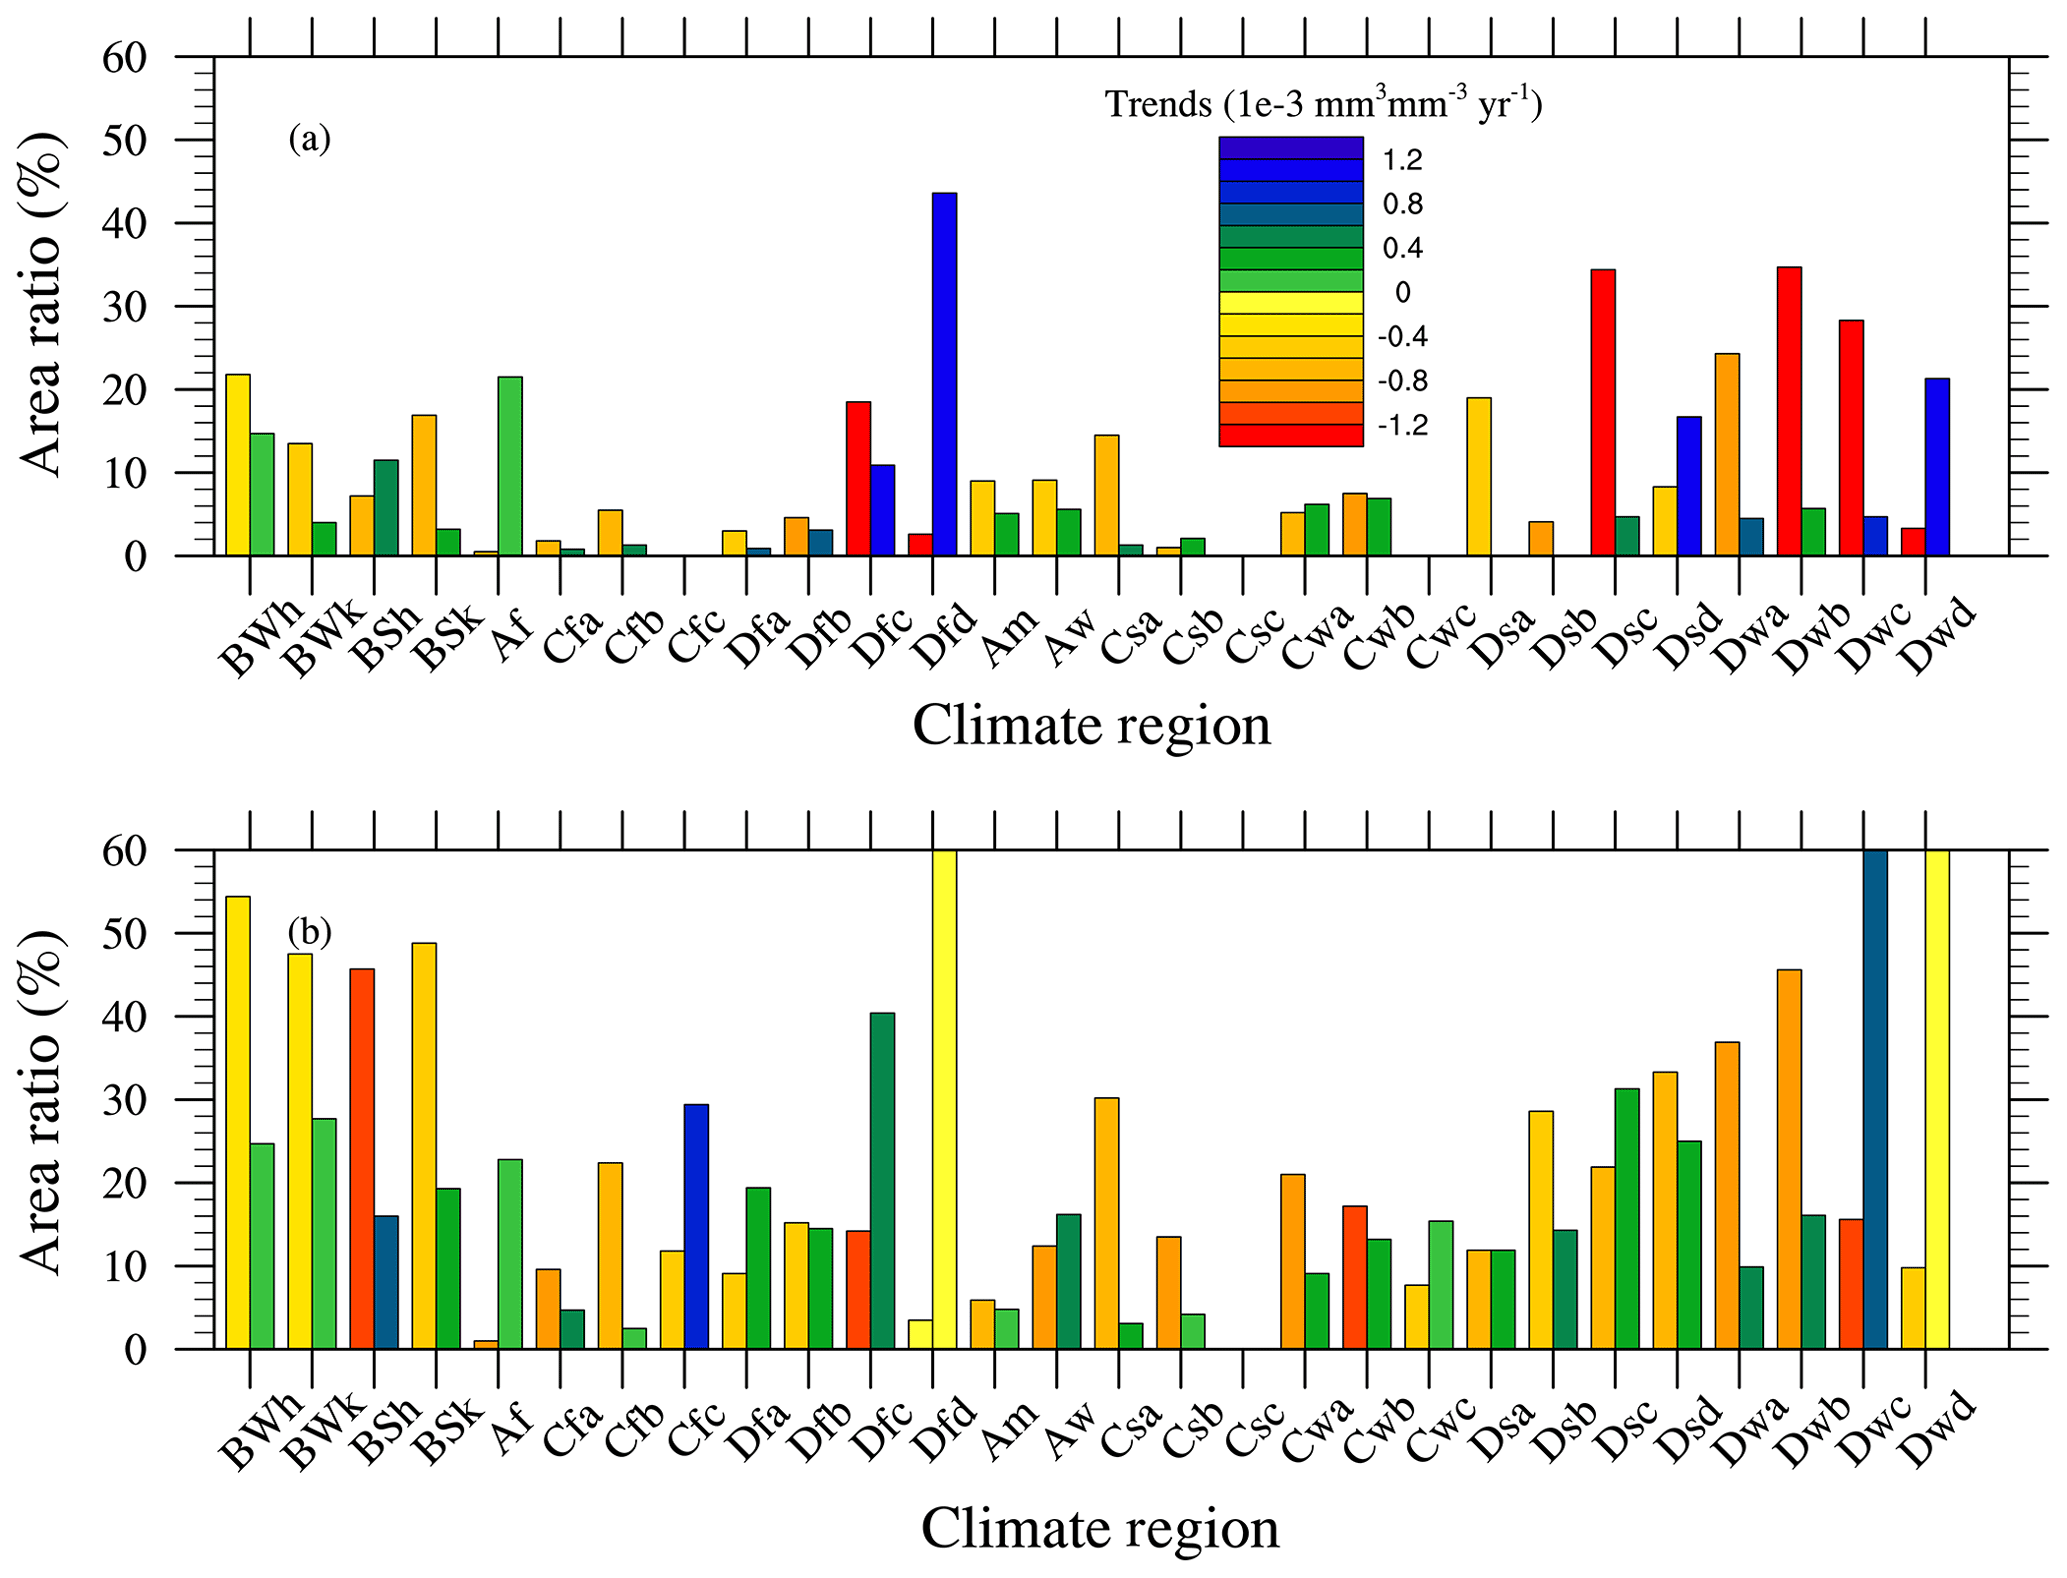
Figure 7Statistics of the soil moisture trends. (a, b) The ratio of surface and deep soil moisture to wet and dry conditions for 28 Köppen–Geiger climate types. For each type, the left bar is the drying ratio and the right bar is the wetting ratio.
3.3 Contribution of climate change and GW extraction to soil moisture trends
The trend in soil moisture was basically consistent with climate change, but the role of GW extraction was not negligible. We quantified the relative contribution of climate and GW intake to the soil moisture trends using the trajectory approach (Eqs. 2 and 3). Results showed that −1.2 % of the significant drying trends in the surface soil originated from GW extraction. Thus, the contribution of climate was 101.2 %. Regarding the wetting trends, the contribution was 9.3 % for GW extraction, with climate contributing 90.7 %. In deep soil, GW extraction contributed 1.37 % and −3.21 % to the drying and wetting trends, respectively. This indicates that GW extraction only weakly contributes to global wetting and drying trends. This is mainly due to the limited regions of GW extraction. The contribution of GW extraction to surface soil moisture trends is presented in Fig. 8a. In the drying regions, GW extraction and climate change accounted for −19.91 % and 119.91 %, respectively. Notably, the negative contribution is because the surface soil moisture is decreasing, while GW extraction slows down the reduction trend (but it is still decreasing): Tgw−Tctl in Eq. (5) is positive, but Tgw is negative. In the wetting regions, the contributions were 11.55 % and 88.45 %, respectively. GW exploitation is mainly used for irrigation to increase moisture in the surface soil, which slows the drying of the surface soil, promoting wetting. Figure 8b shows the contribution of GW extraction in the deeper soil layers. GW extraction positively contributed to the drying trends (109.7 %) and negatively contributed to the wetting trends (−5.48 %). This indirectly reflects the fact that GW exploitation weakens the hydraulic connection between the soil and aquifers. In summary, GW is exploited to provide irrigation, which alleviates water stress in the surface soil, and the deep soil dries due to the loss of hydraulic connection.
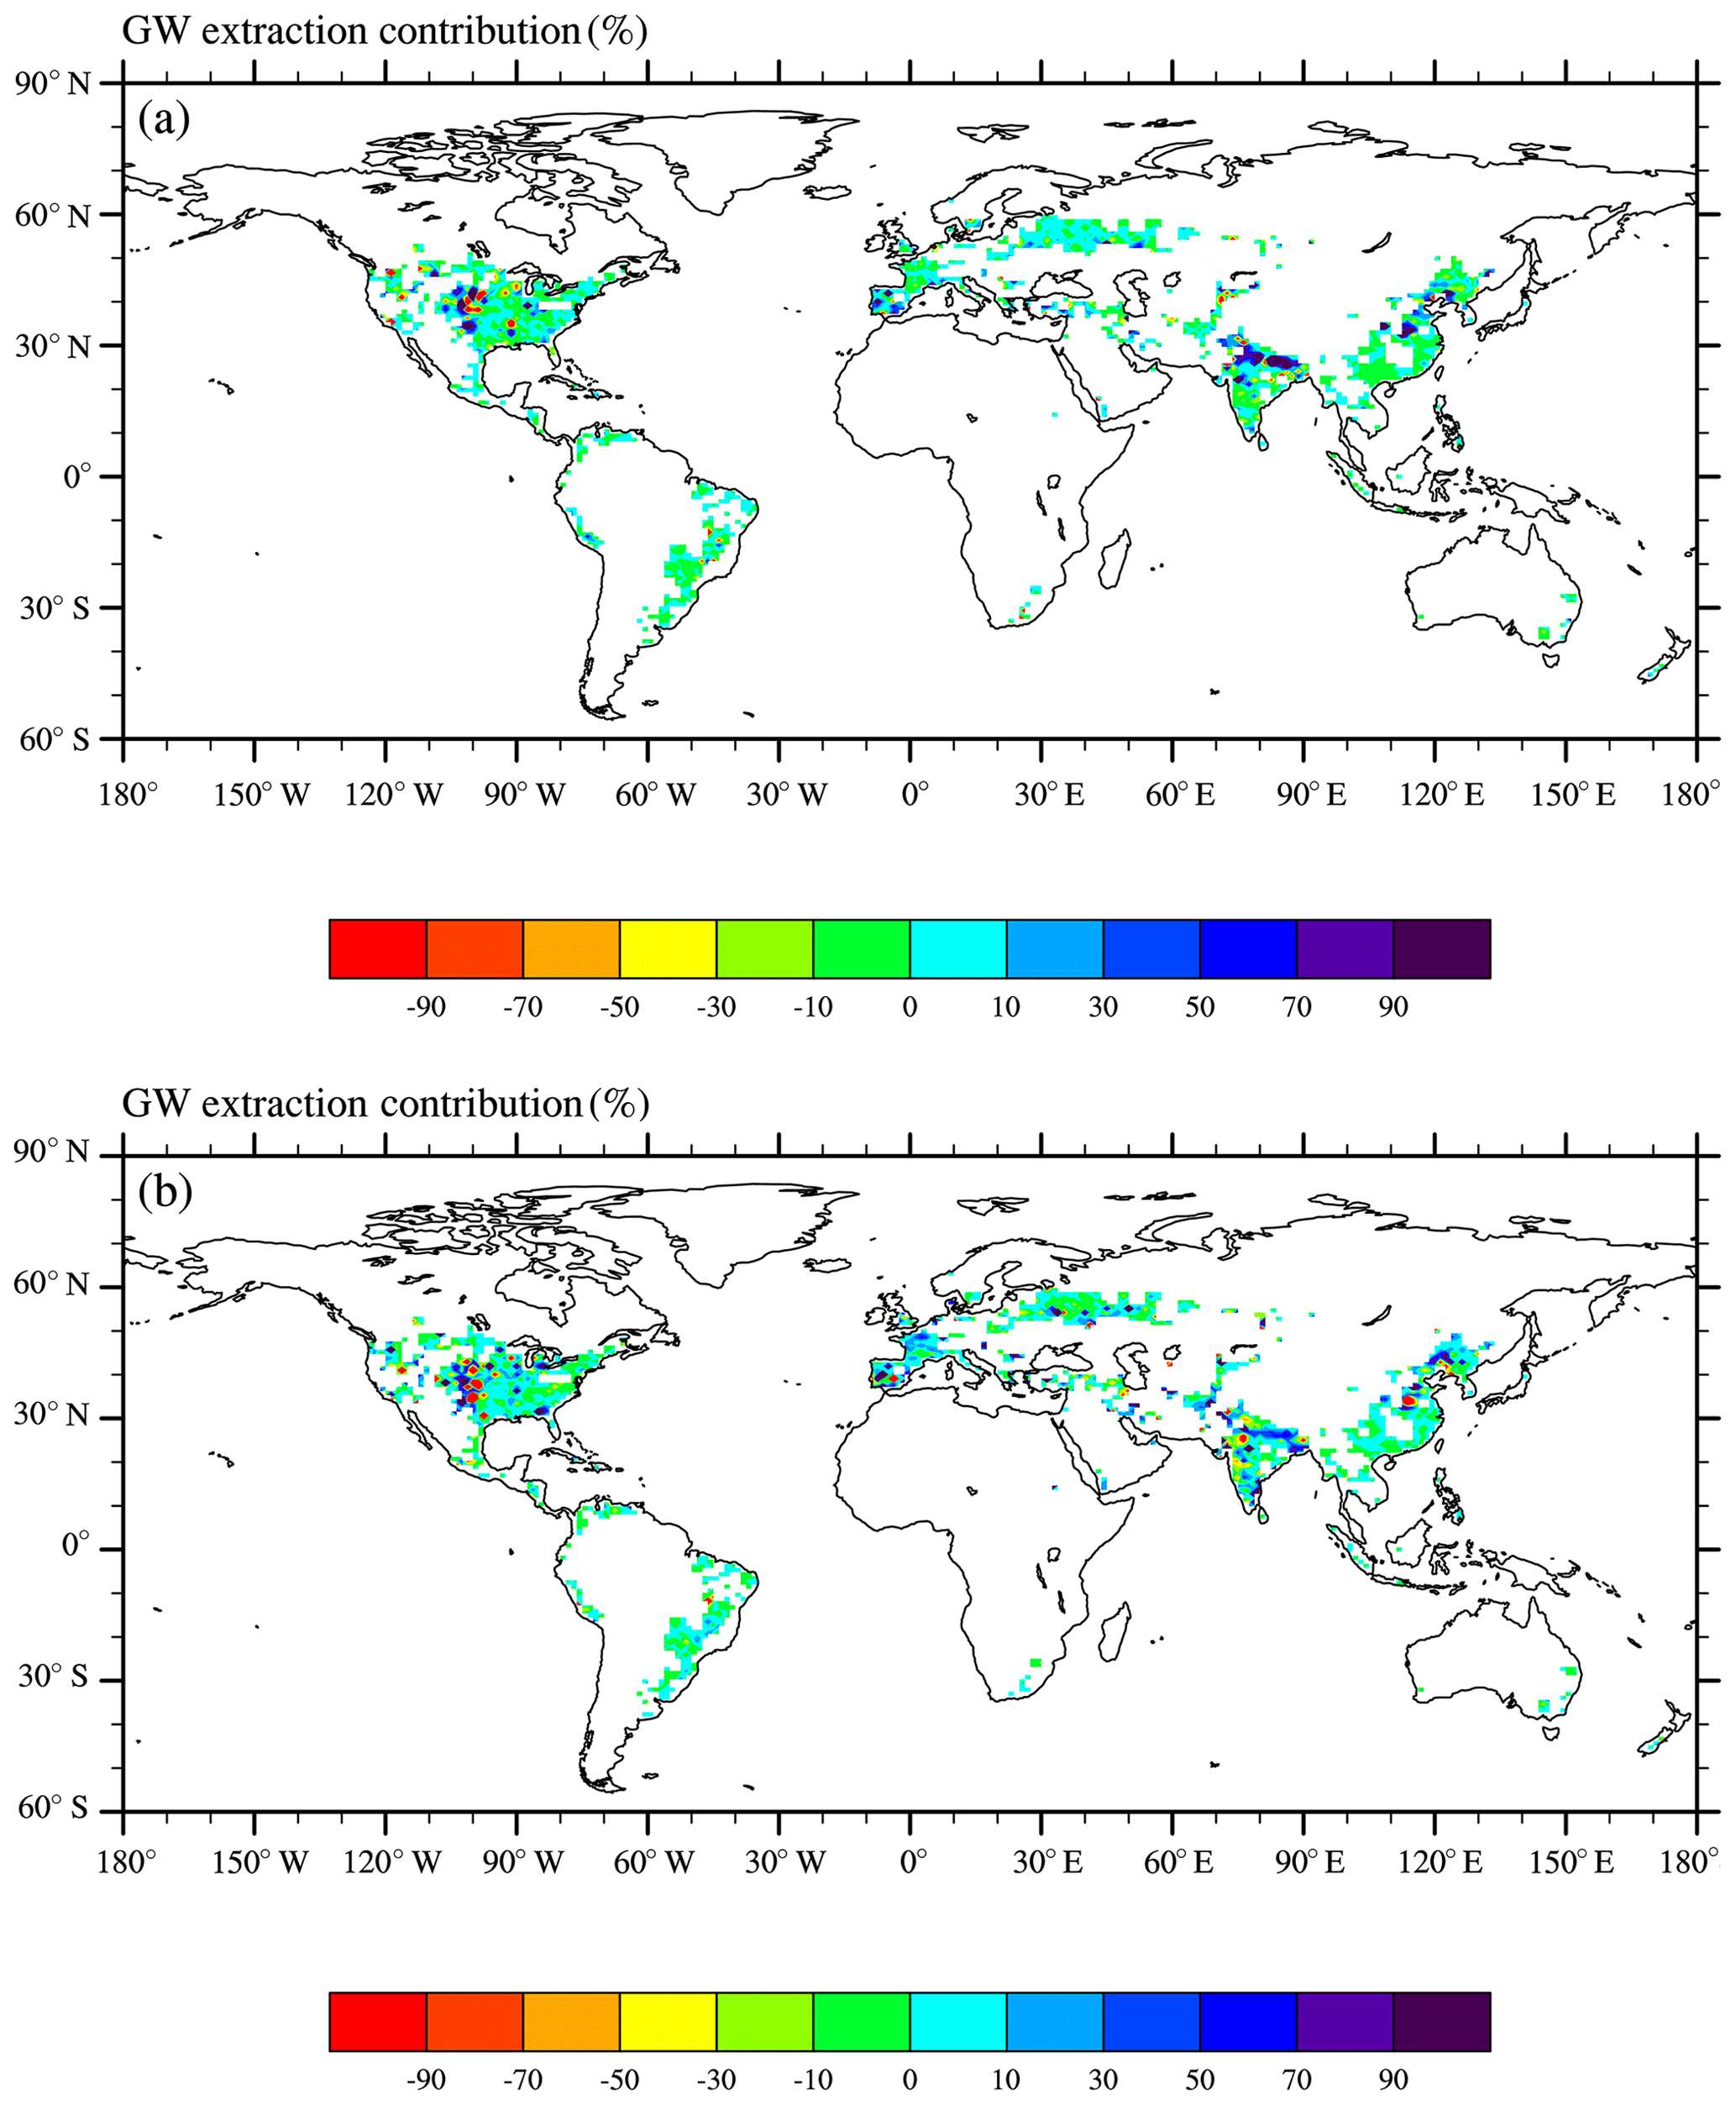
Figure 8The relative contribution of groundwater extraction to (a) surface and (b) deep soil moisture trends (%).
As shown in Fig. 8, the contribution of GW extraction mainly occurs in northern Africa, the North China Plain, and the central US. Thus, the three regions were selected for further evaluation. Figure 9 further shows the relative contributions to soil moisture trends in the three subregions. Contributions of GW extraction to surface soil moisture wetting and drying trends were evident on the North China Plain (drying, up to −62.39 %; wetting, 77.74 %), northern India (drying, up to −13.56 %; wetting, 72.1 %), and the central US (drying, −57.42 %; wetting, 38.51 %). For deep soil, the contribution of GW extraction was as follows: North China Plain (drying, 15.12 %; wetting, −18.16 %), northern India (drying, 56.54 %; wetting, 2.07 %), and the central USA (drying, 23.8 %; wetting, −20 %). GW extraction can increase the water content of the surface soil and thus lead to increased moisture in both humid and arid regions. The results revealed that GW extraction contributes more to the soil moisture trends in typical exploitation areas than in the regions without GW extraction. Climate change dominated the soil moisture trends, while the contribution of GW extraction at the regional scale was much greater than that at the global scale, especially in the areas with GW overexploitation.
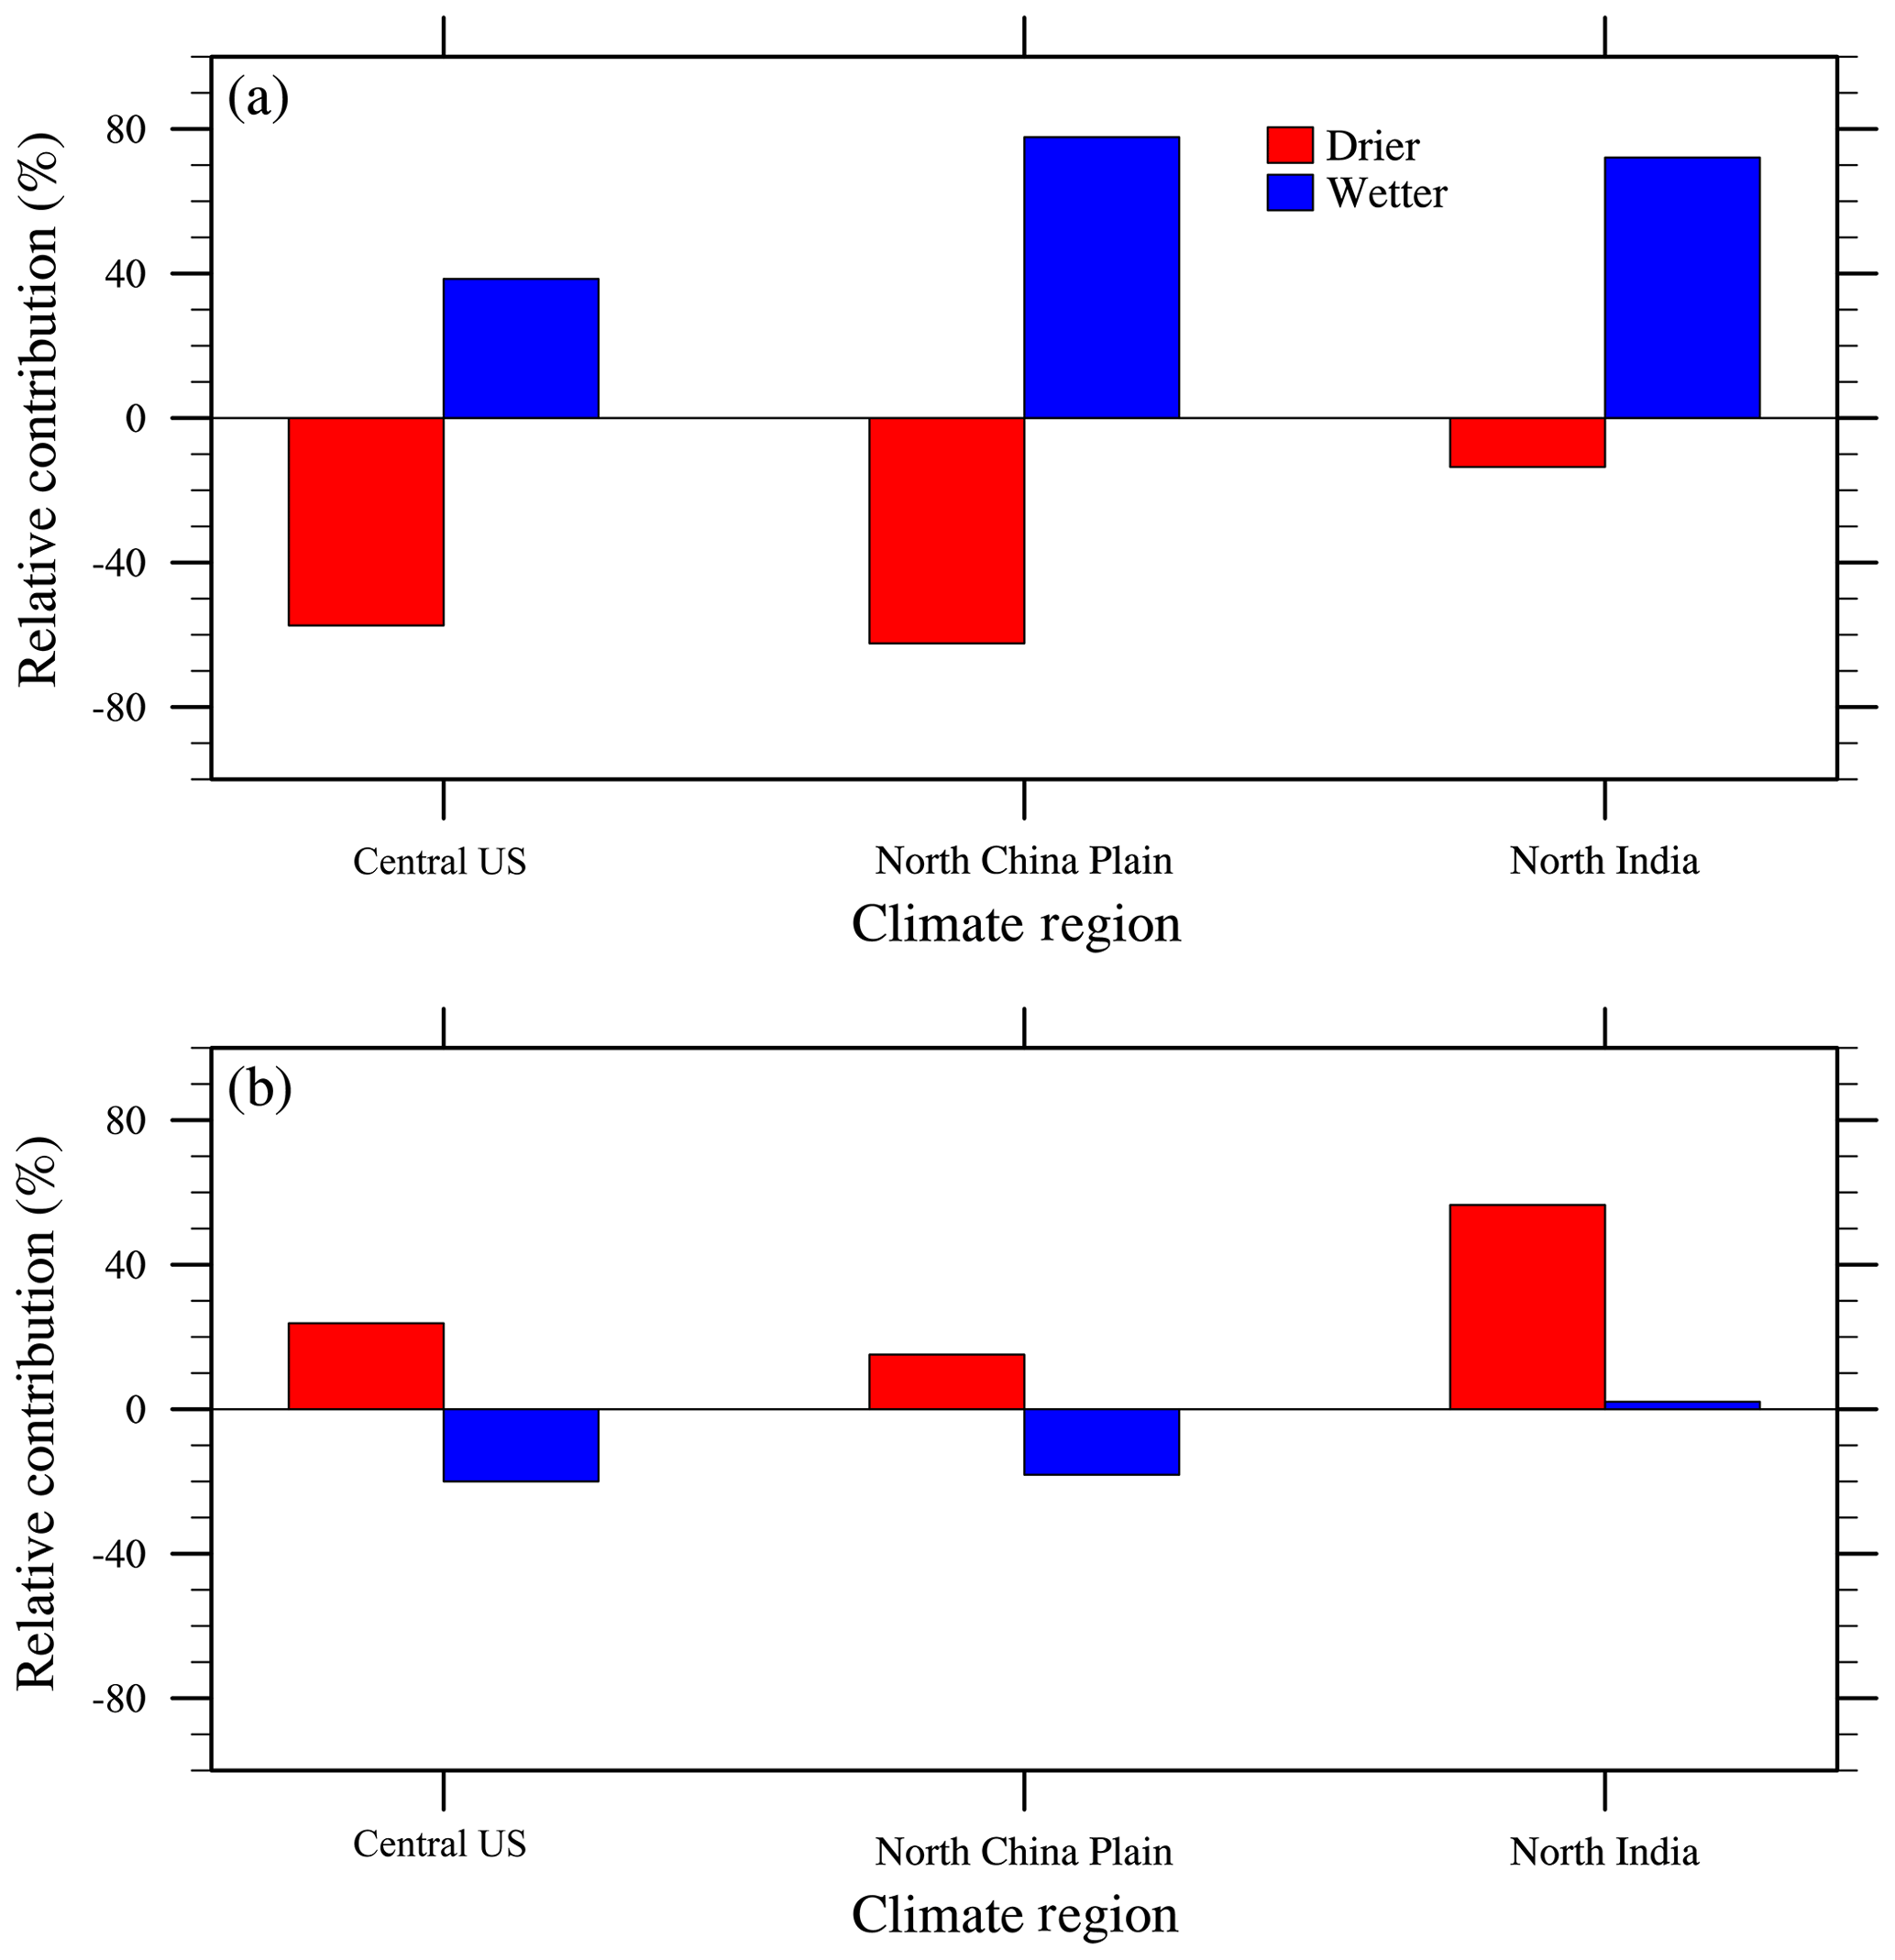
Figure 9The relative contribution of GW extraction to regional (a) surface and (b) deep soil moisture trends (%). North China Plain (34–40∘ N, 110–120∘ E), northern India (23–33∘ N, 68–78∘ E), the central US (33–42∘ N, 97–105∘ W).
In the present study, we quantified the relative contribution of climate and GW extraction to soil moisture trends using an LSM (CAS-LSM) that considers HWR based on four global meteorological forcing datasets. Comparing the simulations, the in situ observational datasets, and the satellite-based ESA-CCI surface products demonstrated that the CAS-LSM is able to reliably represent soil moisture trends.
The main conclusions of this study are as follows. First, all four forcing datasets resulted in similar patterns of surface soil moisture and have higher soil moisture than ESA-CCI. Results at the regional scale (Fig. 4) indicated that the uncertainty of the forcing data affected the simulated soil moisture. Therefore, the ensemble average results were used to reduce the uncertainty caused by the forcing data. Second, our results show a significant decreasing trend in surface and deep soil moisture over the 32-year period investigated. For the surface soil, GW extraction slowed the drying trend in drying areas and increased the wetting trend in wetting areas. This is because GW extraction is mainly used for irrigation as effective water input into the topsoil, while it has the opposite effect on deep soil when the hydrological connection between the aquifer and deep soil was severely weakened due to extraction. Third, climate contributed 101.2 % and 90.7 % to global drying and wetting trends of surface soil moisture, while GW extraction had a relatively weak effect on soil moisture (−1.2 % and 9.3 % for global drying and wetting, respectively). For deep soil, GW extraction contributed 1.37 % and −3.21 % to the drying and wetting trends. This is because there are limited areas that exploit GW. Regionally, GW extraction contributed more in regions with high water demand for irrigation, production, and human consumption. In typical water use areas, including the North China Plain, the central US, and northern India, GW extraction contributed more to the soil moisture trends than in regions with almost no GW extraction. In summary, climate change dominates the soil moisture trends, while GW extraction accelerates or decelerates soil moisture trends under climate change.
Our study demonstrated the effect of GW extraction on soil moisture. Future research should focus on developing strategies to adapt to climate change. At the same time, the effect of GW exploitation on regional soil moisture cannot be ignored. Overexploitation weakens the hydraulic connection between the soil and aquifer, which may affect root growth and development. Furthermore, GW extraction also impacts the atmosphere. Zeng et al. (2016b) found that the cooling caused by GW extraction in northern India weakened the Indian monsoon and its water vapor transport, and precipitation decreased. Therefore, the development and utilization of water resources must consider the local ecological and atmospheric environment.
The mismatch of soil layers between the simulations and observations may affect the evaluation results. Also, our results indicate that it is necessary to consider human activities in LSMs, and improved descriptions of hydrological processes in LSMs are required. For example, GW extraction is assumed to occur in the area in which it is consumed. Moreover, meteorological forcing data can introduce uncertainty for simulation results. The precipitation data used in our study showed significant differences. The WFD precipitation evidently decreased (1.96 mm yr−1), and the GSWP precipitation slightly decreased (0.16 mm yr−1), while for CRU-NCEP and PRINCETON, precipitation slightly increased. Temperature varied similarly for all four forcing datasets (slightly increasing). The ensemble averaging method used in this study is not the optimum choice. However, considering that the purpose of this study was to explore the contribution of GW extraction to soil moisture trends, this simple averaging approach was reasonable. It is necessary to use a more appropriate averaging method to minimize the uncertainty caused by the forcing data in future work.
Future studies should focus on two aspects. First, GW extraction should be improved to reflect realistic levels of water consumption. The GW extraction scheme used in this study is a simple bottom-up representation, and the irrigation demand is the water required to bring the soil moisture to saturation at each time step, which describes an extreme water requirement and significantly overestimates the actual irrigation water demand. Future work will focus on a more realistic definition of irrigation water demand, such as the demand based on the difference between the potential evapotranspiration and available water. Thus, simulations using the improved model would more accurately reflect hydrological effects and enhance water resource management. Second, since only the effect of HWR was discussed in this study, other human activities could also be considered. For instance, the association between soil moisture and land cover change can be evaluated. Changes in land surface cover affect the hydrothermal properties of the surface soil, which further affects soil moisture.
The model code and data are available upon request. Please contact Zhenghui Xie at zxie@lasg.iap.ac.cn.
LW and ZX designed the research; LW performed the simulations, analyzed the data, and drafted the paper with contributions from all authors.
The authors declare that they have no conflict of interest.
The ESA-CCI soil moisture dataset was downloaded from http://www.esa-soilmoisture-cci.org (last access: August 2019); the in situ soil moisture observations were downloaded from http://www.geo.tuwien.ac.at/insitu/data_viewer/ISMN.php (last access: August 2019). We thank Yun Liu and two other anonymous reviewers for the helpful comments that improved the paper.
This research has been supported by the National Natural Science Foundation of China (grant no. 41830967), the National Key R & D Program of China (grant no. 2018YFC1506602), and the Key Research Program of Frontier Sciences, CAS (grant no. QYZDY-SSW-DQC012).
This paper was edited by Yun Liu and reviewed by two anonymous referees.
Albergel, C., Rüdiger, C., Pellarin, T., Calvet, J.-C., Fritz, N., Froissard, F., Suquia, D., Petitpa, A., Piguet, B., and Martin, E.: From near-surface to root-zone soil moisture using an exponential filter: an assessment of the method based on in-situ observations and model simulations, Hydrol. Earth Syst. Sci., 12, 1323–1337, https://doi.org/10.5194/hess-12-1323-2008, 2008.
Albergel, C., de Rosnay, P., Gruhier, C., Muñoz-Sabater, J., Hasenauer, S., Isaksen, L., Kerr, Y., and Wagner, W.: Evaluation of remotely sensed and modelled soil moisture products using global ground-based in-situ observations, Remote Sens. Environ, 118, 215–226, 2012.
Albergel, C., Dorigo, W., Balsamo, G., Muñoz-Sabater, J., De Rosnay, P., and Isaksen, L., Brocca, L., de Jeu, R., and Wagner, W.: Monitoring multi-decadal satellite earth observation of soil moisture products through land surface reanalyses, Remote Sens. Environ, 138, 77–89, 2013.
Berg, A. A., Famiglietti, J. S., Walker, J. P., and Houser, P. R.: Impact of bias correction to reanalysis products on simulations of North American soil moisture and hydrological fluxes, J. Geophys. Res., 108, 4490, https://doi.org/10.1029/2002JD003334, 2003.
Best, M. J., Pryor, M., Clark, D. B., Rooney, G. G., Essery, R. L. H., Ménard, C. B., Edwards, J. M., Hendry, M. A., Porson, A., Gedney, N., Mercado, L. M., Sitch, S., Blyth, E., Boucher, O., Cox, P. M., Grimmond, C. S. B., and Harding, R. J.: The Joint UK Land Environment Simulator (JULES), model description – Part 1: Energy and water fluxes, Geosci. Model Dev., 4, 677–699, https://doi.org/10.5194/gmd-4-677-2011, 2011.
Cai, W., Cowan, T., Briggs, P., and Raupach, M.: Rising temperature depletes soil moisture and exacerbates severe drought conditions across southeast Australia, Geophys. Res. Lett., 36, 272–277, 2009.
Calvet, J. C., Fritz, N., Froissard, F., Suquia, D., Petitpa, A., and Piguet, B.: In-situ soil moisture observations for the CAL/VAL of SMOS: The SMOSMANIA network, in: Proceedings of the IEEE International Geoscience and Remote Sensing Symposium (IGARSS), 23–28 July 2008, Barcelona, Spain, 2008.
Cappelaere, B., Descroix, L., Lebel, T., Boulain, N., Ramier, D., Laurent, J.-P., Favreau, G., Boubkraoui, S., Boucher, M., Moussa, I. B., Chaffard, V., Hiernaux, P., Issoufou, H. B. A., Le Breton, E., Mamadou, I., Nazoumou, Y., Oï, M., Ottlé, C. and Quantin, G.: The AMMA-CATCH experiment in the cultivated Sahelian area of south-west Niger - Investigating water cycle response to a fluctuating climate and changing environment, J. Hydrol., 375, 34–51, 2009.
Cheng, S. J. and Huang, J. P.: Enhanced soil moisture drying in transitional regions under a warming climate, J. Geophys. Res.-Atmos., 121, 2542–2555, 2016.
Coe, M. T. and Foley, J. A.: Human and natural impacts on the water resources of the lake chad basin, J. Geophys. Res.-Atmos., 106, 3349–3356, 2001.
Compo, G. P., Whitaker, J. S., Sardeshmukh, P. D., Matsui, N., Allan, R. J., Yin, X., Gleason, B. E., Vose, R. S., Rutledge, G., Bessemoulin, P., Brönnimann, S., Brunet, M., Crouthamel, R. I., Grant, A. N., Groisman, P. Y., Jones, P. D., Kruk, M. C., Kruger, A. C., Marshall, G. J., Maugeri, M., Mok, H. Y., Nordli, Ø., Ross, T. F., Trigo, R. M., Wang, X. L., Woodruff, S. D., and Worley, S. J.: The Twentieth Century Reanalysis Project, Q. J. Roy. Meteorol. Soc., 137, 1–28, 2011.
Dai, A. G.: Characteristics and trends in various forms of the palmer drought severity index during 1900–2008, J. Geophys. Res.-Atmos., 116, D12115, https://doi.org/10.1029/2010JD015541, 2011.
Dai, A. G.: Increasing drought under global warming in observations and models, Nat. Clim. Change, 3, 52–58, 2013.
de Rosnay, P. D., Gruhier, C., Timouk, F., Baup, F., Mougin, E., and Hiernaux, P., Kergoat, L., and LeDantec, V.: Multi-scale soil moisture measurements at the Gourma meso-scale site in mali, J. Hydrol., 375, 241–252, 2009.
Döll, P., Fiedler, K., and Zhang, J.: Global-scale analysis of river flow alterations due to water withdrawals and reservoirs, Hydrol. Earth Syst. Sci., 13, 2413–2432, https://doi.org/10.5194/hess-13-2413-2009, 2009.
Dorigo, W. A., Wagner, W., Hohensinn, R., Hahn, S., Paulik, C., Xaver, A., Gruber, A., Drusch, M., Mecklenburg, S., van Oevelen, P., Robock, A., and Jackson, T.: The International Soil Moisture Network: a data hosting facility for global in situ soil moisture measurements, Hydrol. Earth Syst. Sci., 15, 1675–1698, https://doi.org/10.5194/hess-15-1675-2011, 2011.
Dorigo, W. A., Jeu, R. D., Chung, D., Parinussa, R., Liu, Y., Wagner, W., and Fernández-Prieto, D.: Evaluating global trends (1988–2010) in harmonized multi-satellite surface soil moisture, Geophys. Res. Lett., 39, 18405, https://doi.org/10.1029/2012GL052988, 2012.
Dorigo, W. A., Xaver, A., Vreugdenhil, M., Gruber, A., Hegyiová, A., Sanchis-Dufau, A. D., Zamojski, D., Cordes, C., Wagner, W., and Drush, M.: Global automated quality control of in-situ soil moisture data from the international soil moisture network, Vadose Zone J., 12, 918–924, 2013.
Douville, H., Ribes, A., Decharme, B., Alkama, R., and Sheffield, J. Anthropogenic influence on multidecadal changes in reconstructed global evapotranspiration, Nat. Clim. Change, 3, 59–62, 2013.
Feng, H. H.: Individual contributions of climate and vegetation change to soil moisture trends across multiple spatial scales, Sci. Rep., 6, 32782, https://doi.org/10.1038/srep32782, 2016.
Feng, H. H. and Liu, Y. B.: Trajectory based detection of forest-change impacts on surface soil moisture at a basin scale [Poyang Lake Basin, China], J. Hydrol., 514, 337–346, 2014.
Feng, H. H. and Zhang, M. Y.: Global land moisture trends: drier in dry and wetter in wet over land, Sci. Rep., 5, 18018, https://doi.org/10.1038/srep18018, 2015.
Guo, Z., Dirmeyer, P., Zeng, Z. H., Gao, X., and Zhao, M.: Evaluation of the Second Global Soil Wetness Project soil moisture simulations: 2. Sensitivity to external meteorological forcing, J. Geophys. Res., 111, D22S03, https://doi.org/10.1029/2006JD007845, 2006.
Haddeland, I., Clark, D. B., Franssen, W., Ludwig, F., Voß, F., Arnell, N. W., Bertrand, N., Best, M., Folwell, S., Gerten, D., Gomes, S., Gosling, S. N., Hagemann, S., Hanasaki, N., Harding, R., Heinke, J., Kabat, P., Koirala, S., Oki, T., Polcher, J., Stacke, T., Viterbo, P., Weedon, G. P., and Yeh, P.: Multimodel Estimate of the Global Terrestrial Water Balance: Setup and First Results, J. Hydrometeorol., 12, 869–884, 2011.
Hulme, M.: Rainfall changes in africa: 1931–1960 to 1961–1990, Int. J. Climatol., 12, 685–699, 1992.
Hurtt, G. C., Chini, L. P., Frolking, S., Betts, R. A., Feddema, J., Fischer, G., Fisk, J. P., Hibbard, K., Houghton, R. A., Janetos, A., Jones, C. D., Kindermann, G., Kinoshita, T., Goldewijk, K. K., Riahi, K., Shevliakova, E., Smith, S., Stehfest, E., Thomson, A., Thornton, P., van Vuuren, D. P., and Wang, Y. P.: Harmonization of land-use scenarios for the period 1500–2100: 600 years of global gridded annual land-use transitions, wood harvest, and resulting secondary lands, Climatic Change, 109, 117–161, 2011.
Jia, B. H., Liu, J. G., Xie, Z. H., and Shi, C. X.: Interannual variations and trends in remotely sensed and modeled soil moisture in China, J. Hydrometeorol., 19, 831–847, 2018.
Kim, H., Watanabe, S., Chang, E.-C., Yoshimura, K., Compo, G. P., Hirabayashi, Y., Famiglietti, J., and Oki, T.: A century-long global surface meteorology for offline terrestrial simulations, in preparation, 2016.
Kottek, M., Grieser, J., Beck, C., Rudolf, B., and Rubel, F.: World Map of the Köppen–Geiger climate classification updated, Meteorol. Z., 15, 259–263, 2006.
Kowalczyk, E. A., Wang, Y. P., Law, R. M., Davies, H. L., McGregor, J. L., and Abramowitz, G.: The CSIRO Atmosphere Biosphere Land Exchange (CABLE) model for use in climate models and as an offline model, CSIRO Marine and Atmospheric Research Paper 013, available at: http://www.cmar.csiro.au/e-print/open/kowalczykea_2006a.pdf (last access: August 2019), 2006.
Lawrence, D. M., Oleson, K. W., Flanner, M. G., Thorton, P. E., Swenson, S. C., Lawrence, P. J., Zeng, X. B., Yand, Z. L., and Levis, S.: Parameterization improvements and functional and structural advances in version 4 of the Community Land Model, J. Adv. Model. Earth Syst., 3, M03001, https://doi.org/10.1029/2011MS000045, 2011.
L'Hôte, Y., Mahé, G., Somé, B., and Triboulet J. P.: Analysis of a sahelian annual rainfall index from 1896 to 2000; the drought continues, Int. Assoc. Scient. Hydrol. Bull., 47, 563–572, 2002.
Li, M., Ma, Z. G., and Niu, G. Y.: Modeling spatial and temporal variations in soil moisture in China, Chin. Sci. Bull., 56, 1809–1820, https://doi.org/10.1007/s11434-011-4493-0, 2011.
Marczewski, W., Slominski, J., Slominska, E., Usowicz, B., Usowicz, J., Romanov, S., Maryskevych, O., Nastula, J., and Zawadzki, J.: Strategies for validating and directions for employing SMOS data, in the Cal-Val project SWEX (3275) for wetlands, Hydrol. Earth Syst. Sci. Discuss., 7, 7007–7057, https://doi.org/10.5194/hessd-7-7007-2010, 2010.
Min, S.-K., Zhang, X. B., Zwiers, F. W., and Hegerl, G. C.: Human contribution to more-intense precipitation extremes, Nature, 470, 378–382, 2011.
Mougin, E., Hiernaux, P., Kergoat, L., Grippa, M., de Rosnay, P., Timouk, F., Le Dantec, V., Demarez, V., Lavenu, F., Arjounin, M., Lebel, T., Soumaguel, N., Ceschia, E., Mougenot, B., Baup, F., Frappart, F., Frison, P. L., Gardelle, J., Gruhier, C., Jarlan, L., Mangiarotti, S., Sanou, B., Tracol, Y., Guichard, F., Trichon, V., Diarra, L., Soumaré, A., Koité, M., Dembélé, F., Lloyd, C., Hanan, N. P., Damesin, C., Delon, C., Serca, D., Galy-Lacaux, C., Seghieri, J., Becerra, S., Dia, H., Gangneron, F., and Mazzega, P.: The AMMA-CATCH Gourma observatory site in Mali: Relating climatic variations to changes in vegetation, surface hydrology, fluxes and natural resources, J. Hydrol., 375, 14–33, 2009.
Oleson, K: Technical description of version 4.5 of the Community Land Model (CLM), NCAR Tech. Note NCAR/TN-503+ STR, NCAR, Boulder, Colorado, 420 pp., 2013.
Omole, D. O.: Sustainable groundwater exploitation in Nigeria, J. Water Resour. Ocean Sci., 2, 9–14, https://doi.org/10.11648/j.wros.20130202.11, 2013.
Pellarin, T., Laurent, J. P., Cappelaere, B., Decharme, B., Descroix, L., and Ramier, D.: Hydrological modelling and associated microwave emission of a semi-arid region in South-western Niger, J. Hydrol., 375, 262–272, 2009.
Robock, A., Vinnikov, K. Y., Srinivasan, G., Entin, J. K., Hollinger, S. E., Speranskaya, N. A., Liu, S. X., and Namkhai, A.: The Global Soil Moisture Data Bank, B. Am. Meteorol. Soci., 81, 1281–1299, 2000.
Robock, A., Mu, M., Vinnikov, K., Trofimova, I. V., and Adamenko T. I.: Forty-five years of observed soil moisture in the Ukraine: No summer desiccation (yet), Geophys. Res. Lett., 32, L03401, https://doi.org/10.1029/2004GL021914, 2005.
Rodell, M., Velicogna, I., and Famiglietti, J. S.: Satellite-based estimates of groundwater depletion in India, Nature, 460, 999–1002, https://doi.org/10.1038/nature08238, 2009.
Siebert, S., Döll, P., Hoogeveen, J., Faures, J.-M., Frenken, K., and Feick, S.: Development and validation of the global map of irrigation areas, Hydrol. Earth Syst. Sci., 9, 535–547, https://doi.org/10.5194/hess-9-535-2005, 2005.
Sen, P. K.: Estimates of the regression coefficient based on Kendall's tau, J. Am. Stat. Assoc., 63, 1379–1389, 1968.
Seneviratne, S., Corti, T., Davin, E., Hirschi, M., Jaeger, E., Lehner, I., Orlowsky, B., and Teuling, A.: Investigating soil moisture–climate interactions in a changing climate: A review, Earth-Sci. Rev., 99, 125–161, 2010.
Sheffield, J. , Goteti, G. , and Wood, E. F.: Development of a 50-year high-resolution global dataset of meteorological forcings for land surface modeling, J. Climate, 19, 3088–3111, 2006.
Smith, A. B., Walker, J. P., Western, A. W., Young, R. I., Ellett, K. M., Pipunic, R. C., Grayson, R. B., Siriwardena, L., Chiew, F. H. B., and Richter, H.: The Murrumbidgee soil moisture monitoring network dataset, Water Resour. Res., 48, 7701, https://doi.org/10.1029/2012WR011976, 2012.
Taylor, K. E.: Summarizing multiple aspects of model performance in a single diagram, J. Geophys. Res., 106, 7183–7192, 2001.
Van Den Hurk, B., Best, M., Dirmeyer, P., Pitman, A., Polcher, J., and Santanello, J.: Acceleration of Land Surface Model Development over a Decade of Glass, B. Am. Meteorol. Soci., 92, 1593–1600, https://doi.org/10.1175/BAMS-D-11-00007.1, 2011.
van den Hurk, B., Kim, H., Krinner, G., Seneviratne, S. I., Derksen, C., Oki, T., Douville, H., Colin, J., Ducharne, A., Cheruy, F., Viovy, N., Puma, M. J., Wada, Y., Li, W., Jia, B., Alessandri, A., Lawrence, D. M., Weedon, G. P., Ellis, R., Hagemann, S., Mao, J., Flanner, M. G., Zampieri, M., Materia, S., Law, R. M., and Sheffield, J.: LS3MIP (v1.0) contribution to CMIP6: the Land Surface, Snow and Soil moisture Model Intercomparison Project – aims, setup and expected outcome, Geosci. Model Dev., 9, 2809–2832, https://doi.org/10.5194/gmd-9-2809-2016, 2016.
Viovy, N. and Ciais, P.: A combined dataset for ecosystem modelling, available at: http://esgf.extra.cea.fr/thredds/catalog/store/p529viov/cruncep/catalog.html (last access: 1 August 2016), 2009.
Wada, Y., van Beek, L. P. H., van Kempen, C. M., Reckman, J. W. T. M., Vasak, S., and Bierkens, M. F. P.: Global depletion of groundwater resources, Geophys. Res. Lett., 37, L20402, https://doi.org/10.1029/2010GL044571, 2010.
Wada, Y., Van Beek, L. P. H., Wanders, N., and Bierkens, M. F. P.: Human water consumption intensifies hydrological drought worldwide, Environ. Res. Lett., 2013, 034036, https://doi.org/10.1088/1748-9326/8/3/034036, 2013.
Wagner, W., Lemoine, G., and Rott, H.: A method for estimating soil moisture from ERS scatterometer and soil data, Remote Sens. Environ, 70, 191–207, 1999.
Wang, A. H. and Zeng, X. B.: Sensitivities of terrestrial water cycle simulations to the variations of precipitation and air temperature in China, J. Geophys. Res.-Atmos., 116, D02107, https://doi.org/10.1029/2010JD014659, 2011.
Weedon, G. P., Balsamo, G., Bellouin, N., Gomes, S., Best, M. J., and Viterbo, P.: The WFDEI meteorological forcing dataset: WATCH Forcing Data methodology applied to ERAInterim reanalysis data, Water Resour. Res., 50, 7505–7514, 2014.
Wei, J., Dirmeyer, P. A., and Guo, Z.: Sensitivities of soil wetness simulation to uncertainties in precipitation and radiation, Geophys. Res. Lett., 35, L15703, https://doi.org/10.1029/2008GL034494, 2008.
Wentz, F. J., Ricciardulli, L., Hilburn, K., and Mears, C.: How Much More Rain Will Global Warming Bring?, Science, 13, 233–235, 2007.
Wisser, D., Fekete, B. M., Vörösmarty, C. J., and Schumann, A. H.: Reconstructing 20th century global hydrography: a contribution to the Global Terrestrial Network-Hydrology (GTN-H), Hydrol. Earth Syst. Sci., 14, 1–24, https://doi.org/10.5194/hess-14-1-2010, 2010.
Wu, B., Zheng, Y., Tian, Y., Yao, Y. Y., Han, F., Liu, J., Zheng, C. M.: Systematic assessment of the uncertainty in integrated surface water–groundwater modeling based on the probabilistic collocation method, Water Resour. Res., 50, 5848–5865, https://doi.org/10.1002/2014WR015366, 2014.
Xie Z. H., Liu S., Zeng Y. Y., Gao J. Q., Qin P. H., Jia, B. H., Xie, J. B., Liu, B., Li, R. C., Wang, Y., and Wang, L. H.: A high-resolution land model with groundwater lateral flow, water use and soil freeze-thaw front dynamics and its applications in an endorheic basin, J. Geophys. Res.-Atmos., 123, 7204–7222, https://doi.org/10.1029/2018JD028369, 2018.
Yin, Z., Ottlé, C., Ciais, P., Guimberteau, M., Wang, X. H., Zhu, D., Maignan, F., Peng, S. S., Piao, S. L., Polcher, J., Zhou, F., Kim, H., and other China-Trend-Stream project members.: Evaluation of ORCHIDEE-MICT-simulated soil moisture over China and impacts of different atmospheric forcing data, Hydrol. Earth Syst. Sci., 22, 5463–5484, https://doi.org/10.5194/hess-22-5463-2018, 2018.
Yu, Y., Xie, Z. H., and Zeng, X. B.: Impacts of modified Richards equation on RegCM4 regional climate modeling over East Asia, J. Geophys. Res.-Atmos., 119, 12642–12659, https://doi.org/10.1002/2014jd021872, 2014.
Zeng, Y. Y., Xie, Z. H., Yu, Y., Liu, S., Wang, L. Y., Zou, J., Qin, P. H., and Jia, B. H.: Effects of anthropogenic water regulation and groundwater lateral flow on land processes, J. Adv. Model. Earth Syst., 8, 1106–1131, 2016a.
Zeng, Y. Y., Xie, Z. H., and Zou, J.: Hydrologic and climatic responses to global anthropogenic groundwater extraction, J. Climate, 30, 71–90, https://doi.org/10.1175/JCLI-D-16-0209.1, 2016b.
Zeng, Y., Xie, Z., and Liu, S.: Seasonal effects of irrigation on land–atmosphere latent heat, sensible heat, and carbon fluxes in semiarid basin, Earth Syst. Dynam., 8, 113–127, https://doi.org/10.5194/esd-8-113-2017, 2017.
Zhan, X., Zheng, W., Fang, L., Liu, J., Hain, C., Yin, J., and Ek, M.: A preliminary assessment of the impact of SMAP soil moisture on numerical weather forecasts from GFS and NUWRF models, IGARSS 2016 – 2016 IEEE International Geoscience and Remote Sensing Symposium, 10–15 July 2016, Beijing, China, 5229–5232, 2016.
Zou, J., Xie, Z. H., Yu, Y., Zhan, C. S., and Sun, Q.: Climatic responses to anthropogenic groundwater exploitation: A case study of the Haihe River Basin, northern China, Clim. Dynam., 42 , 2125–2145, 2014.
Zou, J., Xie, Z. H., Zhan, C. S., Qin, P. H., Sun, Q., Jia, B. H., and Xia, J.: Effects of anthropogenic groundwater exploitation on land surface processes: A case study of the Haihe River Basin, northern China, J. Hydrol., 524, 625–641, https://doi.org/10.1016/j.jhydrol.2015.03.026, 2015.