the Creative Commons Attribution 4.0 License.
the Creative Commons Attribution 4.0 License.
 | 26 Jun 2025
Peat oxic and anoxic controls of Sphagnum decomposition rates in the Holocene Peatland Model decomposition module estimated from litterbag data
Henning Teickner
Edzer Pebesma
Klaus-Holger Knorr
The Holocene Peatland Model (HPM) is a widely applied model for understanding and predicting long-term peat accumulation, but it is difficult to test due to its complexity, measurement errors, and lack of data. Instead of testing the complete model, tests of individual modules may avoid some of these problems. In particular, the HPM decomposition module can be tested with litterbag data, but no such test has been conducted yet.
Here, we estimate parameter values of the HPM decomposition module from available Sphagnum litterbag experiments included in the Peatland Decomposition Database and with a litterbag decomposition model that considers initial leaching losses. Using either these estimates or the standard parameter values, we test whether the HPM decomposition module fits decomposition rates (k0) in Sphagnum litterbag experiments along a gradient from oxic to anoxic conditions.
Both litterbag data and model versions where HPM decomposition module parameters were estimated suggest a less steep gradient of decomposition rates from oxic to anoxic conditions and larger anaerobic decomposition rates for several species than the standard parameter values. This discrepancy may be caused by ignoring the effects of water table fluctuations on aerobic and anaerobic decomposition rates. Moreover, our analysis suggests that maximum possible decomposition rates of individual species (k0,i) vary more than suggested by the standard parameter values of the HPM plant functional types. Based on previous sensitivity analyses of the HPM, the estimated differences from the standard parameter values can cause differences in predicted 5000-year carbon (C) accumulation up to 100 kg m−2.
The HPM decomposition module with standard parameter values fits k0 estimated from Sphagnum litterbag data, but model versions where HPM decomposition module parameters were estimated and differ significantly have an equivalent fit. The reason why models with different parameter values have equivalent fit is that errors in remaining masses and the design of available litterbag experiments support a range of initial leaching loss and k0 estimates. Consequently, applications of the HPM and any other peatland model should consider that a broad range of decomposition module parameter values is compatible with available litterbag experiments.
Improved litterbag experiments are needed for more accurate tests of any peatland decomposition module and for obtaining parameter estimates accurate enough to allow even only approximate predictions of long-term peat accumulation. The modeling approach used here can be combined with different data sources (for example, measured degree of saturation) and decomposition modules. In light of the large differences in long-term peat accumulation suggested by the parameter estimates, we conclude that it is worth conducting such experiments, not only to improve the decomposition module of the HPM, but also to improve peatland models in general.
- Article
(3267 KB) - Full-text XML
-
Supplement
(9476 KB) - BibTeX
- EndNote


Decomposition is one of the major controls of how much carbon (C) peatlands can store. Compared to other ecosystems, northern peatlands usually have small decomposition rates because of cold temperatures, high water table levels, acidic pH value, and litter that does not decompose quickly because of chemical and physical litter properties (van Breemen, 1995; Rydin et al., 2013). These slow decomposition rates caused northern peatlands to accumulate at least 400 Gt C (Yu, 2012; Nichols and Peteet, 2019) during the Holocene, but changes in the controls of decomposition rates may cause them to lose considerable amounts of C to the atmosphere under climate and land use changes (Frolking et al., 2011; Loisel et al., 2017).
Peatland models are used to better understand past C accumulation and to predict future changes in peat C stocks, but, because of the long timescales which have to be considered, they are difficult to test. Past studies have compared site-adapted simulations of peat height, age, C and nitrogen (N) stocks, macrofossil composition, and water table level predicted by peatland models against peat core data (e.g., Frolking et al., 2010; Tuittila et al., 2013; Treat et al., 2021; Zhao et al., 2022) and have shown that existing peatland models can reproduce observed patterns to some extent. However, these tests suffer from two problems. Firstly, they cannot reliably identify the parameter values or model equations that cause discrepancies between model predictions and measurements because they test entire peatland models against observed data. Secondly, there often are large uncertainties both in the model being tested and in the data used to test the model; peatland models have large uncertainties in parameter values and model structure, and these may produce a range of predictions as illustrated by uncertainty analyses (e.g., Quillet et al., 2013b, a) and model intercomparisons (e.g., Zhao et al., 2022). Observed data also have uncertainty from measurements, peat dating, or simply missing data, for example, for past precipitation. Large uncertainties can make tests inconclusive, no matter how much data we use. As a consequence, there remains large and often not quantified uncertainty about parameter values that control decomposition rates.
An alternative that avoids some of these problems is to test only some part of a model while taking into account relevant uncertainty sources. Estimating values and errors of parameters that directly control decomposition rates could be used to test the decomposition module of a peatland model. For example, in the Holocene Peatland Model (HPM) (Frolking et al., 2010), we only need to know the litter species, the peat degree of saturation, the depth of the litter below the peat surface, the water table depth (WTD), and only five parameters to predict decomposition rates. Decomposition rates can also be estimated from litterbag experiments, where a known initial mass of litter is filled into mesh bags, incubated in peat, excavated after some time, and re-weighed to estimate the mass loss due to decomposition. Therefore, predicted decomposition rates can be compared to decomposition rates estimated from litterbag experiments, and the replicability of any identified discrepancies can be directly tested in future litterbag studies. Admittedly, such a test is restricted to the time ranges covered by available litterbag experiments and is therefore not representative for long-term decomposition rates which may differ from those of fresh litter (e.g., Frolking et al., 2001), but future tests with different scopes and applications of the model will benefit from the reduced parameter uncertainties and can consider where the model already fails on short timescales.
A test of decomposition modules is relevant because of the importance of decomposition for long-term C accumulation in peatlands. Previous sensitivity analyses of the HPM and applications to peat cores suggest that relatively small changes to the anoxia scale length (c2), the parameter controlling how anaerobic decomposition rates are limited by electron acceptor depletion and accumulation of decomposition products, can result in a doubling of accumulated C, depending on climate conditions (Frolking et al., 2010; Quillet et al., 2013b; Kurnianto et al., 2015). These sensitivity analyses used assumed parameter ranges that are not informed by litterbag experiments. A test of only the HPM decomposition module can provide better estimates for c2 and may therefore help to reduce uncertainties in predicted C accumulation rates.
Currently, litterbag experiments are not as extensively used for testing peatland models as they could be, and only a fraction of the information available from litterbag experiments is used to develop models. The HPM derives initial decomposition rates of moss plant functional types from litterbag data, but parameters for environmental controls of decomposition are assumptions which appear to be informed qualitatively at most by litterbag experiments, and it is not tested whether the HPM decomposition module successfully fits available litterbag data (Frolking et al., 2010). This is also the case for other dynamic peatland models, e.g., Frolking et al. (2001), Bauer (2004), Heijmans et al. (2008), Heinemeyer et al. (2010), Morris et al. (2012), Chaudhary et al. (2018), and Bona et al. (2020).
One reason why such tests have been difficult is that suitable litterbag raw data to test peatland models are scarce. Bona et al. (2018) developed a peatland productivity and decomposition parameter database, but it only contains data from studies older than 2010 and no error estimates for remaining masses in litterbag data. Since decomposition rates were estimated with different litterbag decomposition models in previous studies, their values are not directly comparable. Moreover, initial leaching losses (losses of soluble compounds, which do not originate from microbial depolymerization, due to leaching during the first days to weeks of incubation) can bias decomposition rate estimates if they are not explicitly considered and can vary between species and experiments (Yu et al., 2001; Teickner et al., 2025a). Therefore, raw data (remaining masses) are necessary for any meaningful test of decomposition modules with litterbag data. The recently published Peatland Decomposition Database (Teickner and Knorr, 2024) contains raw data from available Sphagnum litterbag experiments and therefore allows us to estimate parameters with any mass-loss-based decomposition model and therefore also allows us to consider initial leaching losses.
Even though tests of only a part of a model are less uncertain than tests of whole models, there still is a risk that they are dominated by uncertainties. Remaining masses in litterbag experiments are often very variable, even under controlled environmental conditions (e.g., Bengtsson et al., 2018), and, for many litterbag experiments, a range of decomposition rates may produce similar predictions for remaining masses (e.g., Yu et al., 2001), also if a litterbag decomposition model compatible with the HPM, i.e., which uses Eq. (7) in Frolking et al. (2010) to describe decomposition mass losses, is used (Teickner et al., 2025a). Finally, only five model parameters, as in the case of the HPM decomposition module, can make predictions uncertain. These uncertainties have to be taken into account to check whether litterbag data are compatible with the peatland model. A possible way to do this is to combine the HPM decomposition module, a litterbag decomposition model compatible with this module, and available litterbag experiments into one model and use Bayesian data analysis (Gelman et al., 2014) to estimate uncertainties of data and parameters.
If such a test suggests that decomposition rates predicted by the HPM decomposition module do not fit estimates from litterbag experiments, or only if parameter estimates of the decomposition module differ from the parameter values originally suggested, even if main uncertainty sources are considered, the test has identified a discrepancy worth considering in more detail. We can then analyze whether previous sensitivity analyses of the HPM suggest that these discrepancies may have large effects on the predicted C accumulation, and, if this is the case, the discrepancies are worth testing in future litterbag experiments.
Our aim is to test the HPM decomposition module against decomposition rates estimated from available Sphagnum litterbag experiments. Specifically, we want to
-
test whether the HPM decomposition module can predict litterbag decomposition rates for different Sphagnum species along the gradient from oxic to anoxic conditions;
-
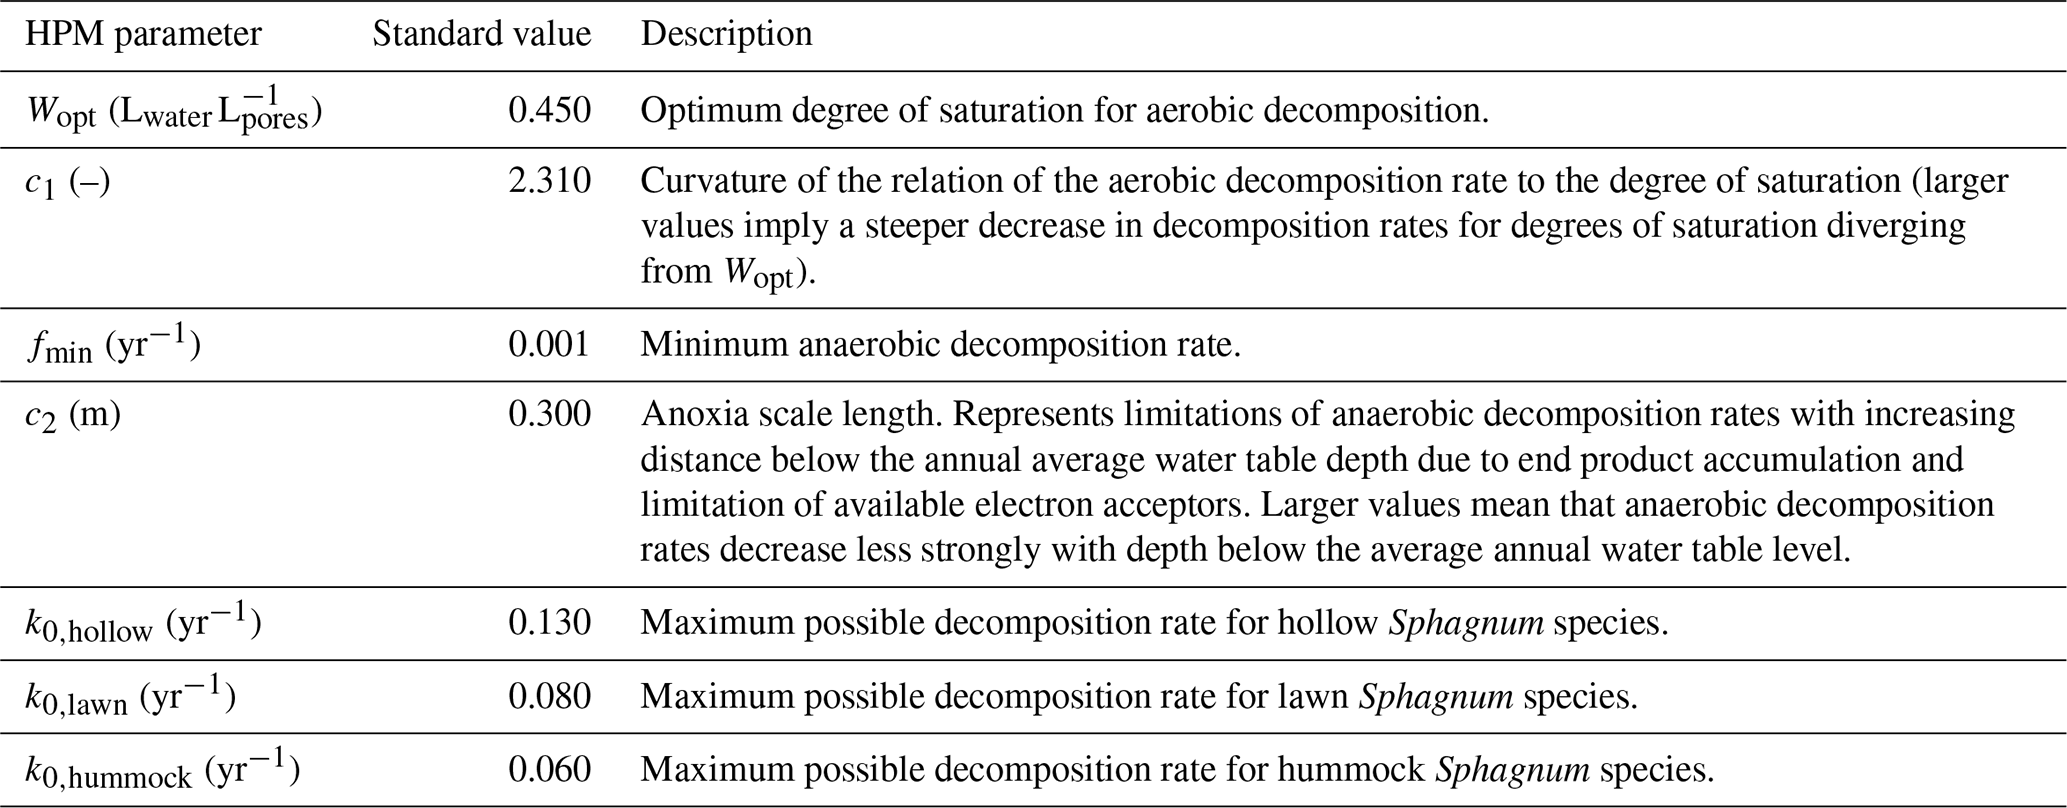
estimate HPM decomposition module parameters from litterbag data and compare them to the originally suggested values (standard parameter values) (Frolking et al., 2010) that are often used when applying the HPM (Table 1);
-
identify possible causes for differences of litterbag-estimated parameter values from standard parameter values to provide guidance for future litterbag experiments;
-
analyze whether estimated differences in HPM parameter values could imply significant differences in decomposition rates and long-term peat accumulation.
Table 1Standard values of parameters of the decomposition module in the Holocene Peatland Model (Frolking et al., 2010).
To address these aims, we used the HPM decomposition module to predict decomposition rates in available litterbag experiments and compared these to decomposition rates estimated for the same litterbag experiments with a litterbag decomposition model that considers initial leaching losses (Teickner et al., 2025a) (Fig. 1). These predictions require the peat degree of saturation, which we estimate with the modified Granberg model (Granberg et al., 1999; Kettridge and Baird, 2007) from water table depth data reported in the litterbag studies. Furthermore, some Sphagnum litterbag experiments do not report water table depths and therefore cannot be used to test the HPM, but they still provide information on initial leaching losses and decomposition rates and therefore help to constrain parameter estimates. We therefore include these data via Bayesian hierarchical modeling in the litterbag decomposition model. In summary, our approach combines the HPM decomposition module, the modified Granberg model, and a Sphagnum litterbag decomposition model, allowing us to consider initial leaching losses and to pool information across litterbag experiments (Teickner et al., 2025a). While this approach has its limitations, it exploits available data as far as possible while considering known confounders and propagating relevant uncertainties.
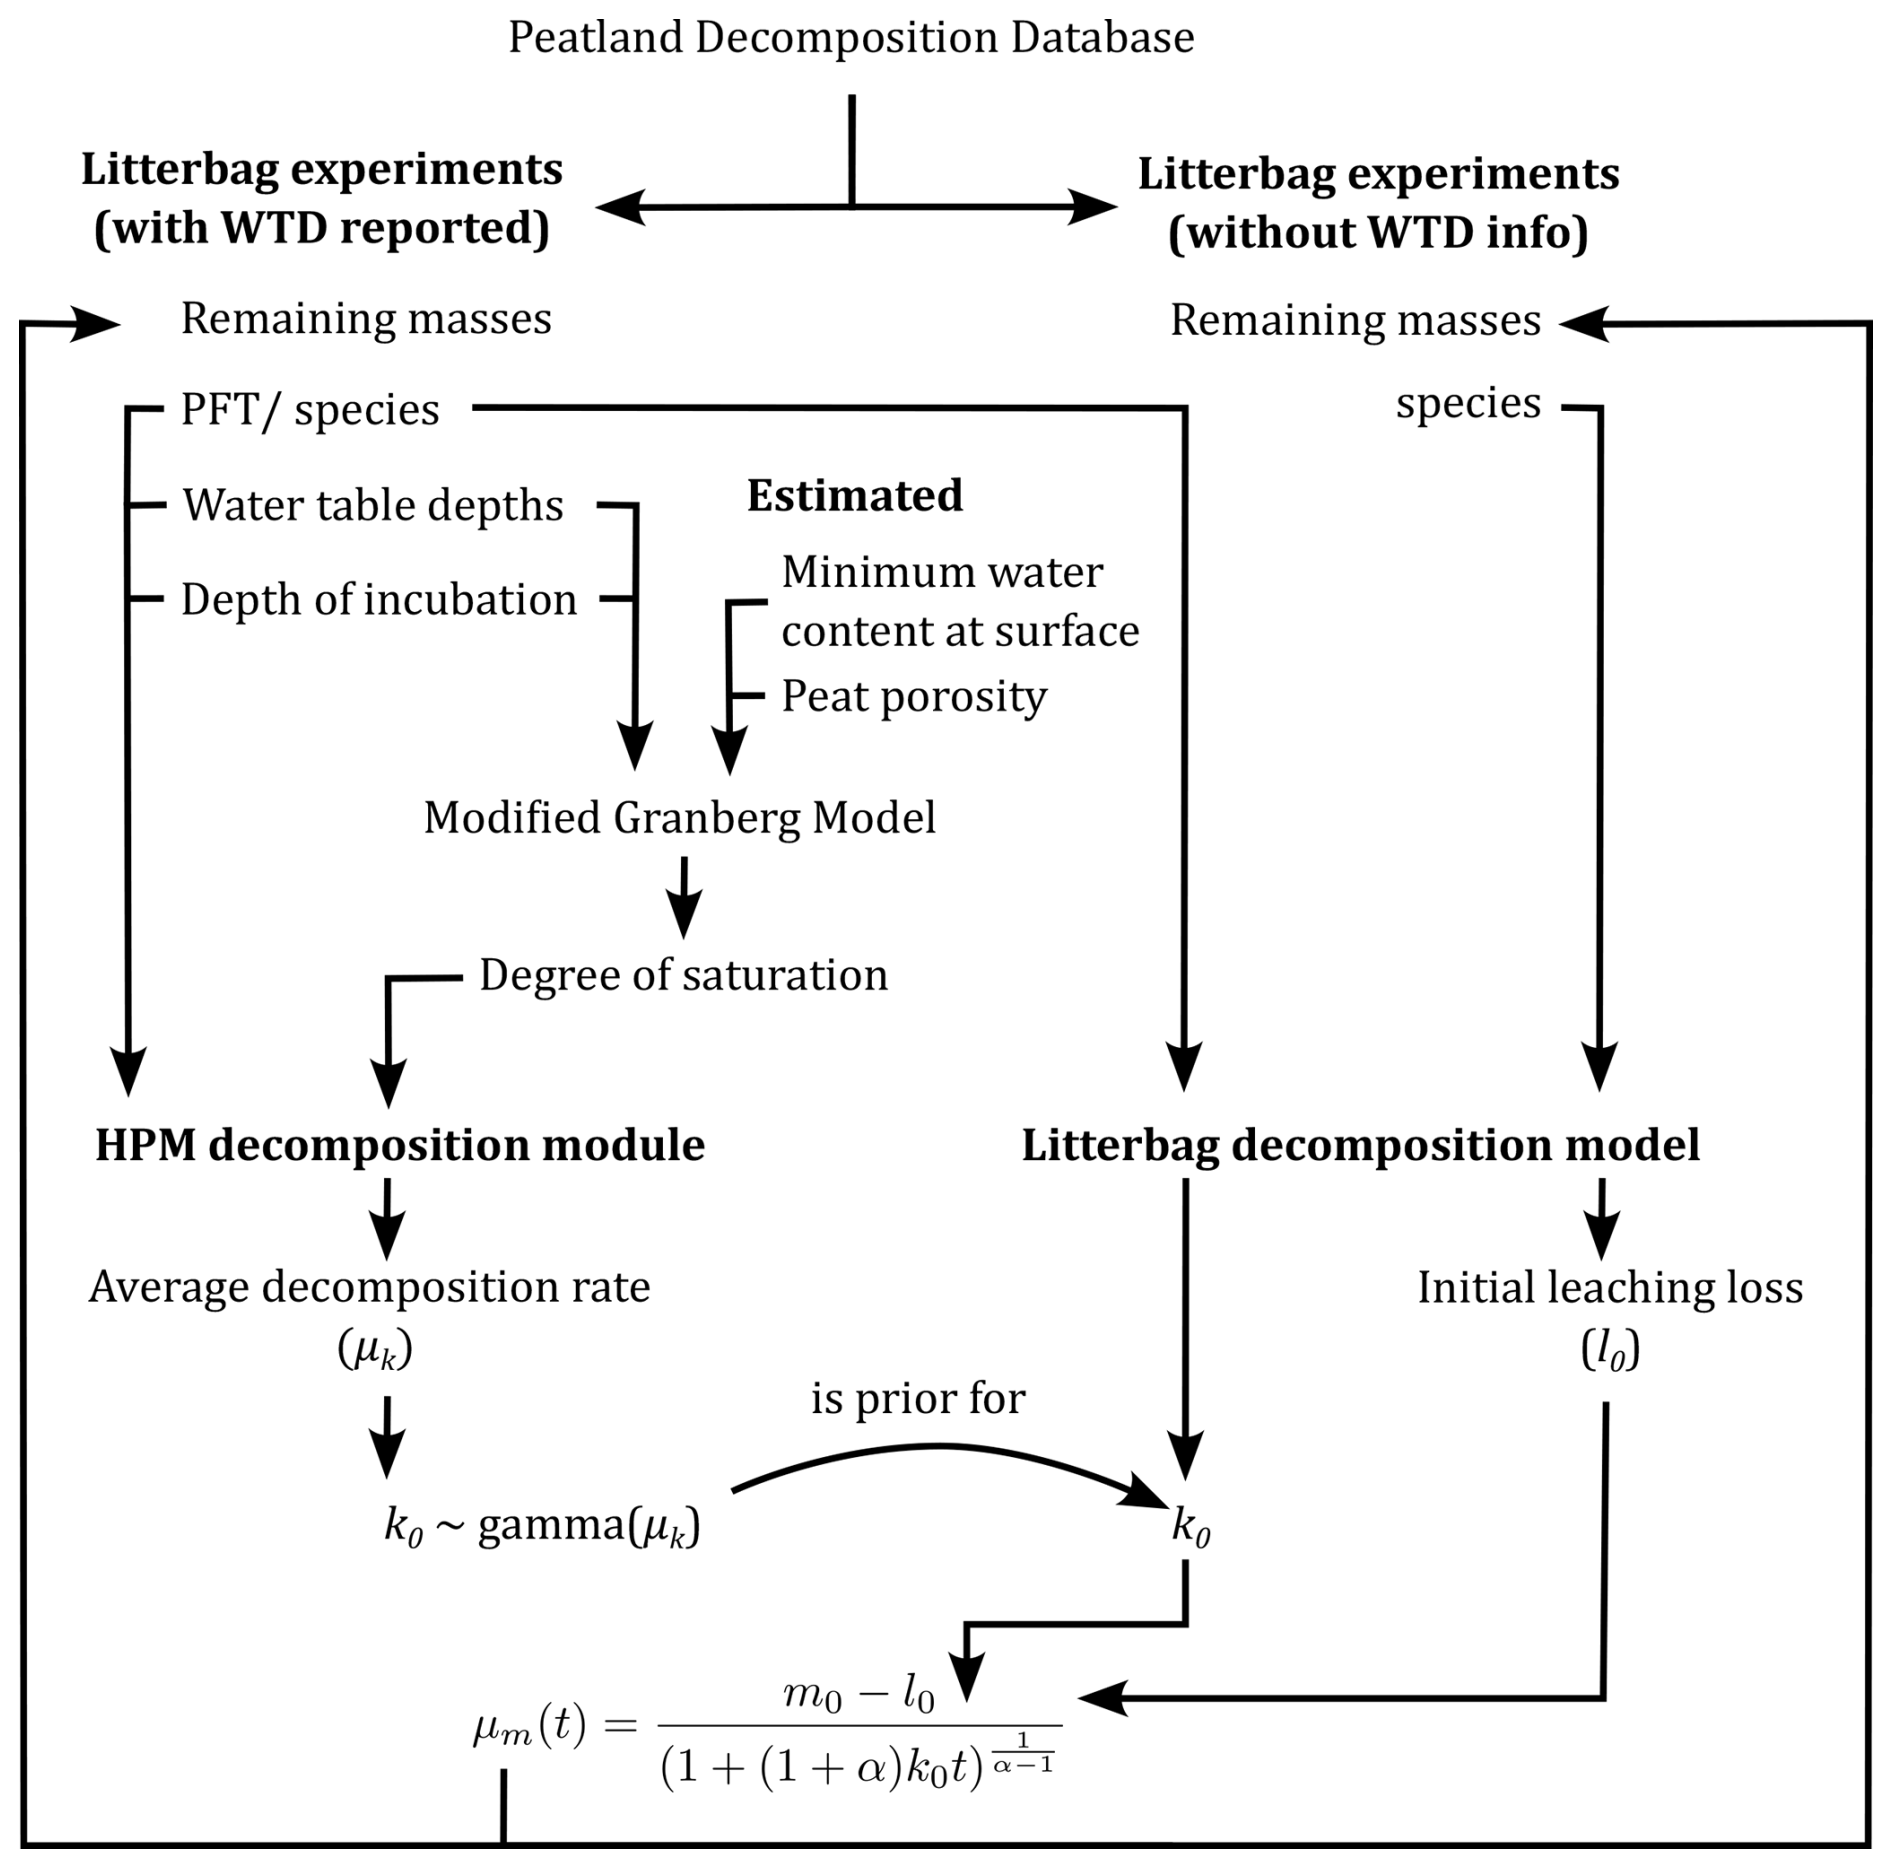
Figure 1Conceptual representation of the modeling approach. Arrows represent flows of information. Litterbag data that have information on water table depths (WTDs) and incubation depths are used to estimate average decomposition rates (μk) with the HPM decomposition module. The HPM decomposition module needs plant functional type identity, peat degree of saturation, WTD, and incubation depth to predict decomposition rates. The modified Granberg model is used to estimate the peat degree of saturation at incubation depths from the WTD, the minimum water content at the surface, and the porosity, of which the latter two are estimated from the remaining masses. The litterbag decomposition model is used to estimate decomposition rates (k0) for all litterbag studies, including those that have information on WTD and those that do not. A gamma distribution with μk as average is used as prior distribution for k0 for the litterbag experiments that have information on WTD (curved arrow). This helps to constrain initial leaching loss and decomposition rate estimates for studies that can be predicted with the HPM decomposition module. The litterbag decomposition module also estimates initial leaching losses (l0) for all litterbag experiments. The equation at the bottom uses these to estimate remaining masses as reported in the litterbag experiments. The litterbag decomposition model is described in more detail in Sect. 2.2. See the text for further details.
We only test the decomposition module of the HPM, but the decomposition modules of many other peatland models are also parameterized based on litterbag experiments, and our modeling approach is flexible enough to be combined with other decomposition modules. Therefore, our test could serve as a blueprint for similar tests of other peatland model decomposition modules. Similarly, the parameter discrepancies identified here suggest future litterbag experiments that would provide novel insights into oxic and anoxic controls of Sphagnum decomposition rates; therefore, our study suggests a strategy to improve decomposition modules in general.
2.1 Sphagnum litterbag data
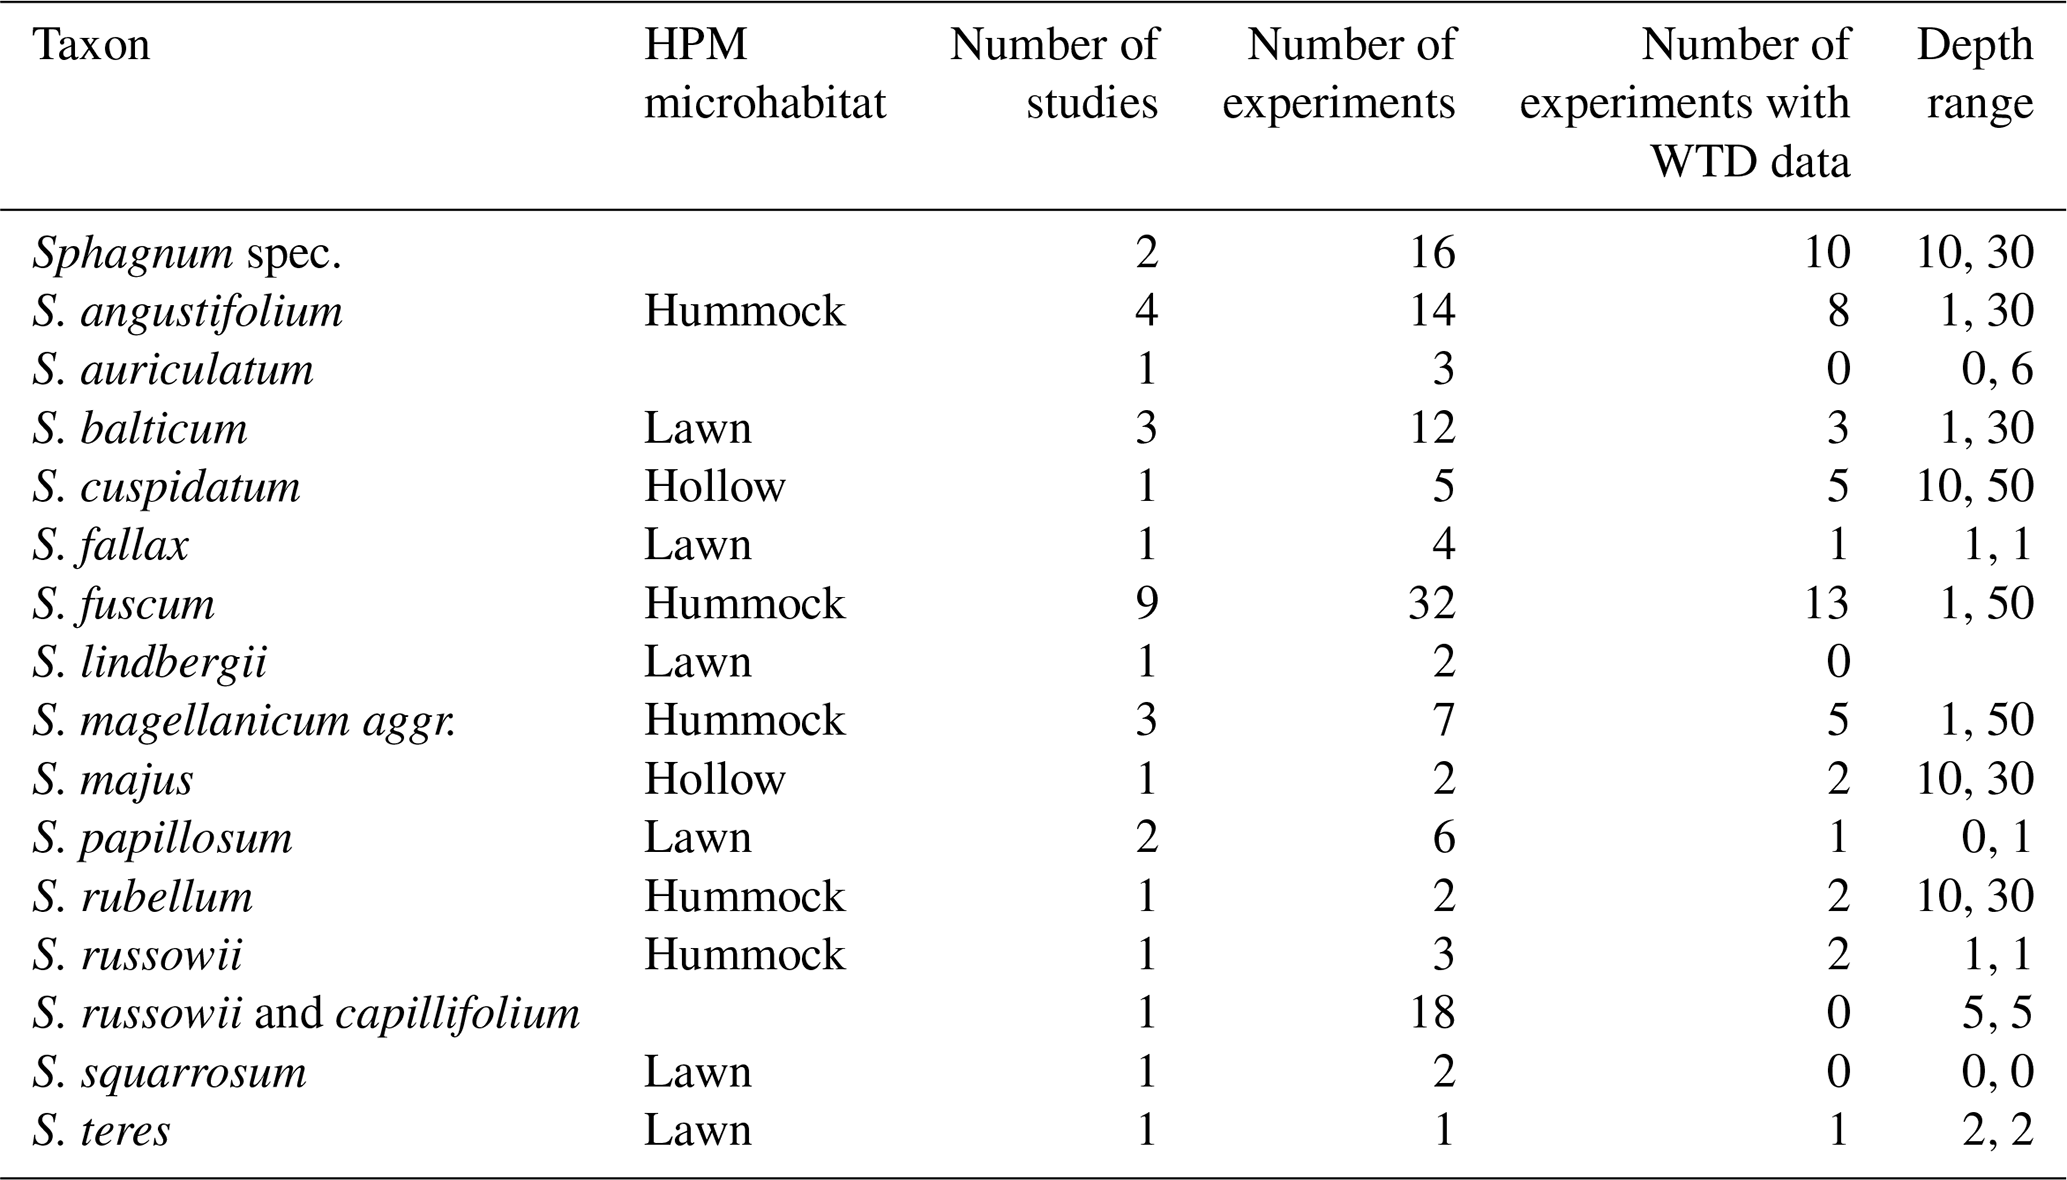
To test the HPM decomposition module against litterbag data, we used the Peatland Decomposition Database (Teickner and Knorr, 2024). In this study, we use data from Bartsch and Moore (1985), Vitt (1990), Johnson and Damman (1991), Szumigalski and Bayley (1996), Prevost et al. (1997), Scheffer et al. (2001), Thormann et al. (2001), Asada and Warner (2005), Trinder et al. (2008), Breeuwer et al. (2008), Straková et al. (2010), Hagemann and Moroni (2015), Golovatskaya and Nikonova (2017), and Mäkilä et al. (2018) to estimate decomposition rates (k0) using the litterbag decomposition model (Fig. 1, Table 2). Data from Johnson and Damman (1991), Szumigalski and Bayley (1996), Prevost et al. (1997), Straková et al. (2010), Golovatskaya and Nikonova (2017), and Mäkilä et al. (2018) include water table depths (WTDs) and depths below the surface where litterbags were incubated, in addition to remaining masses and taxonomic information; therefore only these datasets were also used to predict k0 with the HPM decomposition module (Fig. 1). Samples originally classified as Sphagnum magellanicum are classified here as Sphagnum magellanicum aggr. (Hassel et al., 2018).
Table 2Overview on litterbag experiments included for each Sphagnum taxon in this study. “HPM microhabitat” is the HPM microhabitat assigned to each taxon. Taxa without value are not considered in Johnson et al. (2015) (see Sect. 2.3.2). “Number of experiments” is the number of litterbag experiments available from the Peatland Decomposition Database (these are either individual replicates or average values of replicates, depending on what data were reported in the studies). “Number of experiments with WTD data” is the number of litterbag experiments that also report water table depths and for which we could therefore make predictions with the HPM decomposition module. “Depth range” shows the maximum and minimum depth below the peat surface at which litterbags were placed (cm). Missing values mean that no study reported depths.
2.2 Modeling remaining masses and decomposition rates with the litterbag decomposition model
To estimate decomposition rates for available Sphagnum litterbag experiments, we use the equation from the HPM that computes remaining masses from decomposition rates and decomposition time (Frolking et al., 2001, 2010) as the litterbag decomposition model (Fig. 1), with three modifications. The original equation (Eq. 4 in Frolking et al., 2001) is
where m(t) is the fraction of initial mass remaining at time t; m0 is the fraction of initial mass remaining at time t=0; k0 is the decomposition rate; and α is a parameter that describes how decomposition slows down as mass is lost, where the HPM assumes α=2 for simplicity (Frolking et al., 2001, 2010).
The modified version we use here is (Fig. 1)
where l0 is the fraction of mass lost due to initial leaching. The HPM decomposition process does not assume that there are initial leaching losses, but these are commonly observed in litterbag experiments and bias decomposition rate estimates when they are ignored (Yu et al., 2001; Teickner et al., 2025a); therefore, the modification is necessary to allow a sensible test of the HPM decomposition module with litterbag data.
The second modification is that we do not assume α=2 but regard it as an unknown parameter that is estimated from litterbag data. Since α=2 was chosen for simplicity and attempts to reliably estimate α have failed (e.g., Clymo et al., 1998; Frolking et al., 2001; Teickner et al., 2025a), we estimate α mainly to consider the possible error introduced by this parameter.
The third modification is that we change m(t) to μm(t) because we assume that Eq. (2) describes only the average fraction of the initial mass remaining. For each retrieved litterbag, we assume that the remaining mass can be described with a beta distribution with precision parameter ϕm:
Values for k0 are estimated from remaining masses reported in available litterbag experiments conditional on Eq. (2) and a hierarchical prior structure (Teickner et al., 2025a):
where βk,1 is the estimated decomposition rate across all litterbag experiments, describes the difference in the average decomposition rate for the Sphagnum species, describes the difference in the average decomposition rate for the study (nested within species), and describes the difference in the average decomposition rate for the sample (litterbag experiment). All these parameters have normal distributions as priors. Hierarchical models of the same structure are used to estimate l0 and α from Eq. (2) and to estimate ϕm from Eq. (3).
2.3 Prediction of litterbag decomposition rates with the Holocene Peatland Model decomposition module
To predict decomposition rates, the HPM decomposition module needs as inputs the litter type in terms of the HPM plant functional types (PFTs), the fraction of mass already lost due to previous decomposition, the depth of the litter below the peat surface, the water table depth, and the peat degree of saturation (Frolking et al., 2010).
Predicting decomposition rates for the available litterbag data is not straightforward because the HPM decomposition module does not consider specific features of available litterbag experiments. The HPM does not specify how to assign species to plant functional types. Moreover, none of the available litterbag studies reported the degree of saturation which therefore needs to be estimated in order to make predictions with the HPM decomposition module. The only variables that can be directly linked are the depth of the litter below the peat surface and the water table depths (both reported in litterbag experiments). All other variables can only be estimated from available litterbag experiments with additional assumptions that are described in the following subsections.
In the following subsection, we give a more detailed description of our modeling approach, particularly of the HPM decomposition module and how it predicts decomposition rates, and how we link the decomposition rates estimated with the litterbag decomposition model to those predicted by the HPM decomposition module. The remaining subsections discuss how we derived or estimated PFT, WTD, and degree of saturation for the litterbag data and additional steps to make the litterbag data compatible with the HPM decomposition module.
2.3.1 The Holocene Peatland Model decomposition module
In our study, the decomposition rates estimated from litterbag experiments are compared against decomposition rates predicted by the HPM decomposition module (Frolking et al., 2010) for the same litterbag experiments (Fig. 1). The HPM decomposition module describes how decomposition rates depend on the Sphagnum PFT, the degree of saturation, and the depth of a litter sample below the water table. Similarly to the remaining mass, we assume here that the HPM decomposition module predicts an average decomposition rate, μk, instead of the decomposition rate of individual samples (Fig. 1):
where k0,i is the PFT-specific maximum possible decomposition rate (Table 1); W is the degree of saturation (); is the depth of the sample below the average annual water table (, where zwt and z are the depth of the water table and litterbag below the peat surface); and f1 and f2 are modifiers due to W (under oxic conditions) and (under anoxic conditions), respectively. These modifiers are described in Eqs. (8) and (9) in Frolking et al. (2010):
where all parameters not yet mentioned are defined in Table 1.
In our model that combines the HPM decomposition module and the litterbag decomposition model, k0 estimated from the litterbag data for each litterbag experiment with reported WTD (sample) (Eq. 2) is assumed to follow a gamma distribution with shape parameter (estimated) and average μk (predicted for each sample with Eq. 5):
Thus, the decomposition rate predicted by the HPM decomposition module (Eq. 8) is a prior for k0 as estimated from the litterbag decomposition model (Eq. 4). This forms the link between the litterbag decomposition model and the HPM decomposition module (Fig. 1) and also allows us to estimate parameters of the HPM decomposition module from the litterbag data. The advantage of this modeling approach is that we can consider litterbag experiments without water table depth to estimate l0 and k0 for individual Sphagnum species, which is additional information to constrain estimates of the HPM decomposition module parameters. Moreover, combining the litterbag decomposition model and the HPM decomposition module into one Bayesian model not only estimates HPM decomposition module parameters from the litterbag data, but it also constrains the decomposition rates estimated from litterbag data by the HPM decomposition module because the HPM decomposition module serves as prior in the combined model, which therefore estimates which parameter values are compatible with the data and the combined model. This is exactly what we want because there is uncertainty both in the remaining masses reported in litterbag experiments and in HPM decomposition module parameters. If HPM decomposition module parameter estimates from the combined model are different from the standard values used in the original model (Table 1), even if we consider these uncertainties and use the HPM decomposition module as prior for the litterbag data, this is a discrepancy worth testing in future experiments.
2.3.2 Assignment of Sphagnum species to plant functional types
The HPM defines maximum possible decomposition rates (k0,i) for three Sphagnum PFTs (hollow, lawn, and hummock species) but not how to assign species to them. We assigned individual Sphagnum species to the three PFTs by comparing their niche WTDs with the optimal WTDs for net primary production defined in the HPM. Specifically, we defined fixed average annual WTD intervals for the PFTs – hollow (<5 cm), lawn (≥5 cm and <15 cm), and hummock (≥15 cm) – based on the HPM (Frolking et al., 2010). Then, we used niche WTDs and standard deviations from Johnson et al. (2015) to assign Sphagnum species to these three microhabitats. Using only average values and the microhabitat WTD thresholds resulted in unintuitive assignments, such as assigning S. fallax to hummocks. To avoid such obvious misclassifications, we defined rules to assign species to HPM microhabitats based on the probability of a species occurring in the three niche WTD intervals. To compute the probabilities, we assumed a normal distribution (Johnson et al., 2015):
-
Species with a probability of occurrence ≥15 % in the intervals of all three PFTs were classified as lawn species.
-
In all other cases, species were assigned to the PFT for which their probability of occurrence was largest.
Litterbag data from Prevost et al. (1997) are incubations of peat samples where the species is unknown. Based on descriptions in this study, it is likely that the peat was formed by hummock species. Hummock species are assumed to have the smallest decomposition rate among the three Sphagnum PFTs in the HPM (Frolking et al., 2010), and this is in line with small decomposition rate estimates for these samples (Teickner et al., 2025a). For these reasons, we assigned these samples to the hummock PFT of the HPM.
When estimating parameters of the HPM decomposition module from the litterbag data (see Sect. 2.4.1), we also estimated the maximum possible decomposition rate (k0,i). Sphagnum species differ in their decomposition rate, and the PFTs of the HPM are a simplification that may cause misfits of the HPM decomposition module to litterbag data. We therefore estimated k0,i for individual Sphagnum species in models HPM-all, HPM-leaching, and HPM-outlier (see Sect. 2.4.1) and evaluated the variability in these species-specific estimates compared to the standard k0,i values of the HPM Sphagnum PFT.
2.3.3 Degree of saturation
We estimated the degree of saturation with the modified Granberg model (ModGberg model) (Granberg et al., 1999; Kettridge and Baird, 2007) from the minimum water content at the surface (θ0,min), the total porosity (P), the water table depth below the peat surface (zwt), and the depth of the litterbags below the peat surface during the incubation (z):
where θ0 is the water content at the surface and is an empirical relation of θ0 with the WTD (Kettridge and Baird, 2007).
The minimum water content at the surface was not reported in any study; therefore we assumed a minimum water content at the surface of 0.05 with a standard deviation of 0.05 , based on measurements from Hayward and Clymo (1982). The total porosity was not reported in any study; therefore we assumed an average value of 80 % with a standard deviation of 10 %, roughly based on values reported for low-density Sphagnum peat (Liu and Lennartz, 2019). An improved test of the HPM decomposition module would require litterbag experiments with direct measurements of the degree of saturation at sufficient temporal resolution.
2.3.4 Accounting for mass loss before the start of the litterbag experiments
The HPM decomposition module assumes that the more the initial mass is decomposed, the more decomposition rates decrease (Frolking et al., 2001, 2010). Thus, if litter lost some mass due to decomposition before the start of the litterbag experiment, one would have to know the magnitude of this mass loss to correctly predict decomposition rates with the HPM decomposition module.
Because of the continuous growth of Sphagnum at the top and die-off below, it is difficult to separate living material, assumed not to have lost mass, from dead material, which may have already lost some mass. Based on a visual assessment, the studies that used Sphagnum material from the surface assume that the material did not lose mass prior to the litterbag experiments, and we follow this assumption ( in Eq. 2).
Samples from Prevost et al. (1997) are Sphagnum peat collected from two different depth levels from the same location, and these samples had probably already experienced some decomposition; however, it is difficult to estimate how much. Apart from knowing the exact mass loss prior to the litterbag experiment, an alternative approach to allow the prediction of decomposition rates with the HPM with previous mass loss is to define a dummy species for a sample, such that the maximum possible decomposition rate for the sample (k0,i) is estimated separately. We therefore estimated k0,i separately for each peat layer in Prevost et al. (1997), implicitly assuming that these are two different PFTs with different maximum possible decomposition rates.
2.4 Testing the HPM decomposition module against litterbag data
2.4.1 Model versions
To test different aspects of the HPM decomposition module and the additional assumptions we make, we computed several models which differ as to whether HPM decomposition module parameters were fixed to their standard values or estimated from data, whether peat properties (porosity, water table depth, water content, minimum water content at the surface) are estimated from data or not, and whether the HPM decomposition module was extended to also predict l0 or not (Table 3).
Teickner et al. (2025a)(Frolking et al., 2010)Table 3Overview of HPM decomposition module modifications computed in this study.
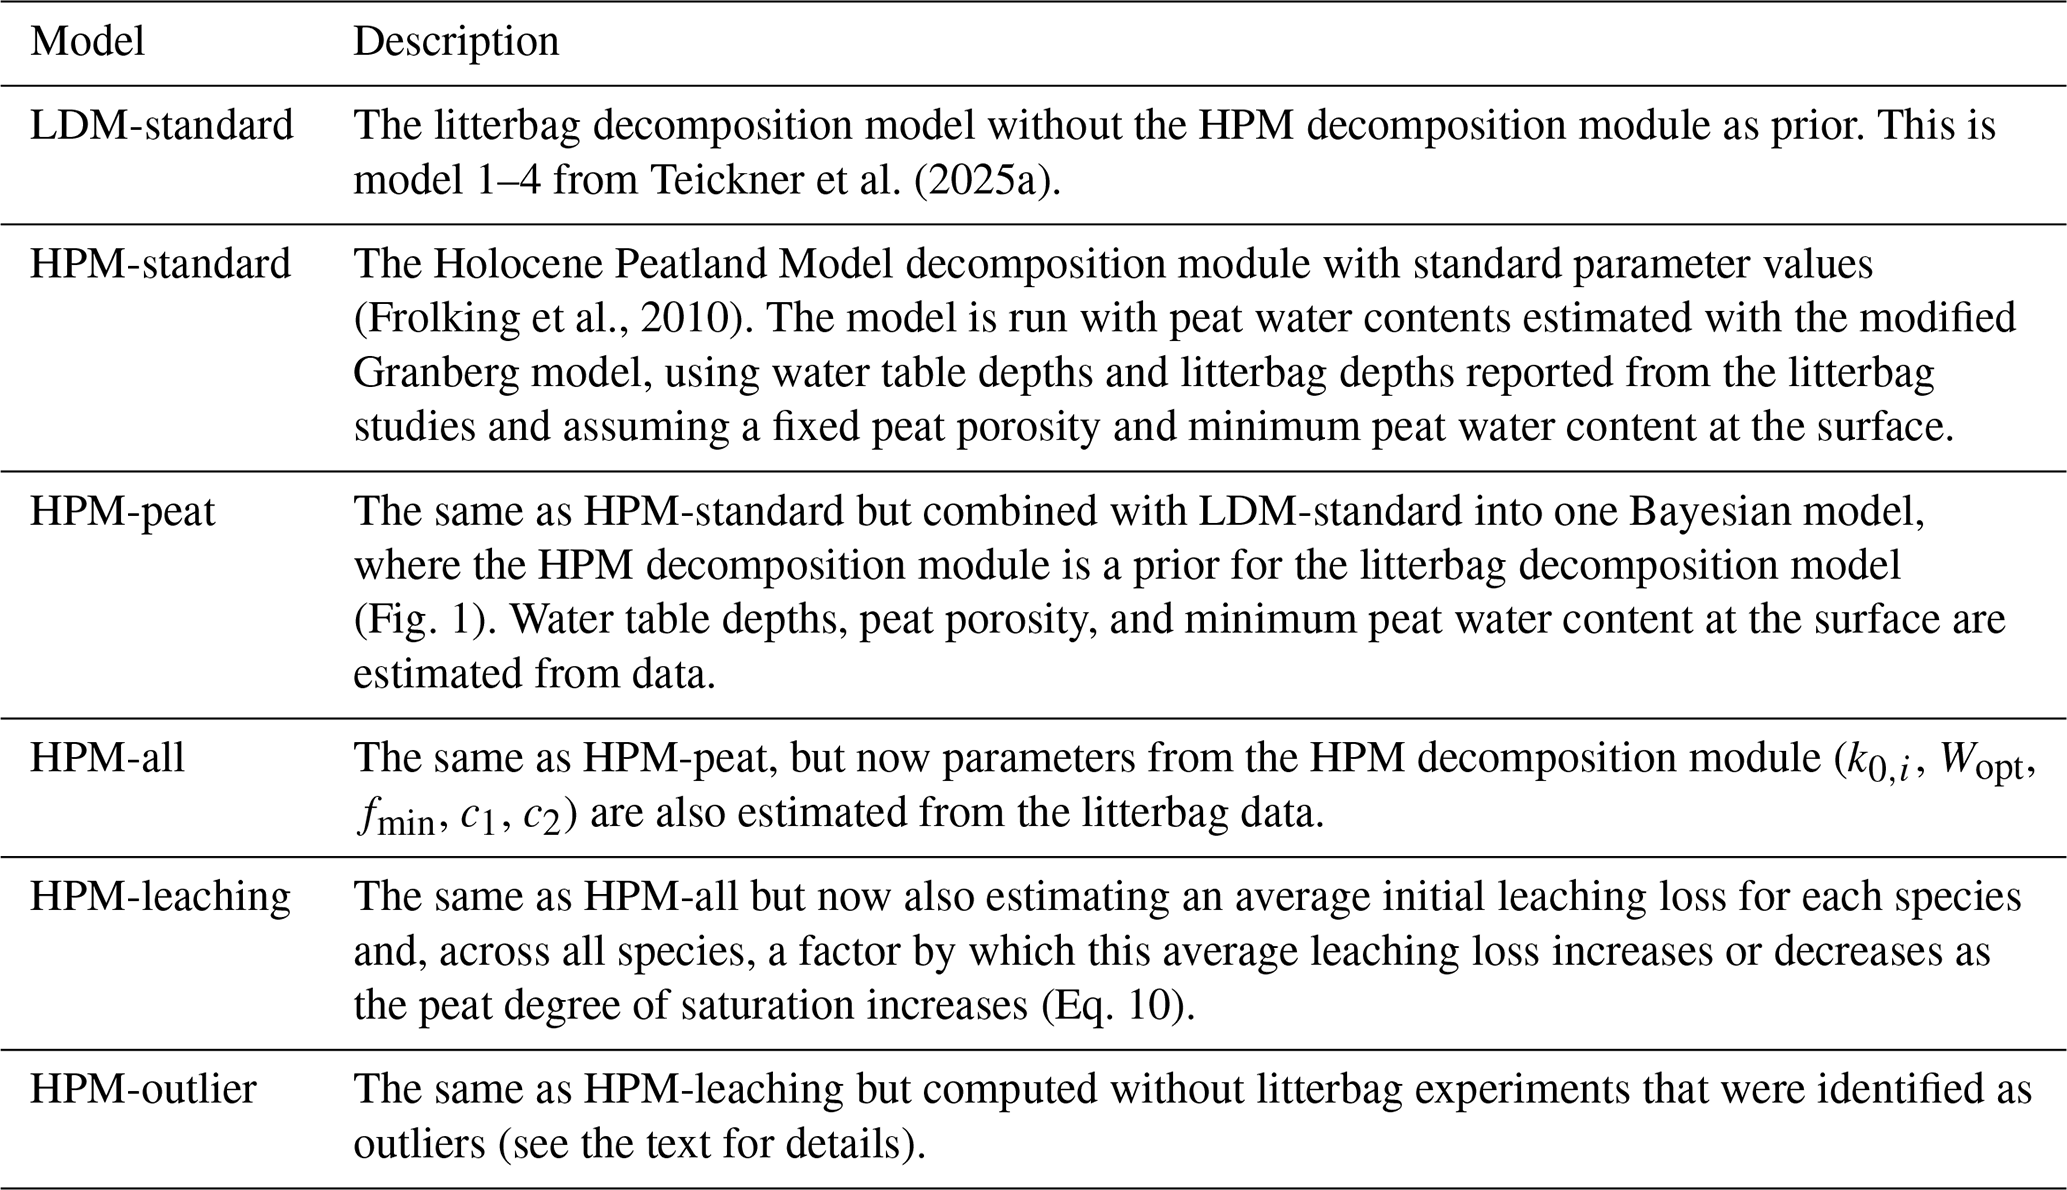
The first model (HPM-standard) does not estimate any parameters of the HPM decomposition module (Eqs. 5–7) and does not estimate peat properties from the litterbag data; therefore, it is the HPM decomposition module with standard parameter values while propagating prior uncertainties for peat properties. For this model, predictions of k0 equal μk (Eq. 5). This version of the HPM decomposition module is completely independent of the litterbag decomposition model, meaning that the HPM decomposition module is not used as prior for the litterbag decomposition model (Fig. 1). This also means that, to compare k0 predicted by HPM-standard to k0 estimated from the litterbag decomposition model, we need to estimate the litterbag decomposition model independently, without using the HPM decomposition module as prior. This independent litterbag decomposition model is called LDM-standard (Table 3). We use LDM-standard not only to compare k0 estimates to k0 predictions of HPM-standard, but also to analyze how k0 estimates of the litterbag decomposition model change when we use different versions of the HPM decomposition module as prior in the subsequent models.
Each subsequent model combines the HPM decomposition module and the litterbag decomposition model into one Bayesian model via Eq. (8). Each of these models estimates an additional set of parameters from the litterbag data relative to the previous model (Table 3). Firstly, only the peat properties (HPM-peat) are estimated, then all HPM parameters (k0,i, c1, Wopt, fmin, c2) (HPM-all) are estimated. Finally, HPM-leaching extends HPM-all by adding formulas to model how l0 depends on the degree of saturation, similarly to how the HPM decomposition module predicts k0 with Eq. (6).
HPM-peat tested whether the HPM decomposition module can fit available litterbag data when the HPM decomposition module and the litterbag decomposition model are combined and when peat properties are estimated from data.
HPM-all estimates which HPM decomposition module parameter values are compatible with available litterbag data and therefore allow us to test whether the standard parameter values are extreme relative to these estimates. Values of k0,i were estimated for each species separately, as described in Sect. 2.3.2.
HPM-leaching was computed because decomposition rates estimated from available litterbag experiments are sensitive to initial leaching losses (Yu et al., 2001; Lind et al., 2022; Teickner et al., 2025a). It is therefore interesting to see whether litterbag decomposition rates are estimated differently in HPM-leaching, when initial leaching losses are constrained by adding formulas to model how l0 depends on the degree of saturation, compared to HPM-all, when initial leaching loss estimates are constrained only by the litterbag decomposition model. Based on previous experiments with tea bags, it is reasonable to assume that there is some relation between initial leaching losses and the degree of saturation (Lind et al., 2022). Specifically, we use the following logistic regression model to describe an average initial leaching loss per sample, in dependency of the degree of saturation:
where μl is the average initial leaching loss for a sample, βl,1 is the (hypothetical) average initial leaching loss at a degree of saturation 0 for each taxon, βl,2 is the coefficient that describes the relation to the degree of saturation (W), and ϕl transforms μl and (1−μl) into the shape and rate parameters of a beta distribution. This beta distribution has the same function as the gamma distribution (Eq. 8) for k0 (compare also with Fig. 1): it is a prior for l0 estimated with the litterbag decomposition model, where the average of this prior is μl.
To check whether outliers in the litterbag data could influence our results, we computed one additional model, HPM-outlier, with the same structure as HPM-leaching but estimated without litterbag experiments identified as outliers. Litterbag experiments were defined as outliers if the reported average remaining mass of any litterbag (batch) during the experiment had a posterior probability>99 % of being different from the remaining mass predicted by the litterbag decomposition model alone. This procedure identified experiments as outliers where remaining masses increased over time, where litterbags collected at intermediate time points had unexpectedly low remaining masses, or where initial leaching losses were retarded to later time points, presumably because of freezing after the start of the experiment (Teickner et al., 2025a). In total, five litterbag experiments were identified as outliers. Results for HPM-outlier are shown in Sect. S8 in the Supplement, and HPM decomposition module parameter estimates agree with estimates of HPM-leaching and HPM-all.
Strictly speaking, we do not test the decomposition module in the HPM, but rather the combination of the HPM decomposition module and the modified Granberg model, assuming that uncertainties in water table depths are negligible and that we accounted sufficiently for uncertainties in total porosity. This ambiguity has to be accepted when combining heterogeneous litterbag data where some variables have to be estimated. Litterbag experiments where water table depths and the degree of saturation are measured at sufficient temporal resolution are needed to avoid this ambiguity in future studies and to improve any test of the HPM decomposition module.
2.4.2 Bayesian data analysis
All models listed in Table 3 were computed with Bayesian statistics to account for relevant uncertainty sources and include relevant prior knowledge (for example, that Sphagnum decomposition rates are unlikely to be larger than 0.5 yr−1). Bayesian computations were performed using Markov chain Monte Carlo (MCMC) sampling with Stan (2.32.2) (Stan Development Team, 2021a) in R (4.2.0) (R Core Team, 2022) via the rstan package (2.32.5) (Stan Development Team, 2021b) using the NUTS sampler (Hoffman and Gelman, 2014), with four chains, 4000 total iterations per chain, and 2000 warmup iterations per chain. None of the models had divergent transitions, the minimum bulk effective sample size was larger than 400, and the largest rank-normalized was 1.01, indicating that all chains converged (Vehtari et al., 2021). All models used the same priors for the same parameters, and prior choices are listed and justified in Table S1 in the Supplement. Results of prior and posterior predictive checks are shown in Sect. S3 in the Supplement.
We used power scaling of the prior and likelihood distributions as implemented in the priorsense package (0.0.0.9000) (Kallioinen et al., 2024) to analyze the relative sensitivity of the posterior distribution to small perturbations of the prior and likelihood in HPM-leaching for HPM decomposition module parameters and peat properties. This is a computationally inexpensive way to check whether the data provide information about a parameter and where prior and data may provide conflicting information (Kallioinen et al., 2024). Results of this analysis and further information on the data analysis are shown in Sect. S2 in the Supplement.
2.4.3 Fit of model predictions to estimated decomposition rates and observed remaining masses
To analyze how well the models fit remaining masses observed in the litterbag experiments, we plotted reported remaining masses versus remaining masses estimated by the litterbag decomposition model in HPM-peat, HPM-all, and HPM-leaching. HPM-standard is not linked to the litterbag decomposition model and therefore does not predict remaining masses.
To analyze how well all HPM decomposition module versions fit k0 estimated by the respective litterbag decomposition model, we created a similar plot for k0. Here, we compared predictions of HPM-standard (Eq. 8) against estimates of LDM-standard (Eq. 4). We also computed the average difference of k0 predicted by the HPM decomposition module and estimated from the litterbag data. We then computed the posterior probability that this average difference is different from zero. A large probability indicates a misfit of the model to available litterbag data. We also tested the same difference for specific species because graphical checks indicated that the decomposition rate prediction skill of the HPM decomposition module depends on species.
To test whether HPM-leaching has not only a better fit to available litterbag data but also a better predictive accuracy for novel data than the model with standard parameter values (HPM-standard), we compared how well both can predict k0 from litterbag experiments. HPM decomposition module parameters of HPM-standard are not estimated from data; therefore we could compute the root-mean-square error of prediction (RMSEtest) directly with k0 predicted by HPM-standard and estimated with LDM-standard. HPM decomposition module parameters of HPM-leaching are estimated from the litterbag data; therefore we used cross-validation (CV) to estimate RMSEtest. Since decomposition rates from the same species and study are usually not independent, we defined blocks which were used as CV folds. Each fold represents the data from one study, but only if there were still data for the same Sphagnum species left in the remaining data (we want to estimate the predictive accuracy not for new species). Species with data from one study only were always used for model training and were not part of the testing folds. This procedure resulted in five folds. HPM-standard and HPM-leaching were tested against the same data. In the text, RMSEtrain is the RMSE computed with the data with which a model was estimated (for HPM-standard, the data with which the litterbag decomposition model was estimated), and RMSEtest is the RMSE computed with independent test data.
2.4.4 Changes in k0 and l0 estimates of the litterbag decomposition models compared to LDM-standard
To analyze how parameter values of the litterbag decomposition model change when it is combined with different versions of the HPM decomposition module as prior, we estimated the average difference in k0 and l0 estimates of each model version to k0 and l0 estimates of LDM-standard. In particular, this allowed us to analyze whether there is any change in the relative magnitude of l0 and k0 because the litterbag decomposition module would constrain these parameter values to fit the respective HPM decomposition module prior and still fit the observed remaining masses.
2.4.5 Magnitudes of k0 along the gradient from oxic to anoxic conditions
To analyze how k0 changes along the gradient from oxic to anoxic conditions, we plotted k0 estimated by LDM-standard versus the water table depth below the litterbags. To this plot, we added k0 predicted by HPM-standard. To analyze how the relation of k0 changes for the HPM decomposition module modifications compared to HPM-standard, we computed differences between k0 estimated by HPM-peat, HPM-all, HPM-leaching, and HPM-standard and plotted these differences versus the water table depth below the litterbags.
2.4.6 Difference between values of k0,i, c1, Wopt, c2, fmin estimated from litterbag data and the standard parameter values
For HPM-all and HPM-leaching, we computed the posterior probability that the HPM decomposition module parameter values estimated from litterbag data (k0,i, c1, Wopt, c2, fmin) differ from the standard parameter values (Table 1). This way, we could identify discrepancies between standard parameter values and parameter values estimated from available litterbag data.
For HPM-leaching, we also conducted a sensitivity analysis, where we simulated the decomposition of S. fuscum incubated at different depths in a peatland with a water table depth of 40 cm below the surface, a porosity of 0.7 , and a minimum water content at the surface of 0.05 . With these settings, we predicted five sets of average k0: (1) one with HPM-leaching (k0,modified(HPM-leaching)) and the remaining four with (2) c1, (3) Wopt, (4) fmin, and (5) c2 set to their standard values (k0,standard(HPM-leaching)). We then computed the difference in k0 from set (1) and (2) to analyze the effect of the new c1 estimate, from set (1) and (3) to analyze the effect of the new Wopt estimate, and so on for sets (4) and (5). This gives the difference in decomposition rates of HPM-leaching if we were to set individual HPM decomposition module parameters to their standard values. This way, we could analyze which HPM decomposition module parameters contribute to a change in k0 predictions along the gradient from oxic to anoxic conditions.
3.1 Fit and predictive accuracy of the different versions of the HPM decomposition module compared to available litterbag data
In each model, the litterbag decomposition model fitted the observed remaining masses similarly well (Figs. 2a and S2 in the Supplement), no matter whether or not the HPM decomposition module was used as prior or whether its parameters were estimated from data (HPM-all, HPM-leaching) or not (HPM-peat). Thus, remaining masses do not indicate large differences between the model versions.
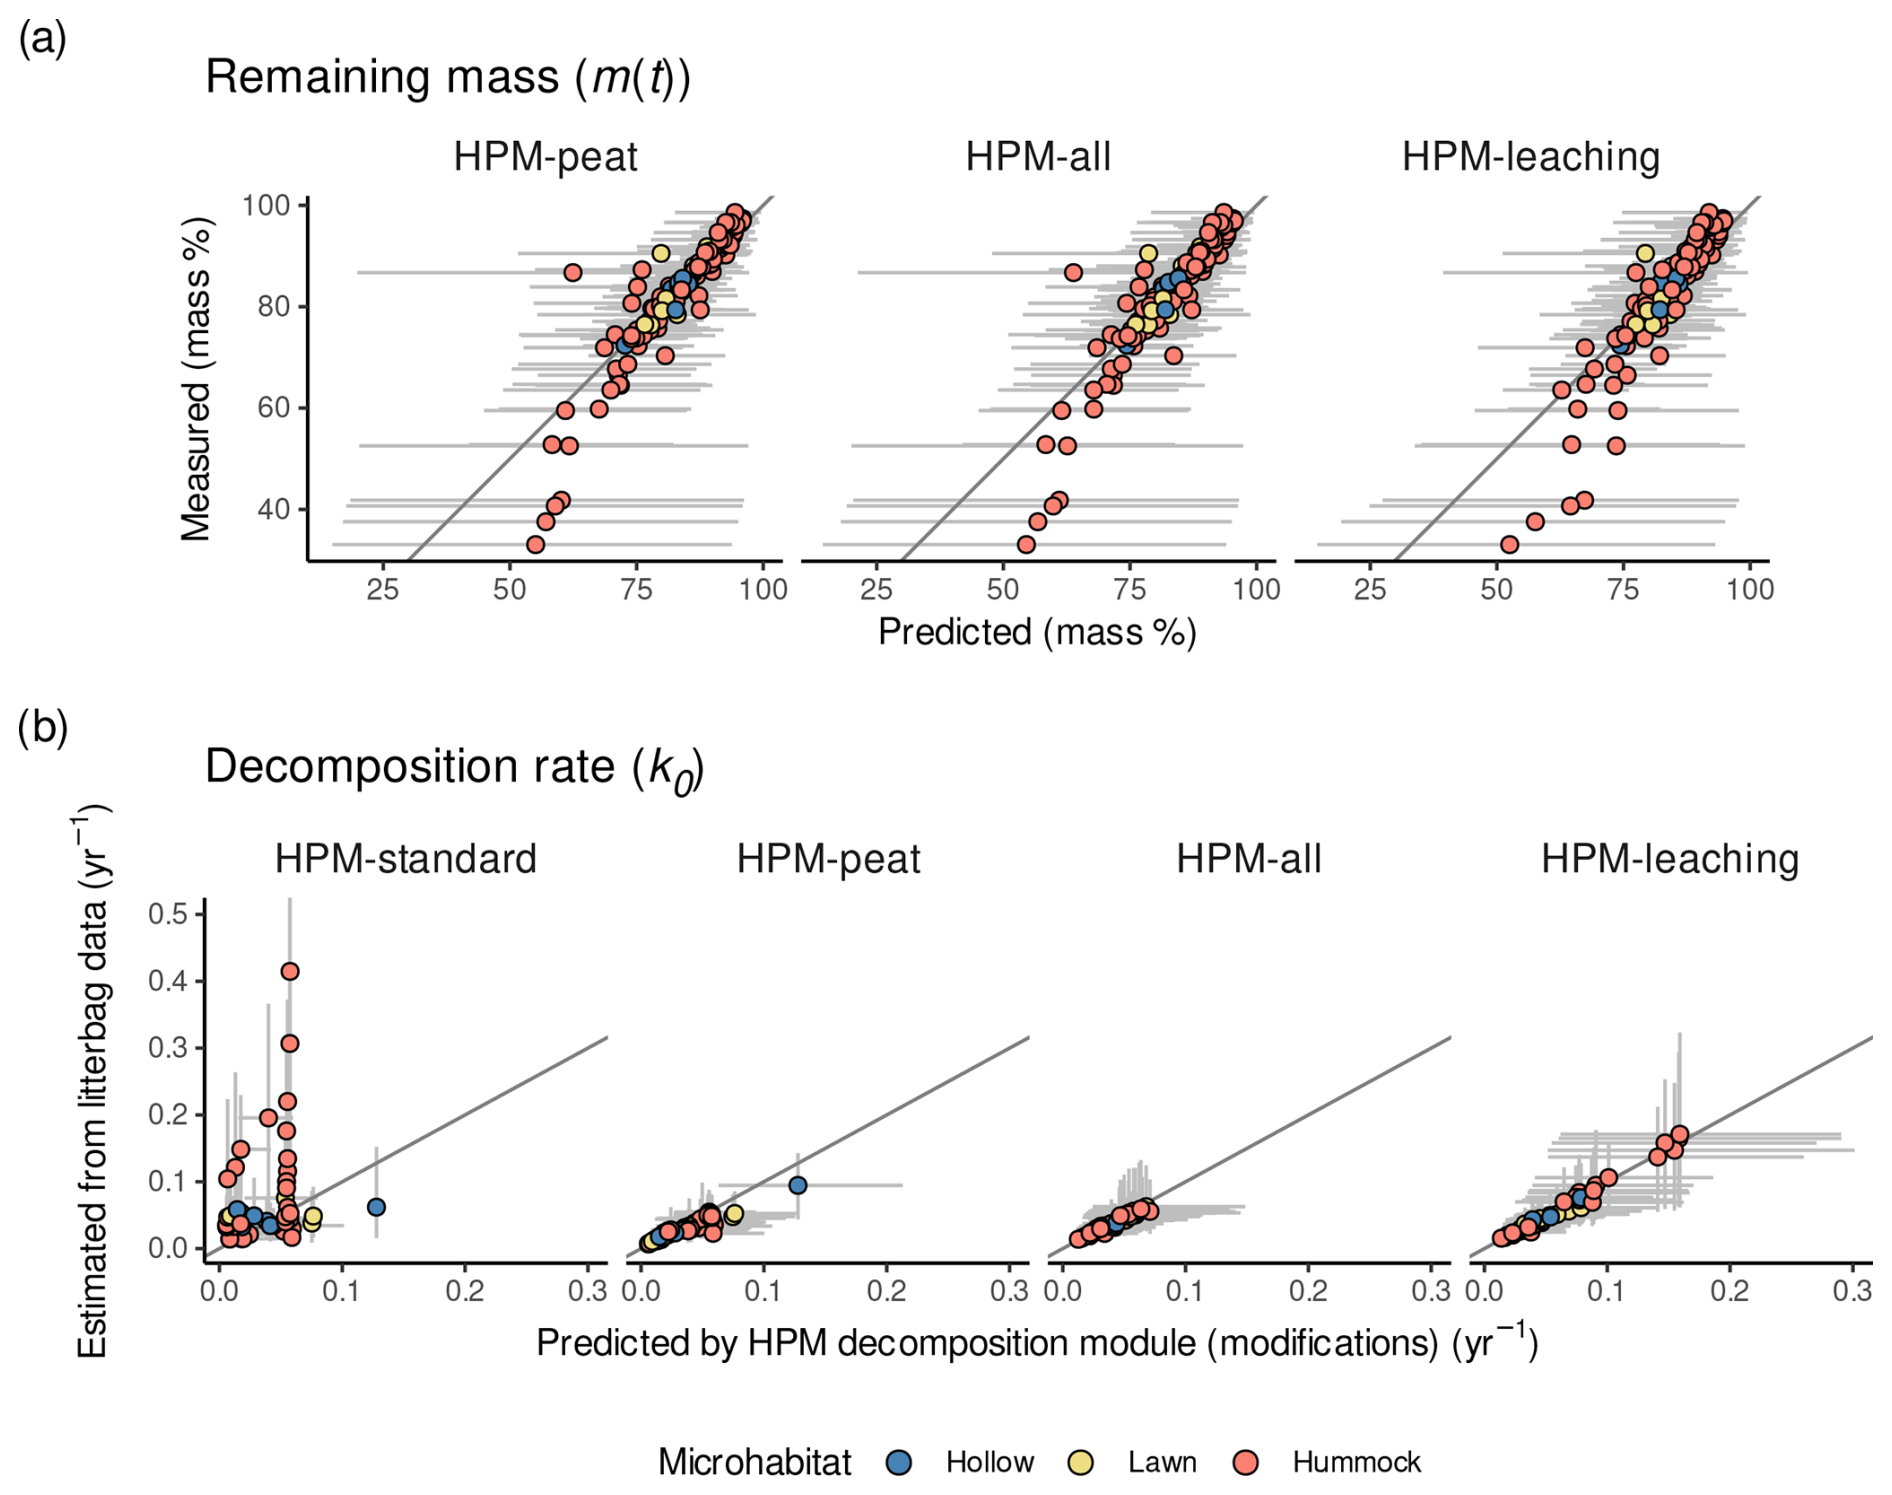
Figure 2(a) Measured remaining masses versus remaining masses predicted by the litterbag decomposition model combined with each HPM decomposition module version. Values are shown for litterbag experiments with reported water table data. For HPM-standard, no values are shown because it was not combined with a litterbag decomposition model. (b) k0 estimated by the litterbag decomposition model versus k0 predicted by different modifications of the HPM decomposition module (Table 3). For HPM-standard, y-axis values are k0 estimates of LDM-standard. For all other model versions, y-axis values are k0 estimates of the litterbag decomposition module with the respective HPM decomposition module version as prior. Points represent average estimates, and error bars represent 95 % posterior intervals. Points are colored according to the microhabitat classification of Sphagnum species (see Methods for details). In panel (b), error bars exceeding 0.5 yr−1 are clipped.
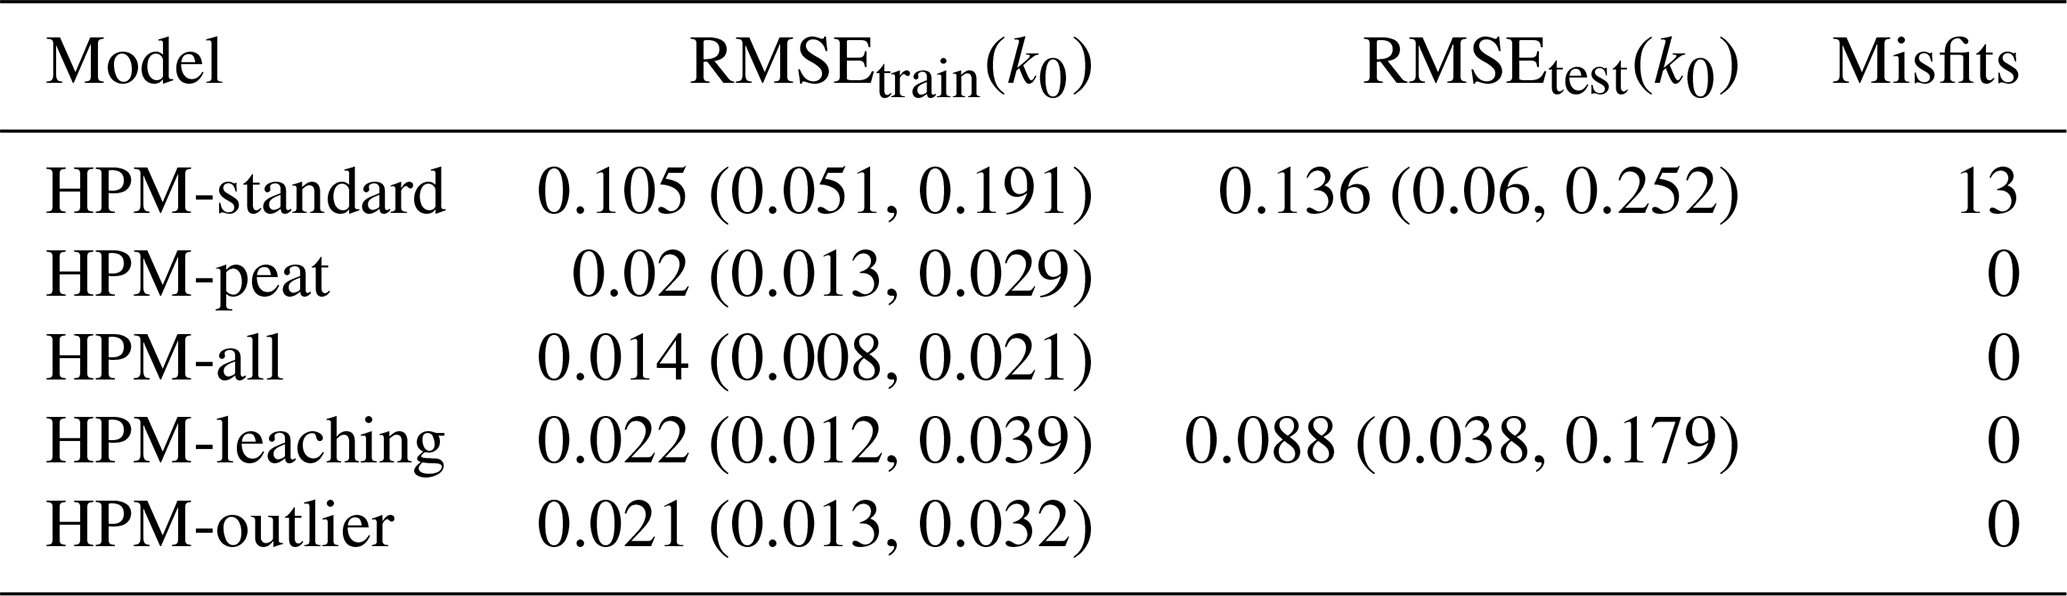
For k0, the picture is more nuanced: when the HPM decomposition module was not used as prior (HPM-standard), it fitted k0 estimated by the litterbag decomposition model on average worse than when it was used as prior (all other model versions) (Fig. 2 and Table 4). For example, HPM-standard had an average RMSEtrain of 0.11 yr−1, whereas HPM-leaching had an average RMSEtrain of 0.02 yr−1. However, the cross-validation indicates that, when applied to novel samples, both HPM-standard and HPM-leaching would perform similarly well if one considers the large uncertainty of the RMSEtest estimates (Table 4).
Table 4Training and testing RMSE for decomposition rates as predicted by different versions of the decomposition module of the Holocene Peatland Model (see Table 3 for a description of the models) and the number of misfits. RMSEtrain(k0) is the root-mean-square error of model predictions for litterbag replicates used during model computation. RMSEtest(k0) is the RMSE for litterbag replicates used in blocked cross-validation. Where no RMSEtest(k0) is given, it was not computed for these models. Values are averages and lower and upper bounds of central 95 % posterior intervals (yr−1). “Misfits” counts the number of litterbag experiments for which k0 predicted by the HPM decomposition module modification differed from k0 as estimated from the litterbag decomposition model with a posterior probability of at least 99 %. In total, k0 was predicted with the HPM decomposition module modifications for 53 (RMSEtrain(k0)) or 29 (RMSEtest(k0)) litterbag experiments.
Interestingly, all model versions where the HPM decomposition module was used as prior had comparable fits (RMSEtrain) (Table 4), even the version that still has standard parameter values for the HPM decomposition module (HPM-peat). This indicates that a change in HPM decomposition module standard parameter values is not required to make the HPM decomposition module fit k0 values estimated from available litterbag data via the litterbag decomposition model, under the assumptions we made. Instead, the results indicate that parameter values of the litterbag decomposition model can be adjusted to fit predictions of this HPM decomposition module prior.
3.2 How are parameter values of the litterbag decomposition model adjusted when different versions of the HPM decomposition module are used as prior?
To understand how using the HPM decomposition module as prior changes k0 and l0 estimates of the litterbag decomposition model, we compared k0 and l0 estimates of the litterbag decomposition model of each model version with the k0 and l0 estimates of LDM-standard. We computed the average difference in k0 estimates by the litterbag decomposition model for all models compared to the k0 estimates of LDM-standard (using only litterbag experiments with reported WTD). Average differences compared to LDM-standard are in the order (average and 95 % confidence interval: ). The magnitude (mean absolute difference) of adjustments of k0 estimates is different for different species (species with at least three samples): the largest average absolute differences across all models were made for S. angustifolium (0.15 (0.06, 0.27) yr−1), and the smallest were made for Sphagnum spec. (0.01 (0.01, 0.02) yr−1). This indicates that, for some species, k0 estimates of the litterbag decomposition model are forced to smaller values for HPM-peat and HPM-all, whereas differences are smaller for HPM-leaching.
With these changes in k0 estimates, a similar fit to remaining masses as observed for all models (see the previous subsection) is only possible when l0 estimates are changed in the opposite direction. To check this, we computed the average difference in l0 estimates by the litterbag decomposition model for all model versions compared to the l0 estimates of LDM-standard. Differences compared to LDM-standard are in the order (average and 95 % confidence interval: mass %). Again, the magnitude (mean absolute difference) of adjustments of l0 estimates is different for different species (species with at least three samples): the largest average absolute differences across all models were made for S. angustifolium (11.4 (7, 16.6) mass %), and the smallest were made for Sphagnum spec. (1.43 (0.86, 2.39) mass %). Thus, the smaller k0 estimates are indeed compensated by larger l0 estimates for HPM-peat and HPM-all, whereas the difference to LDM-standard is smaller for HPM-leaching.
Overall, this analysis indicates that errors in remaining masses observed in available litterbag experiments are large enough to support a range of k0 and l0 estimates. The equivalent fit of the different model versions is therefore caused by adjusting k0 to the HPM prior and adjusting l0 as needed to fit observed masses.
3.3 How do HPM decomposition module parameter estimates differ to the standard values?
Two model versions estimated HPM decomposition module parameters (c1, Wopt, fmin, c2, k0,i): HPM-all and HPM-leaching. These models indicate larger values for c2 and Wopt than the standard values. Figure 3 shows marginal posterior densities of the HPM decomposition module parameters for HPM-all, with standard parameter values as defined in Frolking et al. (2010) indicated by vertical lines. For both HPM-all and HPM-leaching, there are large posterior probabilities that c2 ( and ) and Wopt ( and ) have larger values than the standard parameter values, indicating a discrepancy between the HPM decomposition module and available litterbag data (Figs. 3 and S11 in the Supplement). In contrast, estimates for fmin do not differ much from the prior value, and the power-scaling sensitivity analysis indicates a weak influence of the data (Sect. S2) and therefore that currently available litterbag data provide only little information about minimum decomposition rates under anoxic conditions. HPM-all and HPM-leaching suggest a large variability in k0,i for individual species: both models estimate a large posterior probability (>95 %) that S. russowii and S. rubellum have a larger maximum possible decomposition rate and that S. cuspidatum has a smaller maximum possible decomposition rate (k0,i) than the standard values for the respective PFTs (Figs. 3b and S11). However, estimates for k0,i were very variable for the same species when different subsets of the litterbag data were used to estimate the model in the cross-validation. This indicates that samples of the same species from different studies have a large variability in k0,i values. In summary, when HPM decomposition module parameters are estimated from available litterbag data, estimates for Wopt and c2 are larger than the standard values, differences in the c1 and fmin standard values cannot be detected, and estimates for k0,i are variable and have large errors for different species.
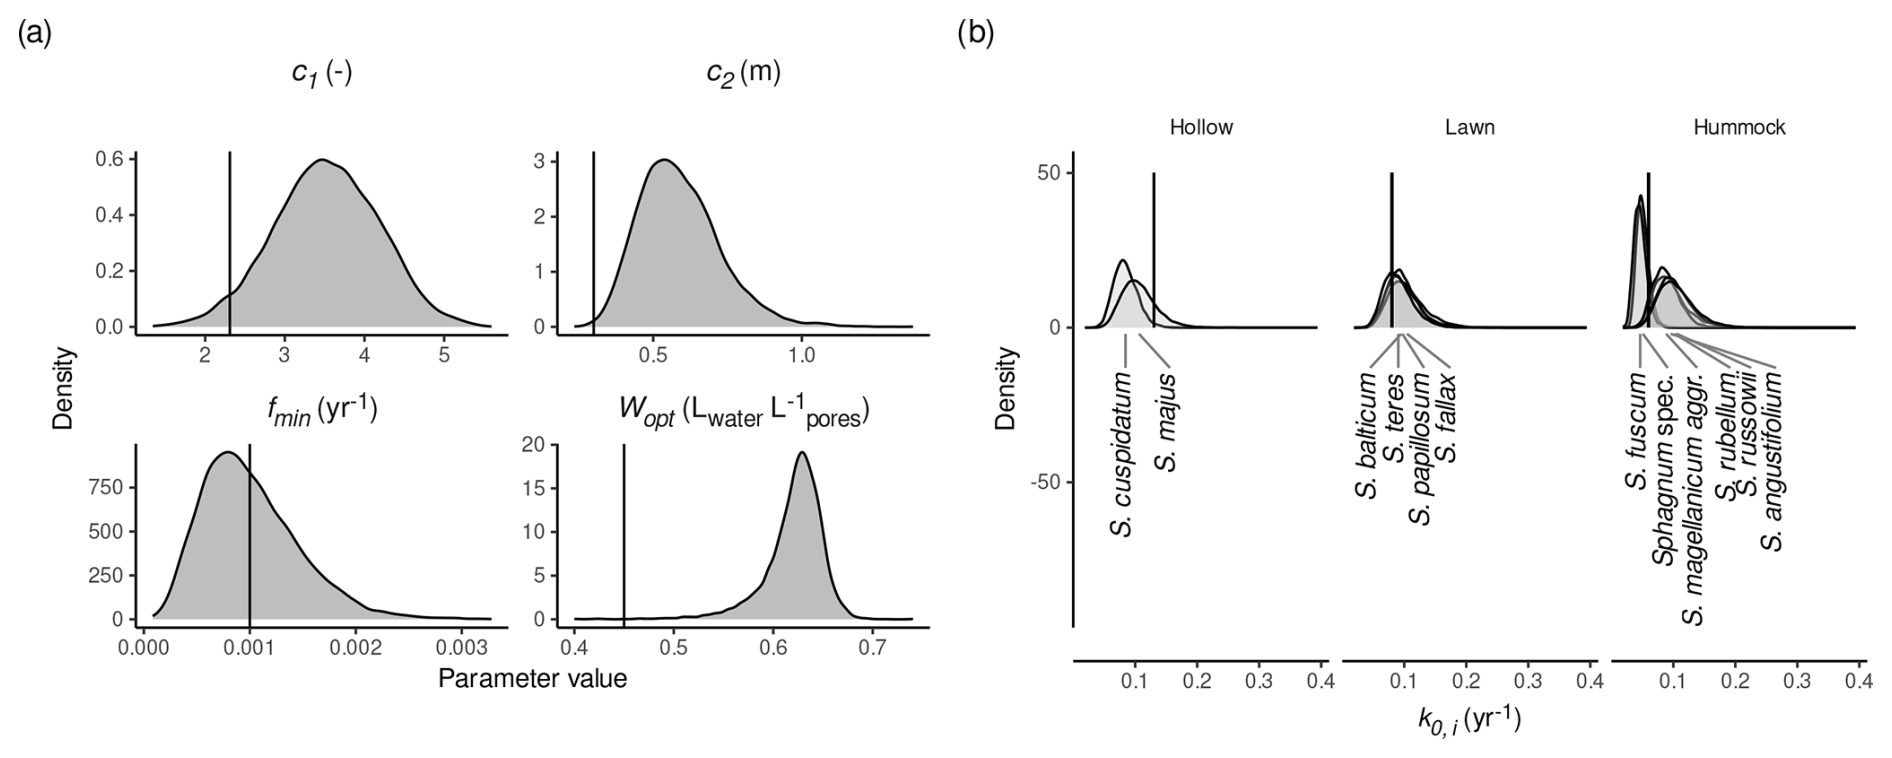
Figure 3Marginal posterior distributions of HPM decomposition module parameters (see Table 1) as estimated by HPM-all. (a) Marginal posterior distributions for c1, Wopt, fmin, and c2. (b) Marginal posterior distributions for k0,i (maximum possible decomposition rate for species i). Species were assigned to HPM microhabitats as described in Sect. 2.2.2. Vertical black lines are the standard parameter values from Frolking et al. (2010). Sphagnum spec. are samples that have been identified only to the genus level.
3.4 Magnitude and change in decomposition rates along the gradient from oxic to anoxic conditions
A comparison of k0 estimates of LDM-standard and k0 estimates of HPM-standard shows that the HPM decomposition module with standard parameter values implies a steeper decrease in decomposition rates from oxic to anoxic conditions than LDM-standard and, for some species, smaller anaerobic decomposition rates. Figure 4a shows k0 estimated by LDM-standard and k0 predicted by HPM-standard versus water table depths below the litterbags reported in the studies for species with at least three litterbag experiments. Regression lines were fitted to both sets of k0 values, and they indicate a steeper slope on average for HPM-standard than for LDM-standard for many species (with large uncertainties). Moreover, under anoxic conditions (negative water table depth), k0 estimates by LDM-standard are larger on average for many of the litterbag experiments than what HPM-standard predicts (Fig. 4b).
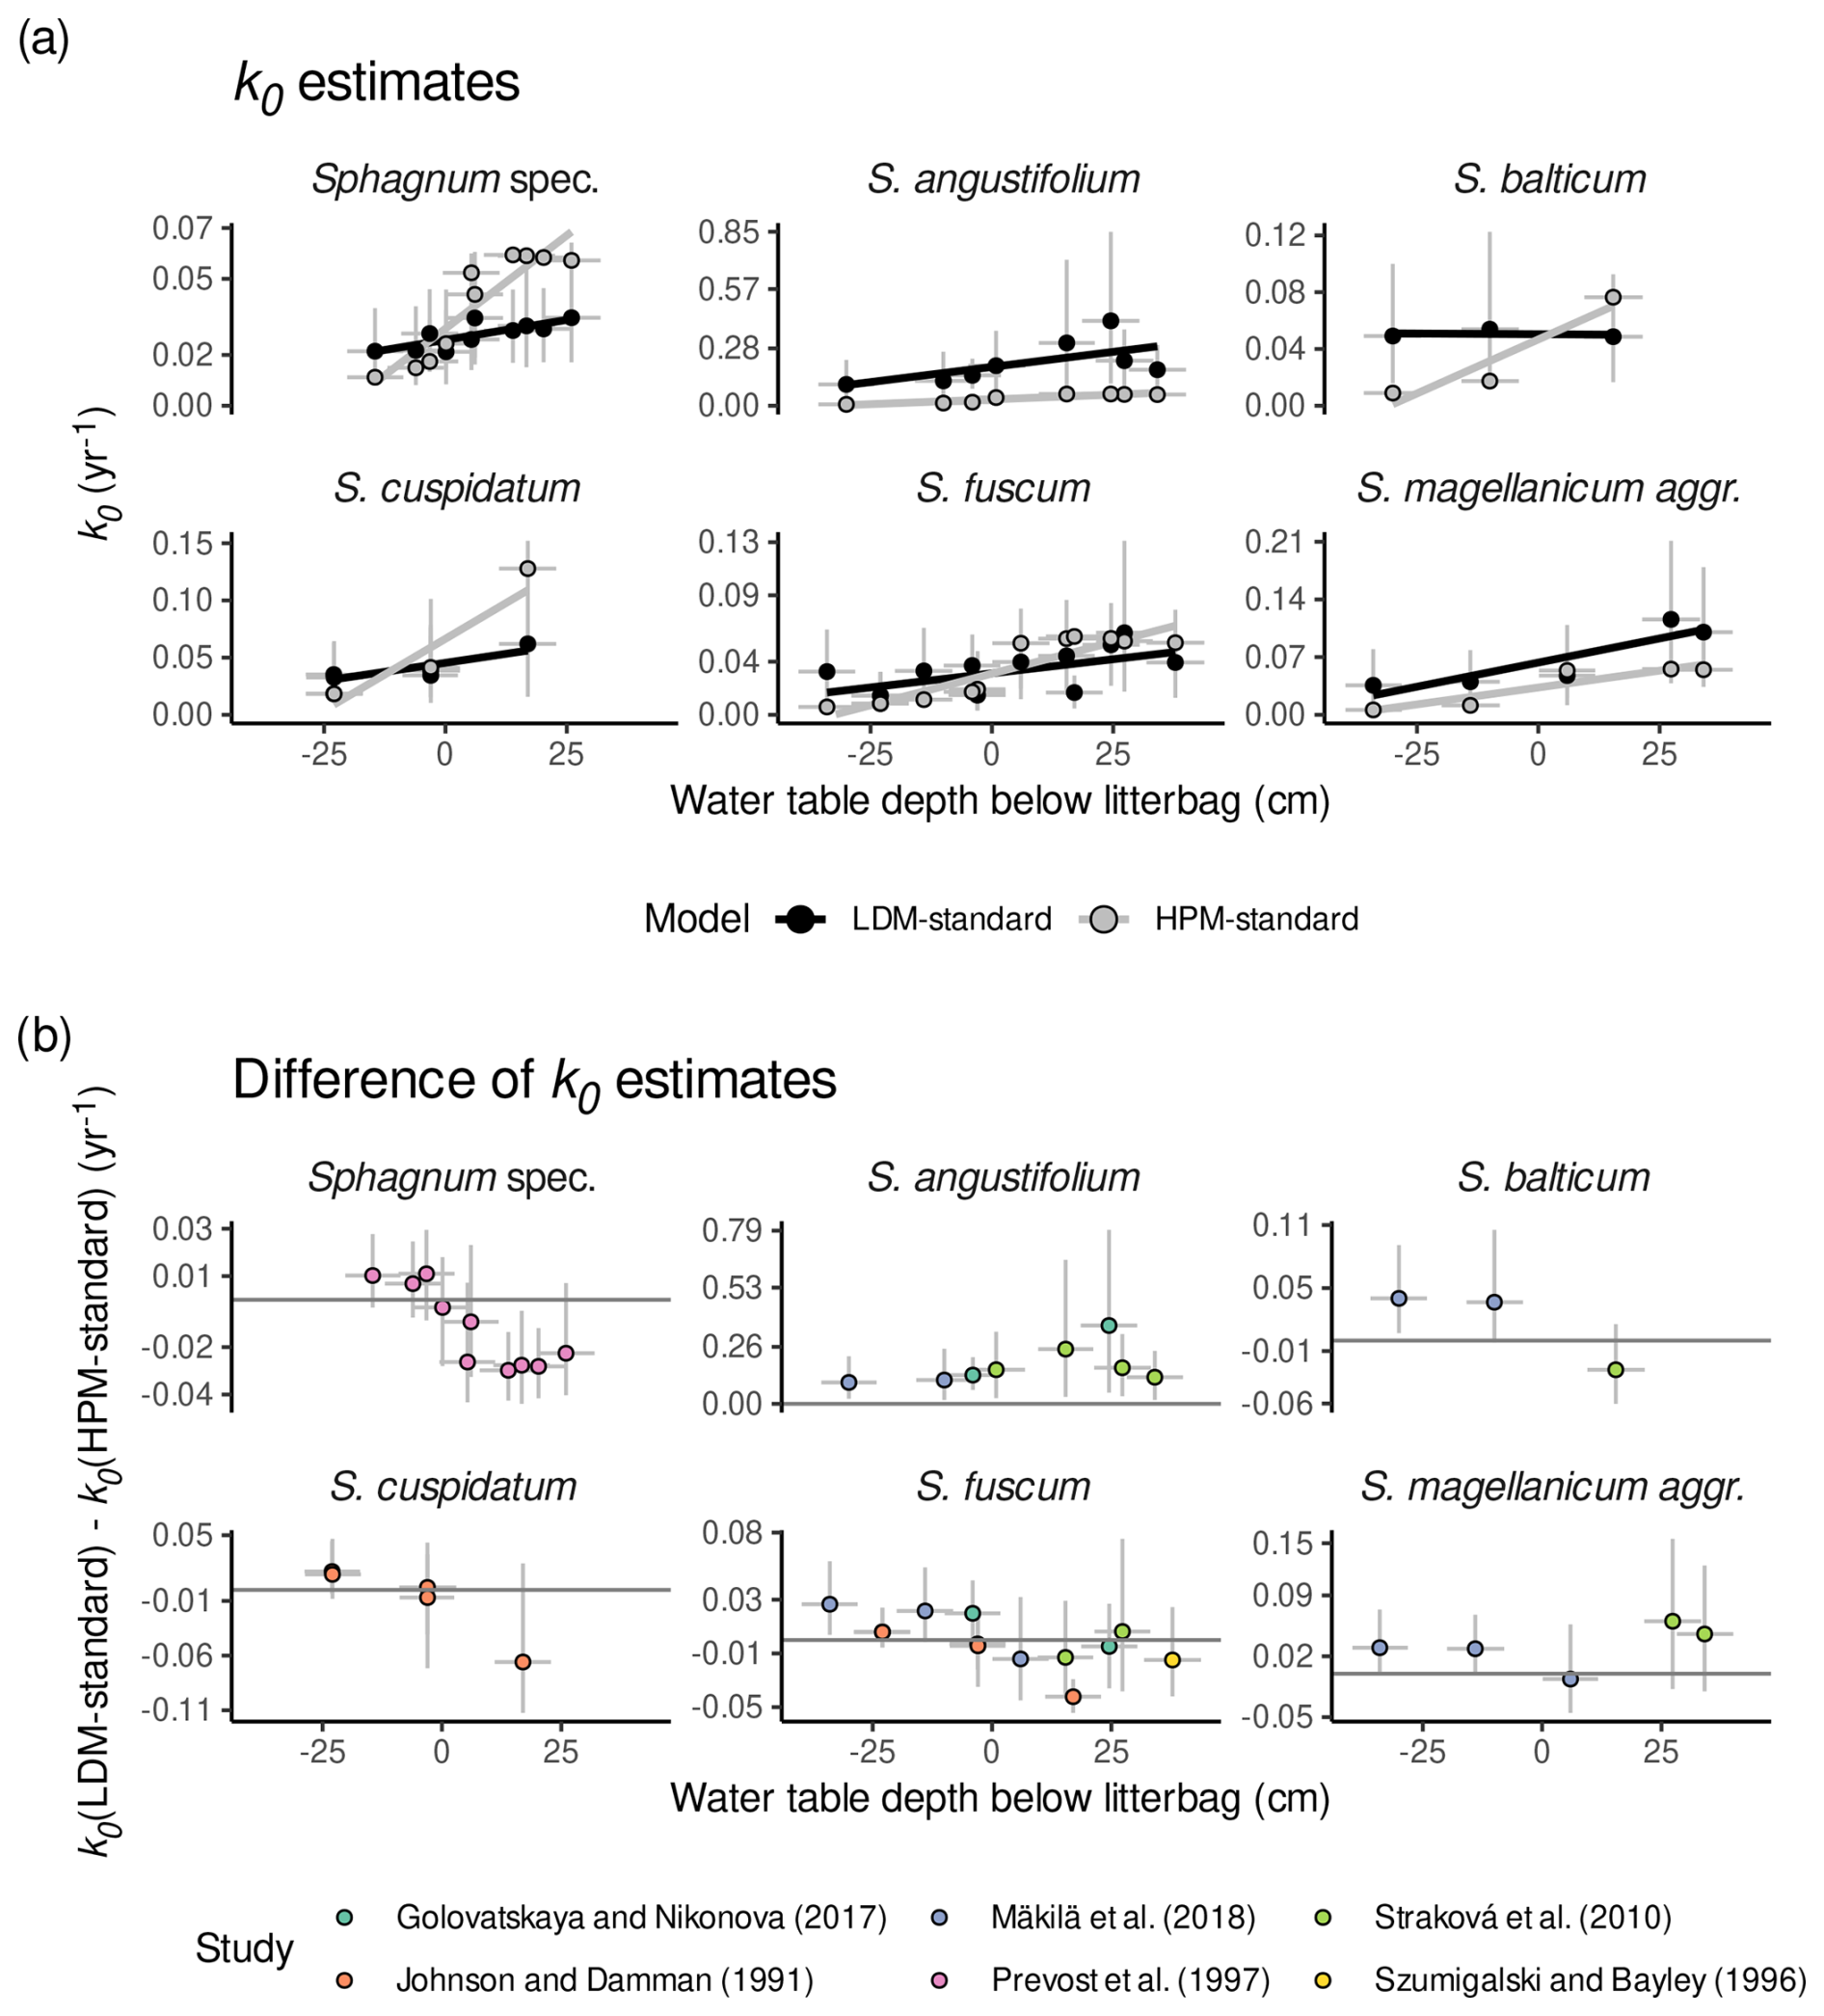
Figure 4Comparison of k0 estimates of HPM-standard and LDM-standard (Table 3) for species with at least three litterbag experiments. (a) k0 estimates of HPM-standard (gray) and k0 estimates of LDM-standard (black) versus reported average water table depths below the litterbags (negative values represent litterbags placed below the water table; positive values represent litterbags placed above the water table in the unsaturated zone). (b) k0 estimates of LDM-standard minus k0 estimates of HPM-standard versus reported average water table depths below the litterbags (i.e., the difference of the values shown in panel (a)). Gray horizontal lines indicate a difference in k0 of 0 yr−1. Points represent average estimates, and error bars represent 95 % posterior intervals. Lines are predictions of linear models fitted to the average estimates. Sphagnum spec. are samples that have been identified only to the genus level.
A comparison of k0 estimates of HPM-standard and the other modifications of the HPM decomposition module suggests that, when HPM decomposition module parameters are estimated, larger anaerobic decomposition rates and a less steep decrease in decomposition rates from oxic to anoxic conditions are predicted, similarly to LDM-standard. We computed the difference in k0 predicted by HPM-standard and the other HPM decomposition module versions (Fig. 5). When the HPM decomposition module with standard parameter values is used as prior for the litterbag decomposition module (HPM-peat), it predicts a k0 value nearly identical to that of HPM-standard. In contrast, both model versions where HPM decomposition module parameters were estimated predict larger anaerobic decomposition rates and less of an increase under oxic conditions relative to anoxic conditions than HPM-standard. Thus, the HPM decomposition module with standard parameter values predicts a steeper decrease in decomposition rates from oxic to anoxic conditions and overall smaller anaerobic decomposition rates than LDM-standard and the models that estimate HPM decomposition module parameters from available litterbag data.
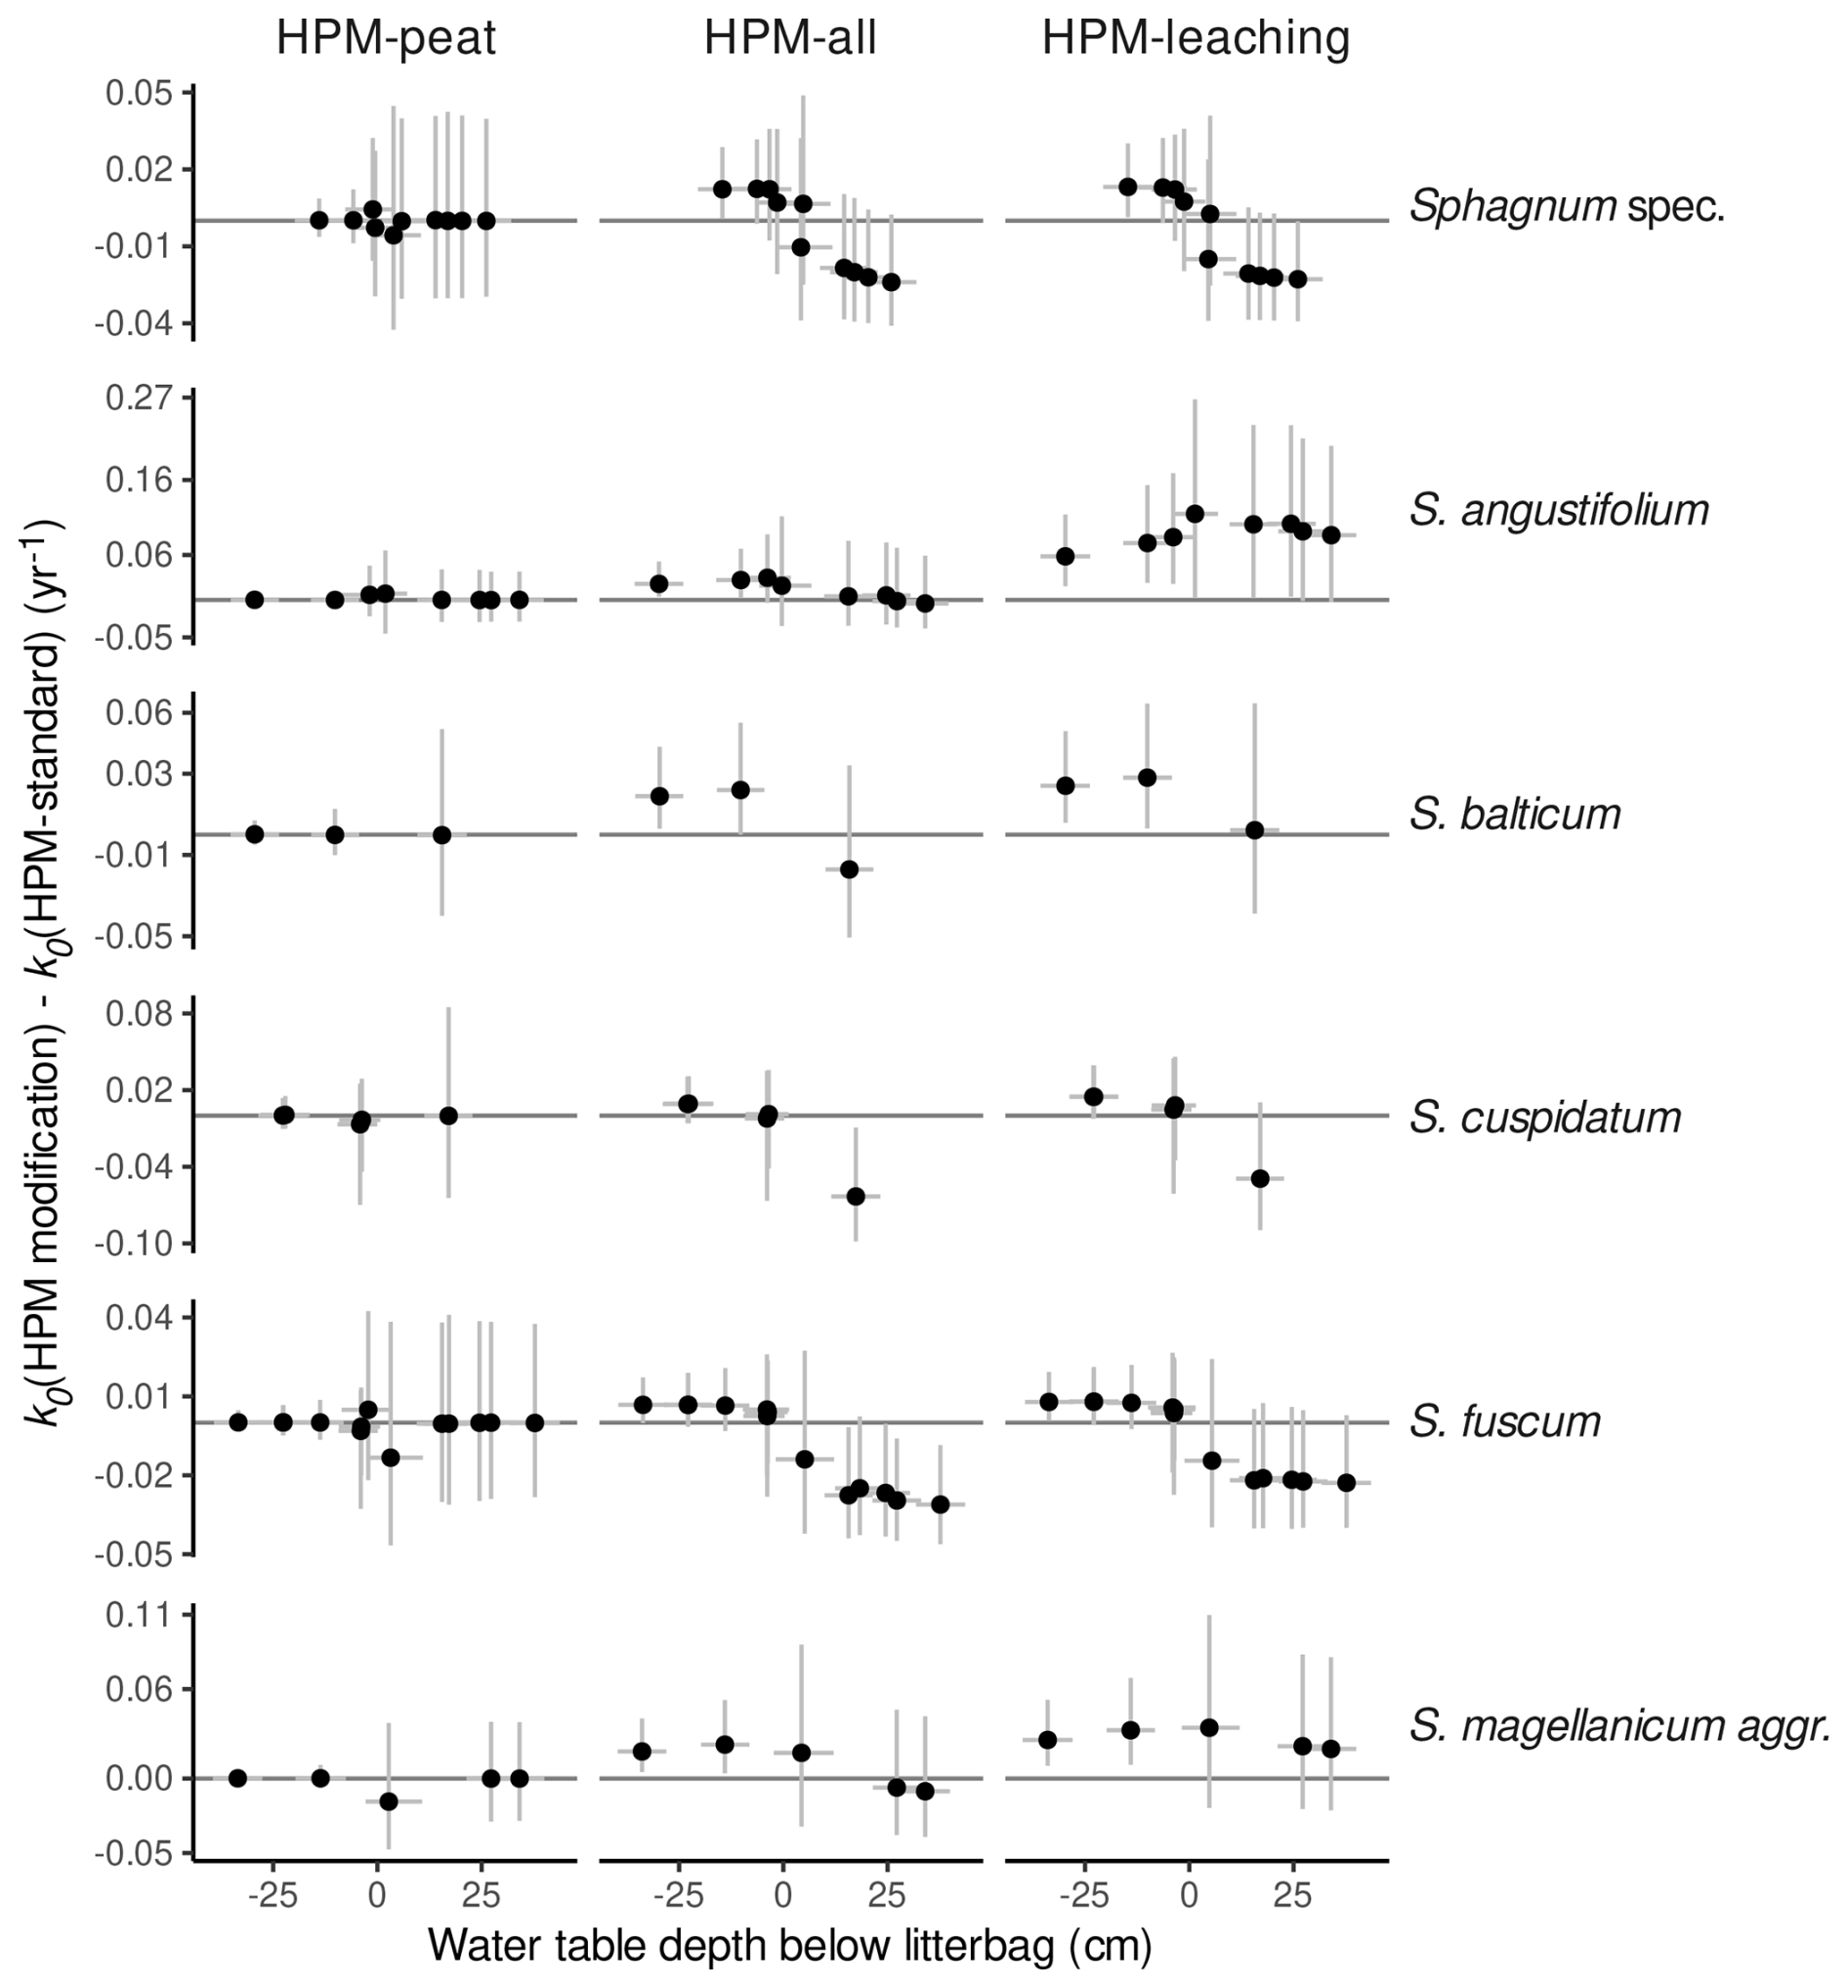
Figure 5k0 predicted by HPM decomposition module modifications (either HPM-peat, HPM-all, or HPM-leaching) minus k0 predicted by the HPM decomposition module with standard parameter values (HPM-standard) versus estimated average water table depths below the litterbags (negative values represent litterbags placed below the water table; positive values represent litterbags placed above the water table in the unsaturated zone). Points represent average estimates, and error bars represent 95 % posterior intervals. Sphagnum spec. are samples that have been identified only to the genus level. Only data for species with at least three replicates are shown.
3.5 HPM decomposition module parameters that are responsible for the less steep gradient in decomposition rates from oxic to anoxic conditions
To analyze which of the HPM decomposition module parameters (c1, Wopt, fmin, c2) cause the less steep gradient in decomposition rates from oxic to anoxic conditions, we conducted a sensitivity analysis, where we made predictions with HPM-leaching for the same species and the same gradient from oxic to anoxic conditions, each time setting one of the four parameters to their standard values (four sets of predictions in total). We then computed the difference in the predicted k0 values to predictions of HPM-leaching (with no parameter value set to its standard value). This difference is plotted versus the depth of the water table below the litter, as shown in Fig. 6. This analysis suggests that Wopt and c2 cause the less steep gradient in decomposition rates from oxic to anoxic conditions, whereas the other two parameters have no qualitative influence.
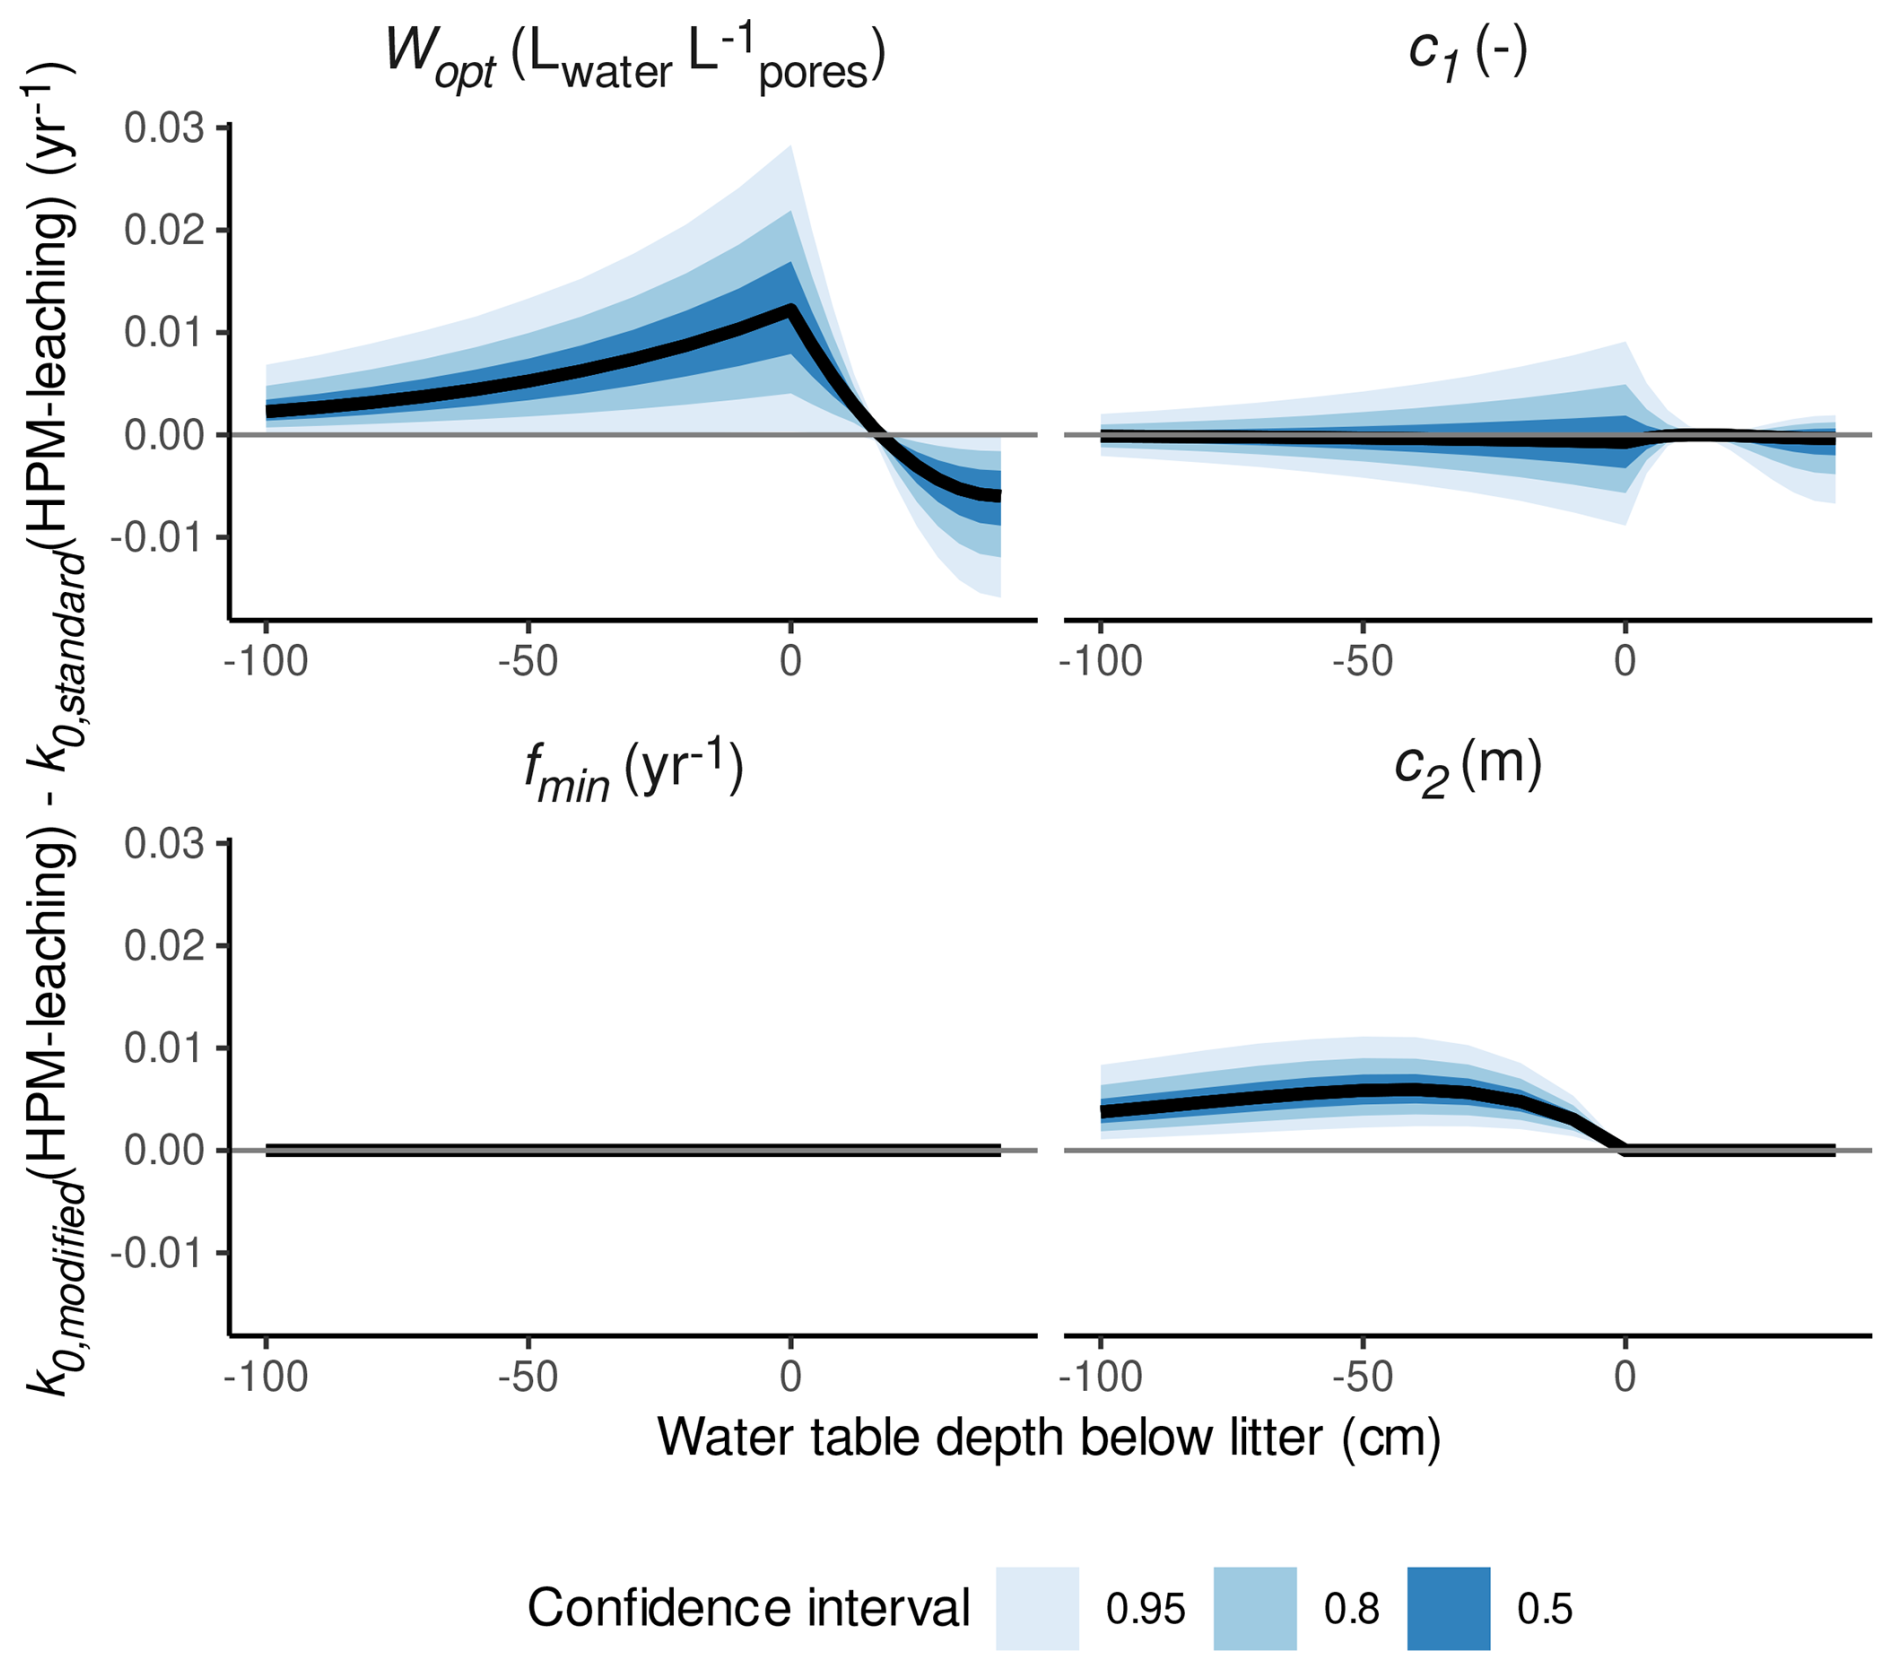
Figure 6Difference between decomposition rates for S. fuscum predicted with parameter values estimated by HPM-leaching (k0,modified(HPM-leaching)) and when setting the HPM decomposition module parameter in the panel title to its standard value (k0,standard(HPM-leaching)) versus the water table depth below the litter (negative values represent litter placed below the water table; positive values represent litter placed above the water table in the unsaturated zone). Panels show results when different parameters are set to their standard values. Positive means that decomposition rates are larger when using the estimated parameter value compared to using the standard parameter value. Shaded areas are central confidence intervals, with probabilities given in the figure legend.
3.6 Relation of l0 to the degree of saturation
In model HPM-leaching, we included a logistic regression model that estimates the relation between l0 and the degree of saturation. The parameter estimates suggest that both positive and negative relations of l0 to the degree of saturation are compatible with available litterbag data (95 % confidence intervals for the slope (logit scale): ). Thus, available litterbag data do not allow us to conclude whether l0 is positively related to the degree of saturation or not.
Our aims were to test whether the HPM decomposition module fits decomposition rates estimated from available litterbag experiments, to estimate HPM decomposition module parameters from available litterbag experiments, to understand what factors could cause differences in parameter estimates to the standard values, and to check whether the estimates from litterbag data could imply significant differences in peat accumulation predicted by the HPM compared to the standard parameter values.
The parameter estimates derived from available litterbag data suggest differences in the control of decomposition rates compared to the standard parameter values: the HPM decomposition module with standard parameter values predicts a steeper decrease in decomposition rates from oxic to anoxic conditions and smaller anaerobic decomposition rates for several species than estimated from LDM-standard and the models that estimate HPM decomposition module parameters from available litterbag data. These differences imply larger estimates for Wopt, the degree of saturation where decomposition rates are maximal, and c2, the anoxia scale length (the parameter that controls how strong decomposition rates decrease below the water table depth). We will show here, by comparing parameter estimates to results from sensitivity analyses of the HPM, that the new parameter estimates can cause large differences in long-term peat accumulation predicted by the HPM.
Our analysis suggests that the HPM decomposition module with standard parameter values fits available litterbag data, but our modifications, where Wopt, c2, and (for some species) k0,i estimates significantly differ from the standard values, have equivalent fit. This can be explained by two mechanisms: firstly, the litterbag decomposition model explains mass loss by initial leaching and decomposition. Thus, remaining masses reported in a litterbag experiment can be fitted either by assuming a larger l0 and a smaller k0 or by assuming a smaller l0 and a larger k0. By this first mechanism, the litterbag decomposition model can first estimate k0 to agree with the HPM decomposition module and then adjust l0 to fit the remaining masses of the litterbag experiments. The second mechanism is the impact of the design of available Sphagnum litterbag experiments on the accuracy of l0 and k0 estimates: initial leaching losses can explain mass losses only at the start of the experiment (Eq. 2), but decomposition explains a continuous mass loss. It is therefore possible to estimate l0 and k0 accurately when remaining masses shortly after the start of the experiment are recorded, but the majority of litterbag experiments collect the first litterbags only after 6 months or later (Teickner et al., 2025a). This causes large errors in l0 and k0 estimates and therefore allows the model to adjust l0 and k0 by the first mechanism, such that all model versions have equivalent fit to remaining masses while also fitting decomposition rates suggested by different HPM decomposition module priors. Improved litterbag experiments are needed for more accurate tests of any peatland decomposition module and for obtaining parameter estimates accurate enough to allow even only approximate predictions of long-term peat accumulation. Applications of the HPM should consider this variability in parameter estimates compatible with available litterbag experiments.
In the next subsections, we firstly evaluate the reliability of our test. We discuss whether the identified parameter value differences could be an artifact of using heterogeneous litterbag data, and we discuss how compatible the new HPM decomposition module parameter estimates are with other studies that analyzed how decomposition rates differ in dependency of water availability or that estimated c2 from peat core data. Secondly, we address the remaining aims: we discuss what factors could cause the larger anaerobic decomposition rates and, in some cases, smaller aerobic decomposition rates estimated by the litterbag decomposition model, and we discuss what implications the differences between estimated and standard parameter values have for peat accumulation predicted by the HPM. Finally, we give recommendations for improving tests of peat decomposition modules.
4.1 Reliability of the identified discrepancies
Before analyzing potential causes of the discrepancies found for c2 and Wopt, we first ask if combining different litterbag experiments is reliable evidence for the less steep gradient in decomposition rates from oxic to anoxic conditions.
If we take a look at the misfits of the standard HPM decomposition module (HPM-standard) shown in Fig. 4, many, but not all, underestimations of aerobic decomposition rates could have been caused by other factors: for example, for S. balticum, the difference may have been caused by differences in the two litterbag experiments from which we collected the data because the replicate with positive water table depth is from Straková et al. (2010), whereas the two others are from Mäkilä et al. (2018) (Fig. 4). The less pronounced gradient in measured decomposition rates above the water table depth is, however, also visible for S. fuscum replicates within the same study and is also similar across independent studies (Fig. 4 and Sect. S6 in the Supplement) (Johnson and Damman, 1991; Golovatskaya and Nikonova, 2017; Mäkilä et al., 2018), indicating that this pattern cannot be explained in all cases by differences between studies. In addition, during the cross-validation, we removed data from individual studies from the model, and the remaining subsets still resulted in similar estimates for c2 and Wopt (Fig. S12 in the Supplement). Finally, numerous previous studies suggest that water table depth is an important control of decomposition rates (e.g., Blodau et al., 2004); therefore one may also expect that, between different studies, decomposition rate differences should be controlled to a large degree by differences in water table depths. Thus, even with the heterogeneous litterbag data currently available, a less steep gradient of decomposition rates from oxic to anoxic conditions appears to be replicable between studies and species. To fully rule out that this pattern may be biased by heterogeneous litterbag data and biases of the litterbag decomposition model, controlled litterbag experiments that systematically estimate decomposition rates along the gradient from oxic to anoxic conditions are needed.
The Wopt estimate suggested by HPM-leaching is near the average optimum of heterotrophic respiration estimated across a range of mineral soils (Moyano et al., 2013). The estimate is also in line with a study where the largest decomposition rates of the same litter type were observed at or just above the average water table level in hummocks (Belyea, 1996) and with maximum CO2 production rates around 13 cm above the water table level in a mesocosm study (Blodau et al., 2004). According to the ModGberg model, the degree of saturation at this depth is near the Wopt estimate suggested by HPM-all and HPM-leaching. For example, for our simulation analysis used to produce Fig. 6, the average Wopt estimated by model HPM-leaching (0.57 ) is reached around 16 cm above the water table level, as shown in Fig. 7b. At shallower depths, the degree of saturation decreases below the Wopt estimate, and this would decrease decomposition rates as observed in Belyea (1996). In contrast, according to the ModGberg model, a degree of saturation corresponding to the standard Wopt value (0.45 ) is reached at shallower depths, and, in the same simulation with this standard Wopt value, no pronounced sub-surface peak in decomposition rates is observed (Fig. 7a). In hollows, the optimum degree of saturation suggested by HPM-leaching is reached near the surface for either Wopt value (Fig. S15 in the Supplement). Thus, a larger value for Wopt would be compatible with results from several previous studies.
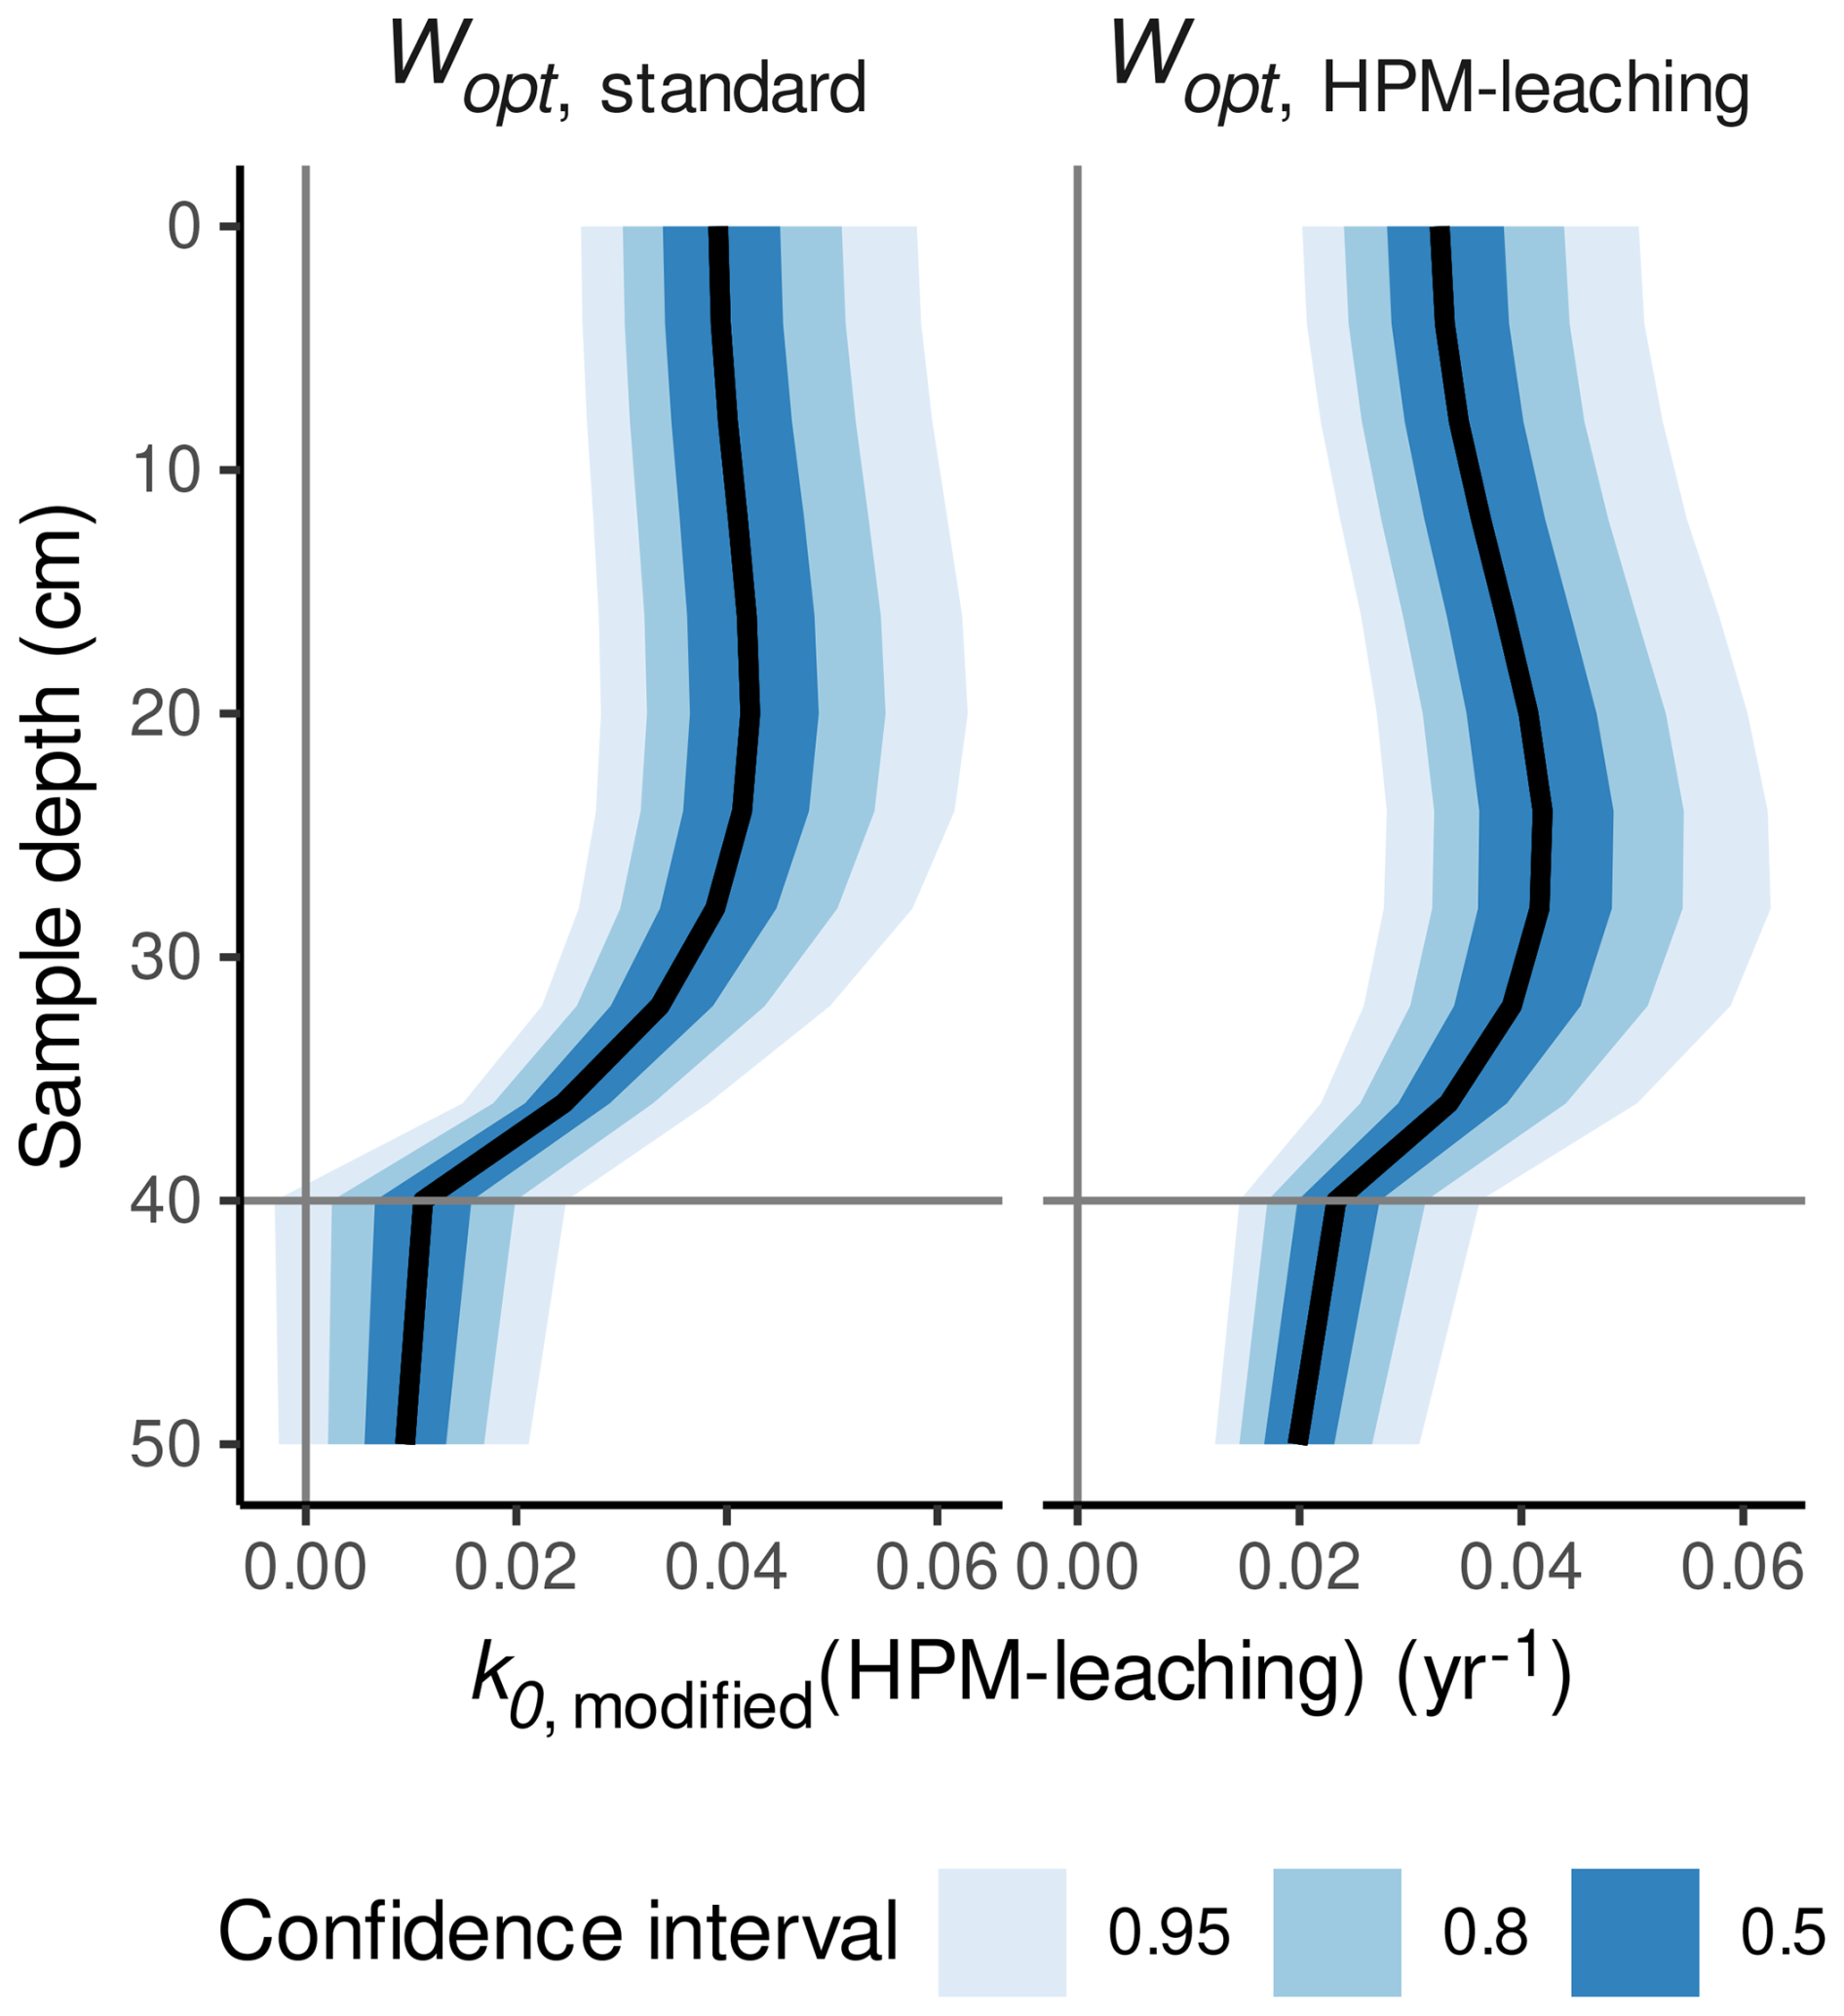
Figure 7Decomposition rates predicted with HPM-leaching (k0,modified(HPM-leaching)) for S. fuscum (hummocks), using either the standard value for Wopt or the Wopt value estimated by HPM-leaching versus depth of the litter below the peat surface. The horizontal line is the average water table depth. Shaded areas are central confidence intervals, with probabilities given in the figure legend.
Larger and smaller c2 values than the standard value have been estimated for several peatland cores with the HPM and for a modified version with monthly time steps (Quillet et al., 2015; Treat et al., 2021, 2022). Smaller values have been estimated for tropical peatlands (Kurnianto et al., 2015). To our knowledge, no litterbag experiment directly estimated c2. A difficulty is that available litterbag experiments cover only a comparatively small depth range below the water table level (at most around 30 cm; Fig. 4); therefore gradients in anaerobic decomposition rates across larger depths below the water table currently cannot be estimated with available litterbag data.
The estimates for the maximum possible decomposition rate (k0,i) have large errors, and the removal of data during the cross-validation caused larger relative differences in k0,i estimates compared to Wopt and c2 estimates (Fig. S12). On the one hand, this variability indicates that available litterbag data are not sufficient to estimate k0,i accurately and that our assignment of Sphagnum species to HPM PFTs may not be optimal, but, on the other hand, this variability may also indicate that categorizing Sphagnum species into three PFTs may not accurately describe the variability in maximum possible decomposition rates. Several studies suggest that diverse aspects of litter chemistry may increase k0,i (Turetsky et al., 2008; Bengtsson et al., 2018). However, we are not aware of studies that systematically analyze what factors control k0,i within the same species.
4.2 Water table fluctuations may explain the discrepancies in c2 and Wopt and in larger anaerobic and smaller aerobic decomposition rates
The HPM decomposition module predicts decomposition rates based on average annual water table depths (Frolking et al., 2010) and ignores water table fluctuations. Our evaluation of the HPM decomposition module also assumed an average water table depth during the litterbag experiments, and the HPM decomposition module translated this into a clear, pronounced transition between anaerobic and aerobic decomposition rates (Fig. 4). In reality, water table levels fluctuate, and this causes transient and nonlinear changes in decomposition rates due to variations in the availability of oxygen and other electron acceptors, the flushing of end products of anaerobic decomposition, and possibly other factors (Siegel et al., 1995; Blodau and Moore, 2003; Blodau et al., 2004; Beer and Blodau, 2007; Knorr and Blodau, 2009; Walpen et al., 2018; Campeau et al., 2021; Kim et al., 2021; Treat et al., 2022; Obradović et al., 2023). A possible explanation why the gradient in decomposition rates from oxic to anoxic decomposition is less steep across litterbag experiments, on average, than suggested by the standard HPM decomposition module could therefore be that an averaging effect of fluctuating water table levels on both aerobic and anaerobic decomposition rates is neglected by the HPM decomposition module. An additional factor may be that litterbags cover a depth range; therefore the decomposition rate estimate is an average over the depth covered by the litterbag. If moisture conditions vary over this depth, the decomposition rate estimate also averages over moisture conditions, with similar effects to the temporal average caused by water table fluctuations.
If this is the case, c2 would have to be re-interpreted as a transition parameter that accounts for both the limitation of anaerobic decomposition under anoxic conditions and the effects of periodically oxic conditions. Similarly, Wopt would have to be re-interpreted as the optimum average degree of saturation for decomposition under water table level variations, and its value would necessarily be different from the optimum degree of saturation for depolymerization under static degree of saturation.
Adjusting the HPM decomposition module parameters as implied by our modified models may be an easy way to account for the effect of sub-annual variation in water table levels on decomposition rates, if the discrepancies are caused by fluctuating water tables and if the model is representative for different effects variations in water table level may have on decomposition rates (e.g., short-term fluctuations compared to seasonal water table variations compared to prolonged droughts). What we have not considered due to limited data is that c2 can be expected to depend on long-term changes in groundwater flow (e.g., Siegel et al., 1995) or site-specific differences in hydrology and other factors (e.g., Frolking et al., 2010; Treat et al., 2021, 2022). Therefore, c2 can be expected to differ between litterbag studies, and our data only indicate that c2 is larger on average, whereas more research is necessary to estimate and understand site-specific controls of c2 and how a change in hydrology controls c2. Similarly, Wopt may differ between sites and over time. It would be interesting to know whether litterbag experiments can quantify these controls and whether c2 estimated from litterbag experiments is generally larger in peatlands with larger water table fluctuations.
It is also worth mentioning that a modification of the HPM, HPM-Arctic (Treat et al., 2021), has a seasonally dynamic WTD, and this modification may account for at least a part of the discrepancies we observed here. Unfortunately, most available litterbag data do not report WTD at sufficient temporal resolution to test whether standard HPM parameter values are more compatible with litterbag data when such seasonal variations in WTD are considered.
4.3 Implications of the discrepancies in Wopt, c2, and k0,i for long-term C accumulation
A larger c2 implies larger anaerobic decomposition and may thus indicate that the HPM decomposition module underestimates anaerobic decomposition rates. Previous global and local sensitivity analyses, where HPM parameter values and environmental conditions were varied in broad ranges, identified c2 as influential for C accumulation in the HPM (Quillet et al., 2013a, b).
If c2 is varied within the range from the standard value (0.3 m) to the average posterior estimate from HPM-leaching (0.64 m), this would cause differences in predicted C accumulation of a maximum of ca. 20 % in the sensitivity experiment of Quillet et al. (2013a) (depending on precipitation; Fig. 1c in Quillet et al., 2013a). If values were changed across the complete posterior range compatible with litterbag data and if other HPM parameters were also varied, the effect would be even larger (Fig. 2c in Quillet et al., 2013a).
Due to parameter interactions and feedbacks, an increase in anaerobic decomposition rates can result in smaller or larger C accumulation of the HPM, depending on environmental conditions (Quillet et al., 2013a). Small anaerobic decomposition may cause a C accumulation that is too rapid, resulting in a low water table level, a thick aerobic zone, and thus smaller overall C accumulation after a longer time. Larger anaerobic decomposition may result in higher water table levels, and this can increase C accumulation in the long-term. Anaerobic decomposition that is too large decreases C accumulation (Quillet et al., 2013a).
A larger Wopt implies that the largest aerobic decomposition rates are reached under more saturated conditions. Wopt has not been identified as influential in a sensitivity analysis of the HPM (Quillet et al., 2013a), but, as shown above, it contributes to the less steep decrease in decomposition rates from oxic to anoxic conditions. Importantly, since the HPM does not have a seasonally resolved water table depth, the two sensitivity analyses did not consider how seasonal variations in the water table depth may control long-term C accumulation; consequently, the re-interpreted Wopt may be more important to long-term C accumulation than previously assumed. In addition, HPM-leaching suggests an average Wopt value of 0.57 , which is outside the range of values tested in Quillet et al. (2013a) (0.3 to 0.5 ). This implies that the sensitivity of long-term C accumulation to Wopt has been evaluated over a range that is too small.
A larger k0,i increases decomposition rates for a species, and Sphagnum k0,i values are particularly relevant for many peatlands because the bulk of the peat is Sphagnum peat. In the sensitivity analysis in Quillet et al. (2013b), k0,hummock had large interaction effects with other parameters of the HPM and therefore could either cause larger or smaller peat accumulation, depending on environmental conditions, other parameters, and what vegetation shifts occur in a specific case. Similarly to Wopt, our k0,i estimates have errors that are larger than the range of values tested in Quillet et al. (2013b). For example, for hummock Sphagnum species, k0,i was varied from 0.04 to 0.06 yr−1, whereas average estimates for k0,i of HPM-leaching for species assigned to the hummock PFT range from 0.04 to 0.19 yr−1. As mentioned above, this range of k0,i estimates may be biased because of the difficulty in assigning Sphagnum species to HPM PFTs, but, from a different perspective, this is an additional error source for k0,i estimates that should be considered in sensitivity analyses unless more evidence becomes available to define PFTs and their maximum possible decomposition rates.
A further aspect that needs to be considered is that HPM-all and HPM-leaching estimate parameter distributions based on available data, whereas existing studies defined fixed parameter values or ranges of parameter values based on expert knowledge. Based on Quillet et al. (2013a), the uncertainties would cause non-negligible differences in predicted long-term C accumulation. For example, values within the uncertainty range of c2 estimated by HPM-leaching ((0.4, 0.97), 95 % confidence interval) would imply differences up to 100 kg m−2 of accumulated C over 5000 years in some simulations (with a maximum total accumulation of ca. 430 kgC m−2; Fig. 1c in Quillet et al., 2013a). Simulations of remaining masses for different Sphagnum species under different conditions also indicate large uncertainties in predicted remaining masses (Sect. S9 in the Supplement). This implies that more work is required to estimate parameters accurately enough to detect even relatively large differences among peatland models and between model predictions and peat cores.
Summarized, based on existing sensitivity analyses of the HPM, the parameter discrepancies suggested by HPM-all and HPM-leaching can translate into non-negligible differences in long-term C accumulation rates. They also imply gaps in previous sensitivity analyses of the HPM, namely that Wopt and possibly k0,i (for some species) have been analyzed over a value range that is too restricted and may play a more important role if water table fluctuations are taken into account.
4.4 How can we improve tests of peatland decomposition modules?
We suggest the following steps to improve accuracy when estimating peatland decomposition module parameters:
-
High-temporal-resolution measurements of WTD. For many available litterbag studies, it is not clear whether reported WTD estimates are unbiased estimates of average WTD (i.e., are derived from high-resolution measurements during the incubation) or biased (due to a temporal resolution or coverage that is too small). This limitation could be reduced by reporting high-temporal-resolution WTD measurements along litterbag experiments. Such data are also necessary to investigate whether HPM decomposition module parameters are controlled by WTD fluctuations.
-
Eliminating the need for auxiliary models to estimate the degree of saturation. There is a lack of data on the degree of saturation (or porosity and volumetric water content, from which the degree of saturation could be computed) for available litterbag experiments. For this reason, we used the modified Granberg model to estimate the degree of saturation based on reported WTD and an assumed peat porosity. The modified Granberg model, reported WTD, and our assumed peat porosity are error sources for our test. This limitation could be reduced by measurements of peat porosity and high-temporal-resolution measurements of volumetric water content during litterbag experiments.
-
Implementing a standard for how to assign Sphagnum species to model PFTs. The HPM does not specify how to assign Sphagnum species to PFTs (Frolking et al., 2010), which makes it difficult to compare litterbag experiments to parameters for HPM PFTs. Ideally, peatland models should provide lists of species they assign to certain PFTs to facilitate tests. Moreover, available niche data used here to assign species to PFTs may be biased by short-term measurements during summer that are not in line with average niches defined in peatland models, similarly to how transfer models for testate amoebae are suggested to be biased (Swindles et al., 2015).
-
Decreasing errors in k0 and l0 estimates from litterbag experiments. Our analysis suggests that a comparatively large range of c2, Wopt, and k0,i estimates in the HPM decomposition module are compatible with available litterbag data because errors in remaining masses are large enough to support a range of k0 and l0 estimates and because of deficiencies in the design of the litterbag experiments. As a consequence, k0 estimates of the litterbag decomposition model can be adjusted to fit predictions of the HPM decomposition module for a range of HPM decomposition module parameter values. We also assume that, because of these large errors and a large variability in initial leaching losses due to differences in litter handling (Teickner et al., 2025a), we could not detect an expected positive relation of l0 to the degree of saturation (Lind et al., 2022). Future litterbag experiments that aim to improve peatland models should reduce errors of k0 and l0 estimates. A first step would, for example, be to modify litterbag experiments as described in Teickner et al. (2025a).
-
Systematic litterbag experiments along the gradient from oxic to anoxic conditions. There are few litterbag experiments available that systematically analyze how decomposition rates differ along the gradient from oxic to anoxic conditions. Problems are that many studies test only few conditions and do not cover depth ranges large enough to estimate the minimum decomposition rate (fmin) and c2. An ideal study would use litter material of the same species and origin (thus making sure k0,i would be the same for all replicates) and systematically record remaining masses under different degrees of saturation in the same peat material to accurately estimate Wopt and c1. Another ideal study would systematically record remaining masses at many depth levels, and deeper than 30 cm below the average annual WTD, to allow the accurate estimation of c2. Similar experiments could be used to estimate how WTD fluctuations affect decomposition rates along the gradient from oxic to anoxic conditions and how this would change estimates for Wopt and c2.
-
Understanding the controls of k0,i. Values of k0,i can be assumed to be controlled, among other factors, by litter chemistry. Even though there are studies that analyze how litter chemistry controls decomposition rates (e.g., Turetsky et al., 2008), there are few that do this systematically (e.g., Bengtsson et al., 2018); they do not consider initial leaching losses and thus may confound initial leaching and decomposition, both of which may depend on initial litter chemistry. Studies that systematically change litter chemistry within species would be required to estimate k0,i (e.g., Siegenthaler et al., 2010; Straková et al., 2010). These estimates would also be useful to define PFT for decomposition modules.
-
Understanding how c2 and Wopt vary between sites and in dependency of peat characteristics. Too few litterbag experiments with too few replicates are available to estimate c2 and Wopt separately for individual sites (or how they may vary over time). Systematic litterbag experiments are needed to estimate how environmental conditions control the magnitude of these parameters, for example, due to temporal variations in water and oxygen availability or differences in the availability of alternative electron acceptors under anoxic conditions.
Systematic and high-quality litterbag experiments that are designed specifically to test peatland decomposition modules are required to achieve these improvements. To support the design of such experiments, we created an R package (hpmdpredict; Sect. S10 in the Supplement) that allows us to make predictions with HPM-leaching for hypothetical litterbag experiments and change parameter values (Teickner and Knorr, 2025). This could, for example, be useful to estimate the sample sizes that are required to detect specific differences in remaining masses, to test to what extent litterbag experiments are compatible with HPM-leaching, or to analyze the effect of changing HPM decomposition module parameter values from the standard values or from our estimates.
Based on the litterbag data, our estimates for the degree of saturation where decomposition is optimal (Wopt) and the anoxia scale length (c2) are significantly larger than the standard parameter values. Moreover, maximum possible decomposition rates (k0,i) for individual species are overall more variable than implied by the standard HPM decomposition module parameter values. According to previous sensitivity analyses, these parameter estimates imply differences in predicted C accumulation rates of up to 100 kgC m−2 over 5000 years (with a maximum total C accumulation of ca. 430 kgC m−2) when compared to the standard parameter values. The differences in HPM parameter estimates imply larger anaerobic decomposition rates for several species and a less steep gradient of decomposition rates from oxic to anoxic conditions. This pattern may be caused by water table fluctuations, differences in groundwater flow, or spatial averaging in litterbag experiments, factors that are currently not explicitly considered both in the HPM decomposition module and in available litterbag experiments.
Our analysis suggests that the HPM decomposition module with standard parameter values fits available Sphagnum litterbag data, but model versions where HPM decomposition module parameters were estimated from available litterbag data have an equivalent fit. This is caused by two mechanisms: firstly, remaining masses in litterbag experiments can be explained by initial leaching losses and decomposition. If remaining masses are reported only some time after the initial leaching loss has happened, they can be explained either by small initial leaching losses and a large decomposition rate or by large initial leaching losses and a smaller decomposition rate. Secondly, the majority of available Sphagnum litterbag experiments report remaining masses only a long time after the initial leaching loss happened. Taken together, this means that available litterbag data are compatible with a broad range of decomposition rates suggested by HPM decomposition module versions with large differences in parameter values. Improved litterbag experiments are needed for more accurate tests of any peatland decomposition module and for obtaining parameter estimates accurate enough to allow even only approximate predictions of long-term peat accumulation. Applications of the HPM and any other peatland model that relies on litterbag data to parameterize its decomposition process should consider that a broad range of decomposition module parameter values is compatible with available litterbag experiments.
The modeling approach used here can be combined with different data sources and peatland decomposition modules and may therefore serve as a blueprint for future tests and to obtain more accurate parameter estimates once improved litterbag experiments are available. In light of the large differences in long-term peat accumulation suggested by the parameter estimates, we conclude that it is worth conducting such litterbag experiments, not only to improve the decomposition module of the HPM, but to improve peatland models in general.
Data and code used to reproduce this article are available at https://doi.org/10.5281/ZENODO.14723909 (Teickner et al., 2025b). The data used in this study are derived from https://doi.org/10.5281/ZENODO.11276065 (Teickner and Knorr, 2024). An R package to make predictions for litterbag experiments with the model HPM-leaching is available at https://doi.org/10.5281/ZENODO.14724314 (Teickner and Knorr, 2025).
The supplement related to this article is available online at https://doi.org/10.5194/esd-16-891-2025-supplement.
HT: conceptualization, methodology, software, validation, formal analysis, investigation, data curation, writing (original draft), visualization, project administration. EP: supervision, funding acquisition, writing (review and editing). KHK: supervision, funding acquisition, writing (review and editing).
The contact author has declared that none of the authors has any competing interests.
Publisher's note: Copernicus Publications remains neutral with regard to jurisdictional claims made in the text, published maps, institutional affiliations, or any other geographical representation in this paper. While Copernicus Publications makes every effort to include appropriate place names, the final responsibility lies with the authors.
This study was funded by the Deutsche Forschungsgemeinschaft (DFG, German Research Foundation) grant no. KN 929/23-1 to Klaus-Holger Knorr and grant no. PE 1632/18-1 to Edzer Pebesma.
This open-access publication was funded by the University of Münster.
This paper was edited by Sibyll Schaphoff and reviewed by three anonymous referees.
Asada, T. and Warner, B. G.: Surface Peat Mass and Carbon Balance in a Hypermaritime Peatland, Soil Sci. Soc. Am. J., 69, 549–562, https://doi.org/10.2136/sssaj2005.0549, 2005. a
Bartsch, I. and Moore, T. R.: A Preliminary Investigation of Primary Production and Decomposition in Four Peatlands near Schefferville, Québec, Can. J. Bot., 63, 1241–1248, https://doi.org/10.1139/b85-171, 1985. a
Bauer, I. E.: Modelling Effects of Litter Quality and Environment on Peat Accumulation over Different Time-Scales: Peat Accumulation over Different Time-Scales, J. Ecol., 92, 661–674, https://doi.org/10.1111/j.0022-0477.2004.00905.x, 2004. a
Beer, J. and Blodau, C.: Transport and Thermodynamics Constrain Belowground Carbon Turnover in a Northern Peatland, Geochim. Cosmochim. Ac., 71, 2989–3002, https://doi.org/10.1016/j.gca.2007.03.010, 2007. a
Belyea, L. R.: Separating the Effects of Litter Quality and Microenvironment on Decomposition Rates in a Patterned Peatland, Oikos, 77, 529–539, https://doi.org/10.2307/3545942, 1996. a, b
Bengtsson, F., Rydin, H., and Hájek, T.: Biochemical Determinants of Litter Quality in 15 Species of Sphagnum, Plant Soil, 425, 161–176, https://doi.org/10.1007/s11104-018-3579-8, 2018. a, b, c
Blodau, C. and Moore, T. R.: Experimental Response of Peatland Carbon Dynamics to a Water Table Fluctuation, Aquat. Sci., 65, 47–62, https://doi.org/10.1007/s000270300004, 2003. a
Blodau, C., Basiliko, N., and Moore, T. R.: Carbon Turnover in Peatland Mesocosms Exposed to Different Water Table Levels, Biogeochemistry, 67, 331–351, https://doi.org/10.1023/B:BIOG.0000015788.30164.e2, 2004. a, b, c
Bona, K. A., Hilger, A., Burgess, M., Wozney, N., and Shaw, C.: A Peatland Productivity and Decomposition Parameter Database, Ecology, 99, 2406–2406, https://doi.org/10.1002/ecy.2462, 2018. a
Bona, K. A., Shaw, C., Thompson, D. K., Hararuk, O., Webster, K., Zhang, G., Voicu, M., and Kurz, W. A.: The Canadian Model for Peatlands (CaMP): A Peatland Carbon Model for National Greenhouse Gas Reporting, Ecol. Model., 431, 109164, https://doi.org/10.1016/j.ecolmodel.2020.109164, 2020. a
Breeuwer, A., Heijmans, M., Robroek, B. J. M., Limpens, J., and Berendse, F.: The Effect of Increased Temperature and Nitrogen Deposition on Decomposition in Bogs, Oikos, 117, 1258–1268, https://doi.org/10.1111/j.0030-1299.2008.16518.x, 2008. a
Campeau, A., Vachon, D., Bishop, K., Nilsson, M. B., and Wallin, M. B.: Autumn Destabilization of Deep Porewater CO2 Store in a Northern Peatland Driven by Turbulent Diffusion, Nat. Commun., 12, 6857, https://doi.org/10.1038/s41467-021-27059-0, 2021. a
Chaudhary, N., Miller, P. A., and Smith, B.: Biotic and Abiotic Drivers of Peatland Growth and Microtopography: A Model Demonstration, Ecosystems, 21, 1196–1214, https://doi.org/10.1007/s10021-017-0213-1, 2018. a
Clymo, R. S., Turunen, J., and Tolonen, K.: Carbon Accumulation in Peatland, Oikos, 81, 368–388, https://doi.org/10.2307/3547057, 1998. a
Frolking, S., Roulet, N. T., Moore, T. R., Richard, P. J. H., Lavoie, M., and Muller, S. D.: Modeling Northern Peatland Decomposition and Peat Accumulation, Ecosystems, 4, 479–498, https://doi.org/10.1007/s10021-001-0105-1, 2001. a, b, c, d, e, f, g
Frolking, S., Roulet, N. T., Tuittila, E., Bubier, J. L., Quillet, A., Talbot, J., and Richard, P. J. H.: A new model of Holocene peatland net primary production, decomposition, water balance, and peat accumulation, Earth Syst. Dynam., 1, 1–21, https://doi.org/10.5194/esd-1-1-2010, 2010. a, b, c, d, e, f, g, h, i, j, k, l, m, n, o, p, q, r, s, t, u
Frolking, S., Talbot, J., Jones, M. C., Treat, C. C., Kauffman, J. B., Tuittila, E.-S., and Roulet, N.: Peatlands in the Earth's 21st Century Climate System, Environ. Rev., 19, 371–396, https://doi.org/10.1139/a11-014, 2011. a
Gelman, A., Carlin, J., Stern, H., Dunson, D., Vehtari, A., and Rubin, D. B.: Bayesian Data Analysis, Chapman & Hall/CRC Texts in Statistical Science, 3rd edition, CRC Press, Boca Raton, https://doi.org/10.1201/b16018, 2014. a
Golovatskaya, E. A. and Nikonova, L. G.: The Influence of the Bog Water Level on the Transformation of Sphagnum Mosses in Peat Soils of Oligotrophic Bogs, Eurasian Soil Sci.+, 50, 580–588, https://doi.org/10.1134/S1064229317030036, 2017. a, b, c
Granberg, G., Grip, H., Löfvenius, M. O., Sundh, I., Svensson, B. H., and Nilsson, M.: A Simple Model for Simulation of Water Content, Soil Frost, and Soil Temperatures in Boreal Mixed Mires, Water Resour. Res., 35, 3771–3782, https://doi.org/10.1029/1999WR900216, 1999. a, b
Hagemann, U. and Moroni, M. T.: Moss and Lichen Decomposition in Old-Growth and Harvested High-Boreal Forests Estimated Using the Litterbag and Minicontainer Methods, Soil Biol. Biochem., 87, 10–24, https://doi.org/10.1016/j.soilbio.2015.04.002, 2015. a
Hassel, K., Kyrkjeeide, M. O., Yousefi, N., Prestø, T., Stenøien, H. K., Shaw, J. A., and Flatberg, K. I.: Sphagnum Divinum (Sp. Nov.) and S. Medium Limpr. and Their Relationship to S. Magellanicum Brid., J. Bryol., 40, 197–222, https://doi.org/10.1080/03736687.2018.1474424, 2018. a
Hayward, P. M. and Clymo, R. S.: Profiles of Water Content and Pore Size in Sphagnum and Peat, and Their Relation to Peat Bog Ecology, P. Roy. Soc. Lond. B Bio., 215, 299–325, 1982. a
Heijmans, M. M., Mauquoy, D., Van Geel, B., and Berendse, F.: Long-term Effects of Climate Change on Vegetation and Carbon Dynamics in Peat Bogs, J. Veg. Sci., 19, 307–320, https://doi.org/10.3170/2008-8-18368, 2008. a
Heinemeyer, A., Croft, S., Garnett, M. H., Gloor, E., Holden, J., Lomas, M. R., and Ineson, P.: The MILLENNIA Peat Cohort Model: Predicting Past, Present and Future Soil Carbon Budgets and Fluxes under Changing Climates in Peatlands, Clim. Res., 45, 207–226, https://doi.org/10.3354/cr00928, 2010. a
Hoffman, M. D. and Gelman, A.: The No-U-turn Sampler: Adaptively Setting Path Lengths in Hamiltonian Monte Carlo, J. Mach. Learn. Res., 15, 1593–1623, 2014. a
Johnson, L. C. and Damman, A. W. H.: Species-Controlled Sphagnum Decay on a South Swedish Raised Bog, Oikos, 61, 234, https://doi.org/10.2307/3545341, 1991. a, b, c
Johnson, M. G., Granath, G., Tahvanainen, T., Pouliot, R., Stenøien, H. K., Rochefort, L., Rydin, H., and Shaw, A. J.: Evolution of Niche Preference in Sphagnum Peat Mosses, Evolution, 69, 90–103, https://doi.org/10.1111/evo.12547, 2015. a, b, c
Kallioinen, N., Paananen, T., Bürkner, P.-C., and Vehtari, A.: Detecting and Diagnosing Prior and Likelihood Sensitivity with Power-Scaling, Stat. Comput., 34, 57, https://doi.org/10.1007/s11222-023-10366-5, 2024. a, b
Kettridge, N. and Baird, A.: In Situ Measurements of the Thermal Properties of a Northern Peatland: Implications for Peatland Temperature Models, J. Geophys. Res.-Earth, 112, F02019, https://doi.org/10.1029/2006JF000655, 2007. a, b, c
Kim, J., Rochefort, L., Hogue-Hugron, S., Alqulaiti, Z., Dunn, C., Pouliot, R., Jones, T. G., Freeman, C., and Kang, H.: Water Table Fluctuation in Peatlands Facilitates Fungal Proliferation, Impedes Sphagnum Growth and Accelerates Decomposition, Front. Earth Sci., 8, 579329, https://doi.org/10.3389/feart.2020.579329, 2021. a
Knorr, K.-H. and Blodau, C.: Impact of Experimental Drought and Rewetting on Redox Transformations and Methanogenesis in Mesocosms of a Northern Fen Soil, Soil Biol. Biochem., 41, 1187–1198, https://doi.org/10.1016/j.soilbio.2009.02.030, 2009. a
Kurnianto, S., Warren, M., Talbot, J., Kauffman, B., Murdiyarso, D., and Frolking, S.: Carbon Accumulation of Tropical Peatlands over Millennia: A Modeling Approach, Glob. Change Biol., 21, 431–444, https://doi.org/10.1111/gcb.12672, 2015. a, b
Lind, L., Harbicht, A., Bergman, E., Edwartz, J., and Eckstein, R. L.: Effects of Initial Leaching for Estimates of Mass Loss and Microbial Decomposition – Call for an Increased Nuance, Ecol. Evol., 12, e9118, https://doi.org/10.1002/ece3.9118, 2022. a, b, c
Liu, H. and Lennartz, B.: Hydraulic Properties of Peat Soils along a Bulk Density Gradient-A Meta Study, Hydrol. Process., 33, 101–114, https://doi.org/10.1002/hyp.13314, 2019. a
Loisel, J., van Bellen, S., Pelletier, L., Talbot, J., Hugelius, G., Karran, D., Yu, Z., Nichols, J., and Holmquist, J.: Insights and Issues with Estimating Northern Peatland Carbon Stocks and Fluxes since the Last Glacial Maximum, Earth-Sci. Rev., 165, 59–80, https://doi.org/10.1016/j.earscirev.2016.12.001, 2017. a
Mäkilä, M., Säävuori, H., Grundström, A., and Suomi, T.: Sphagnum Decay Patterns and Bog Microtopography in South-Eastern Finland, Mires Peat, 21, 1–12, https://doi.org/10.19189/MaP.2017.OMB.283, 2018. a, b, c, d
Morris, P. J., Baird, A. J., and Belyea, L. R.: The DigiBog Peatland Development Model 2: Ecohydrological Simulations in 2D, Ecohydrology, 5, 256–268, https://doi.org/10.1002/eco.229, 2012. a
Moyano, F. E., Manzoni, S., and Chenu, C.: Responses of Soil Heterotrophic Respiration to Moisture Availability: An Exploration of Processes and Models, Soil Biol. Biochem., 59, 72–85, https://doi.org/10.1016/j.soilbio.2013.01.002, 2013. a
Nichols, J. E. and Peteet, D. M.: Rapid Expansion of Northern Peatlands and Doubled Estimate of Carbon Storage, Nat. Geosci., 12, 917–921, https://doi.org/10.1038/s41561-019-0454-z, 2019. a
Obradović, N., Joshi, P., Arn, S., Aeppli, M., Schroth, M. H., and Sander, M.: Reoxidation of Reduced Peat Organic Matter by Dissolved Oxygen: Combined Laboratory Column-breakthrough Experiments and In-field Push-pull Tests, J. Geophys. Res.-Biogeo., 128, e2023JG007640, https://doi.org/10.1029/2023JG007640, 2023. a
Prevost, M., Belleau, P., and Plamondon, A. P.: Substrate Conditions in a Treed Peatland: Responses to Drainage, Écoscience, 4, 543–554, https://doi.org/10.1080/11956860.1997.11682434, 1997. a, b, c, d, e
Quillet, A., Frolking, S., Garneau, M., Talbot, J., and Peng, C.: Assessing the Role of Parameter Interactions in the Sensitivity Analysis of a Model of Peatland Dynamics, Ecol. Model., 248, 30–40, https://doi.org/10.1016/j.ecolmodel.2012.08.023, 2013a. a, b, c, d, e, f, g, h, i, j, k
Quillet, A., Garneau, M., and Frolking, S.: Sobol' Sensitivity Analysis of the Holocene Peat Model: What Drives Carbon Accumulation in Peatlands?, J. Geophys. Res.-Biogeo., 118, 203–214, https://doi.org/10.1029/2012JG002092, 2013b. a, b, c, d, e
Quillet, A., Garneau, M., Van Bellen, S., Frolking, S., and Tuittila, E.-S.: Integration of Palaeohydrological Proxies into a Peatland Model: A New Tool for Palaeoecological Studies, Ecohydrology, 8, 214–229, https://doi.org/10.1002/eco.1501, 2015. a
R Core Team: R: A Language and Environment for Statistical Computing, Vienna, Austria, https://www.R-project.org/ (last access: 29 April 2024), 2022. a
Rydin, H., Jeglum, J. K., and Bennett, K. D.: The Biology of Peatlands, Biology of Habitats, 2nd edn., Oxford University Press, Oxford, https://doi.org/10.1093/acprof:osobl/9780199602995.001.0001, 2013. a
Scheffer, R. A., Van Logtestijn, R. S. P., and Verhoeven, J. T. A.: Decomposition of Carex and Sphagnum Litter in Two Mesotrophic Fens Differing in Dominant Plant Species, Oikos, 92, 44–54, https://doi.org/10.1034/j.1600-0706.2001.920106.x, 2001. a
Siegel, D. I., Reeve, A. S., Glaser, P. H., and Romanowicz, E. A.: Climate-Driven Flushing of Pore Water in Peatlands, Nature, 374, 531–533, https://doi.org/10.1038/374531a0, 1995. a, b
Siegenthaler, A., Buttler, A., Bragazza, L., van der Heijden, E., Grosvernier, P., Gobat, J.-M., and Mitchell, E. A.: Litter- and Ecosystem-Driven Decomposition under Elevated CO2 and Enhanced N Deposition in a Sphagnum Peatland, Soil Biol. Biochem., 42, 968–977, https://doi.org/10.1016/j.soilbio.2010.02.016, 2010. a
Stan Development Team: Stan Modeling Language Users Guide and Reference Manual, version 2.32.2 2021a. a
Stan Development Team: RStan: The R Interface to Stan, version 2.32.5, 2021b. a
Straková, P., Anttila, J., Spetz, P., Kitunen, V., Tapanila, T., and Laiho, R.: Litter Quality and Its Response to Water Level Drawdown in Boreal Peatlands at Plant Species and Community Level, Plant Soil, 335, 501–520, https://doi.org/10.1007/s11104-010-0447-6, 2010. a, b, c, d
Swindles, G. T., Holden, J., Raby, C. L., Turner, T. E., Blundell, A., Charman, D. J., Menberu, M. W., and Kløve, B.: Testing Peatland Water-Table Depth Transfer Functions Using High-Resolution Hydrological Monitoring Data, Quaternary Sci. Rev., 120, 107–117, https://doi.org/10.1016/j.quascirev.2015.04.019, 2015. a
Szumigalski, A. R. and Bayley, S. E.: Decomposition along a Bog to Rich Fen Gradient in Central Alberta, Canada, Can. J. Bot., 74, 573–581, https://doi.org/10.1139/b96-073, 1996. a, b
Teickner, H. and Knorr, K.-H.: Peatland Decomposition Database (1.0.0), https://doi.org/10.5281/ZENODO.11276065, 2024. a, b, c
Teickner, H. and Knorr, K.-H.: hpmdpredict: Predictions with Model HPM-leaching from Teickner et al. (2024), Zenodo [code], https://doi.org/10.5281/ZENODO.14724314, 2025. a, b
Teickner, H., Pebesma, E., and Knorr, K.-H.: A synthesis of Sphagnum litterbag experiments: initial leaching losses bias decomposition rate estimates, Biogeosciences, 22, 417–433, https://doi.org/10.5194/bg-22-417-2025, 2025a. a, b, c, d, e, f, g, h, i, j, k, l, m, n
Teickner, H., Pebesma, E., and Knorr, K.-H.: Compendium of R Code and Data for “A Synthesis of Sphagnum Litterbag Experiments: Initial Leaching Losses Bias Decomposition Rate Estimates” and “Peat Oxic and Anoxic Controls of Sphagnum Decomposition Rates in the Holocene Peatland Model Decomposition Module Estimated from Litterbag Data”, Zenodo, https://doi.org/10.5281/ZENODO.14723909, 2025b. a
Thormann, M. N., Bayley, S. E., and Currah, R. S.: Comparison of Decomposition of Belowground and Aboveground Plant Litters in Peatlands of Boreal Alberta, Canada, Can. J. Bot., 79, 9–22, https://doi.org/10.1139/b00-138, 2001. a
Treat, C. C., Jones, M. C., Alder, J., Sannel, A. B. K., Camill, P., and Frolking, S.: Predicted Vulnerability of Carbon in Permafrost Peatlands with Future Climate Change and Permafrost Thaw in Western Canada, J. Geophys. Res.-Biogeo., 126, e2020JG005872, https://doi.org/10.1029/2020JG005872, 2021. a, b, c, d
Treat, C. C., Jones, M. C., Alder, J., and Frolking, S.: Hydrologic Controls on Peat Permafrost and Carbon Processes: New Insights from Past and Future Modeling, Frontiers in Environmental Science, 10, 892925, https://doi.org/10.3389/fenvs.2022.892925, 2022. a, b, c
Trinder, C. J., Johnson, D., and Artz, R. R.: Interactions among Fungal Community Structure, Litter Decomposition and Depth of Water Table in a Cutover Peatland, FEMS Microbiol. Ecol., 64, 433–448, https://doi.org/10.1111/j.1574-6941.2008.00487.x, 2008. a
Tuittila, E.-S., Juutinen, S., Frolking, S., Väliranta, M., Laine, A. M., Miettinen, A., Seväkivi, M.-L., Quillet, A., and Merilä, P.: Wetland Chronosequence as a Model of Peatland Development: Vegetation Succession, Peat and Carbon Accumulation, Holocene, 23, 25–35, https://doi.org/10.1177/0959683612450197, 2013. a
Turetsky, M. R., Crow, S. E., Evans, R. J., Vitt, D. H., and Wieder, R. K.: Trade-Offs in Resource Allocation among Moss Species Control Decomposition in Boreal Peatlands, J. Ecol., 96, 1297–1305, https://doi.org/10.1111/j.1365-2745.2008.01438.x, 2008. a, b
van Breemen, N.: How Sphagnum Bogs down Other Plants, Trends Ecol. Evol., 10, 270–275, https://doi.org/10.1016/0169-5347(95)90007-1, 1995. a
Vehtari, A., Gelman, A., Simpson, D., Carpenter, B., and Bürkner, P.-C.: Rank-Normalization, Folding, and Localization: An Improved for Assessing Convergence of MCMC (with Discussion), Bayesian Anal., 16, 667–718, https://doi.org/10.1214/20-BA1221, 2021. a
Vitt, D. H.: Growth and Production Dynamics of Boreal Mosses over Climatic, Chemical and Topographic Gradients, Bot. J. Linn. Soc., 104, 35–59, https://doi.org/10.1111/j.1095-8339.1990.tb02210.x, 1990. a
Walpen, N., Lau, M. P., Fiskal, A., Getzinger, G. J., Meyer, S. A., Nelson, T. F., Lever, M. A., Schroth, M. H., and Sander, M.: Oxidation of Reduced Peat Particulate Organic Matter by Dissolved Oxygen: Quantification of Apparent Rate Constants in the Field, Environ. Sci. Technol., 52, 11151–11160, https://doi.org/10.1021/acs.est.8b03419, 2018. a
Yu, Z., Turetsky, M., Campbell, I., and Vitt, D.: Modelling Long-Term Peatland Dynamics. II. Processes and Rates as Inferred from Litter and Peat-Core Data, Ecol. Model., 145, 159–173, https://doi.org/10.1016/S0304-3800(01)00387-8, 2001. a, b, c, d
Yu, Z. C.: Northern peatland carbon stocks and dynamics: a review, Biogeosciences, 9, 4071–4085, https://doi.org/10.5194/bg-9-4071-2012, 2012. a
Zhao, B., Zhuang, Q., Treat, C., and Frolking, S.: A Model Intercomparison Analysis for Controls on C Accumulation in North American Peatlands, J. Geophys. Res.-Biogeo., e2021JG006762, https://doi.org/10.1029/2021JG006762, 2022. a, b