the Creative Commons Attribution 4.0 License.
the Creative Commons Attribution 4.0 License.
 | 01 Sep 2025
A climate suitability index for species distribution modelling applied to terrestrial arthropods in the Mediterranean region
Monique Borg Inguanez
Erika Coppola
Aaron Micallef
David Mifsud
Climate change poses significant threats to global biodiversity, particularly impacting arthropods due to their sensitivity to shifts in temperature and precipitation, as well as other environmental conditions. These changes impact the suitability of their habitats, alter ecological interactions, and consequently affect the distribution and survival of species. Understanding how climate variability influences the ecological niches of arthropods is crucial for predicting future biodiversity patterns and implementing effective conservation strategies. This study introduces a simple index designed to model species' distribution on the basis of their climatic niche, with a specific focus on terrestrial Mediterranean arthropods. This approach leverages regional climate model data to construct a climatology of a species's preferred habitat, based on historically observed locations. This index offers a straightforward and rapid means to assess the resilience and vulnerability of arthropod populations and could be applied to future studies aiming to shed light on how climate change could affect the fundamental niches of terrestrial arthropods. The analysis revealed that the method is most reliable for species with observations exceeding 1000 points and climate datasets of high resolutions (although the latter had a smaller influence on the results). This study offers a proof of concept for the proposed index, demonstrating its potential utility in guiding conservation strategies and mitigating the adverse effects of climate change on arthropod habitats.
- Article
(7315 KB) - Full-text XML
-
Supplement
(7793 KB) - BibTeX
- EndNote


Arthropods are the largest and most diverse group of animals on Earth. They occupy nearly every ecological niche and are found in almost all terrestrial and aquatic habitats (Gullan and Cranston, 2014; Kotze et al., 2022; Schowalter, 2022). Arthropods play essential roles in maintaining ecosystem health and stability, serving as pollinators, predators, detritivores, and other important roles within their diverse habitats (Chakravarthy et al., 2016; Gullan and Cranston, 2014; Rundel and Gibson, 1996; Schowalter, 2022). Hence, they are present at various levels of the food web and many are extremely sensitive to changes in their environment, whose effects can quickly propagate up the food web. As a consequence of all these factors, many arthropods can act as indicators of ecosystem integrity (Maleque et al., 2006). The state of these ecosystems is often sensitive to variations in climate conditions, especially in the Mediterranean basin (Gritti et al., 2006; Santos et al., 2014; Vogel et al., 2021). In recent decades, the diversity of insect pollinators has faced numerous threats due to changes in the environment (Arce et al., 2023; Forister et al., 2021; Raven and Wagner, 2021; Wagner et al., 2021; Zattara and Aizen, 2021), among which climate change emerges as one of several important stressors (Botsch et al., 2024; Outhwaite et al., 2022; Potts et al., 2016; Uhl et al., 2022).
The ecological impacts of the climate crisis vary across the globe (Chen et al., 2021; Cui et al., 2021; Eyring et al., 2016), especially in vulnerable regions such as the Mediterranean basin (Giorgi, 2006; Lionello and Scarascia, 2018; Ranasinghe et al., 2021) and its numerous small islands. According to the Sixth Assessment Report (AR6) by the Intergovernmental Panel for Climate Change (IPCC), droughts in the Mediterranean are already increasing and the basin is projected to become increasingly arid together with a rise in extreme temperature (Doblas-Reyes et al., 2021; Gutiérrez et al., 2021; Ranasinghe et al., 2021). The impact of these changes on the ecosystem varies according to numerous factors and the extent to which insects and other arthropods are affected remains uncertain (Arce et al., 2023). This is especially so when changes to a particular group of organisms (such as pollinators) can impact other members of the ecosystem (Mullin et al., 2023).
One approach to study the climate impacts on arthropods and their habitats is to map species distribution with the use of ecological niche modelling (ENM; Fletcher et al., 2019; Haase et al., 2021; Hiller et al., 2019; Mammola et al., 2021; Mugumaarhahama et al., 2023; Phillips et al., 2004; Sillero et al., 2023; Tesfamariam et al., 2022). This approach offers the possibility of predicting potential shifts in species distributions under future climate scenarios, thereby providing valuable insights into the resilience and vulnerability of arthropod populations and their ecosystems. However, ENM can be especially challenging when considering accurate presence–absence data and additional non-climate factors that determine the distribution of a particular species (e.g. presence of predators, specific plants, competitors, and land use). While access to climate data has become increasingly available (Mammola et al., 2021), this also has its limitations, as very high-resolution data (e.g. CHELSA with ≈ 1 km spatial resolution; Karger et al., 2017) are preferred. These datasets are not abundant and their temporal coverage is limited, as is their range of variables.
Some ecological studies (Adão et al., 2023; Fink and Scheidegger, 2018; Khan et al., 2020; Mauri et al., 2022), like those assessed in the AR6, have leveraged the extensive collection of regional climate models (RCMs) from the Coordinated Regional Climate Downscaling Experiment (CORDEX; Coppola et al., 2021b; Giorgi, 2014; Giorgi et al., 2009, 2022; Gutowski et al., 2016; Teichmann et al., 2021), driven by the Coupled Model Intercomparison Project (CMIP; Eyring et al., 2016; Meehl et al., 1997, 2000, 2007; Taylor et al., 2012). Models from these datasets (accessible via the Earth System Grid Federation), such as the EURO-CORDEX (Coppola et al., 2021a; Jacob et al., 2014, 2020) at ≈ 12.5 km spatial resolution, have undergone thorough validation and offer a wide range of climate variables. RCMs offer a higher resolution compared to global datasets and excel in representing the climate of complex regions such as the Mediterranean (Ciarlo' et al., 2021; Giorgi et al., 2022b; Reale et al., 2022; Somot et al., 2018). Moreover, with recent advances in convection-permitting (CP) simulations, which offer resolutions of approximately 3 km, the development of kilometre-scale RCM ensembles with diverse variables is within reach (Ban et al., 2021; Coppola et al., 2020; Pichelli et al., 2021). Although most arthropods are relatively small in size and tend to occupy regions of specific microclimates (Clark and Johnson, 2024; Høye and Forchhammer, 2008), RCMs' ability to accurately depict climate variations of complex landscapes provides a good understanding of how such organisms may respond to climate change.
This study utilises RCM data to evaluate the influence of climate parameters on terrestrial arthropod habitats, introducing a novel, simplified index for this purpose. The methodology hinges on analysing the climatology of sites where specific species have been documented and, by integrating RCM data from various time periods and spatial resolutions, it could offer insights into potential shifts in the fundamental niches of these species or stress exerted by a changing climate. The fundamental niche, which describes an environment that an organism could survive in (but may not necessarily be present in), is represented by climatic (abiotic) parameters within this study. This differs from the realised niche, which is more restricted since it describes where the organism is actually present due to the inclusion of biotic factors (Putman and Wratten, 1984), which are not represented in the RCM data. The findings detailed herein provide a proof of concept for this index and demonstrate its applicability in modelling arthropod species distribution on the basis of their climatic niches.
This study introduces a new simple metric designed to quantify the climate's influence on the distribution of certain terrestrial arthropods, a tool that can be critical in the future, given the anticipated direct impacts of climate change (IPCC, 2023). This metric is based on the assumption that a living organism observed at a specific location will have favourable climatic conditions for its existence. Hence, a collection of locations where the organism was observed can describe the range of climate parameters of its fundamental niche.
For a potential species of interest (PSI; e.g. Spilostethus pandurus) s, with ns sampling/observation locations, and a selection of climate indices (see Sect. 2.2), the value of an index at a sample location can be expressed as xsij where i represents a specific climate index (examples of such indices include annual mean of near-surface air temperature [tasmean] or annual sum of precipitation [prsum]) such that ; p denotes the number of indices considered and j represents a specific location such that . The corresponding mean for the ith index of the population of s can be expressed as . The most appropriate conditions for s would occur when xsij approaches the value of μsi (difference at, or close to, 0), hence we can define the preferred climate conditions, Csi, to be maximal (i.e. 1). As xsij deviates from μsi, the climate index identifies less favourable conditions until it exceeds the limit, Lsi. Thus, Csij can be expressed as Eq. (1) below.
Using Eq. (1), where σsi is the standard deviation of the ith index for the population s and dsij is the standardised distance to the mean, , Csij can be reduced to Eq. (2).
The limit, Lsi, is expressed as Eqs. (3) and (4), which describe the largest deviation from the maximum or minimum of dsij.
The different quantities of Csij are combined into the Eco-Climate Index for species s at location j, EIsj, which describes the climatological component of a species's ecological niche, as shown in Eq. (5). The value of EIsj is expressed relative to the maximum of all combined Csi at each location j (only for existing observation) to normalise the index. This produces a quantity that ranges between 0 and 1, where 0 describes climate conditions beyond the accepted limit for s, and 1 describes the apparent ideal climate conditions for s according to its sampling locations. It is important to note that a value of 1 does not imply the presence of s as non-climatological factors (e.g. human influence, presence of competitors, availability of food) are not included in this metric. Since EIsj refers to the Eco-Climate Index of species s at location j, when referring to spatial maps this becomes EIs:
2.1 Biodiversity data
In order to evaluate the Eco-Climate index introduced in Eq. (5), an analysis was focused on the broader European region. This permitted the use of RCM data from the EURO-CORDEX ensemble, as well as a new ≈ 3 km CP simulation of the western and central Mediterranean (both described in Sect. 2.2). The analysis focused on terrestrial species occurring in the European and Mediterranean regions; the data consisted of research-grade observations from the iNaturalist (iNaturalist community, 2023) database.
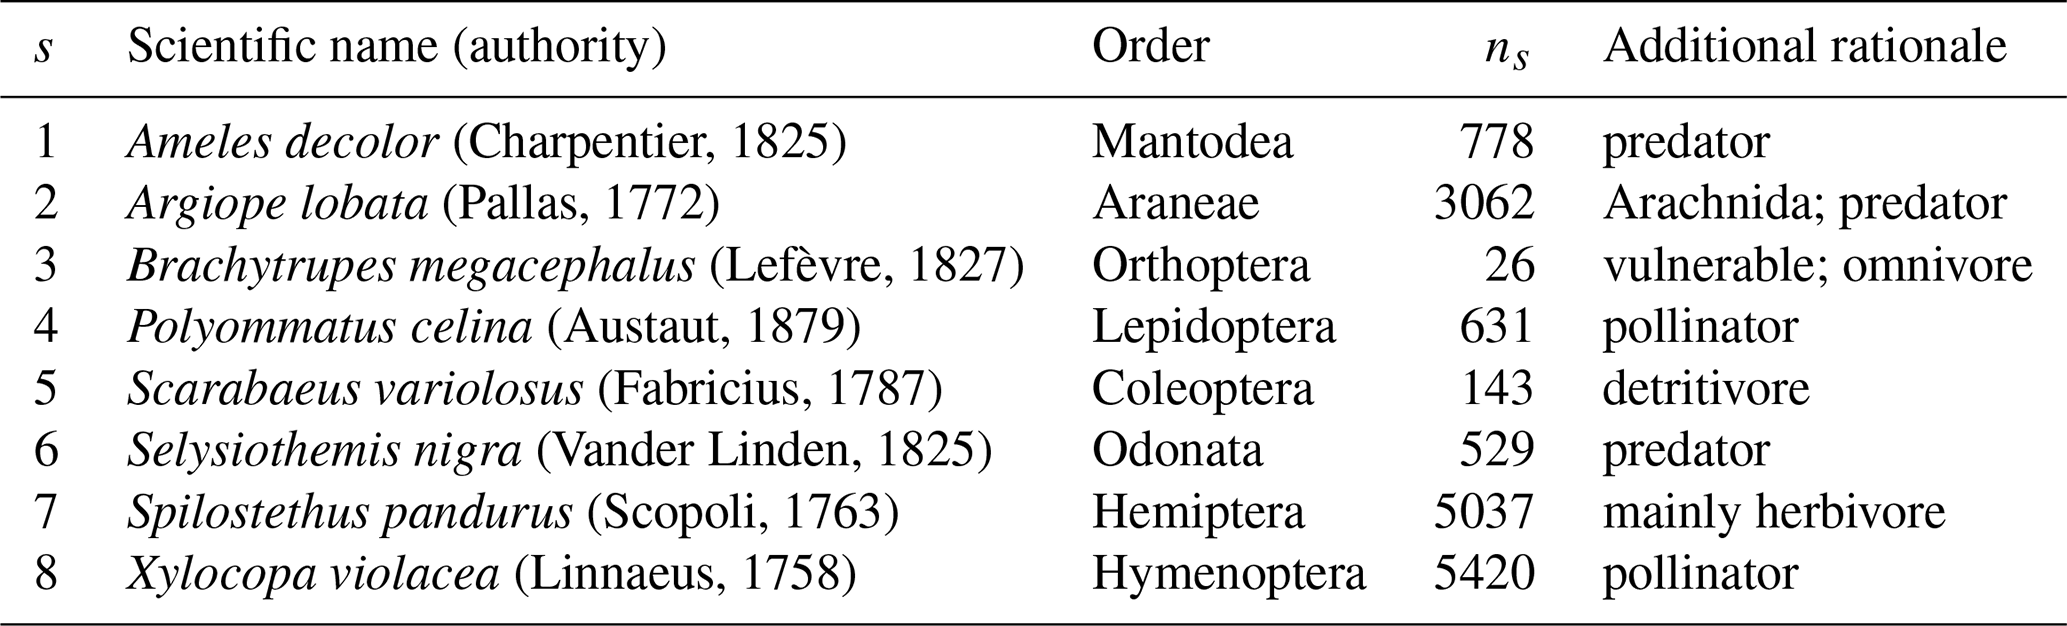
For the purposes of this study, eight arthropods (listed in Table 1) were selected as PSIs, where each play important roles in the ecosystem, such as pollinators, predators, herbivores, and detritivores. Each species was selected to cover a variety of observed Mediterranean arthropods from different orders with varied number of occurrences and ecological roles. One species, Brachytrupes megacephalus, was also chosen due to its status as a vulnerable species (Buzzetti et al., 2016). The results of this analysis would depend greatly on ns (some, such as Brachytrupes megacephalus, have a very small number of observations). Having small values for ns can produce less reliable results when determining preferred habitats for PSIs. For this reason, this study also provides a comparative assessment of how variation in ns influences the product of this metric. Techniques that artificially inflate the sample size, such as bootstrapping, were found to have minimal effect on results and hence were not included to avoid adding unnecessary complexities to the metric.
Table 1Scientific names and order of the selected PSIs, together with the corresponding number of research-grade observations accessed from the iNaturalist (iNaturalist community, 2023) database (number of occurrences, ns) and additional rationale for selection.
2.2 Climate data
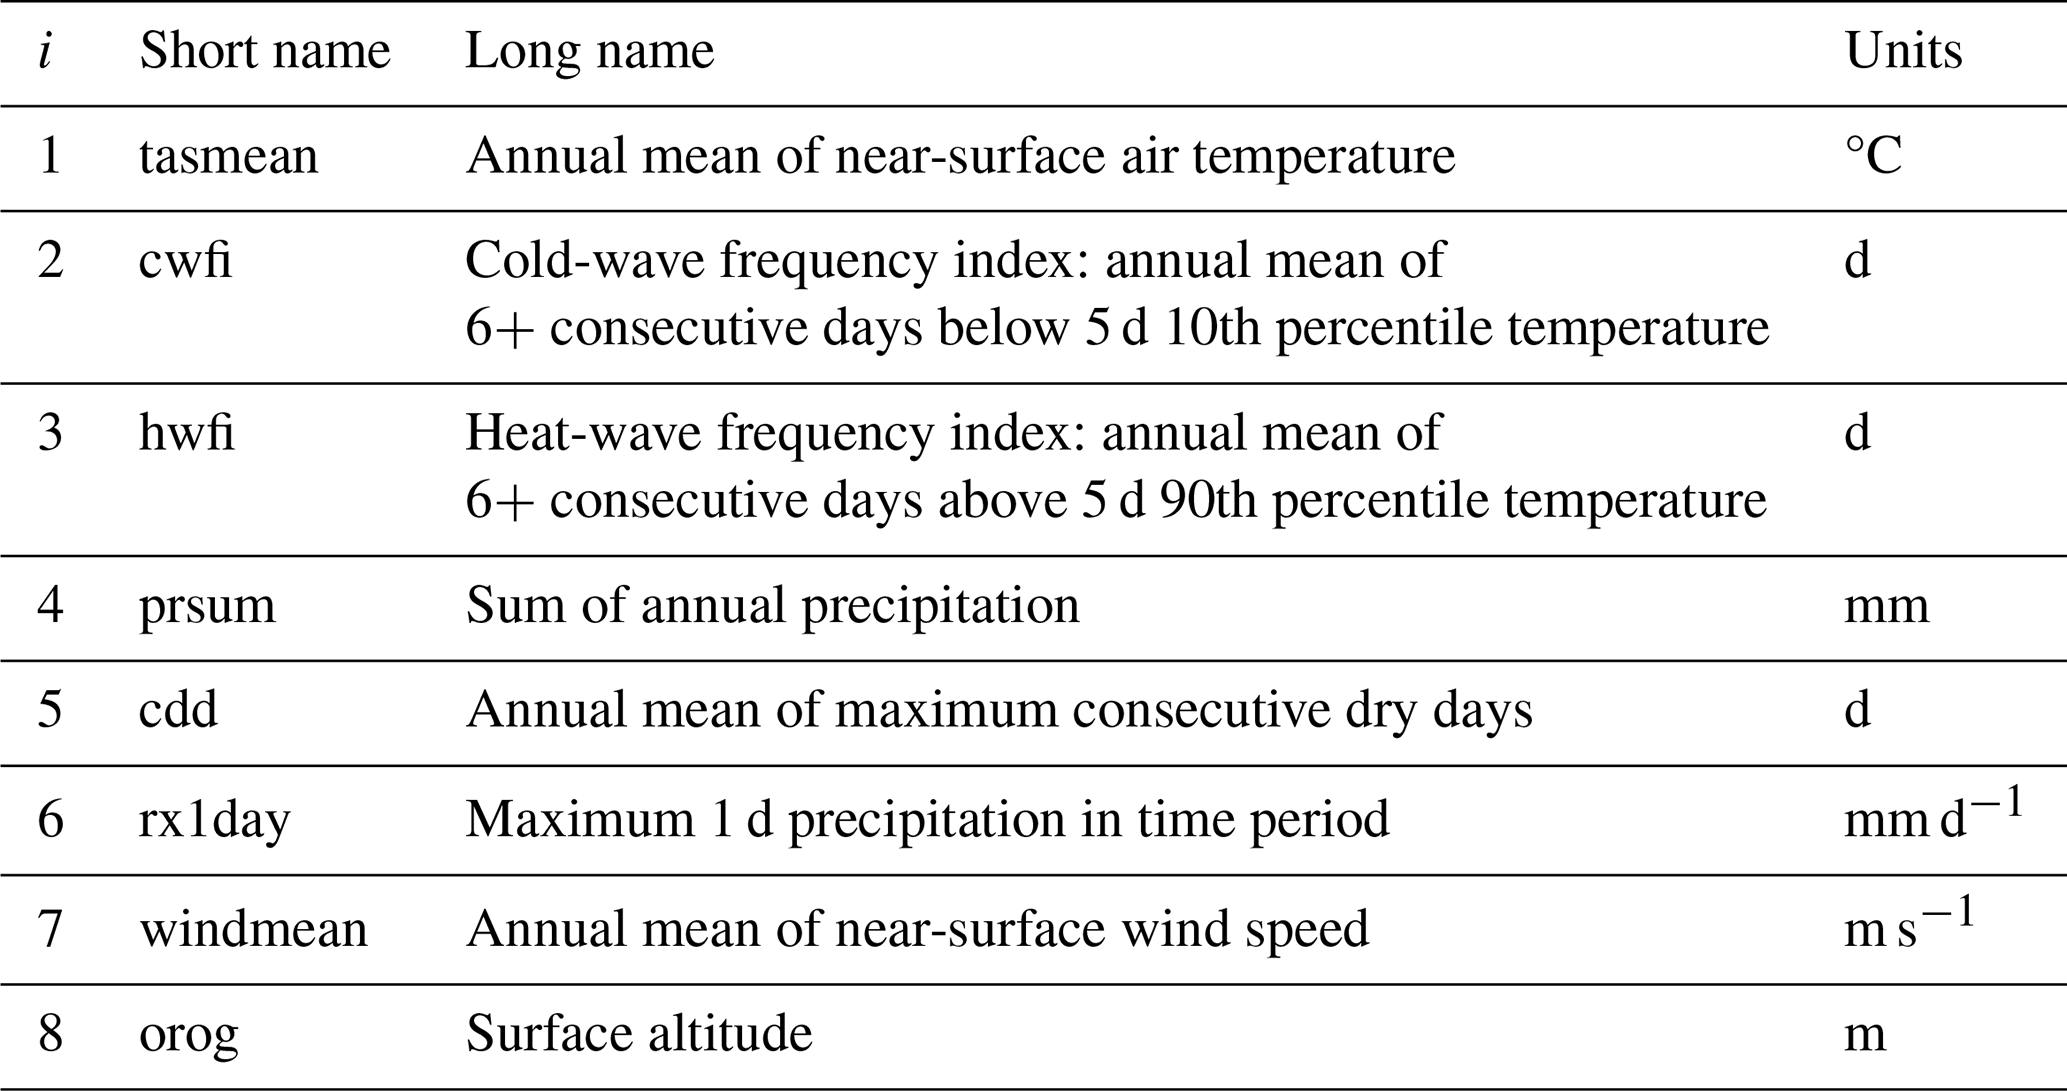
The purpose of EIs is to evaluate the climate influence on the fundamental niche of a particular organism and hence the choice of climate parameters is essential. Several climate indices (Coppola et al., 2021a; Giorgi et al., 2011, 2018; Schwingshackl et al., 2021; Sylla et al., 2018) of varying complexity were considered (see Supplement), but ultimately eight were selected (described in Table 2). The first variables considered to assess the environmental conditions preferred by a given species were temperature (due to its importance to an organism's metabolism) and precipitation (due to the importance of a water source). Given the importance of these variables and their variability throughout the year, the mean conditions together with upper and lower extreme conditions were also deemed important. Thus, indices were selected that represent these conditions for both temperature and precipitation. Given the size of arthropods, average wind speed was also included. Finally, as organisms are known to have a preference to specific altitudes, elevation was also included. Beyond the proof of concept, these criteria can be used to list starting indices but should not be used as strict rules to be satisfied. It is important to note that this study adheres to these eight indices for the purposes of a homogeneous analysis; however, this metric may be used with any number of climate indices.
Table 2The eight climate indices used in this study to describe the climatological component of an ecological niche.
The selection of climate indices was also based in part on the parameters available from the climate observation dataset used for the analysis. The observations are the 31-year (1980–2010) daily variables of E-OBS v25e at 10° horizontal resolution (Cornes et al., 2018; Haylock et al., 2008), hereafter referred to as E-OBS.
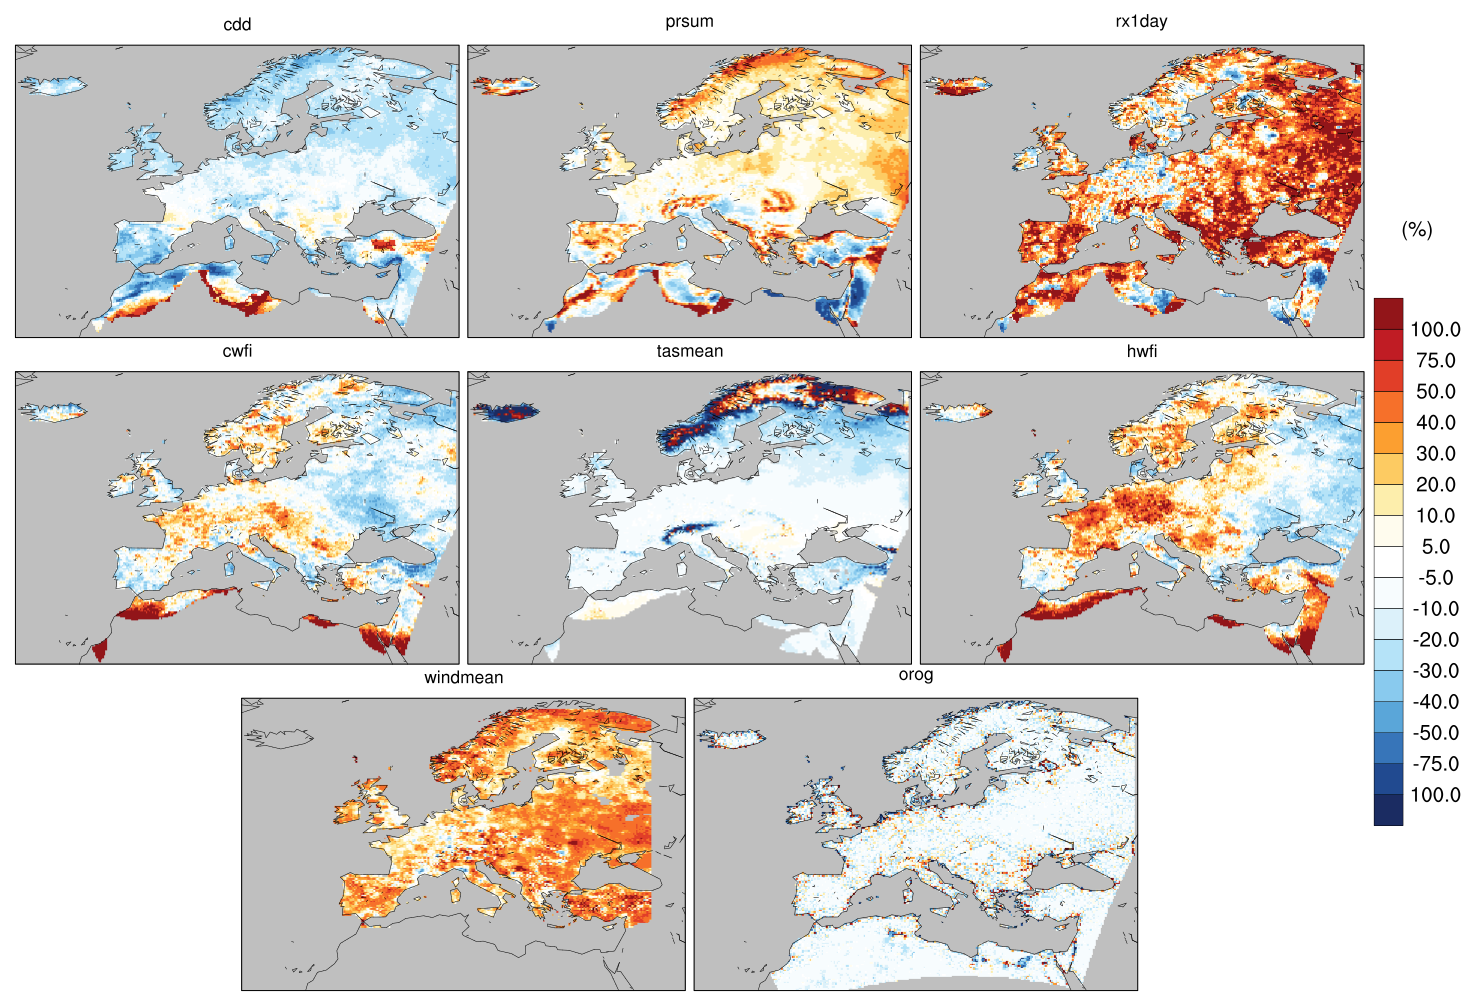
Figure 1Percentage bias for climate indices from the 31-year Ens6 (see Table 3) compared to E-OBS dataset (1980–2010).
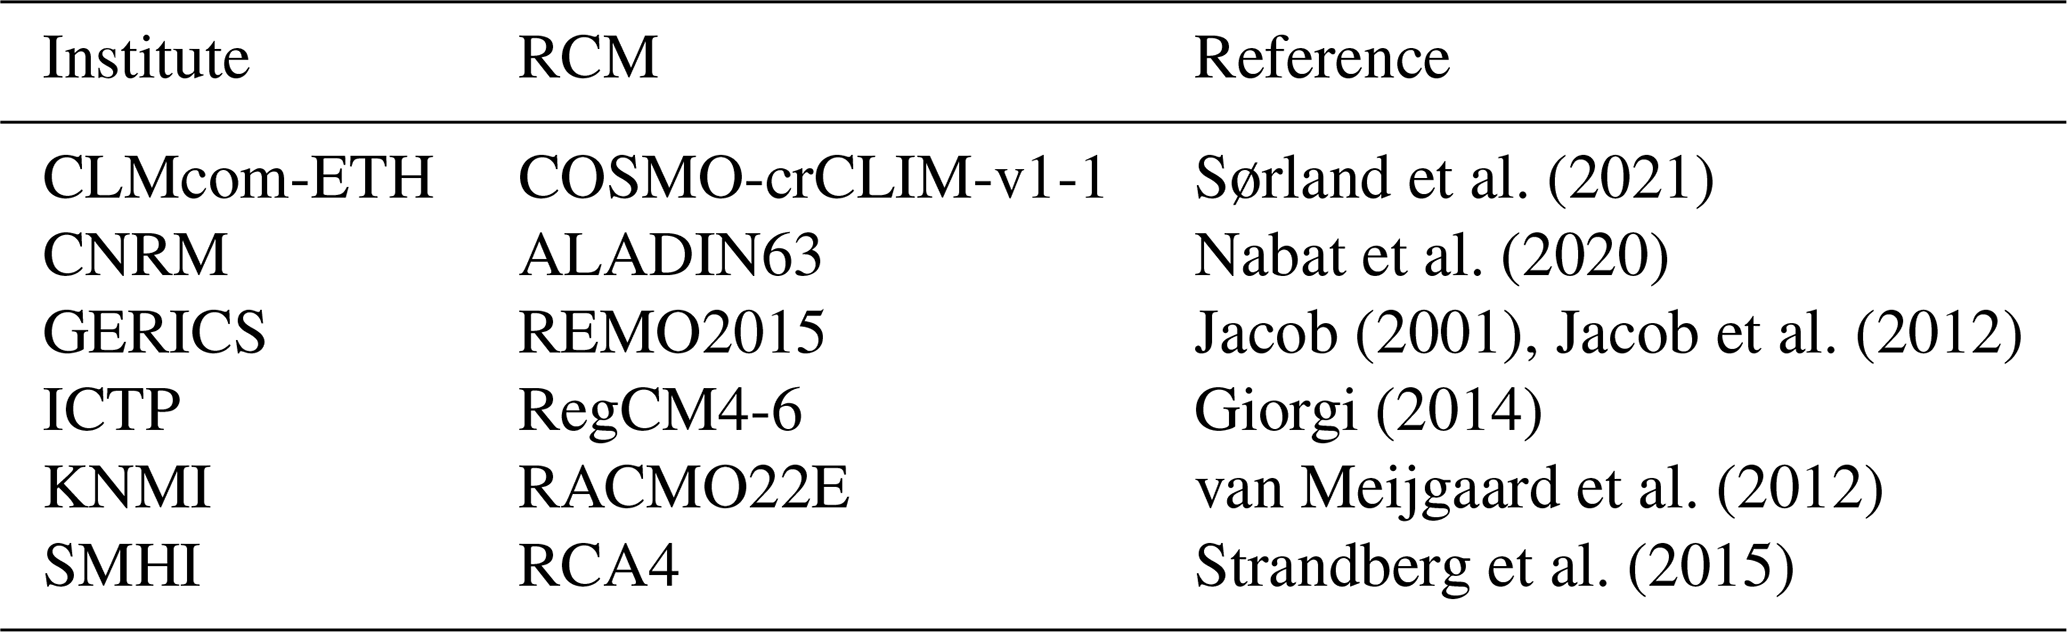
The analysis was extended beyond the observation dataset to the 12 km EURO-CORDEX simulations (available via the Earth System Grid Federation, ESGF), to showcase the application of this metric to climate models. An ensemble was constructed from simulations driven by the European Centre for Medium-Range Weather Forecasts ERA-Interim reanalysis (ECMWF-ERAINT; Dee et al., 2011). The EURO-CORDEX data are extensive and have been evaluated in numerous studies (Casanueva et al., 2016; Fantini et al., 2018; Kotlarski et al., 2014; Prein et al., 2016; Vautard et al., 2013), and the recent CMIP5-driven simulation members, which were used in this paper, have been extensively evaluated for temperature, precipitation, winds, and other variables (Ciarlo' et al., 2021; Molina et al., 2023; Sørland et al., 2021; Vautard et al., 2021). This ensemble was constructed only from simulations which provided the parameters necessary to construct the indices described in Table 2 (for the 1980–2010 time period) and had availability through ESGF nodes at the time data collection began. The 6 RCMs that satisfied these criteria were selected for this ensemble, which is hereafter referred to as Ens6 (detailed in Table 3). All ensemble members are at the same spatial resolution, however two members (CNRM-ALADIN63 and ICTP-RegCM4-6) required interpolation from their native grid to a common grid using a nearest-neighbour approach. To minimise errors, the indices listed in Table 2 were calculated individually before any interpolation. Furthermore, the final Ens6 product was obtained with the use of an ensemble mean of the indices associated with each member.
Table 3A description (including the model, reference, and institute that ran the simulation) of the RCM simulations driven by ECMWF-ERAINT making up Ens6.
The metric was also applied to a new ≈ 3 km resolution CP simulation of the western and central Mediterranean (hereafter referred to as WMD03). This new simulation was run using the fifth-generation regional climate modelling system, RegCM5 (Coppola et al., 2024; Giorgi et al., 2023), and was driven by the fifth-generation ECMWF reanalysis for the global climate and weather (ECMWF-ERA5; Hersbach et al., 2020) and a parent ≈ 12 km EURO-CORDEX domain. Both the parent and CP simulations have been run with the non-hydrostatic Moloch core (Davolio et al., 2020; Malguzzi et al., 2006) and physics configuration as presented in Coppola et al. (2024) with the following differences: NoTo microphysics (Nogherotto et al., 2016), Xu and Randall (1996) cloud fraction, and Biosphere–Atmosphere Transfer Scheme land surface module (Dickinson et al., 1993)(Dickinson et al., 1993). The final CP simulation covers a 10-year period (1995–2004), which was included in the analysis to evaluate the performance of the metric for a very-high resolution climate dataset.
The eight climate indices obtained from the E-OBS dataset were computed for these modelled datasets and evaluated using the E-OBS derived indices as a reference dataset. The comparison was performed with the use of a standard percentage bias as described in Eq. (6).
These data are brought together in the analysis with two time periods: 31 years (1980–2010) for the assessment of the observation and RCM data and 10 years (1995–2004) for the inclusion and comparison of the CP data. The latter 10-year time period is also applied to the observation and RCM data, and while the individual 10-year assessment is shown in the Supplement, the direct comparison of all datasets was performed on this common time period.
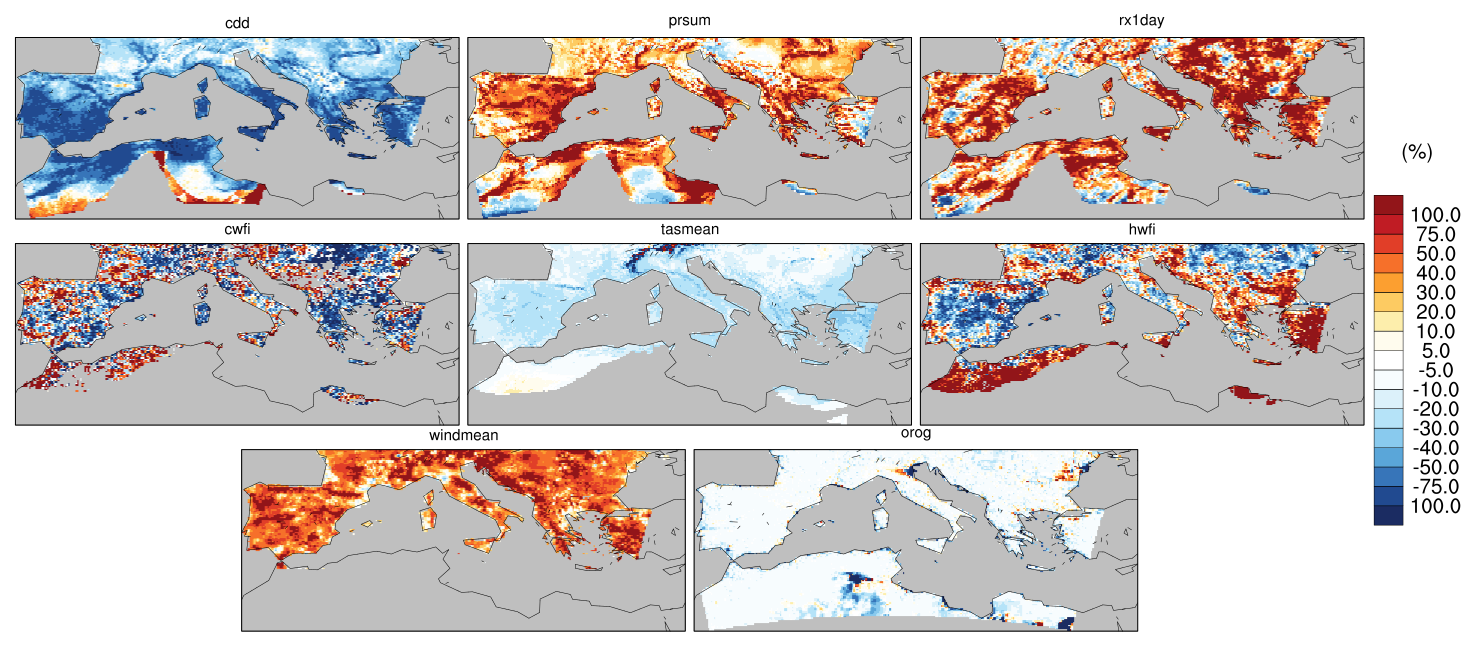
Figure 2Percentage bias for climate indices from the 10-year WMD03 (driven by ERA5) compared to E-OBS dataset (1995–2004).
3.1 Climate indices
The Eco-Climate Index needs to be constructed using climate indices that represent the environmental conditions of an arthropod's habitat. Therefore, the climate indices listed in Table 2 should represent the climatological component of an ecological niche in order to be used in the evaluation of this metric. In order to avoid cases of double sampling, correlations between prospective indices (described in Tables 2 and S1) were analysed and only those with a correlation lower than 0.5 were selected for this analysis (the matrix of scatter plots and a summary of the correlation coefficients is presented in Fig. S1 and Table S2). This study, serving as a proof of concept for this metric, was designed for a homogeneous inter-species assessment and hence this correlation limit was considered an acceptable constraint. However, for targeted in-depth analysis of individual species using the metric, it is advisable to construct the index from environmental parameters that are as independent as possible from those of other species. Ideally, these indices should exhibit even lower correlations than the set threshold to ensure greater precision.
The metric of EIs (described in Sect. 2) is also computed based on two RCM datasets, a 12 km Europe ensemble of six simulations (Ens6), and a 3 km CP simulation of the western and central Mediterranean (WMD03). The percentage biases of each index (shown in Figs. 1 and 2, as well as Figs. S27 to S32 for each ensemble member) reveal limitations of the modelled datasets. The most prominent bias for Ens6 is a prominent wet bias for rx1day, mostly in Spain, South Italy, and the East of the domain. This is consistent throughout all models but to a lesser extent for RegCM and RACMO. A wetter (prsum) and colder (tasmean) bias is noticeable in mountainous regions, consistent with observational challenges associated with these areas, as noted in other studies (Adam and Lettenmaier, 2003; Ciarlo' et al., 2021). All members of Ens6 also show a positive bias over Central Europe for cwfi and especially hwfi, as well as a windy bias throughout the domain. The biases for the WMD03 dataset are more pronounced than the Ens6. This could be partially attributed to the model configuration and/or increased resolution revealing similar issues to mountainous regions related to station density within the reference dataset (a more detailed assessment of the CP dataset is upcoming in a separate study). While these biases will certainly influence the values of EIs, this might not be prominent (see below) since the EIs is based on the statistical descriptors (μsi, σsi, Lsi) of the climate indices calculated within each location. This is noticeable in that actual values obtained for all statistical descriptors (see Supplement Tables S3 to S7) compare well within datasets, revealing that the datasets are still comparable for the purposes of this study.
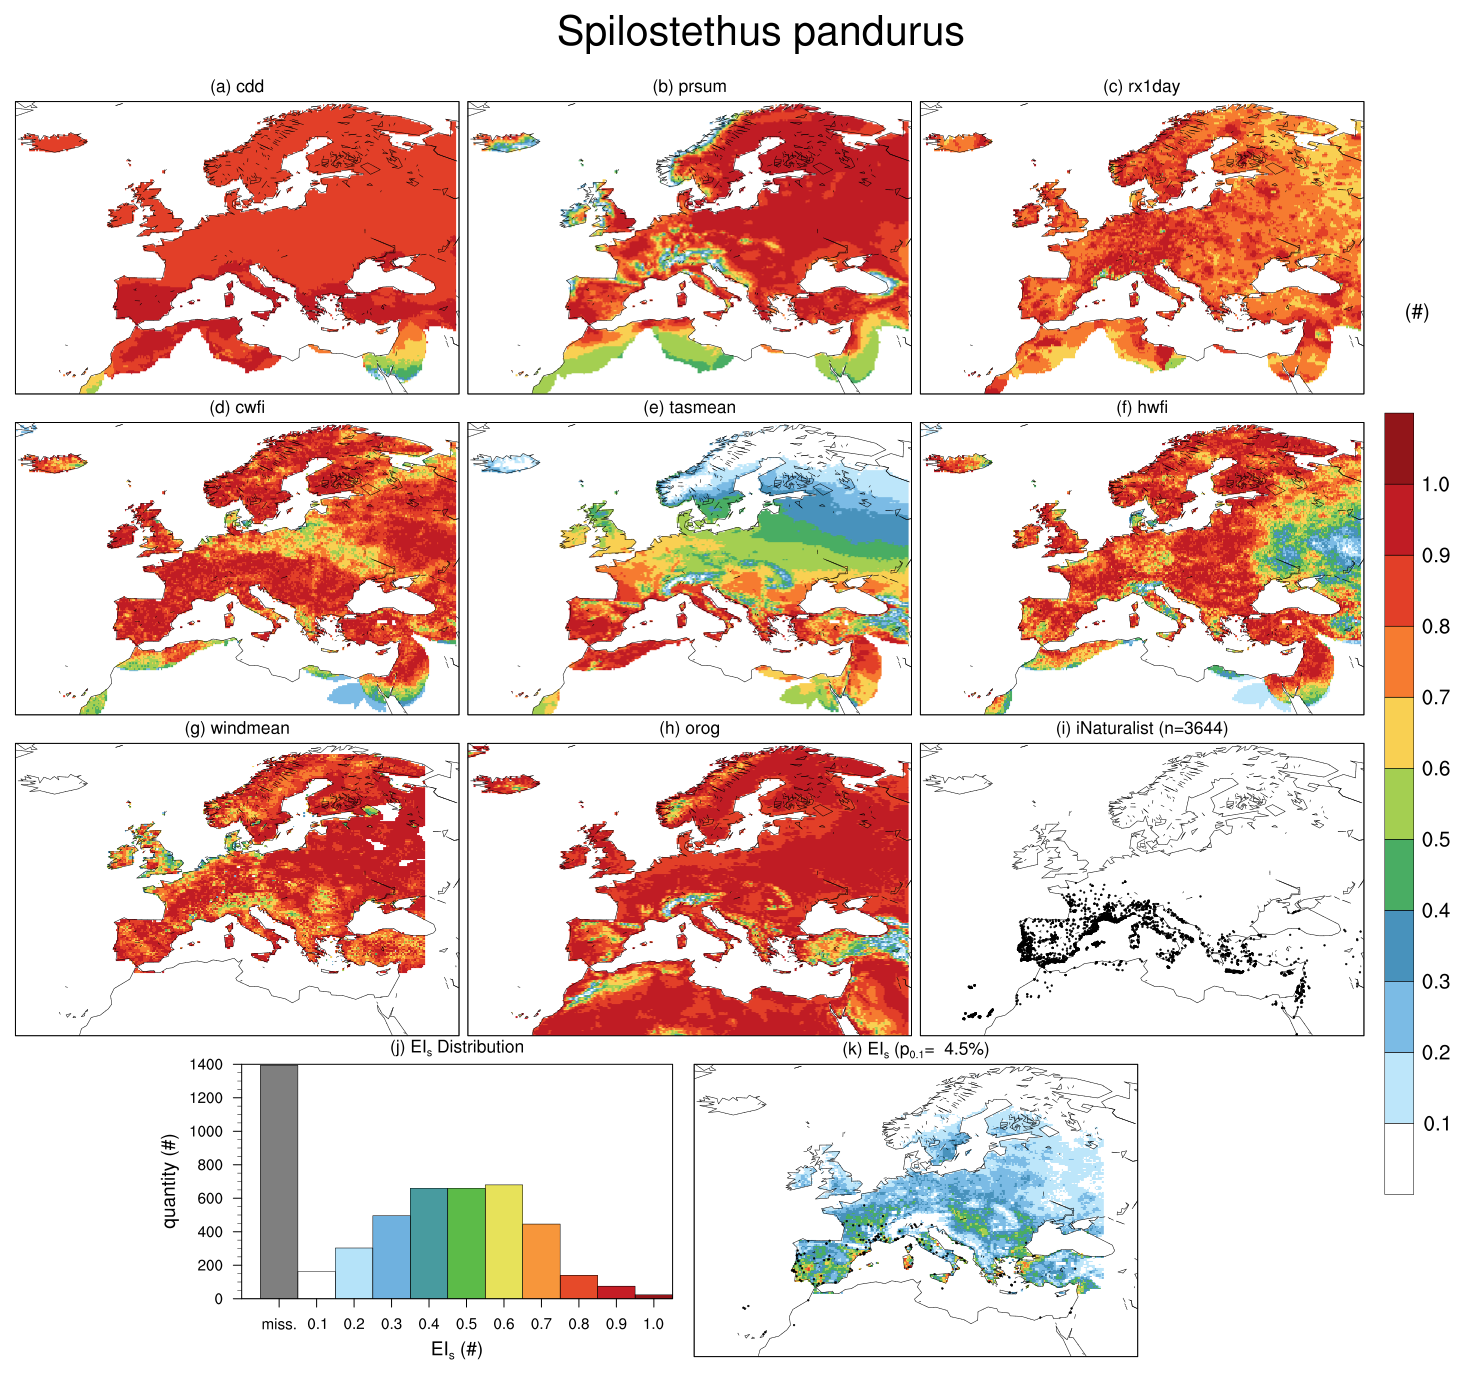
Figure 3The EIs product and components for Spilostethus pandurus according to the 1980–2010 E-OBS dataset. (a–h) The climate indices expressed in terms of affinity to Spilostethus pandurus. (i) The observation points (iNaturalist) and quantity, n, applied. (j) The distribution of EIs values, including the number of points from the original dataset that could not be applied (“miss.”). (k) The spatial distribution of EIs, including the points less than 0.1 (quantified with percentage p0.1).
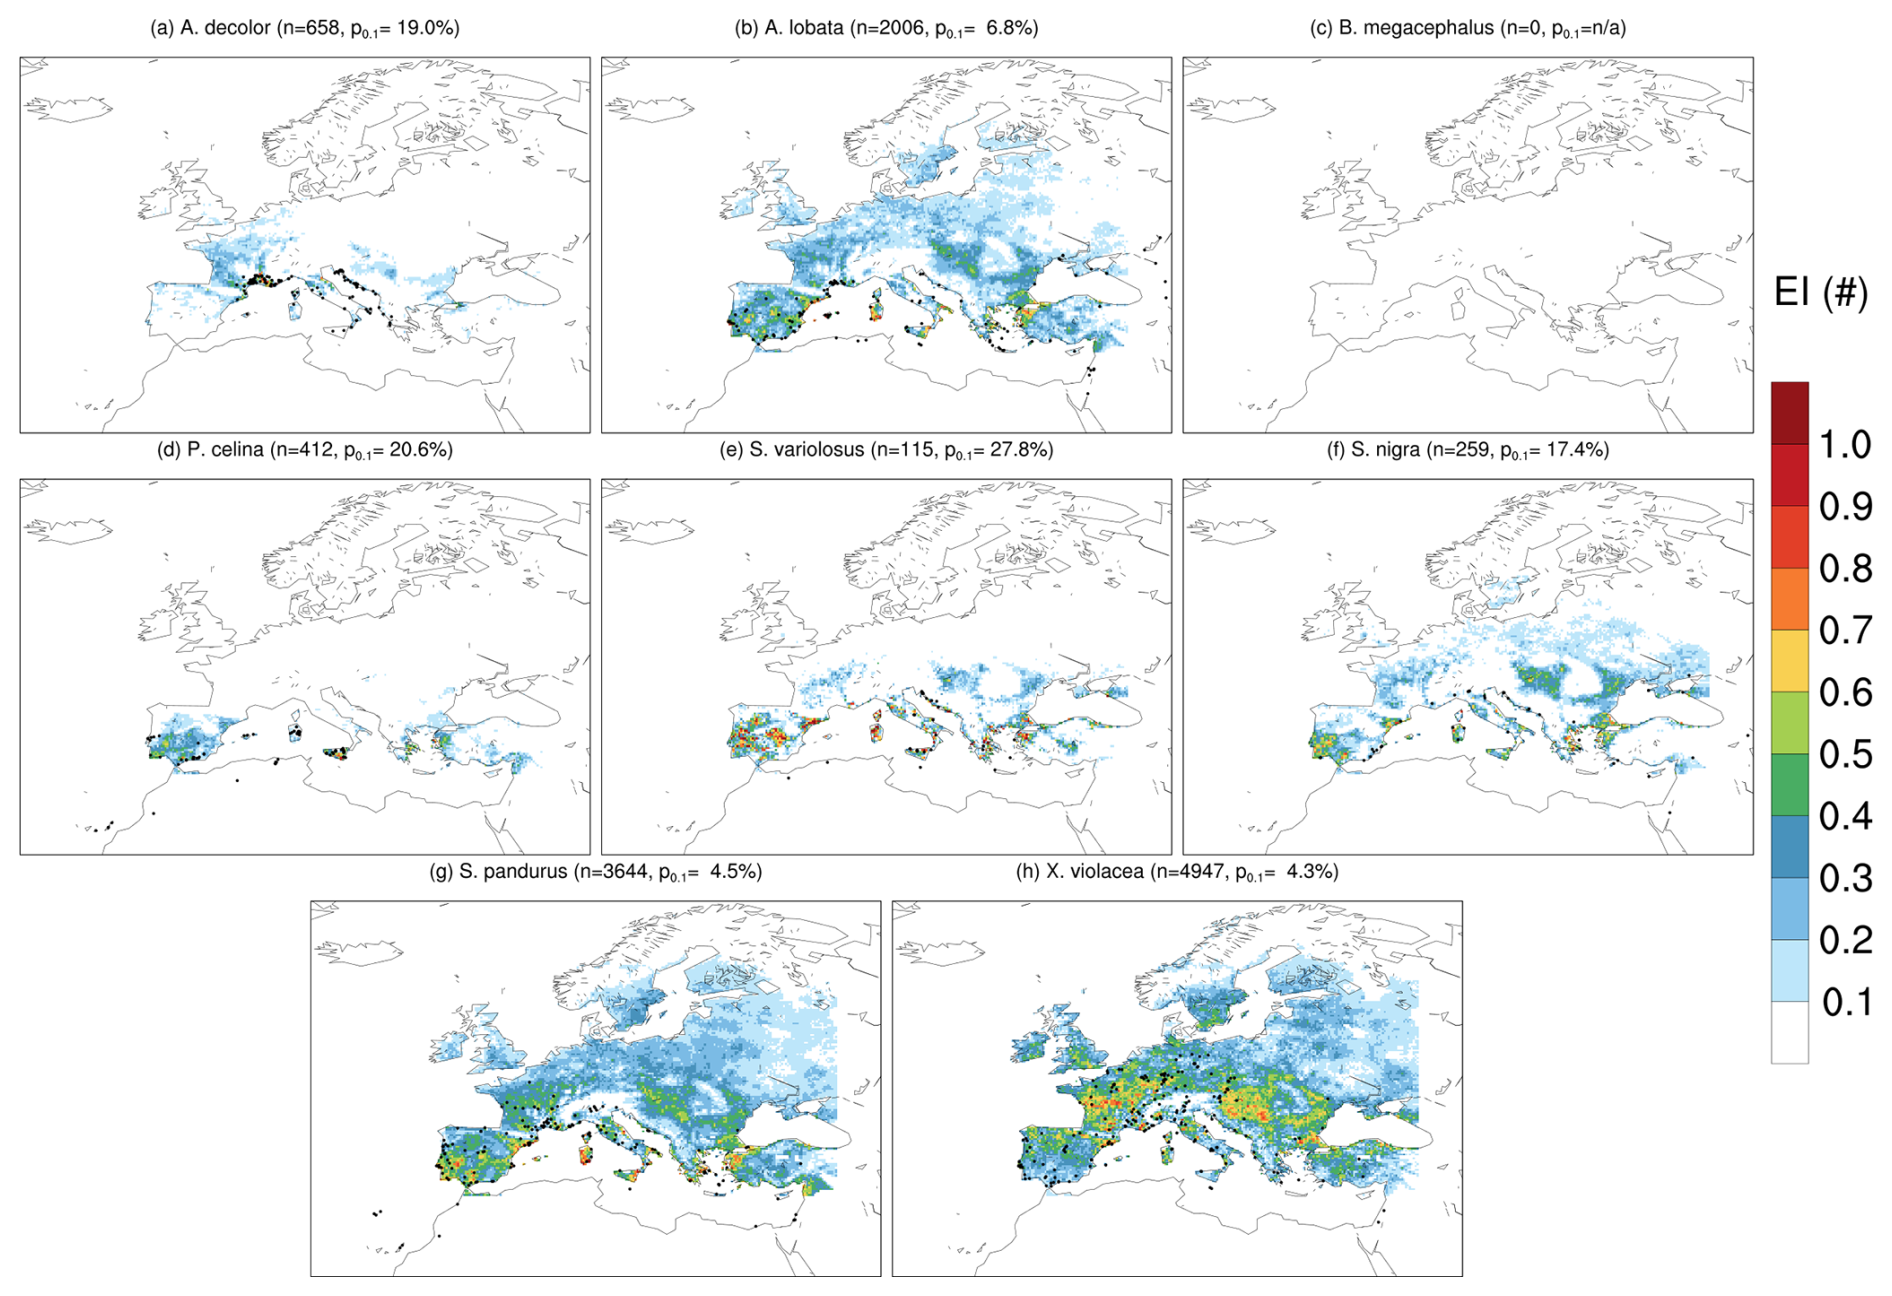
Figure 4The spatial distribution of EIs for all eight PSIs applied to the 1980–2010 E-OBS dataset. Individual products of each PSI are shown in Figs. 3 and S2–8.
3.2 Eco-Climate Index analysis
To demonstrate the application of the Eco-Climate Index, described in Sect. 2, the E-OBS climate dataset was utilised first. Spilostethus pandurus was selected as the first case study, with over 5000 iNaturalist observations. This approach provides a detailed illustration of the index's capabilities, with results summarised in Fig. 3, reflecting the index's performance using extensive empirical data. The spatial maps shown in Fig. 3a–h illustrate the eight climate indices (expressed in terms of the preferred climate conditions, Csi) as separate components of the fundamental niche, each ranging from 0 to 1, which represent the worst and best state of the index respectively. For any PSI, each component can be analysed in detail, if necessary, for example, Fig. 3a shows a broad area with climate conditions at or approaching 1. In this case, given that the lower limit of cdd is 0 days, these minimal drought conditions likely do not pose any additional stress to a PSI.
The observation locations of Spilostethus pandurus ns (Fig. 3i) is different from that given in Table 1. This is because some of the original 5037 points correspond to grid-cells not included in the E-OBS dataset (represented as “miss.” in Fig. 3j) and thus, in this case, ns is reduced to 3644. When the spatial maps of Fig. 3a–h are combined, the Eco-Climate indices of the species, EIs (Fig. 3k) is obtained. This spatial map thus describes the fundamental niche for Spilostethus pandurus according to the observed locations of iNaturalist and the climate conditions of E-OBS.
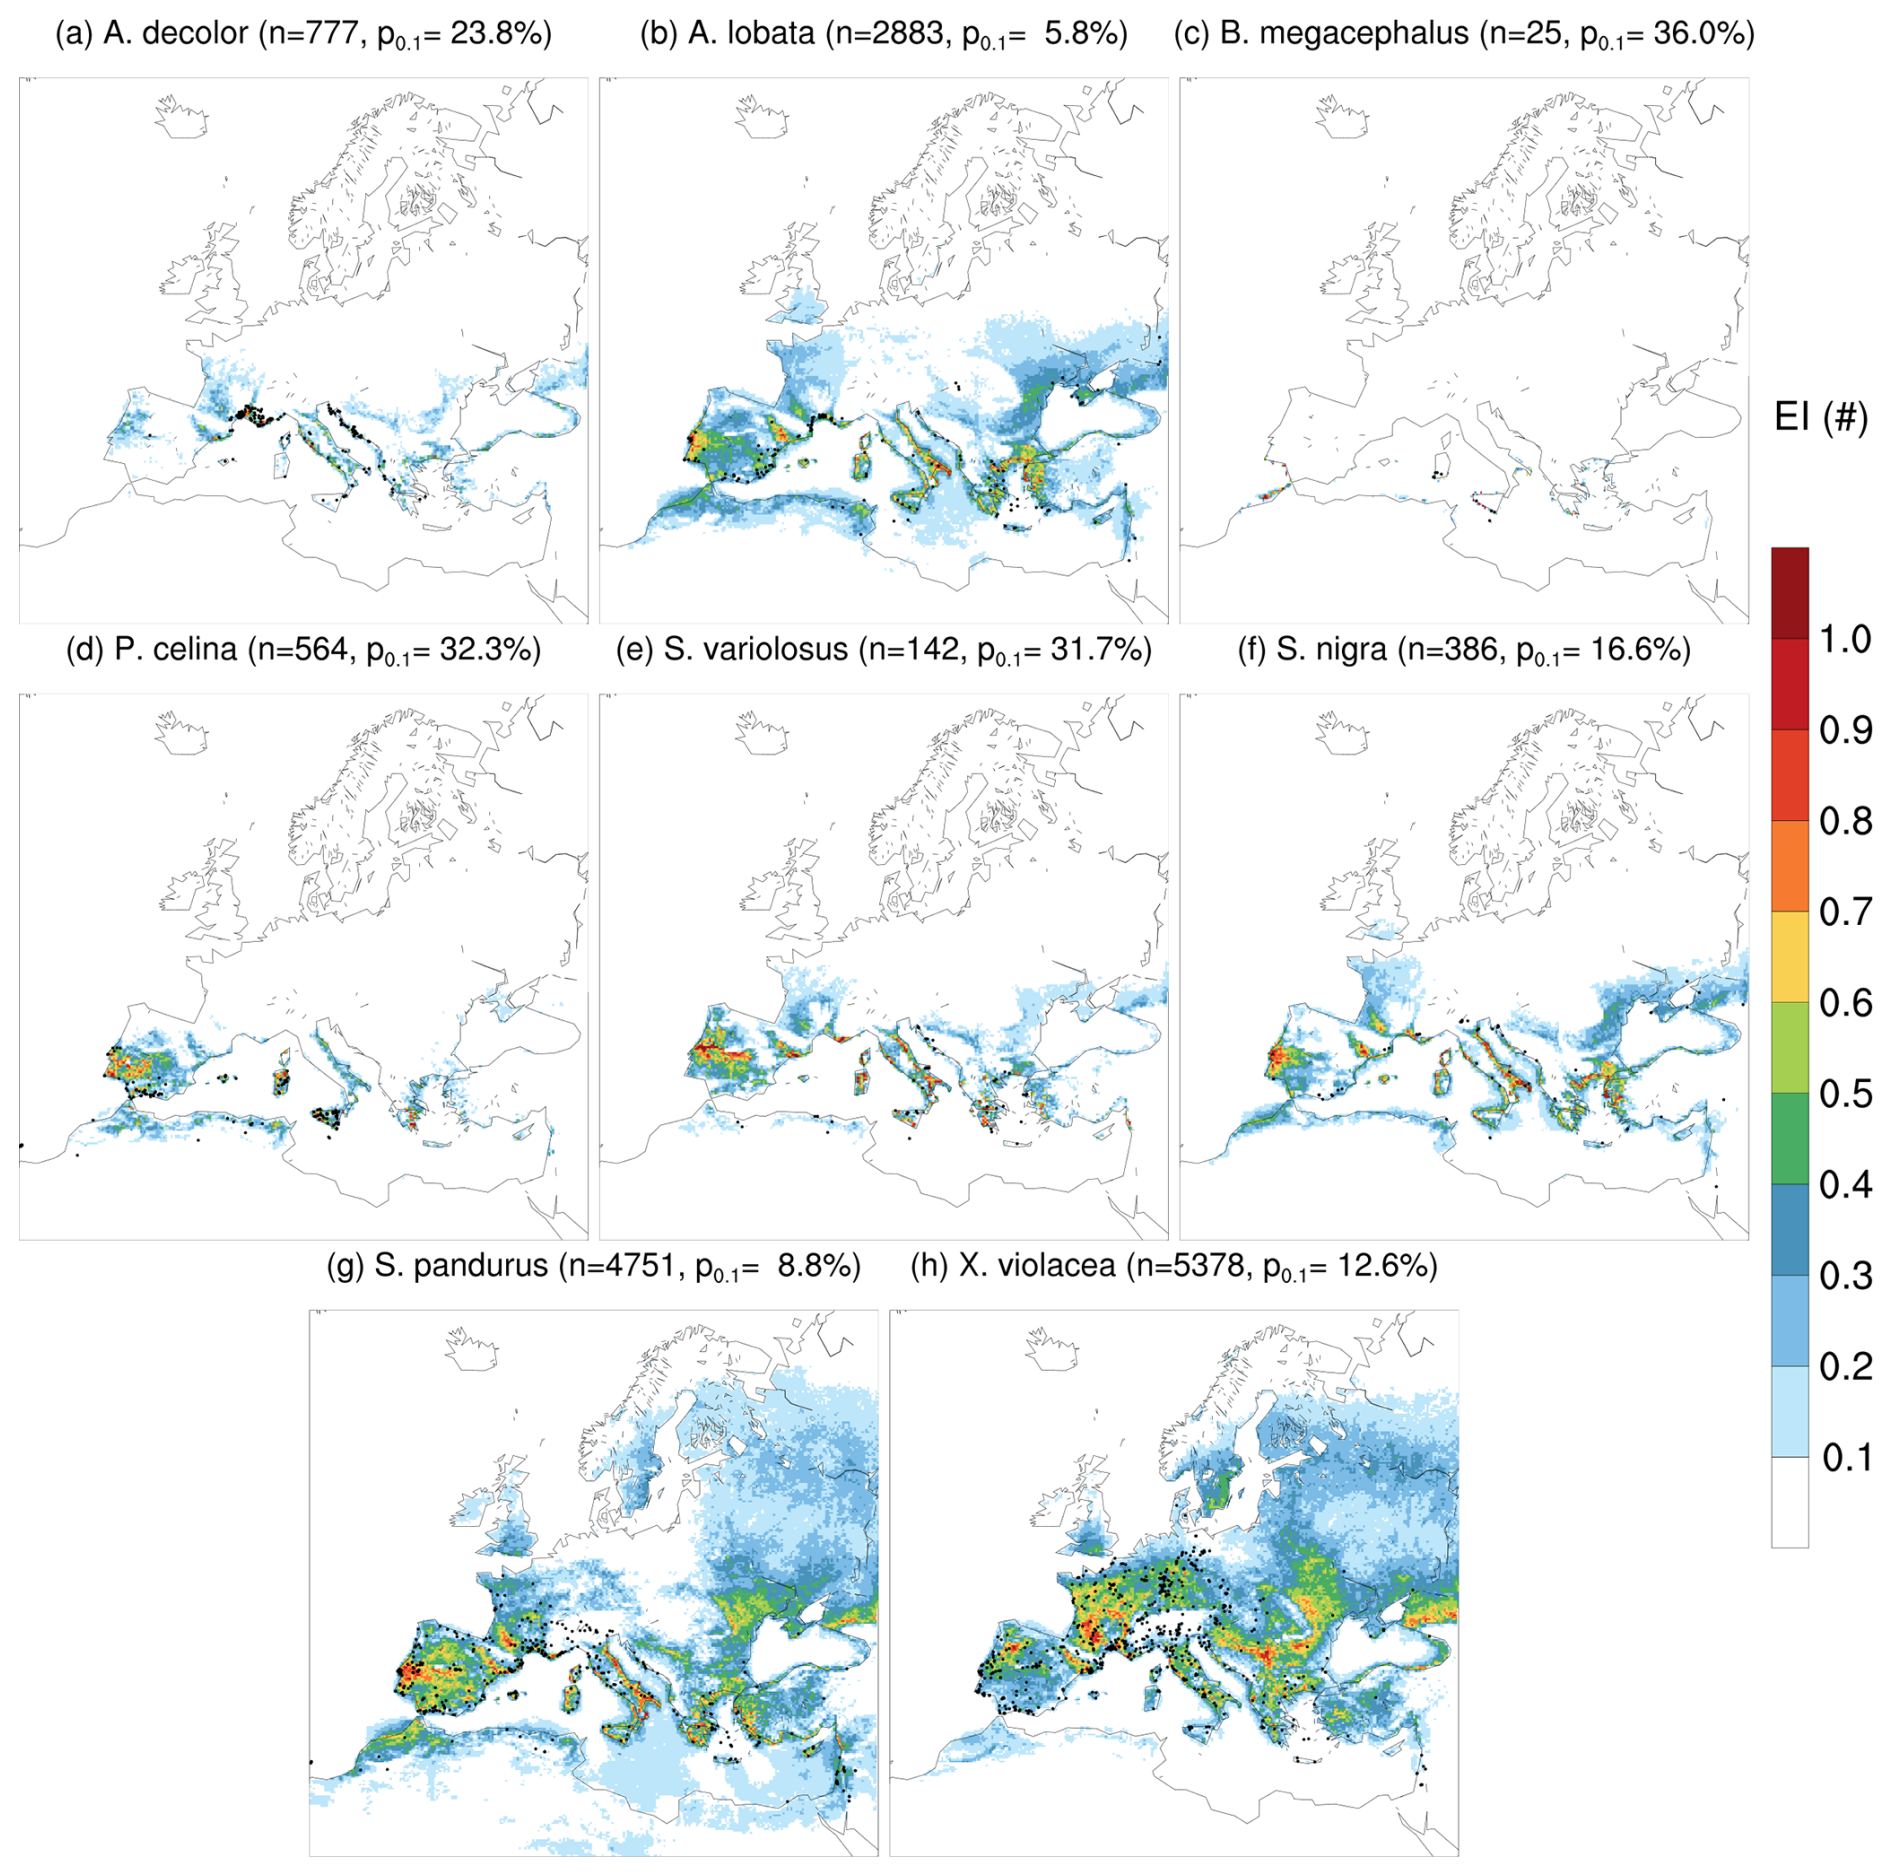
Figure 5The spatial distribution of EIs for all eight PSIs applied to the 1980–2010 Ens6 dataset. Individual products of each PSI are shown in Figs. S9–16.
It should be noted that the value of EIs extends to areas where no observations can be found. This does not imply that these are previously unknown habitats of Spilostethus pandurus, but rather that this represents the fundamental niche for the species and hence favourable climate conditions for the organism. The interaction with other species (host plants, predator-prey relationships, human presence) is not included in this metric and therefore it cannot describe the realised niche.
While the spatial distribution for EIs (Fig. 3k) is appreciably similar to the spatial distribution of the points of observation (Fig. 3j), not all points result in a high EIs. Figure 3k also includes points of observed locations where the corresponding EIs value is less than 0.1, i.e. regions with the least likely chance of observation. This is quantified with the term p0.1, which describes the percentage of valid points within this threshold, and is thus used as a measure of the metric's “effectiveness” in this study.
Although the value of EIs is a unitless quantity, it is constructed from statistical descriptors of climate parameters (as described above). The method allows for the determination of the ideal conditions of each climate index (in their respective units) associated with a particular species. All actual values of statistical descriptors associated with every dataset and time period analysed within this study are defined in Tables S3 to S7 of the Supplement. It's important to note that for the purposes of this study, these values represent a confirmation that no abnormal conditions are being considered. However, these quantities should not be interpreted as the actual parameters preferred by each species, since as described earlier, the climate indices were not selected to represent the precise preferences of each species but to allow for a homogenous assessment of the EIs metric.
The distributions shown in Fig. 3 could be applied within the context of a different study to extrapolate on expected impacts due to climate change. For instance, with the expected aridification of the Mediterranean (IPCC, 2023), one would expect that some impacted regions would become less hospitable to a PSI based on the importance of prsum (e.g. Fig. 3b). Another example based on plots of tasmean (e.g. Fig. 3e), could show northward migration of the ideal temperature conditions as southern regions become less hospitable with increasing temperatures.
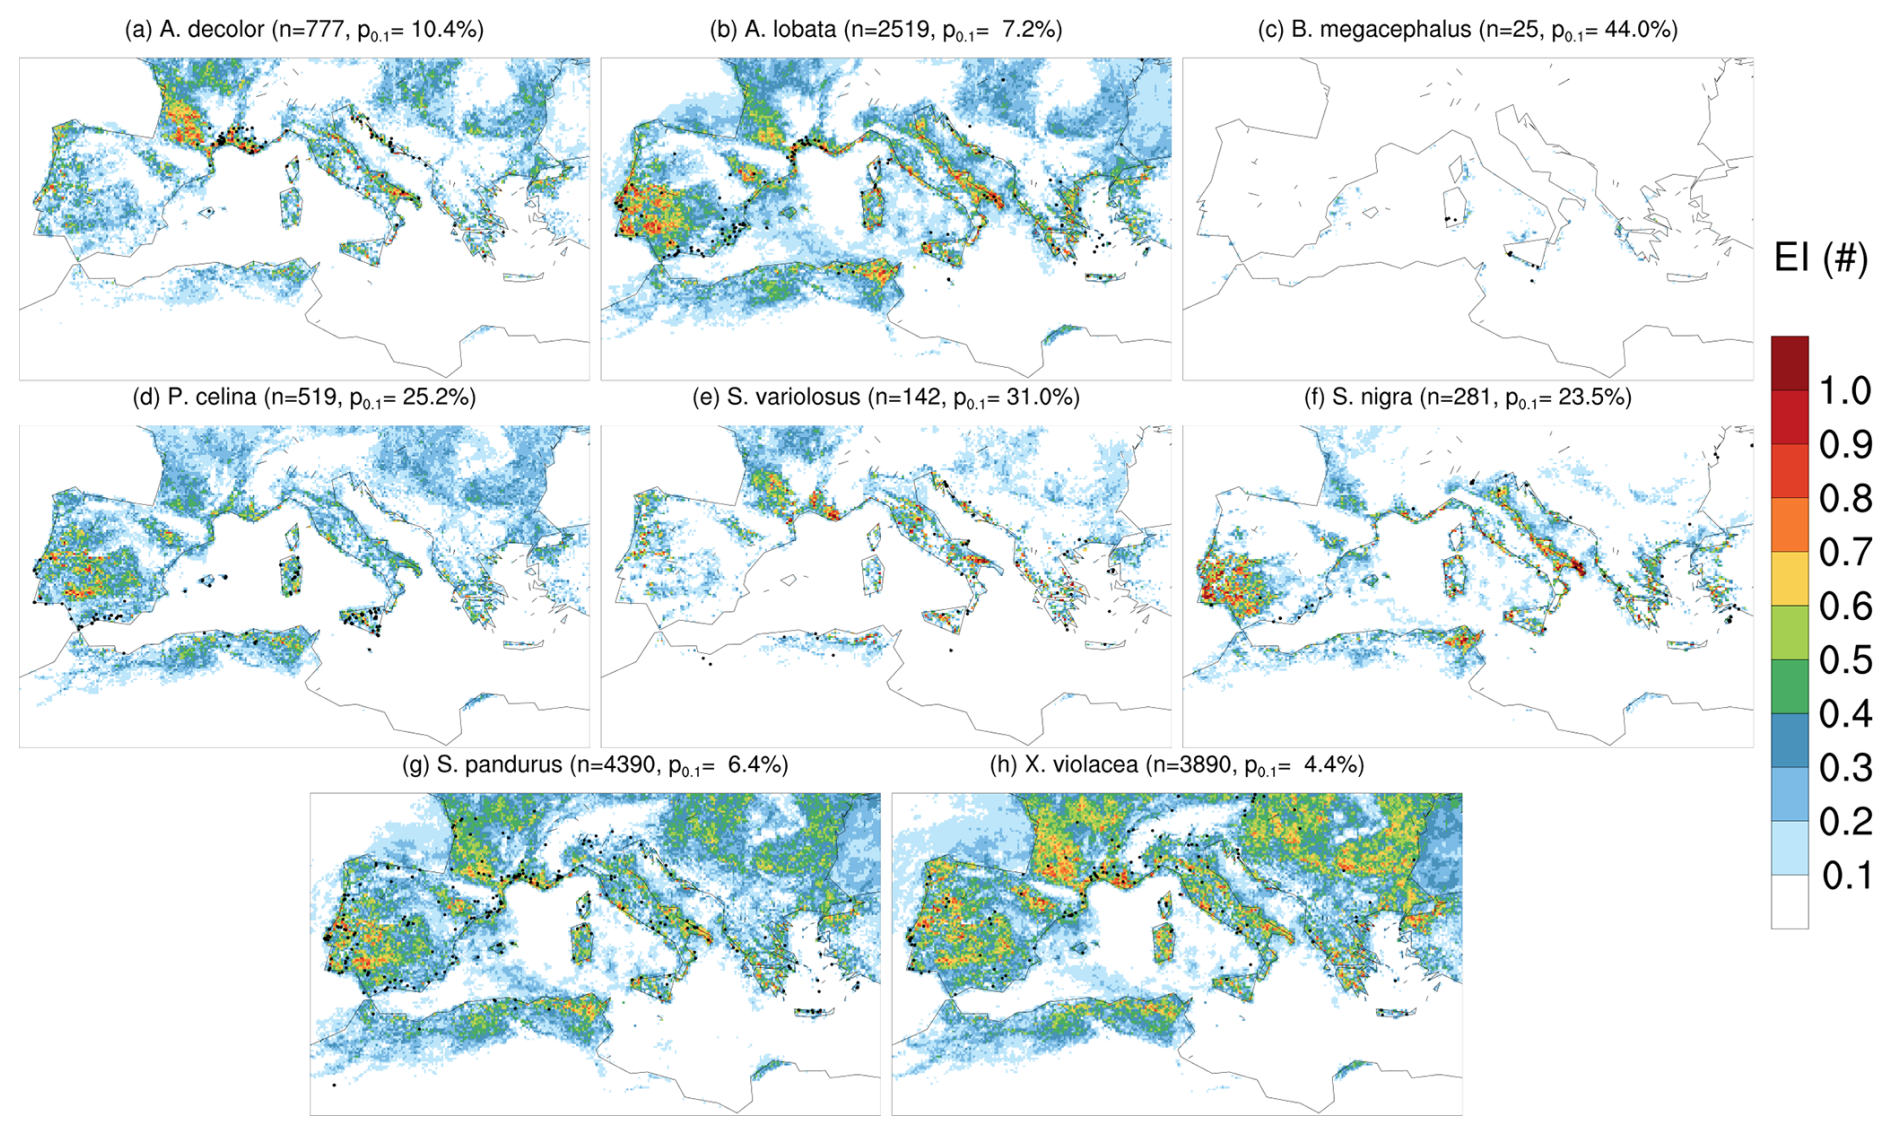
Figure 6The spatial distribution of EIs for all eight PSIs applied to the 1995–2004 WMD03 dataset. Individual products of each PSI are shown in Figs. S17–24.
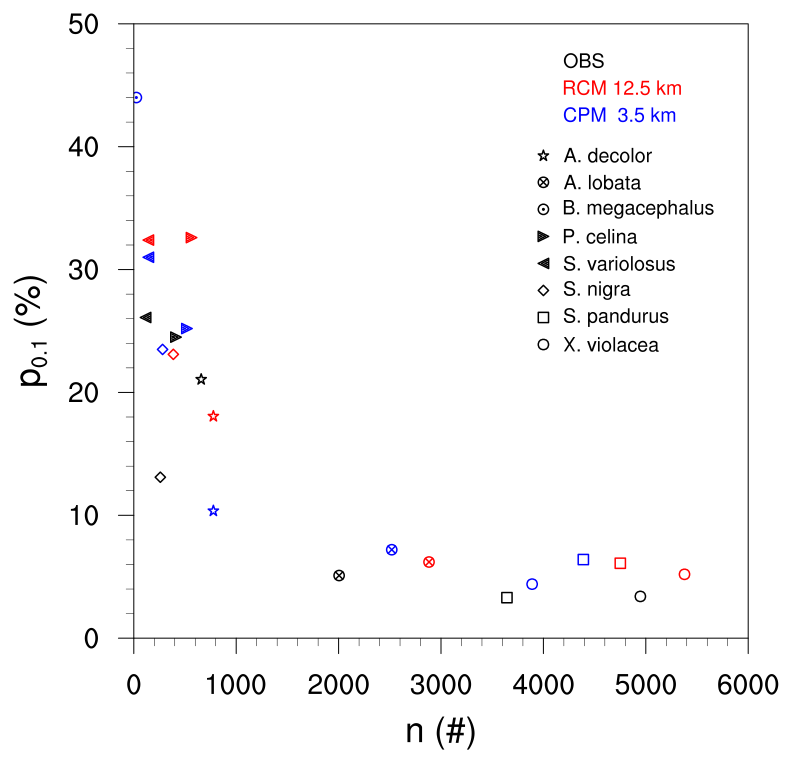
Figure 7The relationship between the total points ns used in each analysis and the corresponding p0.1. Each species is presented with a unique marker, while results obtained from different climate datasets are presented with different colours.
The number of points, ns, used in the initial assessment of the habitat could also influence p0.1. The different PSIs listed in Table 1 provide the opportunity to evaluate the metric for datasets with different ns. A summary of the spatial distributions of EIs for all eight PSIs is shown in Fig. 4 and the corresponding images analogous to Fig. 3 are shown in Figs. S2–8. When investigating the lowest value for ns, too few points from the Brachytrupes megacephalus dataset could be used with the E-OBS dataset, resulting in a constant EIs field of 0 (these results were maintained for consistency throughout this paper). PSIs with ns greater than 100 have p0.1 values of ≈ 20 %, while those with ns greater than 1000 have p0.1 values between 4 %–6 %. This suggests that with higher ns, the method becomes more effective at reproducing the fundamental niche.
Considering that several observations correspond to coastal areas or small islands, they cannot be properly represented within the E-OBS dataset as it is limited to the land. This is explored with the use of the Ens6 data (Fig. 5), which make use of all iNaturalist coordinates within the EURO-CORDEX region. The results, while similar, do not reduce the value of p0.1 and the small differences obtained may be due to model biases (Fig. 1).
The conditions leading to EIs values lower than 0.1 may be a consequence of the spatial resolution of the climate data, where more complex geographic features such as streams, smaller valleys, gulleys, etc. (which can serve as micro-habitats) would not be properly represented in the dataset. The WMD03 data (Fig. 6), which serve as a test for this hypothesis, also give similar results to the previous two datasets, but with a decrease in p0.1 for almost all species when compared to Ens6 (this is mostly consistent when analysing Ens6 within the common time period; see Fig. S26). This is expressed more clearly in Fig. 7, which shows the relationship of ns and p0.1, and also highlights the differences between the three climate datasets. This reveals that the climate data, whilst resulting in some variation to the successful interpretation of the fundamental niche, is likely not a major factor in decreasing the value of p0.1. Figure 7 clearly reveals that, instead, the most reliable results are obtained for species with a very high number of observations (ns>1000). When comparing the results of each species, the reference dataset almost always produces the most reliable results. This, together with the comparable p0.1 values of the RCM and CP dataset (which sometimes is worst for the CP data), suggests that the reducing the bias of the model data can contribute towards improving the results of this metric.
This study has introduced and applied an efficient index for assessing climate suitability for species' occurrences, with a focus on terrestrial arthropods occurring in the Mediterranean region. Through the integration of RCM data, this research paper outlines a methodological framework that reflects the climatological preferences of terrestrial arthropod species based on their historically observed locations. This new metric allows a suitable representation of species distribution on the basis of their fundamental (or climatic) niche and hence might represent an important tool to model future change in response to climate change.
The application of a diverse range of climate data in this study has underscored the effectiveness of the proposed index in representing the fundamental niches of arthropod species across the Mediterranean region. Specifically, for species with observations exceeding 1000 points, the method captures the climatic preferences corresponding to approximately 95 % of these observed points. While the index yields appreciable results with any climate dataset employed, the analysis indicates that CP data often provide some superior outcomes compared to RCM data with a lower resolution. This distinction highlights the index's versatility and its potential for adaptation to different data sources, ensuring its applicability and usefulness in a wide range of ecological and conservation planning scenarios. The positive aspects of this research pave the way for future investigations into the impacts of climate change on biodiversity, offering a promising tool for the assessment and preservation of arthropod populations in changing environmental conditions.
Despite the promising outcomes of this study, it is important to acknowledge its limitations, particularly in the context of data availability for various arthropod species. The methodology's reliance on a significant volume of observations (ns>1000) to accurately model the fundamental niches predominantly benefits well-documented, charismatic species such as butterflies. This criterion, unfortunately, leaves out a vast number of arthropod species that may be less well-known or visually appealing but are equally or more critical from a conservation perspective. Notably, Brachytrupes megacephalus, falls short of the observation threshold necessary for reliable niche modelling through this index. However, this limitation also opens avenues for future research and methodological refinement. By exploring and integrating alternative data sources, there is potential to enhance the model's applicability and extend its benefits to a broader spectrum of arthropod species, ensuring that conservation efforts can be more inclusively and effectively directed.
The successful application of the proposed metric critically hinges on the selection of appropriate climate indices tailored to the specific ecological requirements of each arthropod species. Recognising the unique set of conditions that define the habitat preferences of each species necessitates an individualised approach to determining the most relevant climate indices for accurate niche modelling. During this study, to explore the metric's boundaries and potential, a uniform set of climate indices was applied across all species examples. It is crucial to understand that the results derived from this methodology, while insightful, should not be interpreted as precise depictions of any given species's habitat. Instead, they should be viewed as illustrative examples demonstrating the metric's application. This approach underscores the necessity for nuanced, species-specific research to fully leverage the metric's capabilities in accurately representing the ecological niches of arthropods, thereby reinforcing the importance of customisation in the pursuit of ecological understanding and conservation efforts.
In conclusion, the metric introduced in this study holds the potential for application across a variety of climate scenarios, including future projections from the CORDEX ensembles. Such applications promise to yield valuable insights into the direct impacts of climate change on the ecological niches of species at risk. Envisioned as the basis for follow-up studies, this metric could significantly enhance our comprehension of how climate variability affects biodiversity and ecosystem dynamics. By delineating potential shifts in the fundamental niches of key ecological actors, this research not only advances our understanding of the intricate relationships within ecosystems under the pressure of climate change but also provides practical guidance for conservation strategies. These strategies aim to address and mitigate the negative consequences of environmental changes, thereby supporting the resilience of biodiversity in the face of impending climatic challenges.
The scripts used for the analysis in this study are available on GitHub at https://github.com/ciarloj/PALEOSIM (last access: 14 August 2025; https://doi.org/10.5281/zenodo.16875531, Ciarlo, 2025). The data from the CP simulations are freely available on Zenodo: https://doi.org/10.5281/zenodo.14537964 (Ciarlo' et al., 2024).
The supplement related to this article is available online at https://doi.org/10.5194/esd-16-1391-2025-supplement.
JMC led the conceptualisation and formal analysis of the study, secured the funding, conducted the investigations, developed the methodology, created the visualisations, and drafted the original manuscript; he also participated in reviewing and editing the final version. MBI performed validation and investigation tasks, contributed to the methodology, and took part in reviewing and editing the manuscript. EC provided essential resources, supervised the work, and contributed to reviewing and editing the manuscript. AM provided supervision and contributed to reviewing and editing the manuscript. DM administered the project, provided supervision, and participated in reviewing and editing the manuscript.
The contact author has declared that none of the authors has any competing interests.
Publisher’s note: Copernicus Publications remains neutral with regard to jurisdictional claims made in the text, published maps, institutional affiliations, or any other geographical representation in this paper. While Copernicus Publications makes every effort to include appropriate place names, the final responsibility lies with the authors.
The authors would like to express their gratitude to Arthur Lamoliere, Simone Cutajar, and Cyril Caminade for their insightful and constructive discussions that greatly enhanced this work. The authors acknowledge the E-OBS dataset from the EU-FP6 project UERRA (http://www.uerra.eu, last access: 13 August 2025), the Copernicus Climate Change Service, and the data providers in the ECA&D project (https://www.ecad.eu, last access: 13 August 2025). They also acknowledge the World Climate Research Programme's Working Group on Regional Climate and the Working Group on Coupled Modelling, former coordinating body of CORDEX and responsible panel for CMIP5. They also thank the climate modelling groups (listed in Table 3 of this paper) for producing and making available their model output, as well as the Earth System Grid Federation infrastructure, an international effort led by the U.S. Department of Energy's Program for Climate Model Diagnosis and Intercomparison, the European Network for Earth System Modelling, and other partners in the Global Organisation for Earth System Science Portals (GO-ESSP). ChatGPT (GPT-3.5, OpenAI's large-scale language-generation model) was used to improve the writing style of limited parts of this article prior to English language copy-editing. James M. Ciarlo' reviewed, edited, and revised the ChatGPT-generated texts and takes ultimate responsibility for the content of this publication. The authors sincerely thank the reviewers for their constructive suggestions, which greatly contributed to improving the quality of this study.
This research has been supported by the EU HORIZON EUROPE Marie Skłodowska-Curie Actions (grant no. 101062427).
This paper was edited by Ira Didenkulova and reviewed by Stella Dafka and one anonymous referee.
Adam, J. C. and Lettenmaier, D. P.: Adjustment of global gridded precipitation for systematic bias, J. Geophys. Res.-Atmos., 108, 4257, https://doi.org/10.1029/2002JD002499, 2003.
Adão, F., Campos, J. C., Santos, J. A., Malheiro, A. C., and Fraga, H.: Relocation of bioclimatic suitability of Portuguese grapevine varieties under climate change scenarios, Front. Plant. Sci., 14, 974020, https://doi.org/10.3389/fpls.2023.974020, 2023.
Arce, A. N., Cantwell-Jones, A., Tansley, M., Barnes, I., Brace, S., Mullin, V. E., Notton, D., Ollerton, J., Eatough, E., Rhodes, M. W., Bian, X., Hogan, J., Hunter, T., Jackson, S., Whiffin, A., Blagoderov, V., Broad, G., Judd, S., Kokkini, P., Livermore, L., Dixit, M. K., Pearse, W. D., and Gill, R. J.: Signatures of increasing environmental stress in bumblebee wings over the past century: Insights from museum specimens, J. Anim. Ecol., 92, 297–309, https://doi.org/10.1111/1365-2656.13788, 2023.
Ban, N., Caillaud, C., Coppola, E., Pichelli, E., Sobolowski, S., Adinolfi, M., Ahrens, B., Alias, A., Anders, I., Bastin, S., Belušić, D., Berthou, S., Brisson, E., Cardoso, R. M., Chan, S. C., Christensen, O. B., Fernández, J., Fita, L., Frisius, T., Gašparac, G., Giorgi, F., Goergen, K., Haugen, J. E., Hodnebrog, Ø., Kartsios, S., Katragkou, E., Kendon, E. J., Keuler, K., Lavin-Gullon, A., Lenderink, G., Leutwyler, D., Lorenz, T., Maraun, D., Mercogliano, P., Milovac, J., Panitz, H.-J., Raffa, M., Remedio, A. R., Schär, C., Soares, P. M. M., Srnec, L., Steensen, B. M., Stocchi, P., Tölle, M. H., Truhetz, H., Vergara-Temprado, J., de Vries, H., Warrach-Sagi, K., Wulfmeyer, V., and Zander, M. J.: The first multi-model ensemble of regional climate simulations at kilometer-scale resolution, part I: evaluation of precipitation, Clim. Dynam., 57, 275–302, https://doi.org/10.1007/s00382-021-05708-w, 2021.
Botsch, J. C., Zaveri, A. N., Nell, L. A., McCormick, A. R., Book, K. R., Phillips, J. S., Einarsson, Á., and Ives, A. R.: Disentangling the drivers of decadal body size decline in an insect population, Glob. Change Biol., 30, e17014, https://doi.org/10.1111/gcb.17014, 2024.
Buzzetti, F. M., Fontana, P., Hochkirch, A., Kleukers, R., Massa, B., and Odé, B.: Brachytrupes megacephalus (Europe assessment). The IUCN Red List of Threatened Species 2016, e.T64550733A70738413, https://www.iucnredlist.org/species/64550733/70738413 (last access: 23 March 2025), 2016.
Casanueva, A., Kotlarski, S., Herrera, S., Fernández, J., Gutiérrez, J. M., Boberg, F., Colette, A., Christensen, O. B., Goergen, K., Jacob, D., Keuler, K., Nikulin, G., Teichmann, C., and Vautard, R.: Daily precipitation statistics in a EURO-CORDEX RCM ensemble: added value of raw and bias-corrected high-resolution simulations, Clim. Dynam., 47, 719–737, https://doi.org/10.1007/s00382-015-2865-x, 2016.
Chakravarthy, A. K., Kammar, V., and Shashank, P. R.: Arthropods: Evolution and Ecology, in: Economic and Ecological Significance of Arthropods in Diversified Ecosystems, edited by: Chakravarthy, A. and Sridhara, S., Springer Singapore, Singapore, 1–16, https://doi.org/10.1007/978-981-10-1524-3_1, 2016.
Chen, D., Rojas, M., Samset, B. H., Cobb, K., Niang, A. D., Edwards, P., Emori, S., Faria, S. H., Hawkins, E., Hope, P., Huybrechts, P., Meinshausen, M., Mustafa, S. K., Plattner, G.-K., and Tréguier, A.-M.: Framing, Context, and Methods, in: Climate Change 2021 – The Physical Science Basis, edited by: Masson-Delmotte, V., Zhai, P., Pirani, A., Connors, S. L., Péan, C., Berger, S., Caud, N., Chen, Y., Goldfarb, L., Gomis, M. I., Huang, M., Leitzell, K., Lonnoy, E., Matthews, J. B. R., Maycock, T. K., Waterfield, T., Yelekçi, O., Yu, R., and Zhou, B., Cambridge University Press, 147–286, https://doi.org/10.1017/9781009157896.003, 2021.
Ciarlo, J.: ciarloj/Eco-Climate-Index: Eco-Climate Index Scripts (v1.1), Zenodo [code], https://doi.org/10.5281/zenodo.16875531, 2025.
Ciarlo', J. M., Coppola, E., Fantini, A., Giorgi, F., Gao, X., Tong, Y., Glazer, R. H., Torres Alavez, J. A., Sines, T., Pichelli, E., Raffaele, F., Das, S., Bukovsky, M., Ashfaq, M., Im, E.-S., Nguyen-Xuan, T., Teichmann, C., Remedio, A., Remke, T., Bülow, K., Weber, T., Buntemeyer, L., Sieck, K., Rechid, D., and Jacob, D.: A new spatially distributed added value index for regional climate models: the EURO-CORDEX and the CORDEX-CORE highest resolution ensembles, Clim. Dynam., 57, 1403–1424, https://doi.org/10.1007/s00382-020-05400-5, 2021.
Ciarlo', J., Coppola, E., Micallef, A., and Mifsud, D.: ERA5-driven reduced-Mediterranean RegCM5-BATS CP simulation (Version 1), Zenodo [data set], https://doi.org/10.5281/zenodo.14537964, 2024.
Clark, R. C. and Johnson, J. C.: The functional microclimate of an urban arthropod pest: Urban heat island temperatures in webs of the western black widow spider, J. Therm. Biol., 120, 103814, https://doi.org/10.1016/j.jtherbio.2024.103814, 2024.
Coppola, E., Sobolowski, S., Pichelli, E., Raffaele, F., Ahrens, B., Anders, I., Ban, N., Bastin, S., Belda, M., Belusic, D., Caldas-Alvarez, A., Cardoso, R. M., Davolio, S., Dobler, A., Fernandez, J., Fita, L., Fumiere, Q., Giorgi, F., Goergen, K., Güttler, I., Halenka, T., Heinzeller, D., Hodnebrog, Ø., Jacob, D., Kartsios, S., Katragkou, E., Kendon, E., Khodayar, S., Kunstmann, H., Knist, S., Lavín-Gullón, A., Lind, P., Lorenz, T., Maraun, D., Marelle, L., van Meijgaard, E., Milovac, J., Myhre, G., Panitz, H.-J., Piazza, M., Raffa, M., Raub, T., Rockel, B., Schär, C., Sieck, K., Soares, P. M. M., Somot, S., Srnec, L., Stocchi, P., Tölle, M. H., Truhetz, H., Vautard, R., de Vries, H., and Warrach-Sagi, K.: A first-of-its-kind multi-model convection permitting ensemble for investigating convective phenomena over Europe and the Mediterranean, Clim. Dynam., 55, 3–34, https://doi.org/10.1007/s00382-018-4521-8, 2020.
Coppola, E., Nogherotto, R., Ciarlo', J. M., Giorgi, F., van Meijgaard, E., Kadygrov, N., Iles, C., Corre, L., Sandstad, M., Somot, S., Nabat, P., Vautard, R., Levavasseur, G., Schwingshackl, C., Sillmann, J., Kjellström, E., Nikulin, G., Aalbers, E., Lenderink, G., Christensen, O. B., Boberg, F., Sørland, S. L., Demory, M., Bülow, K., Teichmann, C., Warrach-Sagi, K., and Wulfmeyer, V.: Assessment of the European Climate Projections as Simulated by the Large EURO-CORDEX Regional and Global Climate Model Ensemble, J. Geophys. Res.-Atmos., 126, e2019JD032356, https://doi.org/10.1029/2019JD032356, 2021a.
Coppola, E., Raffaele, F., Giorgi, F., Giuliani, G., Xuejie, G., Ciarlo, J. M., Sines, T. R., Torres-Alavez, J. A., Das, S., di Sante, F., Pichelli, E., Glazer, R., Müller, S. K., Abba Omar, S., Ashfaq, M., Bukovsky, M., Im, E.-S., Jacob, D., Teichmann, C., Remedio, A., Remke, T., Kriegsmann, A., Bülow, K., Weber, T., Buntemeyer, L., Sieck, K., and Rechid, D.: Climate hazard indices projections based on CORDEX-CORE, CMIP5 and CMIP6 ensemble, Clim. Dynam., 57, 1293–1383, https://doi.org/10.1007/s00382-021-05640-z, 2021b.
Coppola, E., Giorgi, F., Giuliani, G., Pichelli, E., Ciarlo', J. M., Raffaele, F., Nogherotto, R., Reboita, M. S., Lu, C., Zazulie, N., Vargas-Heinz, L., Cardoso, A. A., and de Leeuw, J.: The Fifth Generation Regional Climate Modeling System, RegCM5: the first CP European wide simulation and validation over the CORDEX-CORE domains, ESS Open Archive, https://doi.org/10.22541/essoar.170542078.80092084/v1, 2024.
Cornes, R. C., van der Schrier, G., van den Besselaar, E. J. M., and Jones, P. D.: An Ensemble Version of the E-OBS Temperature and Precipitation Data Sets, J. Geophys. Res.-Atmos., 123, 9391–9409, https://doi.org/10.1029/2017JD028200, 2018.
Cui, F., Wang, B., Zhang, Q., Tang, H., De Maeyer, P., Hamdi, R., and Dai, L.: Climate change versus land-use change – What affects the ecosystem services more in the forest-steppe ecotone?, Sci. Total Environ., 759, 143525, https://doi.org/10.1016/j.scitotenv.2020.143525, 2021.
Davolio, S., Malguzzi, P., Drofa, O., Mastrangelo, D., and Buzzi, A.: The Piedmont flood of November 1994: a testbed of forecasting capabilities of the CNR-ISAC meteorological model suite, Bull. Atmos. Sci. Technol., 1, 263–282, https://doi.org/10.1007/s42865-020-00015-4, 2020.
Dee, D. P., Uppala, S. M., Simmons, A. J., Berrisford, P., Poli, P., Kobayashi, S., Andrae, U., Balmaseda, M. A., Balsamo, G., Bauer, P., Bechtold, P., Beljaars, A. C. M., van de Berg, L., Bidlot, J., Bormann, N., Delsol, C., Dragani, R., Fuentes, M., Geer, A. J., Haimberger, L., Healy, S. B., Hersbach, H., Hólm, E. V., Isaksen, L., Kållberg, P., Köhler, M., Matricardi, M., McNally, A. P., Monge-Sanz, B. M., Morcrette, J. -J., Park, B. -K., Peubey, C., de Rosnay, P., Tavolato, C., Thépaut, J. -N., and Vitart, F.: The ERA-Interim reanalysis: configuration and performance of the data assimilation system, Q. J. Roy. Meteorol. Soc., 137, 553–597, https://doi.org/10.1002/qj.828, 2011.
Dickinson, R. E., Henderson-Sellers, A., and Kennedy, P. J.: Biosphere-atmosphere Transfer Scheme (BATS) Version 1e as Coupled to the NCAR Community Climate Model (No. NCAR/TN-387+STR), https://doi.org/10.5065/D67W6959, 1993.
Doblas-Reyes, F. J., Sörensson, A. A., Almazroui, M., Dosio, A., Gutowski, W. J., Haarsma, R., Hamdi, R., Hewitson, B., Kwon, W.-T., Lamptey, B. L., Maraun, D., Stephenson, T. S., Takayabu, I., Terray, L., Turner, A., and Zuo, Z.: Linking Global to Regional Climate Change, in: Climate Change 2021 – The Physical Science Basis, edited by: Masson-Delmotte, V., Zhai, P., Pirani, A., Connors, S. L., Péan, C., Berger, S., Caud, N., Chen, Y., Goldfarb, L., Gomis, M. I., Huang, M., Leitzell, K., Lonnoy, E., Matthews, J. B. R., Maycock, T. K., Waterfield, T., Yelekçi, O., Yu, R., and Zhou, B., Cambridge University Press, 1363–1512, https://doi.org/10.1017/9781009157896.012, 2021.
Eyring, V., Bony, S., Meehl, G. A., Senior, C. A., Stevens, B., Stouffer, R. J., and Taylor, K. E.: Overview of the Coupled Model Intercomparison Project Phase 6 (CMIP6) experimental design and organization, Geosci. Model Dev., 9, 1937–1958, https://doi.org/10.5194/gmd-9-1937-2016, 2016.
Fantini, A., Raffaele, F., Torma, C., Bacer, S., Coppola, E., Giorgi, F., Ahrens, B., Dubois, C., Sanchez, E., and Verdecchia, M.: Assessment of multiple daily precipitation statistics in ERA-Interim driven Med-CORDEX and EURO-CORDEX experiments against high resolution observations, Clim. Dynam., 51, 877–900, https://doi.org/10.1007/s00382-016-3453-4, 2018.
Fink, S. and Scheidegger, C.: Effects of barriers on functional connectivity of riparian plant habitats under climate change, Ecol. Eng., 115, 75–90, https://doi.org/10.1016/j.ecoleng.2018.02.010, 2018.
Fletcher Jr., R. J., Hefley, T. J., Robertson, E. P., Zuckerberg, B., McCleery, R. A., and Dorazio, R. M.: A practical guide for combining data to model species distributions, Ecology, 100, 1–15, 2019.
Forister, M. L., Halsch, C. A., Nice, C. C., Fordyce, J. A., Dilts, T. E., Oliver, J. C., Prudic, K. L., Shapiro, A. M., Wilson, J. K., and Glassberg, J.: Fewer butterflies seen by community scientists across the warming and drying landscapes of the American West, Science, 371, 1042–1045, https://doi.org/10.1126/science.abe5585, 2021.
Giorgi, F.: Climate change hot-spots, Geophys. Res. Lett., 33, L08707, https://doi.org/10.1029/2006GL025734, 2006.
Giorgi, F.: Introduction to the special issue: the phase I CORDEX RegCM4 hyper-matrix (CREMA) experiment, Climatic Change, 125, 1–5, https://doi.org/10.1007/s10584-014-1166-4, 2014.
Giorgi, F., Jones, C., and Asrar, G.: Addressing climate information needs at the regional level: The CORDEX framework, World Meteorol. Org. Bull., 58, 175–183, 2009.
Giorgi, F., Im, E.-S., Coppola, E., Diffenbaugh, N. S., Gao, X. J., Mariotti, L., and Shi, Y.: Higher Hydroclimatic Intensity with Global Warming, J. Clim., 24, 5309–5324, https://doi.org/10.1175/2011JCLI3979.1, 2011.
Giorgi, F., Coppola, E., and Raffaele, F.: Threatening levels of cumulative stress due to hydroclimatic extremes in the 21st century, NPJ Clim. Atmos. Sci., 1, 18, https://doi.org/10.1038/s41612-018-0028-6, 2018.
Giorgi, F., Coppola, E., Jacob, D., Teichmann, C., Abba Omar, S., Ashfaq, M., Ban, N., Bülow, K., Bukovsky, M., Buntemeyer, L., Cavazos, T., Ciarlo', J., da Rocha, R. P., Das, S., di Sante, F., Evans, J. P., Gao, X., Giuliani, G., Glazer, R. H., Hoffmann, P., Im, E.-S., Langendijk, G., Lierhammer, L., Llopart, M., Mueller, S., Luna-Nino, R., Nogherotto, R., Pichelli, E., Raffaele, F., Reboita, M., Rechid, D., Remedio, A., Remke, T., Sawadogo, W., Sieck, K., Torres-Alavez, J. A., and Weber, T.: The CORDEX-CORE EXP-I Initiative: Description and Highlight Results from the Initial Analysis, B. Am. Meteorol. Soc., 103, E293–E310, https://doi.org/10.1175/BAMS-D-21-0119.1, 2022.
Giorgi, F., Coppola, E., Giuliani, G., Ciarlo', J. M., Pichelli, E., Nogherotto, R., Raffaele, F., Malguzzi, P., Davolio, S., Stocchi, P., and Drofa, O.: The Fifth Generation Regional Climate Modeling System, RegCM5: Description and Illustrative Examples at Parameterized Convection and Convection-Permitting Resolutions, J. Geophys. Res.-Atmos., 128, e2022JD038199, https://doi.org/10.1029/2022JD038199, 2023.
Gritti, E. S., Smith, B., and Sykes, M. T.: Vulnerability of Mediterranean Basin ecosystems to climate change and invasion by exotic plant species, J. Biogeogr., 33, 145–157, https://doi.org/10.1111/j.1365-2699.2005.01377.x, 2006.
Gullan, P. J. and Cranston, P. S.: The Insects: An Outline of Entomology, 5th Edition, John Wiley & Sons, Inc., Chichester, UK, ISBN 978-1-118-84615-5, 2014.
Gutiérrez, J. M., Jones, R. G., Narisma, G. T., Alves, L. M., Amjad, M., Gorodetskaya, I. V., Grose, M., Klutse, N. A. B., Krakovska, S., Li, J., Martínez-Castro, D., Mearns, L. O., Mernild, S. H., Ngo-Duc, T., Hurk, B. van den, and Yoon, J.-H.: Atlas, in: Climate Change 2021 – The Physical Science Basis, edited by: Masson-Delmotte, V., Zhai, P., Pirani, A., Connors, S. L., Péan, C., Berger, S., Caud, N., Chen, Y., Goldfarb, L., Gomis, M. I., Huang, M., Leitzell, K., Lonnoy, E., Matthews, J. B. R., Maycock, T. K., Waterfield, T., Yelekçi, O., Yu, R., and Zhou, B., Cambridge University Press, 1927–2058, https://doi.org/10.1017/9781009157896.021, 2021.
Gutowski Jr., W. J., Giorgi, F., Timbal, B., Frigon, A., Jacob, D., Kang, H.-S., Raghavan, K., Lee, B., Lennard, C., Nikulin, G., O'Rourke, E., Rixen, M., Solman, S., Stephenson, T., and Tangang, F.: WCRP COordinated Regional Downscaling EXperiment (CORDEX): a diagnostic MIP for CMIP6, Geosci. Model Dev., 9, 4087–4095, https://doi.org/10.5194/gmd-9-4087-2016, 2016.
Haase, C. G., Yang, A., McNyset, K. M., and Blackburn, J. K.: GARPTools: R software for data preparation and model evaluation of GARP models, Ecography, 44, 1790–1796, https://doi.org/10.1111/ecog.05642, 2021.
Haylock, M. R., Hofstra, N., Klein Tank, A. M. G., Klok, E. J., Jones, P. D., and New, M.: A European daily high-resolution gridded data set of surface temperature and precipitation for 1950–2006, J. Geophys. Res.-Atmos., 113, D20119, https://doi.org/10.1029/2008JD010201, 2008.
Hersbach, H., Bell, B., Berrisford, P., Hirahara, S., Horányi, A., Muñoz-Sabater, J., Nicolas, J., Peubey, C., Radu, R., Schepers, D., Simmons, A., Soci, C., Abdalla, S., Abellan, X., Balsamo, G., Bechtold, P., Biavati, G., Bidlot, J., Bonavita, M., De Chiara, G., Dahlgren, P., Dee, D., Diamantakis, M., Dragani, R., Flemming, J., Forbes, R., Fuentes, M., Geer, A., Haimberger, L., Healy, S., Hogan, R. J., Hólm, E., Janisková, M., Keeley, S., Laloyaux, P., Lopez, P., Lupu, C., Radnoti, G., de Rosnay, P., Rozum, I., Vamborg, F., Villaume, S., and Thépaut, J.: The ERA5 global reanalysis, Q. J. Roy. Meteorol. Soc., 146, 1999–2049, https://doi.org/10.1002/qj.3803, 2020.
Hiller, A. E., Koo, M. S., Goodman, K. R., Shaw, K. L., O'Grady, P. M., and Gillespie, R. G.: Niche conservatism predominates in adaptive radiation: comparing the diversification of Hawaiian arthropods using ecological niche modelling, Biol. J. Linn. Soc., 127, 479–492, https://doi.org/10.1093/biolinnean/blz023, 2019.
Høye, T. T. and Forchhammer, M. C.: The influence of weather conditions on the activity of high-arctic arthropods inferred from long-term observations, BMC Ecol., 8, 8, https://doi.org/10.1186/1472-6785-8-8, 2008.
iNaturalist community: Complete Research Grade Observations of Polyommatus celina, https://www.inaturalist.org, (last access: 11 August 2023), 2023.
IPCC: Climate Change 2021 – The Physical Science Basis, Cambridge University Press, https://doi.org/10.1017/9781009157896, 2023.
Jacob, D.: A note to the simulation of the annual and inter-annual variability of the water budget over the Baltic Sea drainage basin, Meteorol. Atmos. Phys., 77, 61–73, https://doi.org/10.1007/s007030170017, 2001.
Jacob, D., Elizalde, A., Haensler, A., Hagemann, S., Kumar, P., Podzun, R., Rechid, D., Remedio, A. R., Saeed, F., Sieck, K., Teichmann, C., and Wilhelm, C.: Assessing the Transferability of the Regional Climate Model REMO to Different COordinated Regional Climate Downscaling EXperiment (CORDEX) Regions, Atmosphere, 3, 181–199, https://doi.org/10.3390/atmos3010181, 2012.
Jacob, D., Petersen, J., Eggert, B., Alias, A., Christensen, O. B., Bouwer, L. M., Braun, A., Colette, A., Déqué, M., Georgievski, G., Georgopoulou, E., Gobiet, A., Menut, L., Nikulin, G., Haensler, A., Hempelmann, N., Jones, C., Keuler, K., Kovats, S., Kröner, N., Kotlarski, S., Kriegsmann, A., Martin, E., van Meijgaard, E., Moseley, C., Pfeifer, S., Preuschmann, S., Radermacher, C., Radtke, K., Rechid, D., Rounsevell, M., Samuelsson, P., Somot, S., Soussana, J.-F., Teichmann, C., Valentini, R., Vautard, R., Weber, B., and Yiou, P.: EURO-CORDEX: new high-resolution climate change projections for European impact research, Reg. Environ. Change, 14, 563–578, https://doi.org/10.1007/s10113-013-0499-2, 2014.
Jacob, D., Teichmann, C., Sobolowski, S., Katragkou, E., Anders, I., Belda, M., Benestad, R., Boberg, F., Buonomo, E., Cardoso, R. M., Casanueva, A., Christensen, O. B., Christensen, J. H., Coppola, E., De Cruz, L., Davin, E. L., Dobler, A., Domínguez, M., Fealy, R., Fernandez, J., Gaertner, M. A., García-Díez, M., Giorgi, F., Gobiet, A., Goergen, K., Gómez-Navarro, J. J., Alemán, J. J. G., Gutiérrez, C., Gutiérrez, J. M., Güttler, I., Haensler, A., Halenka, T., Jerez, S., Jiménez-Guerrero, P., Jones, R. G., Keuler, K., Kjellström, E., Knist, S., Kotlarski, S., Maraun, D., van Meijgaard, E., Mercogliano, P., Montávez, J. P., Navarra, A., Nikulin, G., de Noblet-Ducoudré, N., Panitz, H.-J., Pfeifer, S., Piazza, M., Pichelli, E., Pietikäinen, J.-P., Prein, A. F., Preuschmann, S., Rechid, D., Rockel, B., Romera, R., Sánchez, E., Sieck, K., Soares, P. M. M., Somot, S., Srnec, L., Sørland, S. L., Termonia, P., Truhetz, H., Vautard, R., Warrach-Sagi, K., and Wulfmeyer, V.: Regional climate downscaling over Europe: perspectives from the EURO-CORDEX community, Reg. Environ. Change, 20, 51, https://doi.org/10.1007/s10113-020-01606-9, 2020.
Karger, D. N., Conrad, O., Böhner, J., Kawohl, T., Kreft, H., Soria-Auza, R. W., Zimmermann, N. E., Linder, H. P., and Kessler, M.: Climatologies at high resolution for the earth's land surface areas, Sci. Data, 4, 170122, https://doi.org/10.1038/sdata.2017.122, 2017.
Khan, S. U., Ogden, N. H., Fazil, A. A., Gachon, P. H., Dueymes, G. U., Greer, A. L., and Ng, V.: Current and Projected Distributions of Aedes aegypti and Ae. albopictus in Canada and the U.S., Environ. Health Persp., 128, 057007, https://doi.org/10.1289/EHP5899, 2020.
Kotlarski, S., Keuler, K., Christensen, O. B., Colette, A., Déqué, M., Gobiet, A., Goergen, K., Jacob, D., Lüthi, D., van Meijgaard, E., Nikulin, G., Schär, C., Teichmann, C., Vautard, R., Warrach-Sagi, K., and Wulfmeyer, V.: Regional climate modeling on European scales: a joint standard evaluation of the EURO-CORDEX RCM ensemble, Geosci. Model Dev., 7, 1297–1333, https://doi.org/10.5194/gmd-7-1297-2014, 2014.
Kotze, D. J., Lowe, E. C., MacIvor, J. S., Ossola, A., Norton, B. A., Hochuli, D. F., Mata, L., Moretti, M., Gagné, S. A., Handa, I. T., Jones, T. M., Threlfall, C. G., and Hahs, A. K.: Urban forest invertebrates: how they shape and respond to the urban environment, Urban Ecosyst., 25, 1589–1609, https://doi.org/10.1007/s11252-022-01240-9, 2022.
Lionello, P. and Scarascia, L.: The relation between climate change in the Mediterranean region and global warming, Reg. Environ. Change, 18, 1481–1493, https://doi.org/10.1007/s10113-018-1290-1, 2018.
Maleque, M. A., Ishii, H. T., and Maeto, K.: The Use of Arthropods as Indicators of Ecosystem Integrity in Forest Management, J. Forest., 104, 113–117, https://doi.org/10.1093/jof/104.3.113, 2006.
Malguzzi, P., Grossi, G., Buzzi, A., Ranzi, R., and Buizza, R.: The 1966 “century” flood in Italy: A meteorological and hydrological revisitation, J. Geophys. Res.-Atmos., 111, D24106, https://doi.org/10.1029/2006JD007111, 2006.
Mammola, S., Pétillon, J., Hacala, A., Monsimet, J., Marti, S., Cardoso, P., and Lafage, D.: Challenges and opportunities of species distribution modelling of terrestrial arthropod predators, Divers. Distrib., 27, 2596–2614, https://doi.org/10.1111/ddi.13434, 2021.
Mauri, A., Girardello, M., Strona, G., Beck, P. S. A., Forzieri, G., Caudullo, G., Manca, F., and Cescatti, A.: EU-Trees4F, a dataset on the future distribution of European tree species, Sci. Data, 9, 37, https://doi.org/10.1038/s41597-022-01128-5, 2022.
Meehl, G. A., Boer, G. J., Covey, C., Latif, M., and Stouffer, R. J.: Intercomparison makes for a better climate model, Eos, Transactions American Geophysical Union, 78, 445–451, https://doi.org/10.1029/97EO00276, 1997.
Meehl, G. A., Boer, G. J., Covey, C., Latif, M., and Stouffer, R. J.: The Coupled Model Intercomparison Project (CMIP), B. Am. Meteorol. Soc., 81, 313–318, https://doi.org/10.1175/1520-0477(2000)081<0313:TCMIPC>2.3.CO;2, 2000.
Meehl, G. A., Covey, C., Delworth, T., Latif, M., McAvaney, B., Mitchell, J. F. B., Stouffer, R. J., and Taylor, K. E.: THE WCRP CMIP3 Multimodel Dataset: A New Era in Climate Change Research, B. Am. Meteorol. Soc., 88, 1383–1394, https://doi.org/10.1175/BAMS-88-9-1383, 2007.
Molina, M. O., Careto, J. A. M., Gutiérrez, C., Sánchez, E., and Soares, P. M. M.: The added value of high-resolution EURO-CORDEX simulations to describe daily wind speed over Europe, Int. J. Climatol., 43, 1062–1078, https://doi.org/10.1002/joc.7877, 2023.
Mugumaarhahama, Y., Fandohan, A. B., and Glèlè Kakaï, R. L.: Performance of inhomogeneous Poisson point process models under different scenarios of uncertainty in species presence-only data, Environ. Syst. Res., 12, 27, https://doi.org/10.1186/s40068-023-00312-9, 2023.
Mullin, V. E., Stephen, W., Arce, A. N., Nash, W., Raine, C., Notton, D. G., Whiffin, A., Blagderov, V., Gharbi, K., Hogan, J., Hunter, T., Irish, N., Jackson, S., Judd, S., Watkins, C., Haerty, W., Ollerton, J., Brace, S., Gill, R. J., and Barnes, I.: First large-scale quantification study of DNA preservation in insects from natural history collections using genome-wide sequencing, Method. Ecol. Evol., 14, 360–371, https://doi.org/10.1111/2041-210X.13945, 2023.
Nabat, P., Somot, S., Cassou, C., Mallet, M., Michou, M., Bouniol, D., Decharme, B., Drugé, T., Roehrig, R., and Saint-Martin, D.: Modulation of radiative aerosols effects by atmospheric circulation over the Euro-Mediterranean region, Atmos. Chem. Phys., 20, 8315–8349, https://doi.org/10.5194/acp-20-8315-2020, 2020.
Nogherotto, R., Tompkins, A. M., Giuliani, G., Coppola, E., and Giorgi, F.: Numerical framework and performance of the new multiple-phase cloud microphysics scheme in RegCM4.5: precipitation, cloud microphysics, and cloud radiative effects, Geosci. Model Dev., 9, 2533–2547, https://doi.org/10.5194/gmd-9-2533-2016, 2016.
Outhwaite, C. L., McCann, P., and Newbold, T.: Agriculture and climate change are reshaping insect biodiversity worldwide, Nature, 605, 97–102, https://doi.org/10.1038/s41586-022-04644-x, 2022.
Phillips, S. J., Dudík, M., and Schapire, R. E.: A maximum entropy approach to species distribution modeling, in: Twenty-first international conference on Machine learning – ICML '04, 83 pp., https://doi.org/10.1145/1015330.1015412, 2004.
Pichelli, E., Coppola, E., Sobolowski, S., Ban, N., Giorgi, F., Stocchi, P., Alias, A., Belušić, D., Berthou, S., Caillaud, C., Cardoso, R. M., Chan, S., Christensen, O. B., Dobler, A., de Vries, H., Goergen, K., Kendon, E. J., Keuler, K., Lenderink, G., Lorenz, T., Mishra, A. N., Panitz, H.-J., Schär, C., Soares, P. M. M., Truhetz, H., and Vergara-Temprado, J.: The first multi-model ensemble of regional climate simulations at kilometer-scale resolution part 2: historical and future simulations of precipitation, Clim. Dynam., 56, 3581–3602, https://doi.org/10.1007/s00382-021-05657-4, 2021.
Potts, S. G., Imperatriz-Fonseca, V., Ngo, H. T., Aizen, M. A., Biesmeijer, J. C., Breeze, T. D., Dicks, L. V., Garibaldi, L. A., Hill, R., Settele, J., and Vanbergen, A. J.: Safeguarding pollinators and their values to human well-being, Nature, 540, 220–229, https://doi.org/10.1038/nature20588, 2016.
Prein, A. F., Gobiet, A., Truhetz, H., Keuler, K., Goergen, K., Teichmann, C., Fox Maule, C., van Meijgaard, E., Déqué, M., Nikulin, G., Vautard, R., Colette, A., Kjellström, E., and Jacob, D.: Precipitation in the EURO-CORDEX 0.11 and 0.44 simulations: high resolution, high benefits?, Clim. Dynam., 46, 383–412, https://doi.org/10.1007/s00382-015-2589-y, 2016.
Putman, R. J. and Wratten, S. D.: The Concept of the Niche, in: Principles of Ecology, Springer Netherlands, Dordrecht, 105–126, https://doi.org/10.1007/978-94-011-6948-6_6, 1984.
Ranasinghe, R., Ruane, A. C., Vautard, R., Arnell, N., Coppola, E., Cruz, F. A., Dessai, S., Islam, A. S., Rahimi, M., Ruiz Carrascal, D., Sillmann, J., Sylla, M. B., Tebaldi, C., Wang, W., and Zaaboul, R.: Climate Change Information for Regional Impact and for Risk Assessment, in: Climate Change 2021 – The Physical Science Basis. Contribution of Working Group I to the Sixth Assessment Report of the Intergovernmental Panel on Climate Change, edited by: Masson- Delmotte, V., Zhai, P., Pirani, A., Connors, S. L., Péan, C., Berger, S., Caud, N., Chen, Y., Goldfarb, L., Gomis, M. I., Huang, M., Leitzell, K., Lonnoy, E., Matthews, J. B. R., Maycock, T. K., Waterfield, T., Yelekçi, O., Yu, R., and Zhou, B., Cambridge University Press, 1767–1926, https://doi.org/10.1017/9781009157896.014, 2021.
Raven, P. H. and Wagner, D. L.: Agricultural intensification and climate change are rapidly decreasing insect biodiversity, P. Natl. Acad. Sci. USA, 118, e2002548117, https://doi.org/10.1073/pnas.2002548117, 2021.
Reale, M., Cabos Narvaez, W. D., Cavicchia, L., Conte, D., Coppola, E., Flaounas, E., Giorgi, F., Gualdi, S., Hochman, A., Li, L., Lionello, P., Podrascanin, Z., Salon, S., Sanchez-Gomez, E., Scoccimarro, E., Sein, D. V., and Somot, S.: Future projections of Mediterranean cyclone characteristics using the Med-CORDEX ensemble of coupled regional climate system models, Clim. Dynam., 58, 2501–2524, https://doi.org/10.1007/s00382-021-06018-x, 2022.
Rundel, P. W. and Gibson, A. C.: Arthropods, in: Ecological Communities and Processes in a Mojave Desert Ecosystem, Cambridge University Press, Cambridge, 214–255, ISBN 9780521021418, 1996.
Santos, F. D., Stigter, T. Y., Faysse, N., and Lourenço, T. C.: Impacts and adaptation to climate change in the Mediterranean coastal areas: the CIRCLE-MED initiative, Reg. Environ. Change, 14, 1–3, https://doi.org/10.1007/s10113-013-0551-2, 2014.
Schowalter, T. D.: Insect Ecology: An Ecosystem Approach, 5th Edition, Elsevier Inc., London, UK, ISBN 9780323856737, 2022.
Schwingshackl, C., Sillmann, J., Vicedo-Cabrera, A. M., Sandstad, M., and Aunan, K.: Heat Stress Indicators in CMIP6: Estimating Future Trends and Exceedances of Impact-Relevant Thresholds, Earths Future, 9, e2020EF001885, https://doi.org/10.1029/2020EF001885, 2021.
Sillero, N., Campos, J. C., Arenas-Castro, S., and Barbosa, A. M.: A curated list of R packages for ecological niche modelling, Ecol. Modell., 476, 110242, https://doi.org/10.1016/j.ecolmodel.2022.110242, 2023.
Somot, S., Ruti, P., Ahrens, B., Coppola, E., Jordà, G., Sannino, G., and Solmon, F.: Editorial for the Med-CORDEX special issue, Clim. Dynam., 51, 771–777, https://doi.org/10.1007/s00382-018-4325-x, 2018.
Sørland, S. L., Brogli, R., Pothapakula, P. K., Russo, E., Van de Walle, J., Ahrens, B., Anders, I., Bucchignani, E., Davin, E. L., Demory, M.-E., Dosio, A., Feldmann, H., Früh, B., Geyer, B., Keuler, K., Lee, D., Li, D., van Lipzig, N. P. M., Min, S.-K., Panitz, H.-J., Rockel, B., Schär, C., Steger, C., and Thiery, W.: COSMO-CLM regional climate simulations in the Coordinated Regional Climate Downscaling Experiment (CORDEX) framework: a review, Geosci. Model Dev., 14, 5125–5154, https://doi.org/10.5194/gmd-14-5125-2021, 2021.
Strandberg, G., Bärring, L., Hansson, U., Jansson, C., Jones, C., Kjellström, E., Kupiainen, M., Nikulin, G., Samuelsson, P., and Ullerstig, A.: CORDEX scenarios for Europe from the Rossby Centre regional climate model RCA4, SMHI, https://www.diva-portal.org/smash/record.jsf?pid=diva2:948136&dswid=8110 (last access: 14 August 2025), 2015.
Sylla, M. B., Faye, A., Giorgi, F., Diedhiou, A., and Kunstmann, H.: Projected Heat Stress Under 1.5 °C and 2 °C Global Warming Scenarios Creates Unprecedented Discomfort for Humans in West Africa, Earths Future, 6, 1029–1044, https://doi.org/10.1029/2018EF000873, 2018.
Taylor, K. E., Stouffer, R. J., and Meehl, G. A.: An Overview of CMIP5 and the Experiment Design, Bull Am Meteorol Soc, 93, 485–498, https://doi.org/10.1175/BAMS-D-11-00094.1, 2012.
Teichmann, C., Jacob, D., Remedio, A. R., Remke, T., Buntemeyer, L., Hoffmann, P., Kriegsmann, A., Lierhammer, L., Bülow, K., Weber, T., Sieck, K., Rechid, D., Langendijk, G. S., Coppola, E., Giorgi, F., Ciarlo', J. M., Raffaele, F., Giuliani, G., Xuejie, G., Sines, T. R., Torres-Alavez, J. A., Das, S., Di Sante, F., Pichelli, E., Glazer, R., Ashfaq, M., Bukovsky, M., and Im, E.-S.: Assessing mean climate change signals in the global CORDEX-CORE ensemble, Clim. Dynam., 57, 1269–1292, https://doi.org/10.1007/s00382-020-05494-x, 2021.
Tesfamariam, B. G., Gessesse, B., and Melgani, F.: MaxEnt-based modeling of suitable habitat for rehabilitation of Podocarpus forest at landscape-scale, Environ. Syst. Res., 11, 4, https://doi.org/10.1186/s40068-022-00248-6, 2022.
Uhl, B., Wölfling, M., and Bässler, C.: Mediterranean moth diversity is sensitive to increasing temperatures and drought under climate change, Sci. Rep., 12, 14473, https://doi.org/10.1038/s41598-022-18770-z, 2022.
van Meijgaard, E., van Ulft, L. H., Lenderink, G., de Roode, S. R., Wipfler, E. L., Boers, R., and van Timmermans, R. M. A.: Refinement and Application of a Regional Atmospheric Model for Climate Scenario Calculations of Western Europe, KvR 054/12, https://edepot.wur.nl/312258 (last access: 23 March 2025), 2012.
Vautard, R., Gobiet, A., Jacob, D., Belda, M., Colette, A., Déqué, M., Fernández, J., García-Díez, M., Goergen, K., Güttler, I., Halenka, T., Karacostas, T., Katragkou, E., Keuler, K., Kotlarski, S., Mayer, S., van Meijgaard, E., Nikulin, G., Patarčić, M., Scinocca, J., Sobolowski, S., Suklitsch, M., Teichmann, C., Warrach-Sagi, K., Wulfmeyer, V., and Yiou, P.: The simulation of European heat waves from an ensemble of regional climate models within the EURO-CORDEX project, Clim. Dynam., 41, 2555–2575, https://doi.org/10.1007/s00382-013-1714-z, 2013.
Vautard, R., Kadygrov, N., Iles, C., Boberg, F., Buonomo, E., Bülow, K., Coppola, E., Corre, L., van Meijgaard, E., Nogherotto, R., Sandstad, M., Schwingshackl, C., Somot, S., Aalbers, E., Christensen, O. B., Ciarlo, J. M., Demory, M., Giorgi, F., Jacob, D., Jones, R. G., Keuler, K., Kjellström, E., Lenderink, G., Levavasseur, G., Nikulin, G., Sillmann, J., Solidoro, C., Sørland, S. L., Steger, C., Teichmann, C., Warrach-Sagi, K., and Wulfmeyer, V.: Evaluation of the Large EURO-CORDEX Regional Climate Model Ensemble, J. Geophys. Res.-Atmos., 126, e2019JD032344, https://doi.org/10.1029/2019JD032344, 2021.
Vogel, J., Paton, E., and Aich, V.: Seasonal ecosystem vulnerability to climatic anomalies in the Mediterranean, Biogeosciences, 18, 5903–5927, https://doi.org/10.5194/bg-18-5903-2021, 2021.
Wagner, D. L., Fox, R., Salcido, D. M., and Dyer, L. A.: A window to the world of global insect declines: Moth biodiversity trends are complex and heterogeneous, P. Natl. Acad. Sci. USA, 118, e2002549117, https://doi.org/10.1073/pnas.2002549117, 2021.
Xu, K.-M. and Randall, D. A.: A Semiempirical Cloudiness Parameterization for Use in Climate Models, J. Atmos. Sci., 53, 3084–3102, https://doi.org/10.1175/1520-0469(1996)053<3084:ASCPFU>2.0.CO;2, 1996.
Zattara, E. E. and Aizen, M. A.: Worldwide occurrence records suggest a global decline in bee species richness, One Earth, 4, 114–123, https://doi.org/10.1016/j.oneear.2020.12.005, 2021.